Zip Codes with the Highest Percentage of Families with Income Above $100,000 in Papillion, NE
RELATED REPORTS & OPTIONS
Family Income | $100k+
Papillion
Compare Zip Codes
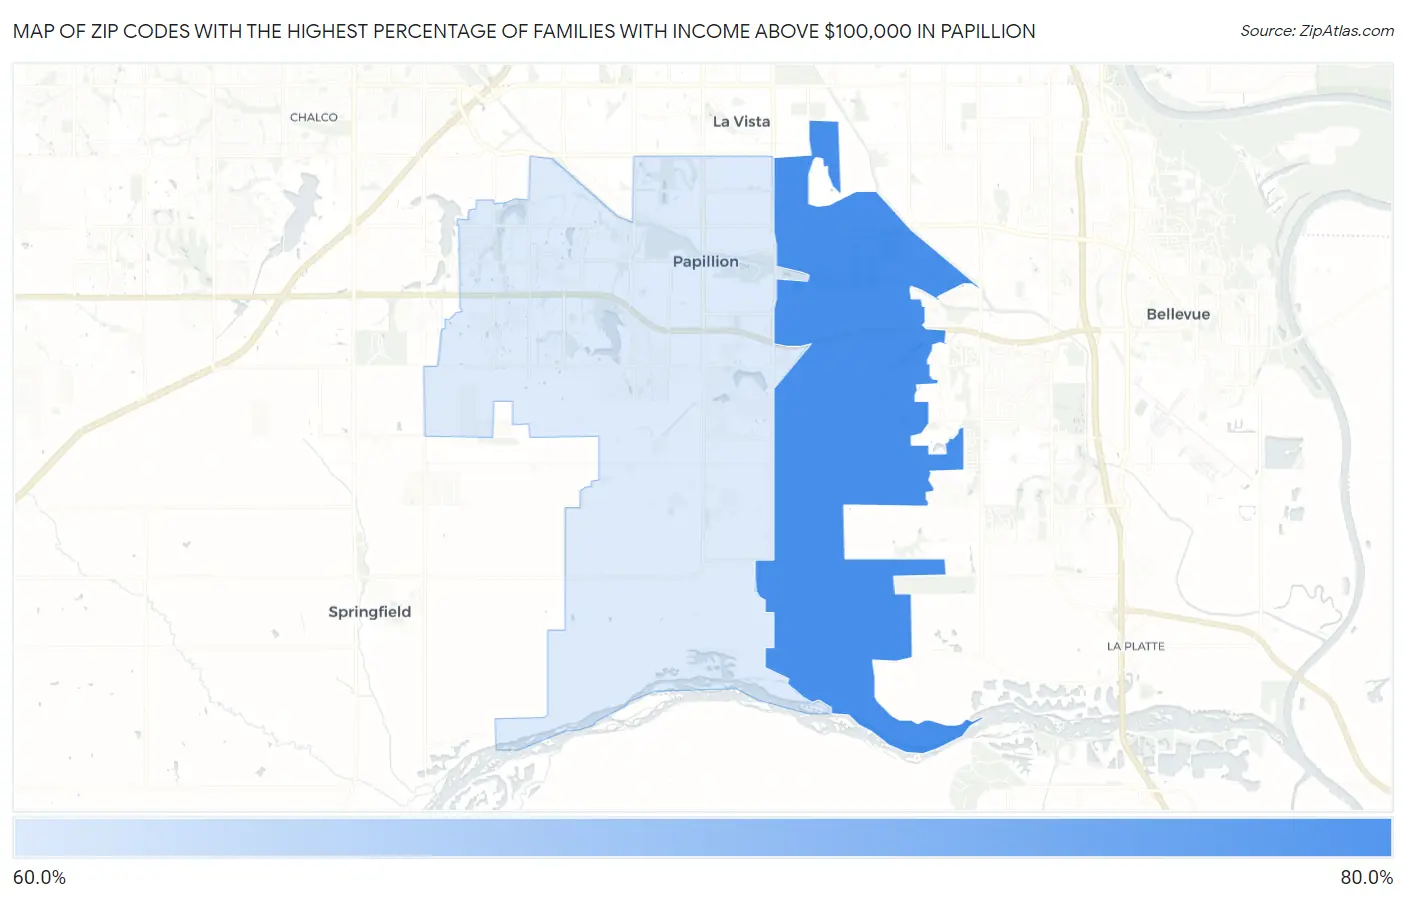
Map of Zip Codes with the Highest Percentage of Families with Income Above $100,000 in Papillion
66.3%
73.0%
Zip Codes with the Highest Percentage of Families with Income Above $100,000 in Papillion, NE
| Zip Code | Families with Income > $100k | vs State | vs National | |
| 1. | 68133 | 73.0% | 45.7%(+27.3)#21 | 46.1%(+26.9)#2,043 |
| 2. | 68046 | 66.3% | 45.7%(+20.6)#36 | 46.1%(+20.2)#3,411 |
1
Common Questions
What are the Top Zip Codes with the Highest Percentage of Families with Income Above $100,000 in Papillion, NE?
Top Zip Codes with the Highest Percentage of Families with Income Above $100,000 in Papillion, NE are:
What zip code has the Highest Percentage of Families with Income Above $100,000 in Papillion, NE?
68133 has the Highest Percentage of Families with Income Above $100,000 in Papillion, NE with 73.0%.
What is the Percentage of Families with Income Above $100,000 in Papillion, NE?
Percentage of Families with Income Above $100,000 in Papillion is 63.6%.
What is the Percentage of Families with Income Above $100,000 in Nebraska?
Percentage of Families with Income Above $100,000 in Nebraska is 45.7%.
What is the Percentage of Families with Income Above $100,000 in the United States?
Percentage of Families with Income Above $100,000 in the United States is 46.1%.