Zip Codes with the Highest Percentage of Population Employed in Arts, Entertainment & Recreation in Kansas City, MO

RELATED REPORTS & OPTIONS

Arts, Entertainment & Recreation
Population
Families and Households
Female Fertility
Female Fertility (Unmarried)
Race (Community Size)
Race (Percentage)
Ancestry (Community Size)
AfghanAfricanAlaska NativeAlbanianAmericanApacheArabArgentineanArmenianAustralianAustrianBahamianBangladeshiBelgianBelizeanBhutaneseBlackfeetBolivianBrazilianBritishBulgarianBurmeseCanadianCelticCentral AmericanCentral American IndianCherokeeChickasawChileanChippewaChoctawColombianComancheCosta RicanCreeCreekCroatianCrowCubanCzechCzechoslovakianDanishDominicanDutchDutch West IndianEastern EuropeanEcuadorianEgyptianEnglishEthiopianEuropeanFijianFilipinoFinnishFrenchFrench American IndianFrench CanadianGermanGerman RussianGhanaianGreekGuamanian / ChamorroGuatemalanGuyaneseHaitianHonduranHungarianIcelanderIndian (Asian)IndonesianIranianIraqiIrishIroquoisIsraeliItalianJamaicanJapaneseJordanianKenyanKoreanLaotianLatvianLebaneseLiberianLithuanianLuxembourgerMalaysianMexicanMexican American IndianMongolianMoroccanNative HawaiianNavajoNew ZealanderNicaraguanNigerianNorthern EuropeanNorwegianOsageOttawaPakistaniPalestinianPanamanianPennsylvania GermanPeruvianPolishPortuguesePotawatomiPuebloPuerto RicanRomanianRussianSalvadoranSamoanScandinavianScotch-IrishScottishSeminoleSerbianShoshoneSierra LeoneanSiouxSlavicSlovakSloveneSomaliSouth AfricanSouth AmericanSouth American IndianSpaniardSpanishSri LankanSubsaharan AfricanSudaneseSwedishSwissSyrianThaiTrinidadian and TobagonianTurkishUgandanUkrainianUruguayanVenezuelanVietnameseWelshWest IndianYugoslavian
Ancestry (Percentage)
AfghanAfricanAlaska NativeAlbanianAmericanApacheArabArgentineanArmenianAustralianAustrianBahamianBangladeshiBelgianBelizeanBhutaneseBlackfeetBolivianBrazilianBritishBulgarianBurmeseCanadianCelticCentral AmericanCentral American IndianCherokeeChickasawChileanChippewaChoctawColombianComancheCosta RicanCreeCreekCroatianCrowCubanCzechCzechoslovakianDanishDominicanDutchDutch West IndianEastern EuropeanEcuadorianEgyptianEnglishEthiopianEuropeanFijianFilipinoFinnishFrenchFrench American IndianFrench CanadianGermanGerman RussianGhanaianGreekGuamanian / ChamorroGuatemalanGuyaneseHaitianHonduranHungarianIcelanderIndian (Asian)IndonesianIranianIraqiIrishIroquoisIsraeliItalianJamaicanJapaneseJordanianKenyanKoreanLaotianLatvianLebaneseLiberianLithuanianLuxembourgerMalaysianMexicanMexican American IndianMongolianMoroccanNative HawaiianNavajoNew ZealanderNicaraguanNigerianNorthern EuropeanNorwegianOsageOttawaPakistaniPalestinianPanamanianPennsylvania GermanPeruvianPolishPortuguesePotawatomiPuebloPuerto RicanRomanianRussianSalvadoranSamoanScandinavianScotch-IrishScottishSeminoleSerbianShoshoneSierra LeoneanSiouxSlavicSlovakSloveneSomaliSouth AfricanSouth AmericanSouth American IndianSpaniardSpanishSri LankanSubsaharan AfricanSudaneseSwedishSwissSyrianThaiTrinidadian and TobagonianTurkishUgandanUkrainianUruguayanVenezuelanVietnameseWelshWest IndianYugoslavian
Immigrant Origin (Total)
AfghanistanAfricaArgentinaAsiaAustraliaBahamasBangladeshBelarusBelgiumBelizeBoliviaBosnia and HerzegovinaBrazilBulgariaBurma / MyanmarCambodiaCameroonCanadaCaribbeanCentral AmericaChileChinaColombiaCongoCosta RicaCubaCzechoslovakiaDenmarkDominican RepublicEastern AfricaEastern AsiaEastern EuropeEcuadorEgyptEl SalvadorEnglandEritreaEthiopiaEuropeFijiFranceGermanyGhanaGreeceGuatemalaGuyanaHaitiHondurasHong KongHungaryIndiaIndonesiaIranIraqIrelandIsraelItalyJamaicaJapanJordanKazakhstanKenyaKoreaKuwaitLaosLatin AmericaLebanonLiberiaMalaysiaMexicoMicronesiaMiddle AfricaMoroccoNepalNetherlandsNicaraguaNigeriaNorthern AfricaNorthern EuropeOceaniaPakistanPeruPhilippinesPolandPortugalRomaniaRussiaSaudi ArabiaScotlandSierra LeoneSomaliaSouth AfricaSouth AmericaSouth Central AsiaSouth Eastern AsiaSouthern EuropeSpainSri LankaSudanSwedenSwitzerlandSyriaTaiwanThailandTrinidad and TobagoTurkeyUgandaUkraineUruguayVenezuelaVietnamWestern AfricaWestern AsiaWestern EuropeZaireZimbabwe
Immigrant Origin (Percentage)
AfghanistanAfricaArgentinaAsiaAustraliaBahamasBangladeshBelarusBelgiumBelizeBoliviaBosnia and HerzegovinaBrazilBulgariaBurma / MyanmarCambodiaCameroonCanadaCaribbeanCentral AmericaChileChinaColombiaCongoCosta RicaCubaCzechoslovakiaDenmarkDominican RepublicEastern AfricaEastern AsiaEastern EuropeEcuadorEgyptEl SalvadorEnglandEritreaEthiopiaEuropeFijiFranceGermanyGhanaGreeceGuatemalaGuyanaHaitiHondurasHong KongHungaryIndiaIndonesiaIranIraqIrelandIsraelItalyJamaicaJapanJordanKazakhstanKenyaKoreaKuwaitLaosLatin AmericaLebanonLiberiaMalaysiaMexicoMicronesiaMiddle AfricaMoroccoNepalNetherlandsNicaraguaNigeriaNorthern AfricaNorthern EuropeOceaniaPakistanPeruPhilippinesPolandPortugalRomaniaRussiaSaudi ArabiaScotlandSierra LeoneSomaliaSouth AfricaSouth AmericaSouth Central AsiaSouth Eastern AsiaSouthern EuropeSpainSri LankaSudanSwedenSwitzerlandSyriaTaiwanThailandTrinidad and TobagoTurkeyUgandaUkraineUruguayVenezuelaVietnamWestern AfricaWestern AsiaWestern EuropeZaireZimbabwe
Income
Income (Families)
Income (Households)
Poverty
Poverty (Families)
Unemployment
Employment Occupations
Employment Industries
Employer Class
Commute Time
Commute Means
School Enrollment
Education by Degree Field
Occupancy
Finances
Physical Characteristics
Kansas City
Compare Zip Codes
Comparison Subject

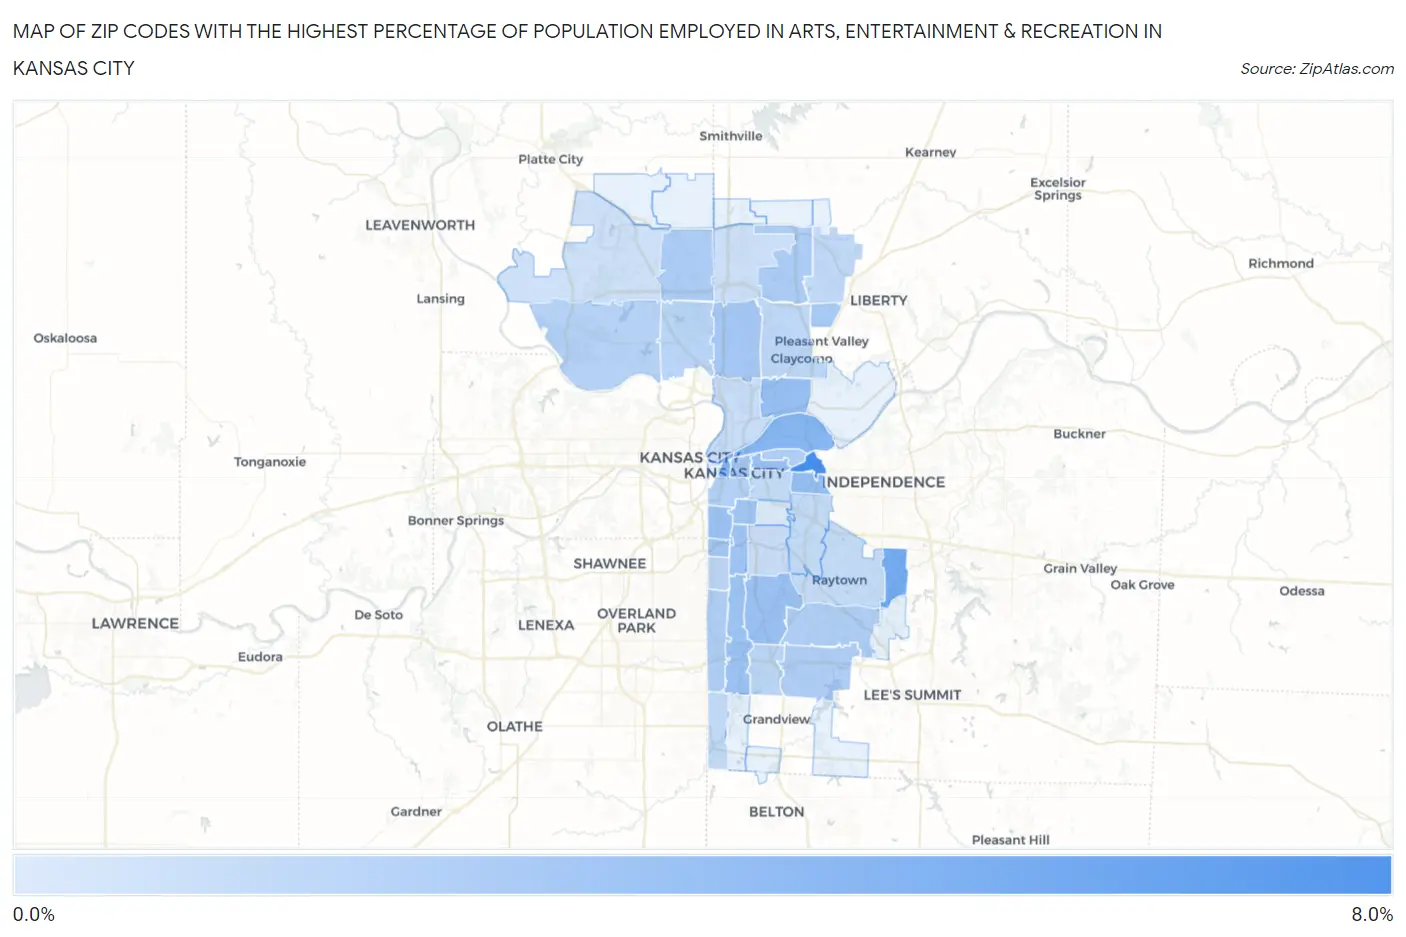
Map of Zip Codes with the Highest Percentage of Population Employed in Arts, Entertainment & Recreation in Kansas City

0.0%
8.0%
Zip Codes with the Highest Percentage of Population Employed in Arts, Entertainment & Recreation in Kansas City Map

Zip Codes with the Highest Percentage of Population Employed in Arts, Entertainment & Recreation in Kansas City, MO

Zip Code % Employed vs State vs National
1.641257.7%1.8%(+5.86)#142.1%(+5.61)#1,133
2.641365.4%1.8%(+3.55)#292.1%(+3.30)#2,032
3.641204.5%1.8%(+2.68)#422.1%(+2.43)#2,728
4.641054.4%1.8%(+2.60)#452.1%(+2.35)#2,816
5.641263.8%1.8%(+2.01)#602.1%(+1.77)#3,556
6.641173.6%1.8%(+1.81)#652.1%(+1.56)#3,861
7.641243.5%1.8%(+1.71)#702.1%(+1.46)#4,037
8.641113.5%1.8%(+1.67)#722.1%(+1.42)#4,118
9.641323.4%1.8%(+1.60)#772.1%(+1.35)#4,286
10.641313.4%1.8%(+1.55)#802.1%(+1.30)#4,392
11.641103.3%1.8%(+1.44)#872.1%(+1.19)#4,626
12.641123.1%1.8%(+1.29)#952.1%(+1.04)#4,995
13.641093.1%1.8%(+1.24)#992.1%(+0.989)#5,156
14.641183.0%1.8%(+1.21)#1022.1%(+0.966)#5,222
15.641063.0%1.8%(+1.18)#1052.1%(+0.929)#5,327
16.641582.9%1.8%(+1.05)#1092.1%(+0.804)#5,690
17.641562.7%1.8%(+0.894)#1172.1%(+0.645)#6,260
18.641542.7%1.8%(+0.881)#1202.1%(+0.632)#6,306
19.641342.5%1.8%(+0.676)#1362.1%(+0.428)#7,135
20.641142.4%1.8%(+0.592)#1482.1%(+0.343)#7,531
21.641382.4%1.8%(+0.585)#1502.1%(+0.336)#7,561
22.641082.4%1.8%(+0.551)#1532.1%(+0.303)#7,711
23.641232.3%1.8%(+0.515)#1572.1%(+0.266)#7,888
24.641522.2%1.8%(+0.371)#1712.1%(+0.123)#8,611
25.641512.0%1.8%(+0.176)#2012.1%(-0.072)#9,710
26.641371.9%1.8%(+0.079)#2152.1%(-0.169)#10,307
27.641131.9%1.8%(+0.025)#2262.1%(-0.224)#10,638
28.641191.8%1.8%(-0.049)#2382.1%(-0.297)#11,121
29.641571.7%1.8%(-0.115)#2522.1%(-0.364)#11,606
30.641451.5%1.8%(-0.287)#2792.1%(-0.536)#12,887
31.641271.5%1.8%(-0.321)#2902.1%(-0.569)#13,158
32.641291.4%1.8%(-0.389)#3012.1%(-0.638)#13,645
33.641331.4%1.8%(-0.393)#3042.1%(-0.642)#13,673
34.641161.3%1.8%(-0.499)#3222.1%(-0.747)#14,479
35.641301.2%1.8%(-0.629)#3462.1%(-0.878)#15,451
36.641551.2%1.8%(-0.676)#3552.1%(-0.925)#15,812
37.641531.0%1.8%(-0.817)#3832.1%(-1.07)#16,832
38.641280.36%1.8%(-1.47)#5062.1%(-1.72)#21,341

Common Questions

What are the Top 10 Zip Codes with the Highest Percentage of Population Employed in Arts, Entertainment & Recreation in Kansas City, MO?
Top 10 Zip Codes with the Highest Percentage of Population Employed in Arts, Entertainment & Recreation in Kansas City, MO are:
#1
7.7%
#2
5.4%
#3
4.5%
#4
4.4%
#5
3.8%
#6
3.6%
#7
3.5%
#8
3.5%
#9
3.4%
#10
3.4%
What zip code has the Highest Percentage of Population Employed in Arts, Entertainment & Recreation in Kansas City, MO?
64125 has the Highest Percentage of Population Employed in Arts, Entertainment & Recreation in Kansas City, MO with 7.7%.
What is the Percentage of Population Employed in Arts, Entertainment & Recreation in Kansas City, MO?
Percentage of Population Employed in Arts, Entertainment & Recreation in Kansas City is 2.5%.
What is the Percentage of Population Employed in Arts, Entertainment & Recreation in Missouri?
Percentage of Population Employed in Arts, Entertainment & Recreation in Missouri is 1.8%.
What is the Percentage of Population Employed in Arts, Entertainment & Recreation in the United States?
Percentage of Population Employed in Arts, Entertainment & Recreation in the United States is 2.1%.