Zip Codes with the Highest Percentage of Population Employed in Legal Services & Support in Chesterfield, MO
RELATED REPORTS & OPTIONS
Legal Services & Support
Chesterfield
Compare Zip Codes
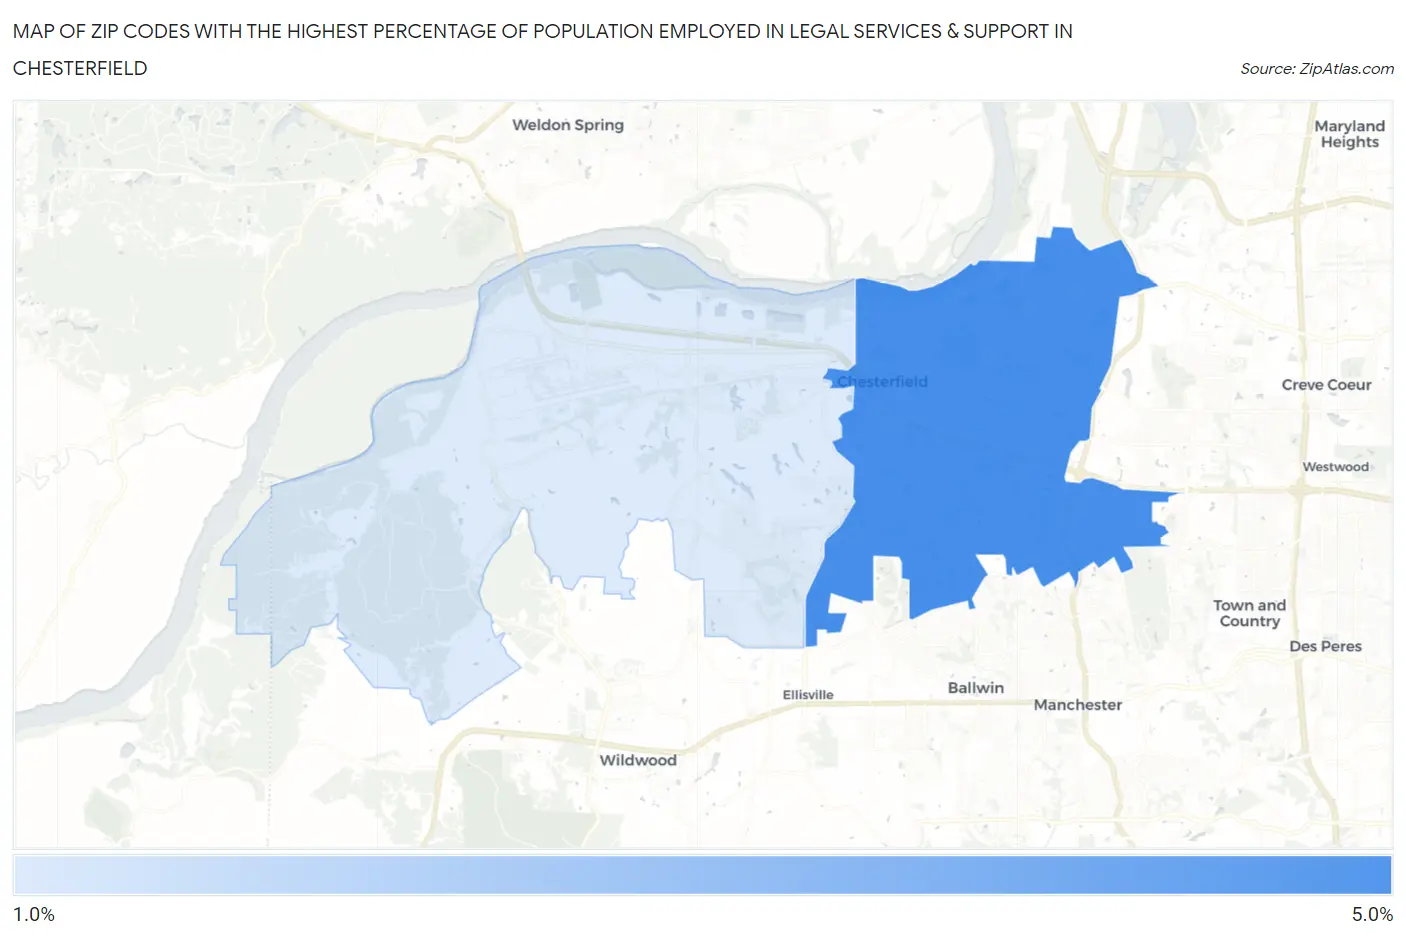
Map of Zip Codes with the Highest Percentage of Population Employed in Legal Services & Support in Chesterfield
1.9%
4.5%
Zip Codes with the Highest Percentage of Population Employed in Legal Services & Support in Chesterfield, MO
| Zip Code | % Employed | vs State | vs National | |
| 1. | 63017 | 4.5% | 0.99%(+3.52)#12 | 1.2%(+3.33)#890 |
| 2. | 63005 | 1.9% | 0.99%(+0.874)#73 | 1.2%(+0.681)#3,824 |
1
Common Questions
What are the Top Zip Codes with the Highest Percentage of Population Employed in Legal Services & Support in Chesterfield, MO?
Top Zip Codes with the Highest Percentage of Population Employed in Legal Services & Support in Chesterfield, MO are:
What zip code has the Highest Percentage of Population Employed in Legal Services & Support in Chesterfield, MO?
63017 has the Highest Percentage of Population Employed in Legal Services & Support in Chesterfield, MO with 4.5%.
What is the Percentage of Population Employed in Legal Services & Support in Chesterfield, MO?
Percentage of Population Employed in Legal Services & Support in Chesterfield is 3.9%.
What is the Percentage of Population Employed in Legal Services & Support in Missouri?
Percentage of Population Employed in Legal Services & Support in Missouri is 0.99%.
What is the Percentage of Population Employed in Legal Services & Support in the United States?
Percentage of Population Employed in Legal Services & Support in the United States is 1.2%.