Zip Codes with the Highest Percentage of Population Employed in Community & Social Service in Chesterfield, MO
RELATED REPORTS & OPTIONS
Community & Social Service
Chesterfield
Compare Zip Codes
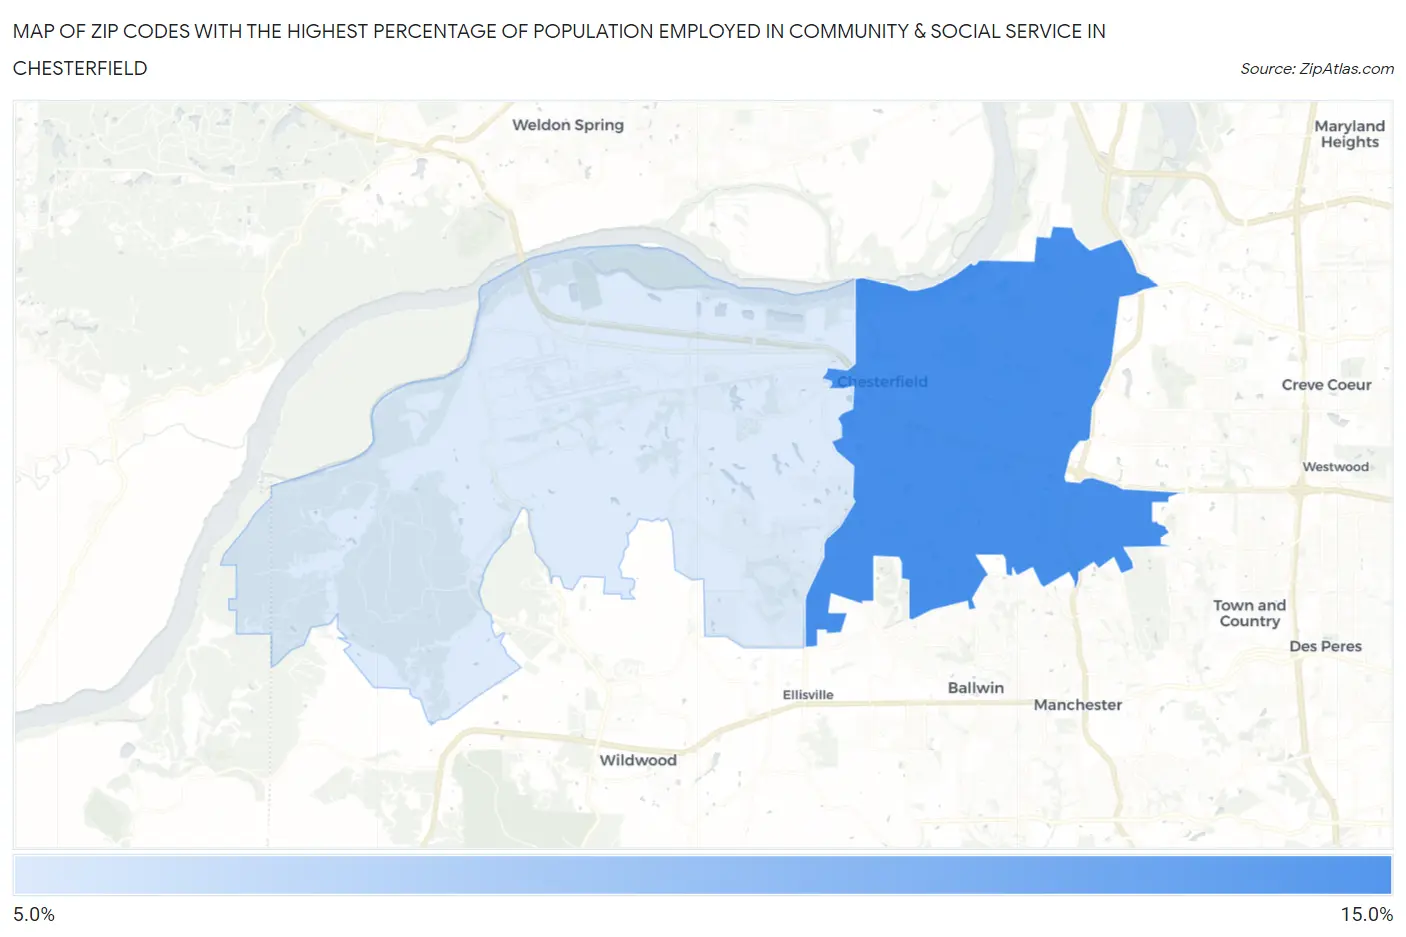
Map of Zip Codes with the Highest Percentage of Population Employed in Community & Social Service in Chesterfield
11.9%
13.9%
Zip Codes with the Highest Percentage of Population Employed in Community & Social Service in Chesterfield, MO
| Zip Code | % Employed | vs State | vs National | |
| 1. | 63017 | 13.9% | 10.6%(+3.29)#145 | 11.2%(+2.64)#6,265 |
| 2. | 63005 | 11.9% | 10.6%(+1.37)#226 | 11.2%(+0.717)#9,519 |
1
Common Questions
What are the Top Zip Codes with the Highest Percentage of Population Employed in Community & Social Service in Chesterfield, MO?
Top Zip Codes with the Highest Percentage of Population Employed in Community & Social Service in Chesterfield, MO are:
What zip code has the Highest Percentage of Population Employed in Community & Social Service in Chesterfield, MO?
63017 has the Highest Percentage of Population Employed in Community & Social Service in Chesterfield, MO with 13.9%.
What is the Percentage of Population Employed in Community & Social Service in Chesterfield, MO?
Percentage of Population Employed in Community & Social Service in Chesterfield is 14.2%.
What is the Percentage of Population Employed in Community & Social Service in Missouri?
Percentage of Population Employed in Community & Social Service in Missouri is 10.6%.
What is the Percentage of Population Employed in Community & Social Service in the United States?
Percentage of Population Employed in Community & Social Service in the United States is 11.2%.