Zip Codes with the Highest Percentage of Population with a Degree in Liberal Arts and History in Chesterfield, MO
RELATED REPORTS & OPTIONS
Liberal Arts and History
Chesterfield
Compare Zip Codes
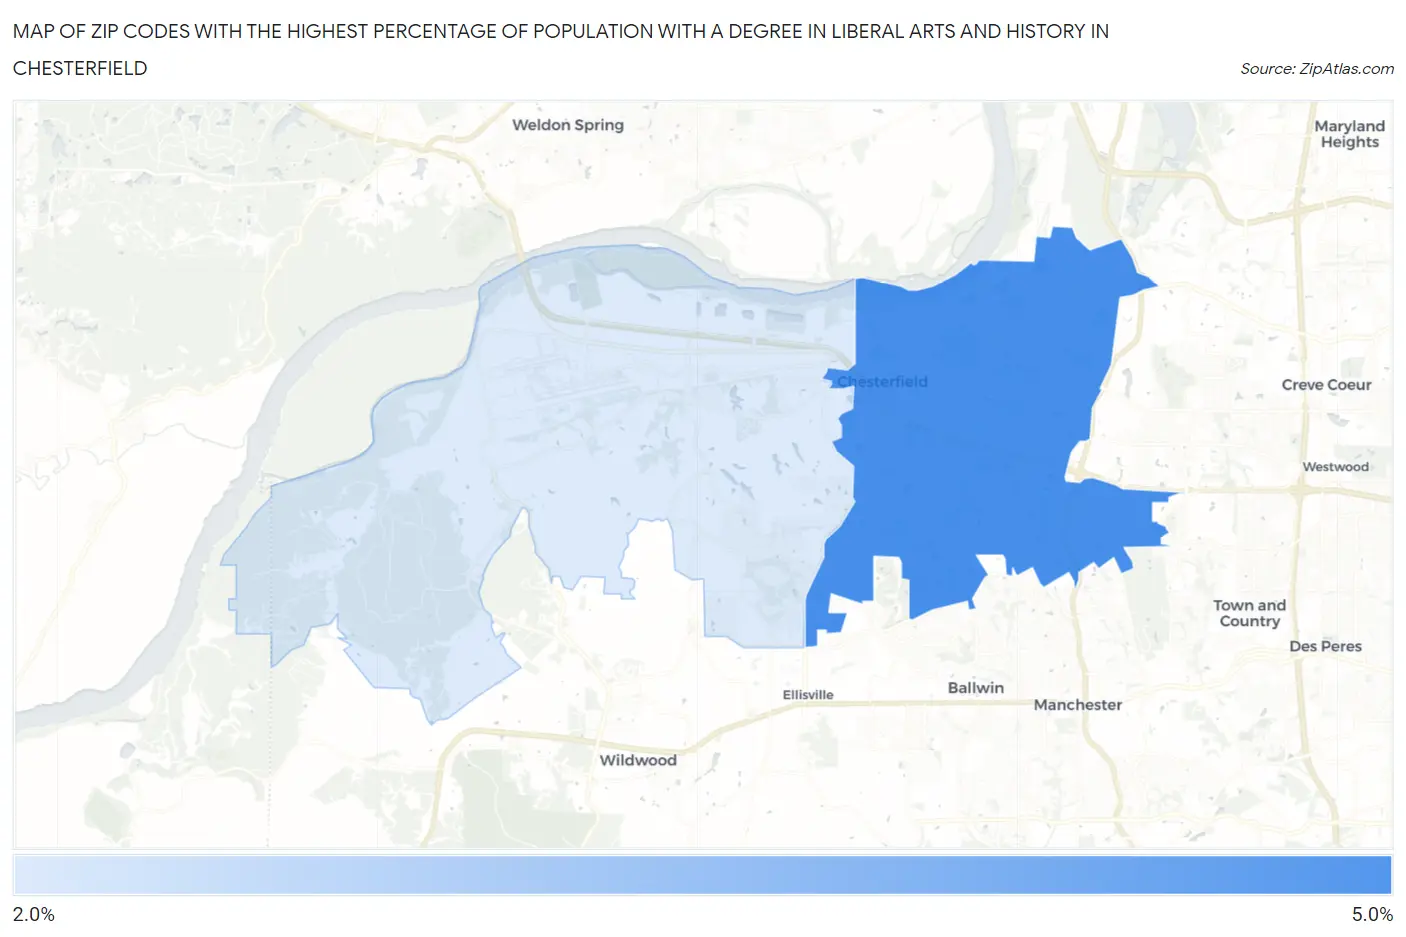
Map of Zip Codes with the Highest Percentage of Population with a Degree in Liberal Arts and History in Chesterfield
2.7%
4.2%
Zip Codes with the Highest Percentage of Population with a Degree in Liberal Arts and History in Chesterfield, MO
| Zip Code | % Graduates | vs State | vs National | |
| 1. | 63017 | 4.2% | 4.6%(-0.358)#352 | 4.9%(-0.660)#13,962 |
| 2. | 63005 | 2.7% | 4.6%(-1.86)#497 | 4.9%(-2.16)#19,266 |
1
Common Questions
What are the Top Zip Codes with the Highest Percentage of Population with a Degree in Liberal Arts and History in Chesterfield, MO?
Top Zip Codes with the Highest Percentage of Population with a Degree in Liberal Arts and History in Chesterfield, MO are:
What zip code has the Highest Percentage of Population with a Degree in Liberal Arts and History in Chesterfield, MO?
63017 has the Highest Percentage of Population with a Degree in Liberal Arts and History in Chesterfield, MO with 4.2%.
What is the Percentage of Population with a Degree in Liberal Arts and History in Chesterfield, MO?
Percentage of Population with a Degree in Liberal Arts and History in Chesterfield is 4.2%.
What is the Percentage of Population with a Degree in Liberal Arts and History in Missouri?
Percentage of Population with a Degree in Liberal Arts and History in Missouri is 4.6%.
What is the Percentage of Population with a Degree in Liberal Arts and History in the United States?
Percentage of Population with a Degree in Liberal Arts and History in the United States is 4.9%.