Woodstock, MN Map & Demographics
Woodstock Map
Woodstock Overview
$30,778
PER CAPITA INCOME
$53,152
AVG FAMILY INCOME
$53,804
AVG HOUSEHOLD INCOME
52.8%
WAGE / INCOME GAP [ % ]
47.2¢/ $1
WAGE / INCOME GAP [ $ ]
0.37
INEQUALITY / GINI INDEX
171
TOTAL POPULATION
97
MALE POPULATION
74
FEMALE POPULATION
131.08
MALES / 100 FEMALES
76.29
FEMALES / 100 MALES
33.6
MEDIAN AGE
2.4
AVG FAMILY SIZE
2.3
AVG HOUSEHOLD SIZE
82
LABOR FORCE [ PEOPLE ]
65.1%
PERCENT IN LABOR FORCE
Woodstock Zip Codes
Woodstock Area Codes
Income in Woodstock
Income Overview in Woodstock
Per Capita Income in Woodstock is $30,778, while median incomes of families and households are $53,152 and $53,804 respectively.
| Characteristic | Number | Measure |
| Per Capita Income | 171 | $30,778 |
| Median Family Income | 62 | $53,152 |
| Mean Family Income | 62 | $66,718 |
| Median Household Income | 74 | $53,804 |
| Mean Household Income | 74 | $66,312 |
| Income Deficit | 62 | $0 |
| Wage / Income Gap (%) | 171 | 52.82% |
| Wage / Income Gap ($) | 171 | 47.18¢ per $1 |
| Gini / Inequality Index | 171 | 0.37 |
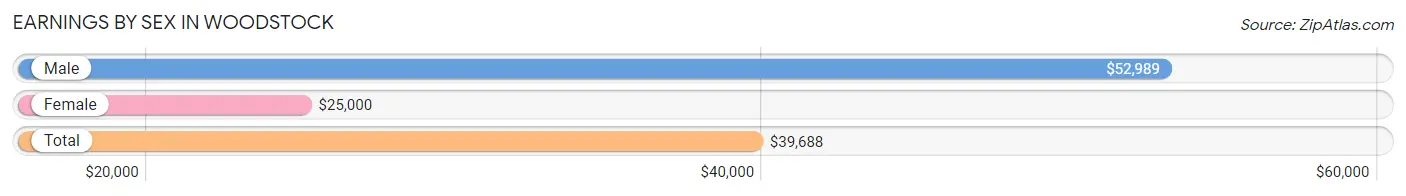
Earnings by Sex in Woodstock
Average Earnings in Woodstock are $39,688, $52,989 for men and $25,000 for women, a difference of 52.8%.
| Sex | Number | Average Earnings |
| Male | 57 (62.6%) | $52,989 |
| Female | 34 (37.4%) | $25,000 |
| Total | 91 (100.0%) | $39,688 |
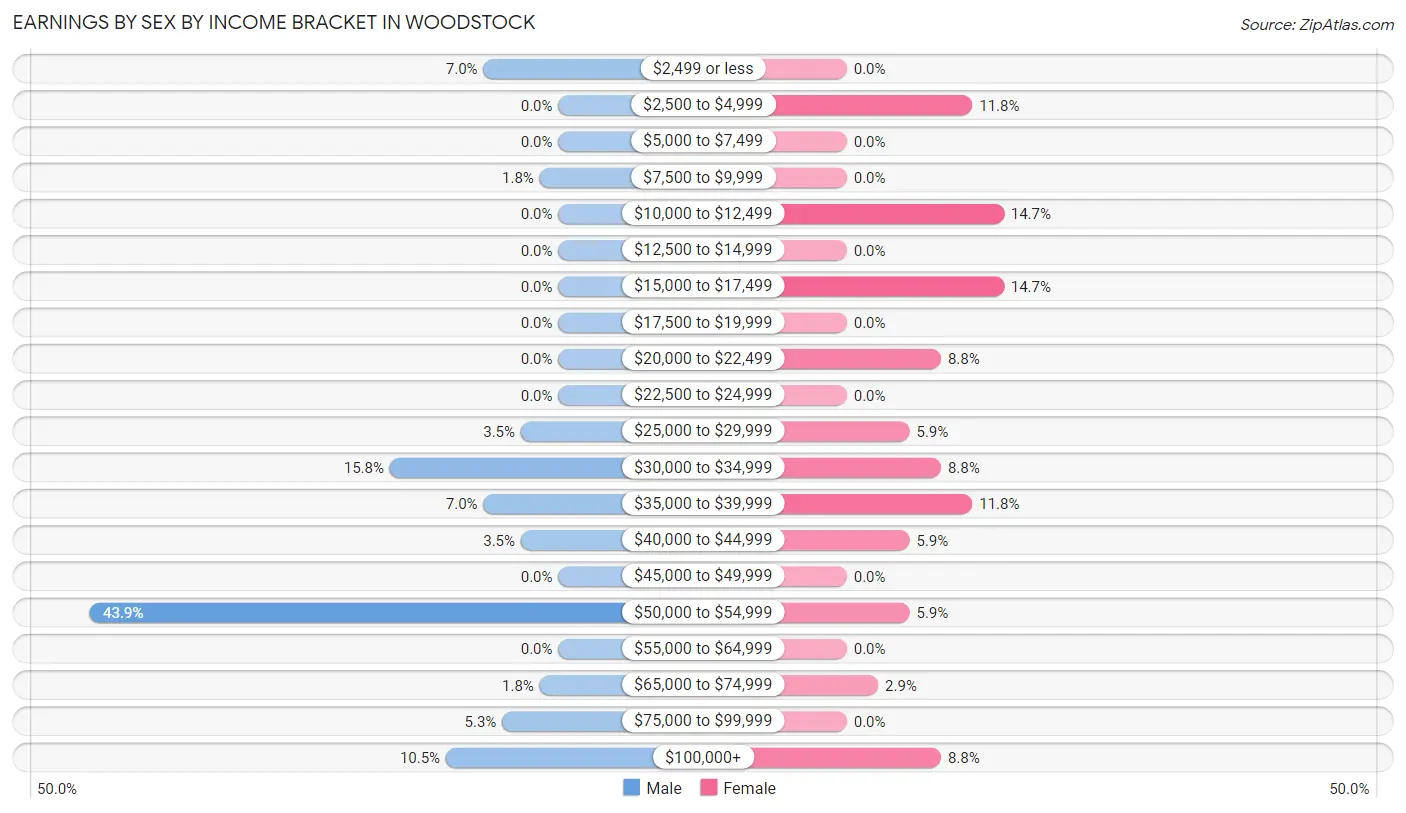
Earnings by Sex by Income Bracket in Woodstock
The most common earnings brackets in Woodstock are $50,000 to $54,999 for men (25 | 43.9%) and $10,000 to $12,499 for women (5 | 14.7%).
| Income | Male | Female |
| $2,499 or less | 4 (7.0%) | 0 (0.0%) |
| $2,500 to $4,999 | 0 (0.0%) | 4 (11.8%) |
| $5,000 to $7,499 | 0 (0.0%) | 0 (0.0%) |
| $7,500 to $9,999 | 1 (1.8%) | 0 (0.0%) |
| $10,000 to $12,499 | 0 (0.0%) | 5 (14.7%) |
| $12,500 to $14,999 | 0 (0.0%) | 0 (0.0%) |
| $15,000 to $17,499 | 0 (0.0%) | 5 (14.7%) |
| $17,500 to $19,999 | 0 (0.0%) | 0 (0.0%) |
| $20,000 to $22,499 | 0 (0.0%) | 3 (8.8%) |
| $22,500 to $24,999 | 0 (0.0%) | 0 (0.0%) |
| $25,000 to $29,999 | 2 (3.5%) | 2 (5.9%) |
| $30,000 to $34,999 | 9 (15.8%) | 3 (8.8%) |
| $35,000 to $39,999 | 4 (7.0%) | 4 (11.8%) |
| $40,000 to $44,999 | 2 (3.5%) | 2 (5.9%) |
| $45,000 to $49,999 | 0 (0.0%) | 0 (0.0%) |
| $50,000 to $54,999 | 25 (43.9%) | 2 (5.9%) |
| $55,000 to $64,999 | 0 (0.0%) | 0 (0.0%) |
| $65,000 to $74,999 | 1 (1.8%) | 1 (2.9%) |
| $75,000 to $99,999 | 3 (5.3%) | 0 (0.0%) |
| $100,000+ | 6 (10.5%) | 3 (8.8%) |
| Total | 57 (100.0%) | 34 (100.0%) |
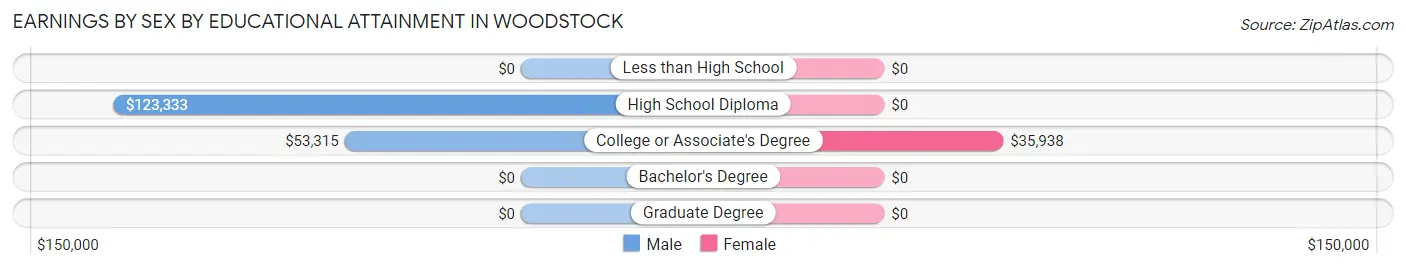
Earnings by Sex by Educational Attainment in Woodstock
Average earnings in Woodstock are $53,533 for men and $32,500 for women, a difference of 39.3%. Men with an educational attainment of high school diploma enjoy the highest average annual earnings of $123,333, while those with college or associate's degree education earn the least with $53,315. Women with an educational attainment of college or associate's degree earn the most with the average annual earnings of $35,938, while those with college or associate's degree education have the smallest earnings of $35,938.
| Educational Attainment | Male Income | Female Income |
| Less than High School | - | - |
| High School Diploma | $123,333 | $0 |
| College or Associate's Degree | $53,315 | $35,938 |
| Bachelor's Degree | - | - |
| Graduate Degree | - | - |
| Total | $53,533 | $32,500 |
Family Income in Woodstock
Family Income Brackets in Woodstock
According to the Woodstock family income data, there are 29 families falling into the $50,000 to $74,999 income range, which is the most common income bracket and makes up 46.8% of all families.
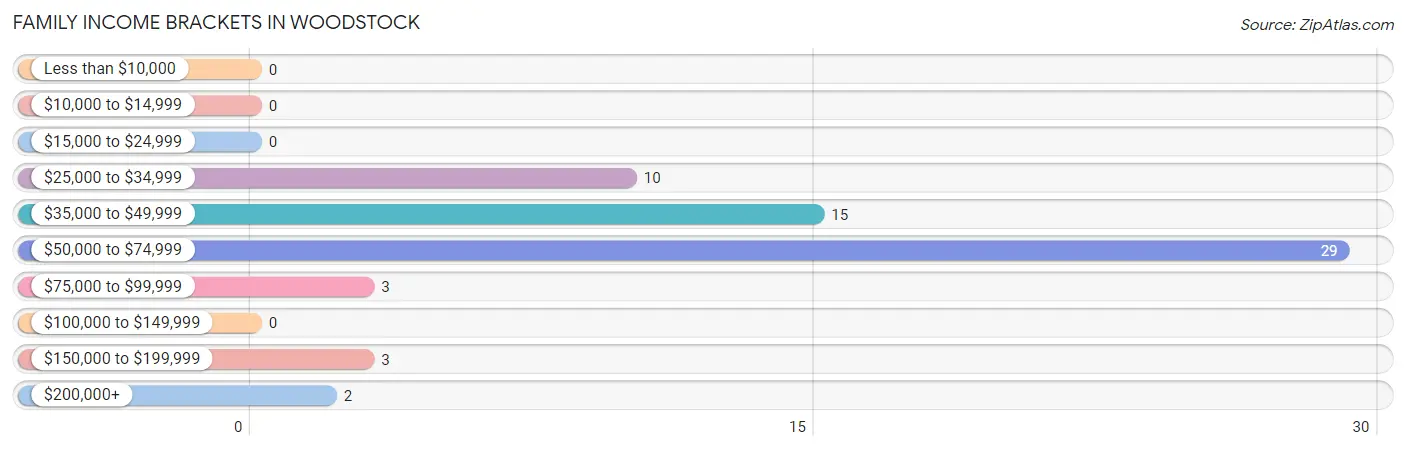
| Income Bracket | # Families | % Families |
| Less than $10,000 | 0 | 0.0% |
| $10,000 to $14,999 | 0 | 0.0% |
| $15,000 to $24,999 | 0 | 0.0% |
| $25,000 to $34,999 | 10 | 16.1% |
| $35,000 to $49,999 | 15 | 24.2% |
| $50,000 to $74,999 | 29 | 46.8% |
| $75,000 to $99,999 | 3 | 4.8% |
| $100,000 to $149,999 | 0 | 0.0% |
| $150,000 to $199,999 | 3 | 4.8% |
| $200,000+ | 2 | 3.2% |
Family Income by Famaliy Size in Woodstock
3-person families (36 | 58.1%) account for the highest median family income in Woodstock with $53,261 per family, while 2-person families (18 | 29.0%) have the highest median income of $19,750 per family member.
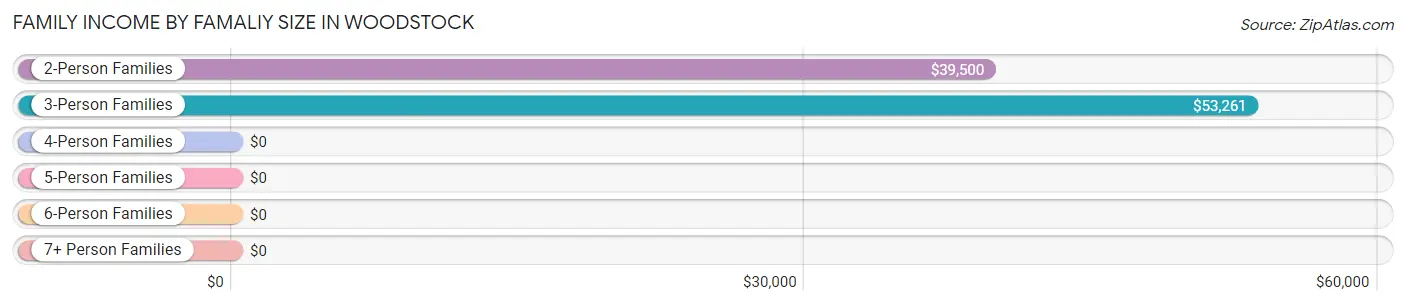
| Income Bracket | # Families | Median Income |
| 2-Person Families | 18 (29.0%) | $39,500 |
| 3-Person Families | 36 (58.1%) | $53,261 |
| 4-Person Families | 6 (9.7%) | $0 |
| 5-Person Families | 2 (3.2%) | $0 |
| 6-Person Families | 0 (0.0%) | $0 |
| 7+ Person Families | 0 (0.0%) | $0 |
| Total | 62 (100.0%) | $53,152 |
Family Income by Number of Earners in Woodstock
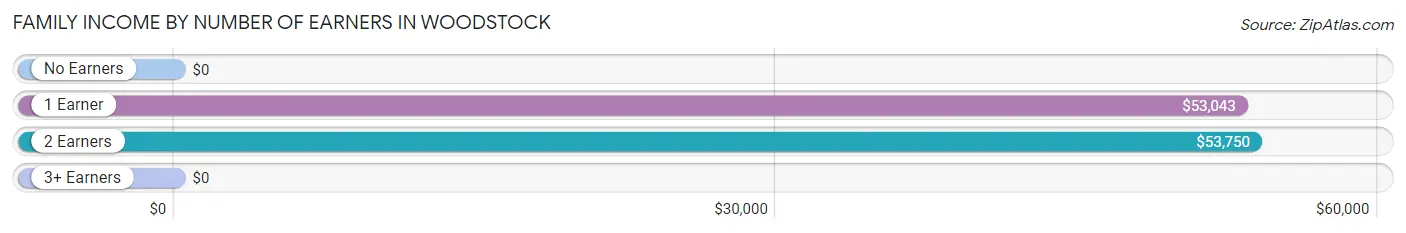
| Number of Earners | # Families | Median Income |
| No Earners | 2 (3.2%) | $0 |
| 1 Earner | 42 (67.7%) | $53,043 |
| 2 Earners | 18 (29.0%) | $53,750 |
| 3+ Earners | 0 (0.0%) | $0 |
| Total | 62 (100.0%) | $53,152 |
Household Income in Woodstock
Household Income Brackets in Woodstock
With 35 households falling in the category, the $50,000 to $74,999 income range is the most frequent in Woodstock, accounting for 47.3% of all households.
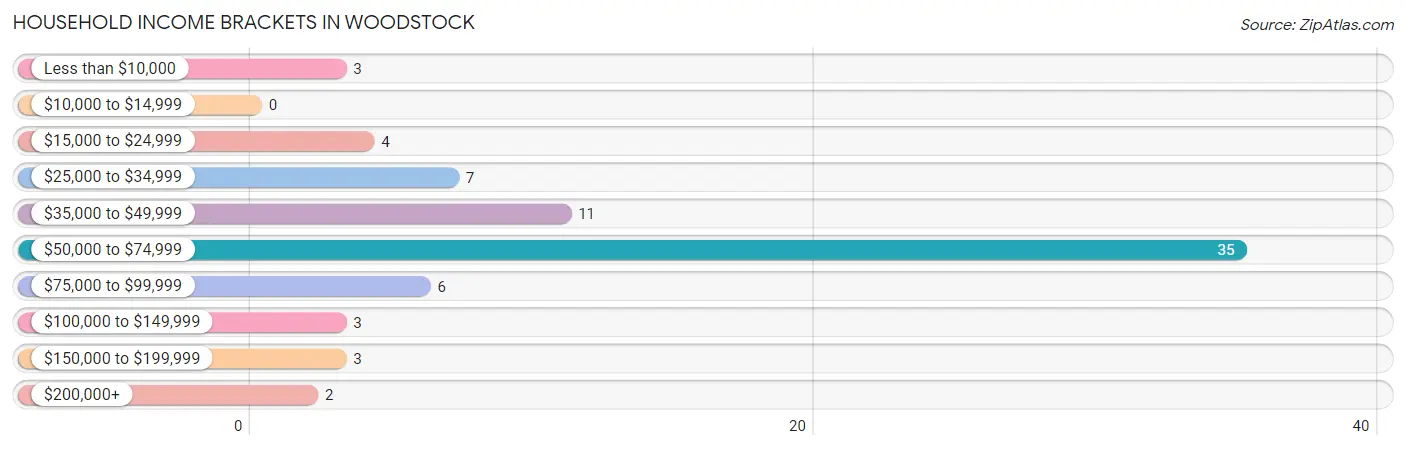
| Income Bracket | # Households | % Households |
| Less than $10,000 | 3 | 4.1% |
| $10,000 to $14,999 | 0 | 0.0% |
| $15,000 to $24,999 | 4 | 5.4% |
| $25,000 to $34,999 | 7 | 9.5% |
| $35,000 to $49,999 | 11 | 14.9% |
| $50,000 to $74,999 | 35 | 47.3% |
| $75,000 to $99,999 | 6 | 8.1% |
| $100,000 to $149,999 | 3 | 4.1% |
| $150,000 to $199,999 | 3 | 4.1% |
| $200,000+ | 2 | 2.7% |
Household Income by Householder Age in Woodstock
The median household income in Woodstock is $53,804, with the highest median household income of $54,185 found in the 25 to 44 years age bracket for the primary householder. A total of 39 households (52.7%) fall into this category. Meanwhile, the 15 to 24 years age bracket for the primary householder has the lowest median household income of $0, with 11 households (14.9%) in this group.
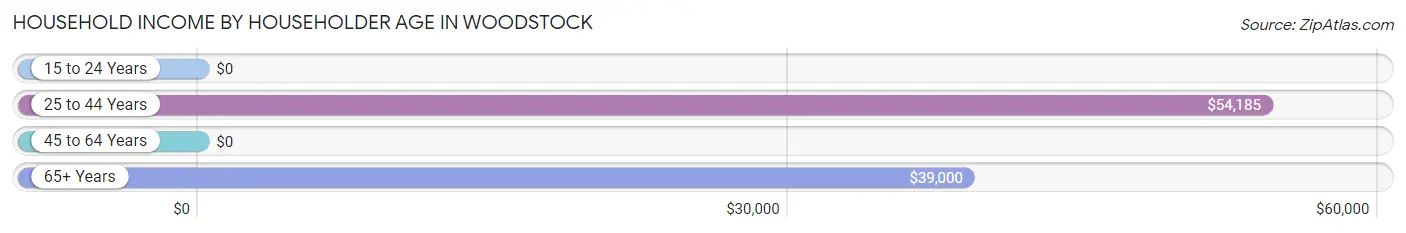
| Income Bracket | # Households | Median Income |
| 15 to 24 Years | 11 (14.9%) | $0 |
| 25 to 44 Years | 39 (52.7%) | $54,185 |
| 45 to 64 Years | 12 (16.2%) | $0 |
| 65+ Years | 12 (16.2%) | $39,000 |
| Total | 74 (100.0%) | $53,804 |
Poverty in Woodstock
Income Below Poverty by Sex and Age in Woodstock
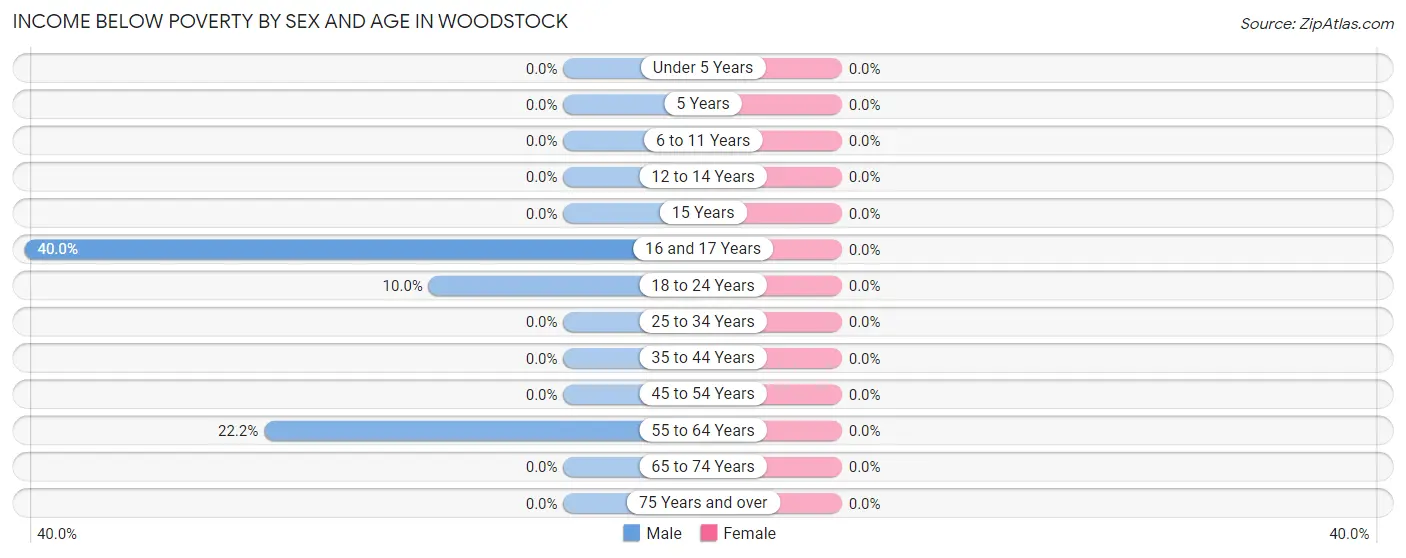
| Age Bracket | Male | Female |
| Under 5 Years | 0 (0.0%) | 0 (0.0%) |
| 5 Years | 0 (0.0%) | 0 (0.0%) |
| 6 to 11 Years | 0 (0.0%) | 0 (0.0%) |
| 12 to 14 Years | 0 (0.0%) | 0 (0.0%) |
| 15 Years | 0 (0.0%) | 0 (0.0%) |
| 16 and 17 Years | 2 (40.0%) | 0 (0.0%) |
| 18 to 24 Years | 1 (10.0%) | 0 (0.0%) |
| 25 to 34 Years | 0 (0.0%) | 0 (0.0%) |
| 35 to 44 Years | 0 (0.0%) | 0 (0.0%) |
| 45 to 54 Years | 0 (0.0%) | 0 (0.0%) |
| 55 to 64 Years | 2 (22.2%) | 0 (0.0%) |
| 65 to 74 Years | 0 (0.0%) | 0 (0.0%) |
| 75 Years and over | 0 (0.0%) | 0 (0.0%) |
| Total | 5 (5.2%) | 0 (0.0%) |
Income Above Poverty by Sex and Age in Woodstock
According to the poverty statistics in Woodstock, males aged under 5 years and females aged under 5 years are the age groups that are most secure financially, with 100.0% of males and 100.0% of females in these age groups living above the poverty line.
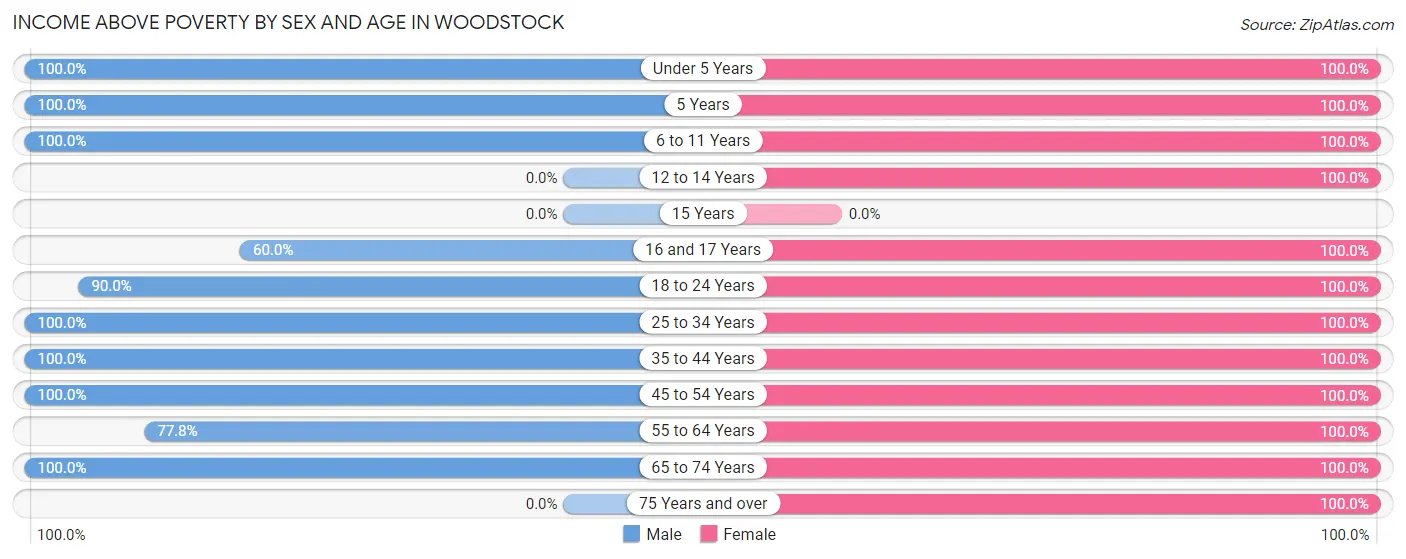
| Age Bracket | Male | Female |
| Under 5 Years | 10 (100.0%) | 4 (100.0%) |
| 5 Years | 8 (100.0%) | 1 (100.0%) |
| 6 to 11 Years | 2 (100.0%) | 13 (100.0%) |
| 12 to 14 Years | 0 (0.0%) | 6 (100.0%) |
| 15 Years | 0 (0.0%) | 0 (0.0%) |
| 16 and 17 Years | 3 (60.0%) | 6 (100.0%) |
| 18 to 24 Years | 9 (90.0%) | 8 (100.0%) |
| 25 to 34 Years | 6 (100.0%) | 9 (100.0%) |
| 35 to 44 Years | 31 (100.0%) | 10 (100.0%) |
| 45 to 54 Years | 6 (100.0%) | 6 (100.0%) |
| 55 to 64 Years | 7 (77.8%) | 2 (100.0%) |
| 65 to 74 Years | 9 (100.0%) | 8 (100.0%) |
| 75 Years and over | 0 (0.0%) | 1 (100.0%) |
| Total | 91 (94.8%) | 74 (100.0%) |
Income Below Poverty Among Married-Couple Families in Woodstock
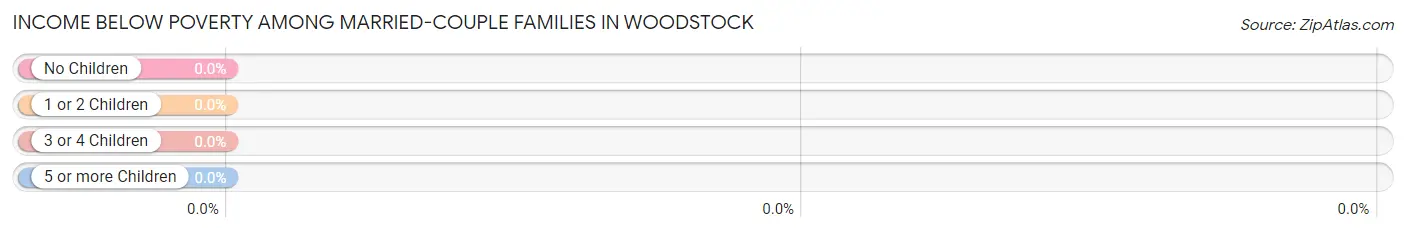
| Children | Above Poverty | Below Poverty |
| No Children | 12 (100.0%) | 0 (0.0%) |
| 1 or 2 Children | 33 (100.0%) | 0 (0.0%) |
| 3 or 4 Children | 2 (100.0%) | 0 (0.0%) |
| 5 or more Children | 0 (0.0%) | 0 (0.0%) |
| Total | 47 (100.0%) | 0 (0.0%) |
Income Below Poverty Among Single-Parent Households in Woodstock
| Children | Single Father | Single Mother |
| No Children | 0 (0.0%) | 0 (0.0%) |
| 1 or 2 Children | 0 (0.0%) | 0 (0.0%) |
| 3 or 4 Children | 0 (0.0%) | 0 (0.0%) |
| 5 or more Children | 0 (0.0%) | 0 (0.0%) |
| Total | 0 (0.0%) | 0 (0.0%) |
Income Below Poverty Among Married-Couple vs Single-Parent Households in Woodstock
| Children | Married-Couple Families | Single-Parent Households |
| No Children | 0 (0.0%) | 0 (0.0%) |
| 1 or 2 Children | 0 (0.0%) | 0 (0.0%) |
| 3 or 4 Children | 0 (0.0%) | 0 (0.0%) |
| 5 or more Children | 0 (0.0%) | 0 (0.0%) |
| Total | 0 (0.0%) | 0 (0.0%) |
Race in Woodstock
The most populous races in Woodstock are White / Caucasian (168 | 98.3%), Hispanic or Latino (3 | 1.8%), and Two or more Races (2 | 1.2%).
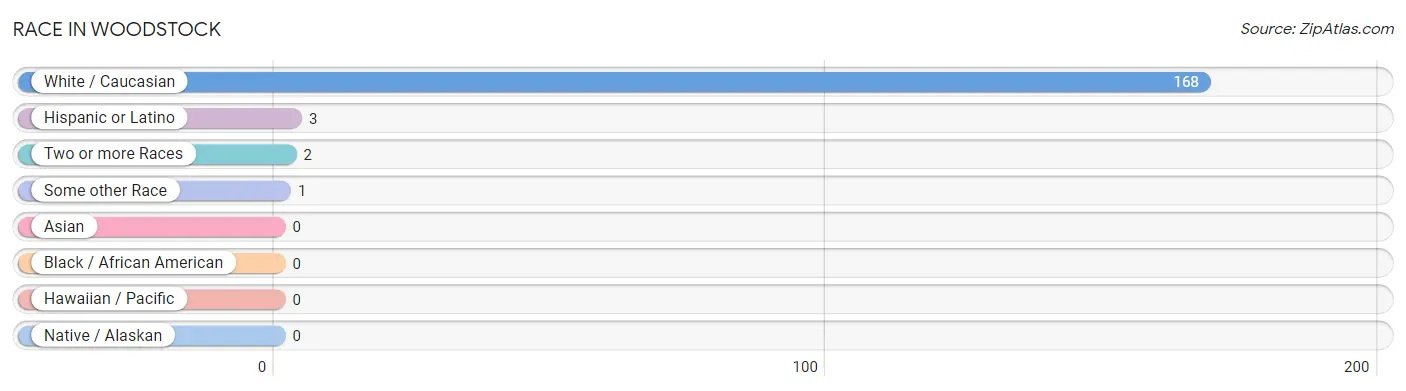
| Race | # Population | % Population |
| Asian | 0 | 0.0% |
| Black / African American | 0 | 0.0% |
| Hawaiian / Pacific | 0 | 0.0% |
| Hispanic or Latino | 3 | 1.8% |
| Native / Alaskan | 0 | 0.0% |
| White / Caucasian | 168 | 98.3% |
| Two or more Races | 2 | 1.2% |
| Some other Race | 1 | 0.6% |
| Total | 171 | 100.0% |
Ancestry in Woodstock
The most populous ancestries reported in Woodstock are German (71 | 41.5%), Norwegian (47 | 27.5%), Dutch (20 | 11.7%), Swedish (9 | 5.3%), and Scandinavian (8 | 4.7%), together accounting for 90.6% of all Woodstock residents.
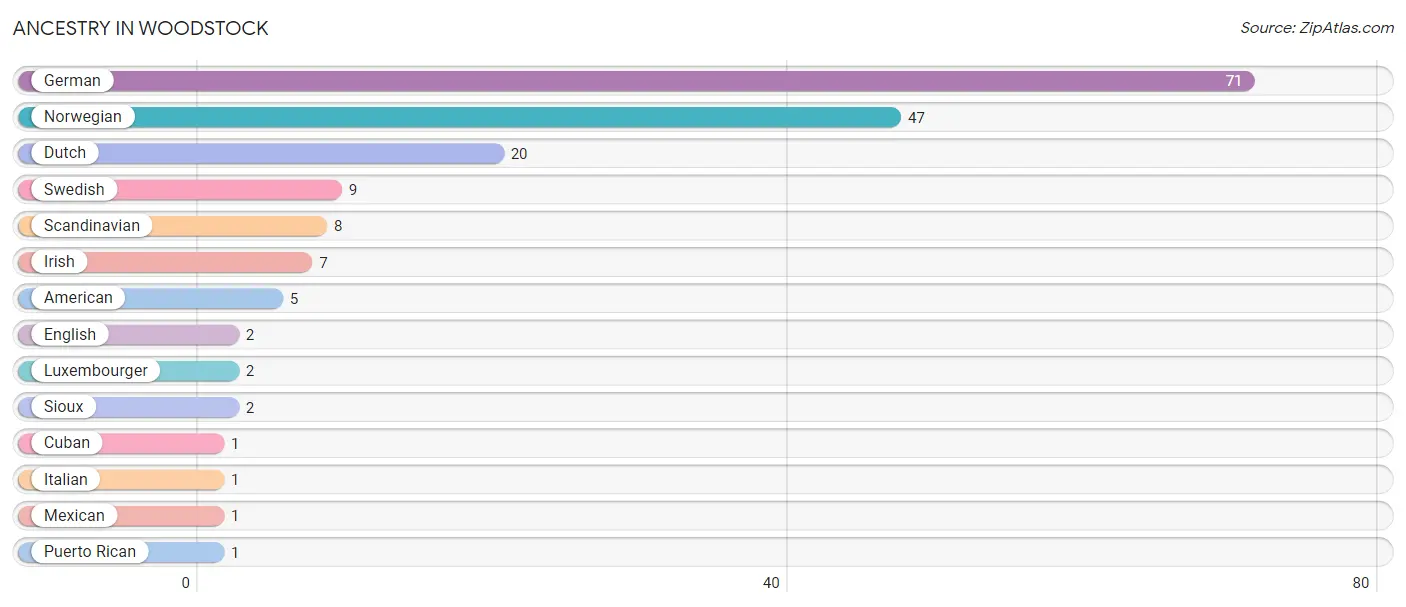
| Ancestry | # Population | % Population |
| American | 5 | 2.9% |
| Cuban | 1 | 0.6% |
| Dutch | 20 | 11.7% |
| English | 2 | 1.2% |
| German | 71 | 41.5% |
| Irish | 7 | 4.1% |
| Italian | 1 | 0.6% |
| Luxembourger | 2 | 1.2% |
| Mexican | 1 | 0.6% |
| Norwegian | 47 | 27.5% |
| Puerto Rican | 1 | 0.6% |
| Scandinavian | 8 | 4.7% |
| Sioux | 2 | 1.2% |
| Swedish | 9 | 5.3% | View All 14 Rows |
Immigrants in Woodstock

| Immigration Origin | # Population | % Population | View All 0 Rows |
Sex and Age in Woodstock
Sex and Age in Woodstock
The most populous age groups in Woodstock are 35 to 39 Years (28 | 28.9%) for men and 5 to 9 Years (14 | 18.9%) for women.
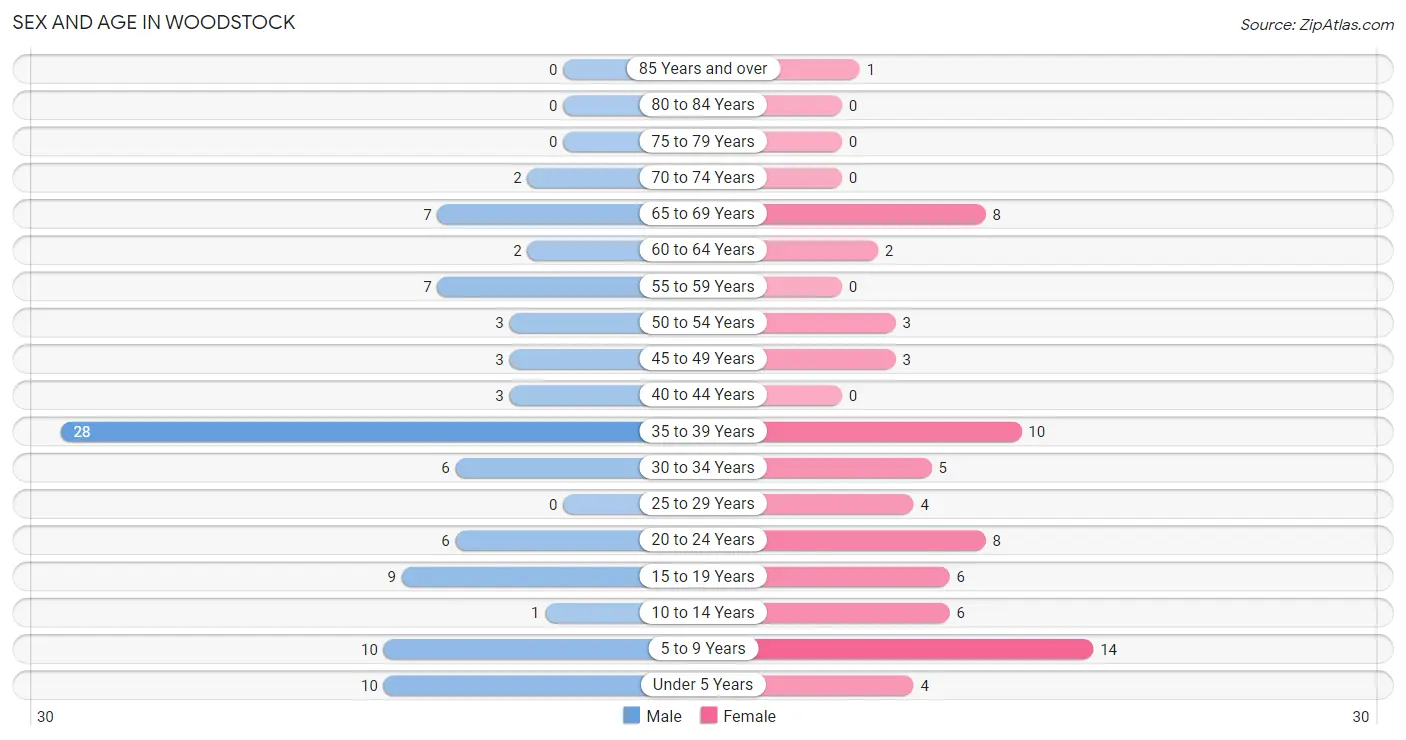
| Age Bracket | Male | Female |
| Under 5 Years | 10 (10.3%) | 4 (5.4%) |
| 5 to 9 Years | 10 (10.3%) | 14 (18.9%) |
| 10 to 14 Years | 1 (1.0%) | 6 (8.1%) |
| 15 to 19 Years | 9 (9.3%) | 6 (8.1%) |
| 20 to 24 Years | 6 (6.2%) | 8 (10.8%) |
| 25 to 29 Years | 0 (0.0%) | 4 (5.4%) |
| 30 to 34 Years | 6 (6.2%) | 5 (6.8%) |
| 35 to 39 Years | 28 (28.9%) | 10 (13.5%) |
| 40 to 44 Years | 3 (3.1%) | 0 (0.0%) |
| 45 to 49 Years | 3 (3.1%) | 3 (4.1%) |
| 50 to 54 Years | 3 (3.1%) | 3 (4.1%) |
| 55 to 59 Years | 7 (7.2%) | 0 (0.0%) |
| 60 to 64 Years | 2 (2.1%) | 2 (2.7%) |
| 65 to 69 Years | 7 (7.2%) | 8 (10.8%) |
| 70 to 74 Years | 2 (2.1%) | 0 (0.0%) |
| 75 to 79 Years | 0 (0.0%) | 0 (0.0%) |
| 80 to 84 Years | 0 (0.0%) | 0 (0.0%) |
| 85 Years and over | 0 (0.0%) | 1 (1.3%) |
| Total | 97 (100.0%) | 74 (100.0%) |
Families and Households in Woodstock
Median Family Size in Woodstock
The median family size in Woodstock is 2.37 persons per family, with single male/father families (10 | 16.1%) accounting for the largest median family size of 2.4 persons per family. On the other hand, married-couple families (47 | 75.8%) represent the smallest median family size with 2.36 persons per family.
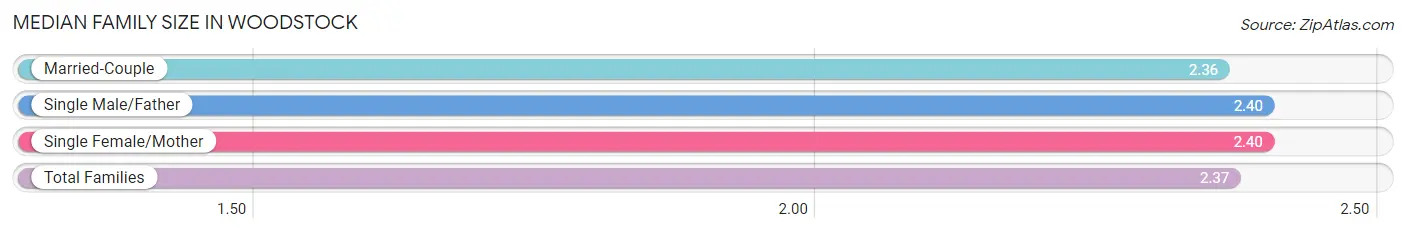
| Family Type | # Families | Family Size |
| Married-Couple | 47 (75.8%) | 2.36 |
| Single Male/Father | 10 (16.1%) | 2.40 |
| Single Female/Mother | 5 (8.1%) | 2.40 |
| Total Families | 62 (100.0%) | 2.37 |
Median Household Size in Woodstock
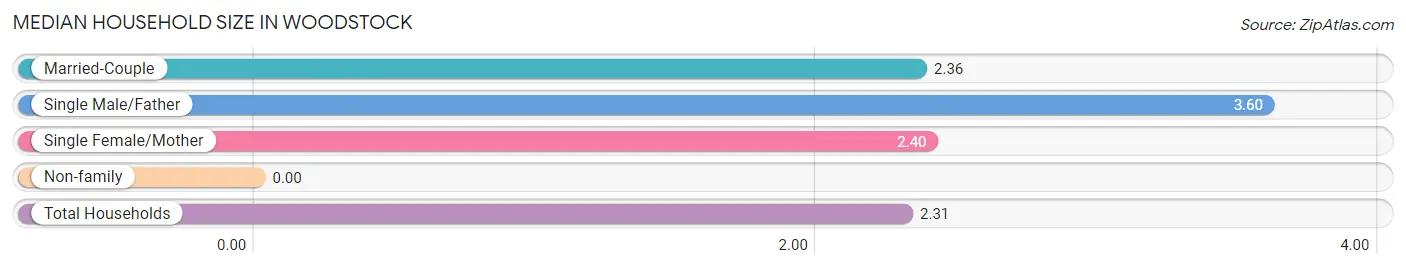
| Household Type | # Households | Household Size |
| Married-Couple | 47 (63.5%) | 2.36 |
| Single Male/Father | 10 (13.5%) | 3.60 |
| Single Female/Mother | 5 (6.8%) | 2.40 |
| Non-family | 12 (16.2%) | - |
| Total Households | 74 (100.0%) | 2.31 |
Household Size by Marriage Status in Woodstock
Out of a total of 74 households in Woodstock, 62 (83.8%) are family households, while 12 (16.2%) are nonfamily households. The most numerous type of family households are 3-person households, comprising 37, and the most common type of nonfamily households are 1-person households, comprising 12.
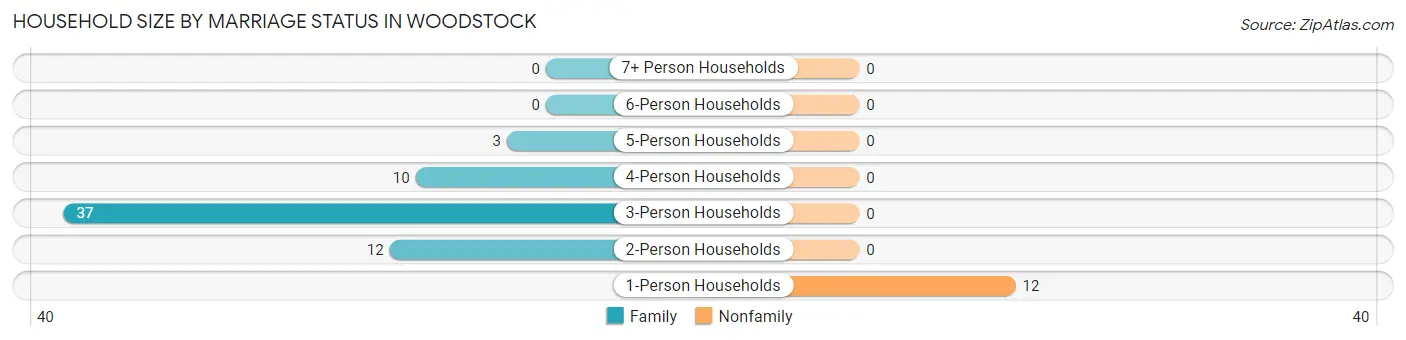
| Household Size | Family Households | Nonfamily Households |
| 1-Person Households | - | 12 (16.2%) |
| 2-Person Households | 12 (16.2%) | 0 (0.0%) |
| 3-Person Households | 37 (50.0%) | 0 (0.0%) |
| 4-Person Households | 10 (13.5%) | 0 (0.0%) |
| 5-Person Households | 3 (4.1%) | 0 (0.0%) |
| 6-Person Households | 0 (0.0%) | 0 (0.0%) |
| 7+ Person Households | 0 (0.0%) | 0 (0.0%) |
| Total | 62 (83.8%) | 12 (16.2%) |
Female Fertility in Woodstock
Fertility by Age in Woodstock
Average fertility rate in Woodstock is 83.0 births per 1,000 women. Women in the age bracket of 20 to 34 years have the highest fertility rate with 176.0 births per 1,000 women. Women in the age bracket of 20 to 34 years acount for 100.0% of all women with births.
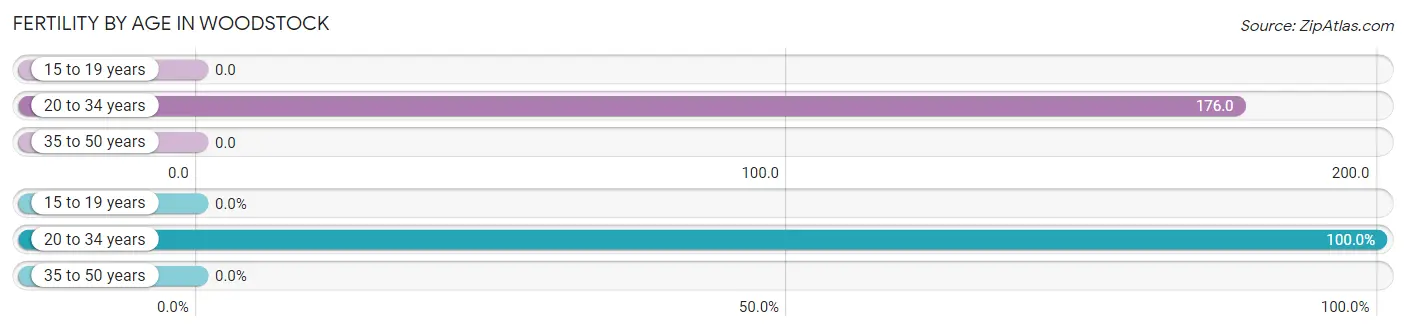
| Age Bracket | Women with Births | Births / 1,000 Women |
| 15 to 19 years | 0 (0.0%) | 0.0 |
| 20 to 34 years | 3 (100.0%) | 176.0 |
| 35 to 50 years | 0 (0.0%) | 0.0 |
| Total | 3 (100.0%) | 83.0 |
Fertility by Age by Marriage Status in Woodstock
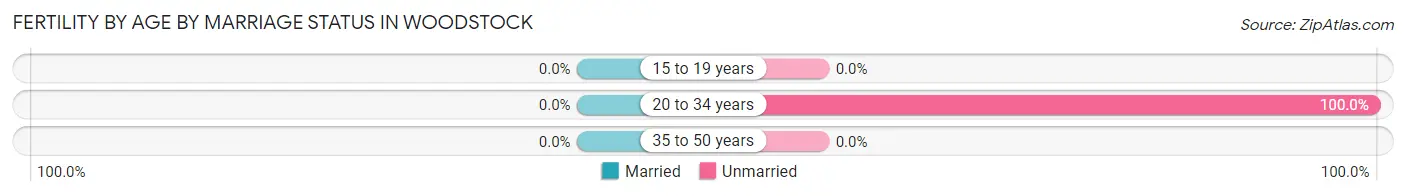
| Age Bracket | Married | Unmarried |
| 15 to 19 years | 0 (0.0%) | 0 (0.0%) |
| 20 to 34 years | 0 (0.0%) | 3 (100.0%) |
| 35 to 50 years | 0 (0.0%) | 0 (0.0%) |
| Total | 0 (0.0%) | 3 (100.0%) |
Fertility by Education in Woodstock
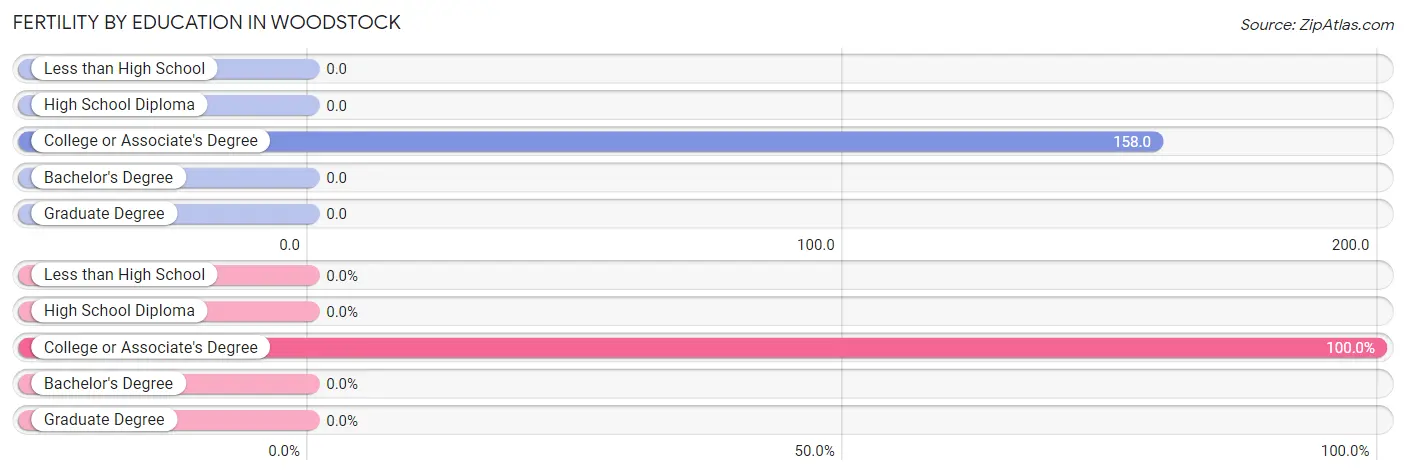
| Educational Attainment | Women with Births | Births / 1,000 Women |
| Less than High School | 0 (0.0%) | 0.0 |
| High School Diploma | 0 (0.0%) | 0.0 |
| College or Associate's Degree | 3 (100.0%) | 158.0 |
| Bachelor's Degree | 0 (0.0%) | 0.0 |
| Graduate Degree | 0 (0.0%) | 0.0 |
| Total | 3 (100.0%) | 83.0 |
Fertility by Education by Marriage Status in Woodstock
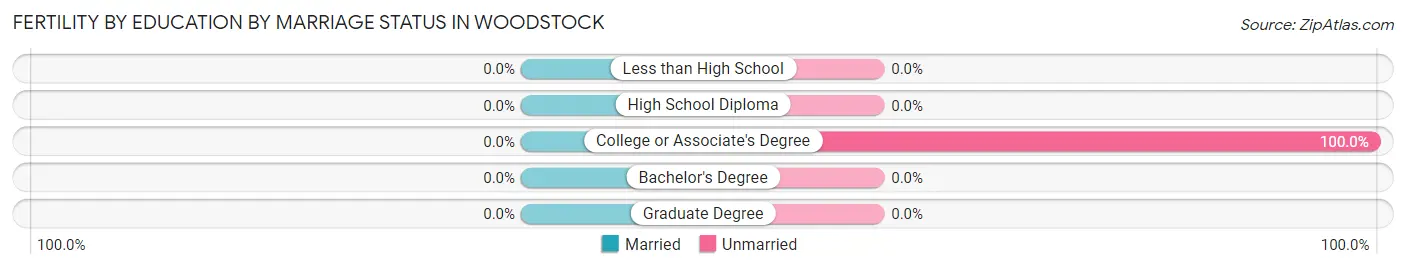
| Educational Attainment | Married | Unmarried |
| Less than High School | 0 (0.0%) | 0 (0.0%) |
| High School Diploma | 0 (0.0%) | 0 (0.0%) |
| College or Associate's Degree | 0 (0.0%) | 3 (100.0%) |
| Bachelor's Degree | 0 (0.0%) | 0 (0.0%) |
| Graduate Degree | 0 (0.0%) | 0 (0.0%) |
| Total | 0 (0.0%) | 3 (100.0%) |
Employment Characteristics in Woodstock
Employment by Class of Employer in Woodstock
Among the 78 employed individuals in Woodstock, private company employees (60 | 76.9%), local government employees (7 | 9.0%), and not-for-profit organizations (6 | 7.7%) make up the most common classes of employment.
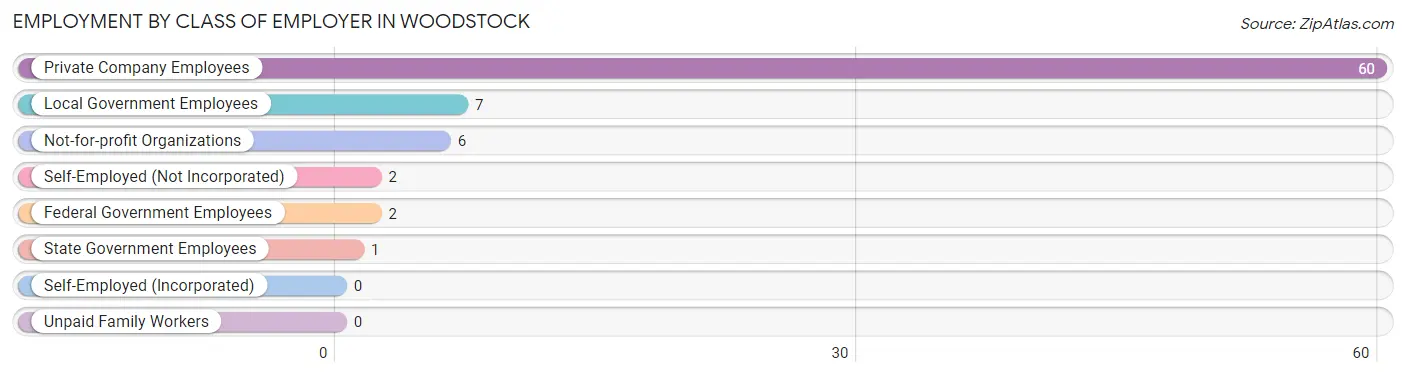
| Employer Class | # Employees | % Employees |
| Private Company Employees | 60 | 76.9% |
| Self-Employed (Incorporated) | 0 | 0.0% |
| Self-Employed (Not Incorporated) | 2 | 2.6% |
| Not-for-profit Organizations | 6 | 7.7% |
| Local Government Employees | 7 | 9.0% |
| State Government Employees | 1 | 1.3% |
| Federal Government Employees | 2 | 2.6% |
| Unpaid Family Workers | 0 | 0.0% |
| Total | 78 | 100.0% |
Employment Status by Age in Woodstock
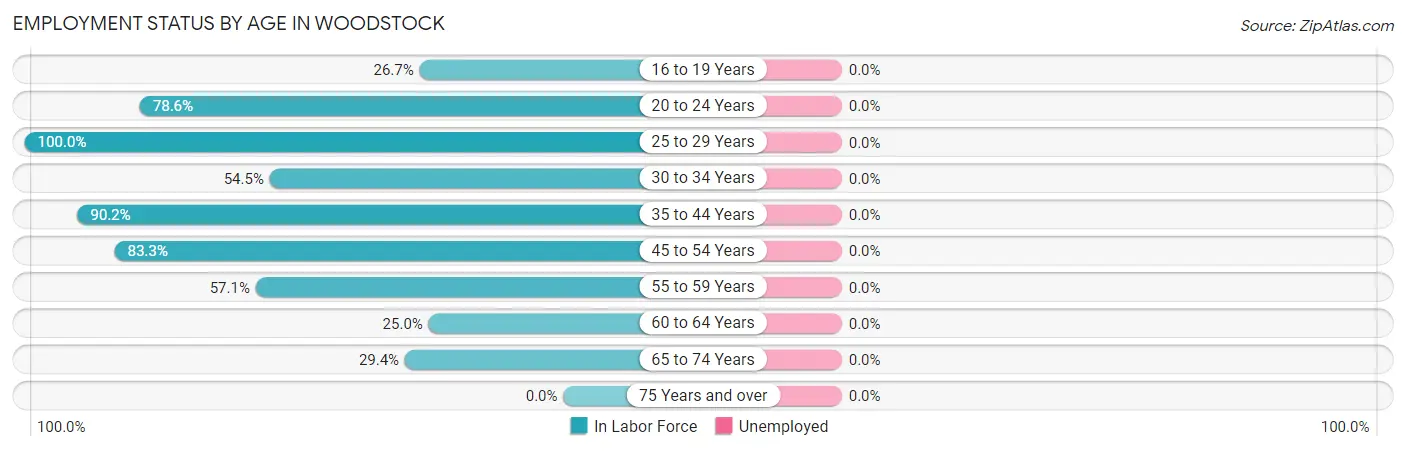
| Age Bracket | In Labor Force | Unemployed |
| 16 to 19 Years | 4 (26.7%) | 0 (0.0%) |
| 20 to 24 Years | 11 (78.6%) | 0 (0.0%) |
| 25 to 29 Years | 4 (100.0%) | 0 (0.0%) |
| 30 to 34 Years | 6 (54.5%) | 0 (0.0%) |
| 35 to 44 Years | 37 (90.2%) | 0 (0.0%) |
| 45 to 54 Years | 10 (83.3%) | 0 (0.0%) |
| 55 to 59 Years | 4 (57.1%) | 0 (0.0%) |
| 60 to 64 Years | 1 (25.0%) | 0 (0.0%) |
| 65 to 74 Years | 5 (29.4%) | 0 (0.0%) |
| 75 Years and over | 0 (0.0%) | 0 (0.0%) |
| Total | 82 (65.1%) | 0 (0.0%) |
Employment Status by Educational Attainment in Woodstock
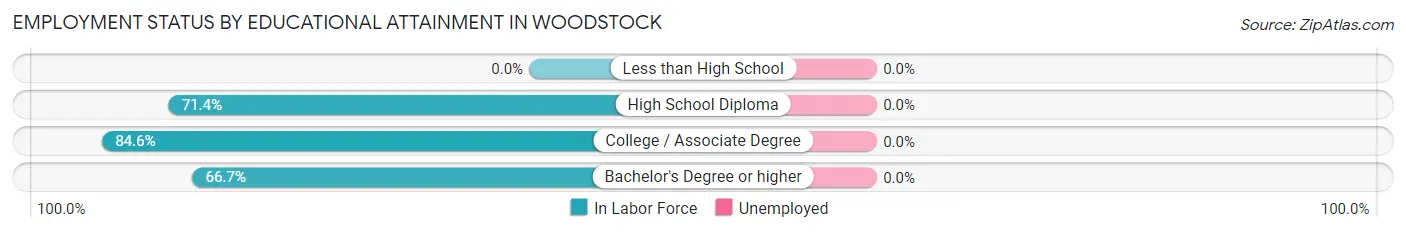
| Educational Attainment | In Labor Force | Unemployed |
| Less than High School | 0 (0.0%) | 0 (0.0%) |
| High School Diploma | 10 (71.4%) | 0 (0.0%) |
| College / Associate Degree | 44 (84.6%) | 0 (0.0%) |
| Bachelor's Degree or higher | 8 (66.7%) | 0 (0.0%) |
| Total | 62 (78.5%) | 0 (0.0%) |
Employment Occupations by Sex in Woodstock
Management, Business, Science and Arts Occupations
The most common Management, Business, Science and Arts occupations in Woodstock are Management (29 | 35.4%), Computers, Engineering & Science (4 | 4.9%), Architecture & Engineering (4 | 4.9%), Community & Social Service (4 | 4.9%), and Education, Arts & Media (4 | 4.9%).
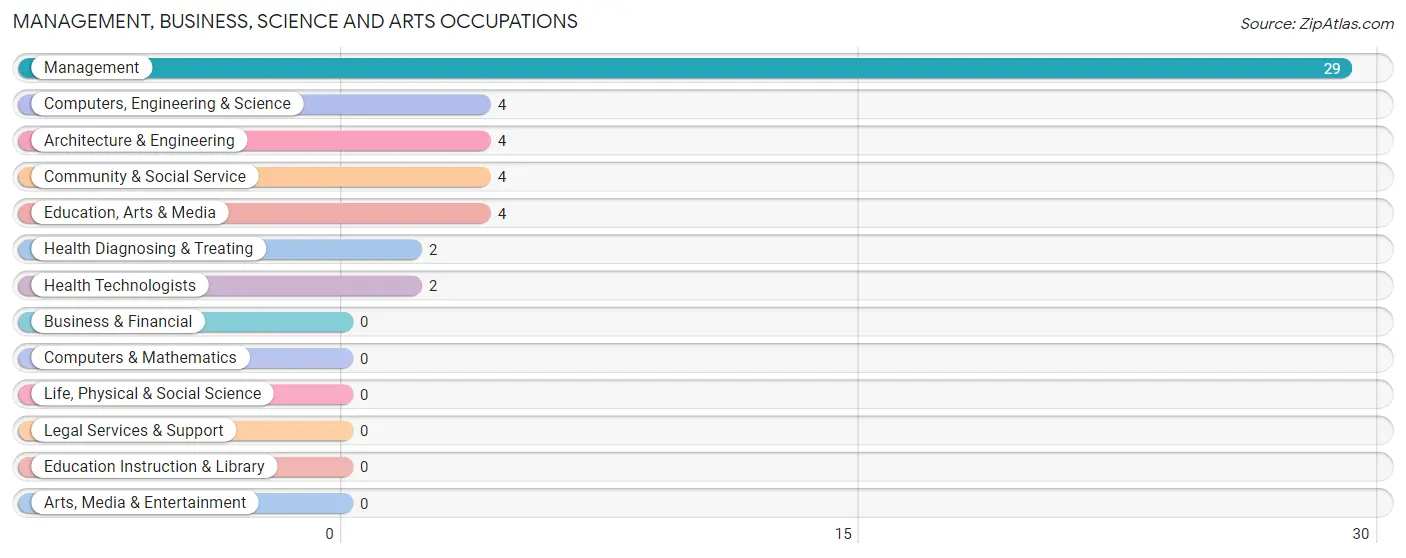
Management, Business, Science and Arts Occupations by Sex
Within the Management, Business, Science and Arts occupations in Woodstock, the most male-oriented occupations are Computers, Engineering & Science (100.0%), Architecture & Engineering (100.0%), and Community & Social Service (100.0%), while the most female-oriented occupations are Health Diagnosing & Treating (100.0%), Health Technologists (100.0%), and Management (13.8%).
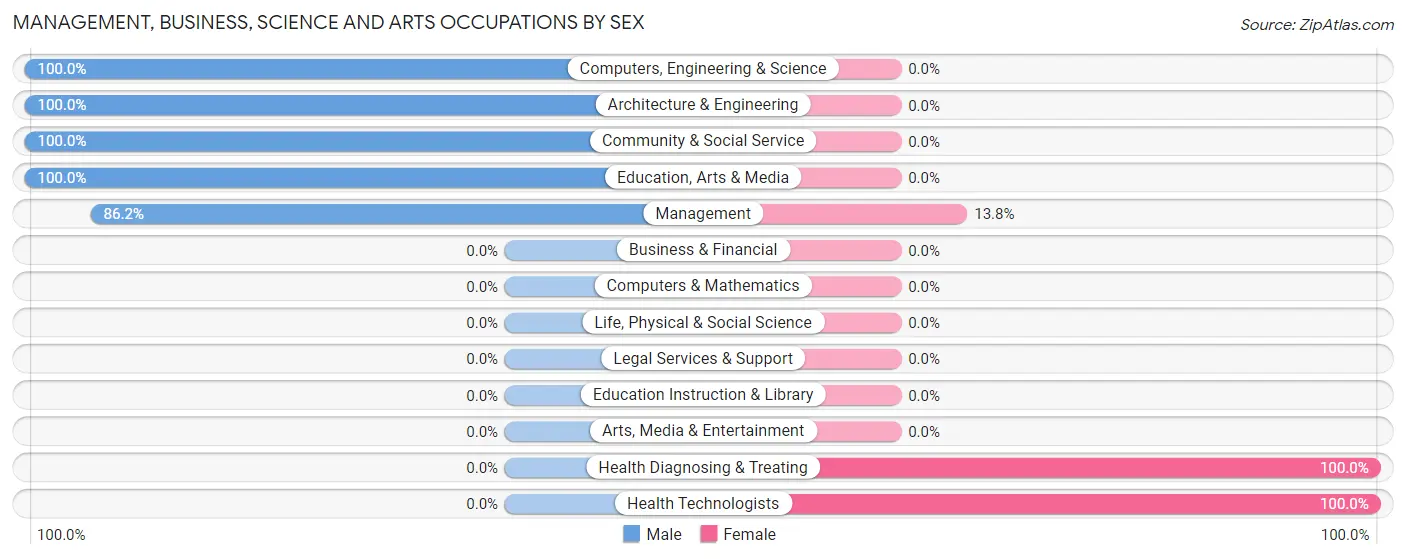
| Occupation | Male | Female |
| Management | 25 (86.2%) | 4 (13.8%) |
| Business & Financial | 0 (0.0%) | 0 (0.0%) |
| Computers, Engineering & Science | 4 (100.0%) | 0 (0.0%) |
| Computers & Mathematics | 0 (0.0%) | 0 (0.0%) |
| Architecture & Engineering | 4 (100.0%) | 0 (0.0%) |
| Life, Physical & Social Science | 0 (0.0%) | 0 (0.0%) |
| Community & Social Service | 4 (100.0%) | 0 (0.0%) |
| Education, Arts & Media | 4 (100.0%) | 0 (0.0%) |
| Legal Services & Support | 0 (0.0%) | 0 (0.0%) |
| Education Instruction & Library | 0 (0.0%) | 0 (0.0%) |
| Arts, Media & Entertainment | 0 (0.0%) | 0 (0.0%) |
| Health Diagnosing & Treating | 0 (0.0%) | 2 (100.0%) |
| Health Technologists | 0 (0.0%) | 2 (100.0%) |
| Total (Category) | 33 (84.6%) | 6 (15.4%) |
| Total (Overall) | 55 (67.1%) | 27 (32.9%) |
Services Occupations
The most common Services occupations in Woodstock are , and Personal Care & Service (2 | 2.4%).
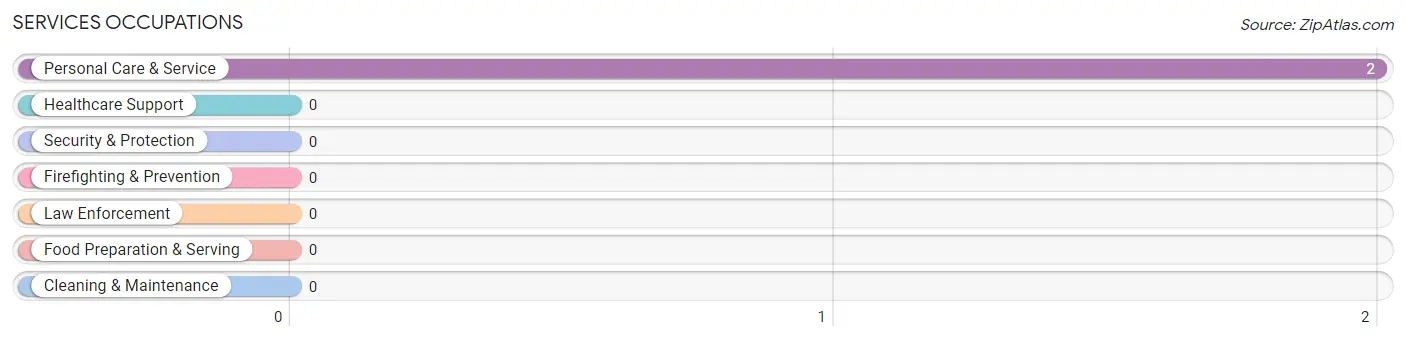
Services Occupations by Sex
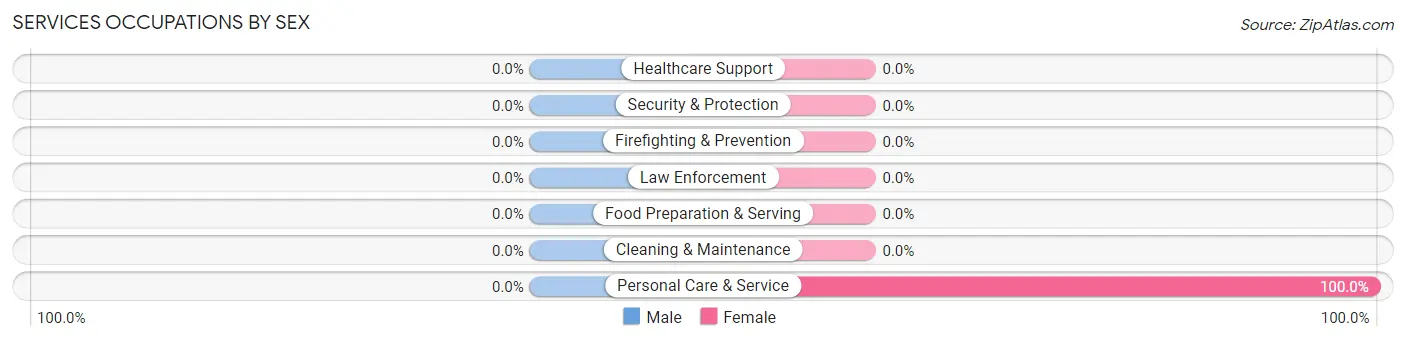
| Occupation | Male | Female |
| Healthcare Support | 0 (0.0%) | 0 (0.0%) |
| Security & Protection | 0 (0.0%) | 0 (0.0%) |
| Firefighting & Prevention | 0 (0.0%) | 0 (0.0%) |
| Law Enforcement | 0 (0.0%) | 0 (0.0%) |
| Food Preparation & Serving | 0 (0.0%) | 0 (0.0%) |
| Cleaning & Maintenance | 0 (0.0%) | 0 (0.0%) |
| Personal Care & Service | 0 (0.0%) | 2 (100.0%) |
| Total (Category) | 0 (0.0%) | 2 (100.0%) |
| Total (Overall) | 55 (67.1%) | 27 (32.9%) |
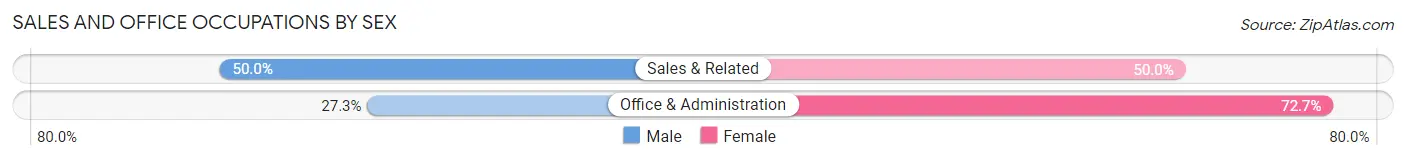
Sales and Office Occupations
The most common Sales and Office occupations in Woodstock are Office & Administration (11 | 13.4%), and Sales & Related (10 | 12.2%).
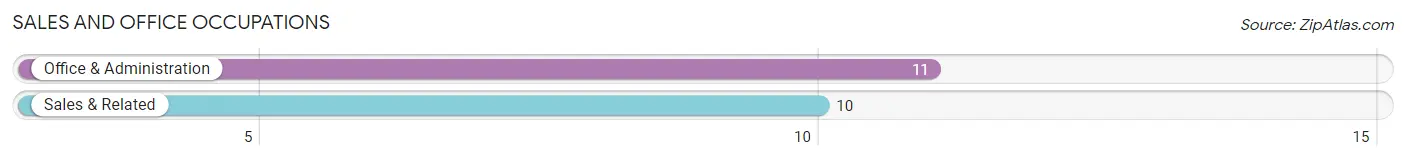
Sales and Office Occupations by Sex
| Occupation | Male | Female |
| Sales & Related | 5 (50.0%) | 5 (50.0%) |
| Office & Administration | 3 (27.3%) | 8 (72.7%) |
| Total (Category) | 8 (38.1%) | 13 (61.9%) |
| Total (Overall) | 55 (67.1%) | 27 (32.9%) |
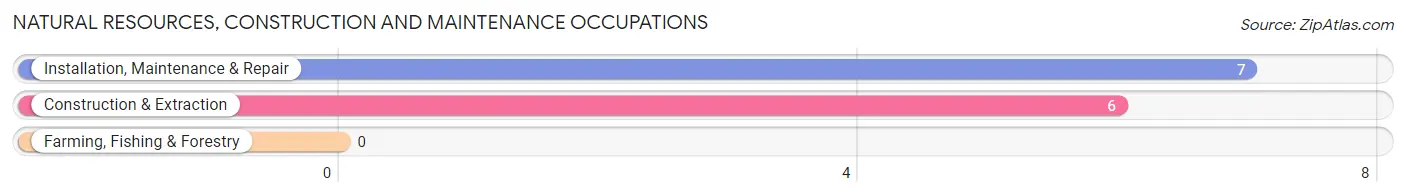
Natural Resources, Construction and Maintenance Occupations
The most common Natural Resources, Construction and Maintenance occupations in Woodstock are Installation, Maintenance & Repair (7 | 8.5%), and Construction & Extraction (6 | 7.3%).
Natural Resources, Construction and Maintenance Occupations by Sex
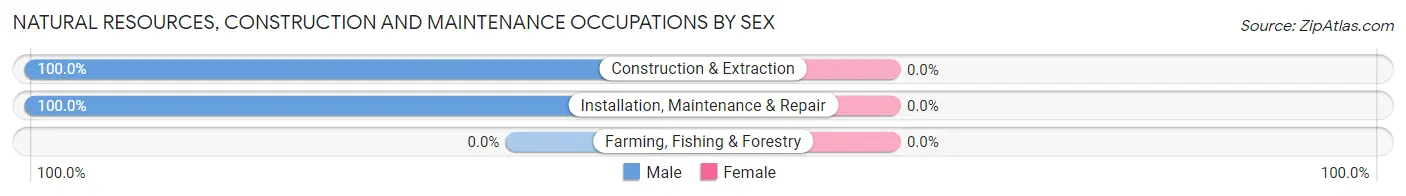
| Occupation | Male | Female |
| Farming, Fishing & Forestry | 0 (0.0%) | 0 (0.0%) |
| Construction & Extraction | 6 (100.0%) | 0 (0.0%) |
| Installation, Maintenance & Repair | 7 (100.0%) | 0 (0.0%) |
| Total (Category) | 13 (100.0%) | 0 (0.0%) |
| Total (Overall) | 55 (67.1%) | 27 (32.9%) |
Production, Transportation and Moving Occupations
The most common Production, Transportation and Moving occupations in Woodstock are Material Moving (5 | 6.1%), and Production (2 | 2.4%).
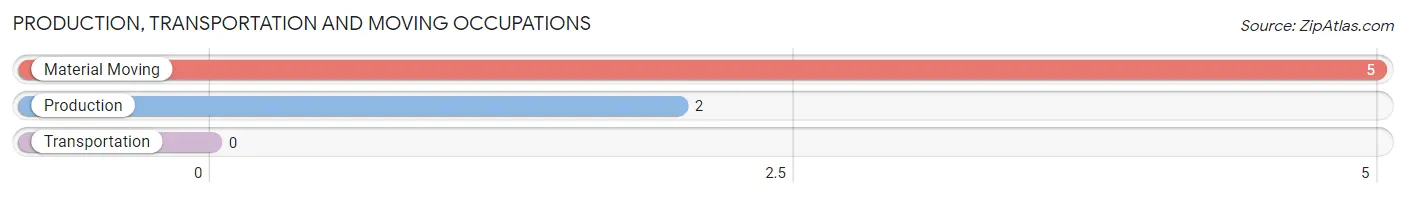
Production, Transportation and Moving Occupations by Sex
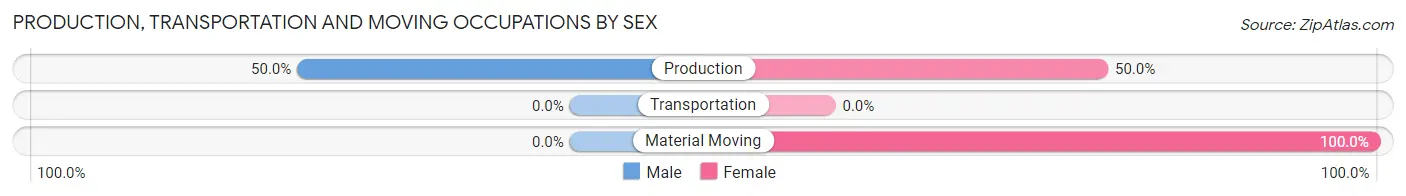
| Occupation | Male | Female |
| Production | 1 (50.0%) | 1 (50.0%) |
| Transportation | 0 (0.0%) | 0 (0.0%) |
| Material Moving | 0 (0.0%) | 5 (100.0%) |
| Total (Category) | 1 (14.3%) | 6 (85.7%) |
| Total (Overall) | 55 (67.1%) | 27 (32.9%) |
Employment Industries by Sex in Woodstock
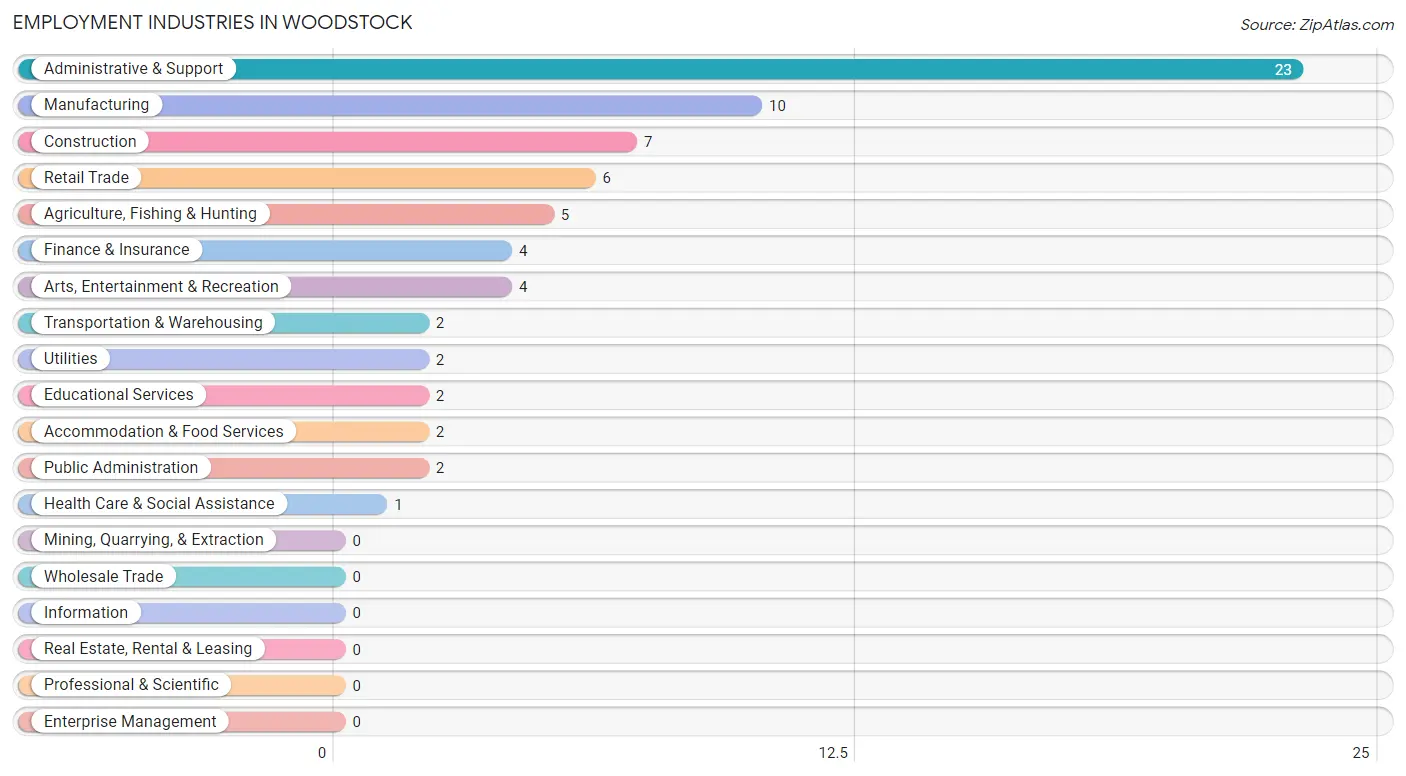
Employment Industries in Woodstock
The major employment industries in Woodstock include Administrative & Support (23 | 28.1%), Manufacturing (10 | 12.2%), Construction (7 | 8.5%), Retail Trade (6 | 7.3%), and Agriculture, Fishing & Hunting (5 | 6.1%).
Employment Industries by Sex in Woodstock
The Woodstock industries that see more men than women are Construction (100.0%), Transportation & Warehousing (100.0%), and Administrative & Support (100.0%), whereas the industries that tend to have a higher number of women are Utilities (100.0%), Finance & Insurance (100.0%), and Educational Services (100.0%).
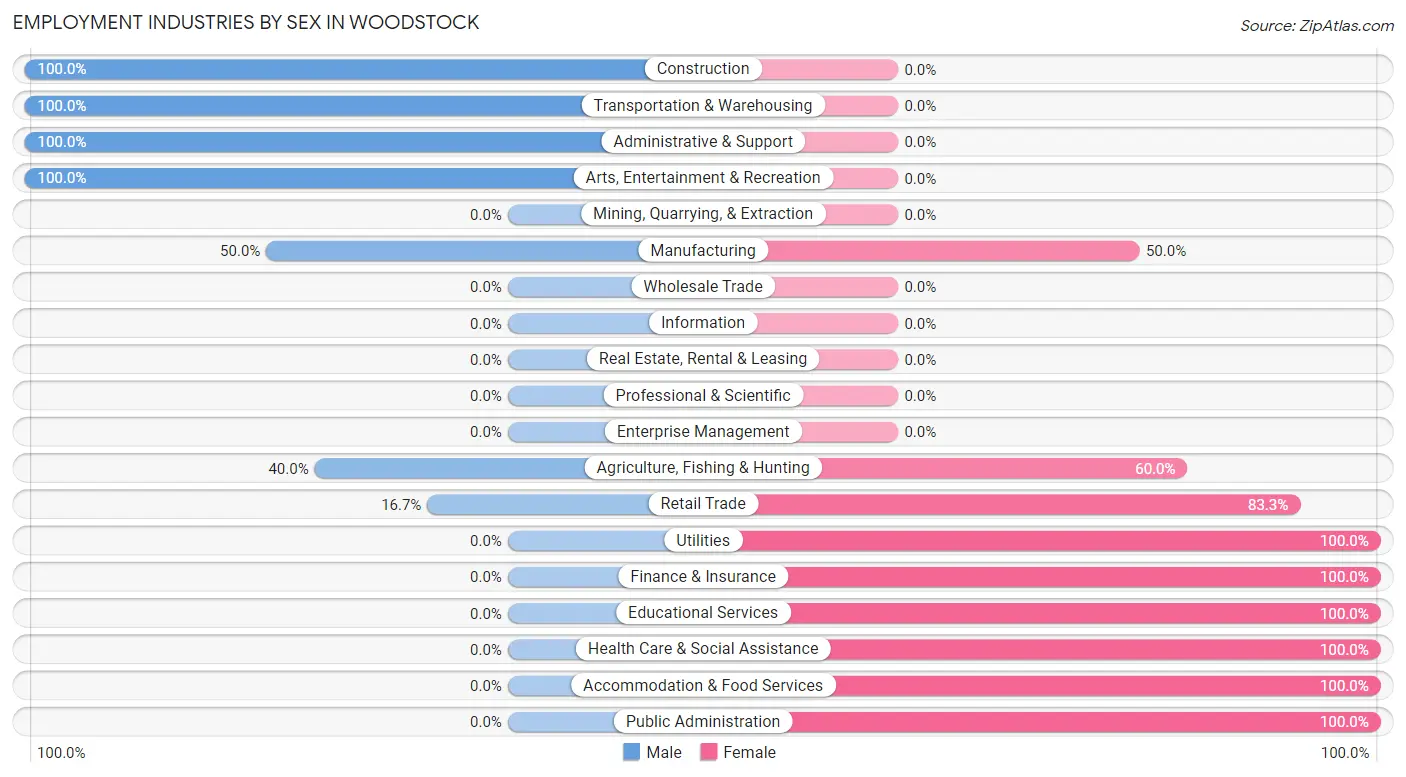
| Industry | Male | Female |
| Agriculture, Fishing & Hunting | 2 (40.0%) | 3 (60.0%) |
| Mining, Quarrying, & Extraction | 0 (0.0%) | 0 (0.0%) |
| Construction | 7 (100.0%) | 0 (0.0%) |
| Manufacturing | 5 (50.0%) | 5 (50.0%) |
| Wholesale Trade | 0 (0.0%) | 0 (0.0%) |
| Retail Trade | 1 (16.7%) | 5 (83.3%) |
| Transportation & Warehousing | 2 (100.0%) | 0 (0.0%) |
| Utilities | 0 (0.0%) | 2 (100.0%) |
| Information | 0 (0.0%) | 0 (0.0%) |
| Finance & Insurance | 0 (0.0%) | 4 (100.0%) |
| Real Estate, Rental & Leasing | 0 (0.0%) | 0 (0.0%) |
| Professional & Scientific | 0 (0.0%) | 0 (0.0%) |
| Enterprise Management | 0 (0.0%) | 0 (0.0%) |
| Administrative & Support | 23 (100.0%) | 0 (0.0%) |
| Educational Services | 0 (0.0%) | 2 (100.0%) |
| Health Care & Social Assistance | 0 (0.0%) | 1 (100.0%) |
| Arts, Entertainment & Recreation | 4 (100.0%) | 0 (0.0%) |
| Accommodation & Food Services | 0 (0.0%) | 2 (100.0%) |
| Public Administration | 0 (0.0%) | 2 (100.0%) |
| Total | 55 (67.1%) | 27 (32.9%) |
Education in Woodstock
School Enrollment in Woodstock
The most common levels of schooling among the 58 students in Woodstock are elementary school (15 | 25.9%), high school (15 | 25.9%), and nursery / preschool (10 | 17.2%).
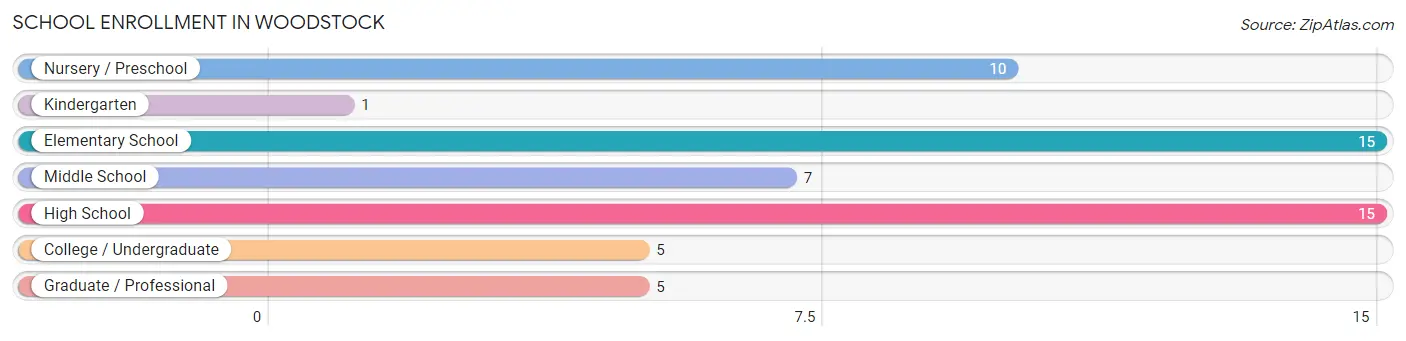
| School Level | # Students | % Students |
| Nursery / Preschool | 10 | 17.2% |
| Kindergarten | 1 | 1.7% |
| Elementary School | 15 | 25.9% |
| Middle School | 7 | 12.1% |
| High School | 15 | 25.9% |
| College / Undergraduate | 5 | 8.6% |
| Graduate / Professional | 5 | 8.6% |
| Total | 58 | 100.0% |
School Enrollment by Age by Funding Source in Woodstock
Out of a total of 58 students who are enrolled in schools in Woodstock, 18 (31.0%) attend a private institution, while the remaining 40 (69.0%) are enrolled in public schools. The age group of 3 to 4 year olds has the highest likelihood of being enrolled in private schools, with 2 (100.0% in the age bracket) enrolled. Conversely, the age group of 15 to 17 year olds has the lowest likelihood of being enrolled in a private school, with 11 (100.0% in the age bracket) attending a public institution.
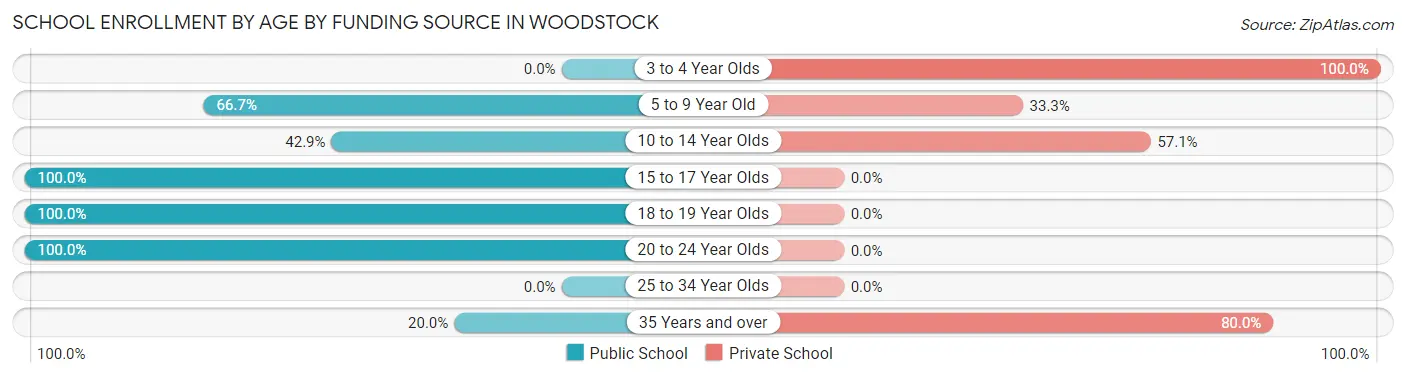
| Age Bracket | Public School | Private School |
| 3 to 4 Year Olds | 0 (0.0%) | 2 (100.0%) |
| 5 to 9 Year Old | 16 (66.7%) | 8 (33.3%) |
| 10 to 14 Year Olds | 3 (42.9%) | 4 (57.1%) |
| 15 to 17 Year Olds | 11 (100.0%) | 0 (0.0%) |
| 18 to 19 Year Olds | 4 (100.0%) | 0 (0.0%) |
| 20 to 24 Year Olds | 5 (100.0%) | 0 (0.0%) |
| 25 to 34 Year Olds | 0 (0.0%) | 0 (0.0%) |
| 35 Years and over | 1 (20.0%) | 4 (80.0%) |
| Total | 40 (69.0%) | 18 (31.0%) |
Educational Attainment by Field of Study in Woodstock
Liberal arts & history (8 | 66.7%), science & technology (2 | 16.7%), and education (2 | 16.7%) are the most common fields of study among 12 individuals in Woodstock who have obtained a bachelor's degree or higher.
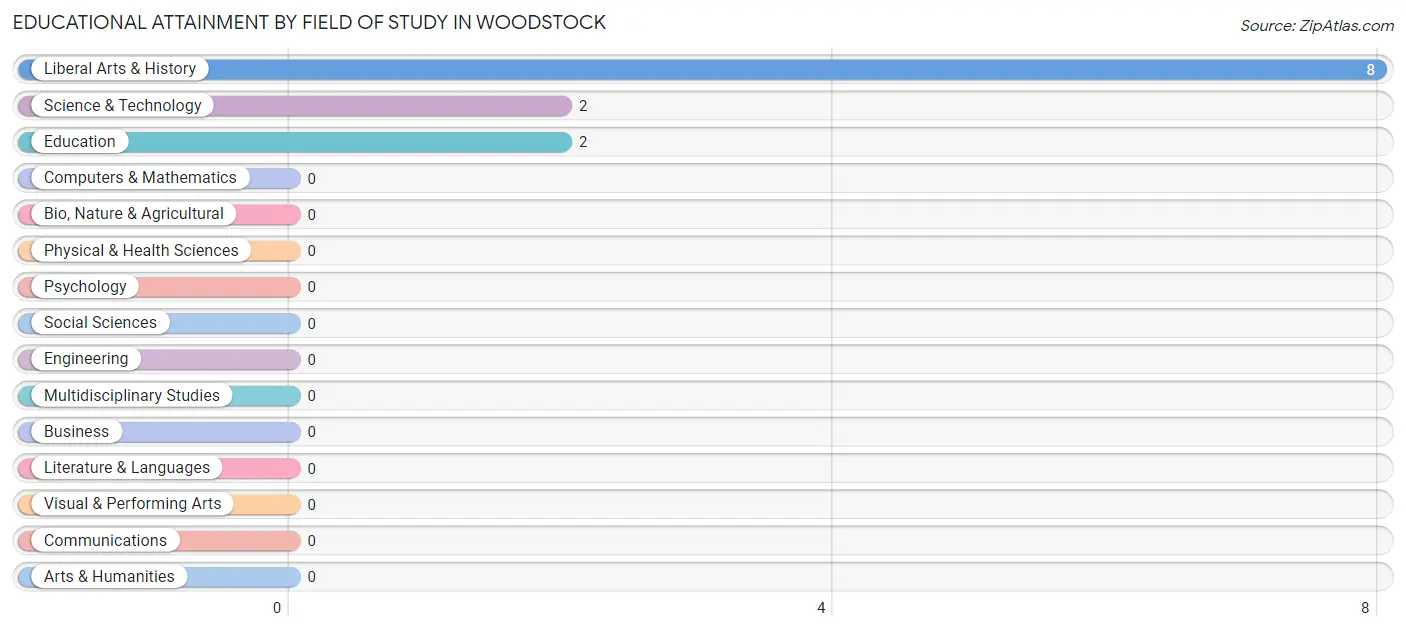
| Field of Study | # Graduates | % Graduates |
| Computers & Mathematics | 0 | 0.0% |
| Bio, Nature & Agricultural | 0 | 0.0% |
| Physical & Health Sciences | 0 | 0.0% |
| Psychology | 0 | 0.0% |
| Social Sciences | 0 | 0.0% |
| Engineering | 0 | 0.0% |
| Multidisciplinary Studies | 0 | 0.0% |
| Science & Technology | 2 | 16.7% |
| Business | 0 | 0.0% |
| Education | 2 | 16.7% |
| Literature & Languages | 0 | 0.0% |
| Liberal Arts & History | 8 | 66.7% |
| Visual & Performing Arts | 0 | 0.0% |
| Communications | 0 | 0.0% |
| Arts & Humanities | 0 | 0.0% |
| Total | 12 | 100.0% |
Transportation & Commute in Woodstock
Vehicle Availability by Sex in Woodstock
The most prevalent vehicle ownership categories in Woodstock are males with 2 vehicles (33, accounting for 64.7%) and females with 2 vehicles (10, making up 122.2%).
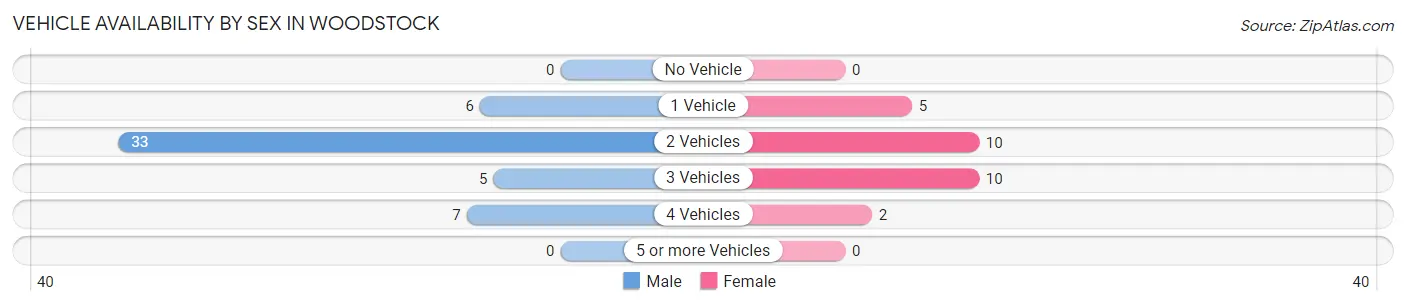
| Vehicles Available | Male | Female |
| No Vehicle | 0 (0.0%) | 0 (0.0%) |
| 1 Vehicle | 6 (11.8%) | 5 (18.5%) |
| 2 Vehicles | 33 (64.7%) | 10 (37.0%) |
| 3 Vehicles | 5 (9.8%) | 10 (37.0%) |
| 4 Vehicles | 7 (13.7%) | 2 (7.4%) |
| 5 or more Vehicles | 0 (0.0%) | 0 (0.0%) |
| Total | 51 (100.0%) | 27 (100.0%) |
Commute Time in Woodstock
The most frequently occuring commute durations in Woodstock are 20 to 24 minutes (33 commuters, 49.2%), 15 to 19 minutes (14 commuters, 20.9%), and 30 to 34 minutes (6 commuters, 9.0%).
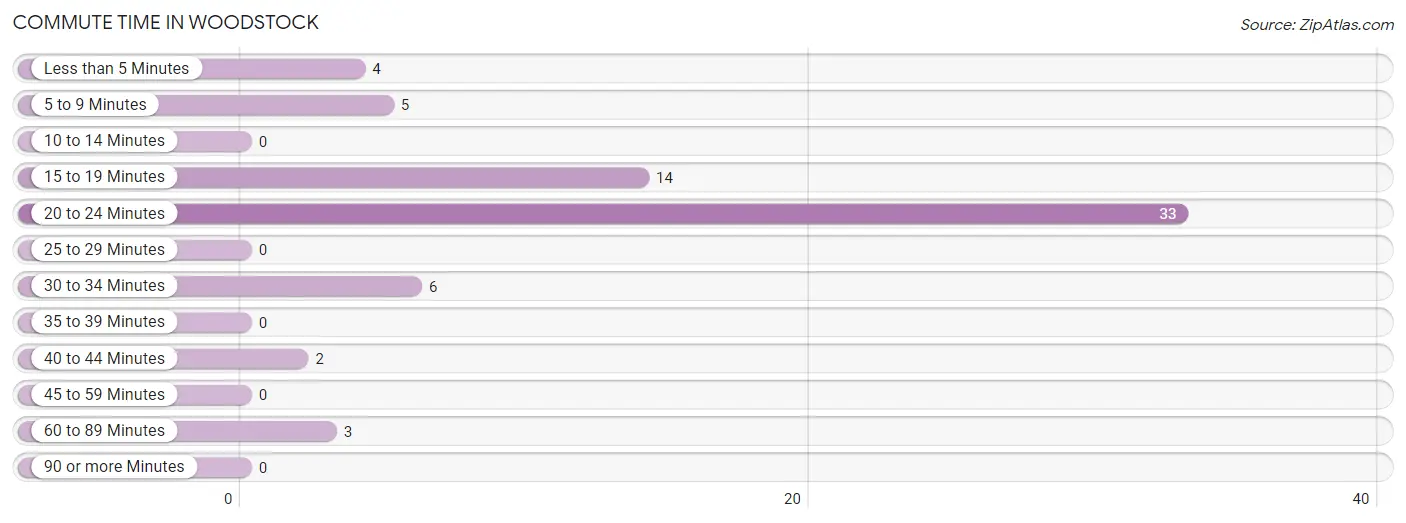
| Commute Time | # Commuters | % Commuters |
| Less than 5 Minutes | 4 | 6.0% |
| 5 to 9 Minutes | 5 | 7.5% |
| 10 to 14 Minutes | 0 | 0.0% |
| 15 to 19 Minutes | 14 | 20.9% |
| 20 to 24 Minutes | 33 | 49.2% |
| 25 to 29 Minutes | 0 | 0.0% |
| 30 to 34 Minutes | 6 | 9.0% |
| 35 to 39 Minutes | 0 | 0.0% |
| 40 to 44 Minutes | 2 | 3.0% |
| 45 to 59 Minutes | 0 | 0.0% |
| 60 to 89 Minutes | 3 | 4.5% |
| 90 or more Minutes | 0 | 0.0% |
Commute Time by Sex in Woodstock
The most common commute times in Woodstock are 20 to 24 minutes (24 commuters, 49.0%) for males and 20 to 24 minutes (9 commuters, 50.0%) for females.
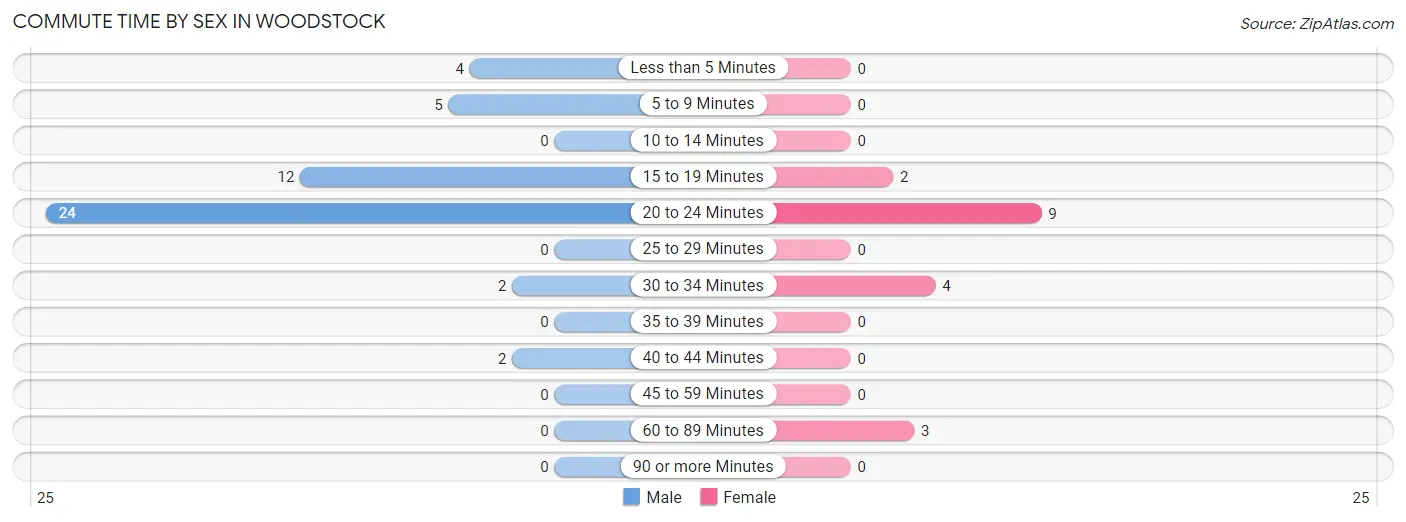
| Commute Time | Male | Female |
| Less than 5 Minutes | 4 (8.2%) | 0 (0.0%) |
| 5 to 9 Minutes | 5 (10.2%) | 0 (0.0%) |
| 10 to 14 Minutes | 0 (0.0%) | 0 (0.0%) |
| 15 to 19 Minutes | 12 (24.5%) | 2 (11.1%) |
| 20 to 24 Minutes | 24 (49.0%) | 9 (50.0%) |
| 25 to 29 Minutes | 0 (0.0%) | 0 (0.0%) |
| 30 to 34 Minutes | 2 (4.1%) | 4 (22.2%) |
| 35 to 39 Minutes | 0 (0.0%) | 0 (0.0%) |
| 40 to 44 Minutes | 2 (4.1%) | 0 (0.0%) |
| 45 to 59 Minutes | 0 (0.0%) | 0 (0.0%) |
| 60 to 89 Minutes | 0 (0.0%) | 3 (16.7%) |
| 90 or more Minutes | 0 (0.0%) | 0 (0.0%) |
Time of Departure to Work by Sex in Woodstock
The most frequent times of departure to work in Woodstock are 7:00 AM to 7:29 AM (25, 51.0%) for males and 7:30 AM to 7:59 AM (7, 38.9%) for females.
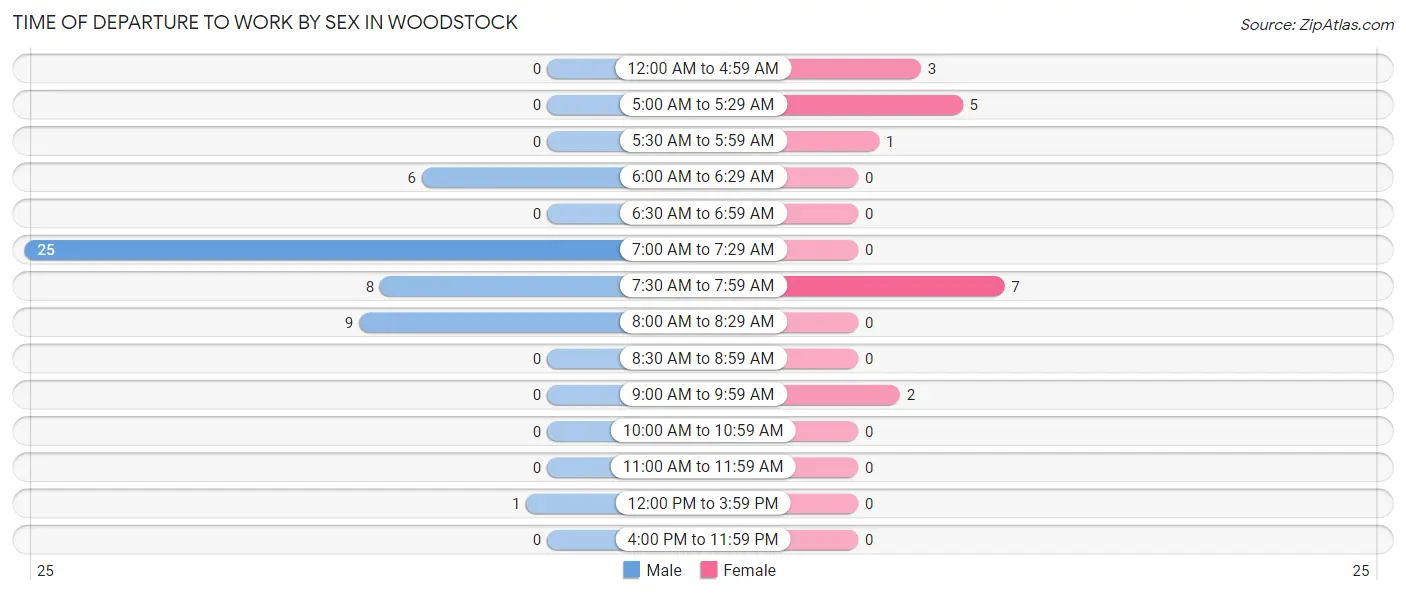
| Time of Departure | Male | Female |
| 12:00 AM to 4:59 AM | 0 (0.0%) | 3 (16.7%) |
| 5:00 AM to 5:29 AM | 0 (0.0%) | 5 (27.8%) |
| 5:30 AM to 5:59 AM | 0 (0.0%) | 1 (5.6%) |
| 6:00 AM to 6:29 AM | 6 (12.2%) | 0 (0.0%) |
| 6:30 AM to 6:59 AM | 0 (0.0%) | 0 (0.0%) |
| 7:00 AM to 7:29 AM | 25 (51.0%) | 0 (0.0%) |
| 7:30 AM to 7:59 AM | 8 (16.3%) | 7 (38.9%) |
| 8:00 AM to 8:29 AM | 9 (18.4%) | 0 (0.0%) |
| 8:30 AM to 8:59 AM | 0 (0.0%) | 0 (0.0%) |
| 9:00 AM to 9:59 AM | 0 (0.0%) | 2 (11.1%) |
| 10:00 AM to 10:59 AM | 0 (0.0%) | 0 (0.0%) |
| 11:00 AM to 11:59 AM | 0 (0.0%) | 0 (0.0%) |
| 12:00 PM to 3:59 PM | 1 (2.0%) | 0 (0.0%) |
| 4:00 PM to 11:59 PM | 0 (0.0%) | 0 (0.0%) |
| Total | 49 (100.0%) | 18 (100.0%) |
Housing Occupancy in Woodstock
Occupancy by Ownership in Woodstock
Of the total 74 dwellings in Woodstock, owner-occupied units account for 66 (89.2%), while renter-occupied units make up 8 (10.8%).
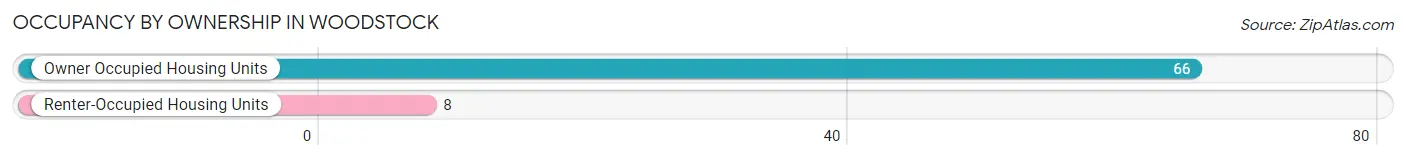
| Occupancy | # Housing Units | % Housing Units |
| Owner Occupied Housing Units | 66 | 89.2% |
| Renter-Occupied Housing Units | 8 | 10.8% |
| Total Occupied Housing Units | 74 | 100.0% |
Occupancy by Household Size in Woodstock
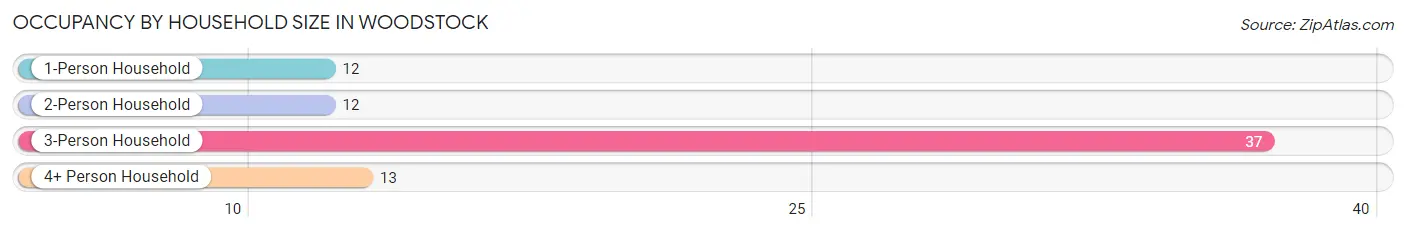
| Household Size | # Housing Units | % Housing Units |
| 1-Person Household | 12 | 16.2% |
| 2-Person Household | 12 | 16.2% |
| 3-Person Household | 37 | 50.0% |
| 4+ Person Household | 13 | 17.6% |
| Total Housing Units | 74 | 100.0% |
Occupancy by Ownership by Household Size in Woodstock
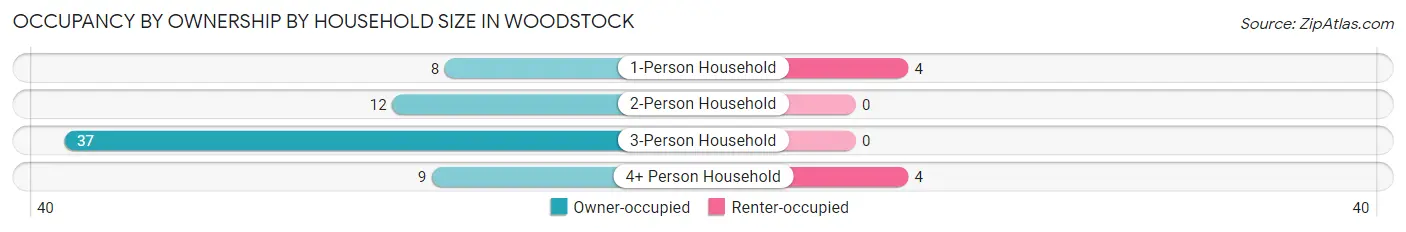
| Household Size | Owner-occupied | Renter-occupied |
| 1-Person Household | 8 (66.7%) | 4 (33.3%) |
| 2-Person Household | 12 (100.0%) | 0 (0.0%) |
| 3-Person Household | 37 (100.0%) | 0 (0.0%) |
| 4+ Person Household | 9 (69.2%) | 4 (30.8%) |
| Total Housing Units | 66 (89.2%) | 8 (10.8%) |
Occupancy by Educational Attainment in Woodstock
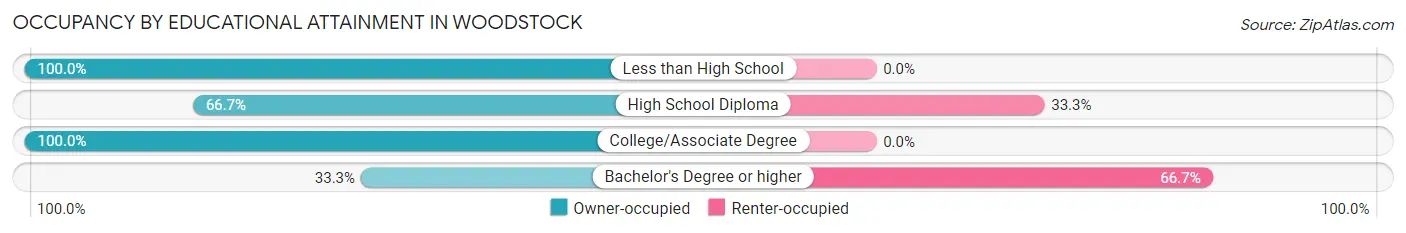
| Household Size | Owner-occupied | Renter-occupied |
| Less than High School | 7 (100.0%) | 0 (0.0%) |
| High School Diploma | 8 (66.7%) | 4 (33.3%) |
| College/Associate Degree | 49 (100.0%) | 0 (0.0%) |
| Bachelor's Degree or higher | 2 (33.3%) | 4 (66.7%) |
Occupancy by Age of Householder in Woodstock
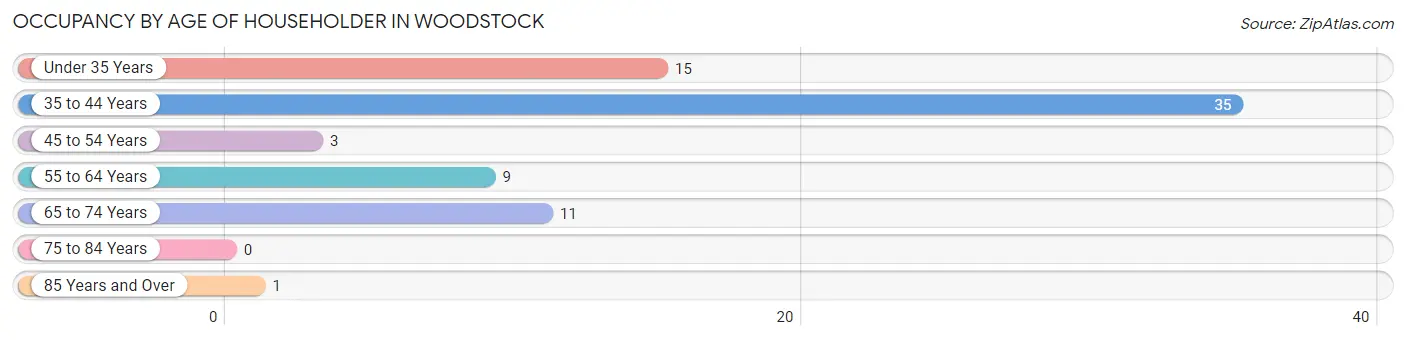
| Age Bracket | # Households | % Households |
| Under 35 Years | 15 | 20.3% |
| 35 to 44 Years | 35 | 47.3% |
| 45 to 54 Years | 3 | 4.1% |
| 55 to 64 Years | 9 | 12.2% |
| 65 to 74 Years | 11 | 14.9% |
| 75 to 84 Years | 0 | 0.0% |
| 85 Years and Over | 1 | 1.3% |
| Total | 74 | 100.0% |
Housing Finances in Woodstock
Median Income by Occupancy in Woodstock
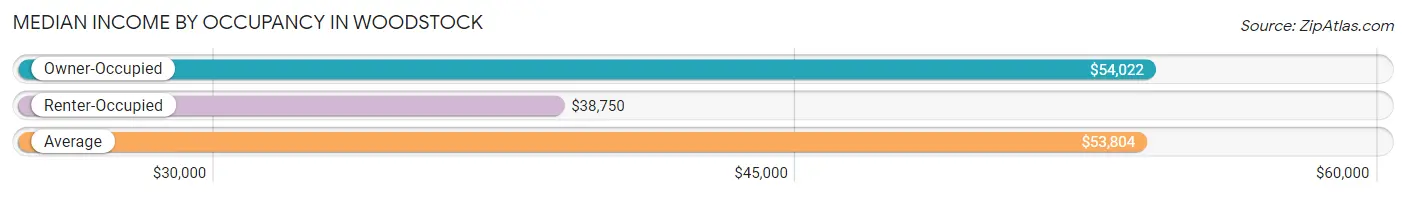
| Occupancy Type | # Households | Median Income |
| Owner-Occupied | 66 (89.2%) | $54,022 |
| Renter-Occupied | 8 (10.8%) | $38,750 |
| Average | 74 (100.0%) | $53,804 |
Occupancy by Householder Income Bracket in Woodstock
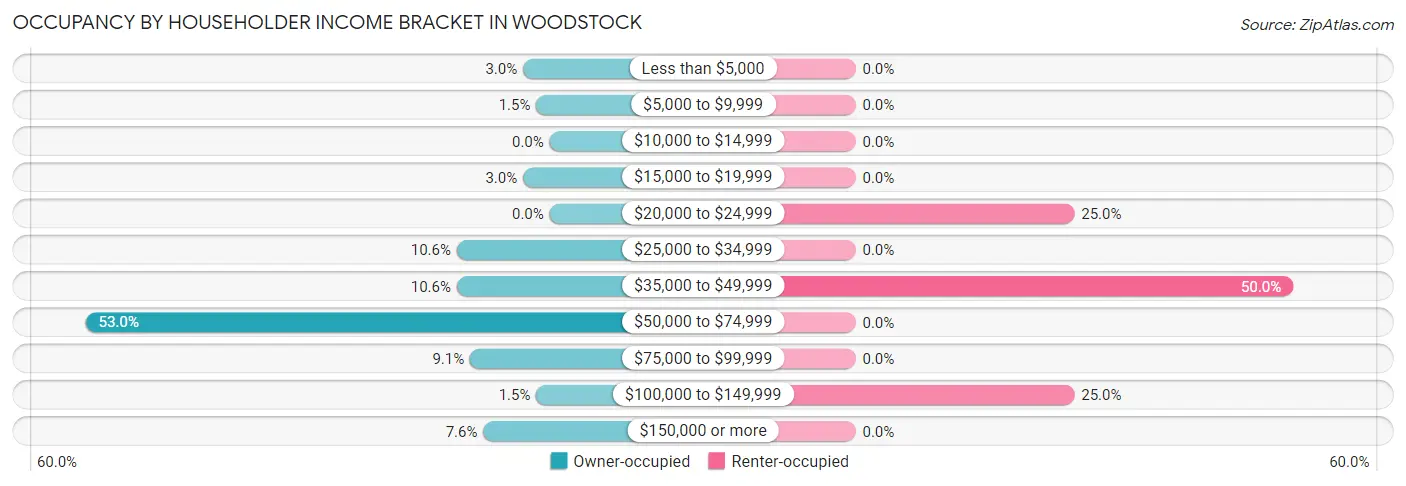
| Income Bracket | Owner-occupied | Renter-occupied |
| Less than $5,000 | 2 (3.0%) | 0 (0.0%) |
| $5,000 to $9,999 | 1 (1.5%) | 0 (0.0%) |
| $10,000 to $14,999 | 0 (0.0%) | 0 (0.0%) |
| $15,000 to $19,999 | 2 (3.0%) | 0 (0.0%) |
| $20,000 to $24,999 | 0 (0.0%) | 2 (25.0%) |
| $25,000 to $34,999 | 7 (10.6%) | 0 (0.0%) |
| $35,000 to $49,999 | 7 (10.6%) | 4 (50.0%) |
| $50,000 to $74,999 | 35 (53.0%) | 0 (0.0%) |
| $75,000 to $99,999 | 6 (9.1%) | 0 (0.0%) |
| $100,000 to $149,999 | 1 (1.5%) | 2 (25.0%) |
| $150,000 or more | 5 (7.6%) | 0 (0.0%) |
| Total | 66 (100.0%) | 8 (100.0%) |
Monthly Housing Cost Tiers in Woodstock
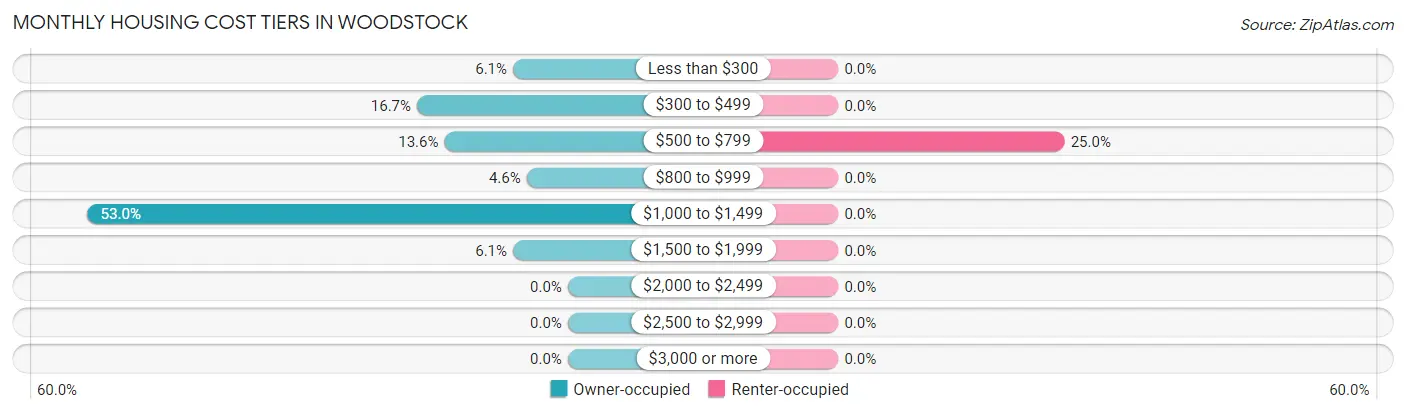
| Monthly Cost | Owner-occupied | Renter-occupied |
| Less than $300 | 4 (6.1%) | 0 (0.0%) |
| $300 to $499 | 11 (16.7%) | 0 (0.0%) |
| $500 to $799 | 9 (13.6%) | 2 (25.0%) |
| $800 to $999 | 3 (4.5%) | 0 (0.0%) |
| $1,000 to $1,499 | 35 (53.0%) | 0 (0.0%) |
| $1,500 to $1,999 | 4 (6.1%) | 0 (0.0%) |
| $2,000 to $2,499 | 0 (0.0%) | 0 (0.0%) |
| $2,500 to $2,999 | 0 (0.0%) | 0 (0.0%) |
| $3,000 or more | 0 (0.0%) | 0 (0.0%) |
| Total | 66 (100.0%) | 8 (100.0%) |
Physical Housing Characteristics in Woodstock
Housing Structures in Woodstock
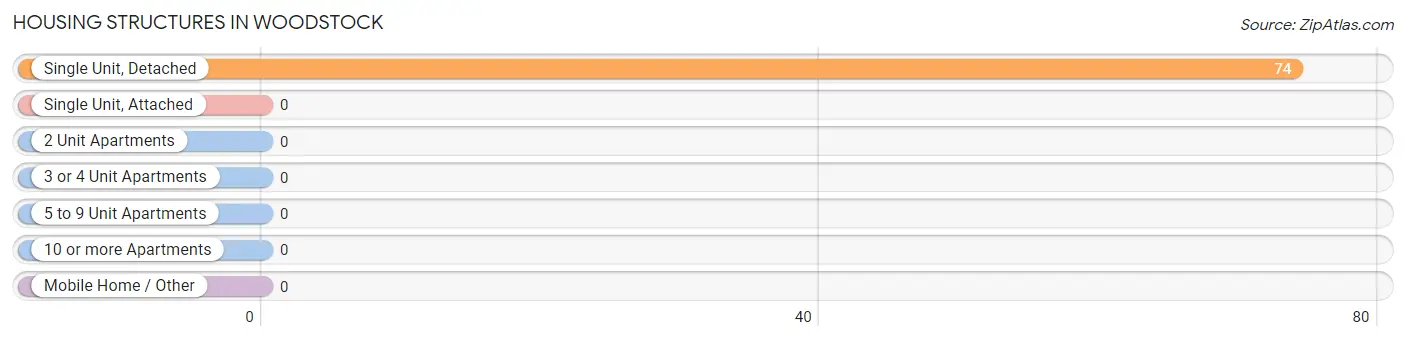
| Structure Type | # Housing Units | % Housing Units |
| Single Unit, Detached | 74 | 100.0% |
| Single Unit, Attached | 0 | 0.0% |
| 2 Unit Apartments | 0 | 0.0% |
| 3 or 4 Unit Apartments | 0 | 0.0% |
| 5 to 9 Unit Apartments | 0 | 0.0% |
| 10 or more Apartments | 0 | 0.0% |
| Mobile Home / Other | 0 | 0.0% |
| Total | 74 | 100.0% |
Housing Structures by Occupancy in Woodstock
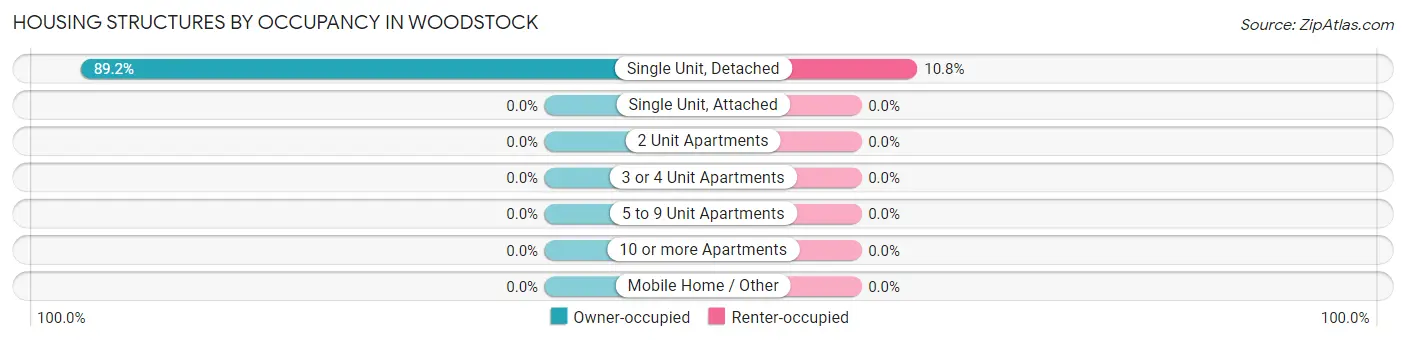
| Structure Type | Owner-occupied | Renter-occupied |
| Single Unit, Detached | 66 (89.2%) | 8 (10.8%) |
| Single Unit, Attached | 0 (0.0%) | 0 (0.0%) |
| 2 Unit Apartments | 0 (0.0%) | 0 (0.0%) |
| 3 or 4 Unit Apartments | 0 (0.0%) | 0 (0.0%) |
| 5 to 9 Unit Apartments | 0 (0.0%) | 0 (0.0%) |
| 10 or more Apartments | 0 (0.0%) | 0 (0.0%) |
| Mobile Home / Other | 0 (0.0%) | 0 (0.0%) |
| Total | 66 (89.2%) | 8 (10.8%) |
Housing Structures by Number of Rooms in Woodstock
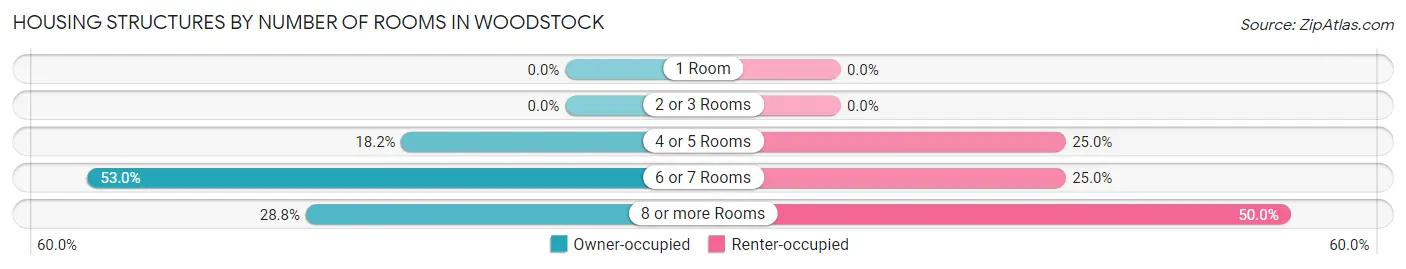
| Number of Rooms | Owner-occupied | Renter-occupied |
| 1 Room | 0 (0.0%) | 0 (0.0%) |
| 2 or 3 Rooms | 0 (0.0%) | 0 (0.0%) |
| 4 or 5 Rooms | 12 (18.2%) | 2 (25.0%) |
| 6 or 7 Rooms | 35 (53.0%) | 2 (25.0%) |
| 8 or more Rooms | 19 (28.8%) | 4 (50.0%) |
| Total | 66 (100.0%) | 8 (100.0%) |
Housing Structure by Heating Type in Woodstock
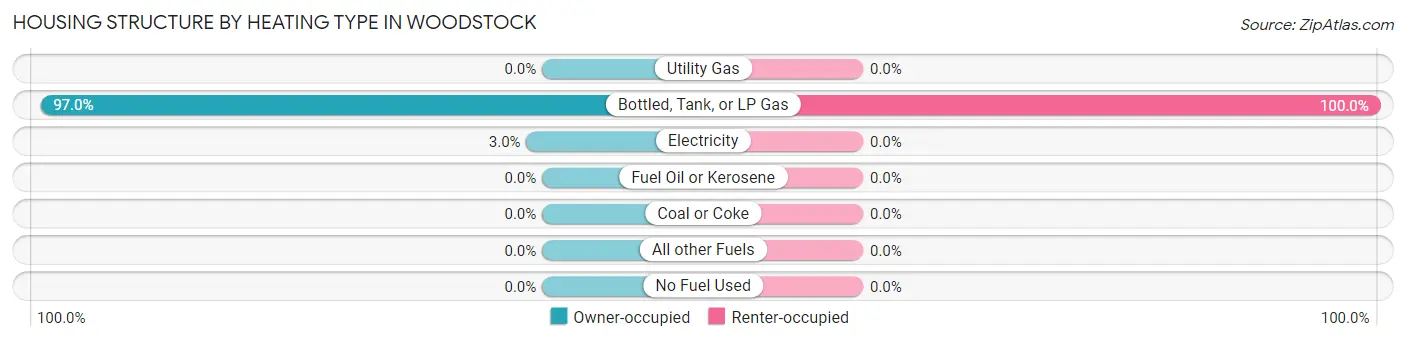
| Heating Type | Owner-occupied | Renter-occupied |
| Utility Gas | 0 (0.0%) | 0 (0.0%) |
| Bottled, Tank, or LP Gas | 64 (97.0%) | 8 (100.0%) |
| Electricity | 2 (3.0%) | 0 (0.0%) |
| Fuel Oil or Kerosene | 0 (0.0%) | 0 (0.0%) |
| Coal or Coke | 0 (0.0%) | 0 (0.0%) |
| All other Fuels | 0 (0.0%) | 0 (0.0%) |
| No Fuel Used | 0 (0.0%) | 0 (0.0%) |
| Total | 66 (100.0%) | 8 (100.0%) |
Household Vehicle Usage in Woodstock
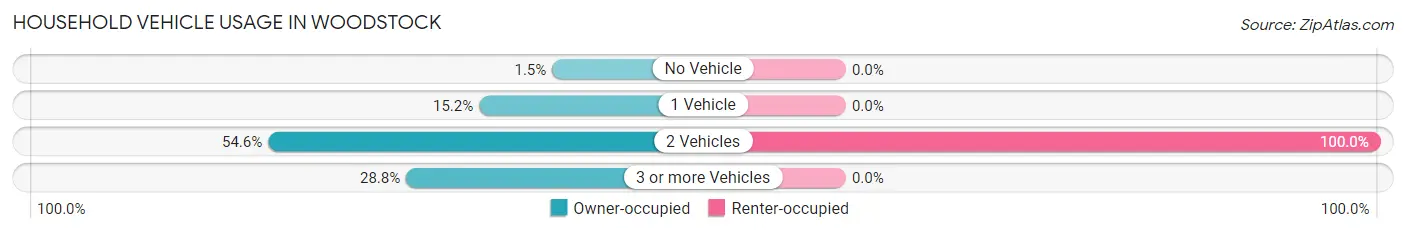
| Vehicles per Household | Owner-occupied | Renter-occupied |
| No Vehicle | 1 (1.5%) | 0 (0.0%) |
| 1 Vehicle | 10 (15.1%) | 0 (0.0%) |
| 2 Vehicles | 36 (54.5%) | 8 (100.0%) |
| 3 or more Vehicles | 19 (28.8%) | 0 (0.0%) |
| Total | 66 (100.0%) | 8 (100.0%) |
Real Estate & Mortgages in Woodstock
Real Estate and Mortgage Overview in Woodstock
| Characteristic | Without Mortgage | With Mortgage |
| Housing Units | 23 | 43 |
| Median Property Value | $53,100 | $182,900 |
| Median Household Income | $34,375 | $5 |
| Monthly Housing Costs | $461 | $0 |
| Real Estate Taxes | $550 | $0 |
Property Value by Mortgage Status in Woodstock
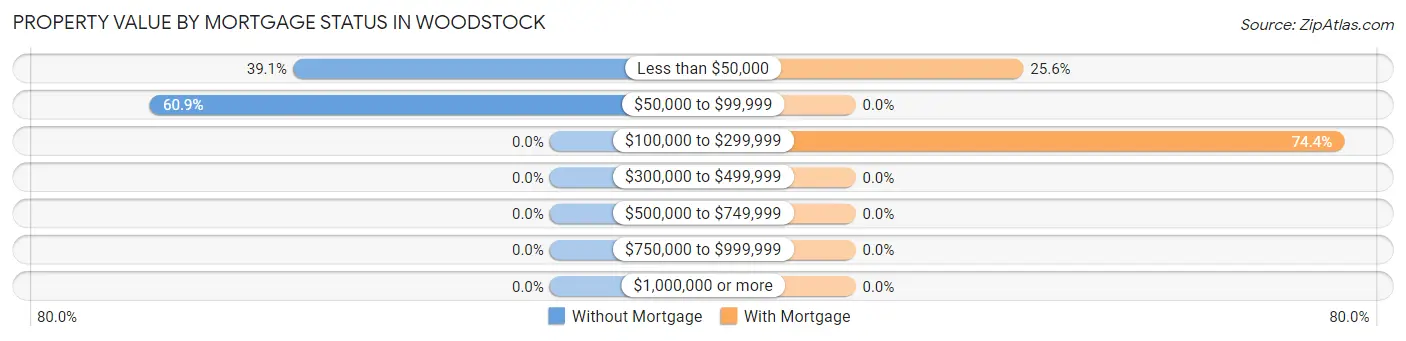
| Property Value | Without Mortgage | With Mortgage |
| Less than $50,000 | 9 (39.1%) | 11 (25.6%) |
| $50,000 to $99,999 | 14 (60.9%) | 0 (0.0%) |
| $100,000 to $299,999 | 0 (0.0%) | 32 (74.4%) |
| $300,000 to $499,999 | 0 (0.0%) | 0 (0.0%) |
| $500,000 to $749,999 | 0 (0.0%) | 0 (0.0%) |
| $750,000 to $999,999 | 0 (0.0%) | 0 (0.0%) |
| $1,000,000 or more | 0 (0.0%) | 0 (0.0%) |
| Total | 23 (100.0%) | 43 (100.0%) |
Household Income by Mortgage Status in Woodstock
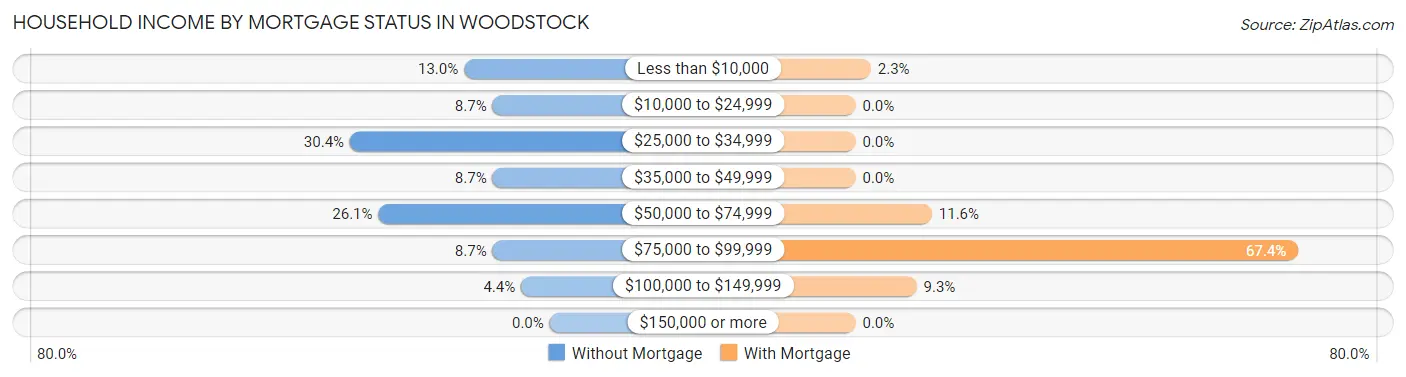
| Household Income | Without Mortgage | With Mortgage |
| Less than $10,000 | 3 (13.0%) | 1 (2.3%) |
| $10,000 to $24,999 | 2 (8.7%) | 0 (0.0%) |
| $25,000 to $34,999 | 7 (30.4%) | 0 (0.0%) |
| $35,000 to $49,999 | 2 (8.7%) | 0 (0.0%) |
| $50,000 to $74,999 | 6 (26.1%) | 5 (11.6%) |
| $75,000 to $99,999 | 2 (8.7%) | 29 (67.4%) |
| $100,000 to $149,999 | 1 (4.3%) | 4 (9.3%) |
| $150,000 or more | 0 (0.0%) | 0 (0.0%) |
| Total | 23 (100.0%) | 43 (100.0%) |
Property Value to Household Income Ratio in Woodstock
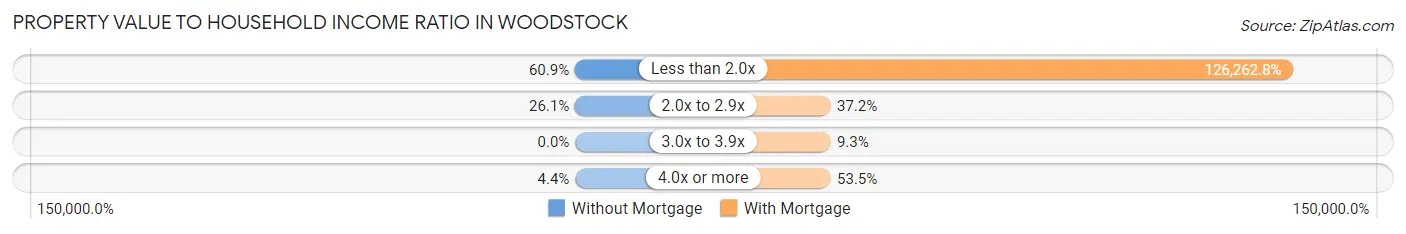
| Value-to-Income Ratio | Without Mortgage | With Mortgage |
| Less than 2.0x | 14 (60.9%) | 54,293 (126,262.8%) |
| 2.0x to 2.9x | 6 (26.1%) | 16 (37.2%) |
| 3.0x to 3.9x | 0 (0.0%) | 4 (9.3%) |
| 4.0x or more | 1 (4.3%) | 23 (53.5%) |
| Total | 23 (100.0%) | 43 (100.0%) |
Real Estate Taxes by Mortgage Status in Woodstock
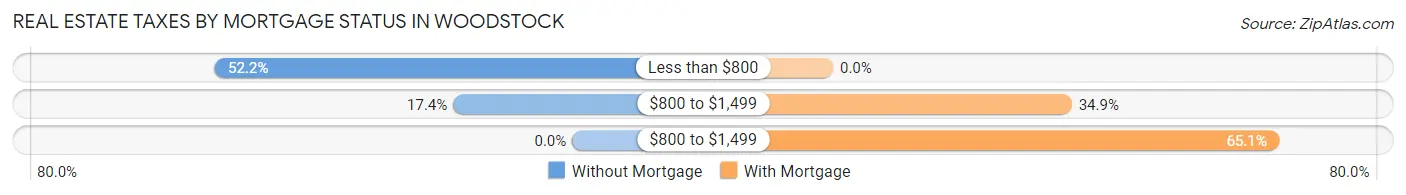
| Property Taxes | Without Mortgage | With Mortgage |
| Less than $800 | 12 (52.2%) | 0 (0.0%) |
| $800 to $1,499 | 4 (17.4%) | 15 (34.9%) |
| $800 to $1,499 | 0 (0.0%) | 28 (65.1%) |
| Total | 23 (100.0%) | 43 (100.0%) |
Health & Disability in Woodstock
Health Insurance Coverage by Age in Woodstock
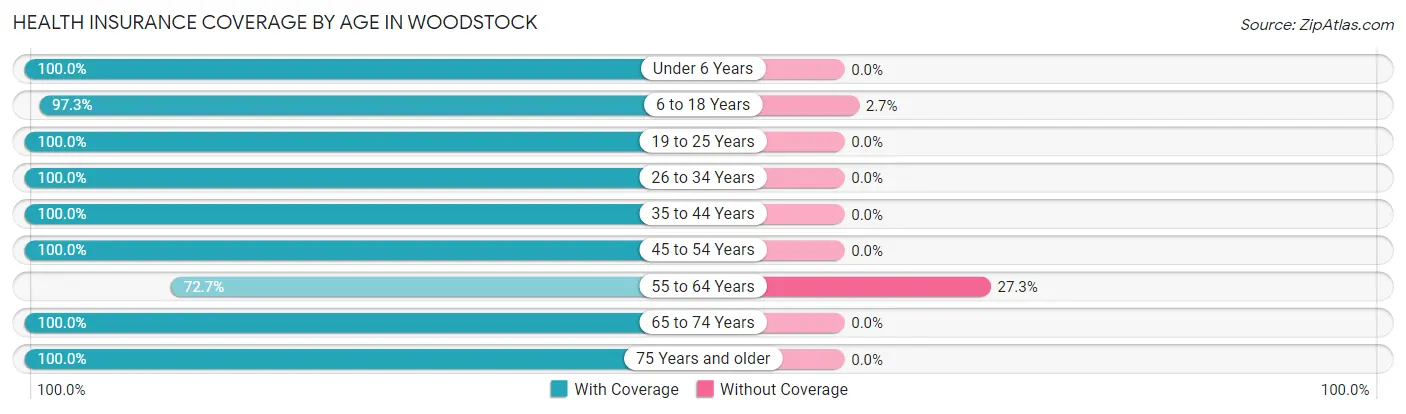
| Age Bracket | With Coverage | Without Coverage |
| Under 6 Years | 23 (100.0%) | 0 (0.0%) |
| 6 to 18 Years | 36 (97.3%) | 1 (2.7%) |
| 19 to 25 Years | 14 (100.0%) | 0 (0.0%) |
| 26 to 34 Years | 15 (100.0%) | 0 (0.0%) |
| 35 to 44 Years | 41 (100.0%) | 0 (0.0%) |
| 45 to 54 Years | 12 (100.0%) | 0 (0.0%) |
| 55 to 64 Years | 8 (72.7%) | 3 (27.3%) |
| 65 to 74 Years | 17 (100.0%) | 0 (0.0%) |
| 75 Years and older | 1 (100.0%) | 0 (0.0%) |
| Total | 167 (97.7%) | 4 (2.3%) |
Health Insurance Coverage by Citizenship Status in Woodstock
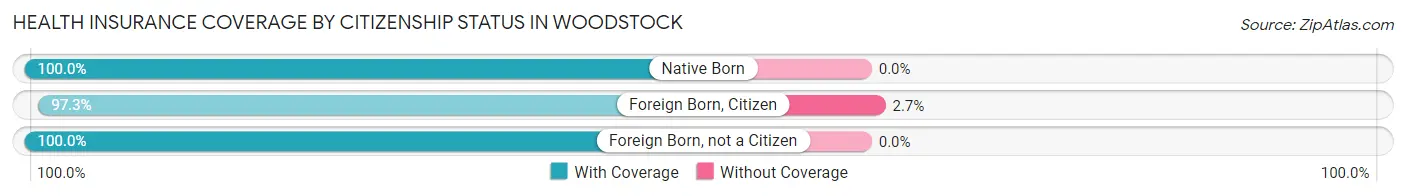
| Citizenship Status | With Coverage | Without Coverage |
| Native Born | 23 (100.0%) | 0 (0.0%) |
| Foreign Born, Citizen | 36 (97.3%) | 1 (2.7%) |
| Foreign Born, not a Citizen | 14 (100.0%) | 0 (0.0%) |
Health Insurance Coverage by Household Income in Woodstock
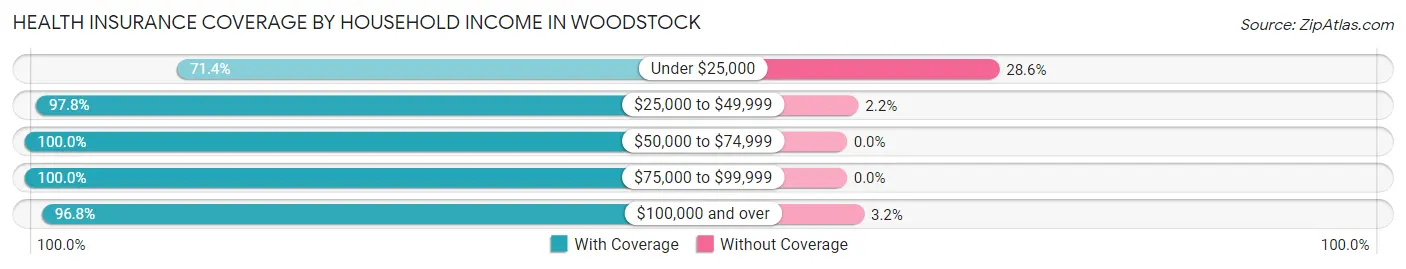
| Household Income | With Coverage | Without Coverage |
| Under $25,000 | 5 (71.4%) | 2 (28.6%) |
| $25,000 to $49,999 | 45 (97.8%) | 1 (2.2%) |
| $50,000 to $74,999 | 64 (100.0%) | 0 (0.0%) |
| $75,000 to $99,999 | 23 (100.0%) | 0 (0.0%) |
| $100,000 and over | 30 (96.8%) | 1 (3.2%) |
Public vs Private Health Insurance Coverage by Age in Woodstock
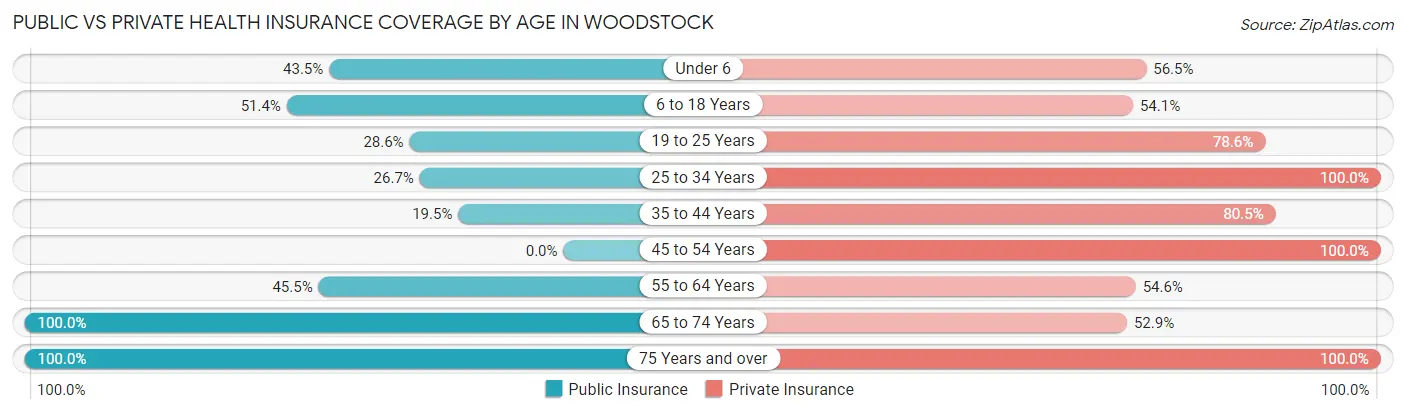
| Age Bracket | Public Insurance | Private Insurance |
| Under 6 | 10 (43.5%) | 13 (56.5%) |
| 6 to 18 Years | 19 (51.3%) | 20 (54.0%) |
| 19 to 25 Years | 4 (28.6%) | 11 (78.6%) |
| 25 to 34 Years | 4 (26.7%) | 15 (100.0%) |
| 35 to 44 Years | 8 (19.5%) | 33 (80.5%) |
| 45 to 54 Years | 0 (0.0%) | 12 (100.0%) |
| 55 to 64 Years | 5 (45.5%) | 6 (54.5%) |
| 65 to 74 Years | 17 (100.0%) | 9 (52.9%) |
| 75 Years and over | 1 (100.0%) | 1 (100.0%) |
| Total | 68 (39.8%) | 120 (70.2%) |
Disability Status by Sex by Age in Woodstock
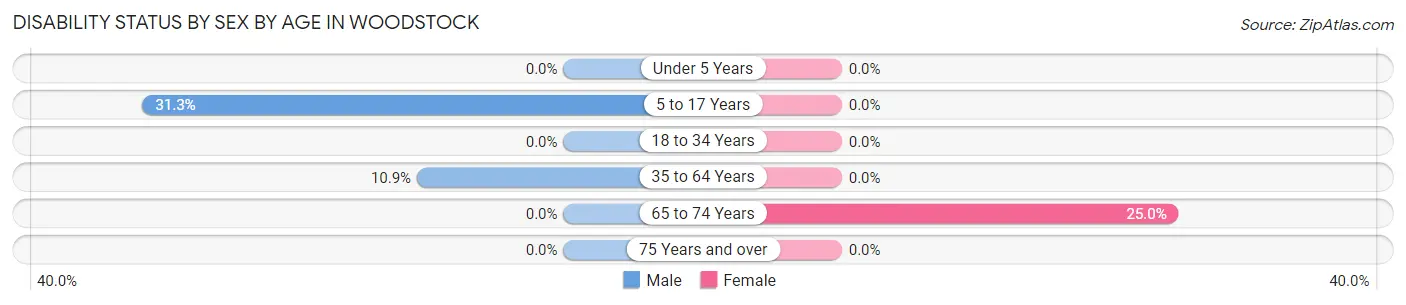
| Age Bracket | Male | Female |
| Under 5 Years | 0 (0.0%) | 0 (0.0%) |
| 5 to 17 Years | 5 (31.2%) | 0 (0.0%) |
| 18 to 34 Years | 0 (0.0%) | 0 (0.0%) |
| 35 to 64 Years | 5 (10.9%) | 0 (0.0%) |
| 65 to 74 Years | 0 (0.0%) | 2 (25.0%) |
| 75 Years and over | 0 (0.0%) | 0 (0.0%) |
Disability Class by Sex by Age in Woodstock
Disability Class: Hearing Difficulty
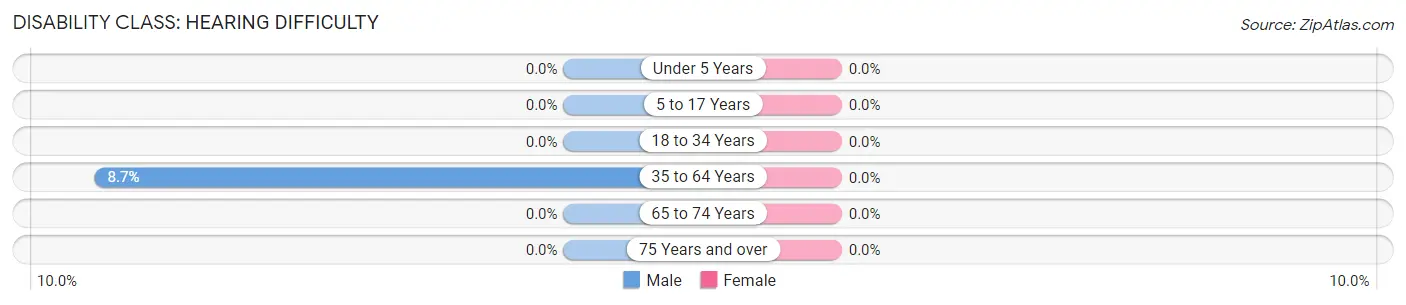
| Age Bracket | Male | Female |
| Under 5 Years | 0 (0.0%) | 0 (0.0%) |
| 5 to 17 Years | 0 (0.0%) | 0 (0.0%) |
| 18 to 34 Years | 0 (0.0%) | 0 (0.0%) |
| 35 to 64 Years | 4 (8.7%) | 0 (0.0%) |
| 65 to 74 Years | 0 (0.0%) | 0 (0.0%) |
| 75 Years and over | 0 (0.0%) | 0 (0.0%) |
Disability Class: Vision Difficulty
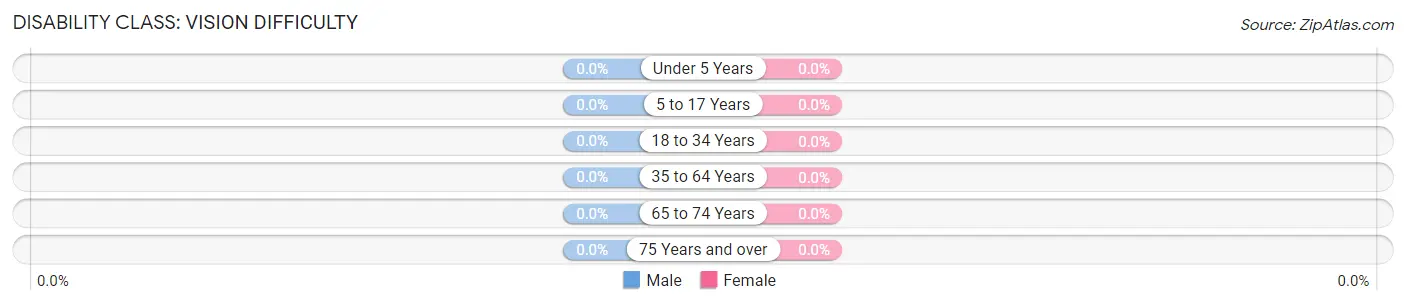
| Age Bracket | Male | Female |
| Under 5 Years | 0 (0.0%) | 0 (0.0%) |
| 5 to 17 Years | 0 (0.0%) | 0 (0.0%) |
| 18 to 34 Years | 0 (0.0%) | 0 (0.0%) |
| 35 to 64 Years | 0 (0.0%) | 0 (0.0%) |
| 65 to 74 Years | 0 (0.0%) | 0 (0.0%) |
| 75 Years and over | 0 (0.0%) | 0 (0.0%) |
Disability Class: Cognitive Difficulty
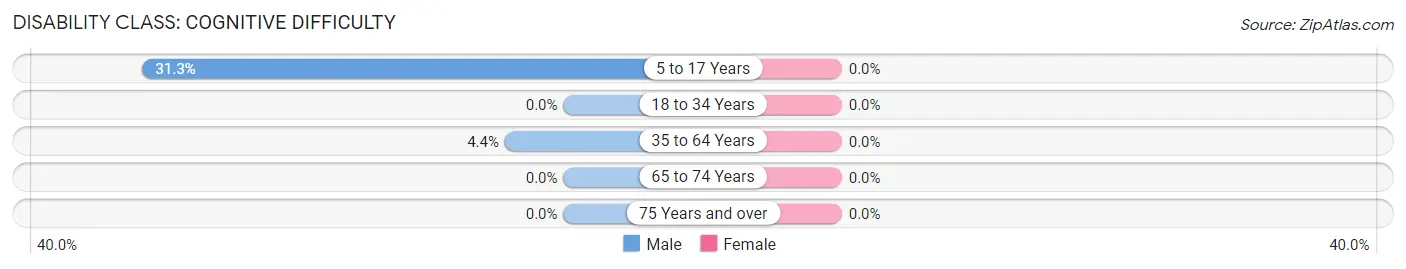
| Age Bracket | Male | Female |
| 5 to 17 Years | 5 (31.2%) | 0 (0.0%) |
| 18 to 34 Years | 0 (0.0%) | 0 (0.0%) |
| 35 to 64 Years | 2 (4.3%) | 0 (0.0%) |
| 65 to 74 Years | 0 (0.0%) | 0 (0.0%) |
| 75 Years and over | 0 (0.0%) | 0 (0.0%) |
Disability Class: Ambulatory Difficulty
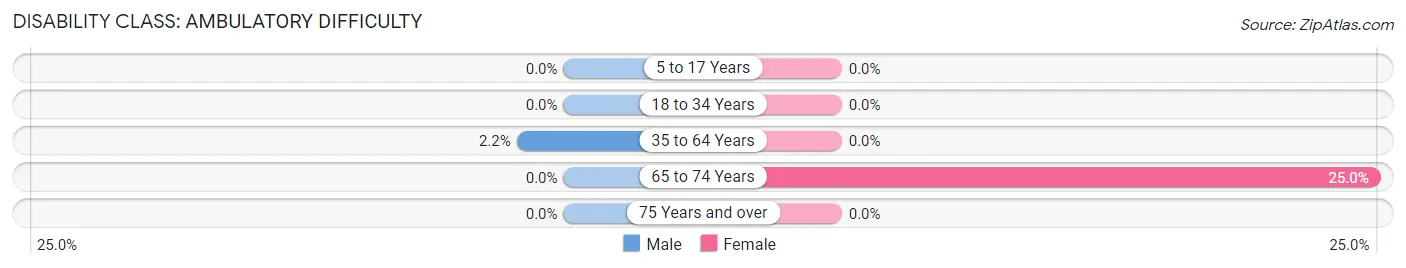
| Age Bracket | Male | Female |
| 5 to 17 Years | 0 (0.0%) | 0 (0.0%) |
| 18 to 34 Years | 0 (0.0%) | 0 (0.0%) |
| 35 to 64 Years | 1 (2.2%) | 0 (0.0%) |
| 65 to 74 Years | 0 (0.0%) | 2 (25.0%) |
| 75 Years and over | 0 (0.0%) | 0 (0.0%) |
Disability Class: Self-Care Difficulty
| Age Bracket | Male | Female |
| 5 to 17 Years | 0 (0.0%) | 0 (0.0%) |
| 18 to 34 Years | 0 (0.0%) | 0 (0.0%) |
| 35 to 64 Years | 0 (0.0%) | 0 (0.0%) |
| 65 to 74 Years | 0 (0.0%) | 0 (0.0%) |
| 75 Years and over | 0 (0.0%) | 0 (0.0%) |
Technology Access in Woodstock
Computing Device Access in Woodstock
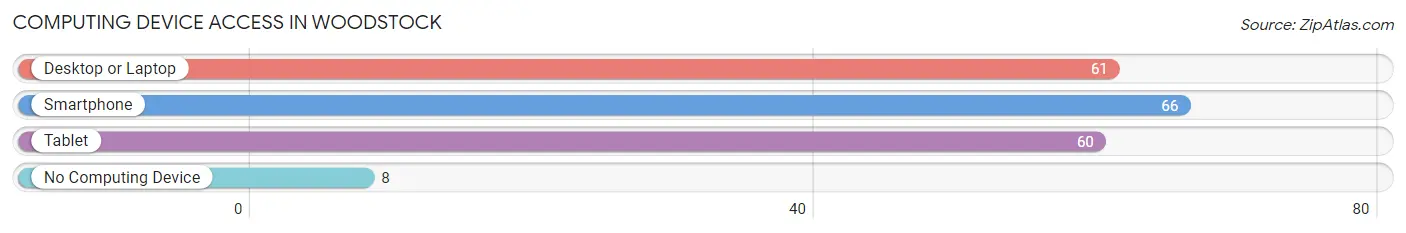
| Device Type | # Households | % Households |
| Desktop or Laptop | 61 | 82.4% |
| Smartphone | 66 | 89.2% |
| Tablet | 60 | 81.1% |
| No Computing Device | 8 | 10.8% |
| Total | 74 | 100.0% |
Internet Access in Woodstock
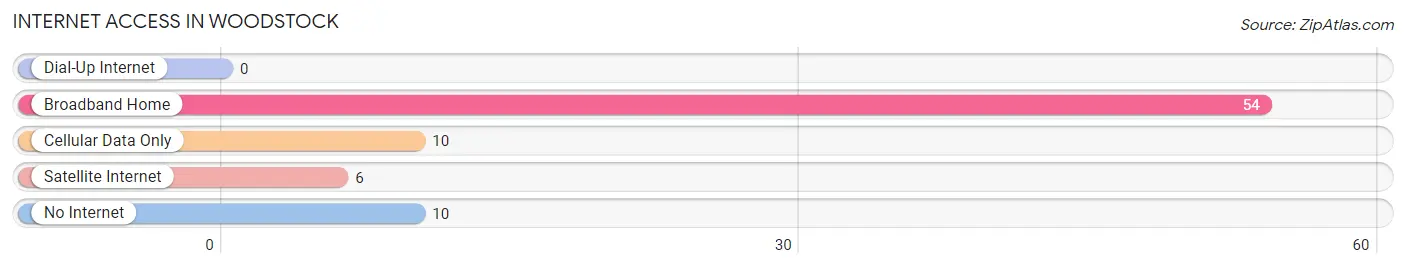
| Internet Type | # Households | % Households |
| Dial-Up Internet | 0 | 0.0% |
| Broadband Home | 54 | 73.0% |
| Cellular Data Only | 10 | 13.5% |
| Satellite Internet | 6 | 8.1% |
| No Internet | 10 | 13.5% |
| Total | 74 | 100.0% |
Woodstock Summary
Stockwood, Minnesota is a small city located in the southeastern corner of the state, just north of the Iowa border. It is part of the Twin Cities metropolitan area and is located in Goodhue County. The city has a population of approximately 4,000 people and is known for its small-town charm and rural atmosphere.
History
The area that is now Stockwood was first settled in 1854 by a group of Swedish immigrants. The town was originally called Swede Town, but was later changed to Stockwood in 1858. The name was chosen to honor the Swedish settlers who had come to the area.
The city was officially incorporated in 1872 and was primarily an agricultural community. The main crops grown in the area were wheat, corn, and oats. The city also had a number of small businesses, including a sawmill, a grist mill, and a blacksmith shop.
In the late 19th century, Stockwood began to experience a period of growth and development. The city was connected to the Twin Cities by rail in 1887, and the first telephone line was installed in 1891. The city also had a number of churches, schools, and other businesses.
Geography
Stockwood is located in the southeastern corner of Minnesota, just north of the Iowa border. The city is situated on the banks of the Cannon River and is surrounded by rolling hills and farmland. The city has a total area of 2.2 square miles, all of which is land.
The climate in Stockwood is typical of the Midwest, with hot summers and cold winters. The average temperature in the summer is around 75 degrees Fahrenheit, while the average temperature in the winter is around 20 degrees Fahrenheit.
Economy
The economy of Stockwood is primarily based on agriculture and tourism. The city is home to a number of small businesses, including restaurants, shops, and other services. The city also has a number of farms that produce a variety of crops, including corn, wheat, and oats.
The city is also home to a number of tourist attractions, including the Stockwood Historical Museum, the Stockwood Arts Center, and the Stockwood Nature Center. These attractions draw visitors from all over the state and beyond.
Demographics
As of the 2010 census, the population of Stockwood was 4,000. The racial makeup of the city was 97.2% White, 0.7% African American, 0.3% Native American, 0.2% Asian, 0.1% Pacific Islander, and 1.5% from other races. The median household income was $45,000, and the median family income was $50,000.
The city is home to a number of churches, including the Stockwood Lutheran Church, the Stockwood United Methodist Church, and the Stockwood Baptist Church. The city also has a number of schools, including Stockwood Elementary School, Stockwood Middle School, and Stockwood High School.
Conclusion
Stockwood, Minnesota is a small city located in the southeastern corner of the state, just north of the Iowa border. It is part of the Twin Cities metropolitan area and is known for its small-town charm and rural atmosphere. The city has a population of approximately 4,000 people and is primarily an agricultural community. The economy of Stockwood is based on agriculture and tourism, and the city is home to a number of small businesses, churches, and schools. The racial makeup of the city is predominantly white, with a small percentage of African American, Native American, Asian, and Pacific Islander residents.
Common Questions
What is Per Capita Income in Woodstock?
Per Capita income in Woodstock is $30,778.
What is the Median Family Income in Woodstock?
Median Family Income in Woodstock is $53,152.
What is the Median Household income in Woodstock?
Median Household Income in Woodstock is $53,804.
What is Income or Wage Gap in Woodstock?
Income or Wage Gap in Woodstock is 52.8%.
Women in Woodstock earn 47.2 cents for every dollar earned by a man.
What is Inequality or Gini Index in Woodstock?
Inequality or Gini Index in Woodstock is 0.37.
What is the Total Population of Woodstock?
Total Population of Woodstock is 171.
What is the Total Male Population of Woodstock?
Total Male Population of Woodstock is 97.
What is the Total Female Population of Woodstock?
Total Female Population of Woodstock is 74.
What is the Ratio of Males per 100 Females in Woodstock?
There are 131.08 Males per 100 Females in Woodstock.
What is the Ratio of Females per 100 Males in Woodstock?
There are 76.29 Females per 100 Males in Woodstock.
What is the Median Population Age in Woodstock?
Median Population Age in Woodstock is 33.6 Years.
What is the Average Family Size in Woodstock
Average Family Size in Woodstock is 2.4 People.
What is the Average Household Size in Woodstock
Average Household Size in Woodstock is 2.3 People.
How Large is the Labor Force in Woodstock?
There are 82 People in the Labor Forcein in Woodstock.
What is the Percentage of People in the Labor Force in Woodstock?
65.1% of People are in the Labor Force in Woodstock.