Winnebago, MN Map & Demographics
Winnebago Map

Winnebago Overview
$31,203
PER CAPITA INCOME
$80,833
AVG FAMILY INCOME
$58,750
AVG HOUSEHOLD INCOME
44.7%
WAGE / INCOME GAP [ % ]
55.3¢/ $1
WAGE / INCOME GAP [ $ ]
0.41
INEQUALITY / GINI INDEX
1,245
TOTAL POPULATION
663
MALE POPULATION
582
FEMALE POPULATION
113.92
MALES / 100 FEMALES
87.78
FEMALES / 100 MALES
41.6
MEDIAN AGE
2.9
AVG FAMILY SIZE
2.2
AVG HOUSEHOLD SIZE
664
LABOR FORCE [ PEOPLE ]
62.1%
PERCENT IN LABOR FORCE
6.1%
UNEMPLOYMENT RATE
Winnebago Zip Codes
Winnebago Area Codes
Income in Winnebago
Income Overview in Winnebago
Per Capita Income in Winnebago is $31,203, while median incomes of families and households are $80,833 and $58,750 respectively.
| Characteristic | Number | Measure |
| Per Capita Income | 1,245 | $31,203 |
| Median Family Income | 310 | $80,833 |
| Mean Family Income | 310 | $88,473 |
| Median Household Income | 539 | $58,750 |
| Mean Household Income | 539 | $71,790 |
| Income Deficit | 310 | $0 |
| Wage / Income Gap (%) | 1,245 | 44.73% |
| Wage / Income Gap ($) | 1,245 | 55.27¢ per $1 |
| Gini / Inequality Index | 1,245 | 0.41 |
Earnings by Sex in Winnebago
Average Earnings in Winnebago are $33,333, $45,000 for men and $24,871 for women, a difference of 44.7%.
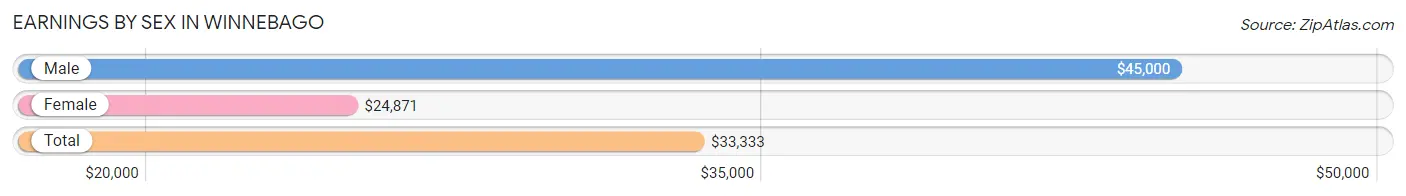
| Sex | Number | Average Earnings |
| Male | 410 (55.6%) | $45,000 |
| Female | 328 (44.4%) | $24,871 |
| Total | 738 (100.0%) | $33,333 |
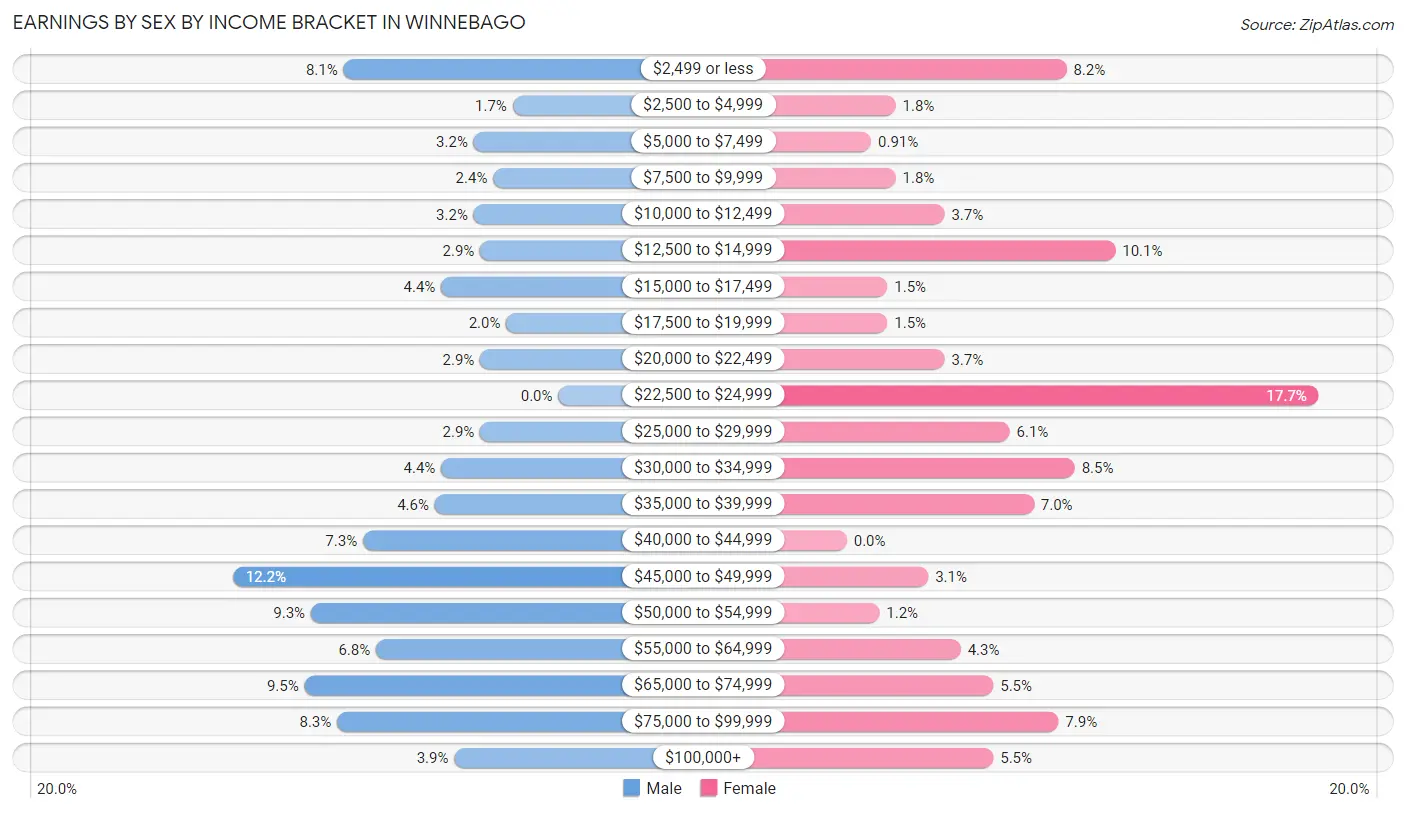
Earnings by Sex by Income Bracket in Winnebago
The most common earnings brackets in Winnebago are $45,000 to $49,999 for men (50 | 12.2%) and $22,500 to $24,999 for women (58 | 17.7%).
| Income | Male | Female |
| $2,499 or less | 33 (8.1%) | 27 (8.2%) |
| $2,500 to $4,999 | 7 (1.7%) | 6 (1.8%) |
| $5,000 to $7,499 | 13 (3.2%) | 3 (0.9%) |
| $7,500 to $9,999 | 10 (2.4%) | 6 (1.8%) |
| $10,000 to $12,499 | 13 (3.2%) | 12 (3.7%) |
| $12,500 to $14,999 | 12 (2.9%) | 33 (10.1%) |
| $15,000 to $17,499 | 18 (4.4%) | 5 (1.5%) |
| $17,500 to $19,999 | 8 (1.9%) | 5 (1.5%) |
| $20,000 to $22,499 | 12 (2.9%) | 12 (3.7%) |
| $22,500 to $24,999 | 0 (0.0%) | 58 (17.7%) |
| $25,000 to $29,999 | 12 (2.9%) | 20 (6.1%) |
| $30,000 to $34,999 | 18 (4.4%) | 28 (8.5%) |
| $35,000 to $39,999 | 19 (4.6%) | 23 (7.0%) |
| $40,000 to $44,999 | 30 (7.3%) | 0 (0.0%) |
| $45,000 to $49,999 | 50 (12.2%) | 10 (3.0%) |
| $50,000 to $54,999 | 38 (9.3%) | 4 (1.2%) |
| $55,000 to $64,999 | 28 (6.8%) | 14 (4.3%) |
| $65,000 to $74,999 | 39 (9.5%) | 18 (5.5%) |
| $75,000 to $99,999 | 34 (8.3%) | 26 (7.9%) |
| $100,000+ | 16 (3.9%) | 18 (5.5%) |
| Total | 410 (100.0%) | 328 (100.0%) |
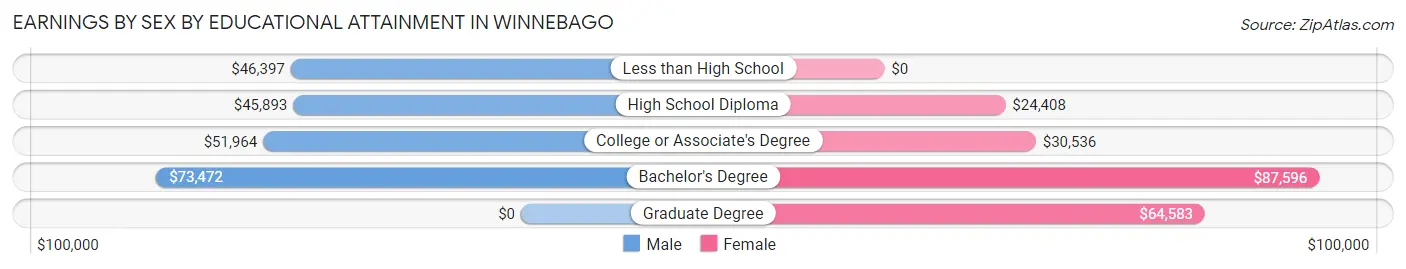
Earnings by Sex by Educational Attainment in Winnebago
Average earnings in Winnebago are $47,614 for men and $27,500 for women, a difference of 42.2%. Men with an educational attainment of bachelor's degree enjoy the highest average annual earnings of $73,472, while those with high school diploma education earn the least with $45,893. Women with an educational attainment of bachelor's degree earn the most with the average annual earnings of $87,596, while those with high school diploma education have the smallest earnings of $24,408.
| Educational Attainment | Male Income | Female Income |
| Less than High School | $46,397 | $0 |
| High School Diploma | $45,893 | $24,408 |
| College or Associate's Degree | $51,964 | $30,536 |
| Bachelor's Degree | $73,472 | $87,596 |
| Graduate Degree | - | - |
| Total | $47,614 | $27,500 |
Family Income in Winnebago
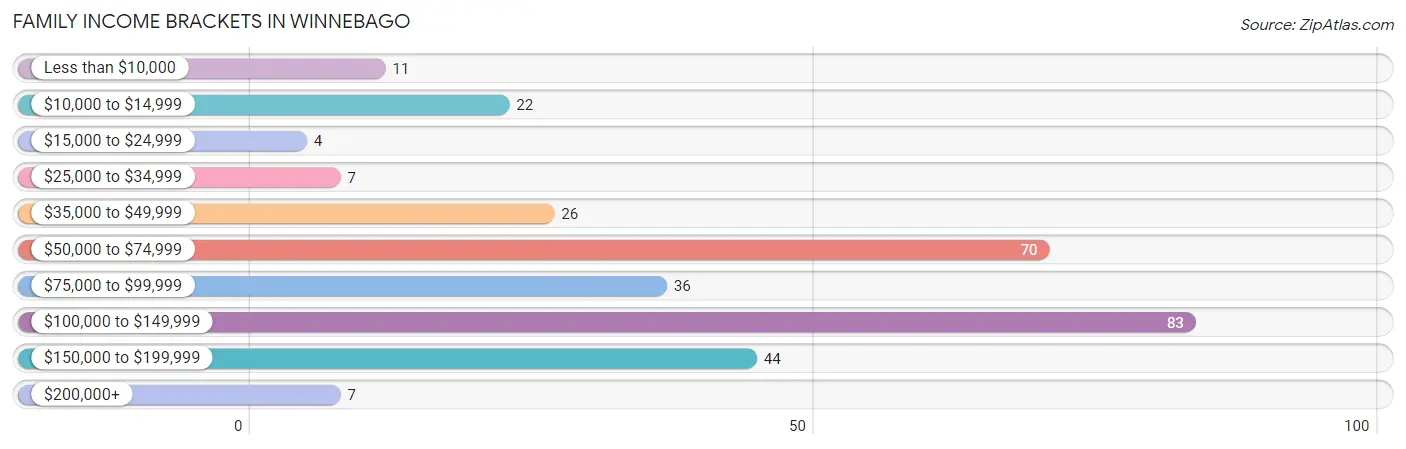
Family Income Brackets in Winnebago
According to the Winnebago family income data, there are 83 families falling into the $100,000 to $149,999 income range, which is the most common income bracket and makes up 26.8% of all families. Conversely, the $15,000 to $24,999 income bracket is the least frequent group with only 4 families (1.3%) belonging to this category.
| Income Bracket | # Families | % Families |
| Less than $10,000 | 11 | 3.5% |
| $10,000 to $14,999 | 22 | 7.1% |
| $15,000 to $24,999 | 4 | 1.3% |
| $25,000 to $34,999 | 7 | 2.3% |
| $35,000 to $49,999 | 26 | 8.4% |
| $50,000 to $74,999 | 70 | 22.6% |
| $75,000 to $99,999 | 36 | 11.6% |
| $100,000 to $149,999 | 83 | 26.8% |
| $150,000 to $199,999 | 44 | 14.2% |
| $200,000+ | 7 | 2.3% |
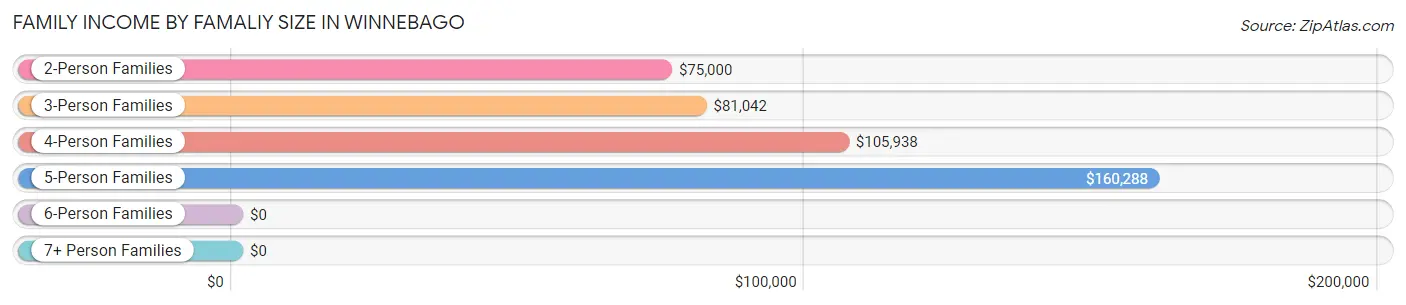
Family Income by Famaliy Size in Winnebago
5-person families (23 | 7.4%) account for the highest median family income in Winnebago with $160,288 per family, while 2-person families (156 | 50.3%) have the highest median income of $37,500 per family member.
| Income Bracket | # Families | Median Income |
| 2-Person Families | 156 (50.3%) | $75,000 |
| 3-Person Families | 61 (19.7%) | $81,042 |
| 4-Person Families | 63 (20.3%) | $105,938 |
| 5-Person Families | 23 (7.4%) | $160,288 |
| 6-Person Families | 7 (2.3%) | $0 |
| 7+ Person Families | 0 (0.0%) | $0 |
| Total | 310 (100.0%) | $80,833 |
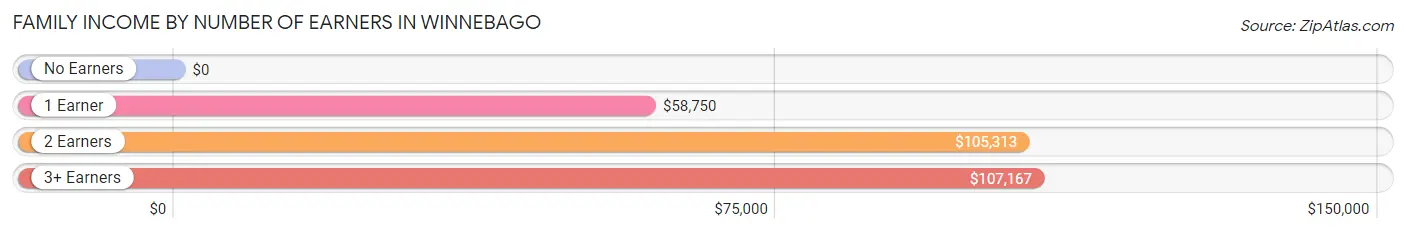
Family Income by Number of Earners in Winnebago
| Number of Earners | # Families | Median Income |
| No Earners | 48 (15.5%) | $0 |
| 1 Earner | 48 (15.5%) | $58,750 |
| 2 Earners | 164 (52.9%) | $105,313 |
| 3+ Earners | 50 (16.1%) | $107,167 |
| Total | 310 (100.0%) | $80,833 |
Household Income in Winnebago
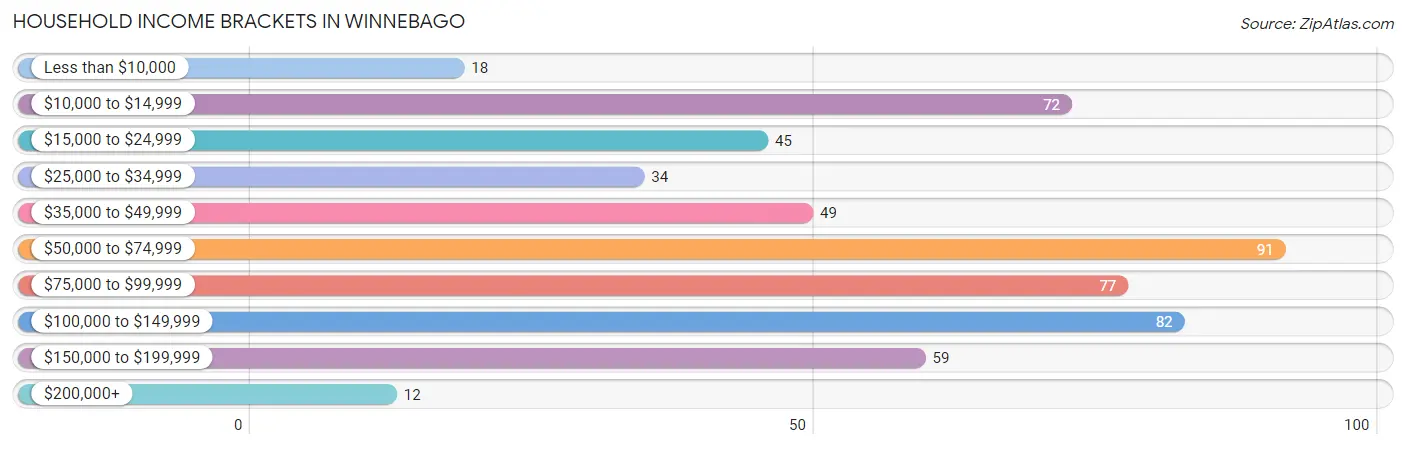
Household Income Brackets in Winnebago
With 91 households falling in the category, the $50,000 to $74,999 income range is the most frequent in Winnebago, accounting for 16.9% of all households. In contrast, only 12 households (2.2%) fall into the $200,000+ income bracket, making it the least populous group.
| Income Bracket | # Households | % Households |
| Less than $10,000 | 18 | 3.3% |
| $10,000 to $14,999 | 72 | 13.4% |
| $15,000 to $24,999 | 45 | 8.3% |
| $25,000 to $34,999 | 34 | 6.3% |
| $35,000 to $49,999 | 49 | 9.1% |
| $50,000 to $74,999 | 91 | 16.9% |
| $75,000 to $99,999 | 77 | 14.3% |
| $100,000 to $149,999 | 82 | 15.2% |
| $150,000 to $199,999 | 59 | 10.9% |
| $200,000+ | 12 | 2.2% |
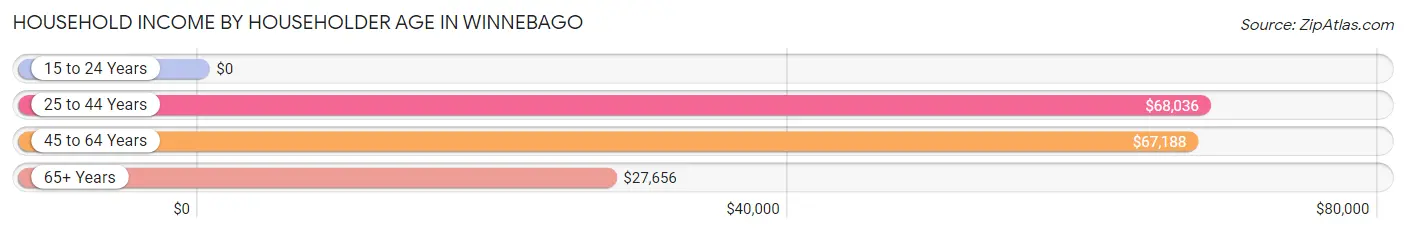
Household Income by Householder Age in Winnebago
The median household income in Winnebago is $58,750, with the highest median household income of $68,036 found in the 25 to 44 years age bracket for the primary householder. A total of 113 households (21.0%) fall into this category. Meanwhile, the 15 to 24 years age bracket for the primary householder has the lowest median household income of $0, with 43 households (8.0%) in this group.
| Income Bracket | # Households | Median Income |
| 15 to 24 Years | 43 (8.0%) | $0 |
| 25 to 44 Years | 113 (21.0%) | $68,036 |
| 45 to 64 Years | 225 (41.7%) | $67,188 |
| 65+ Years | 158 (29.3%) | $27,656 |
| Total | 539 (100.0%) | $58,750 |
Poverty in Winnebago
Income Below Poverty by Sex and Age in Winnebago
With 11.5% poverty level for males and 10.4% for females among the residents of Winnebago, 75 year old and over males and 65 to 74 year old females are the most vulnerable to poverty, with 15 males (38.5%) and 15 females (23.1%) in their respective age groups living below the poverty level.
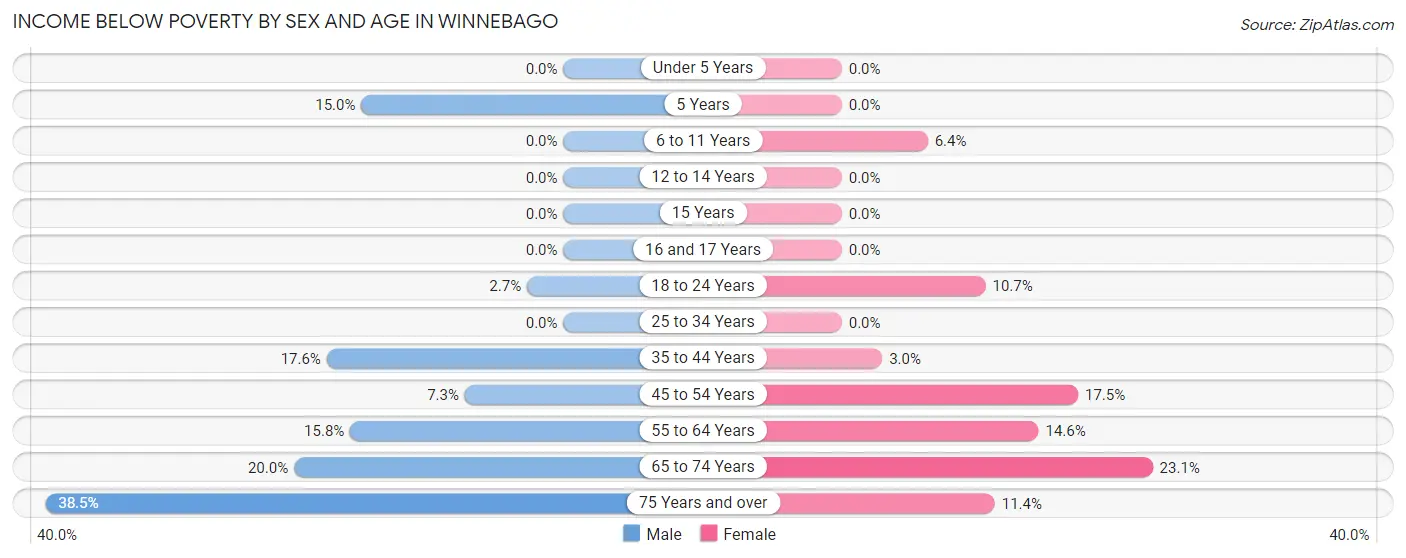
| Age Bracket | Male | Female |
| Under 5 Years | 0 (0.0%) | 0 (0.0%) |
| 5 Years | 3 (15.0%) | 0 (0.0%) |
| 6 to 11 Years | 0 (0.0%) | 3 (6.4%) |
| 12 to 14 Years | 0 (0.0%) | 0 (0.0%) |
| 15 Years | 0 (0.0%) | 0 (0.0%) |
| 16 and 17 Years | 0 (0.0%) | 0 (0.0%) |
| 18 to 24 Years | 3 (2.7%) | 8 (10.7%) |
| 25 to 34 Years | 0 (0.0%) | 0 (0.0%) |
| 35 to 44 Years | 13 (17.6%) | 3 (3.0%) |
| 45 to 54 Years | 3 (7.3%) | 10 (17.5%) |
| 55 to 64 Years | 22 (15.8%) | 13 (14.6%) |
| 65 to 74 Years | 17 (20.0%) | 15 (23.1%) |
| 75 Years and over | 15 (38.5%) | 5 (11.4%) |
| Total | 76 (11.5%) | 57 (10.4%) |
Income Above Poverty by Sex and Age in Winnebago
According to the poverty statistics in Winnebago, males aged under 5 years and females aged under 5 years are the age groups that are most secure financially, with 100.0% of males and 100.0% of females in these age groups living above the poverty line.
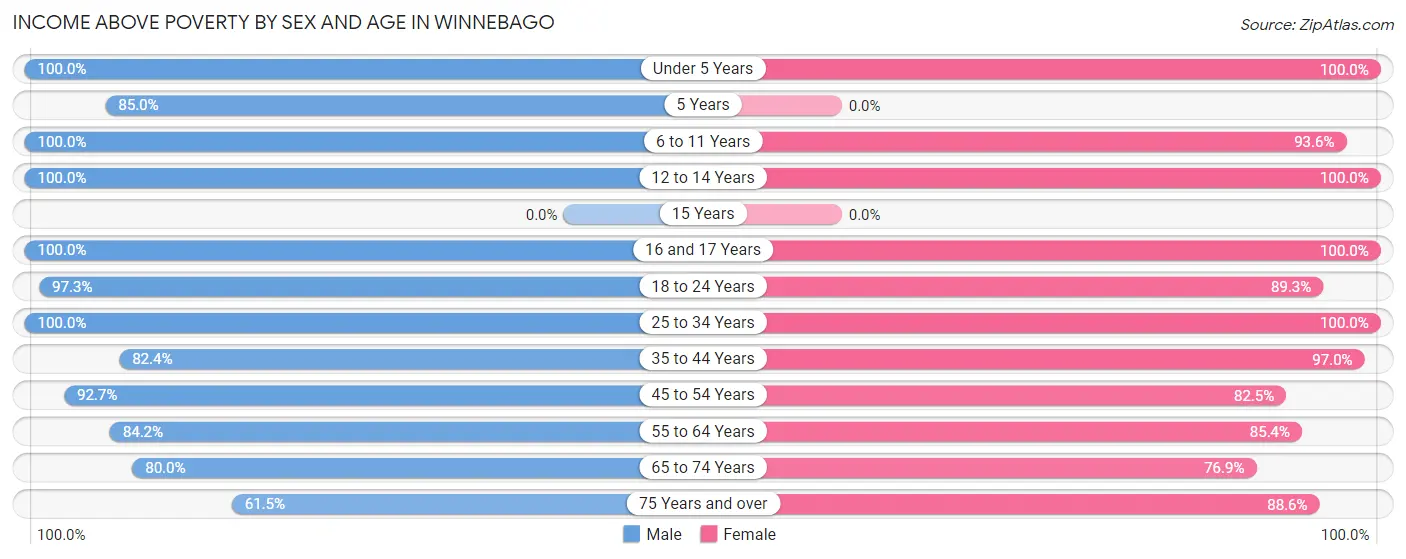
| Age Bracket | Male | Female |
| Under 5 Years | 15 (100.0%) | 11 (100.0%) |
| 5 Years | 17 (85.0%) | 0 (0.0%) |
| 6 to 11 Years | 44 (100.0%) | 44 (93.6%) |
| 12 to 14 Years | 17 (100.0%) | 21 (100.0%) |
| 15 Years | 0 (0.0%) | 0 (0.0%) |
| 16 and 17 Years | 25 (100.0%) | 4 (100.0%) |
| 18 to 24 Years | 108 (97.3%) | 67 (89.3%) |
| 25 to 34 Years | 53 (100.0%) | 37 (100.0%) |
| 35 to 44 Years | 61 (82.4%) | 97 (97.0%) |
| 45 to 54 Years | 38 (92.7%) | 47 (82.5%) |
| 55 to 64 Years | 117 (84.2%) | 76 (85.4%) |
| 65 to 74 Years | 68 (80.0%) | 50 (76.9%) |
| 75 Years and over | 24 (61.5%) | 39 (88.6%) |
| Total | 587 (88.5%) | 493 (89.6%) |
Income Below Poverty Among Married-Couple Families in Winnebago
The poverty statistics for married-couple families in Winnebago show that 4.2% or 8 of the total 191 families live below the poverty line. Families with no children have the highest poverty rate of 6.3%, comprising of 8 families. On the other hand, families with 1 or 2 children have the lowest poverty rate of 0.0%, which includes 0 families.
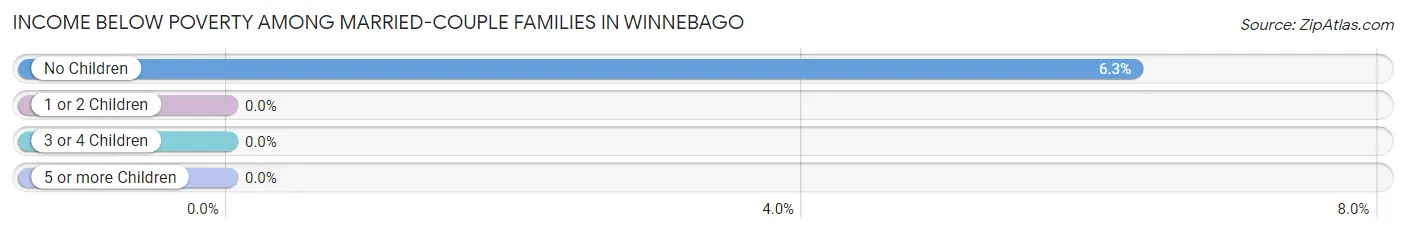
| Children | Above Poverty | Below Poverty |
| No Children | 119 (93.7%) | 8 (6.3%) |
| 1 or 2 Children | 37 (100.0%) | 0 (0.0%) |
| 3 or 4 Children | 27 (100.0%) | 0 (0.0%) |
| 5 or more Children | 0 (0.0%) | 0 (0.0%) |
| Total | 183 (95.8%) | 8 (4.2%) |
Income Below Poverty Among Single-Parent Households in Winnebago
According to the poverty data in Winnebago, 28.9% or 22 single-father households and 7.0% or 3 single-mother households are living below the poverty line. Among single-father households, those with no children have the highest poverty rate, with 22 households (31.9%) experiencing poverty. Likewise, among single-mother households, those with 1 or 2 children have the highest poverty rate, with 3 households (21.4%) falling below the poverty line.
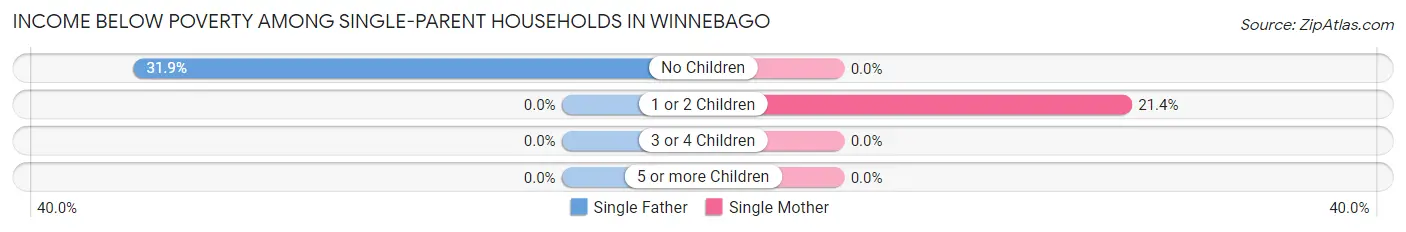
| Children | Single Father | Single Mother |
| No Children | 22 (31.9%) | 0 (0.0%) |
| 1 or 2 Children | 0 (0.0%) | 3 (21.4%) |
| 3 or 4 Children | 0 (0.0%) | 0 (0.0%) |
| 5 or more Children | 0 (0.0%) | 0 (0.0%) |
| Total | 22 (28.9%) | 3 (7.0%) |
Income Below Poverty Among Married-Couple vs Single-Parent Households in Winnebago
The poverty data for Winnebago shows that 8 of the married-couple family households (4.2%) and 25 of the single-parent households (21.0%) are living below the poverty level. Within the married-couple family households, those with no children have the highest poverty rate, with 8 households (6.3%) falling below the poverty line. Among the single-parent households, those with no children have the highest poverty rate, with 22 household (23.4%) living below poverty.
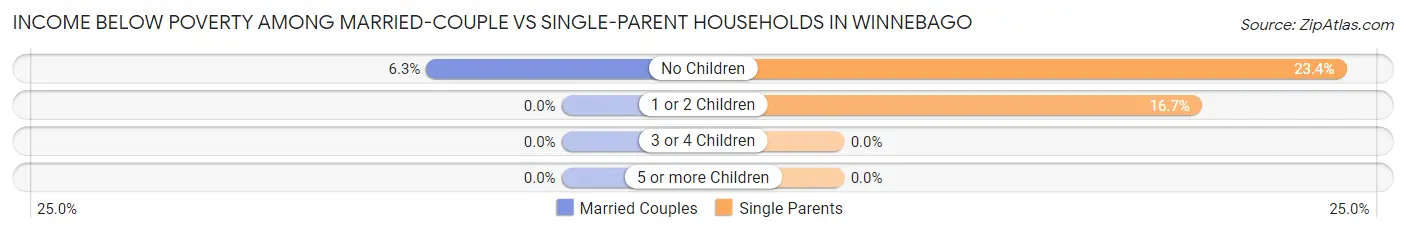
| Children | Married-Couple Families | Single-Parent Households |
| No Children | 8 (6.3%) | 22 (23.4%) |
| 1 or 2 Children | 0 (0.0%) | 3 (16.7%) |
| 3 or 4 Children | 0 (0.0%) | 0 (0.0%) |
| 5 or more Children | 0 (0.0%) | 0 (0.0%) |
| Total | 8 (4.2%) | 25 (21.0%) |
Race in Winnebago
The most populous races in Winnebago are White / Caucasian (960 | 77.1%), Hispanic or Latino (261 | 21.0%), and Two or more Races (168 | 13.5%).
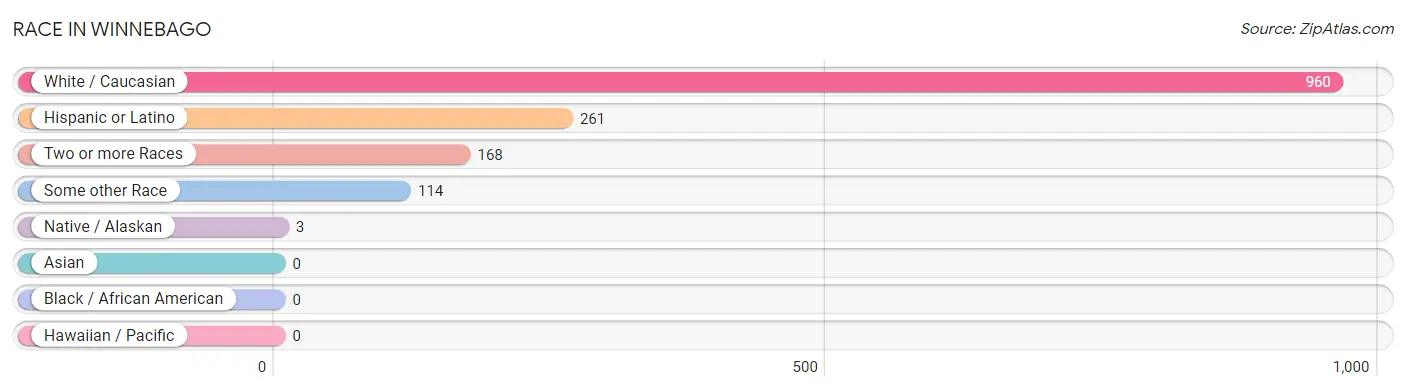
| Race | # Population | % Population |
| Asian | 0 | 0.0% |
| Black / African American | 0 | 0.0% |
| Hawaiian / Pacific | 0 | 0.0% |
| Hispanic or Latino | 261 | 21.0% |
| Native / Alaskan | 3 | 0.2% |
| White / Caucasian | 960 | 77.1% |
| Two or more Races | 168 | 13.5% |
| Some other Race | 114 | 9.2% |
| Total | 1,245 | 100.0% |
Ancestry in Winnebago
The most populous ancestries reported in Winnebago are German (361 | 29.0%), Mexican (244 | 19.6%), Norwegian (97 | 7.8%), Swedish (88 | 7.1%), and Irish (86 | 6.9%), together accounting for 70.4% of all Winnebago residents.
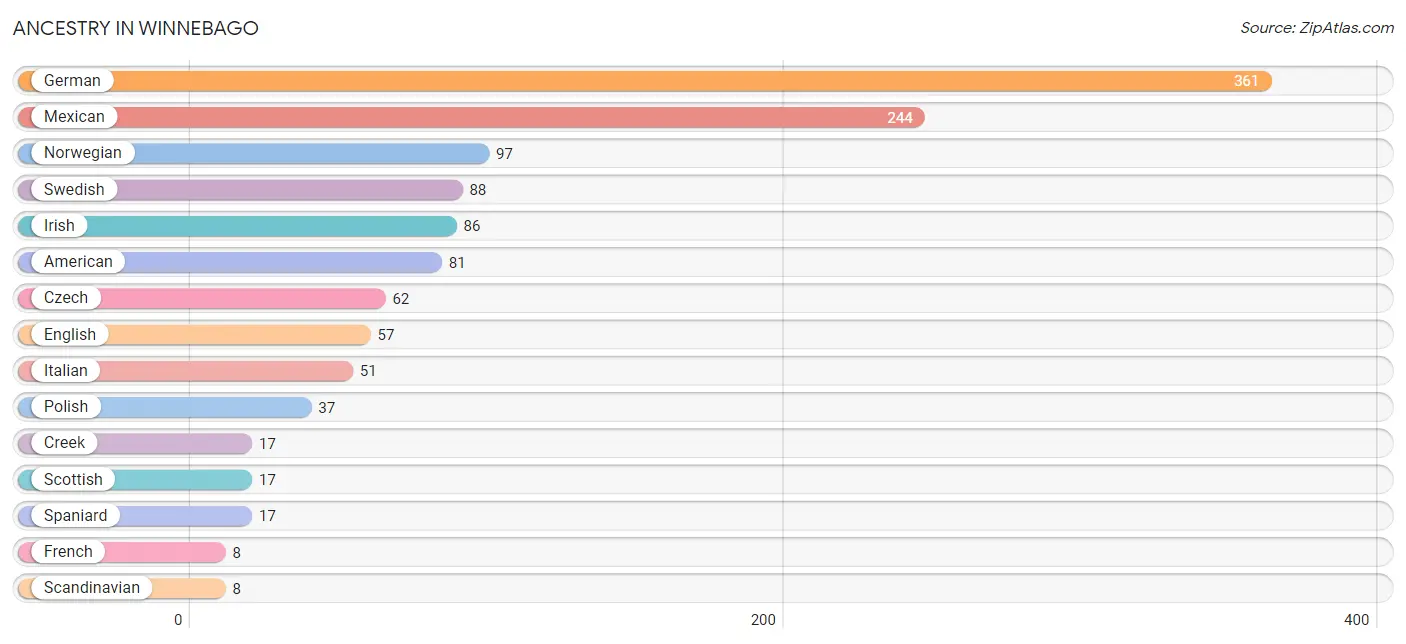
| Ancestry | # Population | % Population |
| American | 81 | 6.5% |
| Austrian | 5 | 0.4% |
| Brazilian | 2 | 0.2% |
| Chippewa | 2 | 0.2% |
| Creek | 17 | 1.4% |
| Croatian | 2 | 0.2% |
| Czech | 62 | 5.0% |
| Danish | 7 | 0.6% |
| Dutch | 2 | 0.2% |
| English | 57 | 4.6% |
| European | 7 | 0.6% |
| French | 8 | 0.6% |
| German | 361 | 29.0% |
| Irish | 86 | 6.9% |
| Italian | 51 | 4.1% |
| Luxembourger | 4 | 0.3% |
| Mexican | 244 | 19.6% |
| Norwegian | 97 | 7.8% |
| Polish | 37 | 3.0% |
| Russian | 3 | 0.2% |
| Scandinavian | 8 | 0.6% |
| Scotch-Irish | 5 | 0.4% |
| Scottish | 17 | 1.4% |
| Sioux | 1 | 0.1% |
| Spaniard | 17 | 1.4% |
| Swedish | 88 | 7.1% | View All 26 Rows |
Immigrants in Winnebago
The most numerous immigrant groups reported in Winnebago came from Latin America (50 | 4.0%), Central America (48 | 3.9%), Mexico (48 | 3.9%), Brazil (2 | 0.2%), and South America (2 | 0.2%), together accounting for 12.1% of all Winnebago residents.
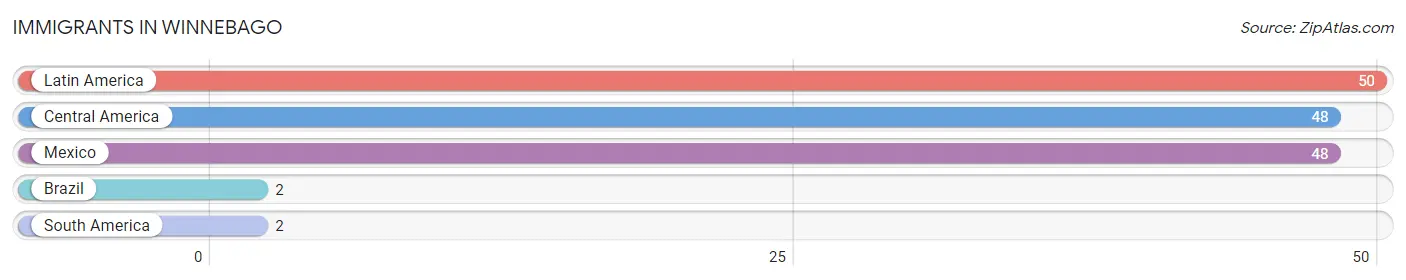
| Immigration Origin | # Population | % Population |
| Brazil | 2 | 0.2% |
| Central America | 48 | 3.9% |
| Latin America | 50 | 4.0% |
| Mexico | 48 | 3.9% |
| South America | 2 | 0.2% | View All 5 Rows |
Sex and Age in Winnebago
Sex and Age in Winnebago
The most populous age groups in Winnebago are 20 to 24 Years (91 | 13.7%) for men and 35 to 39 Years (61 | 10.5%) for women.
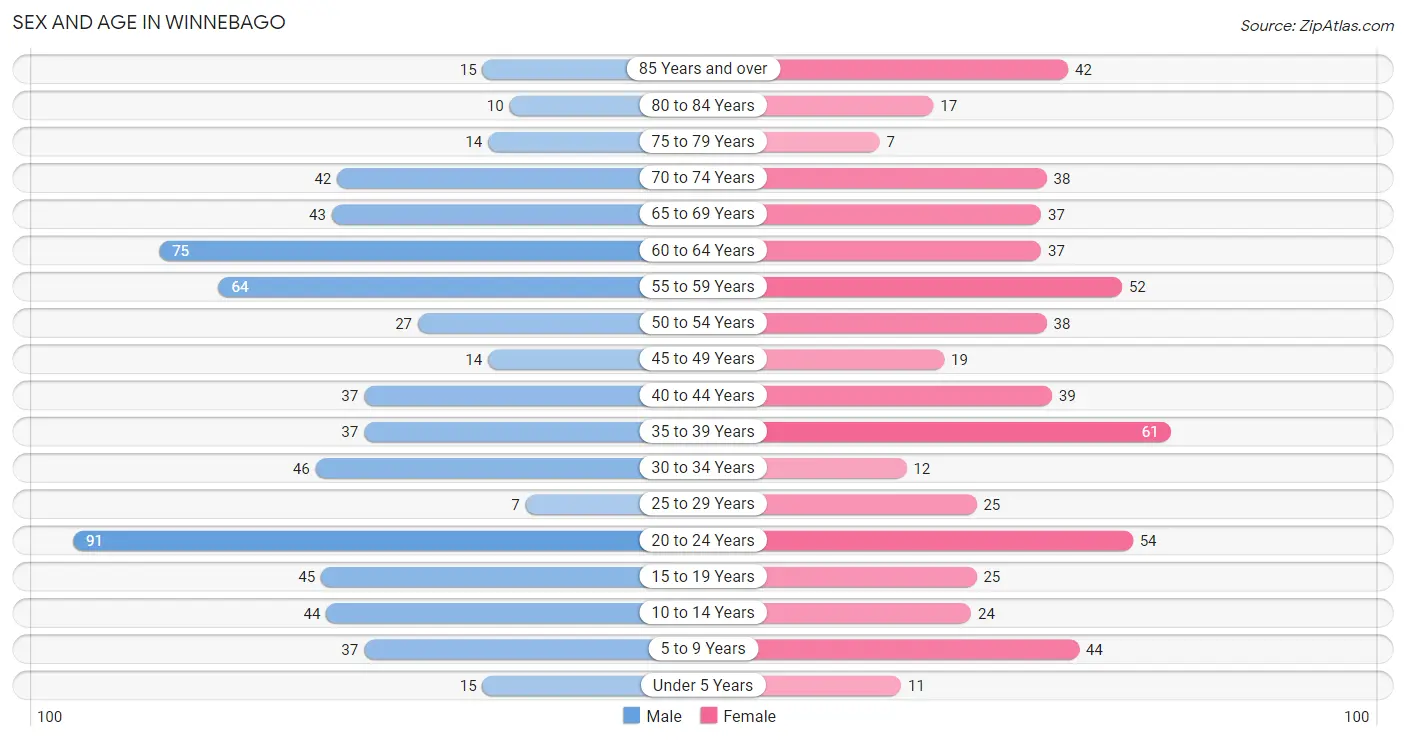
| Age Bracket | Male | Female |
| Under 5 Years | 15 (2.3%) | 11 (1.9%) |
| 5 to 9 Years | 37 (5.6%) | 44 (7.6%) |
| 10 to 14 Years | 44 (6.6%) | 24 (4.1%) |
| 15 to 19 Years | 45 (6.8%) | 25 (4.3%) |
| 20 to 24 Years | 91 (13.7%) | 54 (9.3%) |
| 25 to 29 Years | 7 (1.1%) | 25 (4.3%) |
| 30 to 34 Years | 46 (6.9%) | 12 (2.1%) |
| 35 to 39 Years | 37 (5.6%) | 61 (10.5%) |
| 40 to 44 Years | 37 (5.6%) | 39 (6.7%) |
| 45 to 49 Years | 14 (2.1%) | 19 (3.3%) |
| 50 to 54 Years | 27 (4.1%) | 38 (6.5%) |
| 55 to 59 Years | 64 (9.7%) | 52 (8.9%) |
| 60 to 64 Years | 75 (11.3%) | 37 (6.4%) |
| 65 to 69 Years | 43 (6.5%) | 37 (6.4%) |
| 70 to 74 Years | 42 (6.3%) | 38 (6.5%) |
| 75 to 79 Years | 14 (2.1%) | 7 (1.2%) |
| 80 to 84 Years | 10 (1.5%) | 17 (2.9%) |
| 85 Years and over | 15 (2.3%) | 42 (7.2%) |
| Total | 663 (100.0%) | 582 (100.0%) |
Families and Households in Winnebago
Median Family Size in Winnebago
The median family size in Winnebago is 2.91 persons per family, with married-couple families (191 | 61.6%) accounting for the largest median family size of 3.2 persons per family. On the other hand, single male/father families (76 | 24.5%) represent the smallest median family size with 2.12 persons per family.
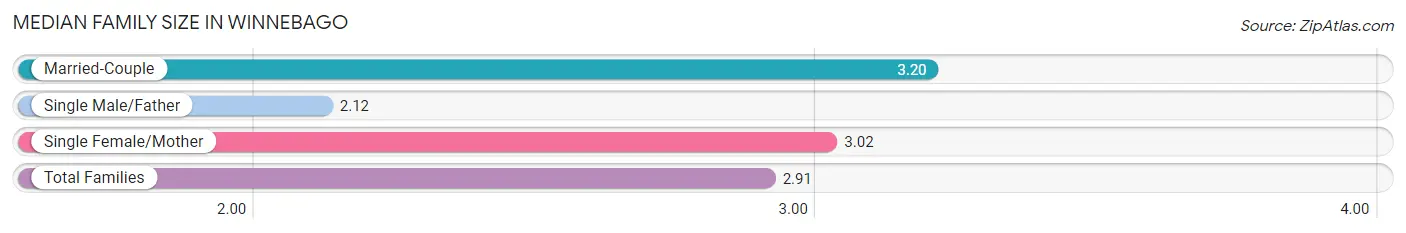
| Family Type | # Families | Family Size |
| Married-Couple | 191 (61.6%) | 3.20 |
| Single Male/Father | 76 (24.5%) | 2.12 |
| Single Female/Mother | 43 (13.9%) | 3.02 |
| Total Families | 310 (100.0%) | 2.91 |
Median Household Size in Winnebago
The median household size in Winnebago is 2.24 persons per household, with married-couple households (191 | 35.4%) accounting for the largest median household size of 3.2 persons per household. non-family households (229 | 42.5%) represent the smallest median household size with 1.14 persons per household.
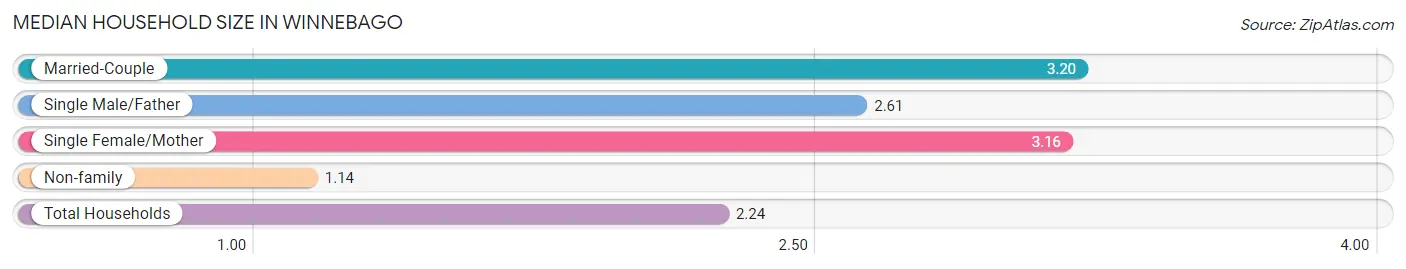
| Household Type | # Households | Household Size |
| Married-Couple | 191 (35.4%) | 3.20 |
| Single Male/Father | 76 (14.1%) | 2.61 |
| Single Female/Mother | 43 (8.0%) | 3.16 |
| Non-family | 229 (42.5%) | 1.14 |
| Total Households | 539 (100.0%) | 2.24 |
Household Size by Marriage Status in Winnebago
Out of a total of 539 households in Winnebago, 310 (57.5%) are family households, while 229 (42.5%) are nonfamily households. The most numerous type of family households are 2-person households, comprising 145, and the most common type of nonfamily households are 1-person households, comprising 188.
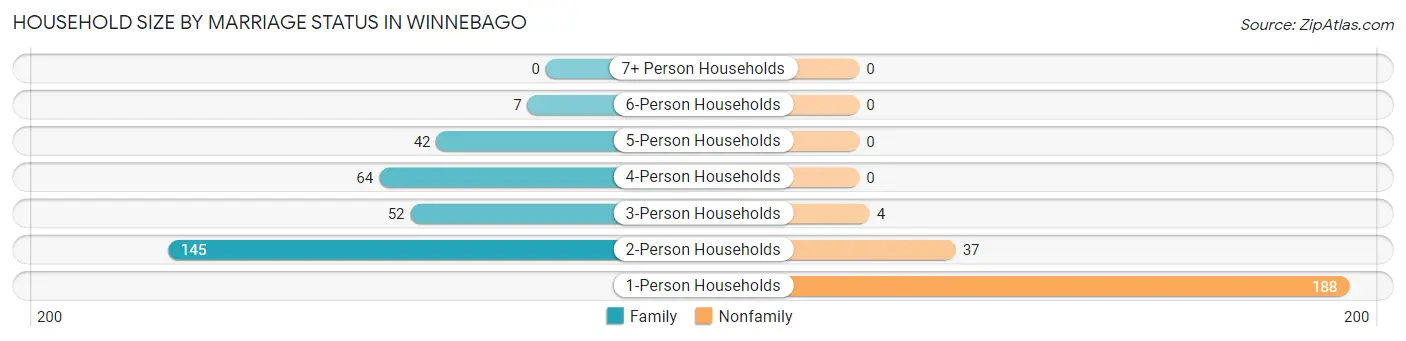
| Household Size | Family Households | Nonfamily Households |
| 1-Person Households | - | 188 (34.9%) |
| 2-Person Households | 145 (26.9%) | 37 (6.9%) |
| 3-Person Households | 52 (9.7%) | 4 (0.7%) |
| 4-Person Households | 64 (11.9%) | 0 (0.0%) |
| 5-Person Households | 42 (7.8%) | 0 (0.0%) |
| 6-Person Households | 7 (1.3%) | 0 (0.0%) |
| 7+ Person Households | 0 (0.0%) | 0 (0.0%) |
| Total | 310 (57.5%) | 229 (42.5%) |
Female Fertility in Winnebago
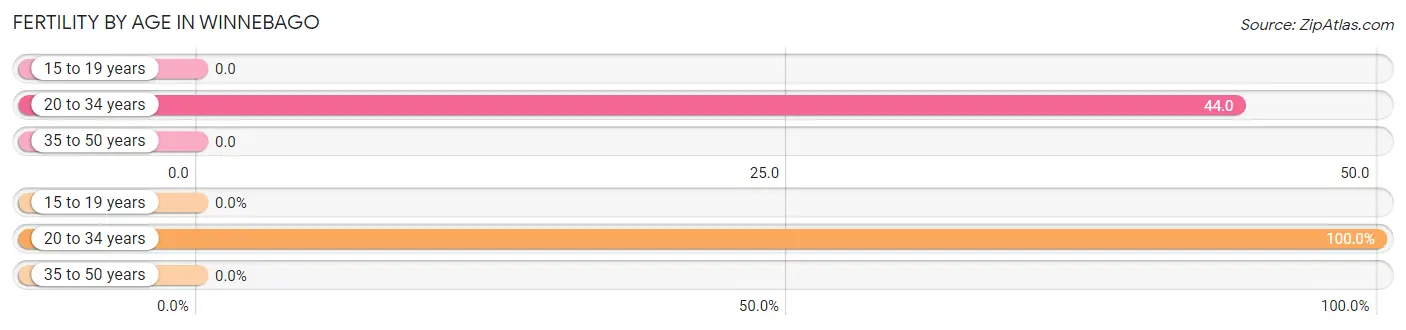
Fertility by Age in Winnebago
Average fertility rate in Winnebago is 16.0 births per 1,000 women. Women in the age bracket of 20 to 34 years have the highest fertility rate with 44.0 births per 1,000 women. Women in the age bracket of 20 to 34 years acount for 100.0% of all women with births.
| Age Bracket | Women with Births | Births / 1,000 Women |
| 15 to 19 years | 0 (0.0%) | 0.0 |
| 20 to 34 years | 4 (100.0%) | 44.0 |
| 35 to 50 years | 0 (0.0%) | 0.0 |
| Total | 4 (100.0%) | 16.0 |
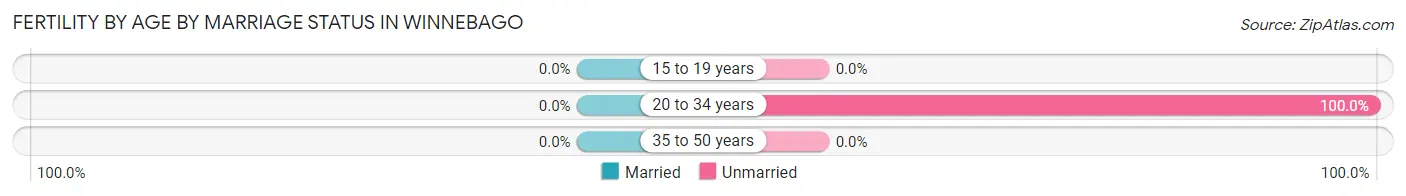
Fertility by Age by Marriage Status in Winnebago
| Age Bracket | Married | Unmarried |
| 15 to 19 years | 0 (0.0%) | 0 (0.0%) |
| 20 to 34 years | 0 (0.0%) | 4 (100.0%) |
| 35 to 50 years | 0 (0.0%) | 0 (0.0%) |
| Total | 0 (0.0%) | 4 (100.0%) |
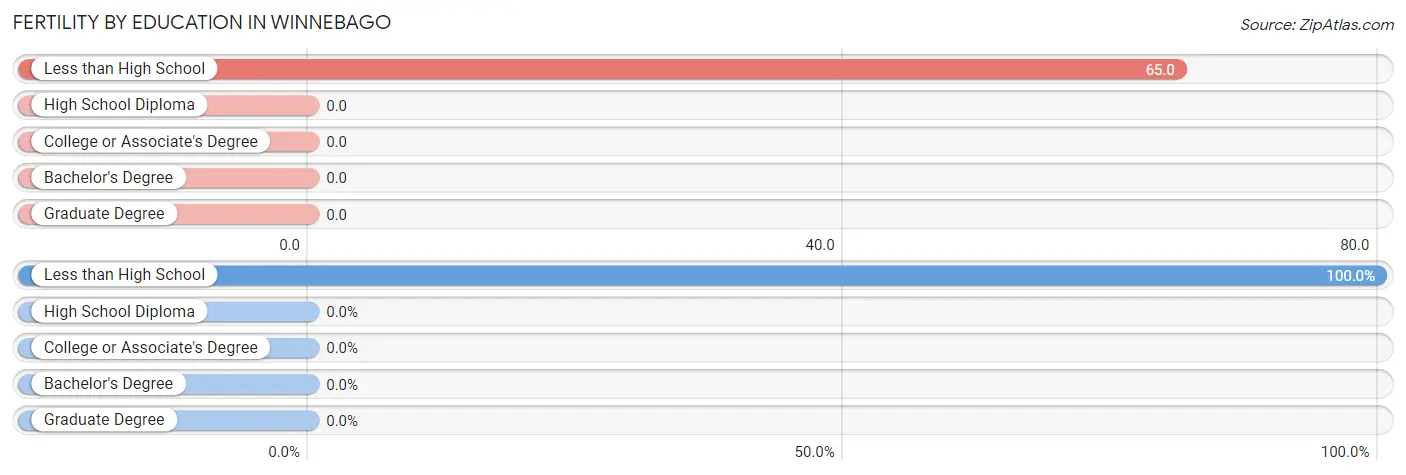
Fertility by Education in Winnebago
| Educational Attainment | Women with Births | Births / 1,000 Women |
| Less than High School | 4 (100.0%) | 65.0 |
| High School Diploma | 0 (0.0%) | 0.0 |
| College or Associate's Degree | 0 (0.0%) | 0.0 |
| Bachelor's Degree | 0 (0.0%) | 0.0 |
| Graduate Degree | 0 (0.0%) | 0.0 |
| Total | 4 (100.0%) | 16.0 |
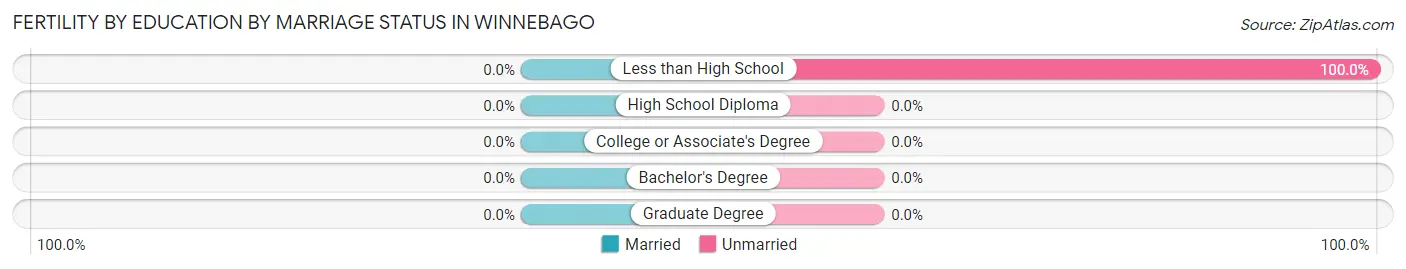
Fertility by Education by Marriage Status in Winnebago
| Educational Attainment | Married | Unmarried |
| Less than High School | 0 (0.0%) | 4 (100.0%) |
| High School Diploma | 0 (0.0%) | 0 (0.0%) |
| College or Associate's Degree | 0 (0.0%) | 0 (0.0%) |
| Bachelor's Degree | 0 (0.0%) | 0 (0.0%) |
| Graduate Degree | 0 (0.0%) | 0 (0.0%) |
| Total | 0 (0.0%) | 4 (100.0%) |
Employment Characteristics in Winnebago
Employment by Class of Employer in Winnebago
Among the 607 employed individuals in Winnebago, private company employees (381 | 62.8%), local government employees (72 | 11.9%), and not-for-profit organizations (66 | 10.9%) make up the most common classes of employment.
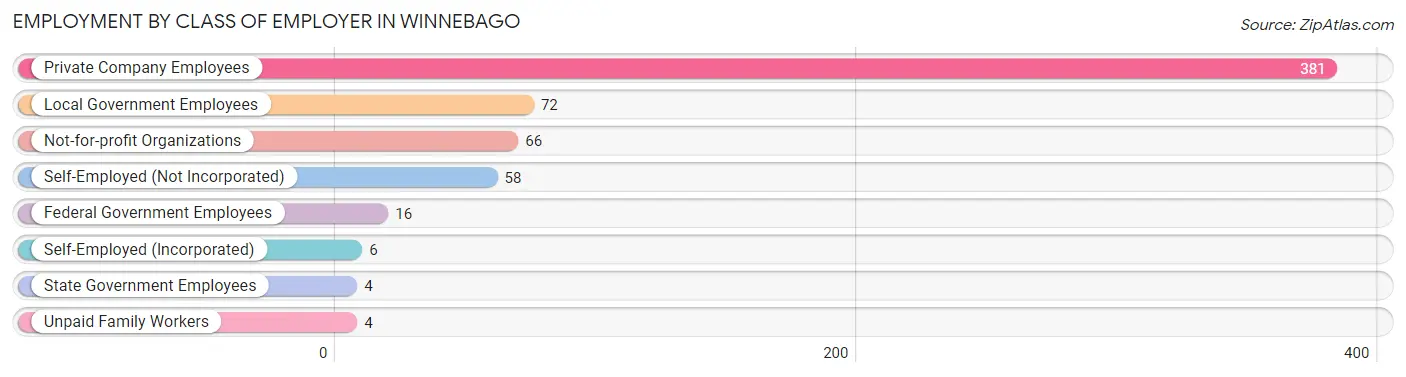
| Employer Class | # Employees | % Employees |
| Private Company Employees | 381 | 62.8% |
| Self-Employed (Incorporated) | 6 | 1.0% |
| Self-Employed (Not Incorporated) | 58 | 9.6% |
| Not-for-profit Organizations | 66 | 10.9% |
| Local Government Employees | 72 | 11.9% |
| State Government Employees | 4 | 0.7% |
| Federal Government Employees | 16 | 2.6% |
| Unpaid Family Workers | 4 | 0.7% |
| Total | 607 | 100.0% |
Employment Status by Age in Winnebago
According to the labor force statistics for Winnebago, out of the total population over 16 years of age (1,070), 62.1% or 664 individuals are in the labor force, with 6.1% or 41 of them unemployed. The age group with the highest labor force participation rate is 25 to 29 years, with 100.0% or 32 individuals in the labor force. Within the labor force, the 16 to 19 years age range has the highest percentage of unemployed individuals, with 31.3% or 11 of them being unemployed.
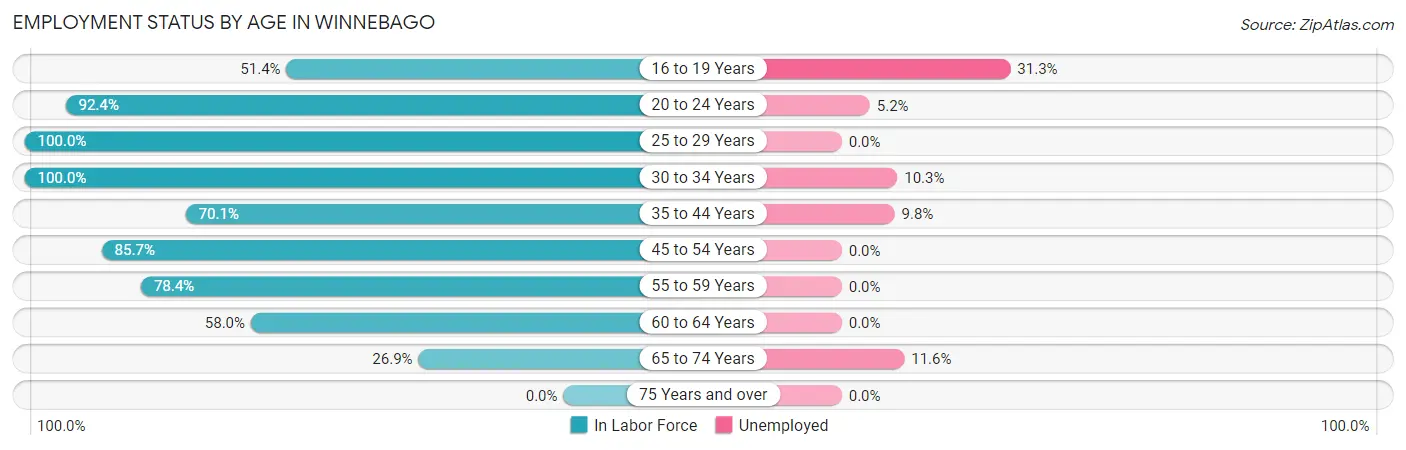
| Age Bracket | In Labor Force | Unemployed |
| 16 to 19 Years | 36 (51.4%) | 11 (31.3%) |
| 20 to 24 Years | 134 (92.4%) | 7 (5.2%) |
| 25 to 29 Years | 32 (100.0%) | 0 (0.0%) |
| 30 to 34 Years | 58 (100.0%) | 6 (10.3%) |
| 35 to 44 Years | 122 (70.1%) | 12 (9.8%) |
| 45 to 54 Years | 84 (85.7%) | 0 (0.0%) |
| 55 to 59 Years | 91 (78.4%) | 0 (0.0%) |
| 60 to 64 Years | 65 (58.0%) | 0 (0.0%) |
| 65 to 74 Years | 43 (26.9%) | 5 (11.6%) |
| 75 Years and over | 0 (0.0%) | 0 (0.0%) |
| Total | 664 (62.1%) | 41 (6.1%) |
Employment Status by Educational Attainment in Winnebago
According to labor force statistics for Winnebago, 76.6% of individuals (452) out of the total population between 25 and 64 years of age (590) are in the labor force, with 4.0% or 18 of them being unemployed. The group with the highest labor force participation rate are those with the educational attainment of bachelor's degree or higher, with 96.4% or 81 individuals in the labor force. Within the labor force, individuals with high school diploma education have the highest percentage of unemployment, with 5.9% or 11 of them being unemployed.
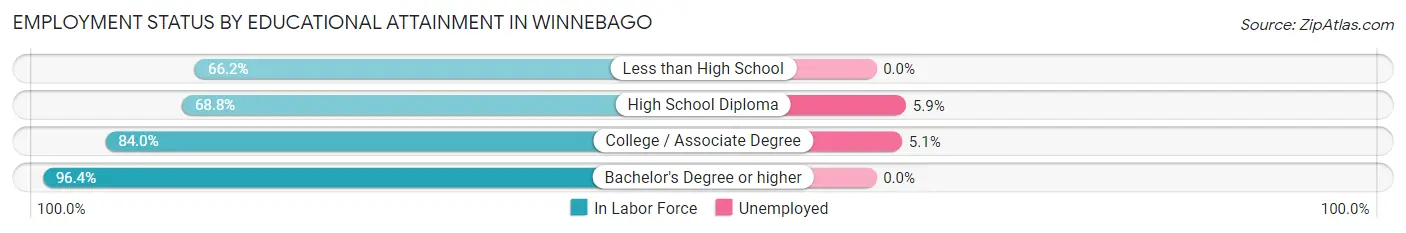
| Educational Attainment | In Labor Force | Unemployed |
| Less than High School | 49 (66.2%) | 0 (0.0%) |
| High School Diploma | 185 (68.8%) | 16 (5.9%) |
| College / Associate Degree | 137 (84.0%) | 8 (5.1%) |
| Bachelor's Degree or higher | 81 (96.4%) | 0 (0.0%) |
| Total | 452 (76.6%) | 24 (4.0%) |
Employment Occupations by Sex in Winnebago
Management, Business, Science and Arts Occupations
The most common Management, Business, Science and Arts occupations in Winnebago are Management (43 | 6.9%), Health Diagnosing & Treating (37 | 6.0%), Community & Social Service (34 | 5.5%), Health Technologists (27 | 4.3%), and Education Instruction & Library (23 | 3.7%).
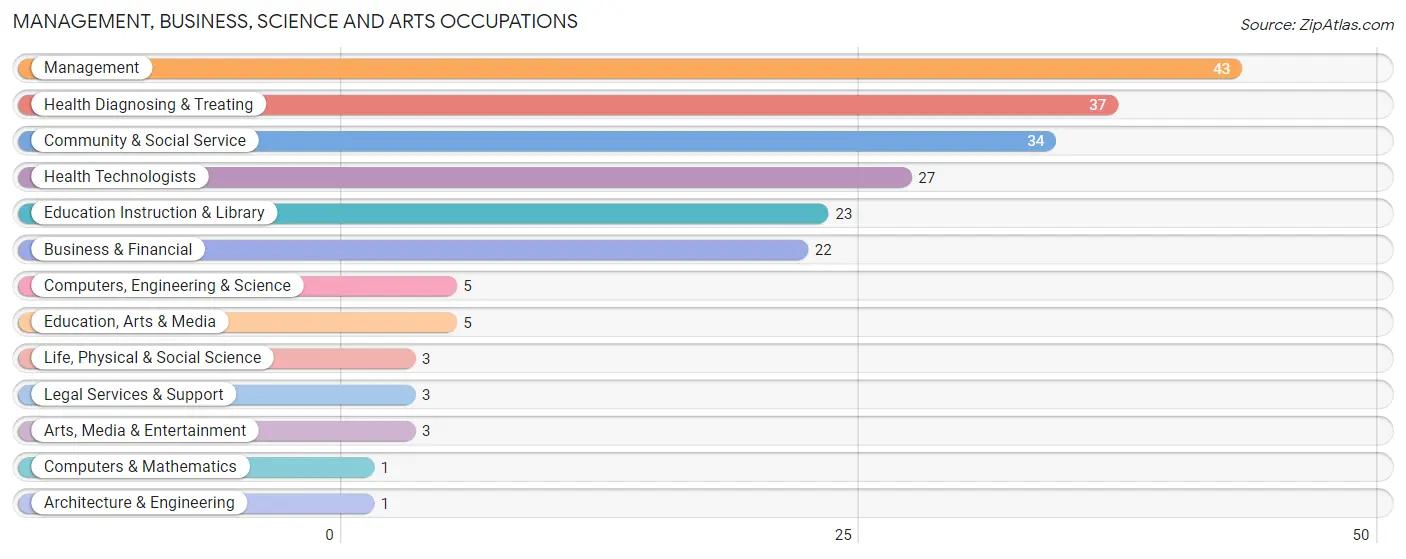
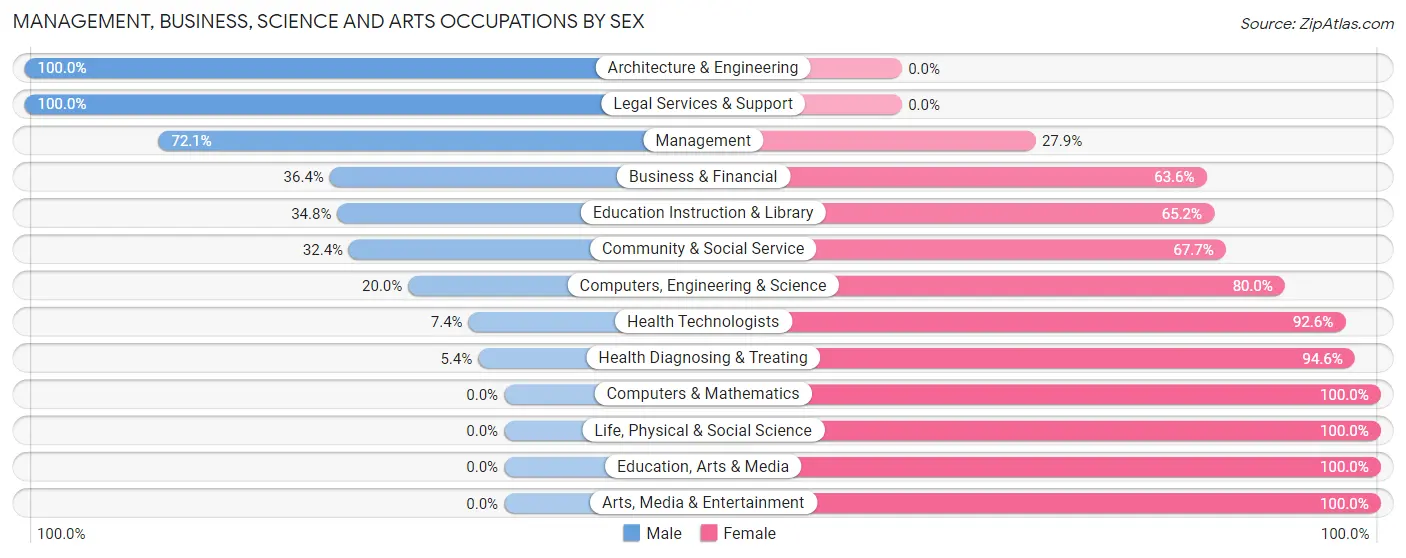
Management, Business, Science and Arts Occupations by Sex
Within the Management, Business, Science and Arts occupations in Winnebago, the most male-oriented occupations are Architecture & Engineering (100.0%), Legal Services & Support (100.0%), and Management (72.1%), while the most female-oriented occupations are Computers & Mathematics (100.0%), Life, Physical & Social Science (100.0%), and Education, Arts & Media (100.0%).
| Occupation | Male | Female |
| Management | 31 (72.1%) | 12 (27.9%) |
| Business & Financial | 8 (36.4%) | 14 (63.6%) |
| Computers, Engineering & Science | 1 (20.0%) | 4 (80.0%) |
| Computers & Mathematics | 0 (0.0%) | 1 (100.0%) |
| Architecture & Engineering | 1 (100.0%) | 0 (0.0%) |
| Life, Physical & Social Science | 0 (0.0%) | 3 (100.0%) |
| Community & Social Service | 11 (32.4%) | 23 (67.6%) |
| Education, Arts & Media | 0 (0.0%) | 5 (100.0%) |
| Legal Services & Support | 3 (100.0%) | 0 (0.0%) |
| Education Instruction & Library | 8 (34.8%) | 15 (65.2%) |
| Arts, Media & Entertainment | 0 (0.0%) | 3 (100.0%) |
| Health Diagnosing & Treating | 2 (5.4%) | 35 (94.6%) |
| Health Technologists | 2 (7.4%) | 25 (92.6%) |
| Total (Category) | 53 (37.6%) | 88 (62.4%) |
| Total (Overall) | 352 (56.7%) | 269 (43.3%) |
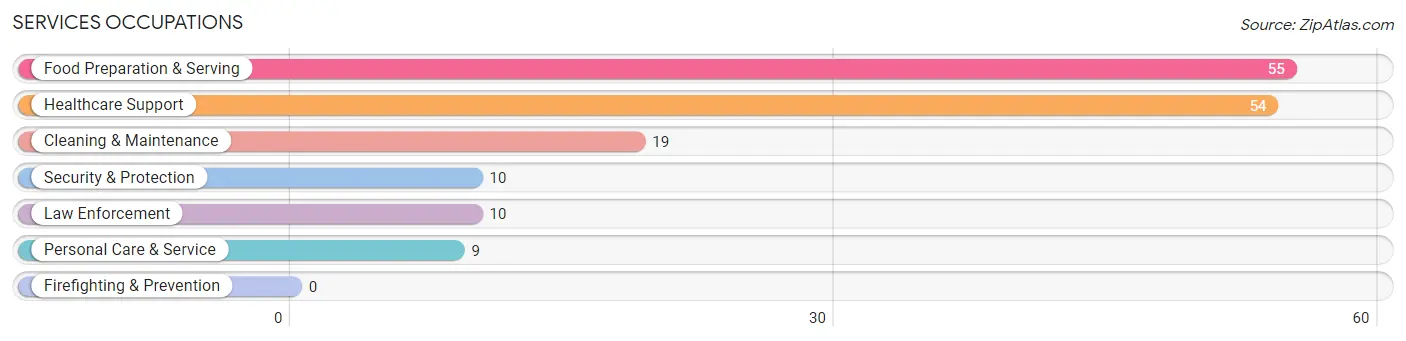
Services Occupations
The most common Services occupations in Winnebago are Food Preparation & Serving (55 | 8.9%), Healthcare Support (54 | 8.7%), Cleaning & Maintenance (19 | 3.1%), Security & Protection (10 | 1.6%), and Law Enforcement (10 | 1.6%).
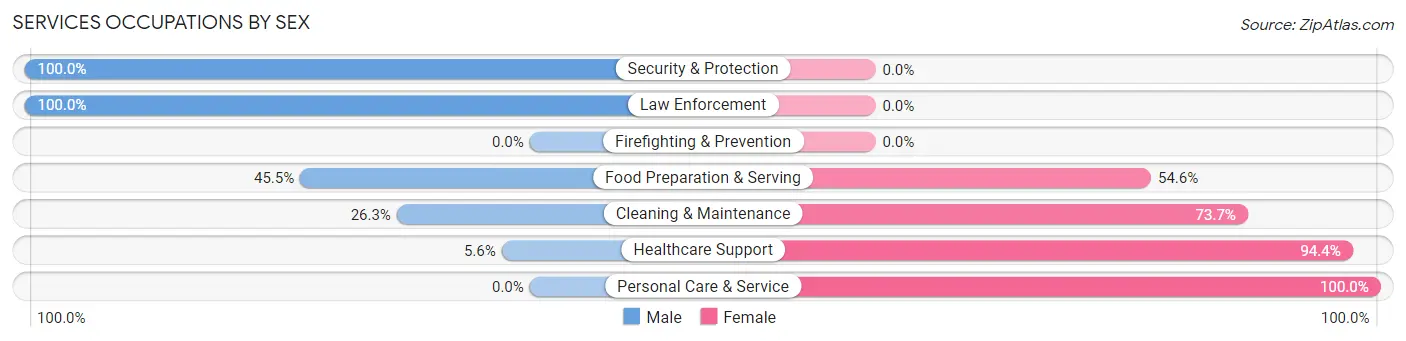
Services Occupations by Sex
Within the Services occupations in Winnebago, the most male-oriented occupations are Security & Protection (100.0%), Law Enforcement (100.0%), and Food Preparation & Serving (45.5%), while the most female-oriented occupations are Personal Care & Service (100.0%), Healthcare Support (94.4%), and Cleaning & Maintenance (73.7%).
| Occupation | Male | Female |
| Healthcare Support | 3 (5.6%) | 51 (94.4%) |
| Security & Protection | 10 (100.0%) | 0 (0.0%) |
| Firefighting & Prevention | 0 (0.0%) | 0 (0.0%) |
| Law Enforcement | 10 (100.0%) | 0 (0.0%) |
| Food Preparation & Serving | 25 (45.5%) | 30 (54.5%) |
| Cleaning & Maintenance | 5 (26.3%) | 14 (73.7%) |
| Personal Care & Service | 0 (0.0%) | 9 (100.0%) |
| Total (Category) | 43 (29.2%) | 104 (70.8%) |
| Total (Overall) | 352 (56.7%) | 269 (43.3%) |
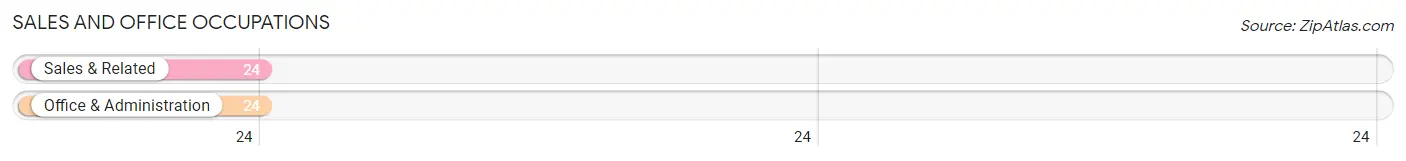
Sales and Office Occupations
The most common Sales and Office occupations in Winnebago are Sales & Related (24 | 3.9%), and Office & Administration (24 | 3.9%).
Sales and Office Occupations by Sex

| Occupation | Male | Female |
| Sales & Related | 16 (66.7%) | 8 (33.3%) |
| Office & Administration | 3 (12.5%) | 21 (87.5%) |
| Total (Category) | 19 (39.6%) | 29 (60.4%) |
| Total (Overall) | 352 (56.7%) | 269 (43.3%) |
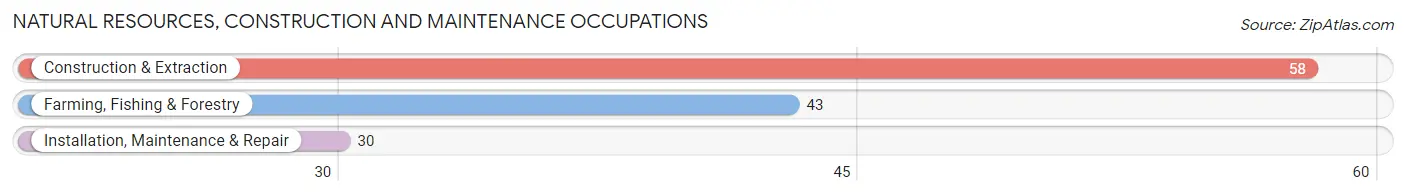
Natural Resources, Construction and Maintenance Occupations
The most common Natural Resources, Construction and Maintenance occupations in Winnebago are Construction & Extraction (58 | 9.3%), Farming, Fishing & Forestry (43 | 6.9%), and Installation, Maintenance & Repair (30 | 4.8%).
Natural Resources, Construction and Maintenance Occupations by Sex
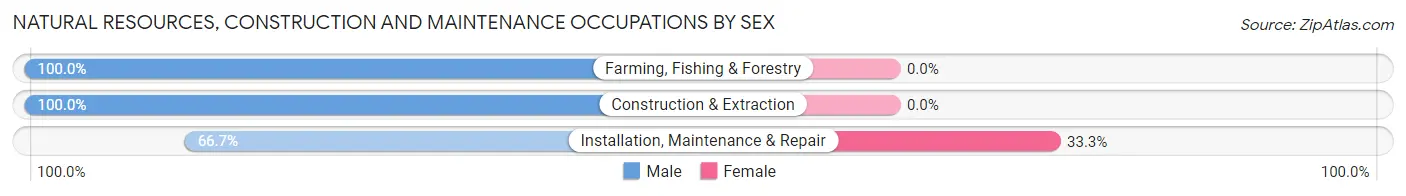
| Occupation | Male | Female |
| Farming, Fishing & Forestry | 43 (100.0%) | 0 (0.0%) |
| Construction & Extraction | 58 (100.0%) | 0 (0.0%) |
| Installation, Maintenance & Repair | 20 (66.7%) | 10 (33.3%) |
| Total (Category) | 121 (92.4%) | 10 (7.6%) |
| Total (Overall) | 352 (56.7%) | 269 (43.3%) |
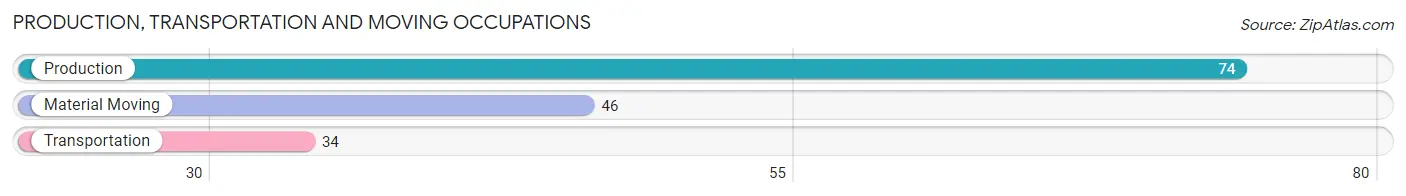
Production, Transportation and Moving Occupations
The most common Production, Transportation and Moving occupations in Winnebago are Production (74 | 11.9%), Material Moving (46 | 7.4%), and Transportation (34 | 5.5%).
Production, Transportation and Moving Occupations by Sex
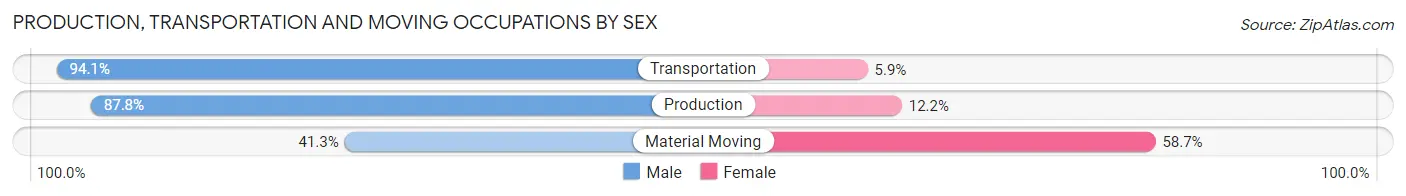
| Occupation | Male | Female |
| Production | 65 (87.8%) | 9 (12.2%) |
| Transportation | 32 (94.1%) | 2 (5.9%) |
| Material Moving | 19 (41.3%) | 27 (58.7%) |
| Total (Category) | 116 (75.3%) | 38 (24.7%) |
| Total (Overall) | 352 (56.7%) | 269 (43.3%) |
Employment Industries by Sex in Winnebago
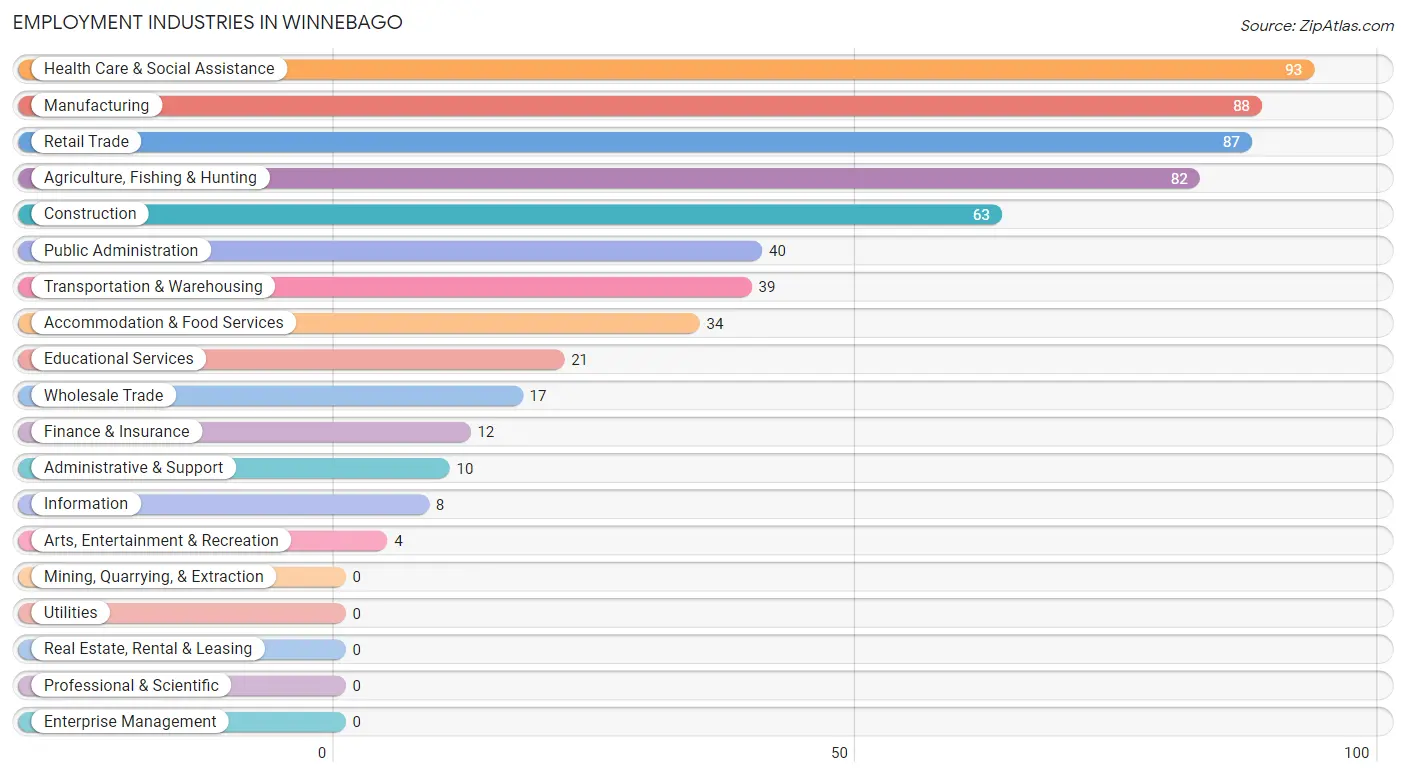
Employment Industries in Winnebago
The major employment industries in Winnebago include Health Care & Social Assistance (93 | 15.0%), Manufacturing (88 | 14.2%), Retail Trade (87 | 14.0%), Agriculture, Fishing & Hunting (82 | 13.2%), and Construction (63 | 10.1%).
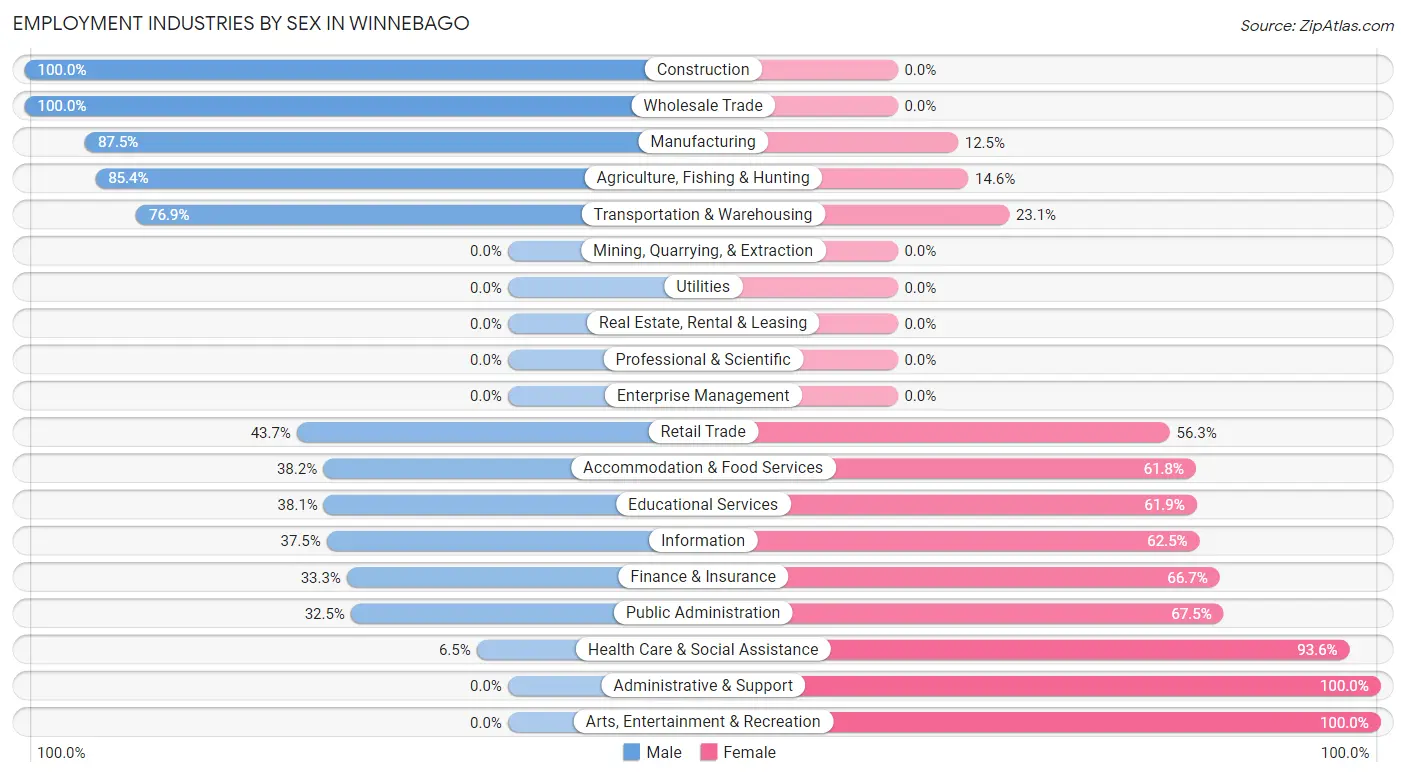
Employment Industries by Sex in Winnebago
The Winnebago industries that see more men than women are Construction (100.0%), Wholesale Trade (100.0%), and Manufacturing (87.5%), whereas the industries that tend to have a higher number of women are Administrative & Support (100.0%), Arts, Entertainment & Recreation (100.0%), and Health Care & Social Assistance (93.5%).
| Industry | Male | Female |
| Agriculture, Fishing & Hunting | 70 (85.4%) | 12 (14.6%) |
| Mining, Quarrying, & Extraction | 0 (0.0%) | 0 (0.0%) |
| Construction | 63 (100.0%) | 0 (0.0%) |
| Manufacturing | 77 (87.5%) | 11 (12.5%) |
| Wholesale Trade | 17 (100.0%) | 0 (0.0%) |
| Retail Trade | 38 (43.7%) | 49 (56.3%) |
| Transportation & Warehousing | 30 (76.9%) | 9 (23.1%) |
| Utilities | 0 (0.0%) | 0 (0.0%) |
| Information | 3 (37.5%) | 5 (62.5%) |
| Finance & Insurance | 4 (33.3%) | 8 (66.7%) |
| Real Estate, Rental & Leasing | 0 (0.0%) | 0 (0.0%) |
| Professional & Scientific | 0 (0.0%) | 0 (0.0%) |
| Enterprise Management | 0 (0.0%) | 0 (0.0%) |
| Administrative & Support | 0 (0.0%) | 10 (100.0%) |
| Educational Services | 8 (38.1%) | 13 (61.9%) |
| Health Care & Social Assistance | 6 (6.5%) | 87 (93.5%) |
| Arts, Entertainment & Recreation | 0 (0.0%) | 4 (100.0%) |
| Accommodation & Food Services | 13 (38.2%) | 21 (61.8%) |
| Public Administration | 13 (32.5%) | 27 (67.5%) |
| Total | 352 (56.7%) | 269 (43.3%) |
Education in Winnebago
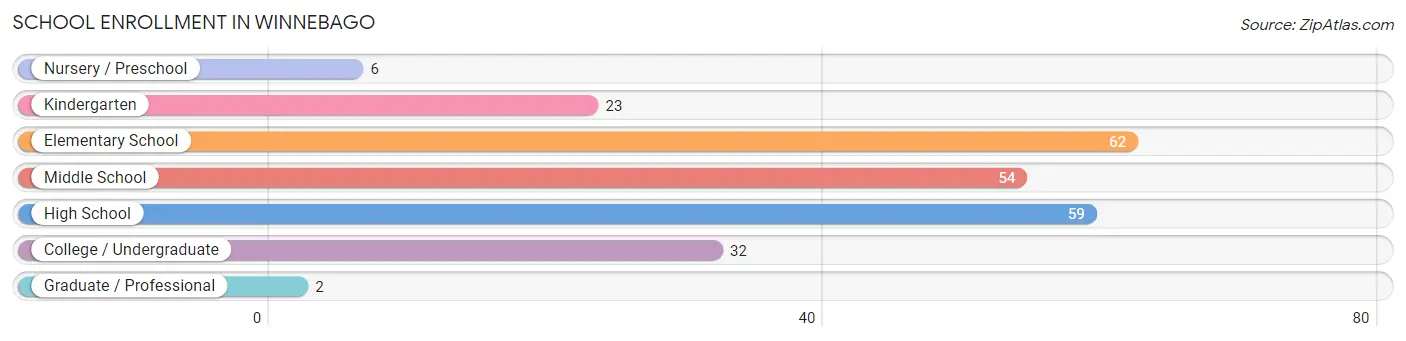
School Enrollment in Winnebago
The most common levels of schooling among the 238 students in Winnebago are elementary school (62 | 26.1%), high school (59 | 24.8%), and middle school (54 | 22.7%).
| School Level | # Students | % Students |
| Nursery / Preschool | 6 | 2.5% |
| Kindergarten | 23 | 9.7% |
| Elementary School | 62 | 26.1% |
| Middle School | 54 | 22.7% |
| High School | 59 | 24.8% |
| College / Undergraduate | 32 | 13.5% |
| Graduate / Professional | 2 | 0.8% |
| Total | 238 | 100.0% |
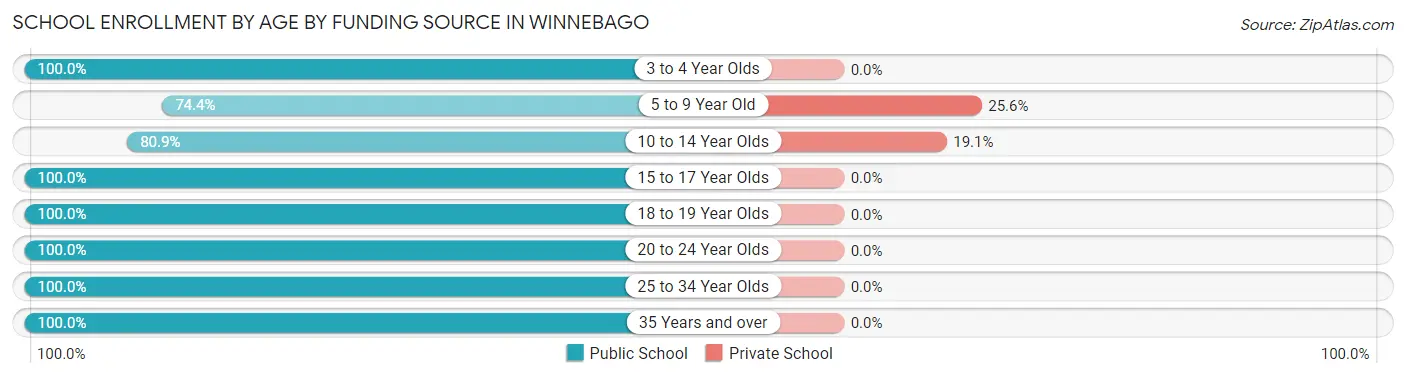
School Enrollment by Age by Funding Source in Winnebago
Out of a total of 238 students who are enrolled in schools in Winnebago, 33 (13.9%) attend a private institution, while the remaining 205 (86.1%) are enrolled in public schools. The age group of 5 to 9 year old has the highest likelihood of being enrolled in private schools, with 20 (25.6% in the age bracket) enrolled. Conversely, the age group of 3 to 4 year olds has the lowest likelihood of being enrolled in a private school, with 3 (100.0% in the age bracket) attending a public institution.
| Age Bracket | Public School | Private School |
| 3 to 4 Year Olds | 3 (100.0%) | 0 (0.0%) |
| 5 to 9 Year Old | 58 (74.4%) | 20 (25.6%) |
| 10 to 14 Year Olds | 55 (80.9%) | 13 (19.1%) |
| 15 to 17 Year Olds | 29 (100.0%) | 0 (0.0%) |
| 18 to 19 Year Olds | 33 (100.0%) | 0 (0.0%) |
| 20 to 24 Year Olds | 15 (100.0%) | 0 (0.0%) |
| 25 to 34 Year Olds | 9 (100.0%) | 0 (0.0%) |
| 35 Years and over | 3 (100.0%) | 0 (0.0%) |
| Total | 205 (86.1%) | 33 (13.9%) |
Educational Attainment by Field of Study in Winnebago
Science & technology (32 | 24.1%), business (21 | 15.8%), education (21 | 15.8%), arts & humanities (15 | 11.3%), and social sciences (13 | 9.8%) are the most common fields of study among 133 individuals in Winnebago who have obtained a bachelor's degree or higher.
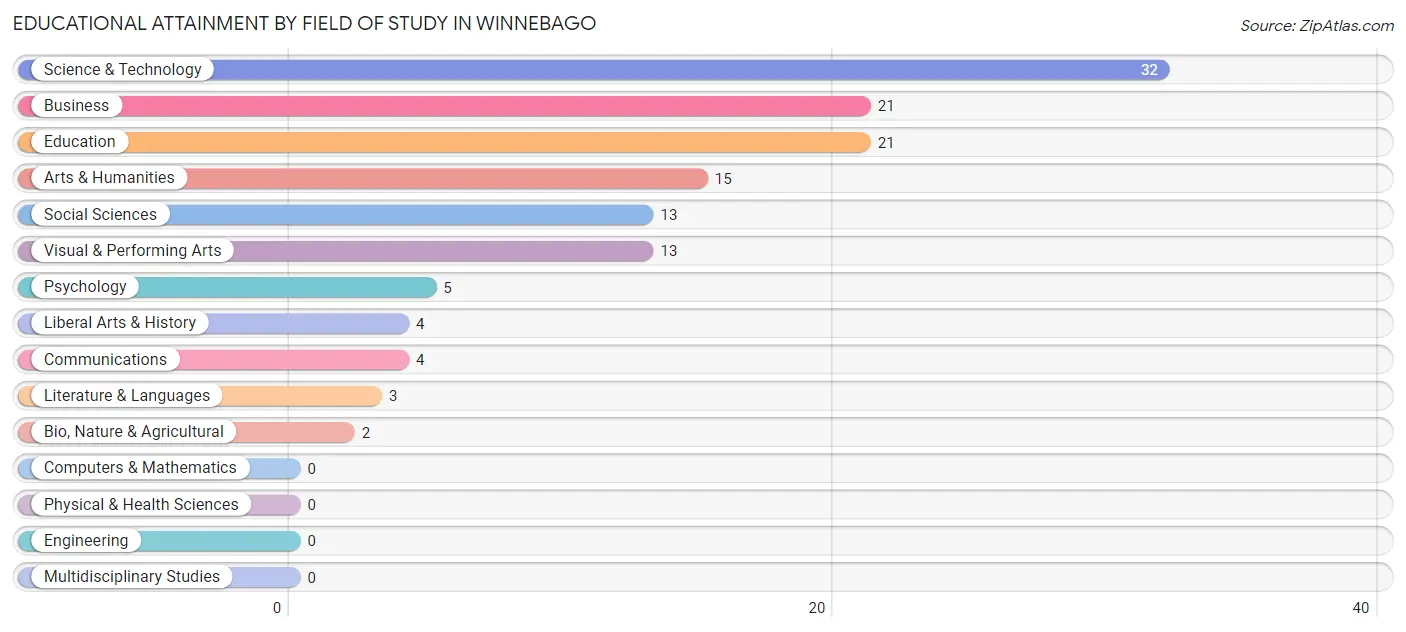
| Field of Study | # Graduates | % Graduates |
| Computers & Mathematics | 0 | 0.0% |
| Bio, Nature & Agricultural | 2 | 1.5% |
| Physical & Health Sciences | 0 | 0.0% |
| Psychology | 5 | 3.8% |
| Social Sciences | 13 | 9.8% |
| Engineering | 0 | 0.0% |
| Multidisciplinary Studies | 0 | 0.0% |
| Science & Technology | 32 | 24.1% |
| Business | 21 | 15.8% |
| Education | 21 | 15.8% |
| Literature & Languages | 3 | 2.3% |
| Liberal Arts & History | 4 | 3.0% |
| Visual & Performing Arts | 13 | 9.8% |
| Communications | 4 | 3.0% |
| Arts & Humanities | 15 | 11.3% |
| Total | 133 | 100.0% |
Transportation & Commute in Winnebago
Vehicle Availability by Sex in Winnebago
The most prevalent vehicle ownership categories in Winnebago are males with 2 vehicles (120, accounting for 35.5%) and females with 2 vehicles (131, making up 44.6%).
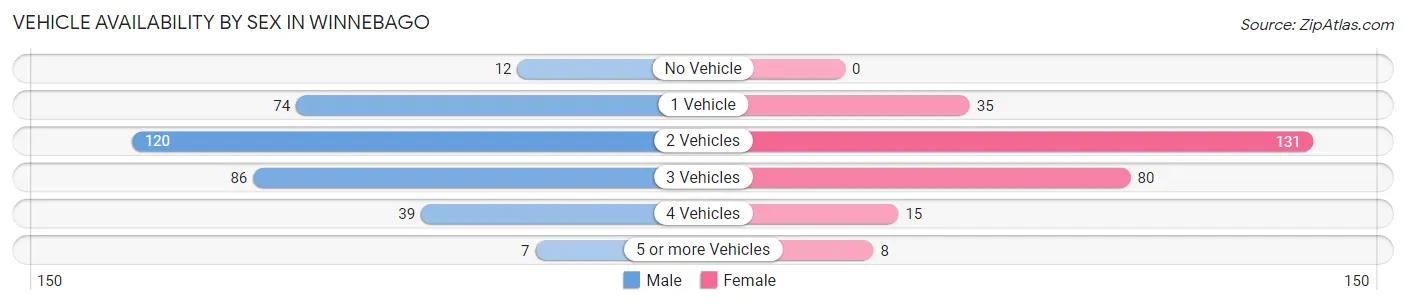
| Vehicles Available | Male | Female |
| No Vehicle | 12 (3.5%) | 0 (0.0%) |
| 1 Vehicle | 74 (21.9%) | 35 (13.0%) |
| 2 Vehicles | 120 (35.5%) | 131 (48.7%) |
| 3 Vehicles | 86 (25.4%) | 80 (29.7%) |
| 4 Vehicles | 39 (11.5%) | 15 (5.6%) |
| 5 or more Vehicles | 7 (2.1%) | 8 (3.0%) |
| Total | 338 (100.0%) | 269 (100.0%) |
Commute Time in Winnebago
The most frequently occuring commute durations in Winnebago are 15 to 19 minutes (133 commuters, 22.5%), 5 to 9 minutes (86 commuters, 14.5%), and less than 5 minutes (71 commuters, 12.0%).
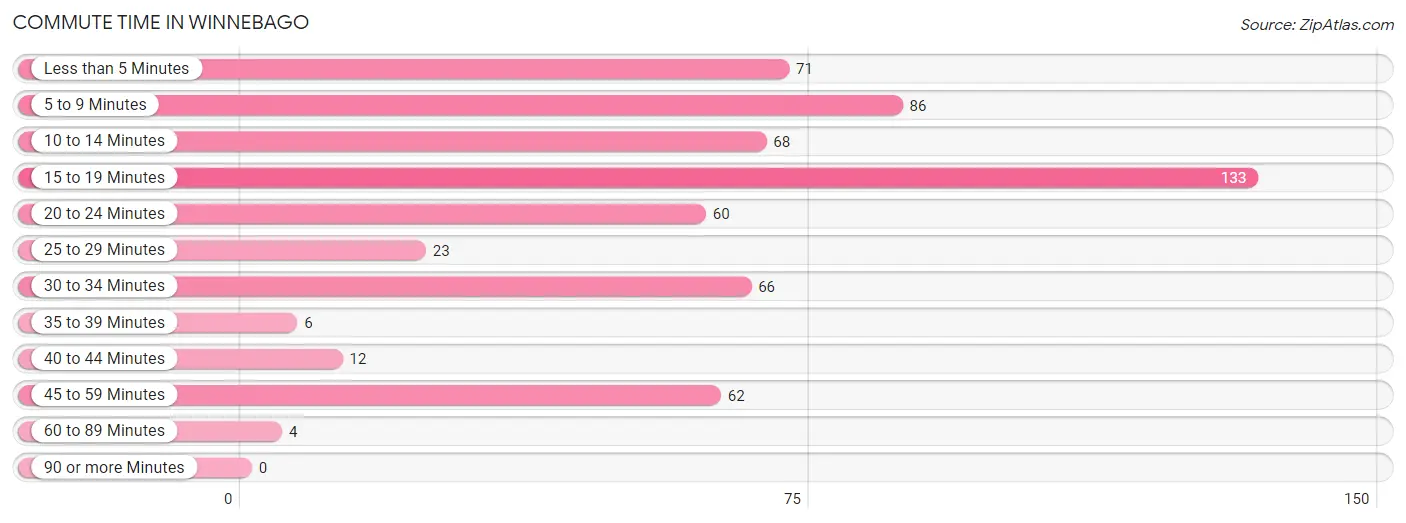
| Commute Time | # Commuters | % Commuters |
| Less than 5 Minutes | 71 | 12.0% |
| 5 to 9 Minutes | 86 | 14.5% |
| 10 to 14 Minutes | 68 | 11.5% |
| 15 to 19 Minutes | 133 | 22.5% |
| 20 to 24 Minutes | 60 | 10.2% |
| 25 to 29 Minutes | 23 | 3.9% |
| 30 to 34 Minutes | 66 | 11.2% |
| 35 to 39 Minutes | 6 | 1.0% |
| 40 to 44 Minutes | 12 | 2.0% |
| 45 to 59 Minutes | 62 | 10.5% |
| 60 to 89 Minutes | 4 | 0.7% |
| 90 or more Minutes | 0 | 0.0% |
Commute Time by Sex in Winnebago
The most common commute times in Winnebago are 15 to 19 minutes (81 commuters, 24.0%) for males and 15 to 19 minutes (52 commuters, 20.5%) for females.
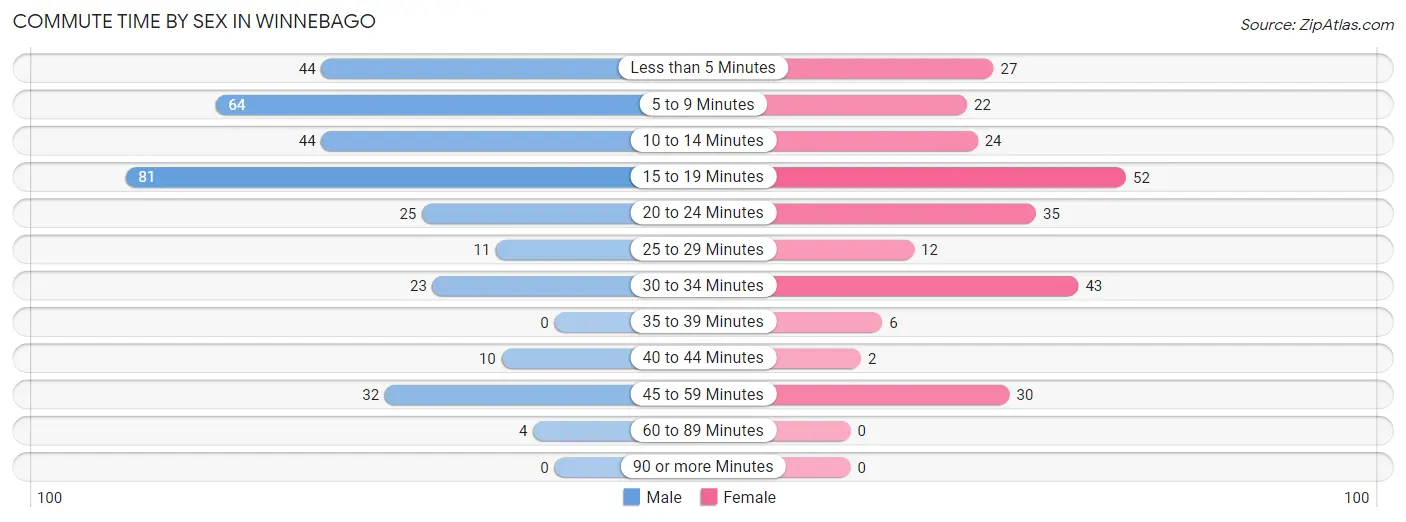
| Commute Time | Male | Female |
| Less than 5 Minutes | 44 (13.0%) | 27 (10.7%) |
| 5 to 9 Minutes | 64 (18.9%) | 22 (8.7%) |
| 10 to 14 Minutes | 44 (13.0%) | 24 (9.5%) |
| 15 to 19 Minutes | 81 (24.0%) | 52 (20.5%) |
| 20 to 24 Minutes | 25 (7.4%) | 35 (13.8%) |
| 25 to 29 Minutes | 11 (3.3%) | 12 (4.7%) |
| 30 to 34 Minutes | 23 (6.8%) | 43 (17.0%) |
| 35 to 39 Minutes | 0 (0.0%) | 6 (2.4%) |
| 40 to 44 Minutes | 10 (3.0%) | 2 (0.8%) |
| 45 to 59 Minutes | 32 (9.5%) | 30 (11.9%) |
| 60 to 89 Minutes | 4 (1.2%) | 0 (0.0%) |
| 90 or more Minutes | 0 (0.0%) | 0 (0.0%) |
Time of Departure to Work by Sex in Winnebago
The most frequent times of departure to work in Winnebago are 4:00 PM to 11:59 PM (70, 20.7%) for males and 4:00 PM to 11:59 PM (50, 19.8%) for females.
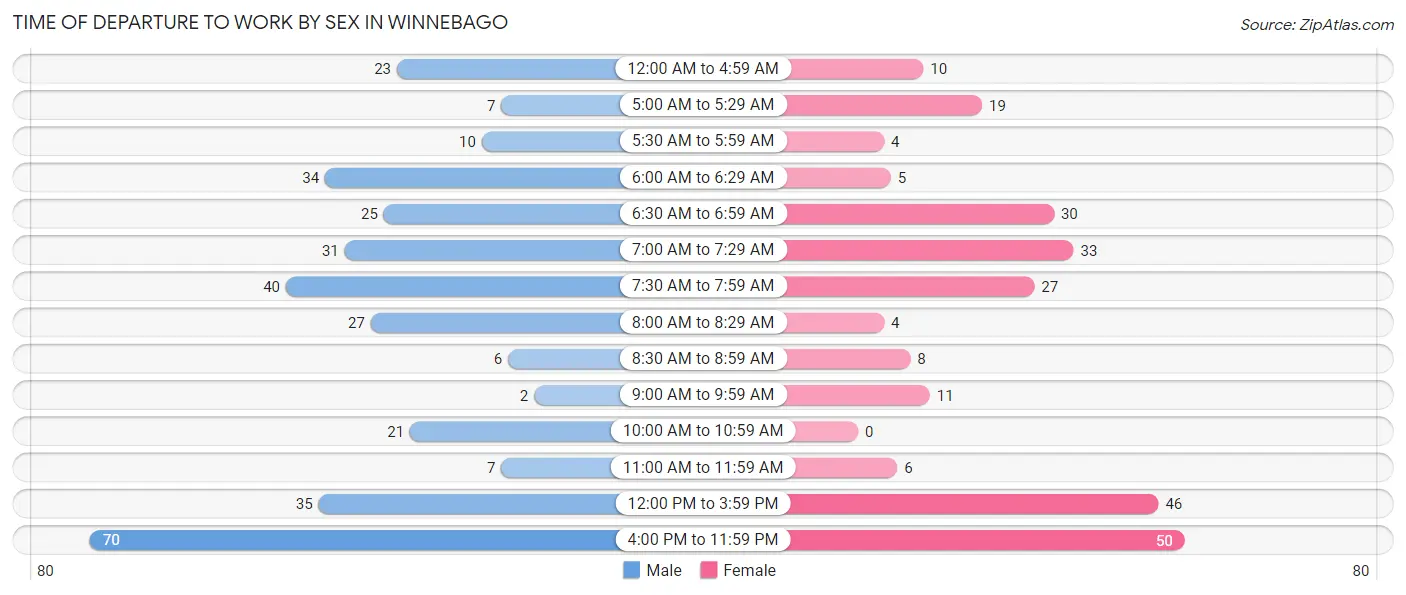
| Time of Departure | Male | Female |
| 12:00 AM to 4:59 AM | 23 (6.8%) | 10 (4.0%) |
| 5:00 AM to 5:29 AM | 7 (2.1%) | 19 (7.5%) |
| 5:30 AM to 5:59 AM | 10 (3.0%) | 4 (1.6%) |
| 6:00 AM to 6:29 AM | 34 (10.1%) | 5 (2.0%) |
| 6:30 AM to 6:59 AM | 25 (7.4%) | 30 (11.9%) |
| 7:00 AM to 7:29 AM | 31 (9.2%) | 33 (13.0%) |
| 7:30 AM to 7:59 AM | 40 (11.8%) | 27 (10.7%) |
| 8:00 AM to 8:29 AM | 27 (8.0%) | 4 (1.6%) |
| 8:30 AM to 8:59 AM | 6 (1.8%) | 8 (3.2%) |
| 9:00 AM to 9:59 AM | 2 (0.6%) | 11 (4.3%) |
| 10:00 AM to 10:59 AM | 21 (6.2%) | 0 (0.0%) |
| 11:00 AM to 11:59 AM | 7 (2.1%) | 6 (2.4%) |
| 12:00 PM to 3:59 PM | 35 (10.4%) | 46 (18.2%) |
| 4:00 PM to 11:59 PM | 70 (20.7%) | 50 (19.8%) |
| Total | 338 (100.0%) | 253 (100.0%) |
Housing Occupancy in Winnebago
Occupancy by Ownership in Winnebago
Of the total 539 dwellings in Winnebago, owner-occupied units account for 425 (78.8%), while renter-occupied units make up 114 (21.1%).
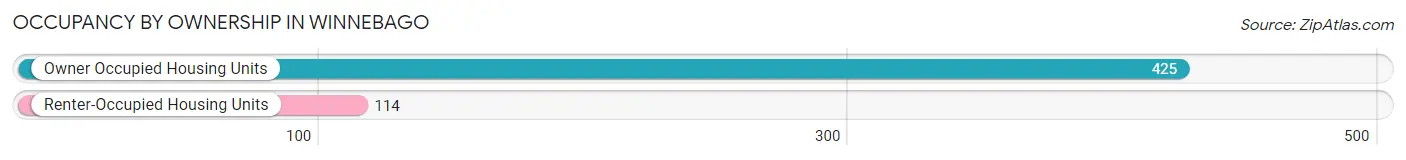
| Occupancy | # Housing Units | % Housing Units |
| Owner Occupied Housing Units | 425 | 78.8% |
| Renter-Occupied Housing Units | 114 | 21.1% |
| Total Occupied Housing Units | 539 | 100.0% |
Occupancy by Household Size in Winnebago
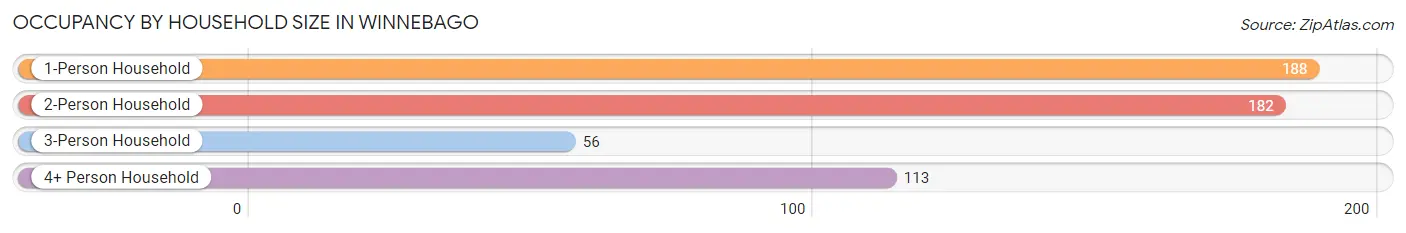
| Household Size | # Housing Units | % Housing Units |
| 1-Person Household | 188 | 34.9% |
| 2-Person Household | 182 | 33.8% |
| 3-Person Household | 56 | 10.4% |
| 4+ Person Household | 113 | 21.0% |
| Total Housing Units | 539 | 100.0% |
Occupancy by Ownership by Household Size in Winnebago
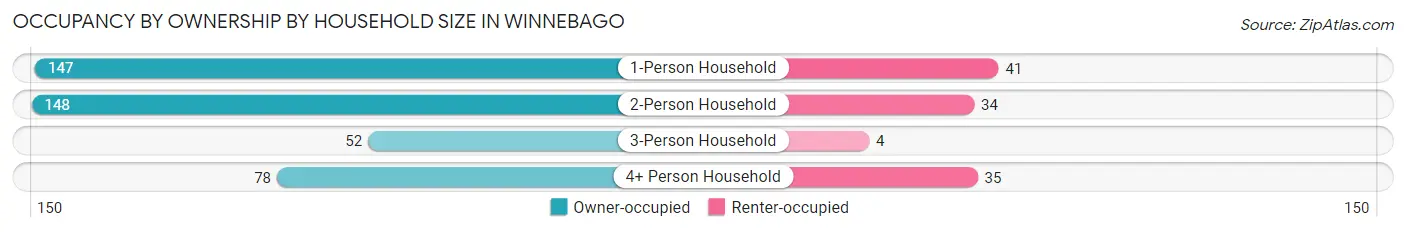
| Household Size | Owner-occupied | Renter-occupied |
| 1-Person Household | 147 (78.2%) | 41 (21.8%) |
| 2-Person Household | 148 (81.3%) | 34 (18.7%) |
| 3-Person Household | 52 (92.9%) | 4 (7.1%) |
| 4+ Person Household | 78 (69.0%) | 35 (31.0%) |
| Total Housing Units | 425 (78.8%) | 114 (21.1%) |
Occupancy by Educational Attainment in Winnebago
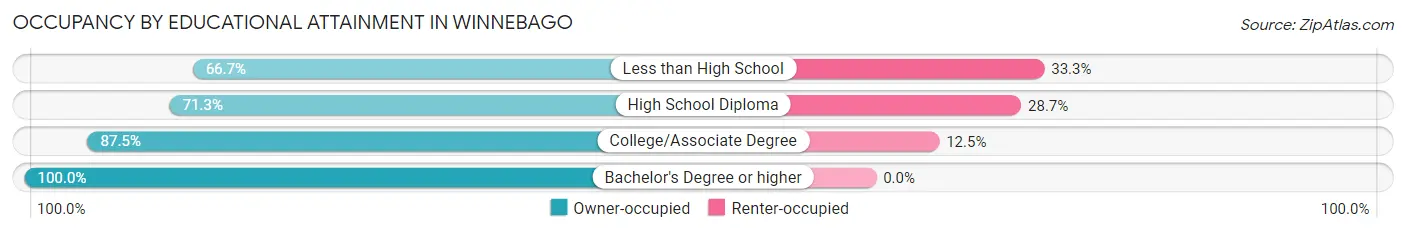
| Household Size | Owner-occupied | Renter-occupied |
| Less than High School | 56 (66.7%) | 28 (33.3%) |
| High School Diploma | 176 (71.3%) | 71 (28.7%) |
| College/Associate Degree | 105 (87.5%) | 15 (12.5%) |
| Bachelor's Degree or higher | 88 (100.0%) | 0 (0.0%) |
Occupancy by Age of Householder in Winnebago
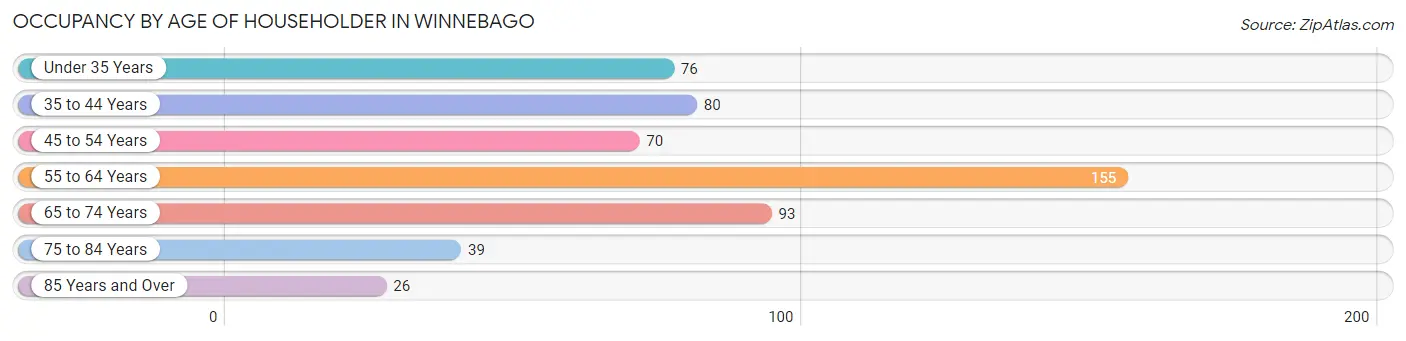
| Age Bracket | # Households | % Households |
| Under 35 Years | 76 | 14.1% |
| 35 to 44 Years | 80 | 14.8% |
| 45 to 54 Years | 70 | 13.0% |
| 55 to 64 Years | 155 | 28.8% |
| 65 to 74 Years | 93 | 17.2% |
| 75 to 84 Years | 39 | 7.2% |
| 85 Years and Over | 26 | 4.8% |
| Total | 539 | 100.0% |
Housing Finances in Winnebago
Median Income by Occupancy in Winnebago
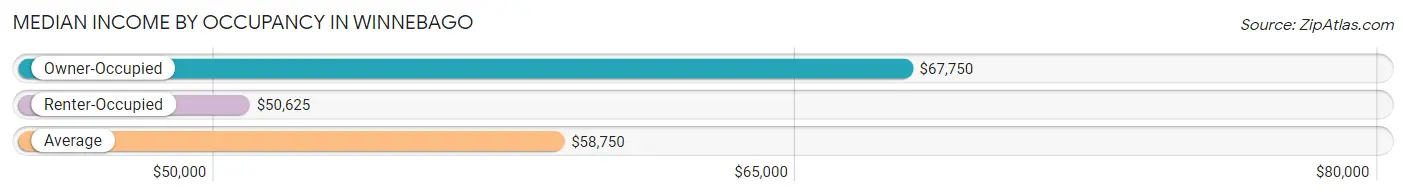
| Occupancy Type | # Households | Median Income |
| Owner-Occupied | 425 (78.8%) | $67,750 |
| Renter-Occupied | 114 (21.1%) | $50,625 |
| Average | 539 (100.0%) | $58,750 |
Occupancy by Householder Income Bracket in Winnebago
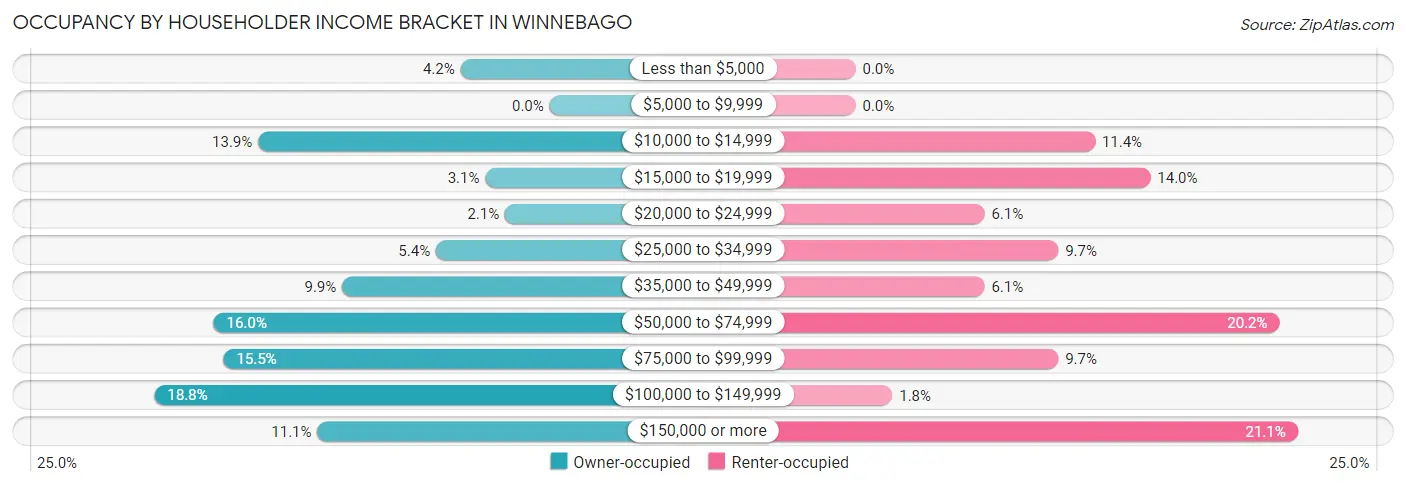
| Income Bracket | Owner-occupied | Renter-occupied |
| Less than $5,000 | 18 (4.2%) | 0 (0.0%) |
| $5,000 to $9,999 | 0 (0.0%) | 0 (0.0%) |
| $10,000 to $14,999 | 59 (13.9%) | 13 (11.4%) |
| $15,000 to $19,999 | 13 (3.1%) | 16 (14.0%) |
| $20,000 to $24,999 | 9 (2.1%) | 7 (6.1%) |
| $25,000 to $34,999 | 23 (5.4%) | 11 (9.7%) |
| $35,000 to $49,999 | 42 (9.9%) | 7 (6.1%) |
| $50,000 to $74,999 | 68 (16.0%) | 23 (20.2%) |
| $75,000 to $99,999 | 66 (15.5%) | 11 (9.7%) |
| $100,000 to $149,999 | 80 (18.8%) | 2 (1.8%) |
| $150,000 or more | 47 (11.1%) | 24 (21.0%) |
| Total | 425 (100.0%) | 114 (100.0%) |
Monthly Housing Cost Tiers in Winnebago
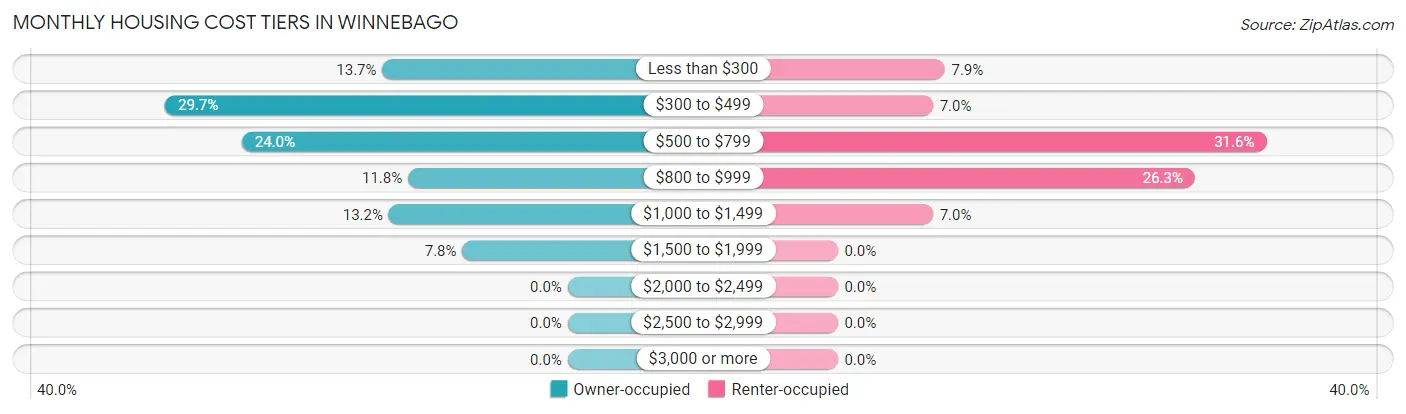
| Monthly Cost | Owner-occupied | Renter-occupied |
| Less than $300 | 58 (13.7%) | 9 (7.9%) |
| $300 to $499 | 126 (29.6%) | 8 (7.0%) |
| $500 to $799 | 102 (24.0%) | 36 (31.6%) |
| $800 to $999 | 50 (11.8%) | 30 (26.3%) |
| $1,000 to $1,499 | 56 (13.2%) | 8 (7.0%) |
| $1,500 to $1,999 | 33 (7.8%) | 0 (0.0%) |
| $2,000 to $2,499 | 0 (0.0%) | 0 (0.0%) |
| $2,500 to $2,999 | 0 (0.0%) | 0 (0.0%) |
| $3,000 or more | 0 (0.0%) | 0 (0.0%) |
| Total | 425 (100.0%) | 114 (100.0%) |
Physical Housing Characteristics in Winnebago
Housing Structures in Winnebago
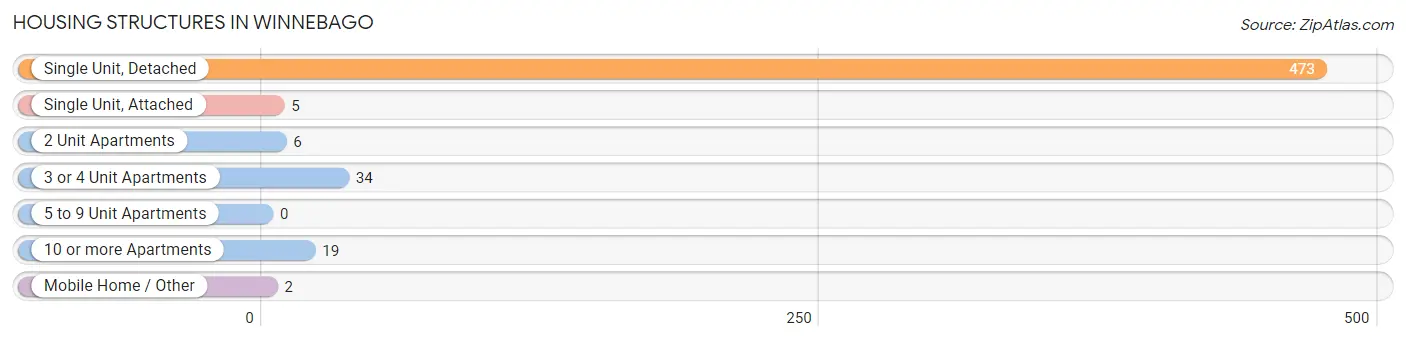
| Structure Type | # Housing Units | % Housing Units |
| Single Unit, Detached | 473 | 87.8% |
| Single Unit, Attached | 5 | 0.9% |
| 2 Unit Apartments | 6 | 1.1% |
| 3 or 4 Unit Apartments | 34 | 6.3% |
| 5 to 9 Unit Apartments | 0 | 0.0% |
| 10 or more Apartments | 19 | 3.5% |
| Mobile Home / Other | 2 | 0.4% |
| Total | 539 | 100.0% |
Housing Structures by Occupancy in Winnebago
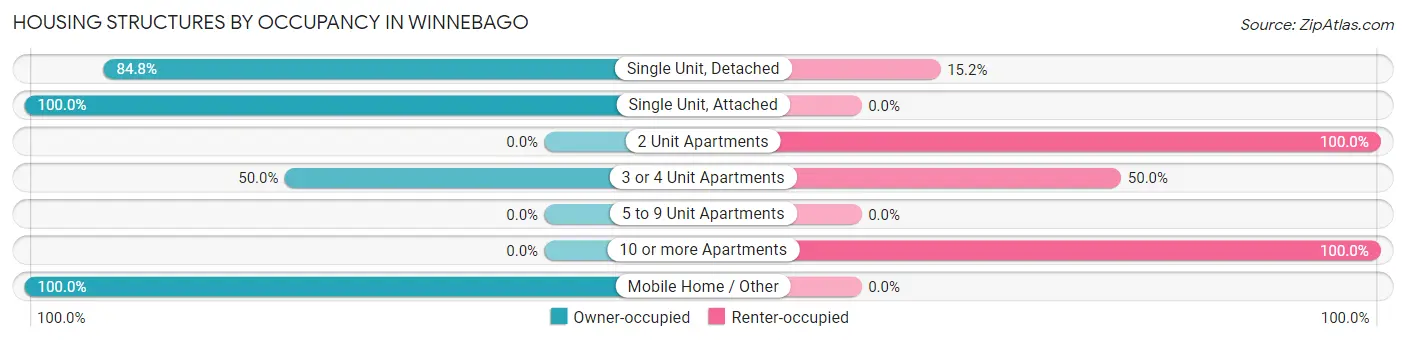
| Structure Type | Owner-occupied | Renter-occupied |
| Single Unit, Detached | 401 (84.8%) | 72 (15.2%) |
| Single Unit, Attached | 5 (100.0%) | 0 (0.0%) |
| 2 Unit Apartments | 0 (0.0%) | 6 (100.0%) |
| 3 or 4 Unit Apartments | 17 (50.0%) | 17 (50.0%) |
| 5 to 9 Unit Apartments | 0 (0.0%) | 0 (0.0%) |
| 10 or more Apartments | 0 (0.0%) | 19 (100.0%) |
| Mobile Home / Other | 2 (100.0%) | 0 (0.0%) |
| Total | 425 (78.8%) | 114 (21.1%) |
Housing Structures by Number of Rooms in Winnebago
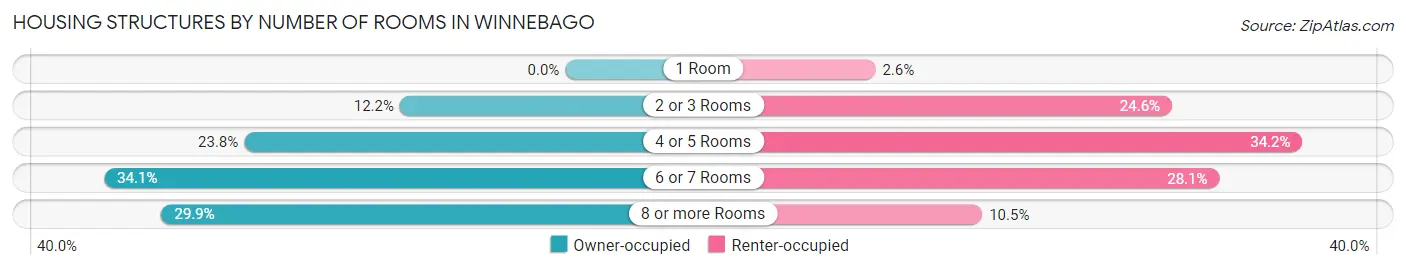
| Number of Rooms | Owner-occupied | Renter-occupied |
| 1 Room | 0 (0.0%) | 3 (2.6%) |
| 2 or 3 Rooms | 52 (12.2%) | 28 (24.6%) |
| 4 or 5 Rooms | 101 (23.8%) | 39 (34.2%) |
| 6 or 7 Rooms | 145 (34.1%) | 32 (28.1%) |
| 8 or more Rooms | 127 (29.9%) | 12 (10.5%) |
| Total | 425 (100.0%) | 114 (100.0%) |
Housing Structure by Heating Type in Winnebago
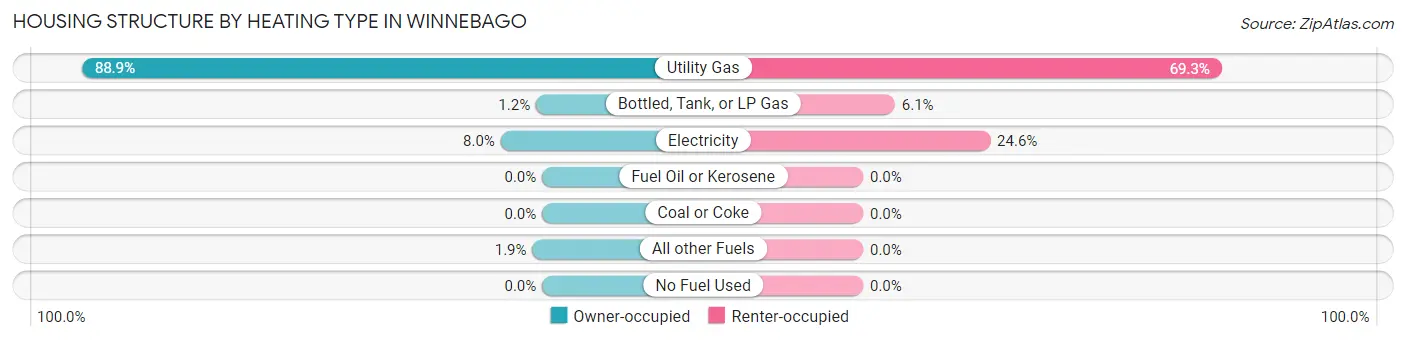
| Heating Type | Owner-occupied | Renter-occupied |
| Utility Gas | 378 (88.9%) | 79 (69.3%) |
| Bottled, Tank, or LP Gas | 5 (1.2%) | 7 (6.1%) |
| Electricity | 34 (8.0%) | 28 (24.6%) |
| Fuel Oil or Kerosene | 0 (0.0%) | 0 (0.0%) |
| Coal or Coke | 0 (0.0%) | 0 (0.0%) |
| All other Fuels | 8 (1.9%) | 0 (0.0%) |
| No Fuel Used | 0 (0.0%) | 0 (0.0%) |
| Total | 425 (100.0%) | 114 (100.0%) |
Household Vehicle Usage in Winnebago
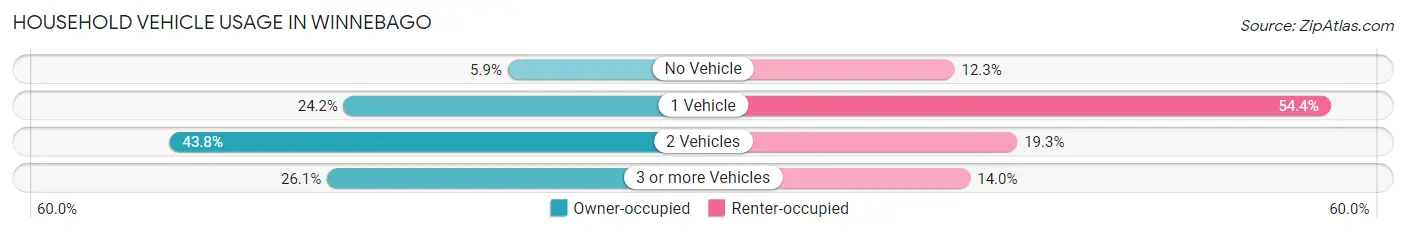
| Vehicles per Household | Owner-occupied | Renter-occupied |
| No Vehicle | 25 (5.9%) | 14 (12.3%) |
| 1 Vehicle | 103 (24.2%) | 62 (54.4%) |
| 2 Vehicles | 186 (43.8%) | 22 (19.3%) |
| 3 or more Vehicles | 111 (26.1%) | 16 (14.0%) |
| Total | 425 (100.0%) | 114 (100.0%) |
Real Estate & Mortgages in Winnebago
Real Estate and Mortgage Overview in Winnebago
| Characteristic | Without Mortgage | With Mortgage |
| Housing Units | 259 | 166 |
| Median Property Value | $79,500 | $129,300 |
| Median Household Income | $51,250 | $23 |
| Monthly Housing Costs | $388 | $0 |
| Real Estate Taxes | $581 | $3 |
Property Value by Mortgage Status in Winnebago
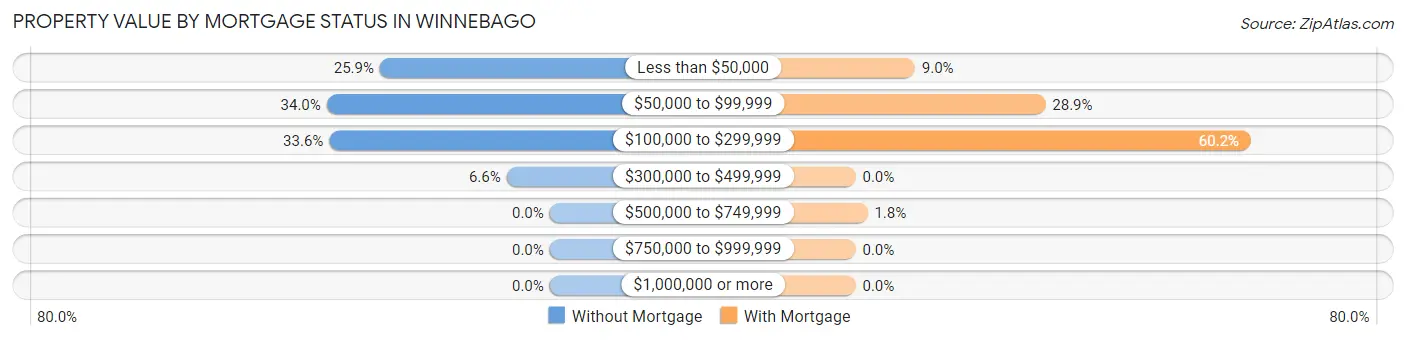
| Property Value | Without Mortgage | With Mortgage |
| Less than $50,000 | 67 (25.9%) | 15 (9.0%) |
| $50,000 to $99,999 | 88 (34.0%) | 48 (28.9%) |
| $100,000 to $299,999 | 87 (33.6%) | 100 (60.2%) |
| $300,000 to $499,999 | 17 (6.6%) | 0 (0.0%) |
| $500,000 to $749,999 | 0 (0.0%) | 3 (1.8%) |
| $750,000 to $999,999 | 0 (0.0%) | 0 (0.0%) |
| $1,000,000 or more | 0 (0.0%) | 0 (0.0%) |
| Total | 259 (100.0%) | 166 (100.0%) |
Household Income by Mortgage Status in Winnebago
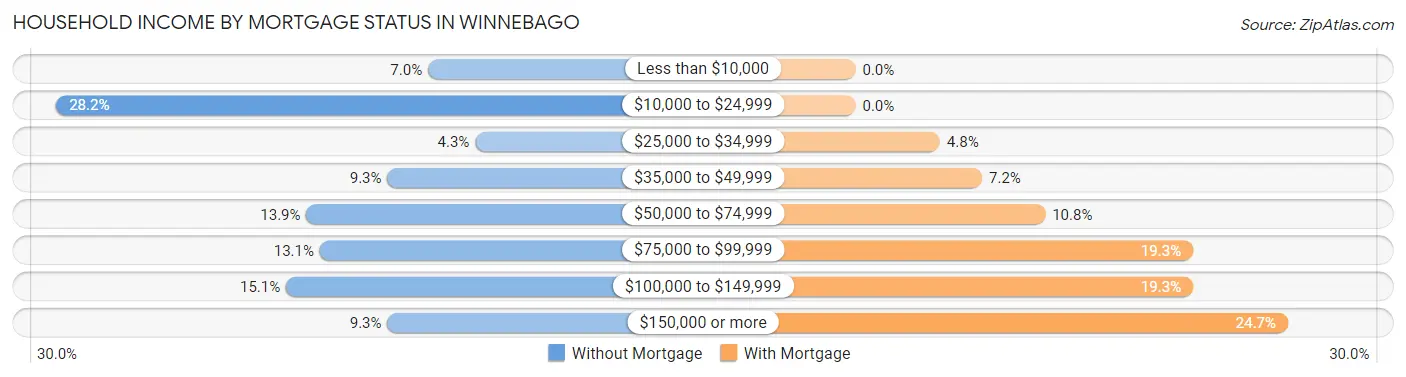
| Household Income | Without Mortgage | With Mortgage |
| Less than $10,000 | 18 (7.0%) | 0 (0.0%) |
| $10,000 to $24,999 | 73 (28.2%) | 0 (0.0%) |
| $25,000 to $34,999 | 11 (4.3%) | 8 (4.8%) |
| $35,000 to $49,999 | 24 (9.3%) | 12 (7.2%) |
| $50,000 to $74,999 | 36 (13.9%) | 18 (10.8%) |
| $75,000 to $99,999 | 34 (13.1%) | 32 (19.3%) |
| $100,000 to $149,999 | 39 (15.1%) | 32 (19.3%) |
| $150,000 or more | 24 (9.3%) | 41 (24.7%) |
| Total | 259 (100.0%) | 166 (100.0%) |
Property Value to Household Income Ratio in Winnebago
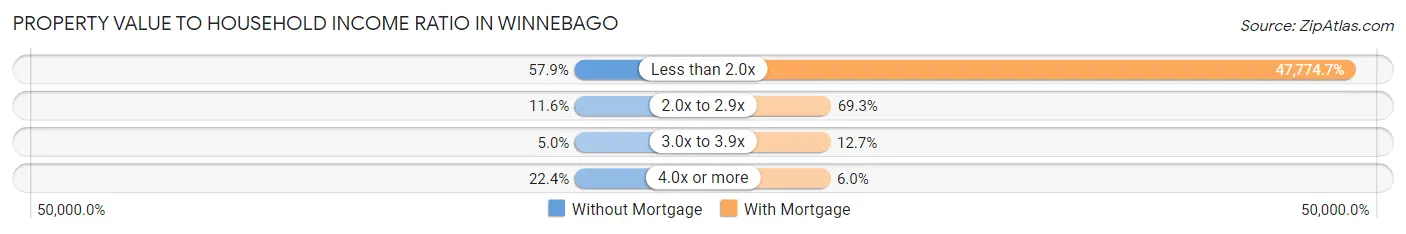
| Value-to-Income Ratio | Without Mortgage | With Mortgage |
| Less than 2.0x | 150 (57.9%) | 79,306 (47,774.7%) |
| 2.0x to 2.9x | 30 (11.6%) | 115 (69.3%) |
| 3.0x to 3.9x | 13 (5.0%) | 21 (12.7%) |
| 4.0x or more | 58 (22.4%) | 10 (6.0%) |
| Total | 259 (100.0%) | 166 (100.0%) |
Real Estate Taxes by Mortgage Status in Winnebago
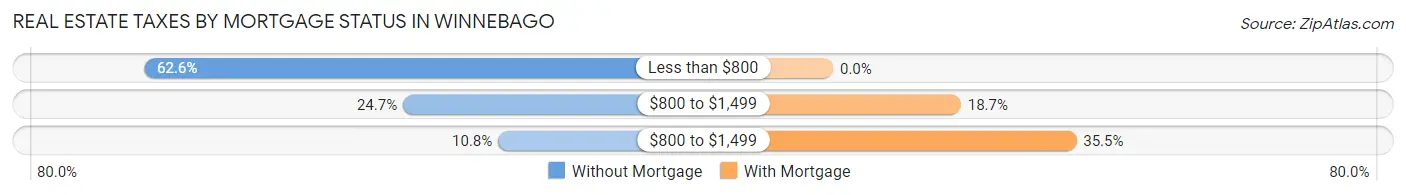
| Property Taxes | Without Mortgage | With Mortgage |
| Less than $800 | 162 (62.5%) | 0 (0.0%) |
| $800 to $1,499 | 64 (24.7%) | 31 (18.7%) |
| $800 to $1,499 | 28 (10.8%) | 59 (35.5%) |
| Total | 259 (100.0%) | 166 (100.0%) |
Health & Disability in Winnebago
Health Insurance Coverage by Age in Winnebago
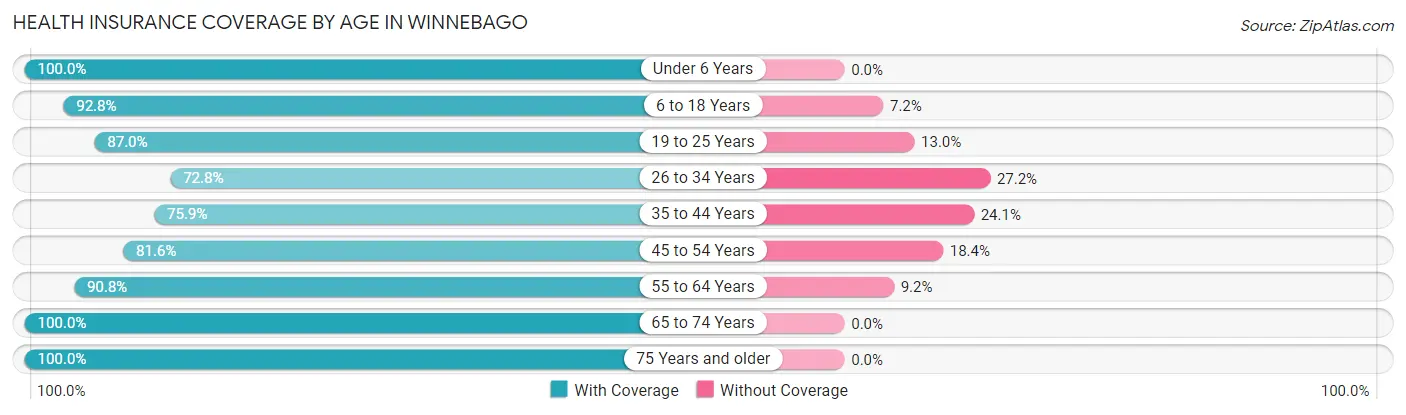
| Age Bracket | With Coverage | Without Coverage |
| Under 6 Years | 46 (100.0%) | 0 (0.0%) |
| 6 to 18 Years | 167 (92.8%) | 13 (7.2%) |
| 19 to 25 Years | 147 (87.0%) | 22 (13.0%) |
| 26 to 34 Years | 59 (72.8%) | 22 (27.2%) |
| 35 to 44 Years | 132 (75.9%) | 42 (24.1%) |
| 45 to 54 Years | 80 (81.6%) | 18 (18.4%) |
| 55 to 64 Years | 207 (90.8%) | 21 (9.2%) |
| 65 to 74 Years | 150 (100.0%) | 0 (0.0%) |
| 75 Years and older | 83 (100.0%) | 0 (0.0%) |
| Total | 1,071 (88.6%) | 138 (11.4%) |
Health Insurance Coverage by Citizenship Status in Winnebago
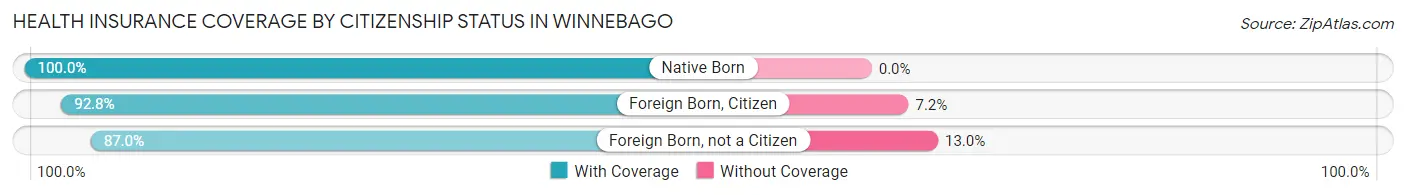
| Citizenship Status | With Coverage | Without Coverage |
| Native Born | 46 (100.0%) | 0 (0.0%) |
| Foreign Born, Citizen | 167 (92.8%) | 13 (7.2%) |
| Foreign Born, not a Citizen | 147 (87.0%) | 22 (13.0%) |
Health Insurance Coverage by Household Income in Winnebago
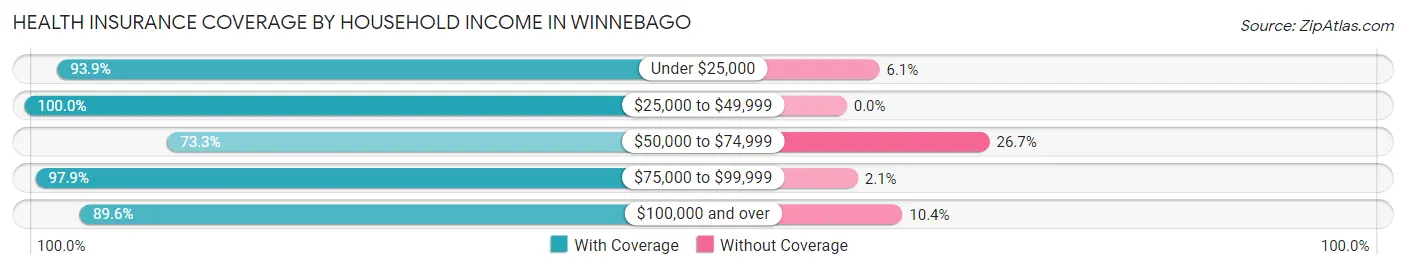
| Household Income | With Coverage | Without Coverage |
| Under $25,000 | 153 (93.9%) | 10 (6.1%) |
| $25,000 to $49,999 | 147 (100.0%) | 0 (0.0%) |
| $50,000 to $74,999 | 211 (73.3%) | 77 (26.7%) |
| $75,000 to $99,999 | 142 (97.9%) | 3 (2.1%) |
| $100,000 and over | 413 (89.6%) | 48 (10.4%) |
Public vs Private Health Insurance Coverage by Age in Winnebago
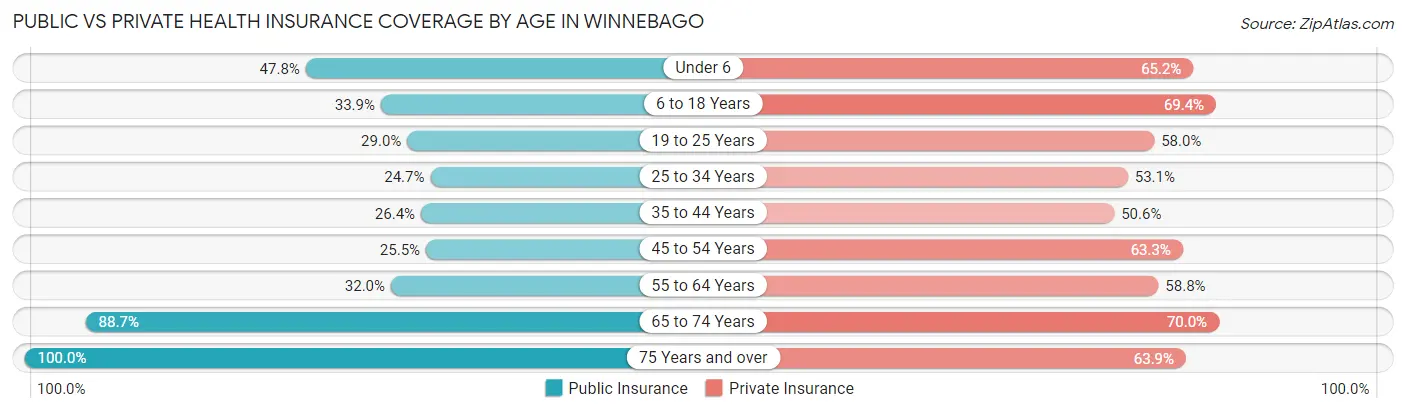
| Age Bracket | Public Insurance | Private Insurance |
| Under 6 | 22 (47.8%) | 30 (65.2%) |
| 6 to 18 Years | 61 (33.9%) | 125 (69.4%) |
| 19 to 25 Years | 49 (29.0%) | 98 (58.0%) |
| 25 to 34 Years | 20 (24.7%) | 43 (53.1%) |
| 35 to 44 Years | 46 (26.4%) | 88 (50.6%) |
| 45 to 54 Years | 25 (25.5%) | 62 (63.3%) |
| 55 to 64 Years | 73 (32.0%) | 134 (58.8%) |
| 65 to 74 Years | 133 (88.7%) | 105 (70.0%) |
| 75 Years and over | 83 (100.0%) | 53 (63.9%) |
| Total | 512 (42.3%) | 738 (61.0%) |
Disability Status by Sex by Age in Winnebago
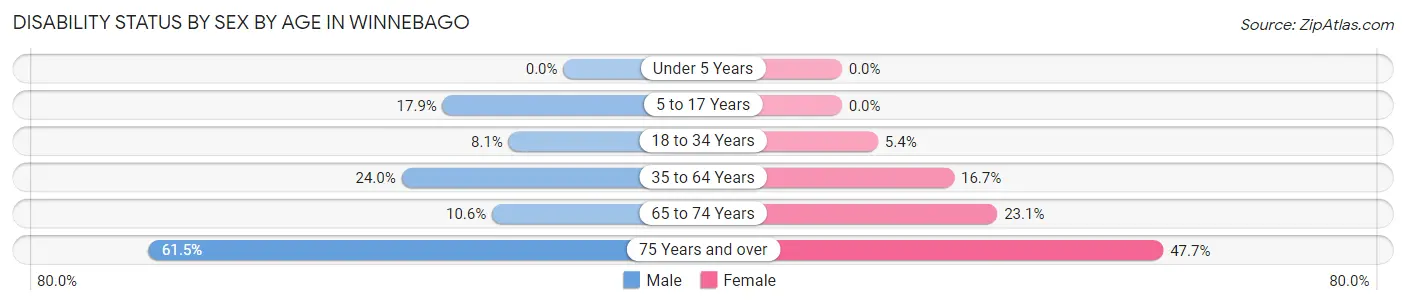
| Age Bracket | Male | Female |
| Under 5 Years | 0 (0.0%) | 0 (0.0%) |
| 5 to 17 Years | 19 (17.9%) | 0 (0.0%) |
| 18 to 34 Years | 13 (8.1%) | 6 (5.4%) |
| 35 to 64 Years | 61 (24.0%) | 41 (16.7%) |
| 65 to 74 Years | 9 (10.6%) | 15 (23.1%) |
| 75 Years and over | 24 (61.5%) | 21 (47.7%) |
Disability Class by Sex by Age in Winnebago
Disability Class: Hearing Difficulty
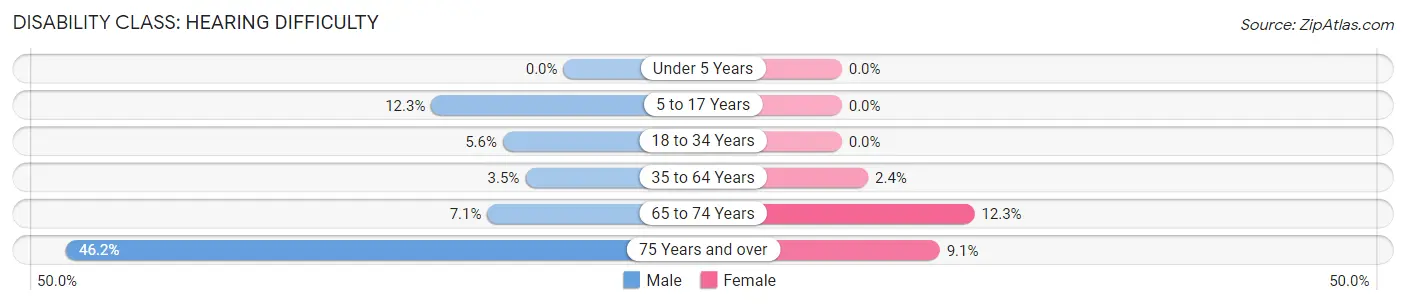
| Age Bracket | Male | Female |
| Under 5 Years | 0 (0.0%) | 0 (0.0%) |
| 5 to 17 Years | 13 (12.3%) | 0 (0.0%) |
| 18 to 34 Years | 9 (5.6%) | 0 (0.0%) |
| 35 to 64 Years | 9 (3.5%) | 6 (2.4%) |
| 65 to 74 Years | 6 (7.1%) | 8 (12.3%) |
| 75 Years and over | 18 (46.2%) | 4 (9.1%) |
Disability Class: Vision Difficulty
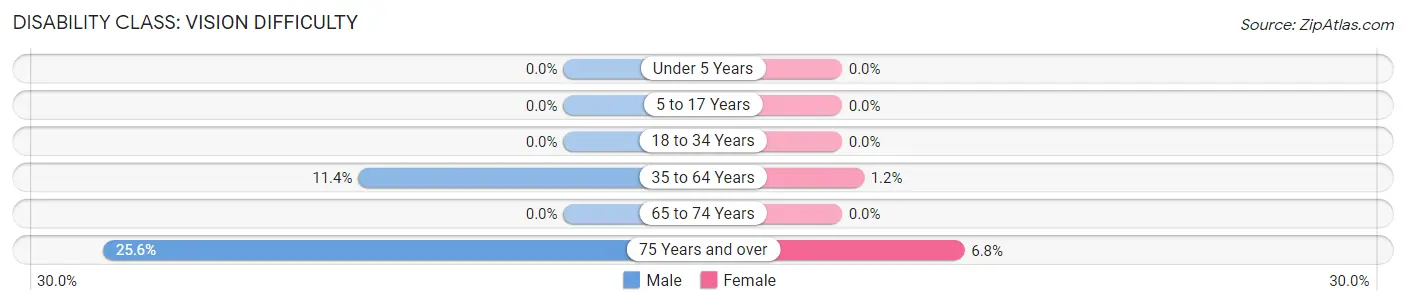
| Age Bracket | Male | Female |
| Under 5 Years | 0 (0.0%) | 0 (0.0%) |
| 5 to 17 Years | 0 (0.0%) | 0 (0.0%) |
| 18 to 34 Years | 0 (0.0%) | 0 (0.0%) |
| 35 to 64 Years | 29 (11.4%) | 3 (1.2%) |
| 65 to 74 Years | 0 (0.0%) | 0 (0.0%) |
| 75 Years and over | 10 (25.6%) | 3 (6.8%) |
Disability Class: Cognitive Difficulty
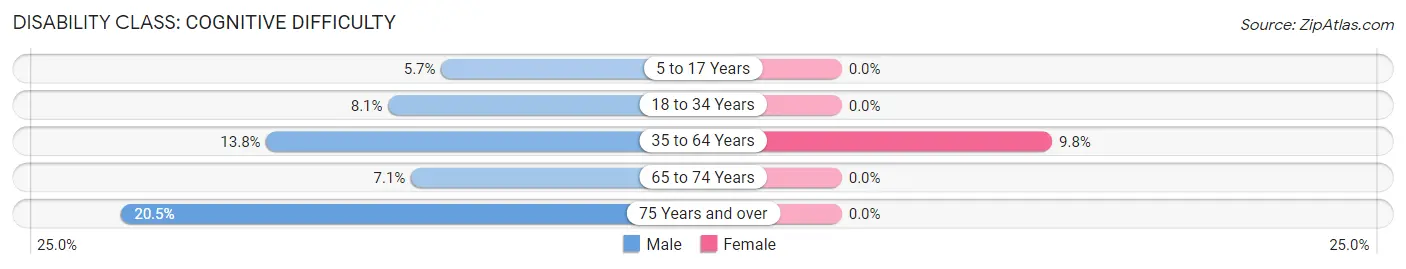
| Age Bracket | Male | Female |
| 5 to 17 Years | 6 (5.7%) | 0 (0.0%) |
| 18 to 34 Years | 13 (8.1%) | 0 (0.0%) |
| 35 to 64 Years | 35 (13.8%) | 24 (9.8%) |
| 65 to 74 Years | 6 (7.1%) | 0 (0.0%) |
| 75 Years and over | 8 (20.5%) | 0 (0.0%) |
Disability Class: Ambulatory Difficulty
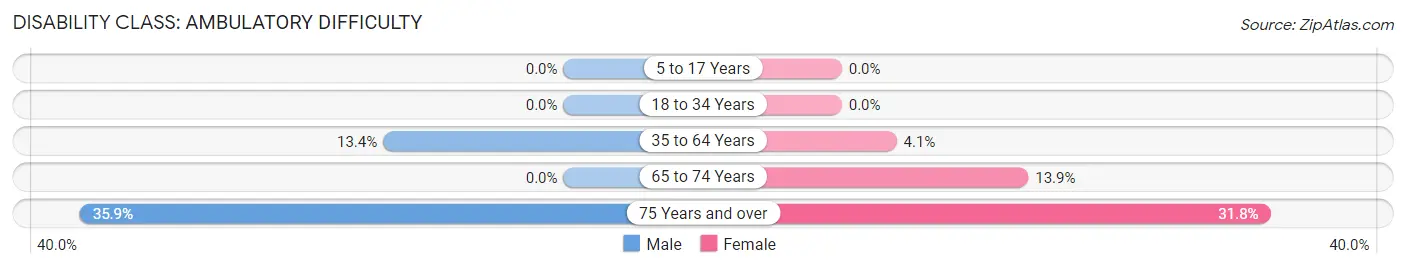
| Age Bracket | Male | Female |
| 5 to 17 Years | 0 (0.0%) | 0 (0.0%) |
| 18 to 34 Years | 0 (0.0%) | 0 (0.0%) |
| 35 to 64 Years | 34 (13.4%) | 10 (4.1%) |
| 65 to 74 Years | 0 (0.0%) | 9 (13.9%) |
| 75 Years and over | 14 (35.9%) | 14 (31.8%) |
Disability Class: Self-Care Difficulty
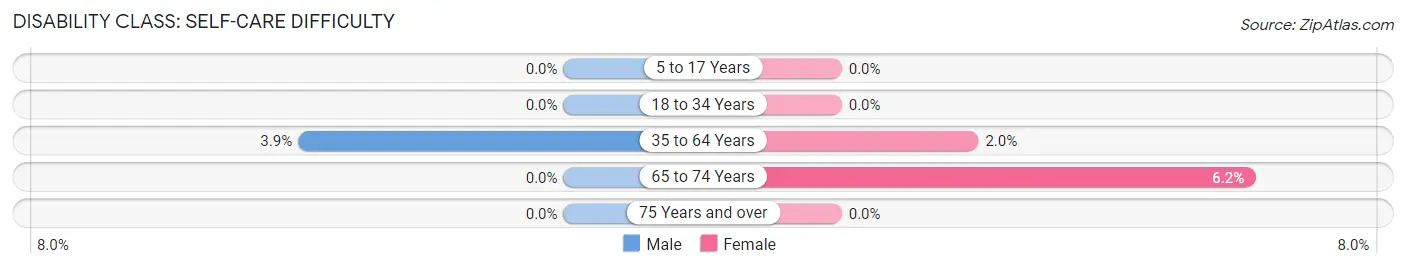
| Age Bracket | Male | Female |
| 5 to 17 Years | 0 (0.0%) | 0 (0.0%) |
| 18 to 34 Years | 0 (0.0%) | 0 (0.0%) |
| 35 to 64 Years | 10 (3.9%) | 5 (2.0%) |
| 65 to 74 Years | 0 (0.0%) | 4 (6.1%) |
| 75 Years and over | 0 (0.0%) | 0 (0.0%) |
Technology Access in Winnebago
Computing Device Access in Winnebago
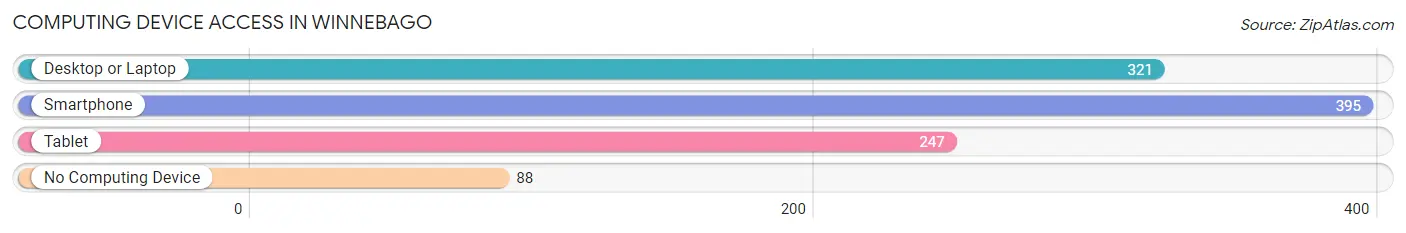
| Device Type | # Households | % Households |
| Desktop or Laptop | 321 | 59.6% |
| Smartphone | 395 | 73.3% |
| Tablet | 247 | 45.8% |
| No Computing Device | 88 | 16.3% |
| Total | 539 | 100.0% |
Internet Access in Winnebago
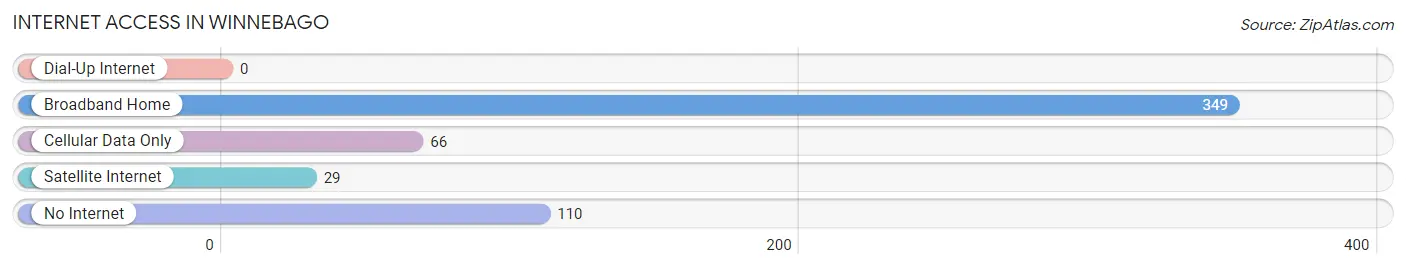
| Internet Type | # Households | % Households |
| Dial-Up Internet | 0 | 0.0% |
| Broadband Home | 349 | 64.7% |
| Cellular Data Only | 66 | 12.2% |
| Satellite Internet | 29 | 5.4% |
| No Internet | 110 | 20.4% |
| Total | 539 | 100.0% |
Winnebago Summary
Winnebago, Minnesota is a small city located in Faribault County in the south-central part of the state. It is situated on the banks of the Blue Earth River, about 30 miles south of Mankato. The city has a population of 1,845 people, according to the 2010 census.
History
The area that is now Winnebago was first settled in 1856 by a group of German immigrants. The town was originally called Germania, but was later changed to Winnebago in 1872. The name was chosen to honor the Winnebago tribe of Native Americans who had lived in the area for centuries.
The city was incorporated in 1876 and quickly became a thriving agricultural center. The railroad arrived in 1879, bringing with it new opportunities for growth. The city was also home to a number of businesses, including a flour mill, a creamery, and a brickyard.
Geography
Winnebago is located in the south-central part of Minnesota, about 30 miles south of Mankato. It is situated on the banks of the Blue Earth River, which flows through the city. The city is surrounded by rolling hills and farmland, and is located in the heart of Minnesota’s “corn belt.”
The city has a total area of 1.3 square miles, all of which is land. The average elevation is 1,072 feet above sea level. Winnebago has a humid continental climate, with cold winters and hot, humid summers.
Economy
The economy of Winnebago is largely based on agriculture. The city is home to several large farms, as well as a number of smaller family-owned farms. The city is also home to a number of businesses, including a grocery store, a hardware store, and a number of restaurants.
The city is also home to a number of manufacturing companies, including a plastics manufacturer and a metal fabrication company. The city is also home to a number of small businesses, including a number of antique stores and a winery.
Demographics
According to the 2010 census, the population of Winnebago was 1,845 people. The racial makeup of the city was 97.3% White, 0.3% African American, 0.2% Native American, 0.2% Asian, 0.1% Pacific Islander, 0.7% from other races, and 1.2% from two or more races. Hispanic or Latino of any race were 1.7% of the population.
The median income for a household in the city was $41,250, and the median income for a family was $50,000. The per capita income for the city was $19,945. About 8.3% of families and 10.2% of the population were below the poverty line, including 13.2% of those under age 18 and 8.3% of those age 65 or over.
Winnebago is a small city with a rich history and a strong agricultural economy. The city is home to a number of businesses, and is a great place to live and work. The city is also home to a diverse population, with a variety of racial and ethnic backgrounds. Winnebago is a great place to call home.
Common Questions
What is Per Capita Income in Winnebago?
Per Capita income in Winnebago is $31,203.
What is the Median Family Income in Winnebago?
Median Family Income in Winnebago is $80,833.
What is the Median Household income in Winnebago?
Median Household Income in Winnebago is $58,750.
What is Income or Wage Gap in Winnebago?
Income or Wage Gap in Winnebago is 44.7%.
Women in Winnebago earn 55.3 cents for every dollar earned by a man.
What is Inequality or Gini Index in Winnebago?
Inequality or Gini Index in Winnebago is 0.41.
What is the Total Population of Winnebago?
Total Population of Winnebago is 1,245.
What is the Total Male Population of Winnebago?
Total Male Population of Winnebago is 663.
What is the Total Female Population of Winnebago?
Total Female Population of Winnebago is 582.
What is the Ratio of Males per 100 Females in Winnebago?
There are 113.92 Males per 100 Females in Winnebago.
What is the Ratio of Females per 100 Males in Winnebago?
There are 87.78 Females per 100 Males in Winnebago.
What is the Median Population Age in Winnebago?
Median Population Age in Winnebago is 41.6 Years.
What is the Average Family Size in Winnebago
Average Family Size in Winnebago is 2.9 People.
What is the Average Household Size in Winnebago
Average Household Size in Winnebago is 2.2 People.
How Large is the Labor Force in Winnebago?
There are 664 People in the Labor Forcein in Winnebago.
What is the Percentage of People in the Labor Force in Winnebago?
62.1% of People are in the Labor Force in Winnebago.
What is the Unemployment Rate in Winnebago?
Unemployment Rate in Winnebago is 6.1%.