Winger, MN Map & Demographics
Winger Map
Winger Overview
$32,110
PER CAPITA INCOME
$42,500
AVG HOUSEHOLD INCOME
45.3%
WAGE / INCOME GAP [ % ]
54.7¢/ $1
WAGE / INCOME GAP [ $ ]
0.41
INEQUALITY / GINI INDEX
155
TOTAL POPULATION
77
MALE POPULATION
78
FEMALE POPULATION
98.72
MALES / 100 FEMALES
101.30
FEMALES / 100 MALES
48.8
MEDIAN AGE
3.2
AVG FAMILY SIZE
2.1
AVG HOUSEHOLD SIZE
87
LABOR FORCE [ PEOPLE ]
69.6%
PERCENT IN LABOR FORCE
3.5%
UNEMPLOYMENT RATE
Winger Zip Codes
Winger Area Codes
Income in Winger
Income Overview in Winger
| Characteristic | Number | Measure |
| Per Capita Income | 155 | $32,110 |
| Median Family Income | 34 | $0 |
| Mean Family Income | 34 | $97,332 |
| Median Household Income | 74 | $42,500 |
| Mean Household Income | 74 | $69,618 |
| Income Deficit | 34 | $0 |
| Wage / Income Gap (%) | 155 | 45.33% |
| Wage / Income Gap ($) | 155 | 54.67¢ per $1 |
| Gini / Inequality Index | 155 | 0.41 |
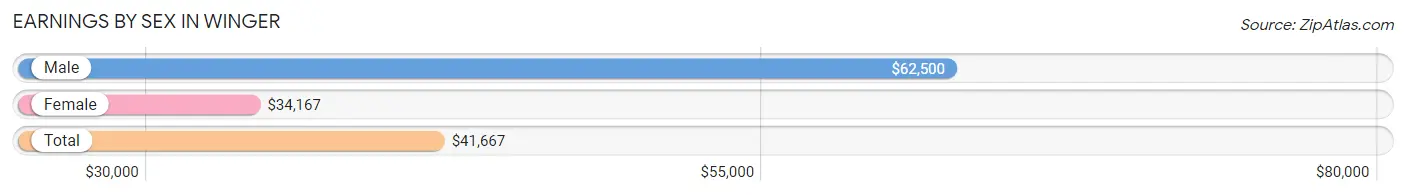
Earnings by Sex in Winger
Average Earnings in Winger are $41,667, $62,500 for men and $34,167 for women, a difference of 45.3%.
| Sex | Number | Average Earnings |
| Male | 48 (52.2%) | $62,500 |
| Female | 44 (47.8%) | $34,167 |
| Total | 92 (100.0%) | $41,667 |
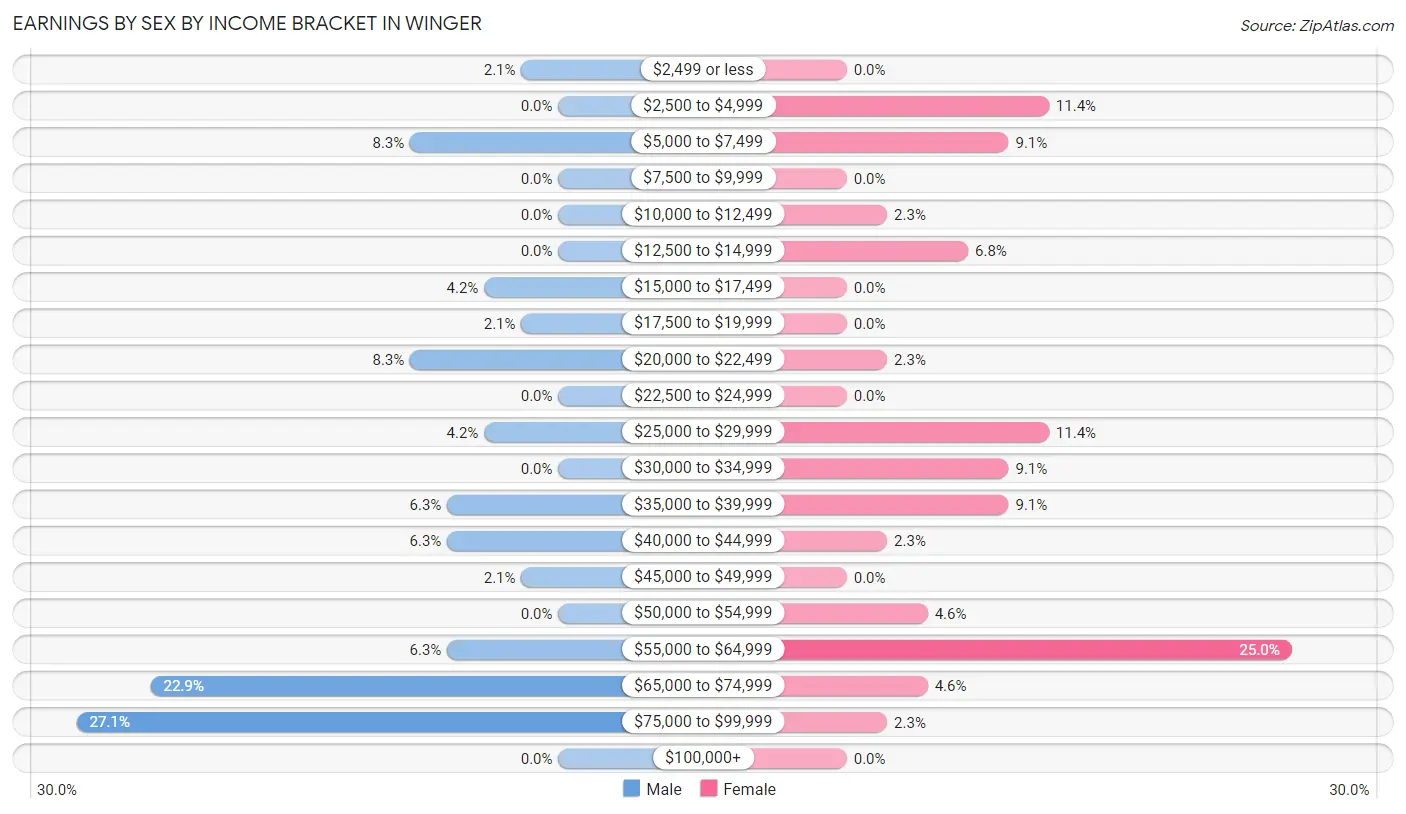
Earnings by Sex by Income Bracket in Winger
The most common earnings brackets in Winger are $75,000 to $99,999 for men (13 | 27.1%) and $55,000 to $64,999 for women (11 | 25.0%).
| Income | Male | Female |
| $2,499 or less | 1 (2.1%) | 0 (0.0%) |
| $2,500 to $4,999 | 0 (0.0%) | 5 (11.4%) |
| $5,000 to $7,499 | 4 (8.3%) | 4 (9.1%) |
| $7,500 to $9,999 | 0 (0.0%) | 0 (0.0%) |
| $10,000 to $12,499 | 0 (0.0%) | 1 (2.3%) |
| $12,500 to $14,999 | 0 (0.0%) | 3 (6.8%) |
| $15,000 to $17,499 | 2 (4.2%) | 0 (0.0%) |
| $17,500 to $19,999 | 1 (2.1%) | 0 (0.0%) |
| $20,000 to $22,499 | 4 (8.3%) | 1 (2.3%) |
| $22,500 to $24,999 | 0 (0.0%) | 0 (0.0%) |
| $25,000 to $29,999 | 2 (4.2%) | 5 (11.4%) |
| $30,000 to $34,999 | 0 (0.0%) | 4 (9.1%) |
| $35,000 to $39,999 | 3 (6.2%) | 4 (9.1%) |
| $40,000 to $44,999 | 3 (6.2%) | 1 (2.3%) |
| $45,000 to $49,999 | 1 (2.1%) | 0 (0.0%) |
| $50,000 to $54,999 | 0 (0.0%) | 2 (4.5%) |
| $55,000 to $64,999 | 3 (6.2%) | 11 (25.0%) |
| $65,000 to $74,999 | 11 (22.9%) | 2 (4.5%) |
| $75,000 to $99,999 | 13 (27.1%) | 1 (2.3%) |
| $100,000+ | 0 (0.0%) | 0 (0.0%) |
| Total | 48 (100.0%) | 44 (100.0%) |
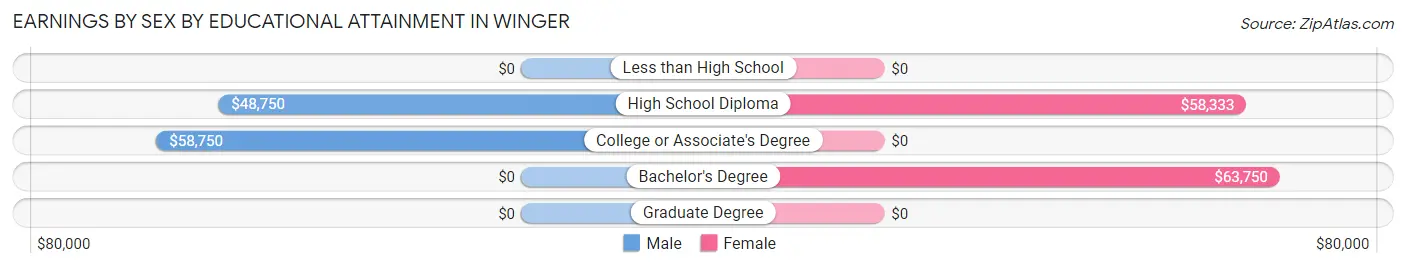
Earnings by Sex by Educational Attainment in Winger
Average earnings in Winger are $66,000 for men and $32,917 for women, a difference of 50.1%. Men with an educational attainment of college or associate's degree enjoy the highest average annual earnings of $58,750, while those with high school diploma education earn the least with $48,750. Women with an educational attainment of bachelor's degree earn the most with the average annual earnings of $63,750, while those with high school diploma education have the smallest earnings of $58,333.
| Educational Attainment | Male Income | Female Income |
| Less than High School | - | - |
| High School Diploma | $48,750 | $58,333 |
| College or Associate's Degree | $58,750 | $0 |
| Bachelor's Degree | - | - |
| Graduate Degree | - | - |
| Total | $66,000 | $32,917 |
Family Income in Winger
Family Income Brackets in Winger
According to the Winger family income data, there are 12 families falling into the $100,000 to $149,999 income range, which is the most common income bracket and makes up 35.3% of all families.
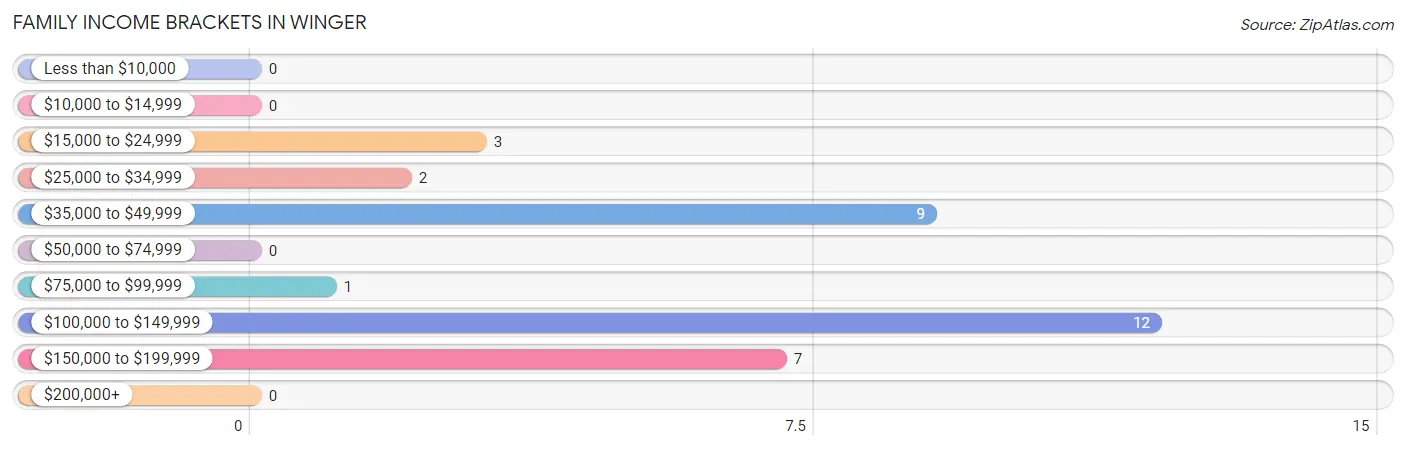
| Income Bracket | # Families | % Families |
| Less than $10,000 | 0 | 0.0% |
| $10,000 to $14,999 | 0 | 0.0% |
| $15,000 to $24,999 | 3 | 8.8% |
| $25,000 to $34,999 | 2 | 5.9% |
| $35,000 to $49,999 | 9 | 26.5% |
| $50,000 to $74,999 | 0 | 0.0% |
| $75,000 to $99,999 | 1 | 2.9% |
| $100,000 to $149,999 | 12 | 35.3% |
| $150,000 to $199,999 | 7 | 20.6% |
| $200,000+ | 0 | 0.0% |
Family Income by Famaliy Size in Winger
5-person families (8 | 23.5%) account for the highest median family income in Winger with $143,333 per family, while 5-person families (8 | 23.5%) have the highest median income of $28,667 per family member.
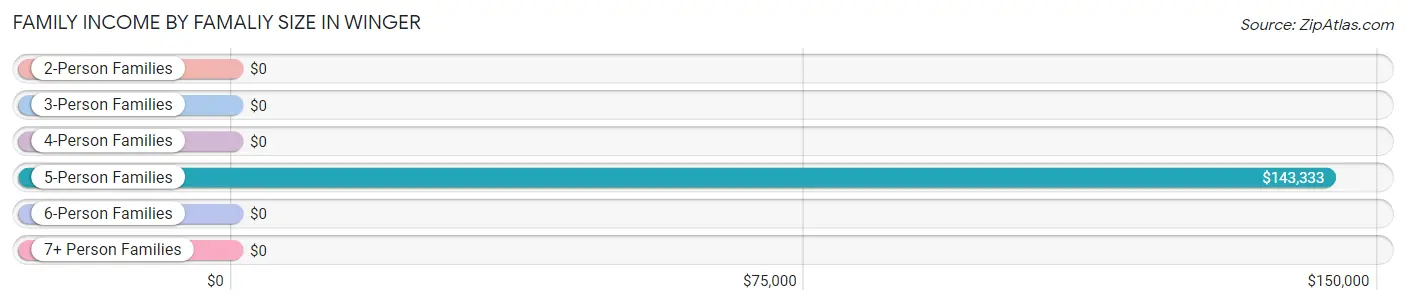
| Income Bracket | # Families | Median Income |
| 2-Person Families | 16 (47.1%) | $0 |
| 3-Person Families | 7 (20.6%) | $0 |
| 4-Person Families | 0 (0.0%) | $0 |
| 5-Person Families | 8 (23.5%) | $143,333 |
| 6-Person Families | 0 (0.0%) | $0 |
| 7+ Person Families | 3 (8.8%) | $0 |
| Total | 34 (100.0%) | $0 |
Family Income by Number of Earners in Winger
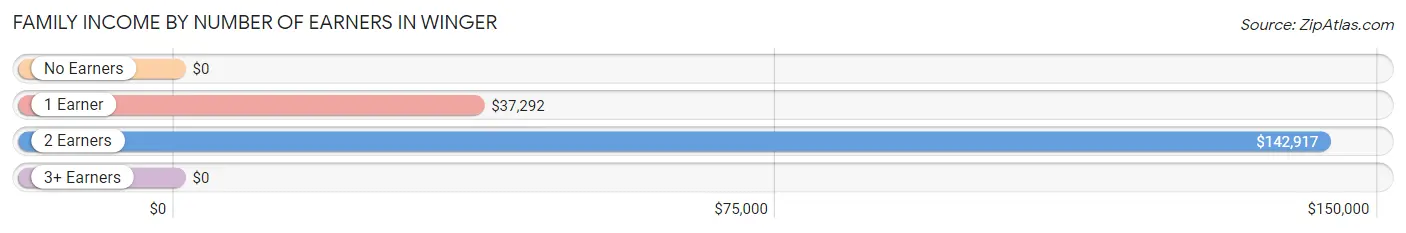
| Number of Earners | # Families | Median Income |
| No Earners | 1 (2.9%) | $0 |
| 1 Earner | 13 (38.2%) | $37,292 |
| 2 Earners | 14 (41.2%) | $142,917 |
| 3+ Earners | 6 (17.6%) | $0 |
| Total | 34 (100.0%) | $0 |
Household Income in Winger
Household Income Brackets in Winger
With 20 households falling in the category, the $35,000 to $49,999 income range is the most frequent in Winger, accounting for 27.0% of all households.
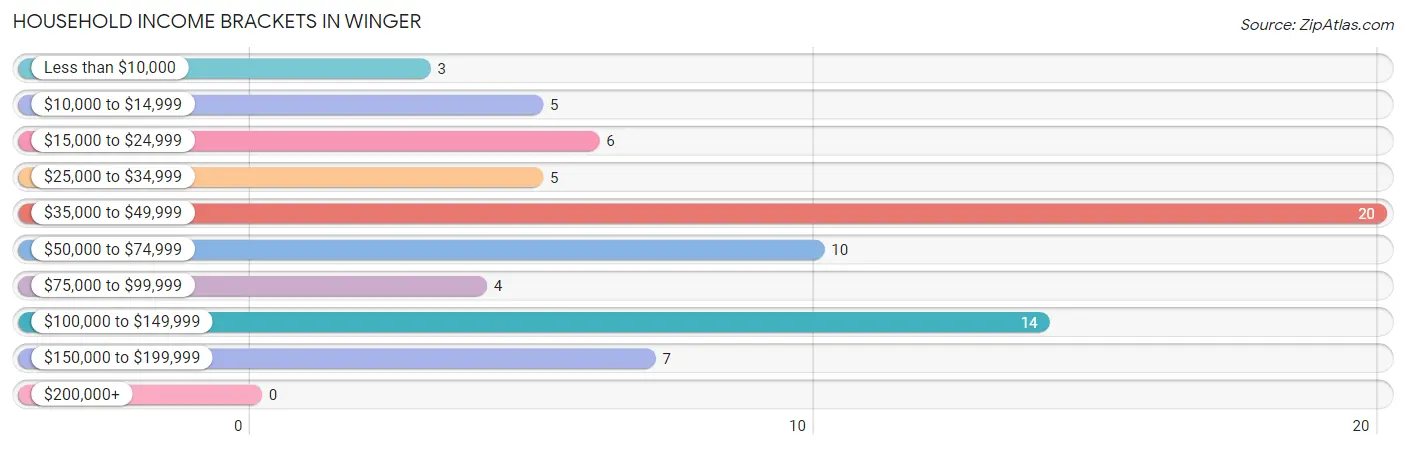
| Income Bracket | # Households | % Households |
| Less than $10,000 | 3 | 4.1% |
| $10,000 to $14,999 | 5 | 6.8% |
| $15,000 to $24,999 | 6 | 8.1% |
| $25,000 to $34,999 | 5 | 6.8% |
| $35,000 to $49,999 | 20 | 27.0% |
| $50,000 to $74,999 | 10 | 13.5% |
| $75,000 to $99,999 | 4 | 5.4% |
| $100,000 to $149,999 | 14 | 18.9% |
| $150,000 to $199,999 | 7 | 9.5% |
| $200,000+ | 0 | 0.0% |
Household Income by Householder Age in Winger
The median household income in Winger is $42,500, with the highest median household income of $136,250 found in the 25 to 44 years age bracket for the primary householder. A total of 14 households (18.9%) fall into this category. Meanwhile, the 15 to 24 years age bracket for the primary householder has the lowest median household income of $0, with 4 households (5.4%) in this group.
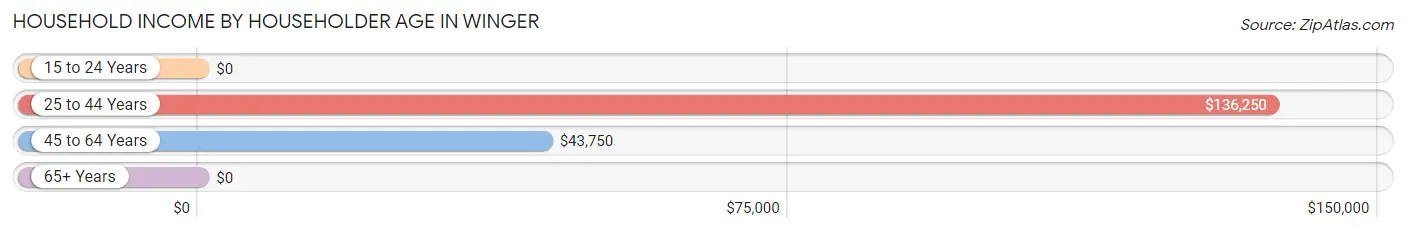
| Income Bracket | # Households | Median Income |
| 15 to 24 Years | 4 (5.4%) | $0 |
| 25 to 44 Years | 14 (18.9%) | $136,250 |
| 45 to 64 Years | 39 (52.7%) | $43,750 |
| 65+ Years | 17 (23.0%) | $0 |
| Total | 74 (100.0%) | $42,500 |
Poverty in Winger
Income Below Poverty by Sex and Age in Winger
With 14.3% poverty level for males and 25.6% for females among the residents of Winger, 12 to 14 year old males and 6 to 11 year old females are the most vulnerable to poverty, with 4 males (80.0%) and 7 females (77.8%) in their respective age groups living below the poverty level.
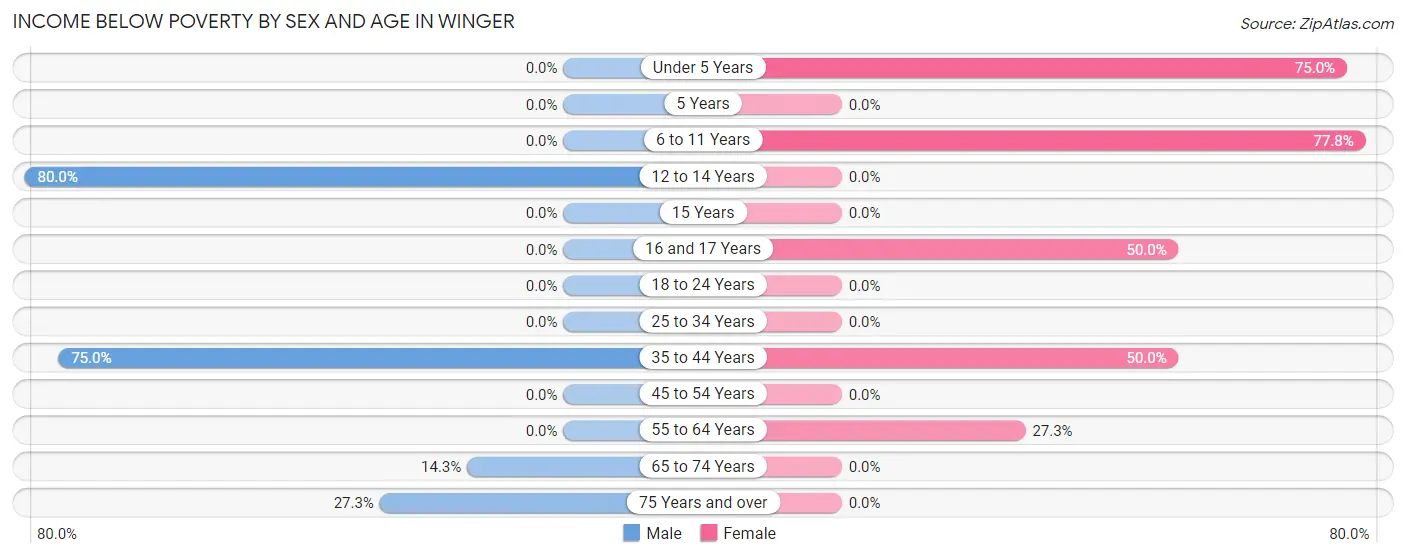
| Age Bracket | Male | Female |
| Under 5 Years | 0 (0.0%) | 3 (75.0%) |
| 5 Years | 0 (0.0%) | 0 (0.0%) |
| 6 to 11 Years | 0 (0.0%) | 7 (77.8%) |
| 12 to 14 Years | 4 (80.0%) | 0 (0.0%) |
| 15 Years | 0 (0.0%) | 0 (0.0%) |
| 16 and 17 Years | 0 (0.0%) | 3 (50.0%) |
| 18 to 24 Years | 0 (0.0%) | 0 (0.0%) |
| 25 to 34 Years | 0 (0.0%) | 0 (0.0%) |
| 35 to 44 Years | 3 (75.0%) | 4 (50.0%) |
| 45 to 54 Years | 0 (0.0%) | 0 (0.0%) |
| 55 to 64 Years | 0 (0.0%) | 3 (27.3%) |
| 65 to 74 Years | 1 (14.3%) | 0 (0.0%) |
| 75 Years and over | 3 (27.3%) | 0 (0.0%) |
| Total | 11 (14.3%) | 20 (25.6%) |
Income Above Poverty by Sex and Age in Winger
According to the poverty statistics in Winger, males aged under 5 years and females aged 15 years are the age groups that are most secure financially, with 100.0% of males and 100.0% of females in these age groups living above the poverty line.
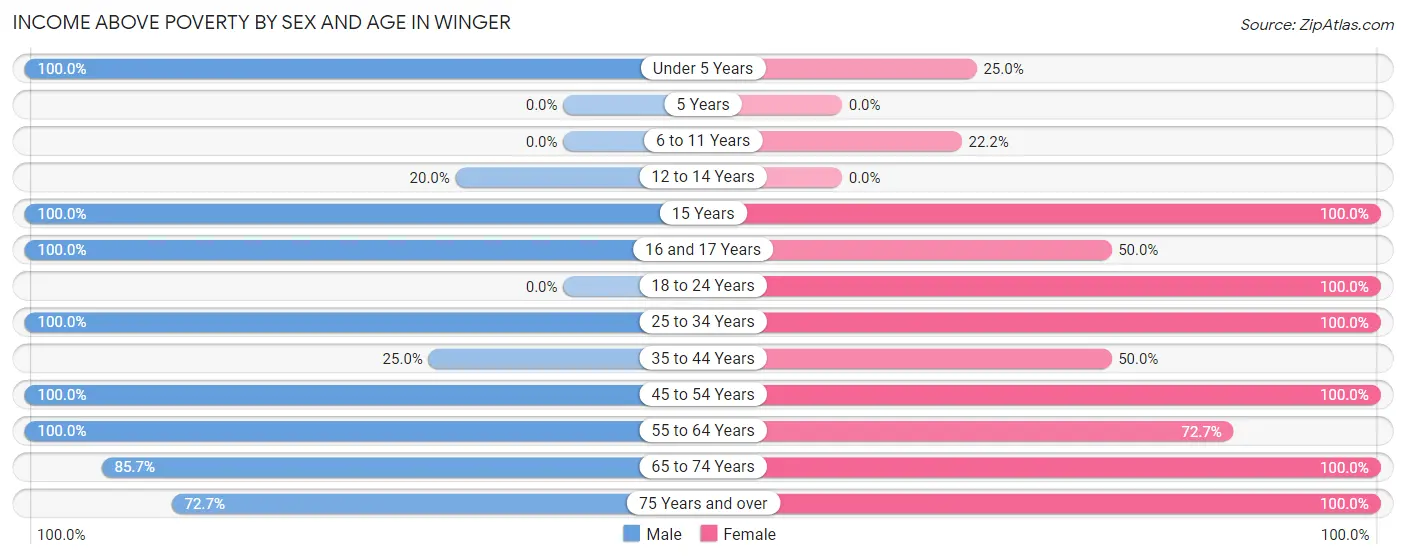
| Age Bracket | Male | Female |
| Under 5 Years | 3 (100.0%) | 1 (25.0%) |
| 5 Years | 0 (0.0%) | 0 (0.0%) |
| 6 to 11 Years | 0 (0.0%) | 2 (22.2%) |
| 12 to 14 Years | 1 (20.0%) | 0 (0.0%) |
| 15 Years | 7 (100.0%) | 2 (100.0%) |
| 16 and 17 Years | 4 (100.0%) | 3 (50.0%) |
| 18 to 24 Years | 0 (0.0%) | 7 (100.0%) |
| 25 to 34 Years | 8 (100.0%) | 7 (100.0%) |
| 35 to 44 Years | 1 (25.0%) | 4 (50.0%) |
| 45 to 54 Years | 20 (100.0%) | 12 (100.0%) |
| 55 to 64 Years | 8 (100.0%) | 8 (72.7%) |
| 65 to 74 Years | 6 (85.7%) | 7 (100.0%) |
| 75 Years and over | 8 (72.7%) | 5 (100.0%) |
| Total | 66 (85.7%) | 58 (74.4%) |
Income Below Poverty Among Married-Couple Families in Winger
The poverty statistics for married-couple families in Winger show that 9.7% or 3 of the total 31 families live below the poverty line. Families with 5 or more children have the highest poverty rate of 100.0%, comprising of 3 families. On the other hand, families with no children have the lowest poverty rate of 0.0%, which includes 0 families.
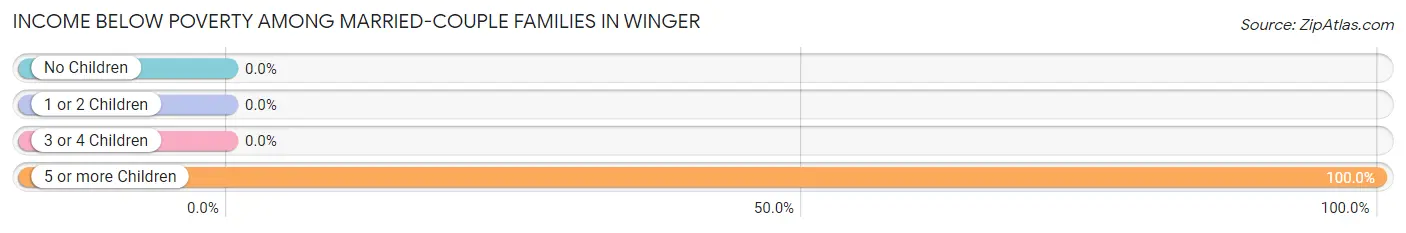
| Children | Above Poverty | Below Poverty |
| No Children | 15 (100.0%) | 0 (0.0%) |
| 1 or 2 Children | 7 (100.0%) | 0 (0.0%) |
| 3 or 4 Children | 6 (100.0%) | 0 (0.0%) |
| 5 or more Children | 0 (0.0%) | 3 (100.0%) |
| Total | 28 (90.3%) | 3 (9.7%) |
Income Below Poverty Among Single-Parent Households in Winger
| Children | Single Father | Single Mother |
| No Children | 0 (0.0%) | 0 (0.0%) |
| 1 or 2 Children | 0 (0.0%) | 0 (0.0%) |
| 3 or 4 Children | 0 (0.0%) | 0 (0.0%) |
| 5 or more Children | 0 (0.0%) | 0 (0.0%) |
| Total | 0 (0.0%) | 0 (0.0%) |
Income Below Poverty Among Married-Couple vs Single-Parent Households in Winger
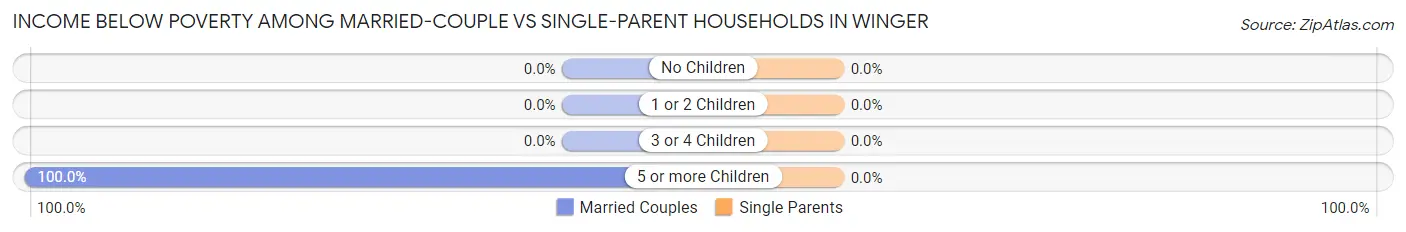
| Children | Married-Couple Families | Single-Parent Households |
| No Children | 0 (0.0%) | 0 (0.0%) |
| 1 or 2 Children | 0 (0.0%) | 0 (0.0%) |
| 3 or 4 Children | 0 (0.0%) | 0 (0.0%) |
| 5 or more Children | 3 (100.0%) | 0 (0.0%) |
| Total | 3 (9.7%) | 0 (0.0%) |
Race in Winger
The most populous races in Winger are White / Caucasian (133 | 85.8%), Two or more Races (18 | 11.6%), and Asian (2 | 1.3%).
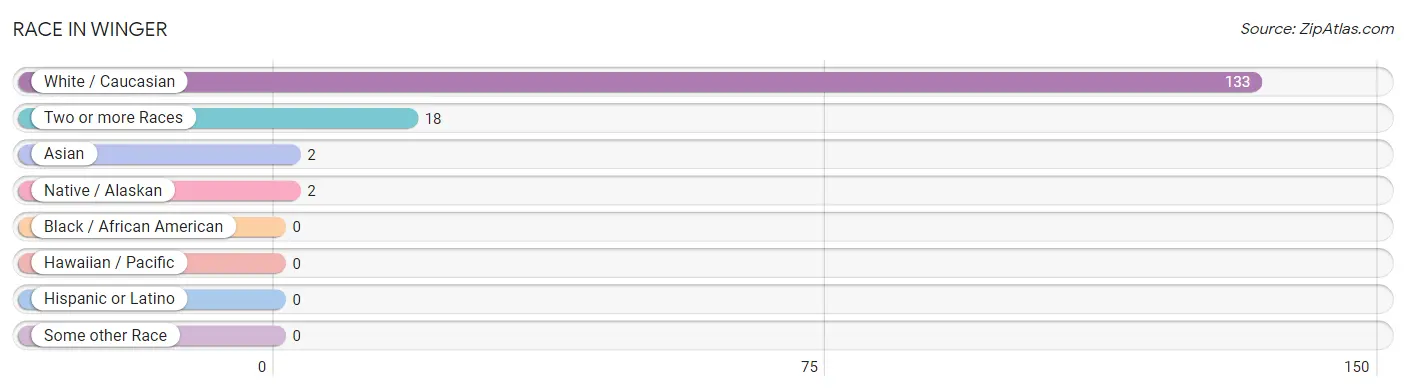
| Race | # Population | % Population |
| Asian | 2 | 1.3% |
| Black / African American | 0 | 0.0% |
| Hawaiian / Pacific | 0 | 0.0% |
| Hispanic or Latino | 0 | 0.0% |
| Native / Alaskan | 2 | 1.3% |
| White / Caucasian | 133 | 85.8% |
| Two or more Races | 18 | 11.6% |
| Some other Race | 0 | 0.0% |
| Total | 155 | 100.0% |
Ancestry in Winger
The most populous ancestries reported in Winger are Norwegian (73 | 47.1%), Czech (23 | 14.8%), German (21 | 13.6%), French (12 | 7.7%), and Scandinavian (8 | 5.2%), together accounting for 88.4% of all Winger residents.
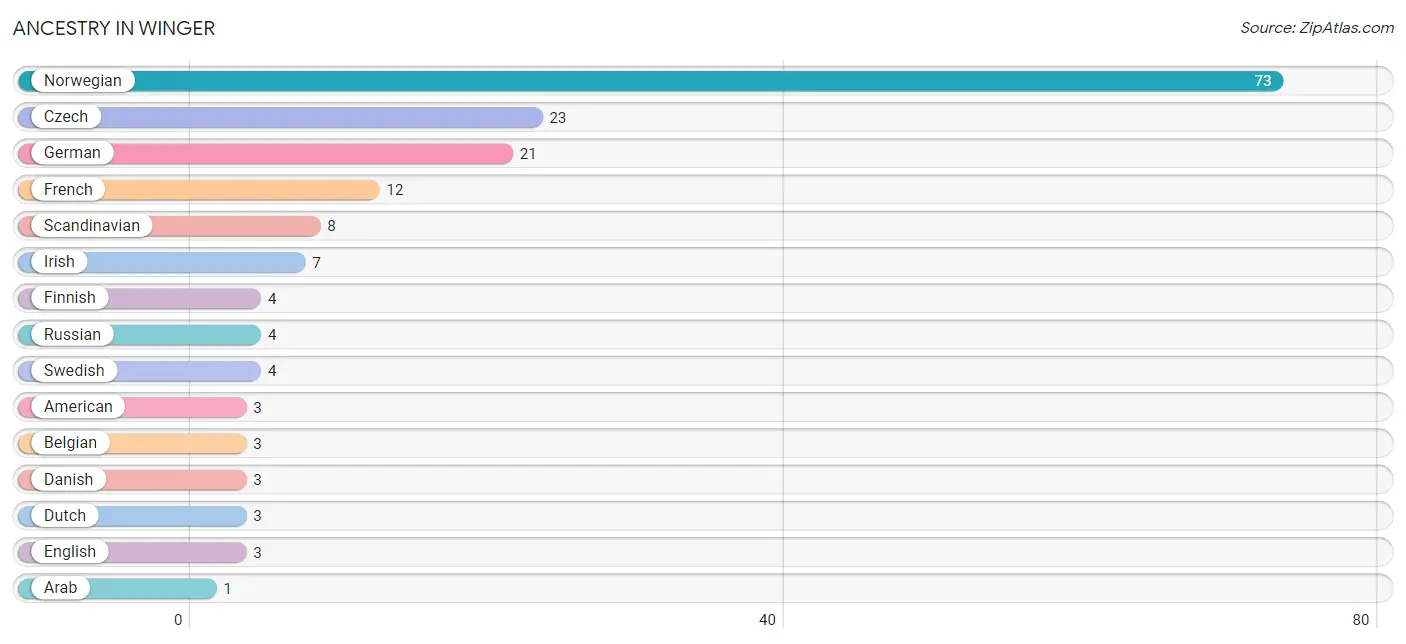
| Ancestry | # Population | % Population |
| American | 3 | 1.9% |
| Arab | 1 | 0.6% |
| Belgian | 3 | 1.9% |
| Burmese | 1 | 0.6% |
| Czech | 23 | 14.8% |
| Danish | 3 | 1.9% |
| Dutch | 3 | 1.9% |
| English | 3 | 1.9% |
| Finnish | 4 | 2.6% |
| French | 12 | 7.7% |
| German | 21 | 13.6% |
| Irish | 7 | 4.5% |
| Lebanese | 1 | 0.6% |
| Malaysian | 1 | 0.6% |
| Norwegian | 73 | 47.1% |
| Russian | 4 | 2.6% |
| Scandinavian | 8 | 5.2% |
| Scottish | 1 | 0.6% |
| Swedish | 4 | 2.6% | View All 19 Rows |
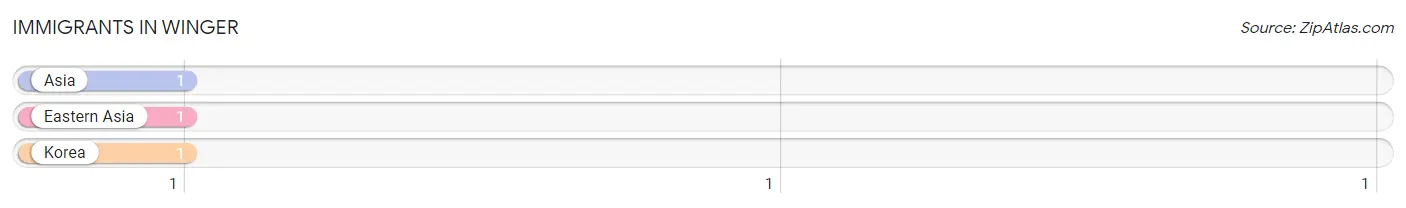
Immigrants in Winger
The most numerous immigrant groups reported in Winger came from Asia (1 | 0.6%), Eastern Asia (1 | 0.6%), and Korea (1 | 0.6%), together accounting for 1.9% of all Winger residents.
| Immigration Origin | # Population | % Population |
| Asia | 1 | 0.6% |
| Eastern Asia | 1 | 0.6% |
| Korea | 1 | 0.6% | View All 3 Rows |
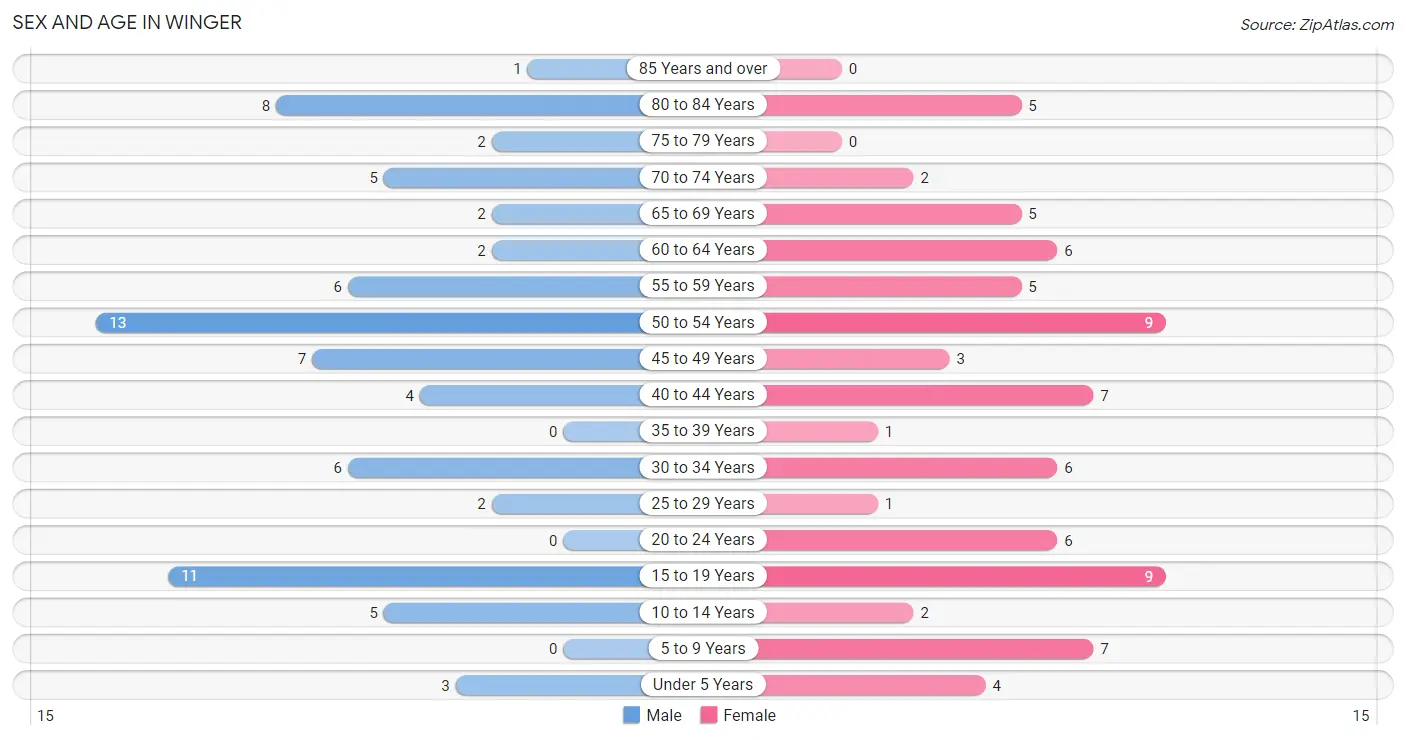
Sex and Age in Winger
Sex and Age in Winger
The most populous age groups in Winger are 50 to 54 Years (13 | 16.9%) for men and 15 to 19 Years (9 | 11.5%) for women.
| Age Bracket | Male | Female |
| Under 5 Years | 3 (3.9%) | 4 (5.1%) |
| 5 to 9 Years | 0 (0.0%) | 7 (9.0%) |
| 10 to 14 Years | 5 (6.5%) | 2 (2.6%) |
| 15 to 19 Years | 11 (14.3%) | 9 (11.5%) |
| 20 to 24 Years | 0 (0.0%) | 6 (7.7%) |
| 25 to 29 Years | 2 (2.6%) | 1 (1.3%) |
| 30 to 34 Years | 6 (7.8%) | 6 (7.7%) |
| 35 to 39 Years | 0 (0.0%) | 1 (1.3%) |
| 40 to 44 Years | 4 (5.2%) | 7 (9.0%) |
| 45 to 49 Years | 7 (9.1%) | 3 (3.8%) |
| 50 to 54 Years | 13 (16.9%) | 9 (11.5%) |
| 55 to 59 Years | 6 (7.8%) | 5 (6.4%) |
| 60 to 64 Years | 2 (2.6%) | 6 (7.7%) |
| 65 to 69 Years | 2 (2.6%) | 5 (6.4%) |
| 70 to 74 Years | 5 (6.5%) | 2 (2.6%) |
| 75 to 79 Years | 2 (2.6%) | 0 (0.0%) |
| 80 to 84 Years | 8 (10.4%) | 5 (6.4%) |
| 85 Years and over | 1 (1.3%) | 0 (0.0%) |
| Total | 77 (100.0%) | 78 (100.0%) |
Families and Households in Winger
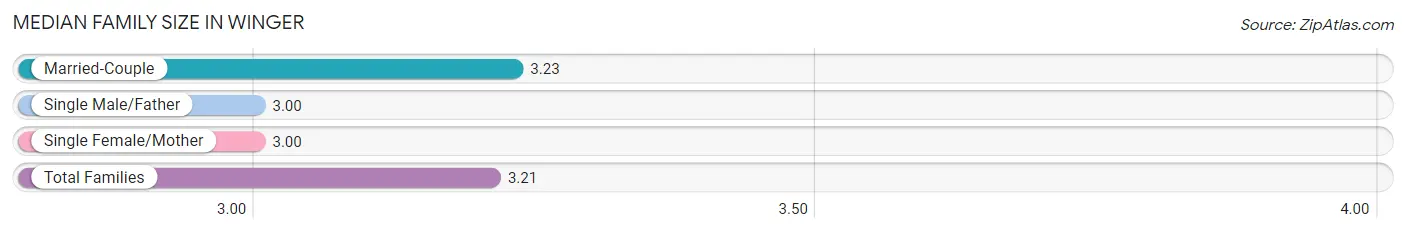
Median Family Size in Winger
The median family size in Winger is 3.21 persons per family, with married-couple families (31 | 91.2%) accounting for the largest median family size of 3.23 persons per family. On the other hand, single male/father families (2 | 5.9%) represent the smallest median family size with 3.00 persons per family.
| Family Type | # Families | Family Size |
| Married-Couple | 31 (91.2%) | 3.23 |
| Single Male/Father | 2 (5.9%) | 3.00 |
| Single Female/Mother | 1 (2.9%) | 3.00 |
| Total Families | 34 (100.0%) | 3.21 |
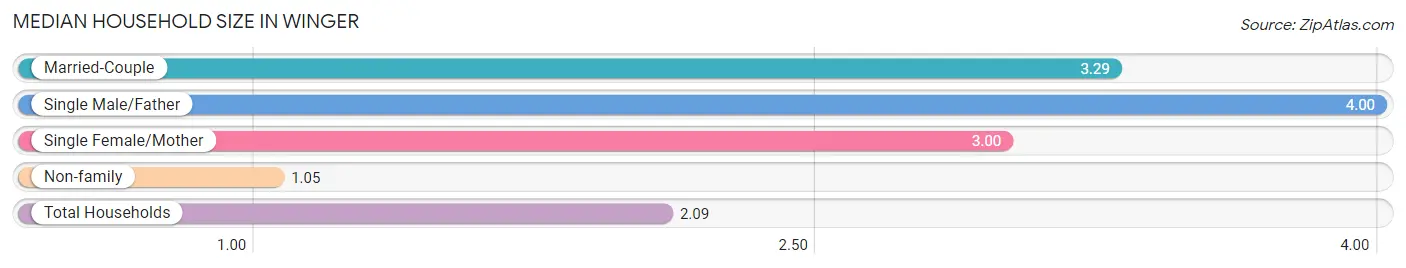
Median Household Size in Winger
The median household size in Winger is 2.09 persons per household, with single male/father households (2 | 2.7%) accounting for the largest median household size of 4 persons per household. non-family households (40 | 54.0%) represent the smallest median household size with 1.05 persons per household.
| Household Type | # Households | Household Size |
| Married-Couple | 31 (41.9%) | 3.29 |
| Single Male/Father | 2 (2.7%) | 4.00 |
| Single Female/Mother | 1 (1.3%) | 3.00 |
| Non-family | 40 (54.0%) | 1.05 |
| Total Households | 74 (100.0%) | 2.09 |
Household Size by Marriage Status in Winger
Out of a total of 74 households in Winger, 34 (46.0%) are family households, while 40 (54.0%) are nonfamily households. The most numerous type of family households are 2-person households, comprising 14, and the most common type of nonfamily households are 1-person households, comprising 37.
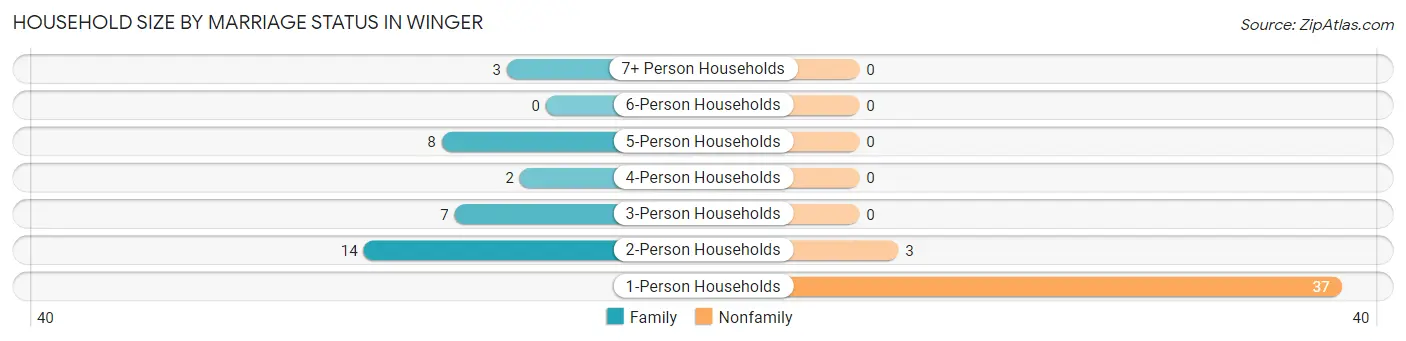
| Household Size | Family Households | Nonfamily Households |
| 1-Person Households | - | 37 (50.0%) |
| 2-Person Households | 14 (18.9%) | 3 (4.1%) |
| 3-Person Households | 7 (9.5%) | 0 (0.0%) |
| 4-Person Households | 2 (2.7%) | 0 (0.0%) |
| 5-Person Households | 8 (10.8%) | 0 (0.0%) |
| 6-Person Households | 0 (0.0%) | 0 (0.0%) |
| 7+ Person Households | 3 (4.1%) | 0 (0.0%) |
| Total | 34 (46.0%) | 40 (54.0%) |
Female Fertility in Winger
Fertility by Age in Winger
| Age Bracket | Women with Births | Births / 1,000 Women |
| 15 to 19 years | 0 (0.0%) | 0.0 |
| 20 to 34 years | 0 (0.0%) | 0.0 |
| 35 to 50 years | 0 (0.0%) | 0.0 |
| Total | 0 (0.0%) | 0.0 |
Fertility by Age by Marriage Status in Winger
| Age Bracket | Married | Unmarried |
| 15 to 19 years | 0 (0.0%) | 0 (0.0%) |
| 20 to 34 years | 0 (0.0%) | 0 (0.0%) |
| 35 to 50 years | 0 (0.0%) | 0 (0.0%) |
| Total | 0 (0.0%) | 0 (0.0%) |
Fertility by Education in Winger
| Educational Attainment | Women with Births | Births / 1,000 Women |
| Less than High School | 0 (0.0%) | 0.0 |
| High School Diploma | 0 (0.0%) | 0.0 |
| College or Associate's Degree | 0 (0.0%) | 0.0 |
| Bachelor's Degree | 0 (0.0%) | 0.0 |
| Graduate Degree | 0 (0.0%) | 0.0 |
| Total | 0 (0.0%) | 0.0 |
Fertility by Education by Marriage Status in Winger
| Educational Attainment | Married | Unmarried |
| Less than High School | 0 (0.0%) | 0 (0.0%) |
| High School Diploma | 0 (0.0%) | 0 (0.0%) |
| College or Associate's Degree | 0 (0.0%) | 0 (0.0%) |
| Bachelor's Degree | 0 (0.0%) | 0 (0.0%) |
| Graduate Degree | 0 (0.0%) | 0 (0.0%) |
| Total | 0 (0.0%) | 0 (0.0%) |
Employment Characteristics in Winger
Employment by Class of Employer in Winger
Among the 81 employed individuals in Winger, private company employees (32 | 39.5%), local government employees (23 | 28.4%), and not-for-profit organizations (9 | 11.1%) make up the most common classes of employment.
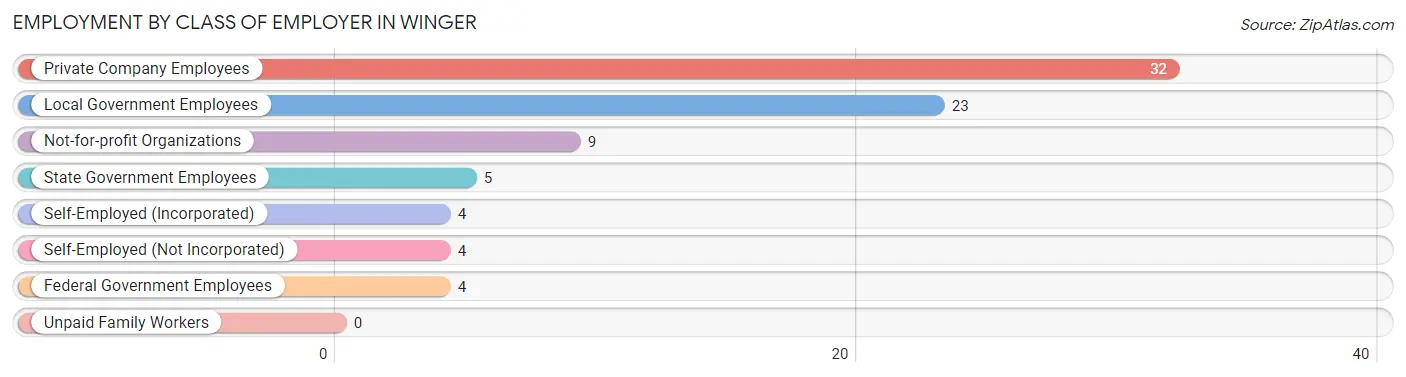
| Employer Class | # Employees | % Employees |
| Private Company Employees | 32 | 39.5% |
| Self-Employed (Incorporated) | 4 | 4.9% |
| Self-Employed (Not Incorporated) | 4 | 4.9% |
| Not-for-profit Organizations | 9 | 11.1% |
| Local Government Employees | 23 | 28.4% |
| State Government Employees | 5 | 6.2% |
| Federal Government Employees | 4 | 4.9% |
| Unpaid Family Workers | 0 | 0.0% |
| Total | 81 | 100.0% |
Employment Status by Age in Winger
According to the labor force statistics for Winger, out of the total population over 16 years of age (125), 69.6% or 87 individuals are in the labor force, with 3.5% or 3 of them unemployed. The age group with the highest labor force participation rate is 20 to 24 years, with 100.0% or 6 individuals in the labor force. Within the labor force, the 60 to 64 years age range has the highest percentage of unemployed individuals, with 37.5% or 3 of them being unemployed.
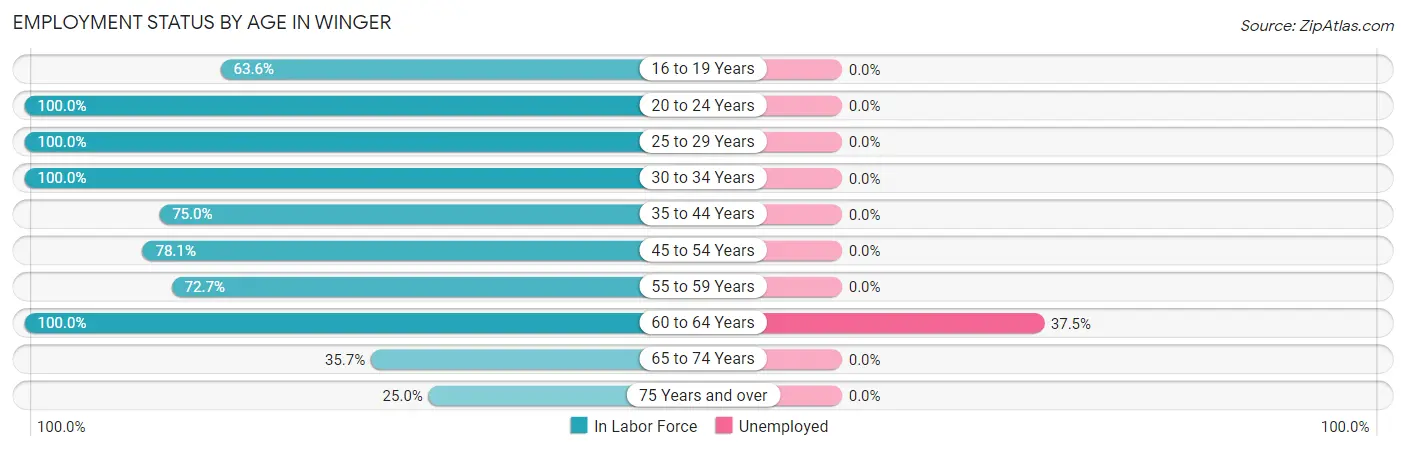
| Age Bracket | In Labor Force | Unemployed |
| 16 to 19 Years | 7 (63.6%) | 0 (0.0%) |
| 20 to 24 Years | 6 (100.0%) | 0 (0.0%) |
| 25 to 29 Years | 3 (100.0%) | 0 (0.0%) |
| 30 to 34 Years | 12 (100.0%) | 0 (0.0%) |
| 35 to 44 Years | 9 (75.0%) | 0 (0.0%) |
| 45 to 54 Years | 25 (78.1%) | 0 (0.0%) |
| 55 to 59 Years | 8 (72.7%) | 0 (0.0%) |
| 60 to 64 Years | 8 (100.0%) | 3 (37.5%) |
| 65 to 74 Years | 5 (35.7%) | 0 (0.0%) |
| 75 Years and over | 4 (25.0%) | 0 (0.0%) |
| Total | 87 (69.6%) | 3 (3.5%) |
Employment Status by Educational Attainment in Winger
According to labor force statistics for Winger, 83.3% of individuals (65) out of the total population between 25 and 64 years of age (78) are in the labor force, with 4.8% or 3 of them being unemployed. The group with the highest labor force participation rate are those with the educational attainment of less than high school, with 100.0% or 11 individuals in the labor force. Within the labor force, individuals with college / associate degree education have the highest percentage of unemployment, with 15.0% or 3 of them being unemployed.
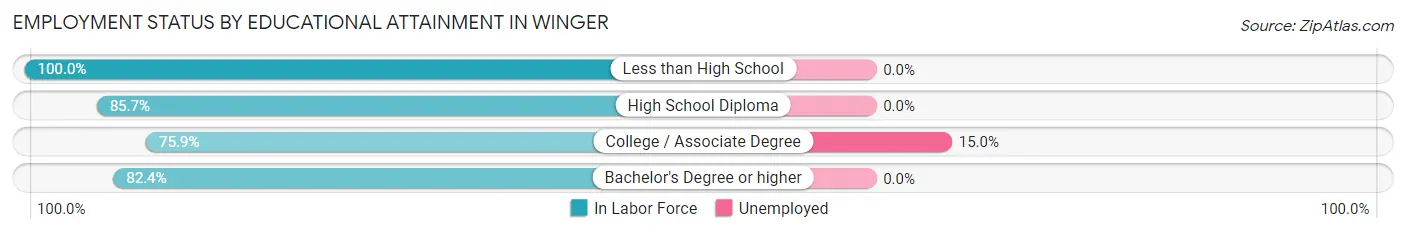
| Educational Attainment | In Labor Force | Unemployed |
| Less than High School | 11 (100.0%) | 0 (0.0%) |
| High School Diploma | 18 (85.7%) | 0 (0.0%) |
| College / Associate Degree | 22 (75.9%) | 4 (15.0%) |
| Bachelor's Degree or higher | 14 (82.4%) | 0 (0.0%) |
| Total | 65 (83.3%) | 4 (4.8%) |
Employment Occupations by Sex in Winger
Management, Business, Science and Arts Occupations
The most common Management, Business, Science and Arts occupations in Winger are Management (4 | 4.9%), Community & Social Service (4 | 4.9%), Education Instruction & Library (4 | 4.9%), Health Diagnosing & Treating (2 | 2.4%), and Business & Financial (1 | 1.2%).
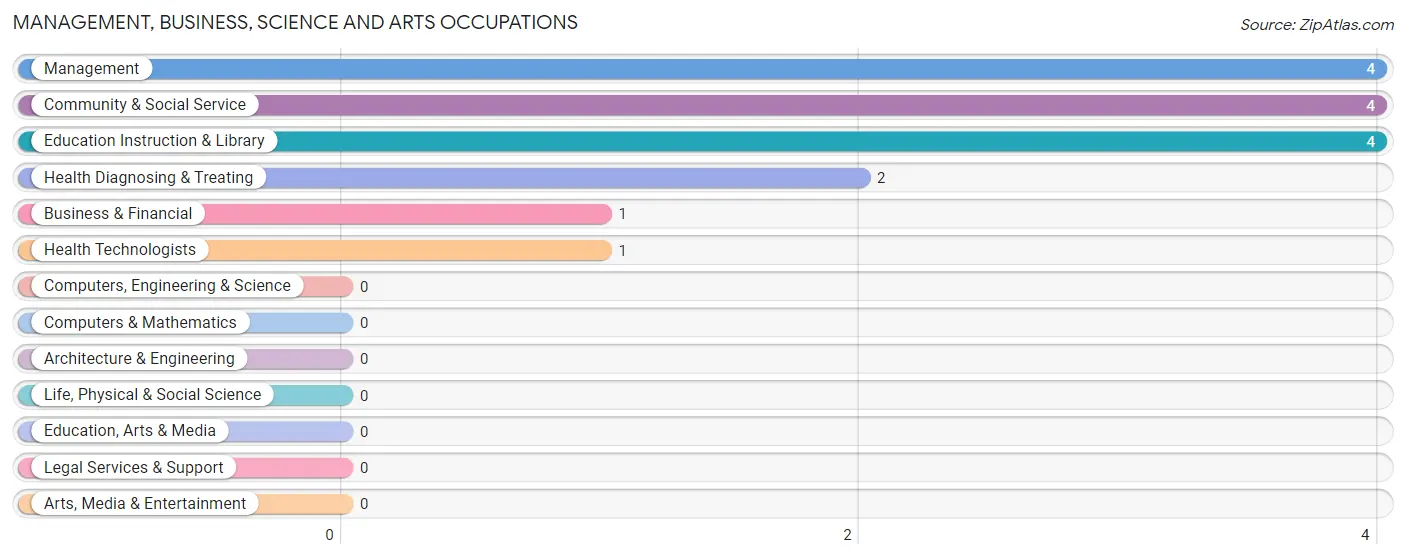
Management, Business, Science and Arts Occupations by Sex
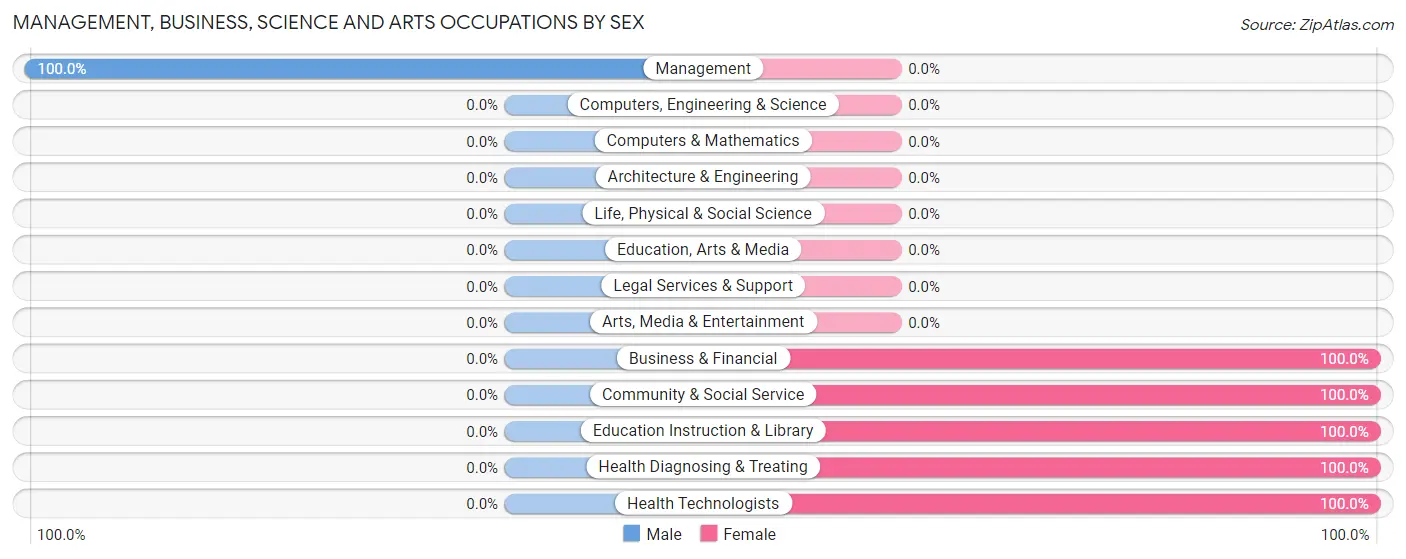
| Occupation | Male | Female |
| Management | 4 (100.0%) | 0 (0.0%) |
| Business & Financial | 0 (0.0%) | 1 (100.0%) |
| Computers, Engineering & Science | 0 (0.0%) | 0 (0.0%) |
| Computers & Mathematics | 0 (0.0%) | 0 (0.0%) |
| Architecture & Engineering | 0 (0.0%) | 0 (0.0%) |
| Life, Physical & Social Science | 0 (0.0%) | 0 (0.0%) |
| Community & Social Service | 0 (0.0%) | 4 (100.0%) |
| Education, Arts & Media | 0 (0.0%) | 0 (0.0%) |
| Legal Services & Support | 0 (0.0%) | 0 (0.0%) |
| Education Instruction & Library | 0 (0.0%) | 4 (100.0%) |
| Arts, Media & Entertainment | 0 (0.0%) | 0 (0.0%) |
| Health Diagnosing & Treating | 0 (0.0%) | 2 (100.0%) |
| Health Technologists | 0 (0.0%) | 1 (100.0%) |
| Total (Category) | 4 (36.4%) | 7 (63.6%) |
| Total (Overall) | 45 (54.9%) | 37 (45.1%) |
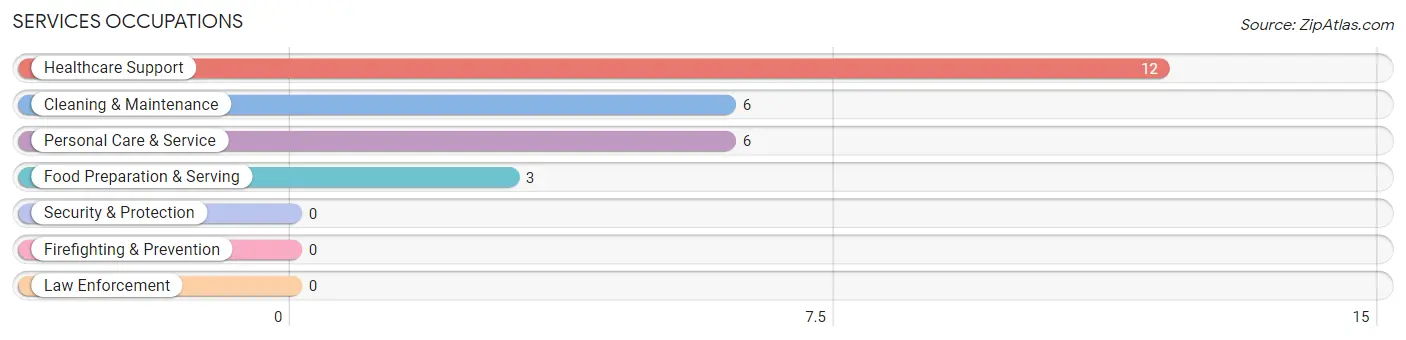
Services Occupations
The most common Services occupations in Winger are Healthcare Support (12 | 14.6%), Cleaning & Maintenance (6 | 7.3%), Personal Care & Service (6 | 7.3%), and Food Preparation & Serving (3 | 3.7%).
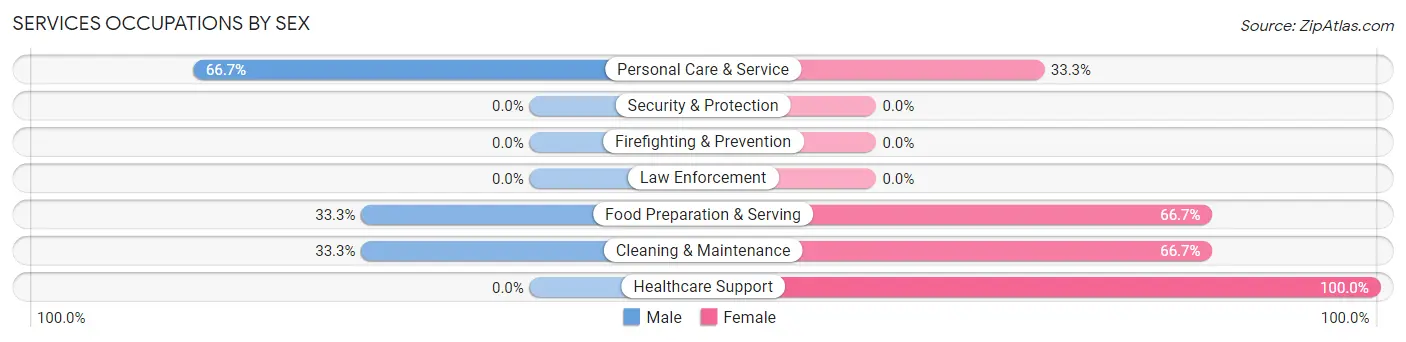
Services Occupations by Sex
Within the Services occupations in Winger, the most male-oriented occupations are Personal Care & Service (66.7%), Food Preparation & Serving (33.3%), and Cleaning & Maintenance (33.3%), while the most female-oriented occupations are Healthcare Support (100.0%), Food Preparation & Serving (66.7%), and Cleaning & Maintenance (66.7%).
| Occupation | Male | Female |
| Healthcare Support | 0 (0.0%) | 12 (100.0%) |
| Security & Protection | 0 (0.0%) | 0 (0.0%) |
| Firefighting & Prevention | 0 (0.0%) | 0 (0.0%) |
| Law Enforcement | 0 (0.0%) | 0 (0.0%) |
| Food Preparation & Serving | 1 (33.3%) | 2 (66.7%) |
| Cleaning & Maintenance | 2 (33.3%) | 4 (66.7%) |
| Personal Care & Service | 4 (66.7%) | 2 (33.3%) |
| Total (Category) | 7 (25.9%) | 20 (74.1%) |
| Total (Overall) | 45 (54.9%) | 37 (45.1%) |
Sales and Office Occupations
The most common Sales and Office occupations in Winger are Office & Administration (11 | 13.4%), and Sales & Related (2 | 2.4%).
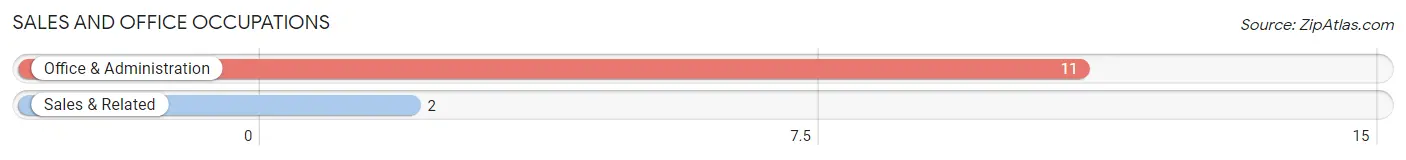
Sales and Office Occupations by Sex
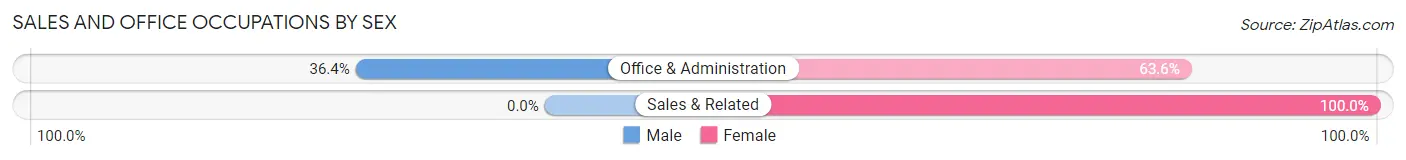
| Occupation | Male | Female |
| Sales & Related | 0 (0.0%) | 2 (100.0%) |
| Office & Administration | 4 (36.4%) | 7 (63.6%) |
| Total (Category) | 4 (30.8%) | 9 (69.2%) |
| Total (Overall) | 45 (54.9%) | 37 (45.1%) |
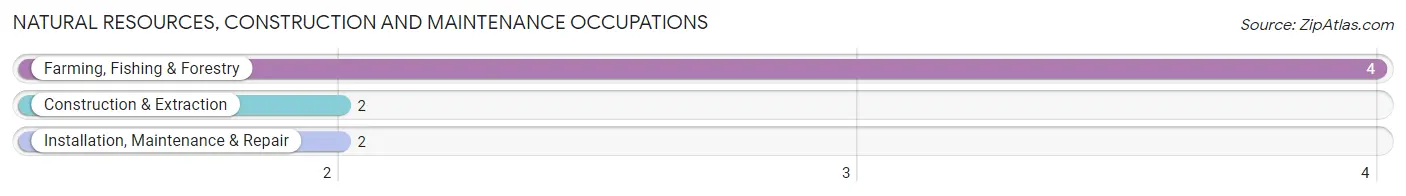
Natural Resources, Construction and Maintenance Occupations
The most common Natural Resources, Construction and Maintenance occupations in Winger are Farming, Fishing & Forestry (4 | 4.9%), Construction & Extraction (2 | 2.4%), and Installation, Maintenance & Repair (2 | 2.4%).
Natural Resources, Construction and Maintenance Occupations by Sex
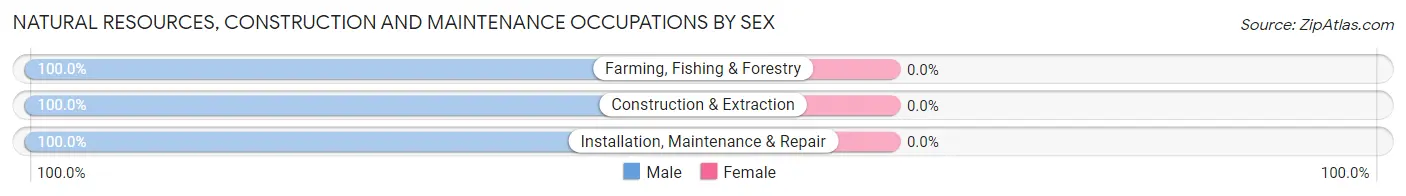
| Occupation | Male | Female |
| Farming, Fishing & Forestry | 4 (100.0%) | 0 (0.0%) |
| Construction & Extraction | 2 (100.0%) | 0 (0.0%) |
| Installation, Maintenance & Repair | 2 (100.0%) | 0 (0.0%) |
| Total (Category) | 8 (100.0%) | 0 (0.0%) |
| Total (Overall) | 45 (54.9%) | 37 (45.1%) |
Production, Transportation and Moving Occupations
The most common Production, Transportation and Moving occupations in Winger are Transportation (11 | 13.4%), Production (10 | 12.2%), and Material Moving (2 | 2.4%).
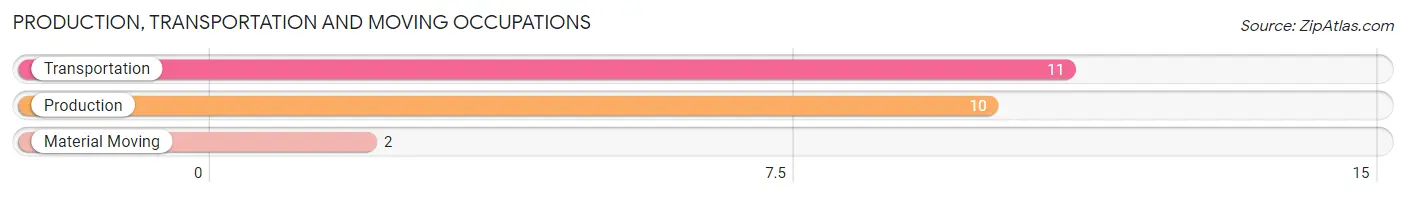
Production, Transportation and Moving Occupations by Sex
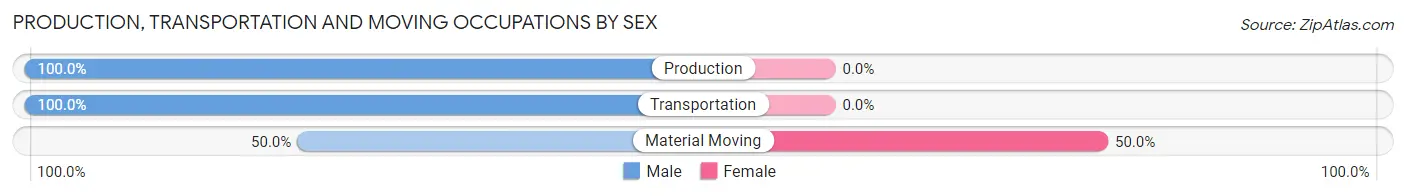
| Occupation | Male | Female |
| Production | 10 (100.0%) | 0 (0.0%) |
| Transportation | 11 (100.0%) | 0 (0.0%) |
| Material Moving | 1 (50.0%) | 1 (50.0%) |
| Total (Category) | 22 (95.7%) | 1 (4.3%) |
| Total (Overall) | 45 (54.9%) | 37 (45.1%) |
Employment Industries by Sex in Winger
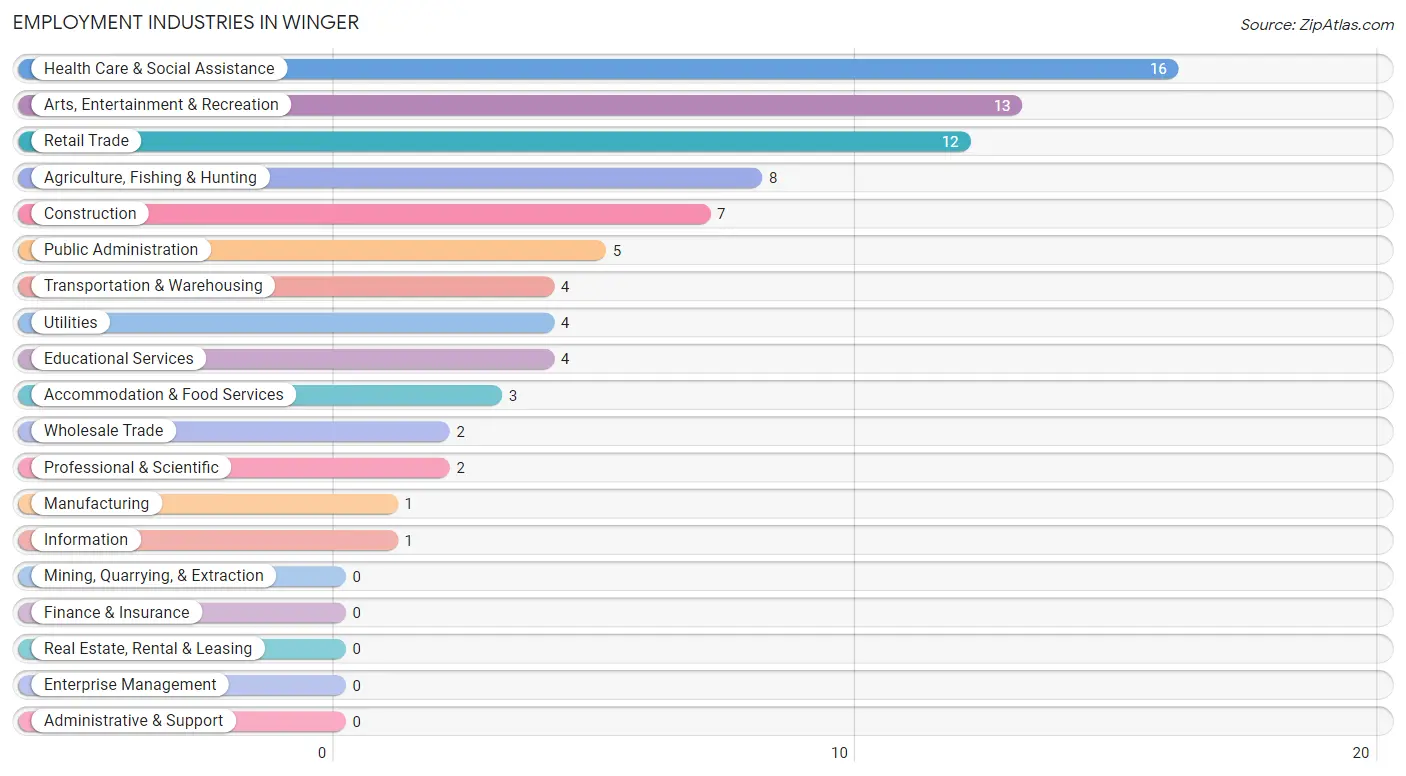
Employment Industries in Winger
The major employment industries in Winger include Health Care & Social Assistance (16 | 19.5%), Arts, Entertainment & Recreation (13 | 15.9%), Retail Trade (12 | 14.6%), Agriculture, Fishing & Hunting (8 | 9.8%), and Construction (7 | 8.5%).
Employment Industries by Sex in Winger
The Winger industries that see more men than women are Agriculture, Fishing & Hunting (100.0%), Construction (100.0%), and Transportation & Warehousing (100.0%), whereas the industries that tend to have a higher number of women are Manufacturing (100.0%), Wholesale Trade (100.0%), and Educational Services (100.0%).
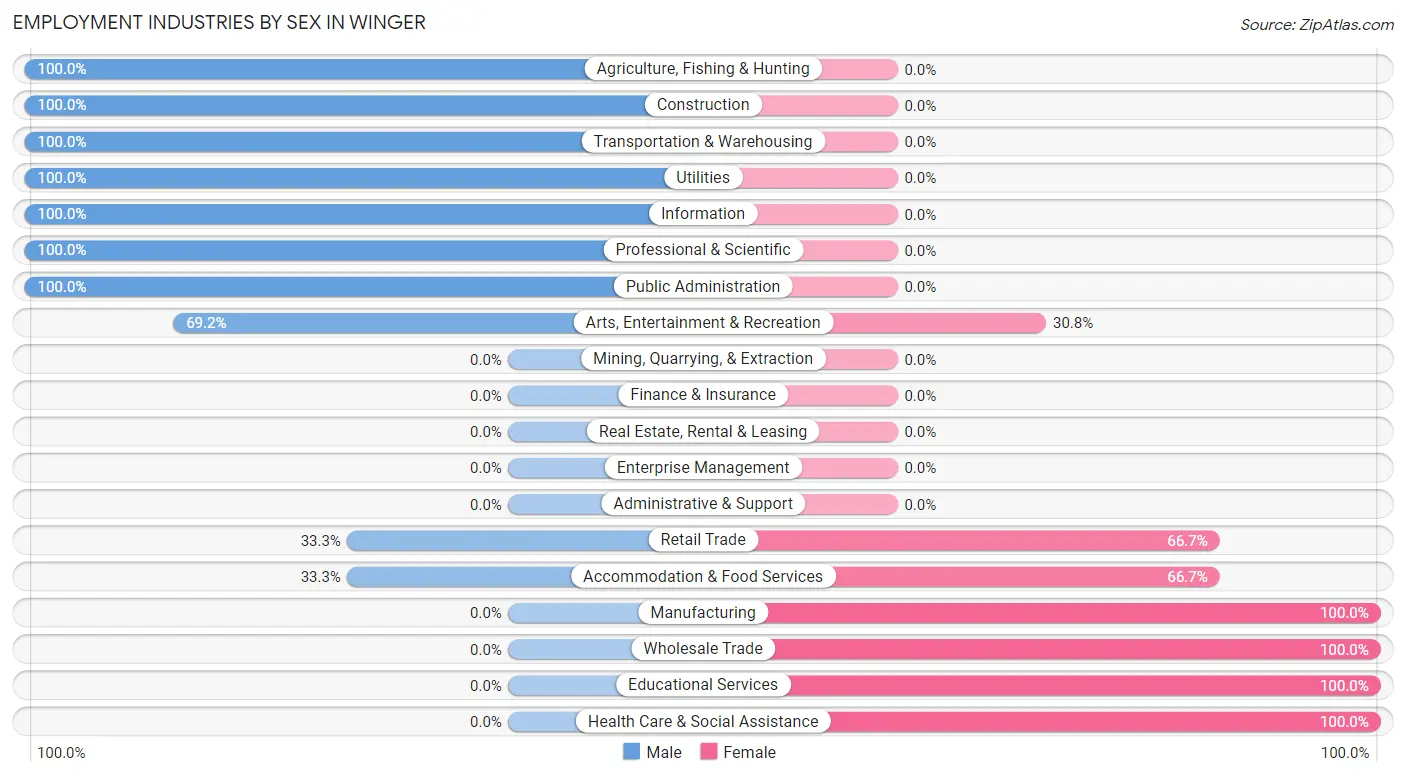
| Industry | Male | Female |
| Agriculture, Fishing & Hunting | 8 (100.0%) | 0 (0.0%) |
| Mining, Quarrying, & Extraction | 0 (0.0%) | 0 (0.0%) |
| Construction | 7 (100.0%) | 0 (0.0%) |
| Manufacturing | 0 (0.0%) | 1 (100.0%) |
| Wholesale Trade | 0 (0.0%) | 2 (100.0%) |
| Retail Trade | 4 (33.3%) | 8 (66.7%) |
| Transportation & Warehousing | 4 (100.0%) | 0 (0.0%) |
| Utilities | 4 (100.0%) | 0 (0.0%) |
| Information | 1 (100.0%) | 0 (0.0%) |
| Finance & Insurance | 0 (0.0%) | 0 (0.0%) |
| Real Estate, Rental & Leasing | 0 (0.0%) | 0 (0.0%) |
| Professional & Scientific | 2 (100.0%) | 0 (0.0%) |
| Enterprise Management | 0 (0.0%) | 0 (0.0%) |
| Administrative & Support | 0 (0.0%) | 0 (0.0%) |
| Educational Services | 0 (0.0%) | 4 (100.0%) |
| Health Care & Social Assistance | 0 (0.0%) | 16 (100.0%) |
| Arts, Entertainment & Recreation | 9 (69.2%) | 4 (30.8%) |
| Accommodation & Food Services | 1 (33.3%) | 2 (66.7%) |
| Public Administration | 5 (100.0%) | 0 (0.0%) |
| Total | 45 (54.9%) | 37 (45.1%) |
Education in Winger
School Enrollment in Winger
The most common levels of schooling among the 37 students in Winger are high school (24 | 64.9%), elementary school (9 | 24.3%), and college / undergraduate (2 | 5.4%).
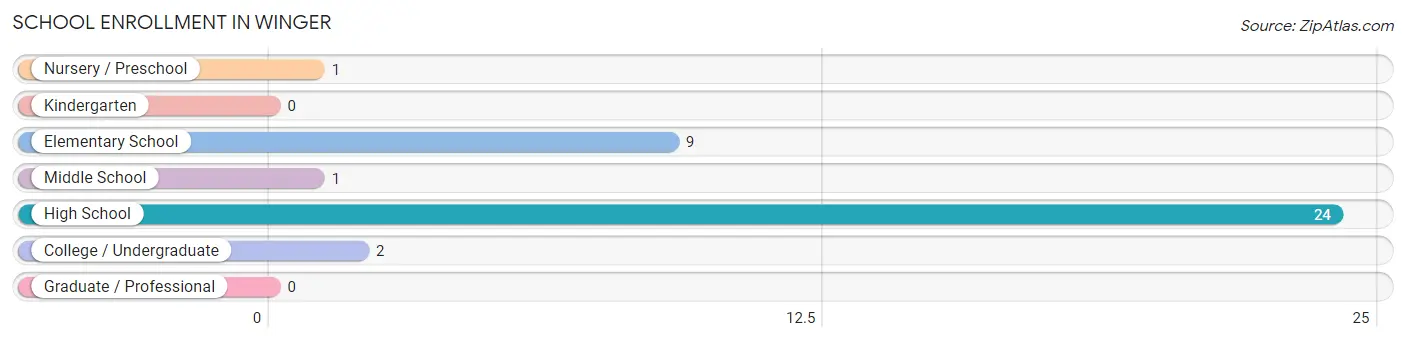
| School Level | # Students | % Students |
| Nursery / Preschool | 1 | 2.7% |
| Kindergarten | 0 | 0.0% |
| Elementary School | 9 | 24.3% |
| Middle School | 1 | 2.7% |
| High School | 24 | 64.9% |
| College / Undergraduate | 2 | 5.4% |
| Graduate / Professional | 0 | 0.0% |
| Total | 37 | 100.0% |
School Enrollment by Age by Funding Source in Winger
Out of a total of 37 students who are enrolled in schools in Winger, 2 (5.4%) attend a private institution, while the remaining 35 (94.6%) are enrolled in public schools. The age group of 35 years and over has the highest likelihood of being enrolled in private schools, with 1 (33.3% in the age bracket) enrolled. Conversely, the age group of 3 to 4 year olds has the lowest likelihood of being enrolled in a private school, with 1 (100.0% in the age bracket) attending a public institution.
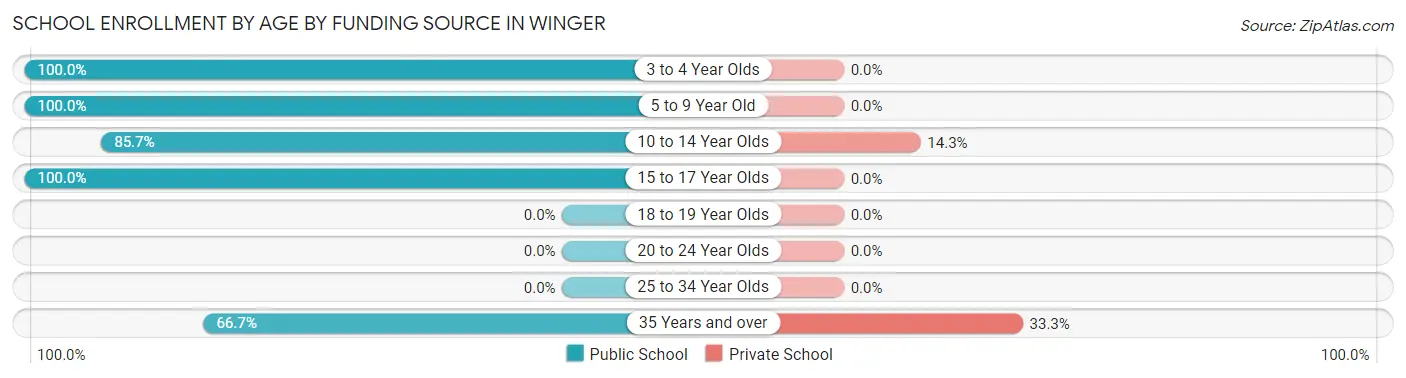
| Age Bracket | Public School | Private School |
| 3 to 4 Year Olds | 1 (100.0%) | 0 (0.0%) |
| 5 to 9 Year Old | 7 (100.0%) | 0 (0.0%) |
| 10 to 14 Year Olds | 6 (85.7%) | 1 (14.3%) |
| 15 to 17 Year Olds | 19 (100.0%) | 0 (0.0%) |
| 18 to 19 Year Olds | 0 (0.0%) | 0 (0.0%) |
| 20 to 24 Year Olds | 0 (0.0%) | 0 (0.0%) |
| 25 to 34 Year Olds | 0 (0.0%) | 0 (0.0%) |
| 35 Years and over | 2 (66.7%) | 1 (33.3%) |
| Total | 35 (94.6%) | 2 (5.4%) |
Educational Attainment by Field of Study in Winger
Education (11 | 44.0%), liberal arts & history (8 | 32.0%), communications (3 | 12.0%), bio, nature & agricultural (2 | 8.0%), and science & technology (1 | 4.0%) are the most common fields of study among 25 individuals in Winger who have obtained a bachelor's degree or higher.
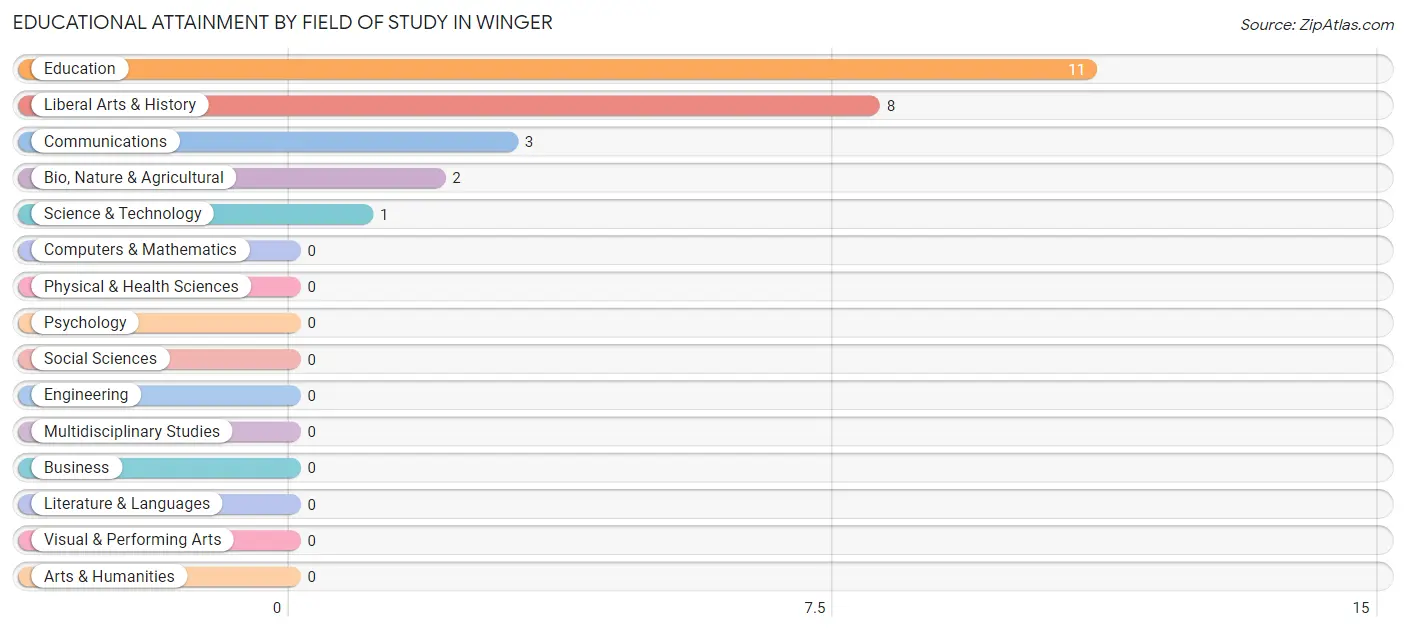
| Field of Study | # Graduates | % Graduates |
| Computers & Mathematics | 0 | 0.0% |
| Bio, Nature & Agricultural | 2 | 8.0% |
| Physical & Health Sciences | 0 | 0.0% |
| Psychology | 0 | 0.0% |
| Social Sciences | 0 | 0.0% |
| Engineering | 0 | 0.0% |
| Multidisciplinary Studies | 0 | 0.0% |
| Science & Technology | 1 | 4.0% |
| Business | 0 | 0.0% |
| Education | 11 | 44.0% |
| Literature & Languages | 0 | 0.0% |
| Liberal Arts & History | 8 | 32.0% |
| Visual & Performing Arts | 0 | 0.0% |
| Communications | 3 | 12.0% |
| Arts & Humanities | 0 | 0.0% |
| Total | 25 | 100.0% |
Transportation & Commute in Winger
Vehicle Availability by Sex in Winger
The most prevalent vehicle ownership categories in Winger are males with 1 vehicle (17, accounting for 37.8%) and females with 1 vehicle (17, making up 47.2%).
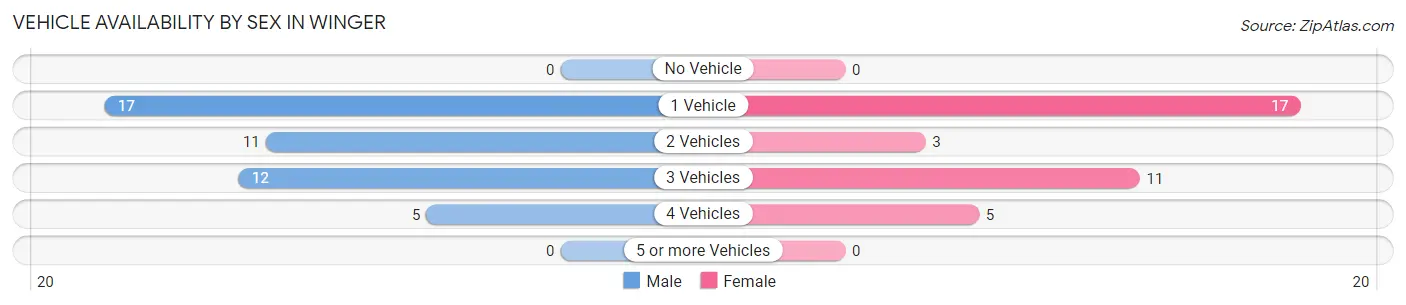
| Vehicles Available | Male | Female |
| No Vehicle | 0 (0.0%) | 0 (0.0%) |
| 1 Vehicle | 17 (37.8%) | 17 (47.2%) |
| 2 Vehicles | 11 (24.4%) | 3 (8.3%) |
| 3 Vehicles | 12 (26.7%) | 11 (30.6%) |
| 4 Vehicles | 5 (11.1%) | 5 (13.9%) |
| 5 or more Vehicles | 0 (0.0%) | 0 (0.0%) |
| Total | 45 (100.0%) | 36 (100.0%) |
Commute Time in Winger
The most frequently occuring commute durations in Winger are 20 to 24 minutes (24 commuters, 31.6%), 10 to 14 minutes (15 commuters, 19.7%), and 5 to 9 minutes (11 commuters, 14.5%).
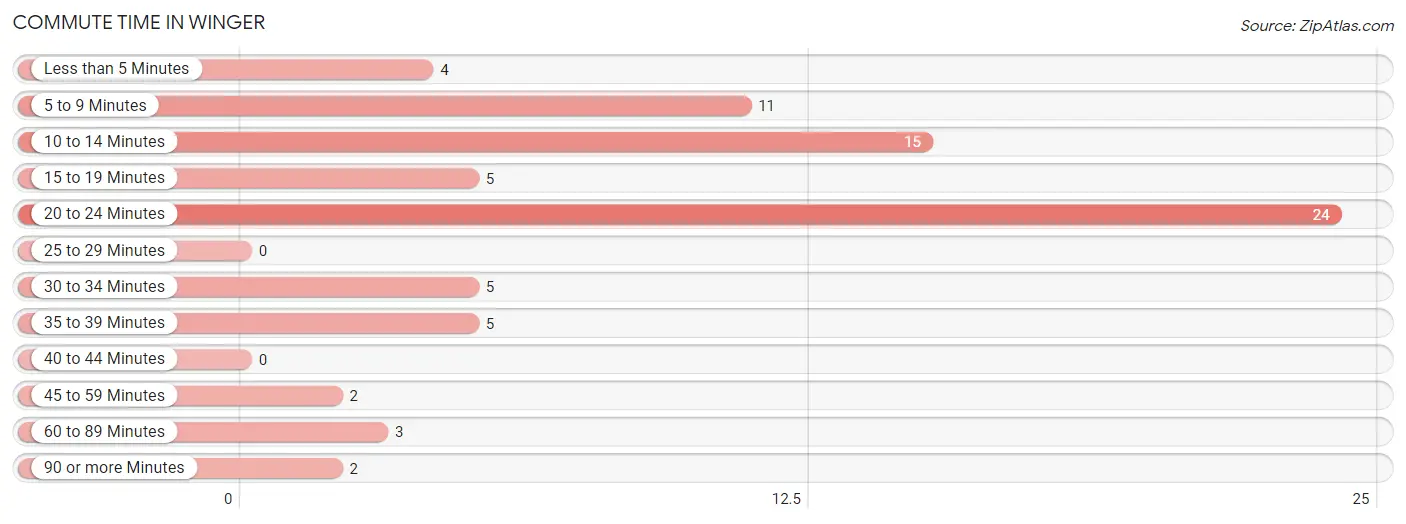
| Commute Time | # Commuters | % Commuters |
| Less than 5 Minutes | 4 | 5.3% |
| 5 to 9 Minutes | 11 | 14.5% |
| 10 to 14 Minutes | 15 | 19.7% |
| 15 to 19 Minutes | 5 | 6.6% |
| 20 to 24 Minutes | 24 | 31.6% |
| 25 to 29 Minutes | 0 | 0.0% |
| 30 to 34 Minutes | 5 | 6.6% |
| 35 to 39 Minutes | 5 | 6.6% |
| 40 to 44 Minutes | 0 | 0.0% |
| 45 to 59 Minutes | 2 | 2.6% |
| 60 to 89 Minutes | 3 | 4.0% |
| 90 or more Minutes | 2 | 2.6% |
Commute Time by Sex in Winger
The most common commute times in Winger are 20 to 24 minutes (11 commuters, 27.5%) for males and 20 to 24 minutes (13 commuters, 36.1%) for females.
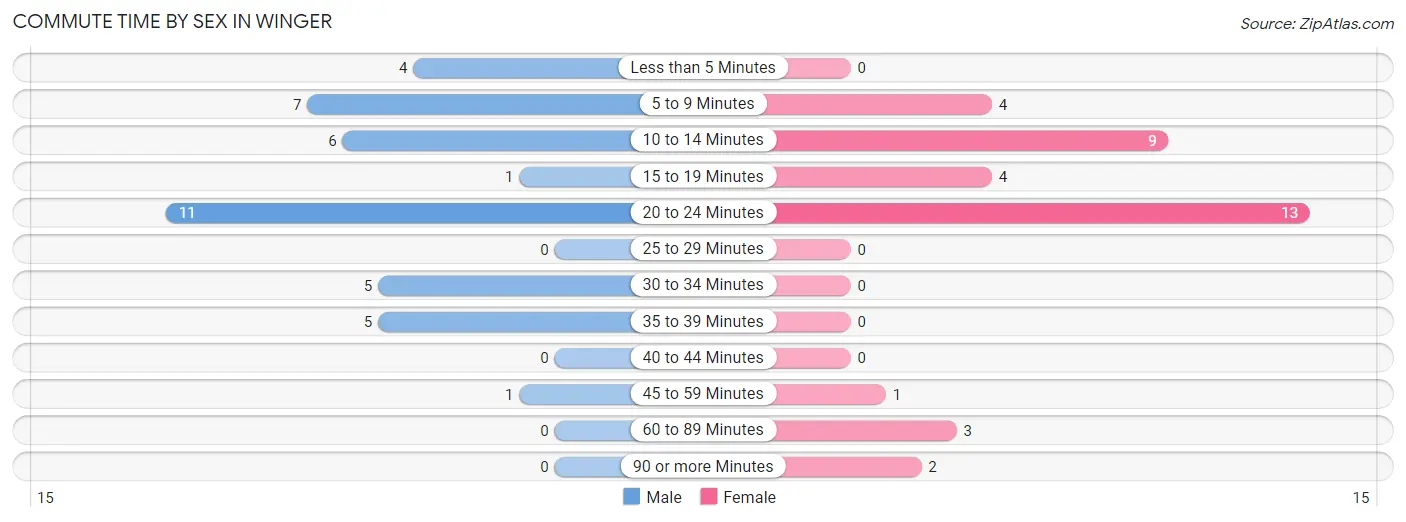
| Commute Time | Male | Female |
| Less than 5 Minutes | 4 (10.0%) | 0 (0.0%) |
| 5 to 9 Minutes | 7 (17.5%) | 4 (11.1%) |
| 10 to 14 Minutes | 6 (15.0%) | 9 (25.0%) |
| 15 to 19 Minutes | 1 (2.5%) | 4 (11.1%) |
| 20 to 24 Minutes | 11 (27.5%) | 13 (36.1%) |
| 25 to 29 Minutes | 0 (0.0%) | 0 (0.0%) |
| 30 to 34 Minutes | 5 (12.5%) | 0 (0.0%) |
| 35 to 39 Minutes | 5 (12.5%) | 0 (0.0%) |
| 40 to 44 Minutes | 0 (0.0%) | 0 (0.0%) |
| 45 to 59 Minutes | 1 (2.5%) | 1 (2.8%) |
| 60 to 89 Minutes | 0 (0.0%) | 3 (8.3%) |
| 90 or more Minutes | 0 (0.0%) | 2 (5.6%) |
Time of Departure to Work by Sex in Winger
The most frequent times of departure to work in Winger are 9:00 AM to 9:59 AM (8, 20.0%) for males and 7:30 AM to 7:59 AM (11, 30.6%) for females.
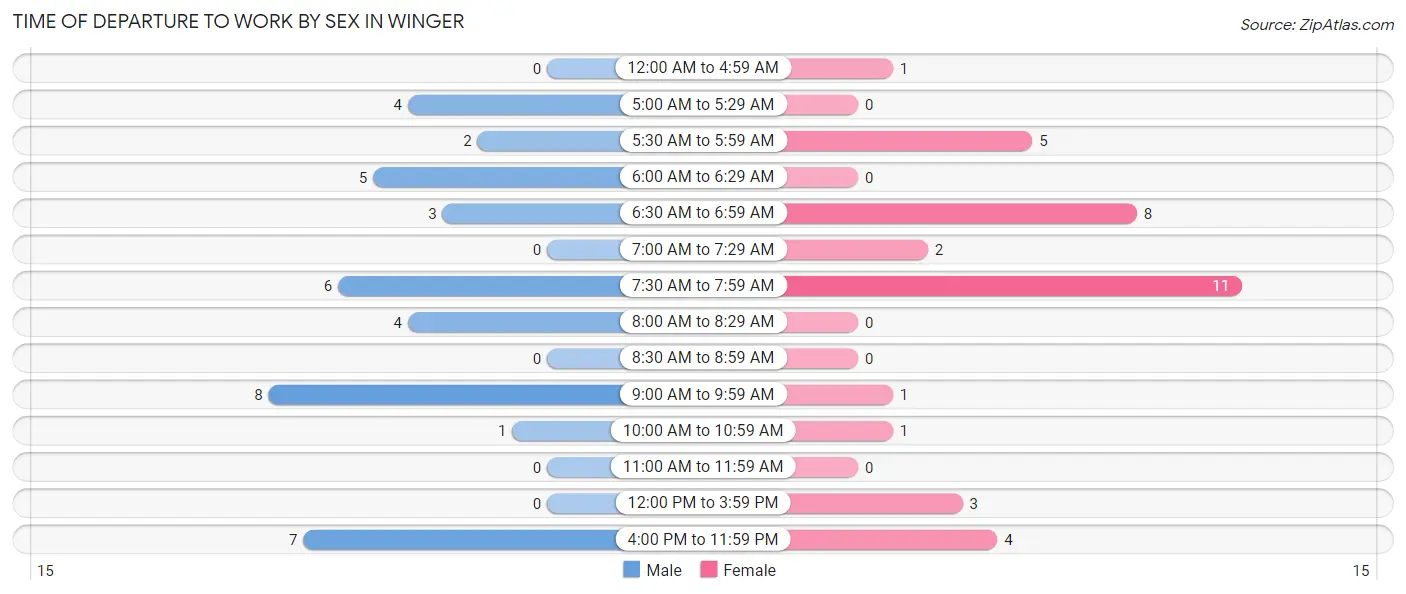
| Time of Departure | Male | Female |
| 12:00 AM to 4:59 AM | 0 (0.0%) | 1 (2.8%) |
| 5:00 AM to 5:29 AM | 4 (10.0%) | 0 (0.0%) |
| 5:30 AM to 5:59 AM | 2 (5.0%) | 5 (13.9%) |
| 6:00 AM to 6:29 AM | 5 (12.5%) | 0 (0.0%) |
| 6:30 AM to 6:59 AM | 3 (7.5%) | 8 (22.2%) |
| 7:00 AM to 7:29 AM | 0 (0.0%) | 2 (5.6%) |
| 7:30 AM to 7:59 AM | 6 (15.0%) | 11 (30.6%) |
| 8:00 AM to 8:29 AM | 4 (10.0%) | 0 (0.0%) |
| 8:30 AM to 8:59 AM | 0 (0.0%) | 0 (0.0%) |
| 9:00 AM to 9:59 AM | 8 (20.0%) | 1 (2.8%) |
| 10:00 AM to 10:59 AM | 1 (2.5%) | 1 (2.8%) |
| 11:00 AM to 11:59 AM | 0 (0.0%) | 0 (0.0%) |
| 12:00 PM to 3:59 PM | 0 (0.0%) | 3 (8.3%) |
| 4:00 PM to 11:59 PM | 7 (17.5%) | 4 (11.1%) |
| Total | 40 (100.0%) | 36 (100.0%) |
Housing Occupancy in Winger
Occupancy by Ownership in Winger
Of the total 74 dwellings in Winger, owner-occupied units account for 55 (74.3%), while renter-occupied units make up 19 (25.7%).
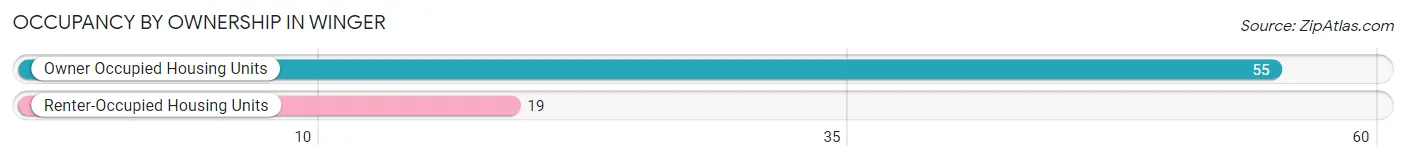
| Occupancy | # Housing Units | % Housing Units |
| Owner Occupied Housing Units | 55 | 74.3% |
| Renter-Occupied Housing Units | 19 | 25.7% |
| Total Occupied Housing Units | 74 | 100.0% |
Occupancy by Household Size in Winger
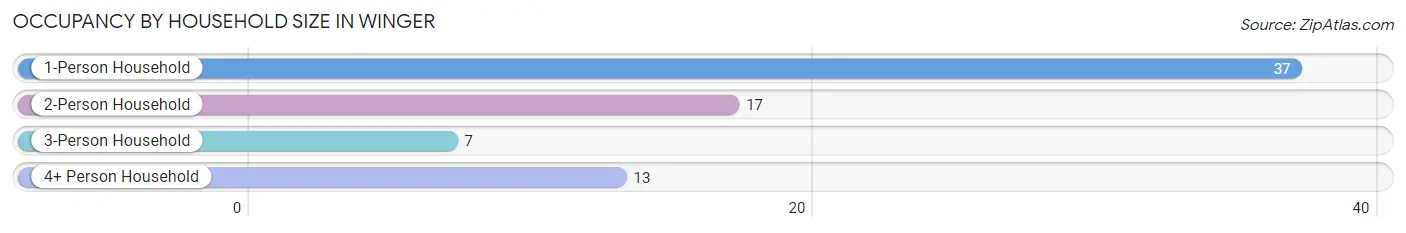
| Household Size | # Housing Units | % Housing Units |
| 1-Person Household | 37 | 50.0% |
| 2-Person Household | 17 | 23.0% |
| 3-Person Household | 7 | 9.5% |
| 4+ Person Household | 13 | 17.6% |
| Total Housing Units | 74 | 100.0% |
Occupancy by Ownership by Household Size in Winger
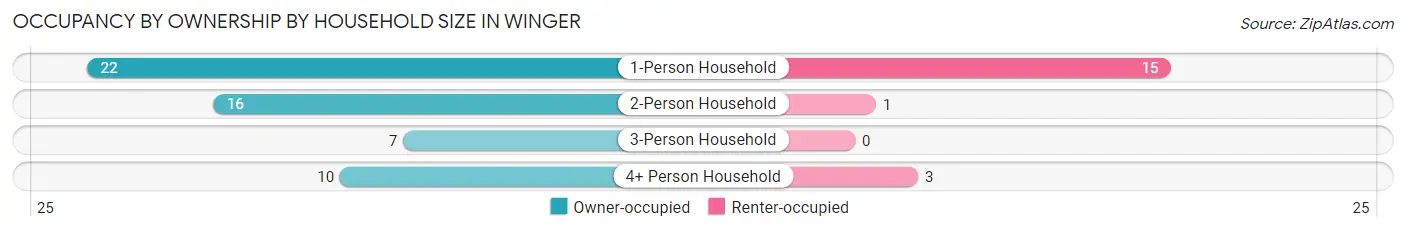
| Household Size | Owner-occupied | Renter-occupied |
| 1-Person Household | 22 (59.5%) | 15 (40.5%) |
| 2-Person Household | 16 (94.1%) | 1 (5.9%) |
| 3-Person Household | 7 (100.0%) | 0 (0.0%) |
| 4+ Person Household | 10 (76.9%) | 3 (23.1%) |
| Total Housing Units | 55 (74.3%) | 19 (25.7%) |
Occupancy by Educational Attainment in Winger
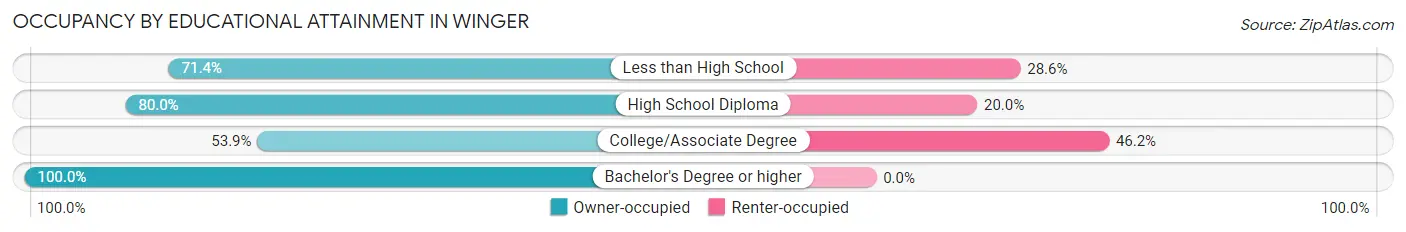
| Household Size | Owner-occupied | Renter-occupied |
| Less than High School | 5 (71.4%) | 2 (28.6%) |
| High School Diploma | 20 (80.0%) | 5 (20.0%) |
| College/Associate Degree | 14 (53.8%) | 12 (46.2%) |
| Bachelor's Degree or higher | 16 (100.0%) | 0 (0.0%) |
Occupancy by Age of Householder in Winger
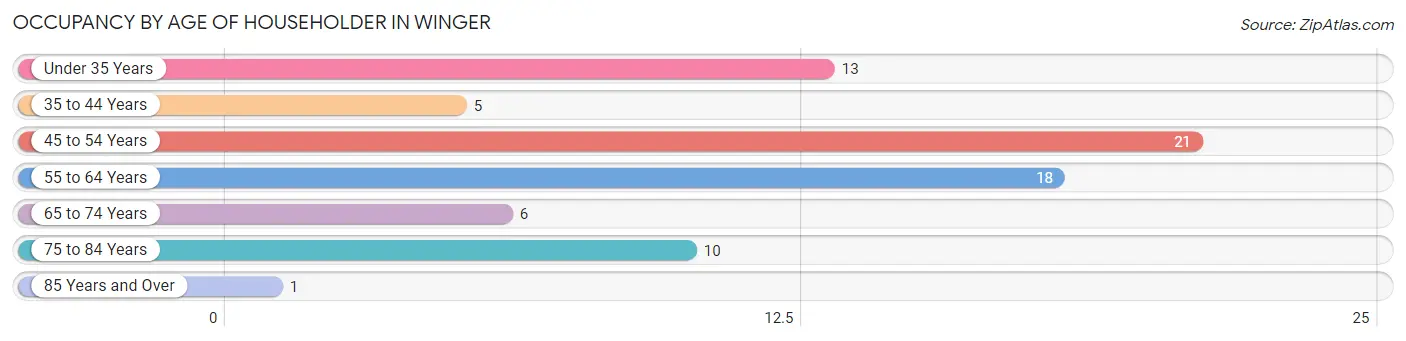
| Age Bracket | # Households | % Households |
| Under 35 Years | 13 | 17.6% |
| 35 to 44 Years | 5 | 6.8% |
| 45 to 54 Years | 21 | 28.4% |
| 55 to 64 Years | 18 | 24.3% |
| 65 to 74 Years | 6 | 8.1% |
| 75 to 84 Years | 10 | 13.5% |
| 85 Years and Over | 1 | 1.3% |
| Total | 74 | 100.0% |
Housing Finances in Winger
Median Income by Occupancy in Winger
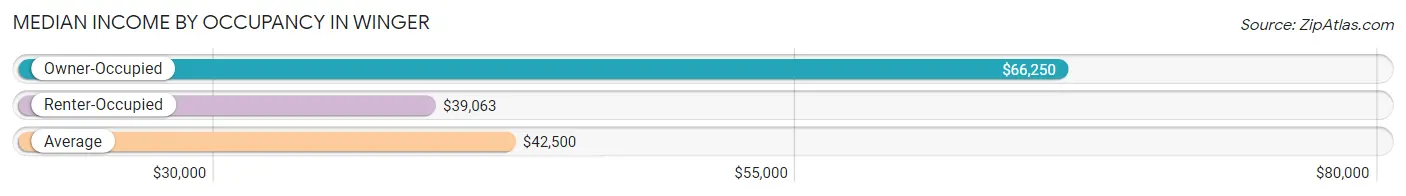
| Occupancy Type | # Households | Median Income |
| Owner-Occupied | 55 (74.3%) | $66,250 |
| Renter-Occupied | 19 (25.7%) | $39,063 |
| Average | 74 (100.0%) | $42,500 |
Occupancy by Householder Income Bracket in Winger
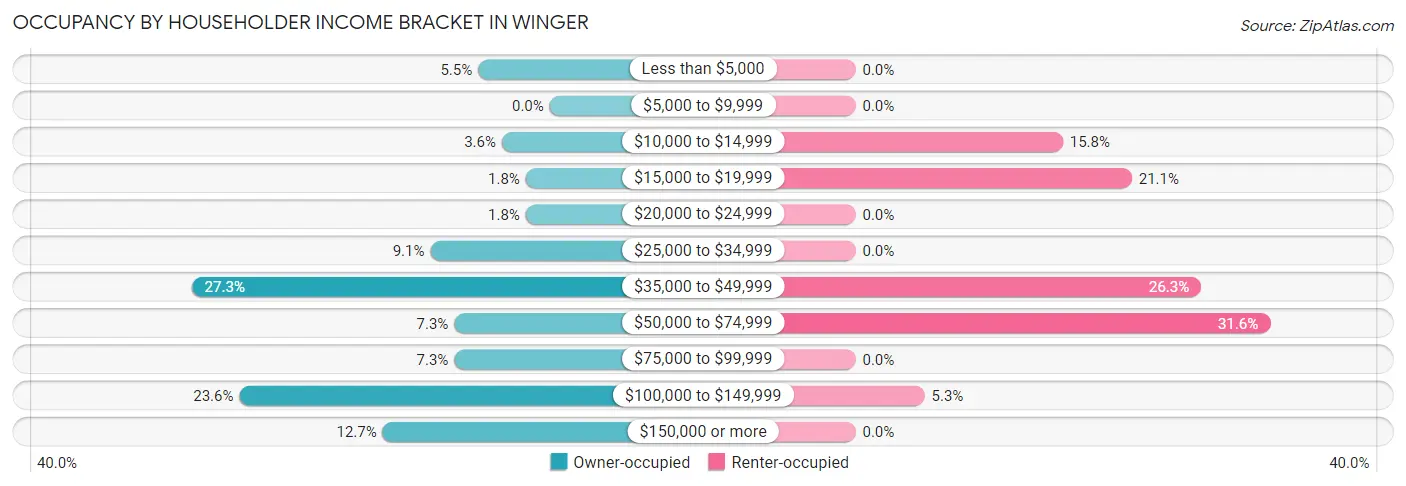
| Income Bracket | Owner-occupied | Renter-occupied |
| Less than $5,000 | 3 (5.4%) | 0 (0.0%) |
| $5,000 to $9,999 | 0 (0.0%) | 0 (0.0%) |
| $10,000 to $14,999 | 2 (3.6%) | 3 (15.8%) |
| $15,000 to $19,999 | 1 (1.8%) | 4 (21.0%) |
| $20,000 to $24,999 | 1 (1.8%) | 0 (0.0%) |
| $25,000 to $34,999 | 5 (9.1%) | 0 (0.0%) |
| $35,000 to $49,999 | 15 (27.3%) | 5 (26.3%) |
| $50,000 to $74,999 | 4 (7.3%) | 6 (31.6%) |
| $75,000 to $99,999 | 4 (7.3%) | 0 (0.0%) |
| $100,000 to $149,999 | 13 (23.6%) | 1 (5.3%) |
| $150,000 or more | 7 (12.7%) | 0 (0.0%) |
| Total | 55 (100.0%) | 19 (100.0%) |
Monthly Housing Cost Tiers in Winger
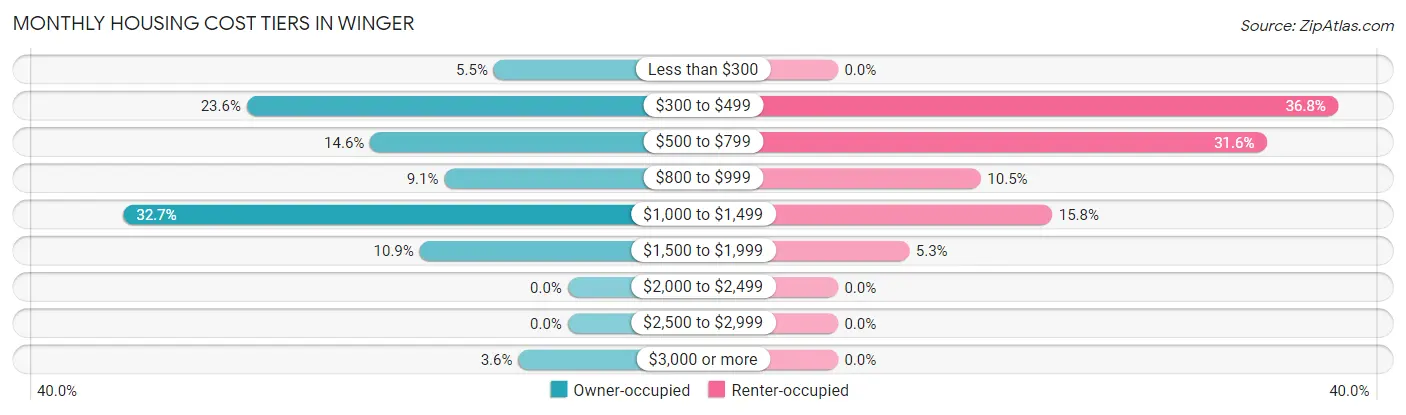
| Monthly Cost | Owner-occupied | Renter-occupied |
| Less than $300 | 3 (5.4%) | 0 (0.0%) |
| $300 to $499 | 13 (23.6%) | 7 (36.8%) |
| $500 to $799 | 8 (14.5%) | 6 (31.6%) |
| $800 to $999 | 5 (9.1%) | 2 (10.5%) |
| $1,000 to $1,499 | 18 (32.7%) | 3 (15.8%) |
| $1,500 to $1,999 | 6 (10.9%) | 1 (5.3%) |
| $2,000 to $2,499 | 0 (0.0%) | 0 (0.0%) |
| $2,500 to $2,999 | 0 (0.0%) | 0 (0.0%) |
| $3,000 or more | 2 (3.6%) | 0 (0.0%) |
| Total | 55 (100.0%) | 19 (100.0%) |
Physical Housing Characteristics in Winger
Housing Structures in Winger
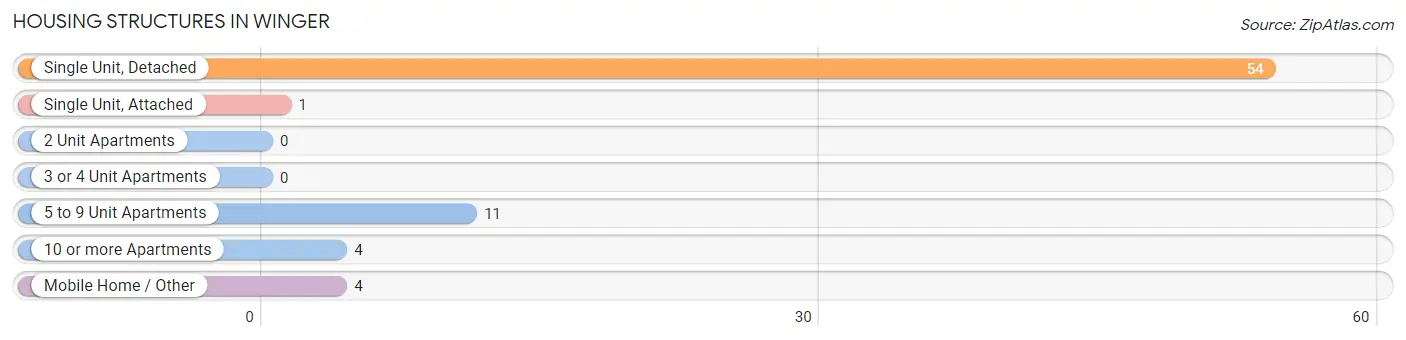
| Structure Type | # Housing Units | % Housing Units |
| Single Unit, Detached | 54 | 73.0% |
| Single Unit, Attached | 1 | 1.3% |
| 2 Unit Apartments | 0 | 0.0% |
| 3 or 4 Unit Apartments | 0 | 0.0% |
| 5 to 9 Unit Apartments | 11 | 14.9% |
| 10 or more Apartments | 4 | 5.4% |
| Mobile Home / Other | 4 | 5.4% |
| Total | 74 | 100.0% |
Housing Structures by Occupancy in Winger
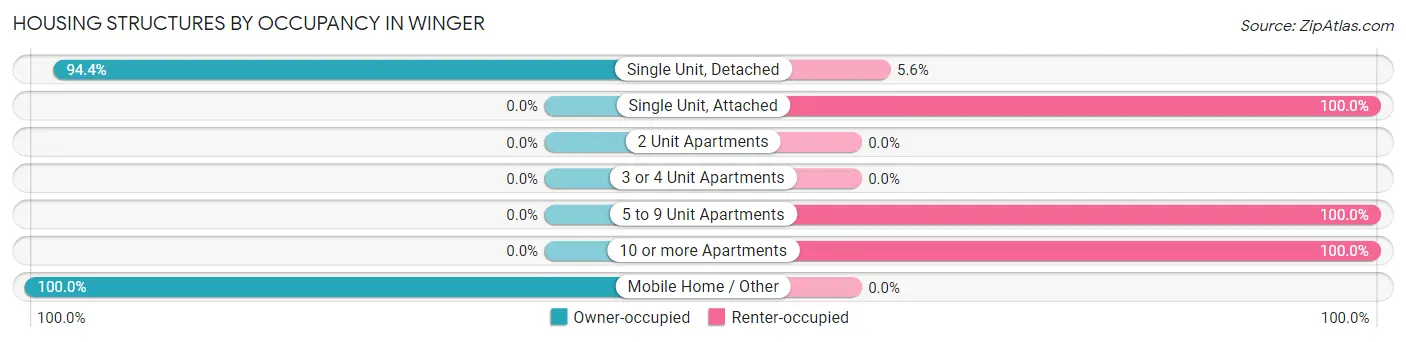
| Structure Type | Owner-occupied | Renter-occupied |
| Single Unit, Detached | 51 (94.4%) | 3 (5.6%) |
| Single Unit, Attached | 0 (0.0%) | 1 (100.0%) |
| 2 Unit Apartments | 0 (0.0%) | 0 (0.0%) |
| 3 or 4 Unit Apartments | 0 (0.0%) | 0 (0.0%) |
| 5 to 9 Unit Apartments | 0 (0.0%) | 11 (100.0%) |
| 10 or more Apartments | 0 (0.0%) | 4 (100.0%) |
| Mobile Home / Other | 4 (100.0%) | 0 (0.0%) |
| Total | 55 (74.3%) | 19 (25.7%) |
Housing Structures by Number of Rooms in Winger
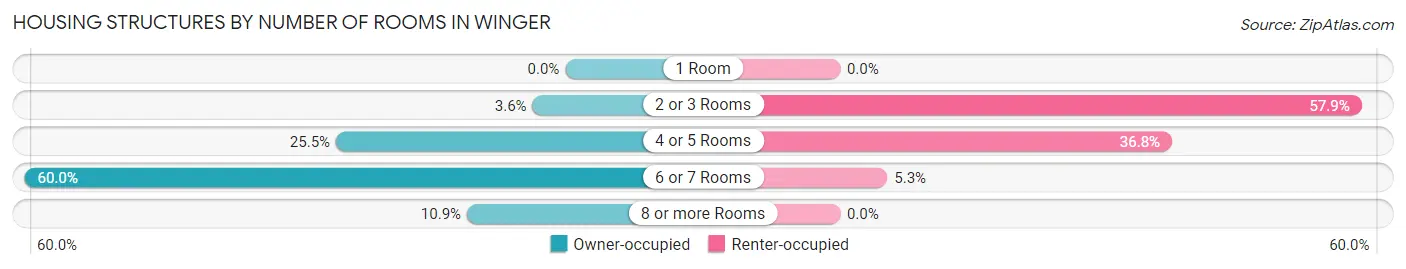
| Number of Rooms | Owner-occupied | Renter-occupied |
| 1 Room | 0 (0.0%) | 0 (0.0%) |
| 2 or 3 Rooms | 2 (3.6%) | 11 (57.9%) |
| 4 or 5 Rooms | 14 (25.5%) | 7 (36.8%) |
| 6 or 7 Rooms | 33 (60.0%) | 1 (5.3%) |
| 8 or more Rooms | 6 (10.9%) | 0 (0.0%) |
| Total | 55 (100.0%) | 19 (100.0%) |
Housing Structure by Heating Type in Winger
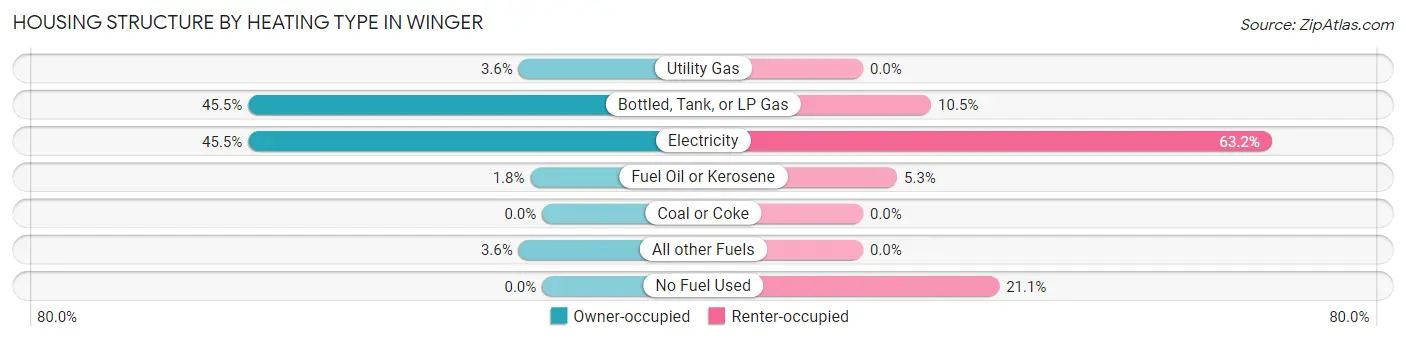
| Heating Type | Owner-occupied | Renter-occupied |
| Utility Gas | 2 (3.6%) | 0 (0.0%) |
| Bottled, Tank, or LP Gas | 25 (45.5%) | 2 (10.5%) |
| Electricity | 25 (45.5%) | 12 (63.2%) |
| Fuel Oil or Kerosene | 1 (1.8%) | 1 (5.3%) |
| Coal or Coke | 0 (0.0%) | 0 (0.0%) |
| All other Fuels | 2 (3.6%) | 0 (0.0%) |
| No Fuel Used | 0 (0.0%) | 4 (21.0%) |
| Total | 55 (100.0%) | 19 (100.0%) |
Household Vehicle Usage in Winger
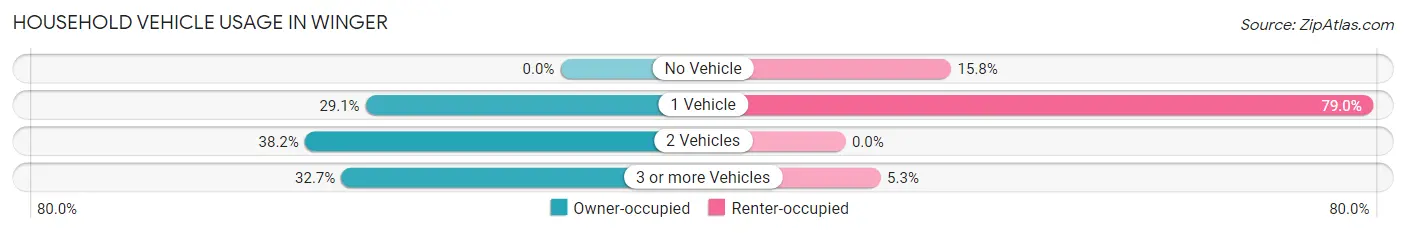
| Vehicles per Household | Owner-occupied | Renter-occupied |
| No Vehicle | 0 (0.0%) | 3 (15.8%) |
| 1 Vehicle | 16 (29.1%) | 15 (78.9%) |
| 2 Vehicles | 21 (38.2%) | 0 (0.0%) |
| 3 or more Vehicles | 18 (32.7%) | 1 (5.3%) |
| Total | 55 (100.0%) | 19 (100.0%) |
Real Estate & Mortgages in Winger
Real Estate and Mortgage Overview in Winger
| Characteristic | Without Mortgage | With Mortgage |
| Housing Units | 27 | 28 |
| Median Property Value | $87,500 | $90,000 |
| Median Household Income | $40,938 | $5 |
| Monthly Housing Costs | $494 | $2 |
| Real Estate Taxes | $957 | $0 |
Property Value by Mortgage Status in Winger
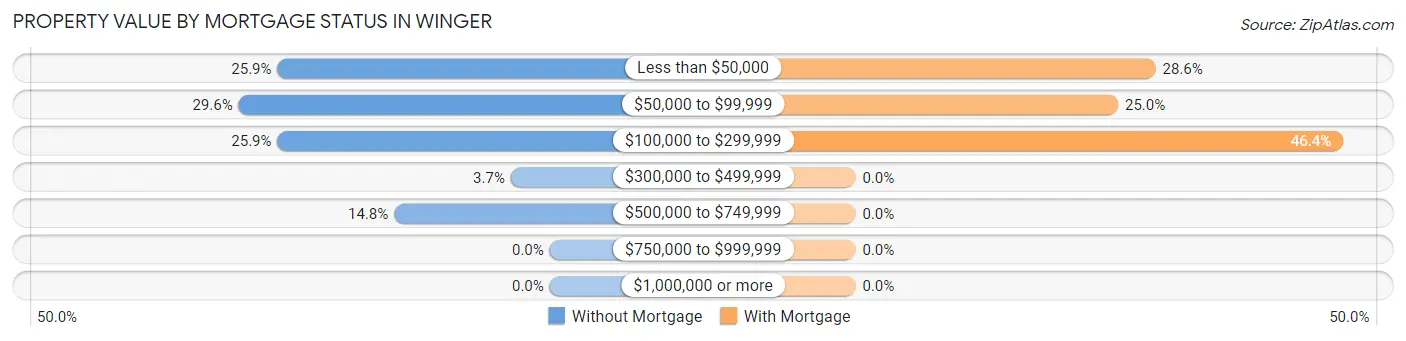
| Property Value | Without Mortgage | With Mortgage |
| Less than $50,000 | 7 (25.9%) | 8 (28.6%) |
| $50,000 to $99,999 | 8 (29.6%) | 7 (25.0%) |
| $100,000 to $299,999 | 7 (25.9%) | 13 (46.4%) |
| $300,000 to $499,999 | 1 (3.7%) | 0 (0.0%) |
| $500,000 to $749,999 | 4 (14.8%) | 0 (0.0%) |
| $750,000 to $999,999 | 0 (0.0%) | 0 (0.0%) |
| $1,000,000 or more | 0 (0.0%) | 0 (0.0%) |
| Total | 27 (100.0%) | 28 (100.0%) |
Household Income by Mortgage Status in Winger
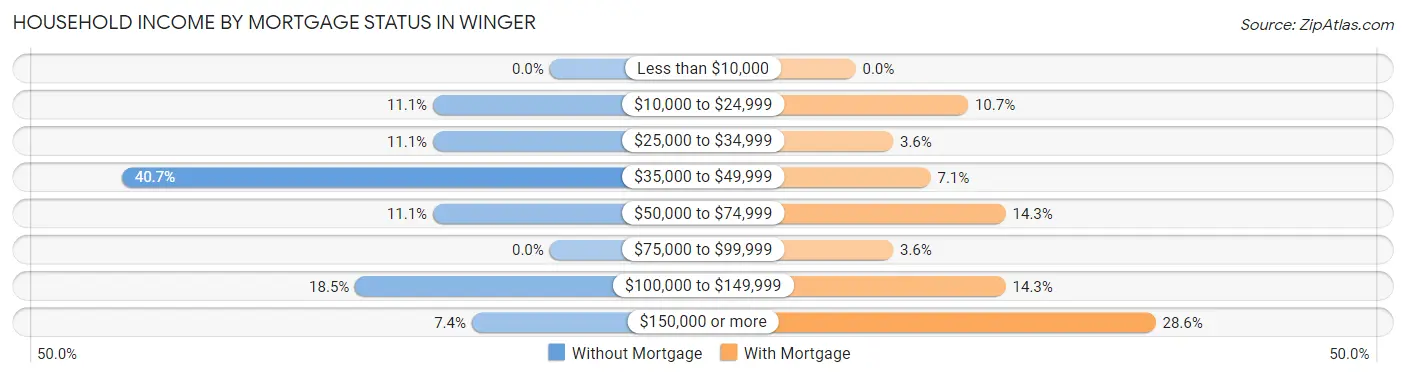
| Household Income | Without Mortgage | With Mortgage |
| Less than $10,000 | 0 (0.0%) | 0 (0.0%) |
| $10,000 to $24,999 | 3 (11.1%) | 3 (10.7%) |
| $25,000 to $34,999 | 3 (11.1%) | 1 (3.6%) |
| $35,000 to $49,999 | 11 (40.7%) | 2 (7.1%) |
| $50,000 to $74,999 | 3 (11.1%) | 4 (14.3%) |
| $75,000 to $99,999 | 0 (0.0%) | 1 (3.6%) |
| $100,000 to $149,999 | 5 (18.5%) | 4 (14.3%) |
| $150,000 or more | 2 (7.4%) | 8 (28.6%) |
| Total | 27 (100.0%) | 28 (100.0%) |
Property Value to Household Income Ratio in Winger
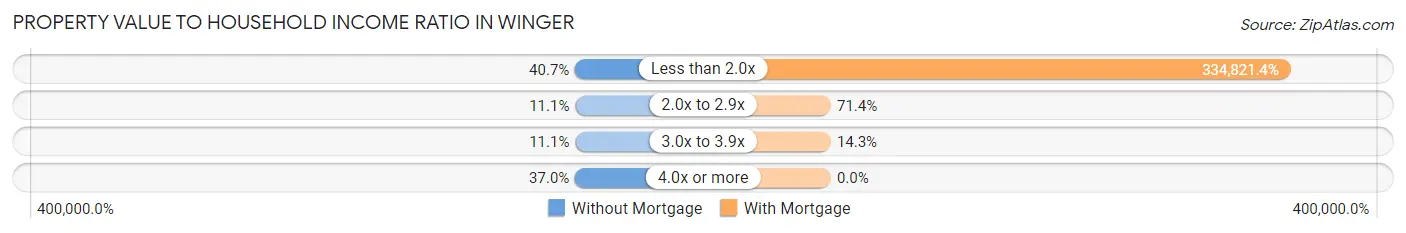
| Value-to-Income Ratio | Without Mortgage | With Mortgage |
| Less than 2.0x | 11 (40.7%) | 93,750 (334,821.4%) |
| 2.0x to 2.9x | 3 (11.1%) | 20 (71.4%) |
| 3.0x to 3.9x | 3 (11.1%) | 4 (14.3%) |
| 4.0x or more | 10 (37.0%) | 0 (0.0%) |
| Total | 27 (100.0%) | 28 (100.0%) |
Real Estate Taxes by Mortgage Status in Winger
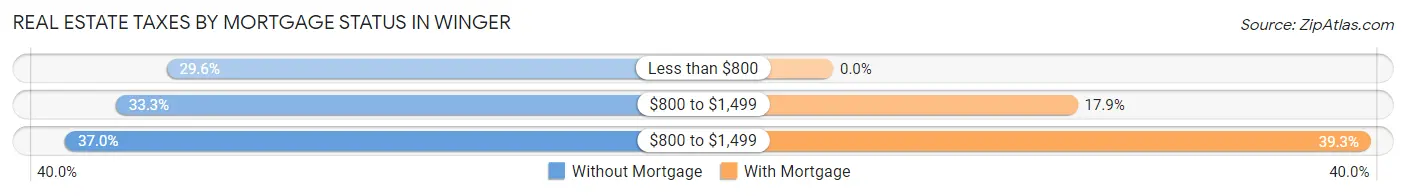
| Property Taxes | Without Mortgage | With Mortgage |
| Less than $800 | 8 (29.6%) | 0 (0.0%) |
| $800 to $1,499 | 9 (33.3%) | 5 (17.9%) |
| $800 to $1,499 | 10 (37.0%) | 11 (39.3%) |
| Total | 27 (100.0%) | 28 (100.0%) |
Health & Disability in Winger
Health Insurance Coverage by Age in Winger
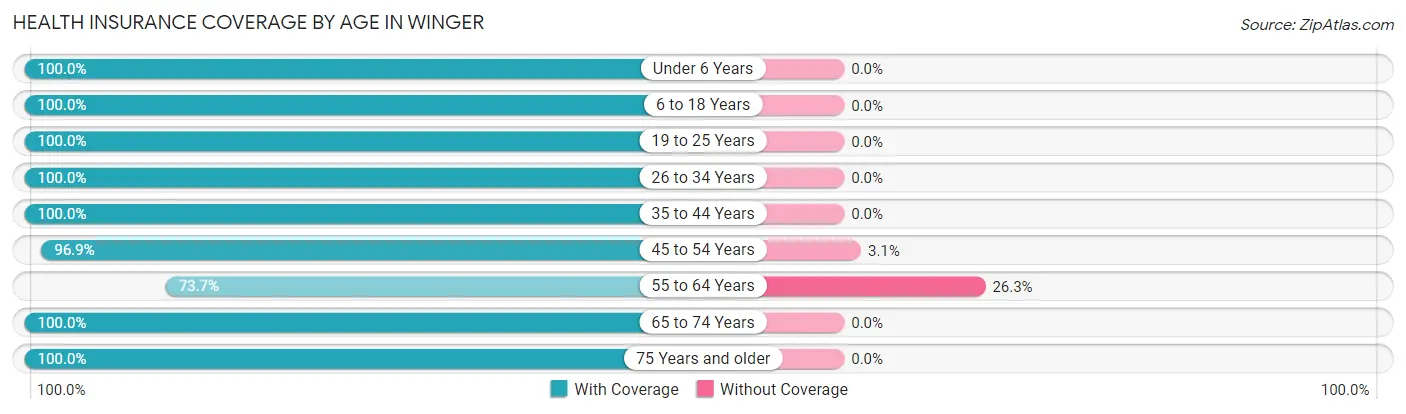
| Age Bracket | With Coverage | Without Coverage |
| Under 6 Years | 7 (100.0%) | 0 (0.0%) |
| 6 to 18 Years | 33 (100.0%) | 0 (0.0%) |
| 19 to 25 Years | 7 (100.0%) | 0 (0.0%) |
| 26 to 34 Years | 13 (100.0%) | 0 (0.0%) |
| 35 to 44 Years | 12 (100.0%) | 0 (0.0%) |
| 45 to 54 Years | 31 (96.9%) | 1 (3.1%) |
| 55 to 64 Years | 14 (73.7%) | 5 (26.3%) |
| 65 to 74 Years | 14 (100.0%) | 0 (0.0%) |
| 75 Years and older | 16 (100.0%) | 0 (0.0%) |
| Total | 147 (96.1%) | 6 (3.9%) |
Health Insurance Coverage by Citizenship Status in Winger
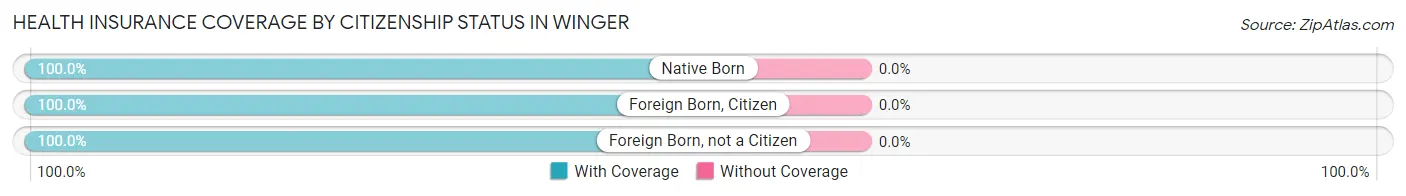
| Citizenship Status | With Coverage | Without Coverage |
| Native Born | 7 (100.0%) | 0 (0.0%) |
| Foreign Born, Citizen | 33 (100.0%) | 0 (0.0%) |
| Foreign Born, not a Citizen | 7 (100.0%) | 0 (0.0%) |
Health Insurance Coverage by Household Income in Winger
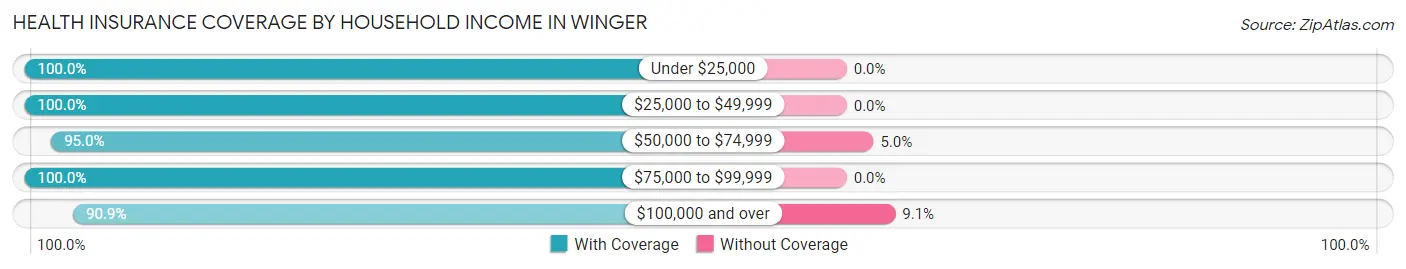
| Household Income | With Coverage | Without Coverage |
| Under $25,000 | 16 (100.0%) | 0 (0.0%) |
| $25,000 to $49,999 | 54 (100.0%) | 0 (0.0%) |
| $50,000 to $74,999 | 19 (95.0%) | 1 (5.0%) |
| $75,000 to $99,999 | 8 (100.0%) | 0 (0.0%) |
| $100,000 and over | 50 (90.9%) | 5 (9.1%) |
Public vs Private Health Insurance Coverage by Age in Winger
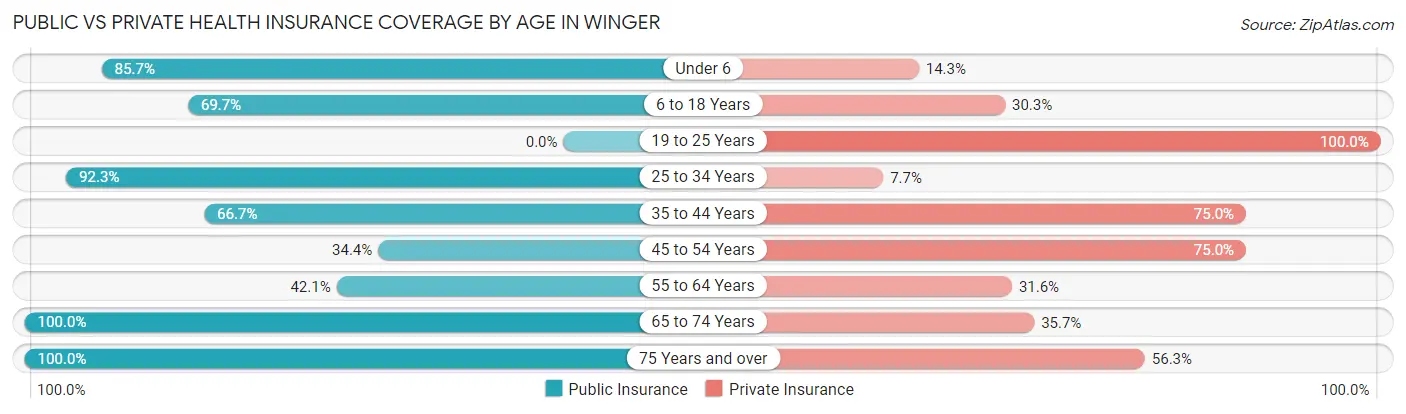
| Age Bracket | Public Insurance | Private Insurance |
| Under 6 | 6 (85.7%) | 1 (14.3%) |
| 6 to 18 Years | 23 (69.7%) | 10 (30.3%) |
| 19 to 25 Years | 0 (0.0%) | 7 (100.0%) |
| 25 to 34 Years | 12 (92.3%) | 1 (7.7%) |
| 35 to 44 Years | 8 (66.7%) | 9 (75.0%) |
| 45 to 54 Years | 11 (34.4%) | 24 (75.0%) |
| 55 to 64 Years | 8 (42.1%) | 6 (31.6%) |
| 65 to 74 Years | 14 (100.0%) | 5 (35.7%) |
| 75 Years and over | 16 (100.0%) | 9 (56.2%) |
| Total | 98 (64.0%) | 72 (47.1%) |
Disability Status by Sex by Age in Winger
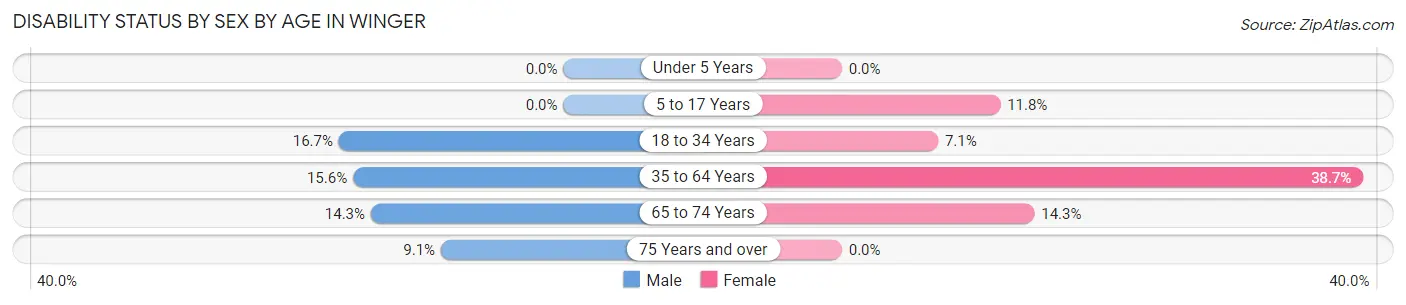
| Age Bracket | Male | Female |
| Under 5 Years | 0 (0.0%) | 0 (0.0%) |
| 5 to 17 Years | 0 (0.0%) | 2 (11.8%) |
| 18 to 34 Years | 1 (16.7%) | 1 (7.1%) |
| 35 to 64 Years | 5 (15.6%) | 12 (38.7%) |
| 65 to 74 Years | 1 (14.3%) | 1 (14.3%) |
| 75 Years and over | 1 (9.1%) | 0 (0.0%) |
Disability Class by Sex by Age in Winger
Disability Class: Hearing Difficulty
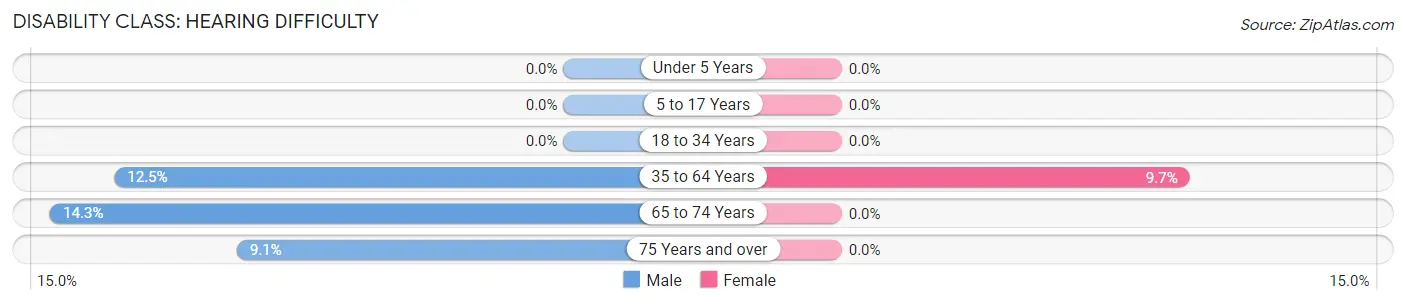
| Age Bracket | Male | Female |
| Under 5 Years | 0 (0.0%) | 0 (0.0%) |
| 5 to 17 Years | 0 (0.0%) | 0 (0.0%) |
| 18 to 34 Years | 0 (0.0%) | 0 (0.0%) |
| 35 to 64 Years | 4 (12.5%) | 3 (9.7%) |
| 65 to 74 Years | 1 (14.3%) | 0 (0.0%) |
| 75 Years and over | 1 (9.1%) | 0 (0.0%) |
Disability Class: Vision Difficulty
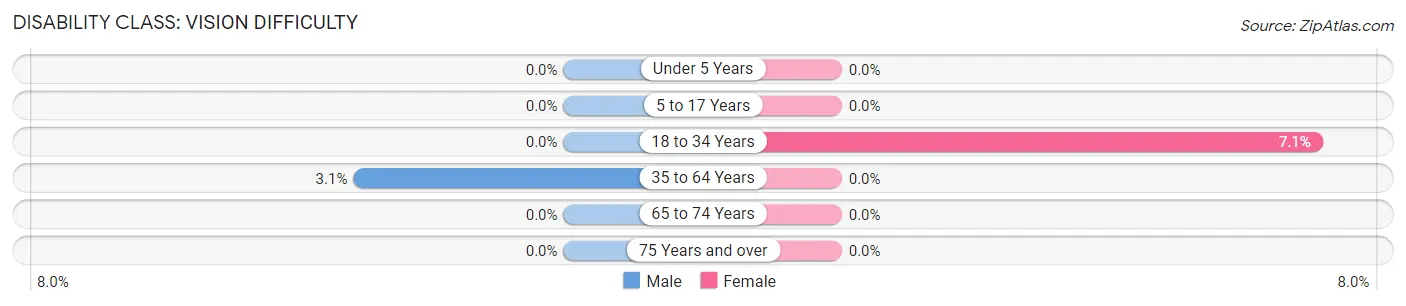
| Age Bracket | Male | Female |
| Under 5 Years | 0 (0.0%) | 0 (0.0%) |
| 5 to 17 Years | 0 (0.0%) | 0 (0.0%) |
| 18 to 34 Years | 0 (0.0%) | 1 (7.1%) |
| 35 to 64 Years | 1 (3.1%) | 0 (0.0%) |
| 65 to 74 Years | 0 (0.0%) | 0 (0.0%) |
| 75 Years and over | 0 (0.0%) | 0 (0.0%) |
Disability Class: Cognitive Difficulty
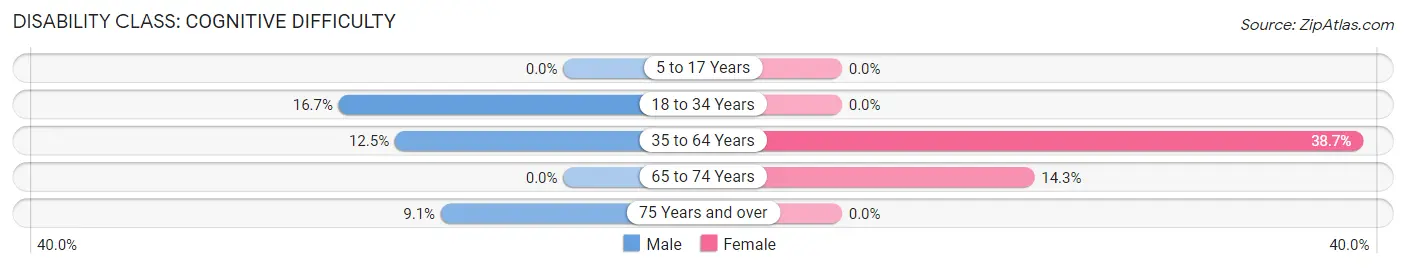
| Age Bracket | Male | Female |
| 5 to 17 Years | 0 (0.0%) | 0 (0.0%) |
| 18 to 34 Years | 1 (16.7%) | 0 (0.0%) |
| 35 to 64 Years | 4 (12.5%) | 12 (38.7%) |
| 65 to 74 Years | 0 (0.0%) | 1 (14.3%) |
| 75 Years and over | 1 (9.1%) | 0 (0.0%) |
Disability Class: Ambulatory Difficulty
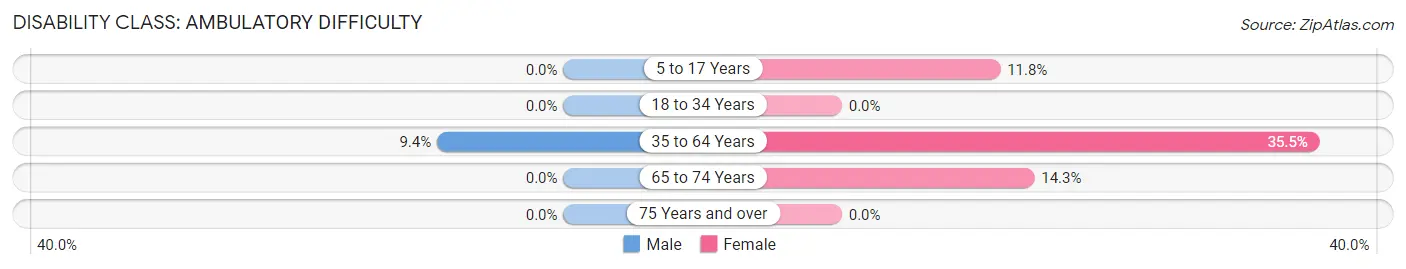
| Age Bracket | Male | Female |
| 5 to 17 Years | 0 (0.0%) | 2 (11.8%) |
| 18 to 34 Years | 0 (0.0%) | 0 (0.0%) |
| 35 to 64 Years | 3 (9.4%) | 11 (35.5%) |
| 65 to 74 Years | 0 (0.0%) | 1 (14.3%) |
| 75 Years and over | 0 (0.0%) | 0 (0.0%) |
Disability Class: Self-Care Difficulty
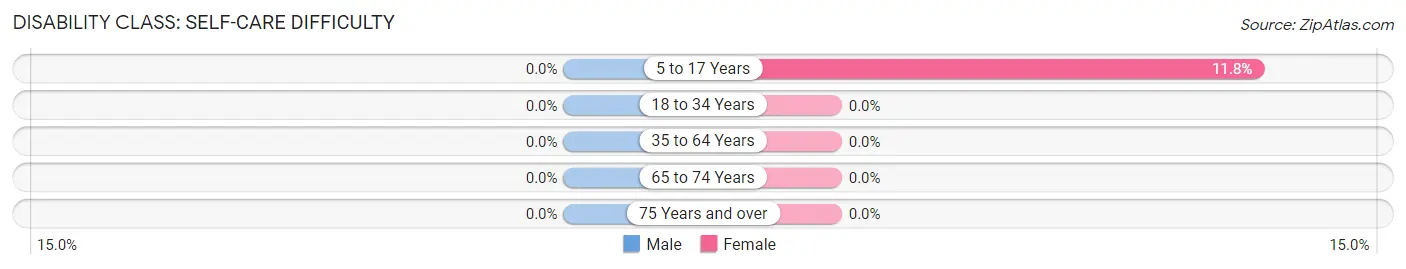
| Age Bracket | Male | Female |
| 5 to 17 Years | 0 (0.0%) | 2 (11.8%) |
| 18 to 34 Years | 0 (0.0%) | 0 (0.0%) |
| 35 to 64 Years | 0 (0.0%) | 0 (0.0%) |
| 65 to 74 Years | 0 (0.0%) | 0 (0.0%) |
| 75 Years and over | 0 (0.0%) | 0 (0.0%) |
Technology Access in Winger
Computing Device Access in Winger
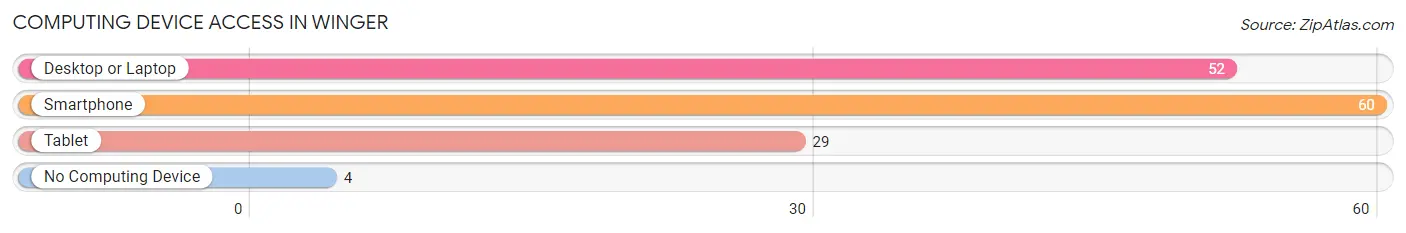
| Device Type | # Households | % Households |
| Desktop or Laptop | 52 | 70.3% |
| Smartphone | 60 | 81.1% |
| Tablet | 29 | 39.2% |
| No Computing Device | 4 | 5.4% |
| Total | 74 | 100.0% |
Internet Access in Winger
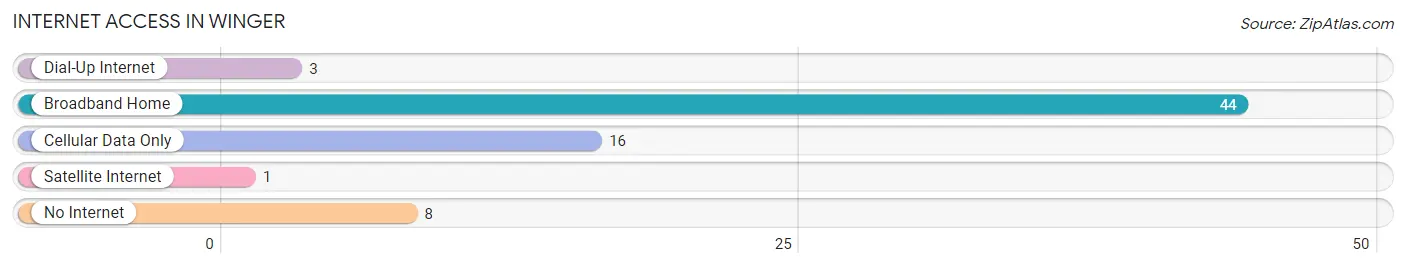
| Internet Type | # Households | % Households |
| Dial-Up Internet | 3 | 4.1% |
| Broadband Home | 44 | 59.5% |
| Cellular Data Only | 16 | 21.6% |
| Satellite Internet | 1 | 1.3% |
| No Internet | 8 | 10.8% |
| Total | 74 | 100.0% |
Winger Summary
MN History
Minnesota is a state located in the Midwestern United States. It was admitted to the Union as the 32nd state on May 11, 1858. Minnesota was originally inhabited by the Dakota and Ojibwe/Anishinaabe tribes. The first Europeans to explore the area were the French, who arrived in the late 17th century. The area was part of the French colony of New France until 1763, when it was ceded to Great Britain after the French and Indian War. In 1803, the United States acquired the area through the Louisiana Purchase.
The Minnesota Territory was organized in 1849, and the state was admitted to the Union in 1858. During the 19th century, Minnesota experienced rapid growth and development, becoming a major agricultural and industrial center. The state was a major supplier of wheat and other grains, as well as lumber and iron ore. The state also became a major center of manufacturing, with Minneapolis and St. Paul becoming major hubs of industry.
In the 20th century, Minnesota continued to experience rapid growth and development. The state became a major center of technology, with the establishment of the University of Minnesota and the Mayo Clinic. The state also became a major center of finance, with the establishment of the Federal Reserve Bank of Minneapolis.
Geography
Minnesota is located in the Midwestern United States, bordered by Wisconsin to the east, Iowa to the south, North Dakota and South Dakota to the west, and the Canadian provinces of Ontario and Manitoba to the north. The state has a total area of 86,943 square miles, making it the 12th largest state in the United States.
The state is divided into 87 counties and contains 87 incorporated cities. The state is divided into five distinct geographic regions: the Minnesota River Valley, the Central Plains, the North Woods, the Iron Range, and the Great Lakes region.
The Minnesota River Valley is located in the southeastern part of the state and is home to the state's largest city, Minneapolis. The Central Plains region is located in the central part of the state and is home to the state capital, St. Paul. The North Woods region is located in the northern part of the state and is home to many of the state's lakes and forests. The Iron Range is located in the northeastern part of the state and is home to the state's iron ore mining industry. The Great Lakes region is located in the northwestern part of the state and is home to the state's largest lake, Lake Superior.
Economy
Minnesota has a diversified economy, with a mix of industries including agriculture, manufacturing, finance, technology, and tourism. The state is a major producer of agricultural products, including corn, soybeans, wheat, and dairy products. The state is also a major producer of iron ore, and is home to the world's largest iron ore mine, located in the Iron Range region.
The state is also a major center of manufacturing, with major industries including food processing, machinery, printing and publishing, and medical technology. The state is also a major center of finance, with the Federal Reserve Bank of Minneapolis located in the state.
The state is also a major center of technology, with the University of Minnesota and the Mayo Clinic located in the state. The state is also home to several major technology companies, including 3M, Cargill, and Medtronic.
Demographics
As of the 2010 census, the population of Minnesota was 5,303,925. The state is home to a diverse population, with the largest ethnic groups being German (25.2%), Norwegian (17.2%), Irish (13.2%), Swedish (10.7%), and English (7.2%).
The state is also home to a large immigrant population, with the largest groups being from Mexico (5.3%), India (2.2%), and Somalia (1.7%). The state also has a large Native American population, with the largest groups being Dakota (2.9%), Ojibwe (2.2%), and Menominee (0.3%).
The state has a median household income of $60,828 and a poverty rate of 11.2%. The state also has a high rate of educational attainment, with 91.2% of adults over the age of 25 having at least a high school diploma and 37.2% having a bachelor's degree or higher.
Common Questions
What is Per Capita Income in Winger?
Per Capita income in Winger is $32,110.
What is the Median Household income in Winger?
Median Household Income in Winger is $42,500.
What is Income or Wage Gap in Winger?
Income or Wage Gap in Winger is 45.3%.
Women in Winger earn 54.7 cents for every dollar earned by a man.
What is Inequality or Gini Index in Winger?
Inequality or Gini Index in Winger is 0.41.
What is the Total Population of Winger?
Total Population of Winger is 155.
What is the Total Male Population of Winger?
Total Male Population of Winger is 77.
What is the Total Female Population of Winger?
Total Female Population of Winger is 78.
What is the Ratio of Males per 100 Females in Winger?
There are 98.72 Males per 100 Females in Winger.
What is the Ratio of Females per 100 Males in Winger?
There are 101.30 Females per 100 Males in Winger.
What is the Median Population Age in Winger?
Median Population Age in Winger is 48.8 Years.
What is the Average Family Size in Winger
Average Family Size in Winger is 3.2 People.
What is the Average Household Size in Winger
Average Household Size in Winger is 2.1 People.
How Large is the Labor Force in Winger?
There are 87 People in the Labor Forcein in Winger.
What is the Percentage of People in the Labor Force in Winger?
69.6% of People are in the Labor Force in Winger.
What is the Unemployment Rate in Winger?
Unemployment Rate in Winger is 3.5%.