Welcome, MN Map & Demographics
Welcome Map
Welcome Overview
$24,664
PER CAPITA INCOME
$54,875
AVG FAMILY INCOME
$57,321
AVG HOUSEHOLD INCOME
4.4%
WAGE / INCOME GAP [ % ]
95.6¢/ $1
WAGE / INCOME GAP [ $ ]
0.38
INEQUALITY / GINI INDEX
824
TOTAL POPULATION
427
MALE POPULATION
397
FEMALE POPULATION
107.56
MALES / 100 FEMALES
92.97
FEMALES / 100 MALES
35.5
MEDIAN AGE
3.0
AVG FAMILY SIZE
2.5
AVG HOUSEHOLD SIZE
400
LABOR FORCE [ PEOPLE ]
66.2%
PERCENT IN LABOR FORCE
8.0%
UNEMPLOYMENT RATE
Welcome Zip Codes
Welcome Area Codes
Income in Welcome
Income Overview in Welcome
Per Capita Income in Welcome is $24,664, while median incomes of families and households are $54,875 and $57,321 respectively.
| Characteristic | Number | Measure |
| Per Capita Income | 824 | $24,664 |
| Median Family Income | 231 | $54,875 |
| Mean Family Income | 231 | $64,856 |
| Median Household Income | 329 | $57,321 |
| Mean Household Income | 329 | $62,062 |
| Income Deficit | 231 | $0 |
| Wage / Income Gap (%) | 824 | 4.44% |
| Wage / Income Gap ($) | 824 | 95.56¢ per $1 |
| Gini / Inequality Index | 824 | 0.38 |
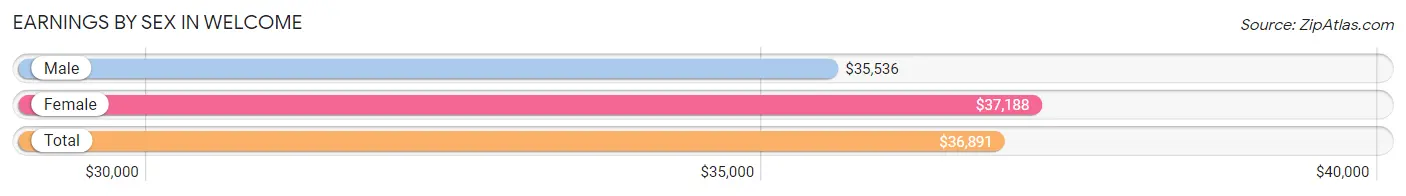
Earnings by Sex in Welcome
Average Earnings in Welcome are $36,891, $35,536 for men and $37,188 for women, a difference of 4.4%.
| Sex | Number | Average Earnings |
| Male | 237 (55.2%) | $35,536 |
| Female | 192 (44.8%) | $37,188 |
| Total | 429 (100.0%) | $36,891 |
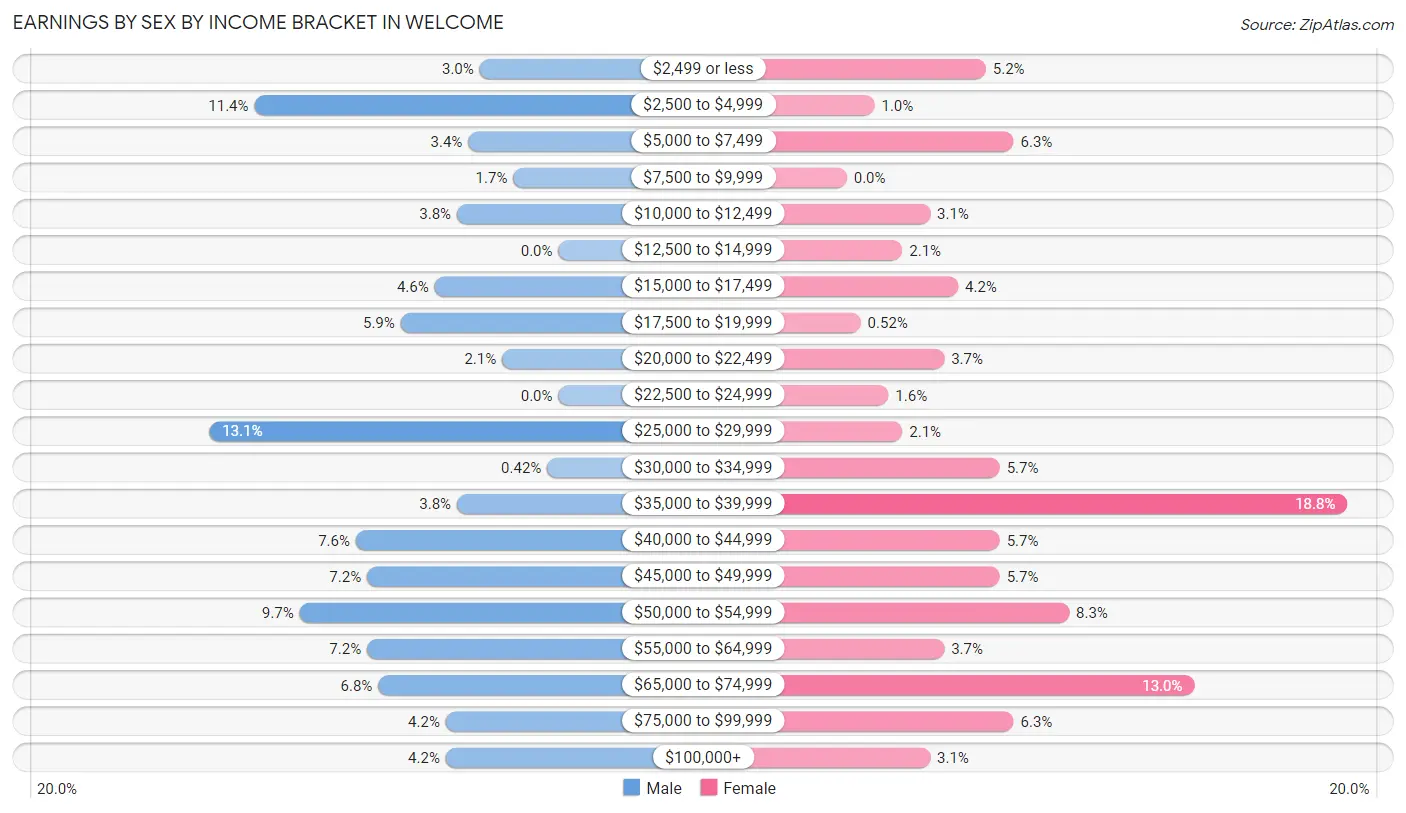
Earnings by Sex by Income Bracket in Welcome
The most common earnings brackets in Welcome are $25,000 to $29,999 for men (31 | 13.1%) and $35,000 to $39,999 for women (36 | 18.8%).
| Income | Male | Female |
| $2,499 or less | 7 (2.9%) | 10 (5.2%) |
| $2,500 to $4,999 | 27 (11.4%) | 2 (1.0%) |
| $5,000 to $7,499 | 8 (3.4%) | 12 (6.2%) |
| $7,500 to $9,999 | 4 (1.7%) | 0 (0.0%) |
| $10,000 to $12,499 | 9 (3.8%) | 6 (3.1%) |
| $12,500 to $14,999 | 0 (0.0%) | 4 (2.1%) |
| $15,000 to $17,499 | 11 (4.6%) | 8 (4.2%) |
| $17,500 to $19,999 | 14 (5.9%) | 1 (0.5%) |
| $20,000 to $22,499 | 5 (2.1%) | 7 (3.6%) |
| $22,500 to $24,999 | 0 (0.0%) | 3 (1.6%) |
| $25,000 to $29,999 | 31 (13.1%) | 4 (2.1%) |
| $30,000 to $34,999 | 1 (0.4%) | 11 (5.7%) |
| $35,000 to $39,999 | 9 (3.8%) | 36 (18.8%) |
| $40,000 to $44,999 | 18 (7.6%) | 11 (5.7%) |
| $45,000 to $49,999 | 17 (7.2%) | 11 (5.7%) |
| $50,000 to $54,999 | 23 (9.7%) | 16 (8.3%) |
| $55,000 to $64,999 | 17 (7.2%) | 7 (3.6%) |
| $65,000 to $74,999 | 16 (6.8%) | 25 (13.0%) |
| $75,000 to $99,999 | 10 (4.2%) | 12 (6.2%) |
| $100,000+ | 10 (4.2%) | 6 (3.1%) |
| Total | 237 (100.0%) | 192 (100.0%) |
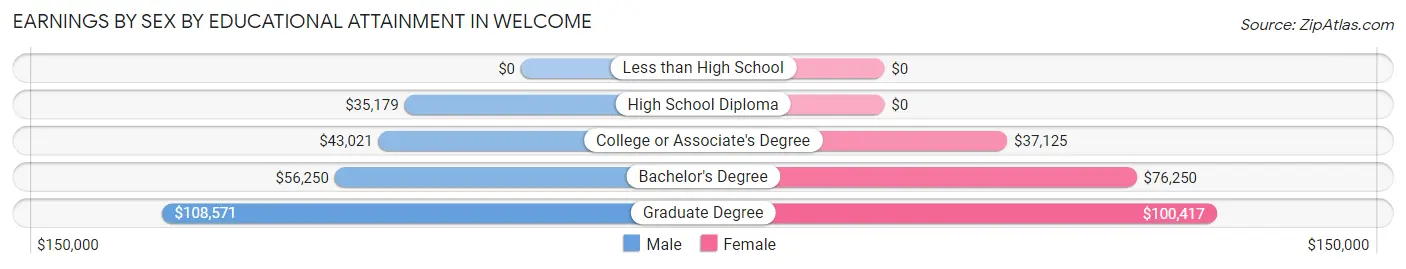
Earnings by Sex by Educational Attainment in Welcome
Average earnings in Welcome are $42,596 for men and $39,375 for women, a difference of 7.6%. Men with an educational attainment of graduate degree enjoy the highest average annual earnings of $108,571, while those with high school diploma education earn the least with $35,179. Women with an educational attainment of graduate degree earn the most with the average annual earnings of $100,417, while those with college or associate's degree education have the smallest earnings of $37,125.
| Educational Attainment | Male Income | Female Income |
| Less than High School | - | - |
| High School Diploma | $35,179 | $0 |
| College or Associate's Degree | $43,021 | $37,125 |
| Bachelor's Degree | $56,250 | $76,250 |
| Graduate Degree | $108,571 | $100,417 |
| Total | $42,596 | $39,375 |
Family Income in Welcome
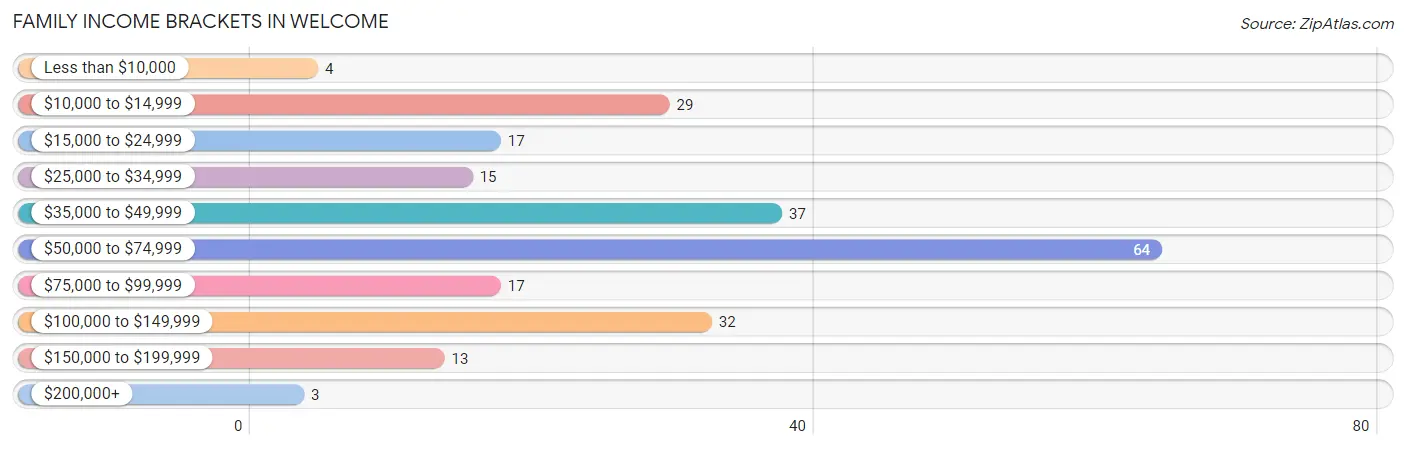
Family Income Brackets in Welcome
According to the Welcome family income data, there are 64 families falling into the $50,000 to $74,999 income range, which is the most common income bracket and makes up 27.7% of all families. Conversely, the $200,000+ income bracket is the least frequent group with only 3 families (1.3%) belonging to this category.
| Income Bracket | # Families | % Families |
| Less than $10,000 | 4 | 1.7% |
| $10,000 to $14,999 | 29 | 12.6% |
| $15,000 to $24,999 | 17 | 7.4% |
| $25,000 to $34,999 | 15 | 6.5% |
| $35,000 to $49,999 | 37 | 16.0% |
| $50,000 to $74,999 | 64 | 27.7% |
| $75,000 to $99,999 | 17 | 7.4% |
| $100,000 to $149,999 | 32 | 13.9% |
| $150,000 to $199,999 | 13 | 5.6% |
| $200,000+ | 3 | 1.3% |
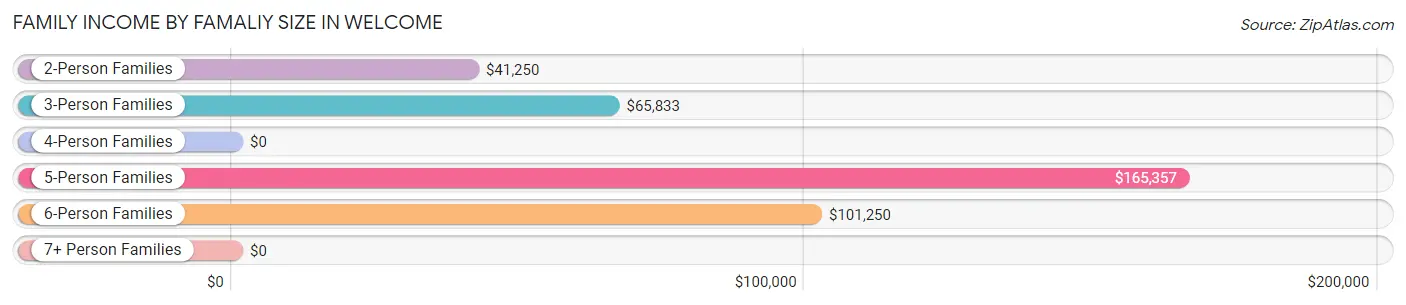
Family Income by Famaliy Size in Welcome
5-person families (12 | 5.2%) account for the highest median family income in Welcome with $165,357 per family, while 5-person families (12 | 5.2%) have the highest median income of $33,071 per family member.
| Income Bracket | # Families | Median Income |
| 2-Person Families | 118 (51.1%) | $41,250 |
| 3-Person Families | 42 (18.2%) | $65,833 |
| 4-Person Families | 53 (22.9%) | $0 |
| 5-Person Families | 12 (5.2%) | $165,357 |
| 6-Person Families | 6 (2.6%) | $101,250 |
| 7+ Person Families | 0 (0.0%) | $0 |
| Total | 231 (100.0%) | $54,875 |
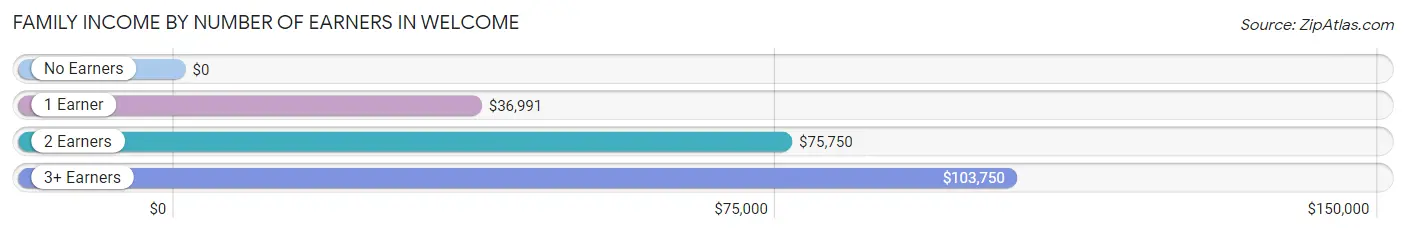
Family Income by Number of Earners in Welcome
| Number of Earners | # Families | Median Income |
| No Earners | 46 (19.9%) | $0 |
| 1 Earner | 79 (34.2%) | $36,991 |
| 2 Earners | 79 (34.2%) | $75,750 |
| 3+ Earners | 27 (11.7%) | $103,750 |
| Total | 231 (100.0%) | $54,875 |
Household Income in Welcome
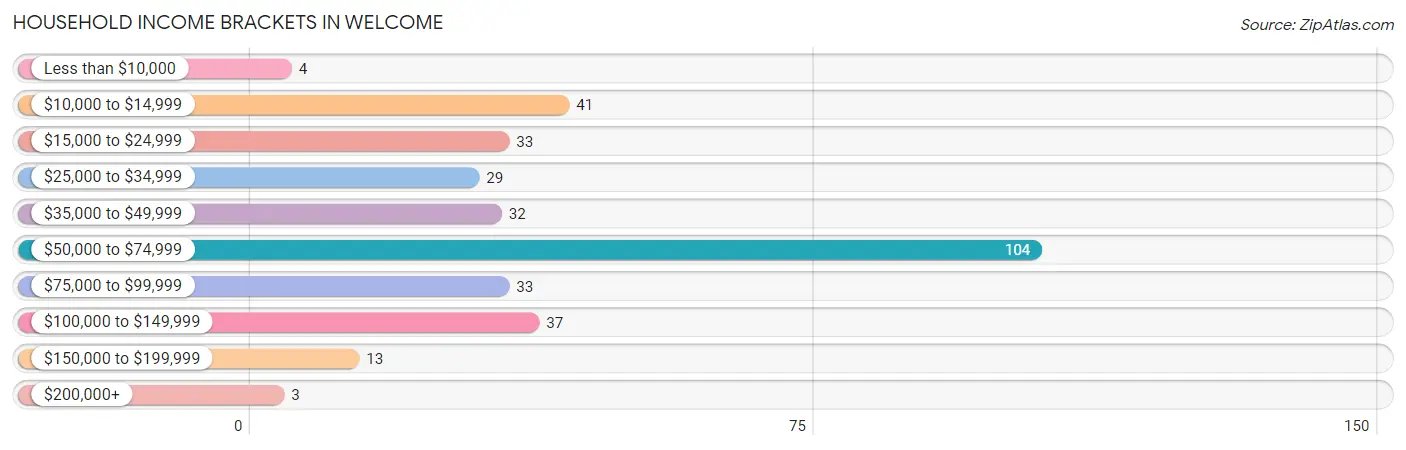
Household Income Brackets in Welcome
With 104 households falling in the category, the $50,000 to $74,999 income range is the most frequent in Welcome, accounting for 31.6% of all households. In contrast, only 3 households (0.9%) fall into the $200,000+ income bracket, making it the least populous group.
| Income Bracket | # Households | % Households |
| Less than $10,000 | 4 | 1.2% |
| $10,000 to $14,999 | 41 | 12.5% |
| $15,000 to $24,999 | 33 | 10.0% |
| $25,000 to $34,999 | 29 | 8.8% |
| $35,000 to $49,999 | 32 | 9.7% |
| $50,000 to $74,999 | 104 | 31.6% |
| $75,000 to $99,999 | 33 | 10.0% |
| $100,000 to $149,999 | 37 | 11.2% |
| $150,000 to $199,999 | 13 | 4.0% |
| $200,000+ | 3 | 0.9% |
Household Income by Householder Age in Welcome
The median household income in Welcome is $57,321, with the highest median household income of $70,598 found in the 45 to 64 years age bracket for the primary householder. A total of 131 households (39.8%) fall into this category.
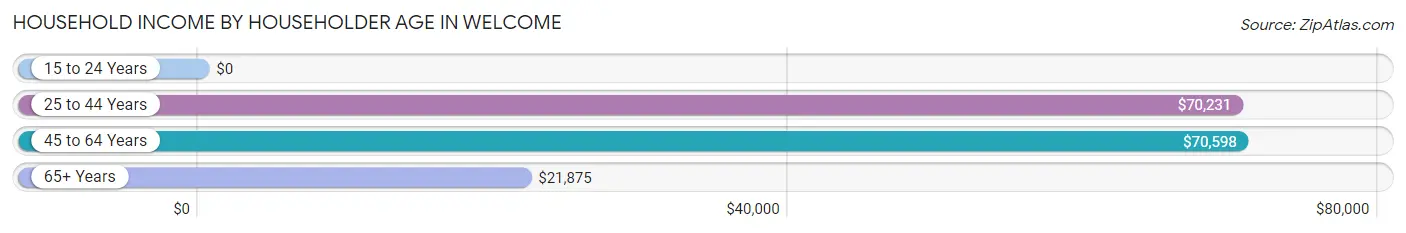
| Income Bracket | # Households | Median Income |
| 15 to 24 Years | 0 (0.0%) | $0 |
| 25 to 44 Years | 115 (34.9%) | $70,231 |
| 45 to 64 Years | 131 (39.8%) | $70,598 |
| 65+ Years | 83 (25.2%) | $21,875 |
| Total | 329 (100.0%) | $57,321 |
Poverty in Welcome
Income Below Poverty by Sex and Age in Welcome
With 10.1% poverty level for males and 11.3% for females among the residents of Welcome, 75 year old and over males and 75 year old and over females are the most vulnerable to poverty, with 19 males (63.3%) and 29 females (67.4%) in their respective age groups living below the poverty level.
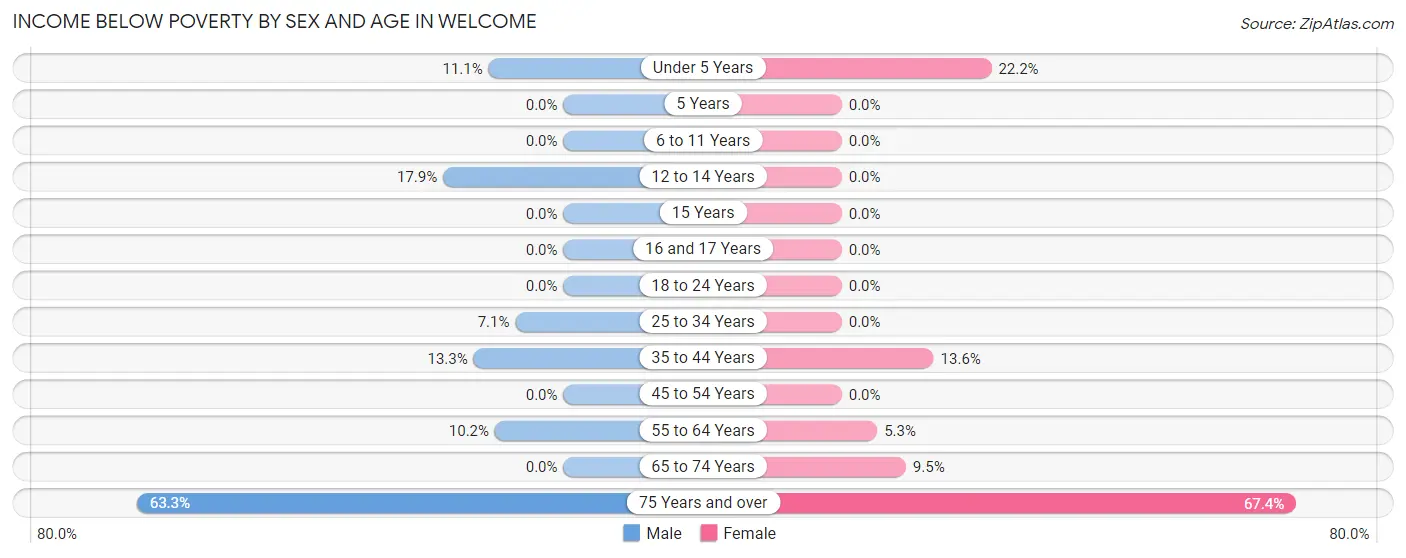
| Age Bracket | Male | Female |
| Under 5 Years | 2 (11.1%) | 4 (22.2%) |
| 5 Years | 0 (0.0%) | 0 (0.0%) |
| 6 to 11 Years | 0 (0.0%) | 0 (0.0%) |
| 12 to 14 Years | 5 (17.9%) | 0 (0.0%) |
| 15 Years | 0 (0.0%) | 0 (0.0%) |
| 16 and 17 Years | 0 (0.0%) | 0 (0.0%) |
| 18 to 24 Years | 0 (0.0%) | 0 (0.0%) |
| 25 to 34 Years | 5 (7.1%) | 0 (0.0%) |
| 35 to 44 Years | 6 (13.3%) | 6 (13.6%) |
| 45 to 54 Years | 0 (0.0%) | 0 (0.0%) |
| 55 to 64 Years | 6 (10.2%) | 4 (5.3%) |
| 65 to 74 Years | 0 (0.0%) | 2 (9.5%) |
| 75 Years and over | 19 (63.3%) | 29 (67.4%) |
| Total | 43 (10.1%) | 45 (11.3%) |
Income Above Poverty by Sex and Age in Welcome
According to the poverty statistics in Welcome, males aged 5 years and females aged 5 years are the age groups that are most secure financially, with 100.0% of males and 100.0% of females in these age groups living above the poverty line.
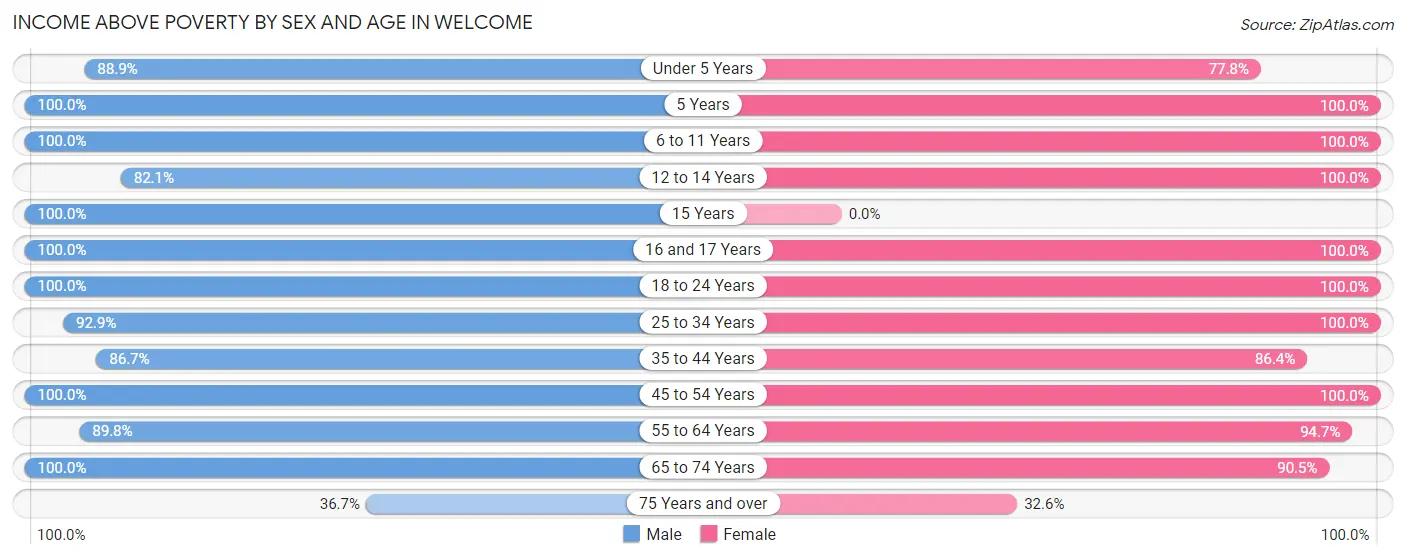
| Age Bracket | Male | Female |
| Under 5 Years | 16 (88.9%) | 14 (77.8%) |
| 5 Years | 4 (100.0%) | 7 (100.0%) |
| 6 to 11 Years | 64 (100.0%) | 36 (100.0%) |
| 12 to 14 Years | 23 (82.1%) | 39 (100.0%) |
| 15 Years | 6 (100.0%) | 0 (0.0%) |
| 16 and 17 Years | 6 (100.0%) | 3 (100.0%) |
| 18 to 24 Years | 27 (100.0%) | 19 (100.0%) |
| 25 to 34 Years | 65 (92.9%) | 62 (100.0%) |
| 35 to 44 Years | 39 (86.7%) | 38 (86.4%) |
| 45 to 54 Years | 41 (100.0%) | 29 (100.0%) |
| 55 to 64 Years | 53 (89.8%) | 72 (94.7%) |
| 65 to 74 Years | 29 (100.0%) | 19 (90.5%) |
| 75 Years and over | 11 (36.7%) | 14 (32.6%) |
| Total | 384 (89.9%) | 352 (88.7%) |
Income Below Poverty Among Married-Couple Families in Welcome
The poverty statistics for married-couple families in Welcome show that 18.9% or 31 of the total 164 families live below the poverty line. Families with no children have the highest poverty rate of 25.9%, comprising of 29 families. On the other hand, families with 3 or 4 children have the lowest poverty rate of 0.0%, which includes 0 families.
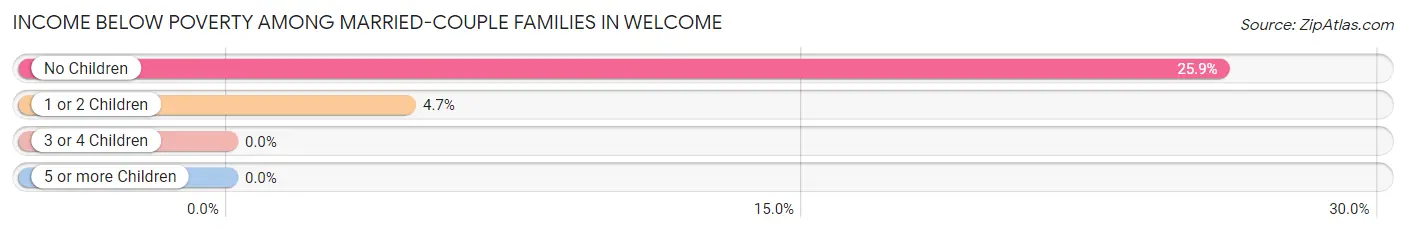
| Children | Above Poverty | Below Poverty |
| No Children | 83 (74.1%) | 29 (25.9%) |
| 1 or 2 Children | 41 (95.4%) | 2 (4.6%) |
| 3 or 4 Children | 9 (100.0%) | 0 (0.0%) |
| 5 or more Children | 0 (0.0%) | 0 (0.0%) |
| Total | 133 (81.1%) | 31 (18.9%) |
Income Below Poverty Among Single-Parent Households in Welcome
According to the poverty data in Welcome, 11.5% or 6 single-father households and 13.3% or 2 single-mother households are living below the poverty line. Among single-father households, those with 1 or 2 children have the highest poverty rate, with 6 households (37.5%) experiencing poverty. Likewise, among single-mother households, those with 1 or 2 children have the highest poverty rate, with 2 households (20.0%) falling below the poverty line.
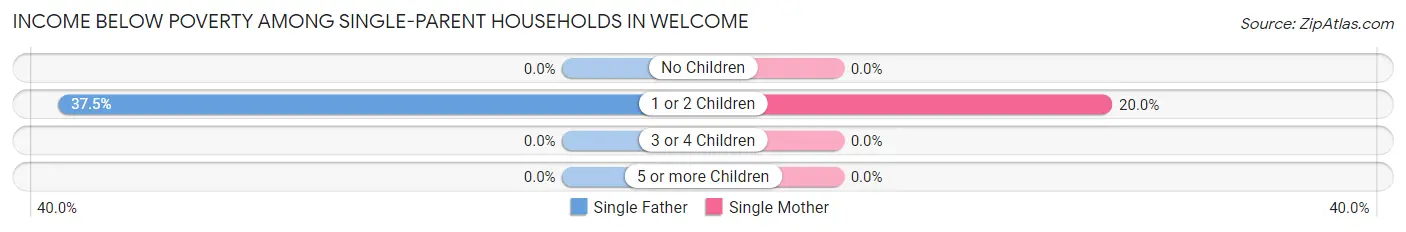
| Children | Single Father | Single Mother |
| No Children | 0 (0.0%) | 0 (0.0%) |
| 1 or 2 Children | 6 (37.5%) | 2 (20.0%) |
| 3 or 4 Children | 0 (0.0%) | 0 (0.0%) |
| 5 or more Children | 0 (0.0%) | 0 (0.0%) |
| Total | 6 (11.5%) | 2 (13.3%) |
Income Below Poverty Among Married-Couple vs Single-Parent Households in Welcome
The poverty data for Welcome shows that 31 of the married-couple family households (18.9%) and 8 of the single-parent households (11.9%) are living below the poverty level. Within the married-couple family households, those with no children have the highest poverty rate, with 29 households (25.9%) falling below the poverty line. Among the single-parent households, those with 1 or 2 children have the highest poverty rate, with 8 household (30.8%) living below poverty.
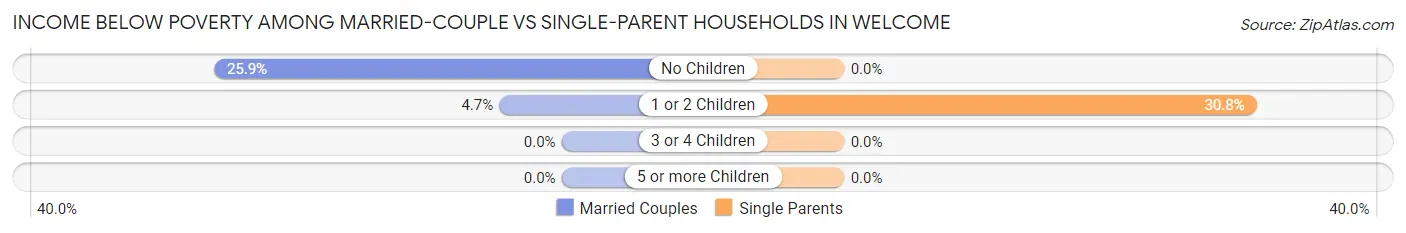
| Children | Married-Couple Families | Single-Parent Households |
| No Children | 29 (25.9%) | 0 (0.0%) |
| 1 or 2 Children | 2 (4.6%) | 8 (30.8%) |
| 3 or 4 Children | 0 (0.0%) | 0 (0.0%) |
| 5 or more Children | 0 (0.0%) | 0 (0.0%) |
| Total | 31 (18.9%) | 8 (11.9%) |
Race in Welcome
The most populous races in Welcome are White / Caucasian (750 | 91.0%), Two or more Races (53 | 6.4%), and Hispanic or Latino (28 | 3.4%).
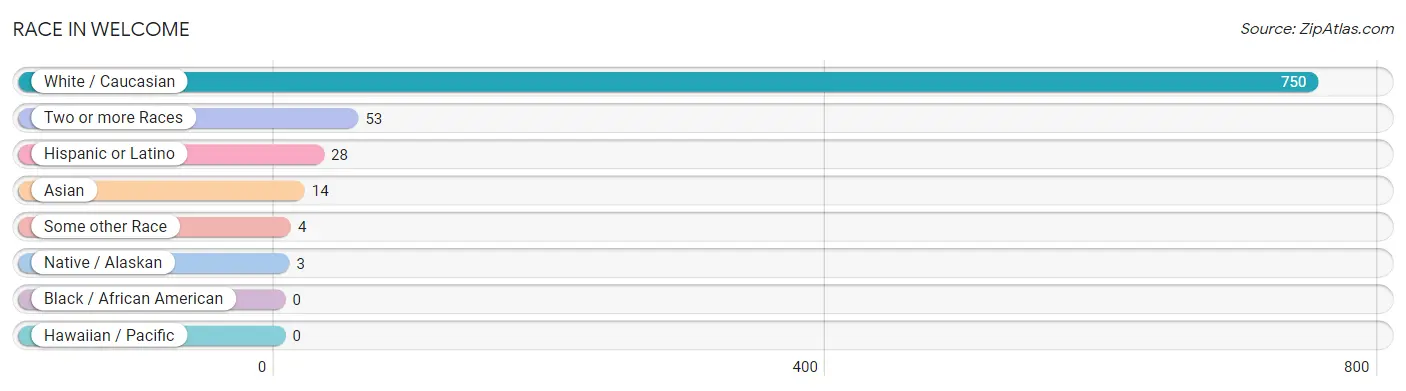
| Race | # Population | % Population |
| Asian | 14 | 1.7% |
| Black / African American | 0 | 0.0% |
| Hawaiian / Pacific | 0 | 0.0% |
| Hispanic or Latino | 28 | 3.4% |
| Native / Alaskan | 3 | 0.4% |
| White / Caucasian | 750 | 91.0% |
| Two or more Races | 53 | 6.4% |
| Some other Race | 4 | 0.5% |
| Total | 824 | 100.0% |
Ancestry in Welcome
The most populous ancestries reported in Welcome are German (316 | 38.4%), European (125 | 15.2%), Irish (102 | 12.4%), English (82 | 10.0%), and Norwegian (73 | 8.9%), together accounting for 84.7% of all Welcome residents.
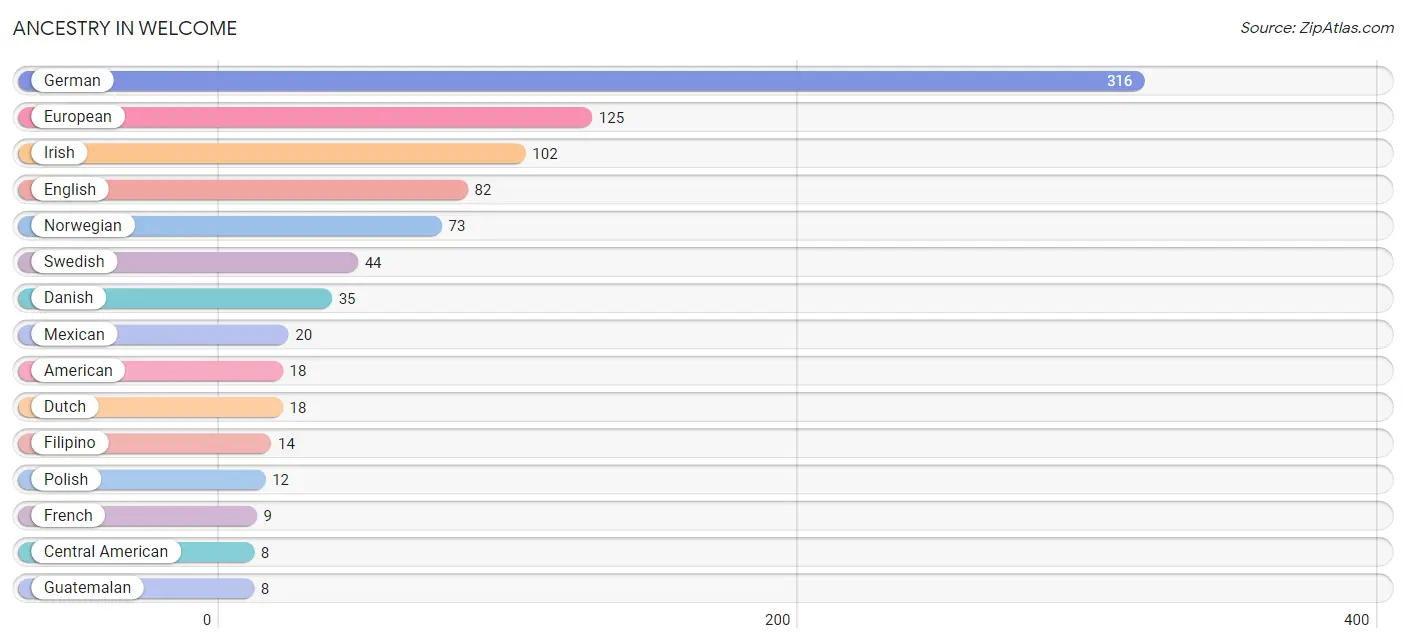
| Ancestry | # Population | % Population |
| American | 18 | 2.2% |
| Blackfeet | 3 | 0.4% |
| Central American | 8 | 1.0% |
| Cherokee | 2 | 0.2% |
| Czech | 4 | 0.5% |
| Danish | 35 | 4.3% |
| Dutch | 18 | 2.2% |
| English | 82 | 10.0% |
| European | 125 | 15.2% |
| Filipino | 14 | 1.7% |
| French | 9 | 1.1% |
| French Canadian | 4 | 0.5% |
| German | 316 | 38.4% |
| Guatemalan | 8 | 1.0% |
| Irish | 102 | 12.4% |
| Italian | 4 | 0.5% |
| Mexican | 20 | 2.4% |
| Norwegian | 73 | 8.9% |
| Polish | 12 | 1.5% |
| Russian | 2 | 0.2% |
| Scandinavian | 2 | 0.2% |
| Scottish | 1 | 0.1% |
| Swedish | 44 | 5.3% | View All 23 Rows |
Immigrants in Welcome
The most numerous immigrant groups reported in Welcome came from Central America (8 | 1.0%), Latin America (8 | 1.0%), Guatemala (4 | 0.5%), and Mexico (4 | 0.5%), together accounting for 2.9% of all Welcome residents.
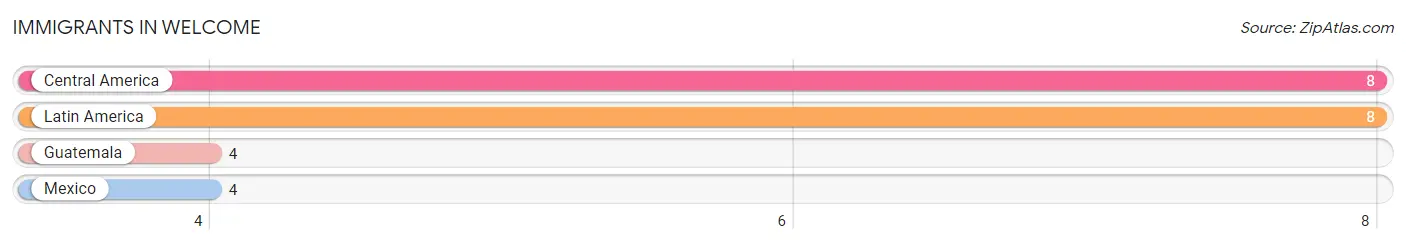
| Immigration Origin | # Population | % Population |
| Central America | 8 | 1.0% |
| Guatemala | 4 | 0.5% |
| Latin America | 8 | 1.0% |
| Mexico | 4 | 0.5% | View All 4 Rows |
Sex and Age in Welcome
Sex and Age in Welcome
The most populous age groups in Welcome are 5 to 9 Years (52 | 12.2%) for men and 10 to 14 Years (54 | 13.6%) for women.
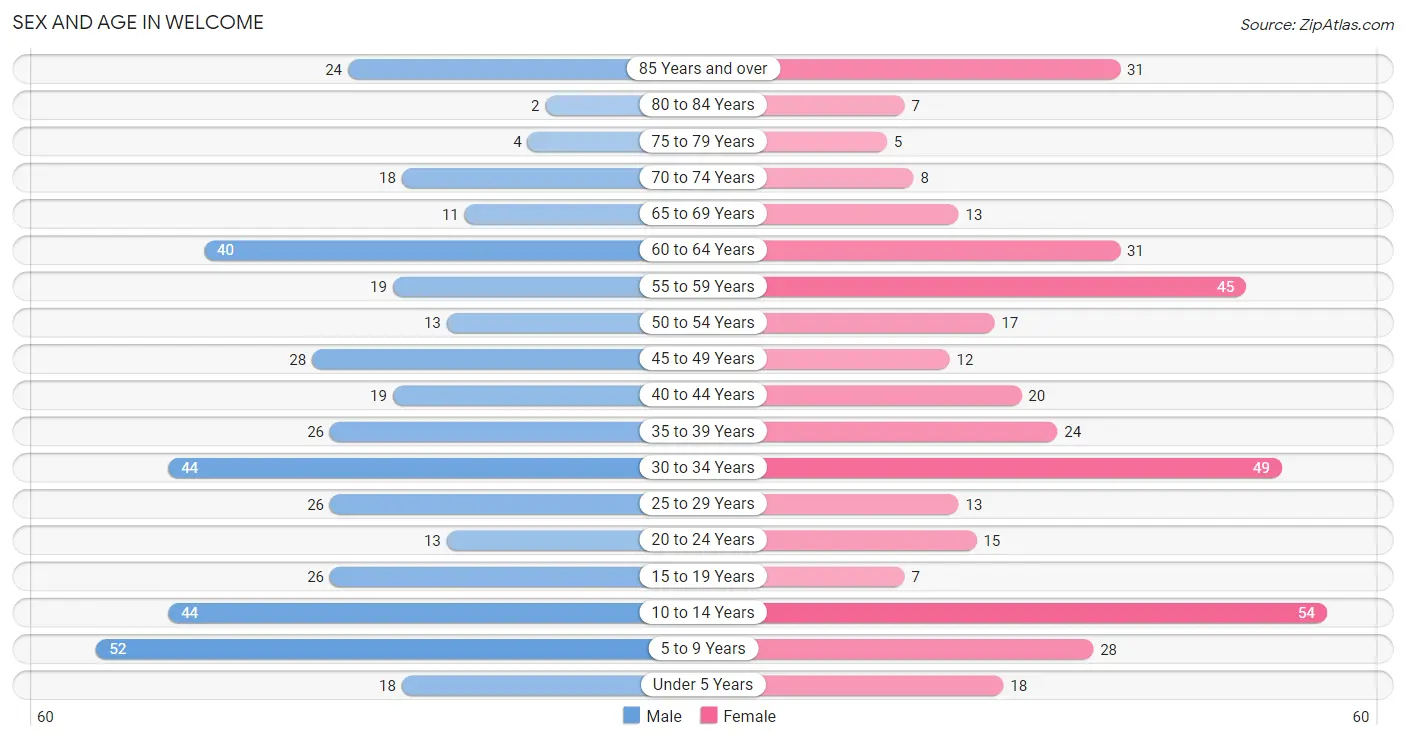
| Age Bracket | Male | Female |
| Under 5 Years | 18 (4.2%) | 18 (4.5%) |
| 5 to 9 Years | 52 (12.2%) | 28 (7.0%) |
| 10 to 14 Years | 44 (10.3%) | 54 (13.6%) |
| 15 to 19 Years | 26 (6.1%) | 7 (1.8%) |
| 20 to 24 Years | 13 (3.0%) | 15 (3.8%) |
| 25 to 29 Years | 26 (6.1%) | 13 (3.3%) |
| 30 to 34 Years | 44 (10.3%) | 49 (12.3%) |
| 35 to 39 Years | 26 (6.1%) | 24 (6.0%) |
| 40 to 44 Years | 19 (4.4%) | 20 (5.0%) |
| 45 to 49 Years | 28 (6.6%) | 12 (3.0%) |
| 50 to 54 Years | 13 (3.0%) | 17 (4.3%) |
| 55 to 59 Years | 19 (4.4%) | 45 (11.3%) |
| 60 to 64 Years | 40 (9.4%) | 31 (7.8%) |
| 65 to 69 Years | 11 (2.6%) | 13 (3.3%) |
| 70 to 74 Years | 18 (4.2%) | 8 (2.0%) |
| 75 to 79 Years | 4 (0.9%) | 5 (1.3%) |
| 80 to 84 Years | 2 (0.5%) | 7 (1.8%) |
| 85 Years and over | 24 (5.6%) | 31 (7.8%) |
| Total | 427 (100.0%) | 397 (100.0%) |
Families and Households in Welcome
Median Family Size in Welcome
The median family size in Welcome is 2.97 persons per family, with single female/mother families (15 | 6.5%) accounting for the largest median family size of 4.53 persons per family. On the other hand, married-couple families (164 | 71.0%) represent the smallest median family size with 2.86 persons per family.
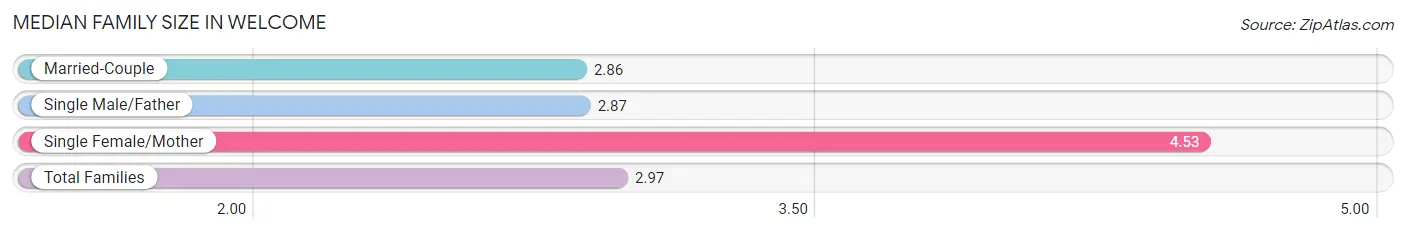
| Family Type | # Families | Family Size |
| Married-Couple | 164 (71.0%) | 2.86 |
| Single Male/Father | 52 (22.5%) | 2.87 |
| Single Female/Mother | 15 (6.5%) | 4.53 |
| Total Families | 231 (100.0%) | 2.97 |
Median Household Size in Welcome
The median household size in Welcome is 2.50 persons per household, with single female/mother households (15 | 4.6%) accounting for the largest median household size of 4.87 persons per household. non-family households (98 | 29.8%) represent the smallest median household size with 1.06 persons per household.
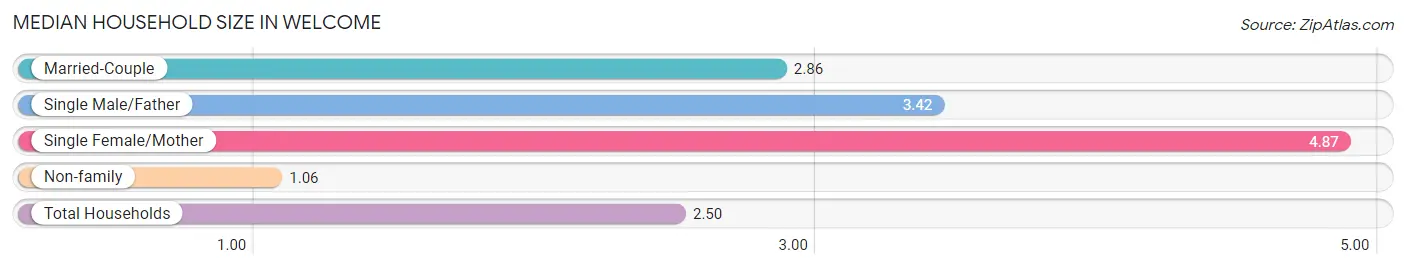
| Household Type | # Households | Household Size |
| Married-Couple | 164 (49.8%) | 2.86 |
| Single Male/Father | 52 (15.8%) | 3.42 |
| Single Female/Mother | 15 (4.6%) | 4.87 |
| Non-family | 98 (29.8%) | 1.06 |
| Total Households | 329 (100.0%) | 2.50 |
Household Size by Marriage Status in Welcome
Out of a total of 329 households in Welcome, 231 (70.2%) are family households, while 98 (29.8%) are nonfamily households. The most numerous type of family households are 2-person households, comprising 111, and the most common type of nonfamily households are 1-person households, comprising 90.
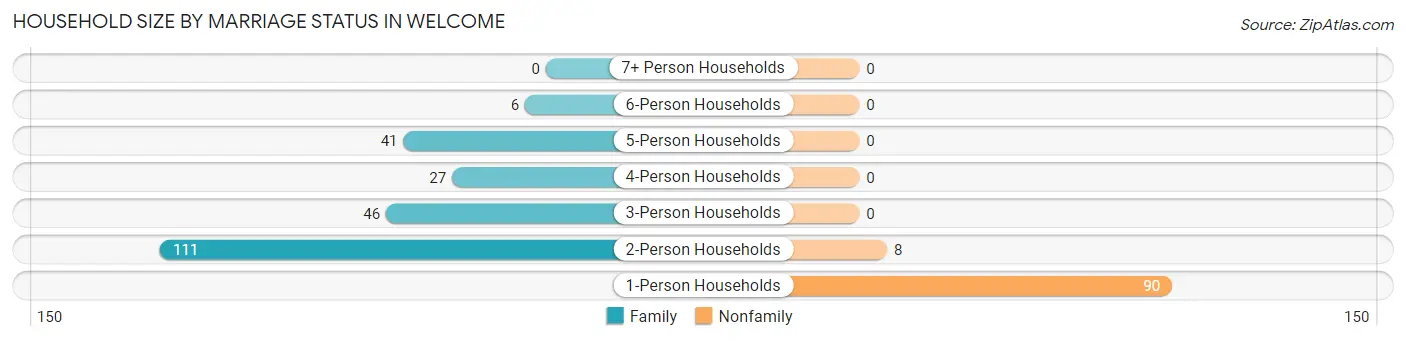
| Household Size | Family Households | Nonfamily Households |
| 1-Person Households | - | 90 (27.4%) |
| 2-Person Households | 111 (33.7%) | 8 (2.4%) |
| 3-Person Households | 46 (14.0%) | 0 (0.0%) |
| 4-Person Households | 27 (8.2%) | 0 (0.0%) |
| 5-Person Households | 41 (12.5%) | 0 (0.0%) |
| 6-Person Households | 6 (1.8%) | 0 (0.0%) |
| 7+ Person Households | 0 (0.0%) | 0 (0.0%) |
| Total | 231 (70.2%) | 98 (29.8%) |
Female Fertility in Welcome
Fertility by Age in Welcome
Average fertility rate in Welcome is 132.0 births per 1,000 women. Women in the age bracket of 15 to 19 years have the highest fertility rate with 571.0 births per 1,000 women. Women in the age bracket of 20 to 34 years acount for 57.9% of all women with births.
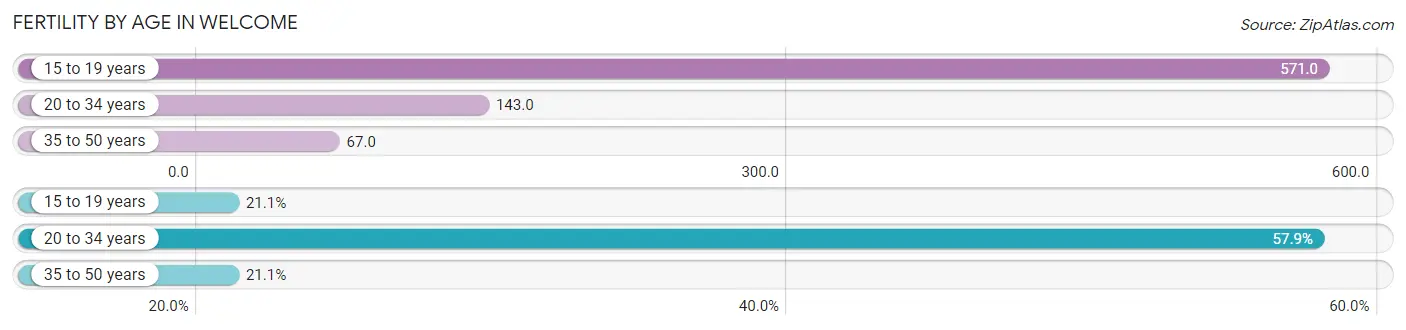
| Age Bracket | Women with Births | Births / 1,000 Women |
| 15 to 19 years | 4 (21.0%) | 571.0 |
| 20 to 34 years | 11 (57.9%) | 143.0 |
| 35 to 50 years | 4 (21.0%) | 67.0 |
| Total | 19 (100.0%) | 132.0 |
Fertility by Age by Marriage Status in Welcome
57.9% of women with births (19) in Welcome are married. The highest percentage of unmarried women with births falls into 15 to 19 years age bracket with 100.0% of them unmarried at the time of birth, while the lowest percentage of unmarried women with births belong to 20 to 34 years age bracket with 18.2% of them unmarried.
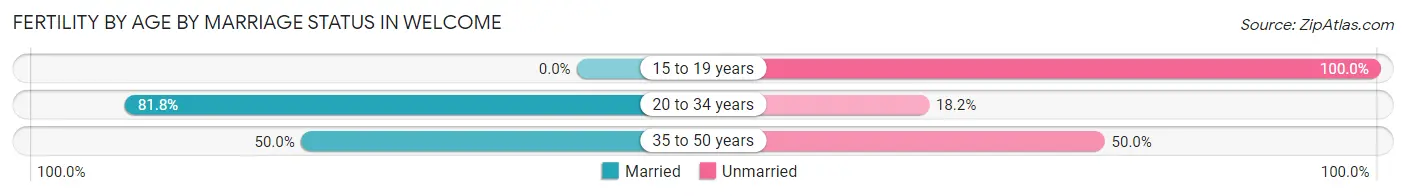
| Age Bracket | Married | Unmarried |
| 15 to 19 years | 0 (0.0%) | 4 (100.0%) |
| 20 to 34 years | 9 (81.8%) | 2 (18.2%) |
| 35 to 50 years | 2 (50.0%) | 2 (50.0%) |
| Total | 11 (57.9%) | 8 (42.1%) |
Fertility by Education in Welcome
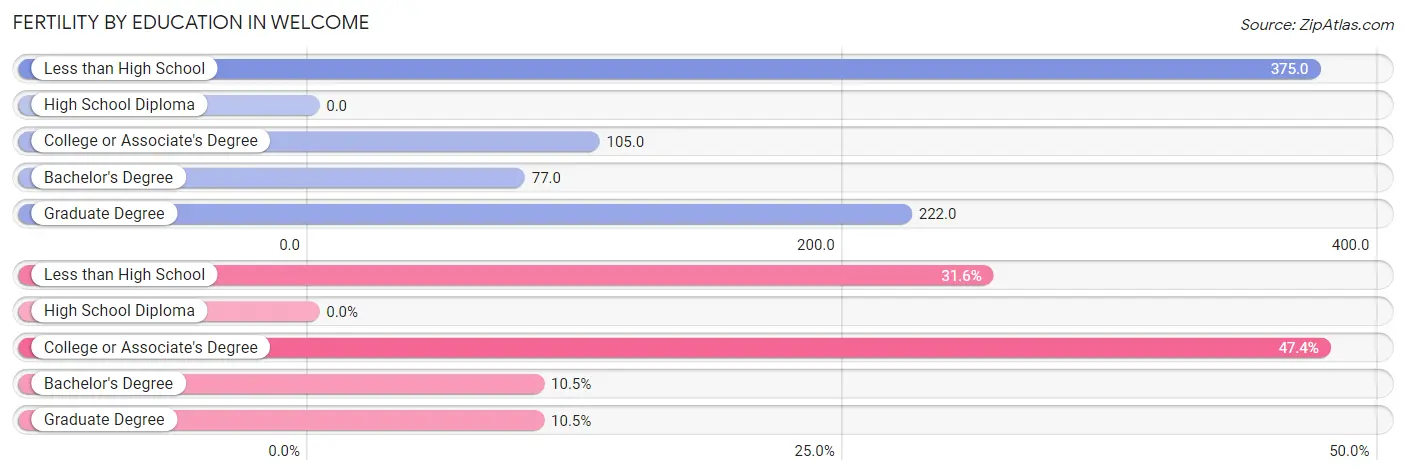
| Educational Attainment | Women with Births | Births / 1,000 Women |
| Less than High School | 6 (31.6%) | 375.0 |
| High School Diploma | 0 (0.0%) | 0.0 |
| College or Associate's Degree | 9 (47.4%) | 105.0 |
| Bachelor's Degree | 2 (10.5%) | 77.0 |
| Graduate Degree | 2 (10.5%) | 222.0 |
| Total | 19 (100.0%) | 132.0 |
Fertility by Education by Marriage Status in Welcome
42.1% of women with births in Welcome are unmarried. Women with the educational attainment of bachelor's degree are most likely to be married with 100.0% of them married at childbirth, while women with the educational attainment of less than high school are least likely to be married with 66.7% of them unmarried at childbirth.
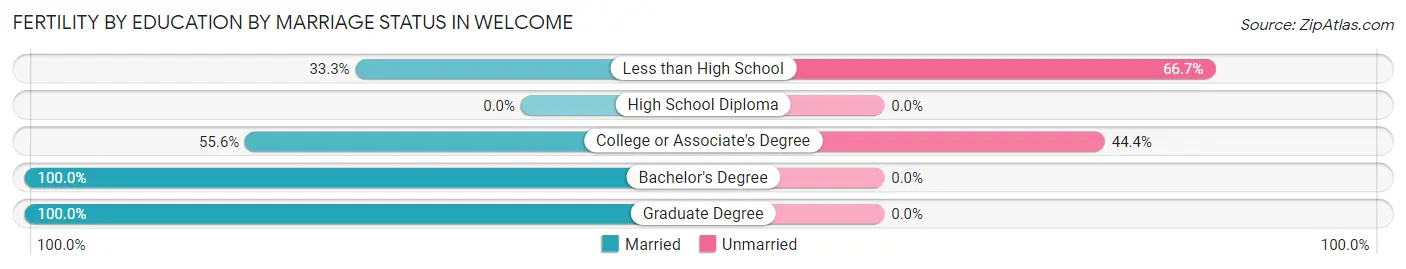
| Educational Attainment | Married | Unmarried |
| Less than High School | 2 (33.3%) | 4 (66.7%) |
| High School Diploma | 0 (0.0%) | 0 (0.0%) |
| College or Associate's Degree | 5 (55.6%) | 4 (44.4%) |
| Bachelor's Degree | 2 (100.0%) | 0 (0.0%) |
| Graduate Degree | 2 (100.0%) | 0 (0.0%) |
| Total | 11 (57.9%) | 8 (42.1%) |
Employment Characteristics in Welcome
Employment by Class of Employer in Welcome
Among the 368 employed individuals in Welcome, private company employees (224 | 60.9%), local government employees (52 | 14.1%), and not-for-profit organizations (46 | 12.5%) make up the most common classes of employment.
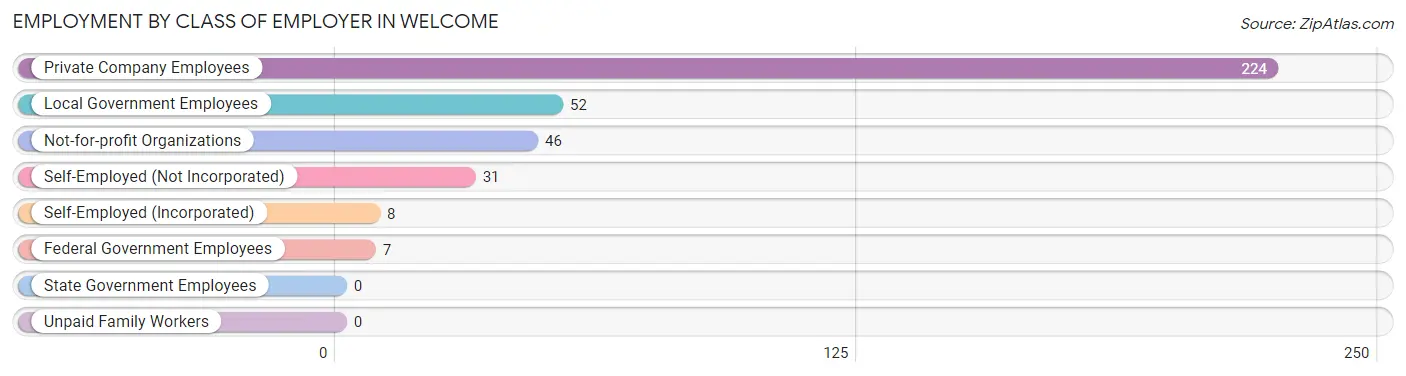
| Employer Class | # Employees | % Employees |
| Private Company Employees | 224 | 60.9% |
| Self-Employed (Incorporated) | 8 | 2.2% |
| Self-Employed (Not Incorporated) | 31 | 8.4% |
| Not-for-profit Organizations | 46 | 12.5% |
| Local Government Employees | 52 | 14.1% |
| State Government Employees | 0 | 0.0% |
| Federal Government Employees | 7 | 1.9% |
| Unpaid Family Workers | 0 | 0.0% |
| Total | 368 | 100.0% |
Employment Status by Age in Welcome
According to the labor force statistics for Welcome, out of the total population over 16 years of age (604), 66.2% or 400 individuals are in the labor force, with 8.0% or 32 of them unemployed. The age group with the highest labor force participation rate is 45 to 54 years, with 98.6% or 69 individuals in the labor force. Within the labor force, the 30 to 34 years age range has the highest percentage of unemployed individuals, with 34.4% or 31 of them being unemployed.
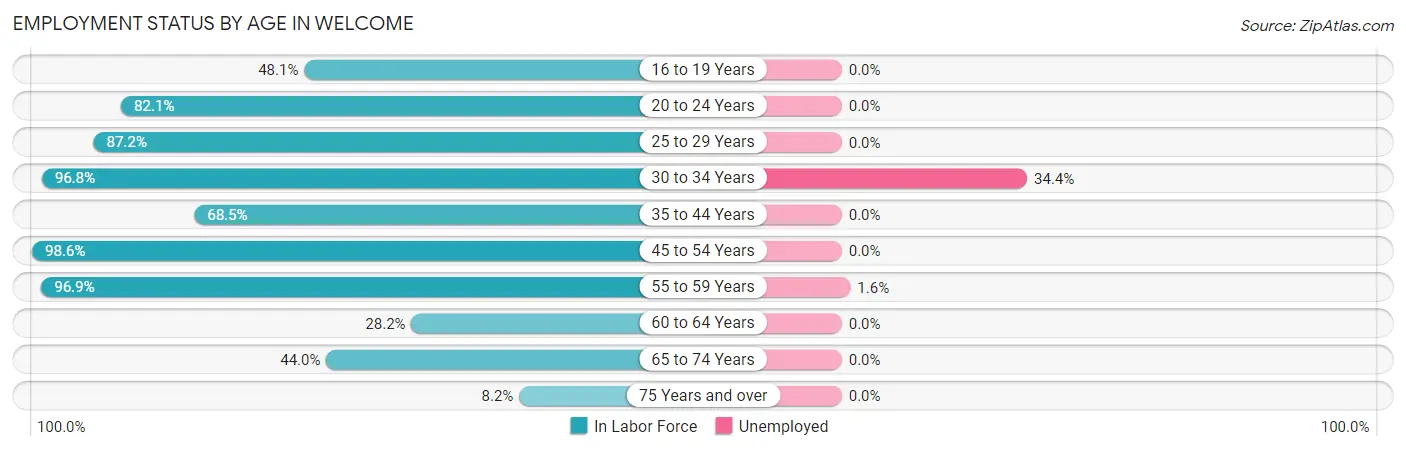
| Age Bracket | In Labor Force | Unemployed |
| 16 to 19 Years | 13 (48.1%) | 0 (0.0%) |
| 20 to 24 Years | 23 (82.1%) | 0 (0.0%) |
| 25 to 29 Years | 34 (87.2%) | 0 (0.0%) |
| 30 to 34 Years | 90 (96.8%) | 31 (34.4%) |
| 35 to 44 Years | 61 (68.5%) | 0 (0.0%) |
| 45 to 54 Years | 69 (98.6%) | 0 (0.0%) |
| 55 to 59 Years | 62 (96.9%) | 1 (1.6%) |
| 60 to 64 Years | 20 (28.2%) | 0 (0.0%) |
| 65 to 74 Years | 22 (44.0%) | 0 (0.0%) |
| 75 Years and over | 6 (8.2%) | 0 (0.0%) |
| Total | 400 (66.2%) | 32 (8.0%) |
Employment Status by Educational Attainment in Welcome
According to labor force statistics for Welcome, 78.9% of individuals (336) out of the total population between 25 and 64 years of age (426) are in the labor force, with 9.6% or 32 of them being unemployed. The group with the highest labor force participation rate are those with the educational attainment of college / associate degree, with 91.9% or 226 individuals in the labor force. Within the labor force, individuals with less than high school education have the highest percentage of unemployment, with 33.3% or 4 of them being unemployed.
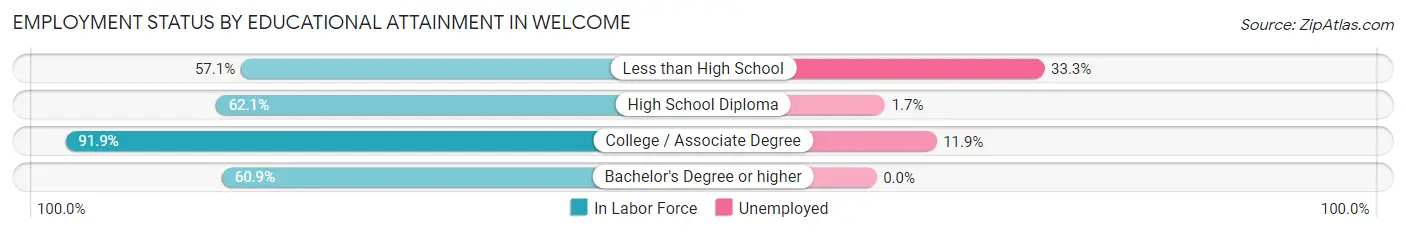
| Educational Attainment | In Labor Force | Unemployed |
| Less than High School | 12 (57.1%) | 7 (33.3%) |
| High School Diploma | 59 (62.1%) | 2 (1.7%) |
| College / Associate Degree | 226 (91.9%) | 29 (11.9%) |
| Bachelor's Degree or higher | 39 (60.9%) | 0 (0.0%) |
| Total | 336 (78.9%) | 41 (9.6%) |
Employment Occupations by Sex in Welcome
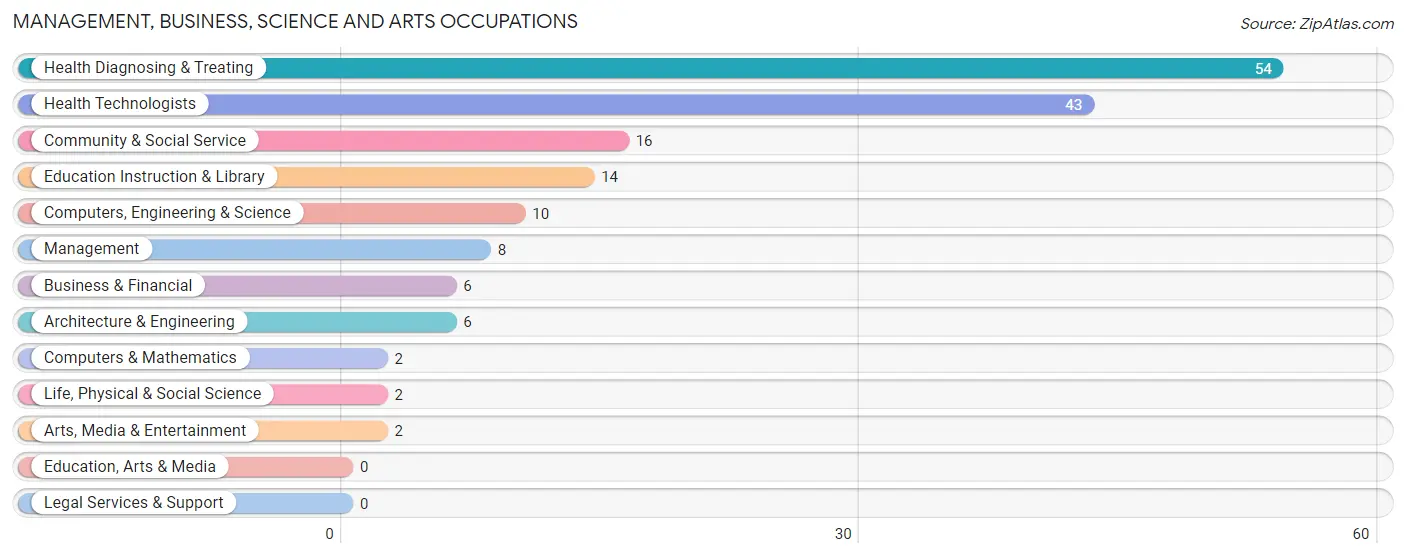
Management, Business, Science and Arts Occupations
The most common Management, Business, Science and Arts occupations in Welcome are Health Diagnosing & Treating (54 | 14.7%), Health Technologists (43 | 11.7%), Community & Social Service (16 | 4.4%), Education Instruction & Library (14 | 3.8%), and Computers, Engineering & Science (10 | 2.7%).
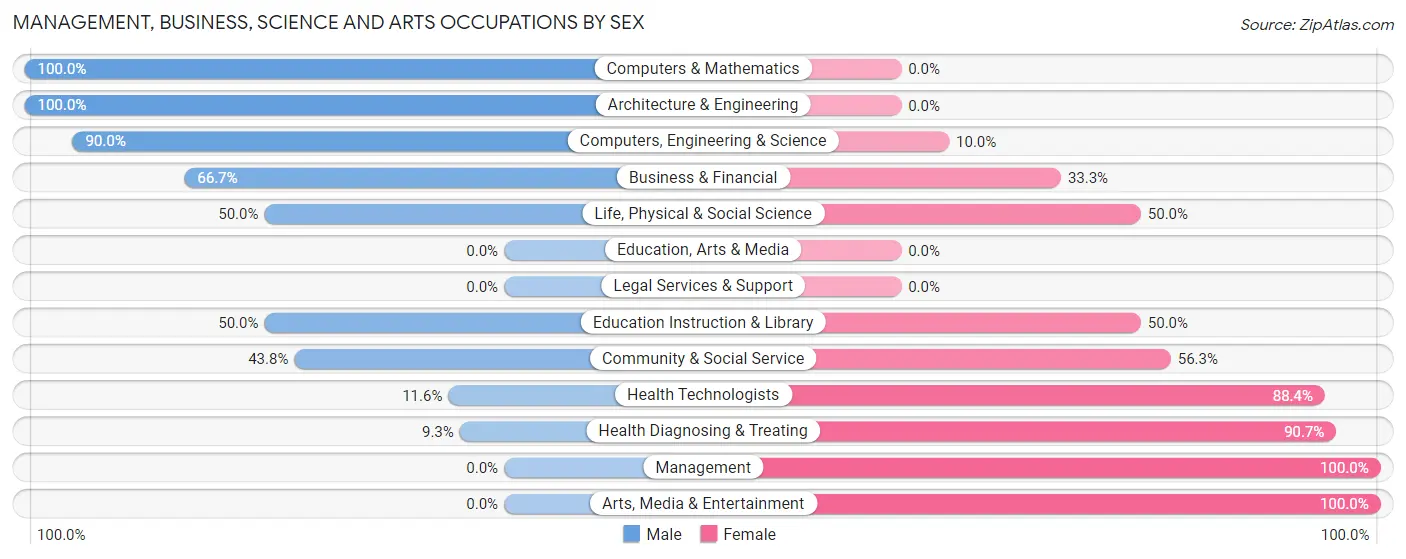
Management, Business, Science and Arts Occupations by Sex
Within the Management, Business, Science and Arts occupations in Welcome, the most male-oriented occupations are Computers & Mathematics (100.0%), Architecture & Engineering (100.0%), and Computers, Engineering & Science (90.0%), while the most female-oriented occupations are Management (100.0%), Arts, Media & Entertainment (100.0%), and Health Diagnosing & Treating (90.7%).
| Occupation | Male | Female |
| Management | 0 (0.0%) | 8 (100.0%) |
| Business & Financial | 4 (66.7%) | 2 (33.3%) |
| Computers, Engineering & Science | 9 (90.0%) | 1 (10.0%) |
| Computers & Mathematics | 2 (100.0%) | 0 (0.0%) |
| Architecture & Engineering | 6 (100.0%) | 0 (0.0%) |
| Life, Physical & Social Science | 1 (50.0%) | 1 (50.0%) |
| Community & Social Service | 7 (43.8%) | 9 (56.2%) |
| Education, Arts & Media | 0 (0.0%) | 0 (0.0%) |
| Legal Services & Support | 0 (0.0%) | 0 (0.0%) |
| Education Instruction & Library | 7 (50.0%) | 7 (50.0%) |
| Arts, Media & Entertainment | 0 (0.0%) | 2 (100.0%) |
| Health Diagnosing & Treating | 5 (9.3%) | 49 (90.7%) |
| Health Technologists | 5 (11.6%) | 38 (88.4%) |
| Total (Category) | 25 (26.6%) | 69 (73.4%) |
| Total (Overall) | 208 (56.7%) | 159 (43.3%) |
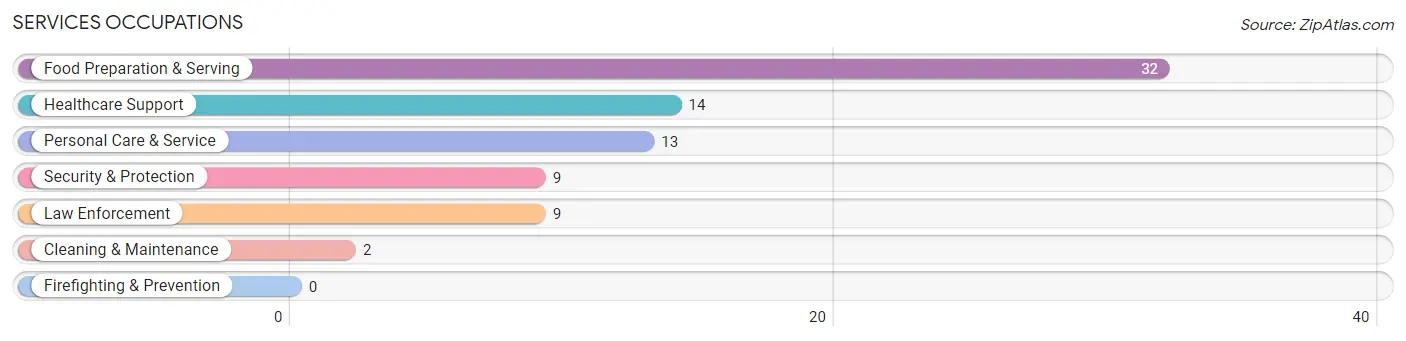
Services Occupations
The most common Services occupations in Welcome are Food Preparation & Serving (32 | 8.7%), Healthcare Support (14 | 3.8%), Personal Care & Service (13 | 3.5%), Security & Protection (9 | 2.5%), and Law Enforcement (9 | 2.5%).
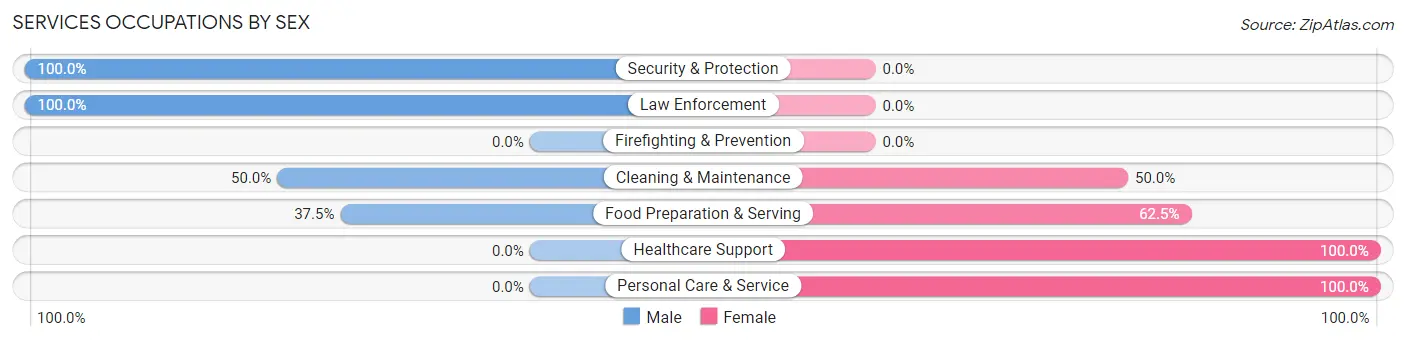
Services Occupations by Sex
Within the Services occupations in Welcome, the most male-oriented occupations are Security & Protection (100.0%), Law Enforcement (100.0%), and Cleaning & Maintenance (50.0%), while the most female-oriented occupations are Healthcare Support (100.0%), Personal Care & Service (100.0%), and Food Preparation & Serving (62.5%).
| Occupation | Male | Female |
| Healthcare Support | 0 (0.0%) | 14 (100.0%) |
| Security & Protection | 9 (100.0%) | 0 (0.0%) |
| Firefighting & Prevention | 0 (0.0%) | 0 (0.0%) |
| Law Enforcement | 9 (100.0%) | 0 (0.0%) |
| Food Preparation & Serving | 12 (37.5%) | 20 (62.5%) |
| Cleaning & Maintenance | 1 (50.0%) | 1 (50.0%) |
| Personal Care & Service | 0 (0.0%) | 13 (100.0%) |
| Total (Category) | 22 (31.4%) | 48 (68.6%) |
| Total (Overall) | 208 (56.7%) | 159 (43.3%) |
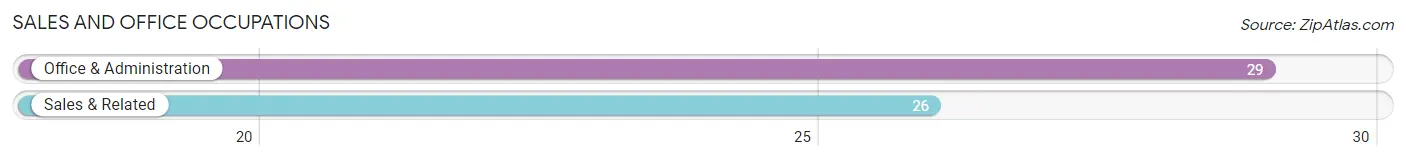
Sales and Office Occupations
The most common Sales and Office occupations in Welcome are Office & Administration (29 | 7.9%), and Sales & Related (26 | 7.1%).
Sales and Office Occupations by Sex
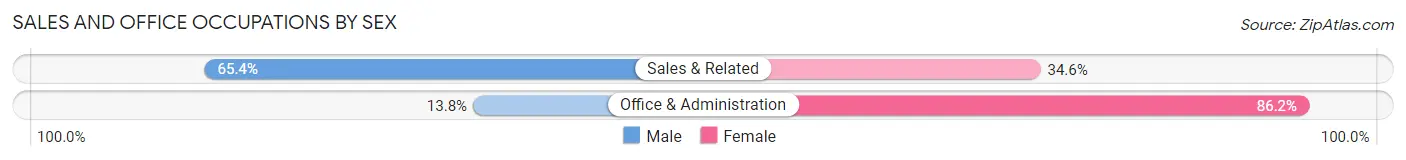
| Occupation | Male | Female |
| Sales & Related | 17 (65.4%) | 9 (34.6%) |
| Office & Administration | 4 (13.8%) | 25 (86.2%) |
| Total (Category) | 21 (38.2%) | 34 (61.8%) |
| Total (Overall) | 208 (56.7%) | 159 (43.3%) |
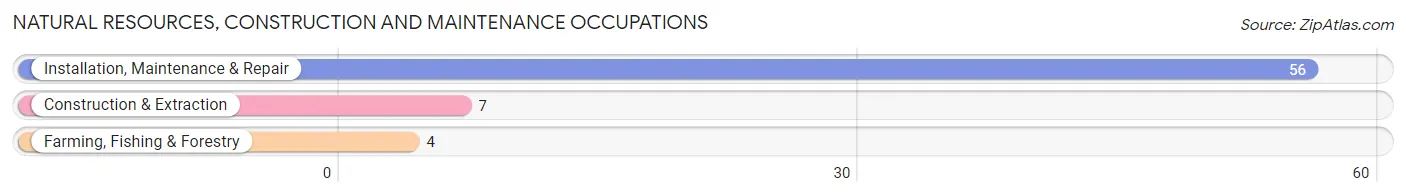
Natural Resources, Construction and Maintenance Occupations
The most common Natural Resources, Construction and Maintenance occupations in Welcome are Installation, Maintenance & Repair (56 | 15.3%), Construction & Extraction (7 | 1.9%), and Farming, Fishing & Forestry (4 | 1.1%).
Natural Resources, Construction and Maintenance Occupations by Sex
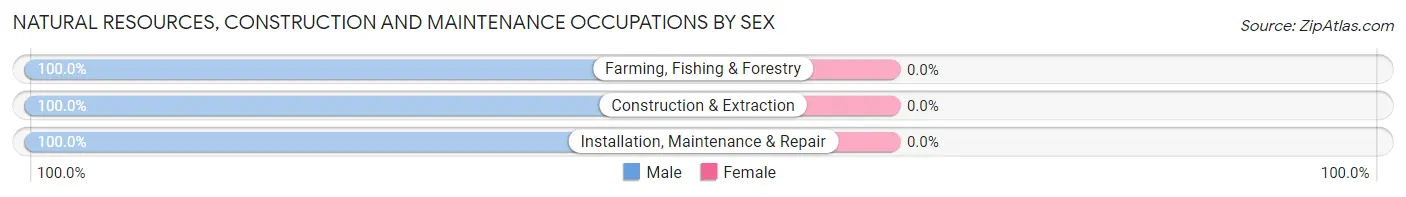
| Occupation | Male | Female |
| Farming, Fishing & Forestry | 4 (100.0%) | 0 (0.0%) |
| Construction & Extraction | 7 (100.0%) | 0 (0.0%) |
| Installation, Maintenance & Repair | 56 (100.0%) | 0 (0.0%) |
| Total (Category) | 67 (100.0%) | 0 (0.0%) |
| Total (Overall) | 208 (56.7%) | 159 (43.3%) |
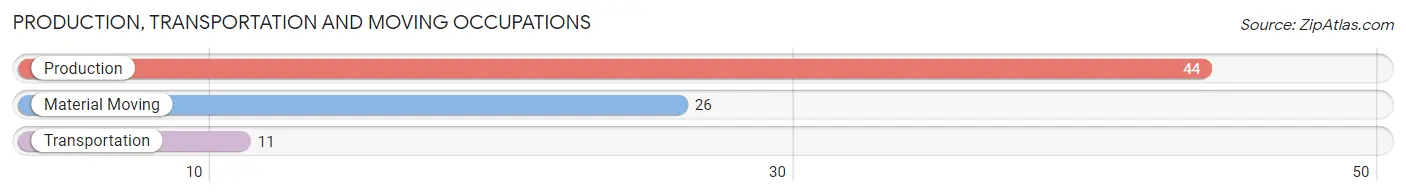
Production, Transportation and Moving Occupations
The most common Production, Transportation and Moving occupations in Welcome are Production (44 | 12.0%), Material Moving (26 | 7.1%), and Transportation (11 | 3.0%).
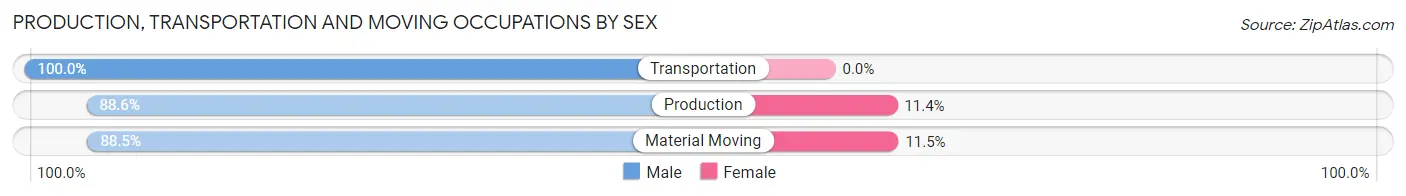
Production, Transportation and Moving Occupations by Sex
| Occupation | Male | Female |
| Production | 39 (88.6%) | 5 (11.4%) |
| Transportation | 11 (100.0%) | 0 (0.0%) |
| Material Moving | 23 (88.5%) | 3 (11.5%) |
| Total (Category) | 73 (90.1%) | 8 (9.9%) |
| Total (Overall) | 208 (56.7%) | 159 (43.3%) |
Employment Industries by Sex in Welcome
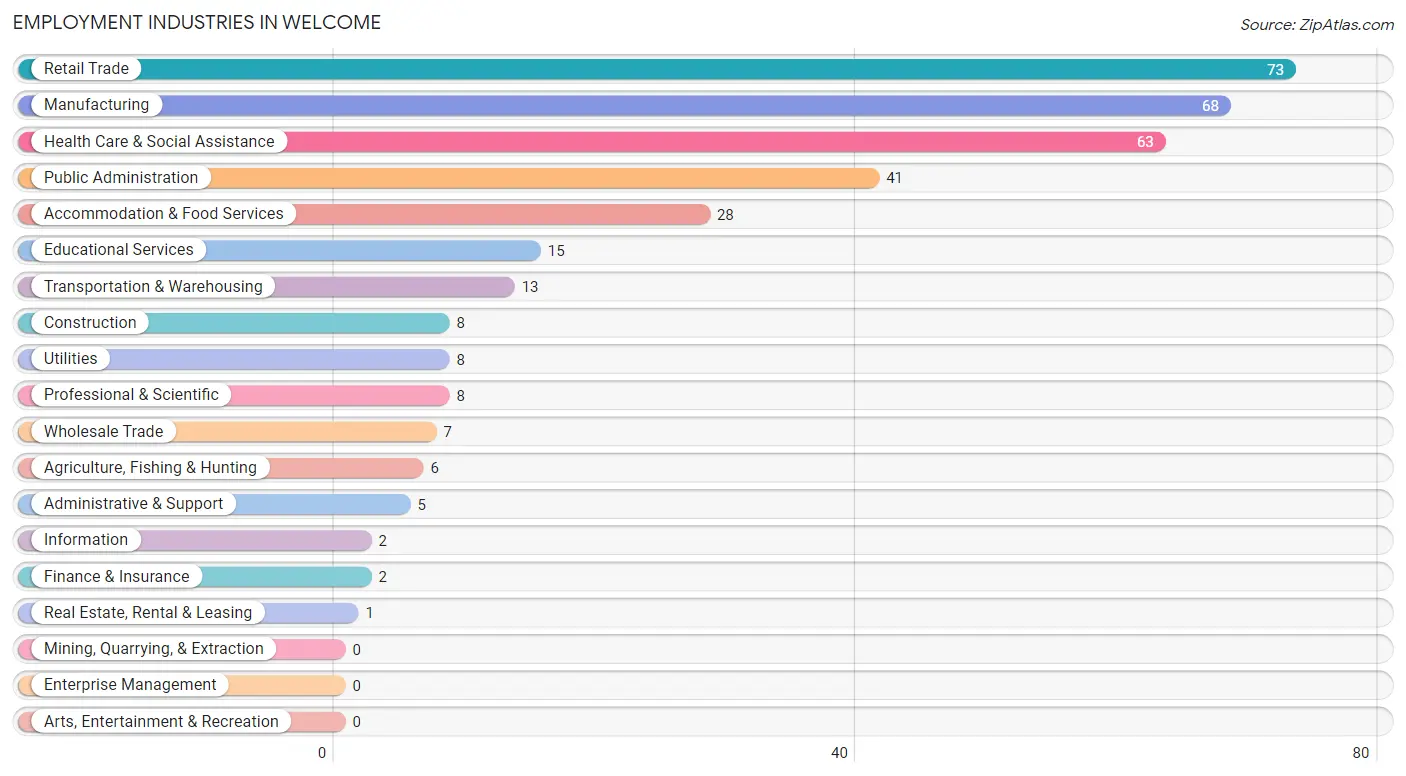
Employment Industries in Welcome
The major employment industries in Welcome include Retail Trade (73 | 19.9%), Manufacturing (68 | 18.5%), Health Care & Social Assistance (63 | 17.2%), Public Administration (41 | 11.2%), and Accommodation & Food Services (28 | 7.6%).
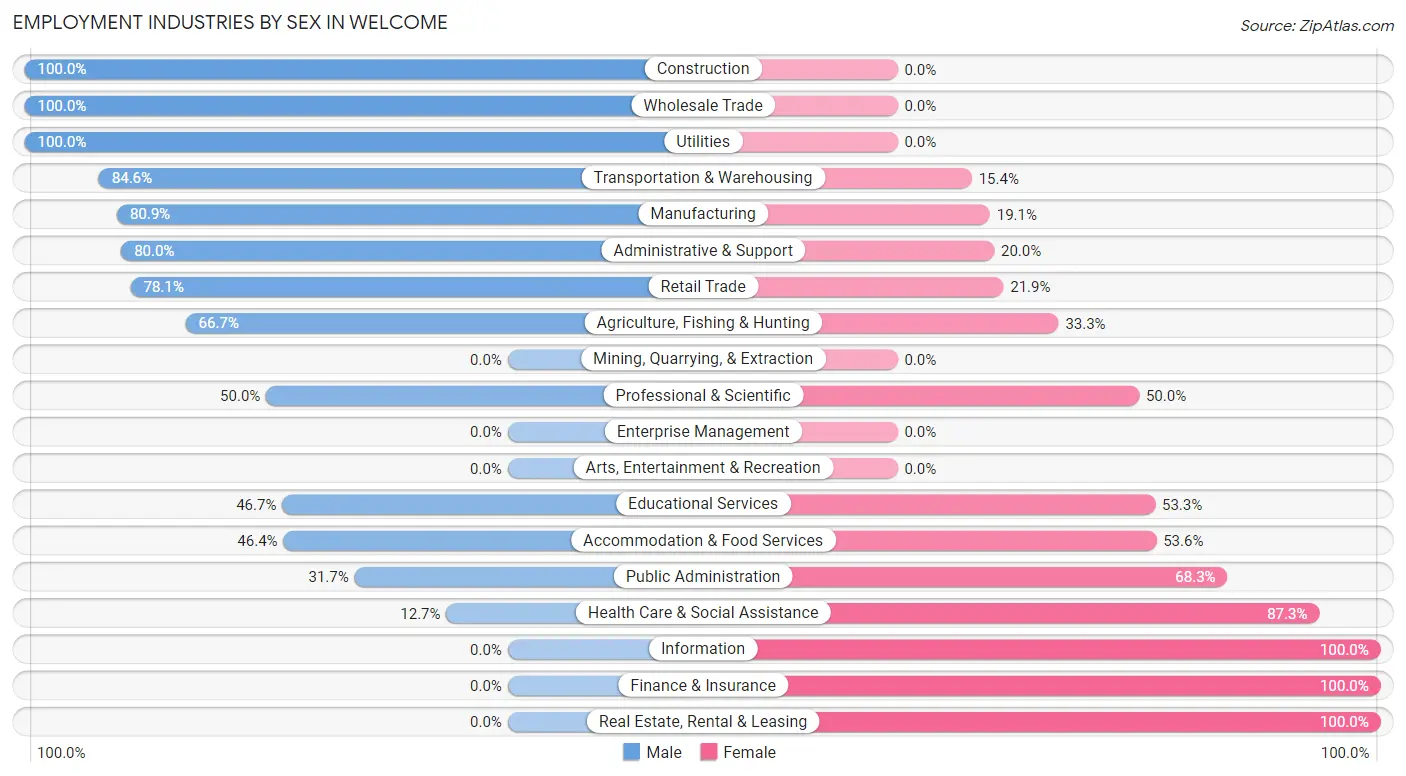
Employment Industries by Sex in Welcome
The Welcome industries that see more men than women are Construction (100.0%), Wholesale Trade (100.0%), and Utilities (100.0%), whereas the industries that tend to have a higher number of women are Information (100.0%), Finance & Insurance (100.0%), and Real Estate, Rental & Leasing (100.0%).
| Industry | Male | Female |
| Agriculture, Fishing & Hunting | 4 (66.7%) | 2 (33.3%) |
| Mining, Quarrying, & Extraction | 0 (0.0%) | 0 (0.0%) |
| Construction | 8 (100.0%) | 0 (0.0%) |
| Manufacturing | 55 (80.9%) | 13 (19.1%) |
| Wholesale Trade | 7 (100.0%) | 0 (0.0%) |
| Retail Trade | 57 (78.1%) | 16 (21.9%) |
| Transportation & Warehousing | 11 (84.6%) | 2 (15.4%) |
| Utilities | 8 (100.0%) | 0 (0.0%) |
| Information | 0 (0.0%) | 2 (100.0%) |
| Finance & Insurance | 0 (0.0%) | 2 (100.0%) |
| Real Estate, Rental & Leasing | 0 (0.0%) | 1 (100.0%) |
| Professional & Scientific | 4 (50.0%) | 4 (50.0%) |
| Enterprise Management | 0 (0.0%) | 0 (0.0%) |
| Administrative & Support | 4 (80.0%) | 1 (20.0%) |
| Educational Services | 7 (46.7%) | 8 (53.3%) |
| Health Care & Social Assistance | 8 (12.7%) | 55 (87.3%) |
| Arts, Entertainment & Recreation | 0 (0.0%) | 0 (0.0%) |
| Accommodation & Food Services | 13 (46.4%) | 15 (53.6%) |
| Public Administration | 13 (31.7%) | 28 (68.3%) |
| Total | 208 (56.7%) | 159 (43.3%) |
Education in Welcome
School Enrollment in Welcome
The most common levels of schooling among the 242 students in Welcome are middle school (90 | 37.2%), elementary school (75 | 31.0%), and college / undergraduate (32 | 13.2%).
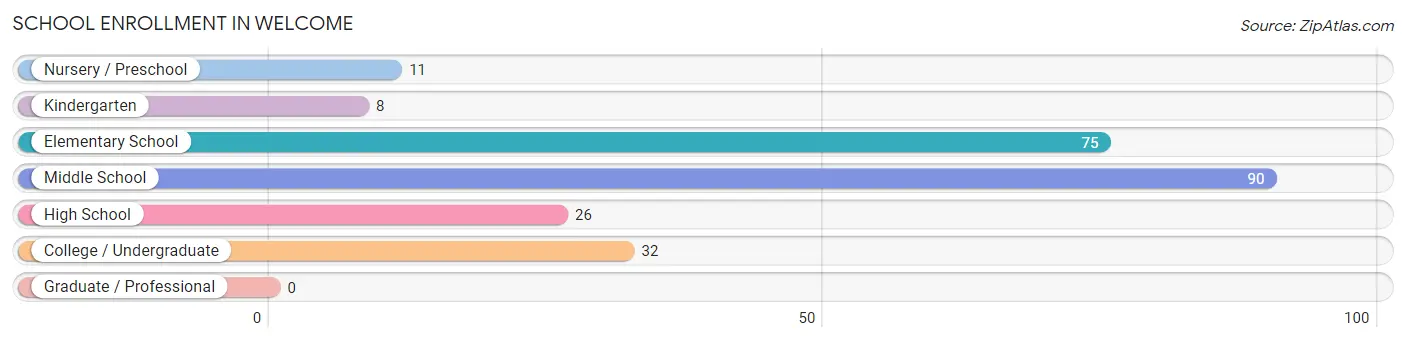
| School Level | # Students | % Students |
| Nursery / Preschool | 11 | 4.5% |
| Kindergarten | 8 | 3.3% |
| Elementary School | 75 | 31.0% |
| Middle School | 90 | 37.2% |
| High School | 26 | 10.7% |
| College / Undergraduate | 32 | 13.2% |
| Graduate / Professional | 0 | 0.0% |
| Total | 242 | 100.0% |
School Enrollment by Age by Funding Source in Welcome
Out of a total of 242 students who are enrolled in schools in Welcome, 1 (0.4%) attend a private institution, while the remaining 241 (99.6%) are enrolled in public schools. The age group of 5 to 9 year old has the highest likelihood of being enrolled in private schools, with 1 (1.3% in the age bracket) enrolled. Conversely, the age group of 3 to 4 year olds has the lowest likelihood of being enrolled in a private school, with 7 (100.0% in the age bracket) attending a public institution.
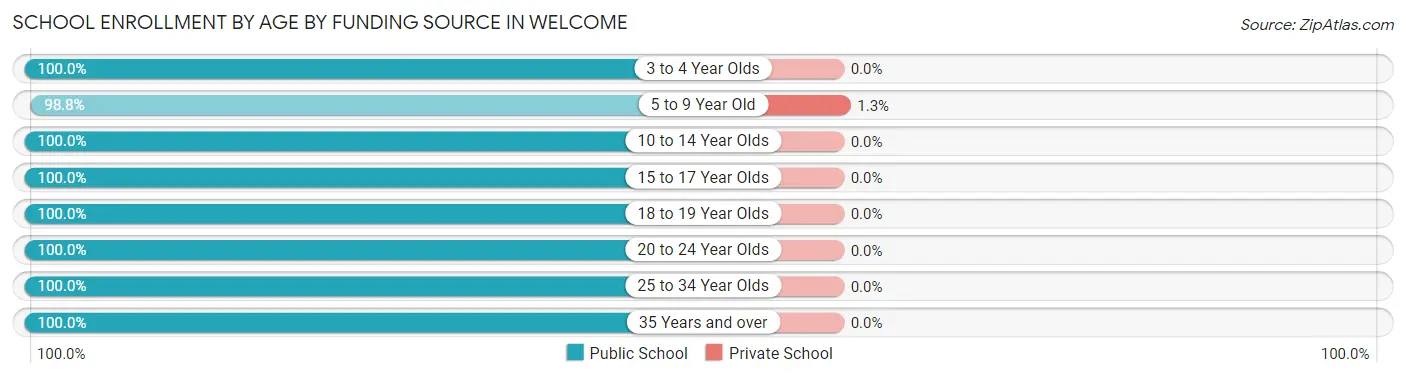
| Age Bracket | Public School | Private School |
| 3 to 4 Year Olds | 7 (100.0%) | 0 (0.0%) |
| 5 to 9 Year Old | 79 (98.8%) | 1 (1.3%) |
| 10 to 14 Year Olds | 98 (100.0%) | 0 (0.0%) |
| 15 to 17 Year Olds | 15 (100.0%) | 0 (0.0%) |
| 18 to 19 Year Olds | 12 (100.0%) | 0 (0.0%) |
| 20 to 24 Year Olds | 4 (100.0%) | 0 (0.0%) |
| 25 to 34 Year Olds | 3 (100.0%) | 0 (0.0%) |
| 35 Years and over | 23 (100.0%) | 0 (0.0%) |
| Total | 241 (99.6%) | 1 (0.4%) |
Educational Attainment by Field of Study in Welcome
Education (28 | 25.7%), physical & health sciences (21 | 19.3%), bio, nature & agricultural (19 | 17.4%), science & technology (14 | 12.8%), and arts & humanities (13 | 11.9%) are the most common fields of study among 109 individuals in Welcome who have obtained a bachelor's degree or higher.
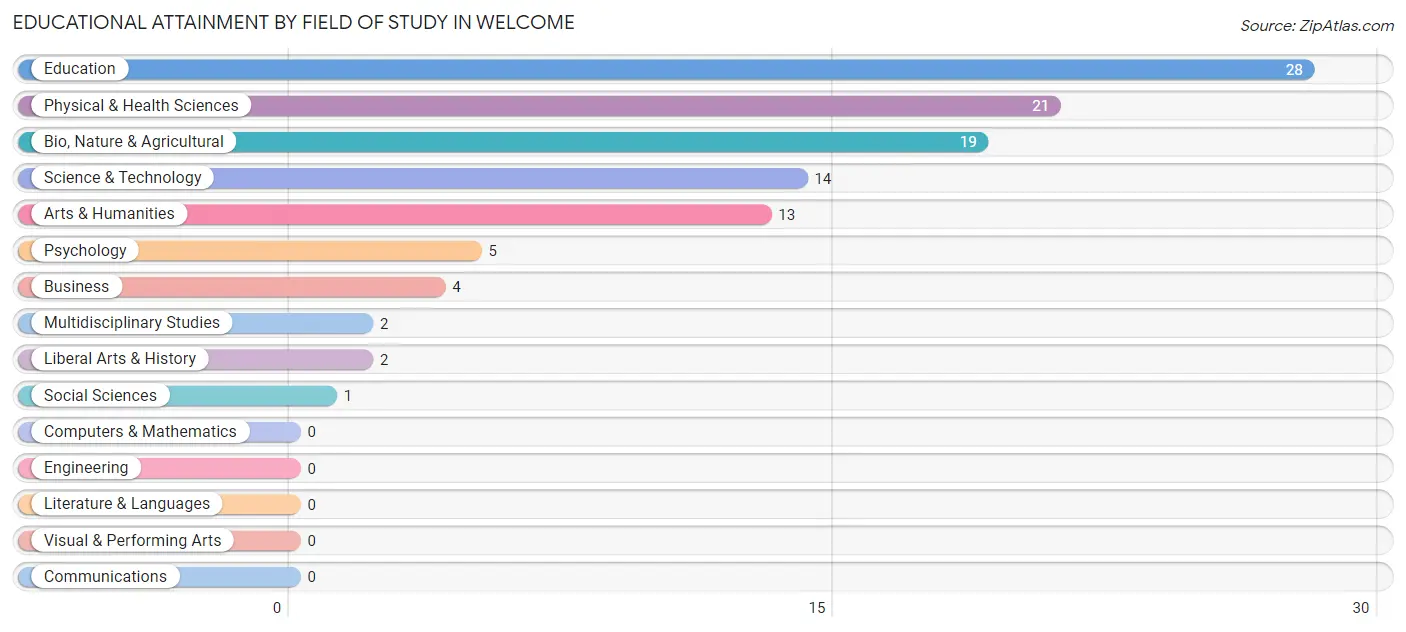
| Field of Study | # Graduates | % Graduates |
| Computers & Mathematics | 0 | 0.0% |
| Bio, Nature & Agricultural | 19 | 17.4% |
| Physical & Health Sciences | 21 | 19.3% |
| Psychology | 5 | 4.6% |
| Social Sciences | 1 | 0.9% |
| Engineering | 0 | 0.0% |
| Multidisciplinary Studies | 2 | 1.8% |
| Science & Technology | 14 | 12.8% |
| Business | 4 | 3.7% |
| Education | 28 | 25.7% |
| Literature & Languages | 0 | 0.0% |
| Liberal Arts & History | 2 | 1.8% |
| Visual & Performing Arts | 0 | 0.0% |
| Communications | 0 | 0.0% |
| Arts & Humanities | 13 | 11.9% |
| Total | 109 | 100.0% |
Transportation & Commute in Welcome
Vehicle Availability by Sex in Welcome
The most prevalent vehicle ownership categories in Welcome are males with 2 vehicles (67, accounting for 32.1%) and females with 2 vehicles (72, making up 42.1%).
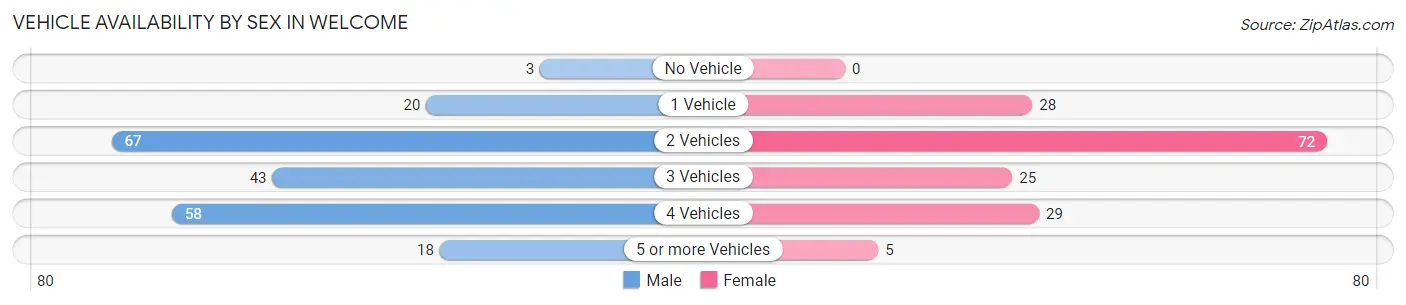
| Vehicles Available | Male | Female |
| No Vehicle | 3 (1.4%) | 0 (0.0%) |
| 1 Vehicle | 20 (9.6%) | 28 (17.6%) |
| 2 Vehicles | 67 (32.1%) | 72 (45.3%) |
| 3 Vehicles | 43 (20.6%) | 25 (15.7%) |
| 4 Vehicles | 58 (27.8%) | 29 (18.2%) |
| 5 or more Vehicles | 18 (8.6%) | 5 (3.1%) |
| Total | 209 (100.0%) | 159 (100.0%) |
Commute Time in Welcome
The most frequently occuring commute durations in Welcome are 15 to 19 minutes (125 commuters, 34.6%), 20 to 24 minutes (68 commuters, 18.8%), and 5 to 9 minutes (44 commuters, 12.2%).
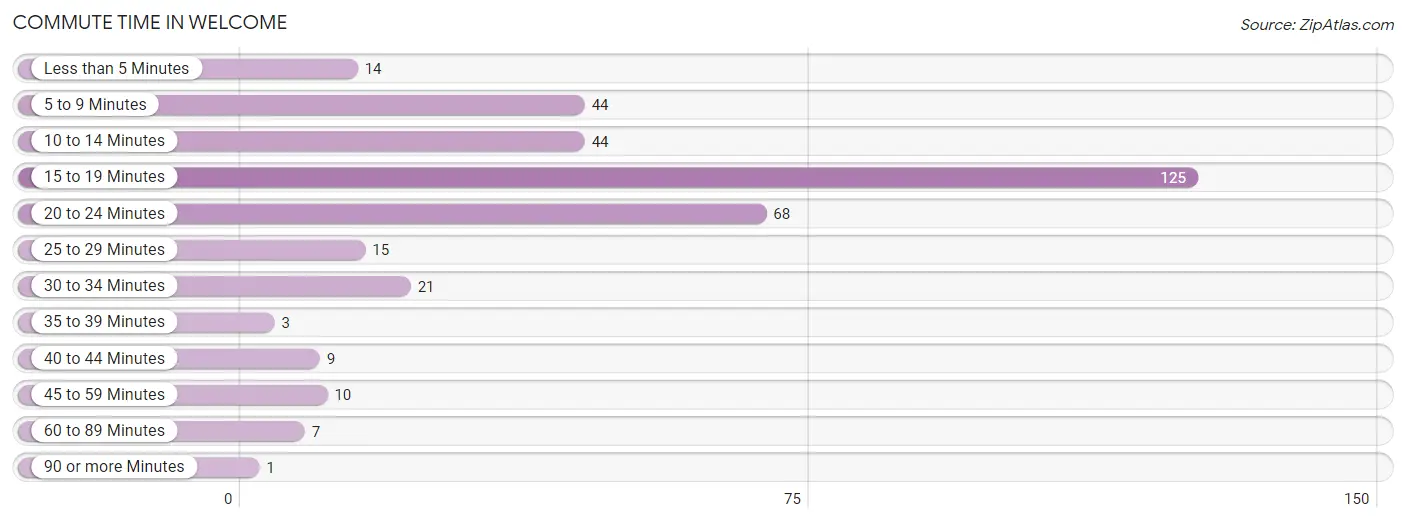
| Commute Time | # Commuters | % Commuters |
| Less than 5 Minutes | 14 | 3.9% |
| 5 to 9 Minutes | 44 | 12.2% |
| 10 to 14 Minutes | 44 | 12.2% |
| 15 to 19 Minutes | 125 | 34.6% |
| 20 to 24 Minutes | 68 | 18.8% |
| 25 to 29 Minutes | 15 | 4.2% |
| 30 to 34 Minutes | 21 | 5.8% |
| 35 to 39 Minutes | 3 | 0.8% |
| 40 to 44 Minutes | 9 | 2.5% |
| 45 to 59 Minutes | 10 | 2.8% |
| 60 to 89 Minutes | 7 | 1.9% |
| 90 or more Minutes | 1 | 0.3% |
Commute Time by Sex in Welcome
The most common commute times in Welcome are 15 to 19 minutes (58 commuters, 27.9%) for males and 15 to 19 minutes (67 commuters, 43.8%) for females.
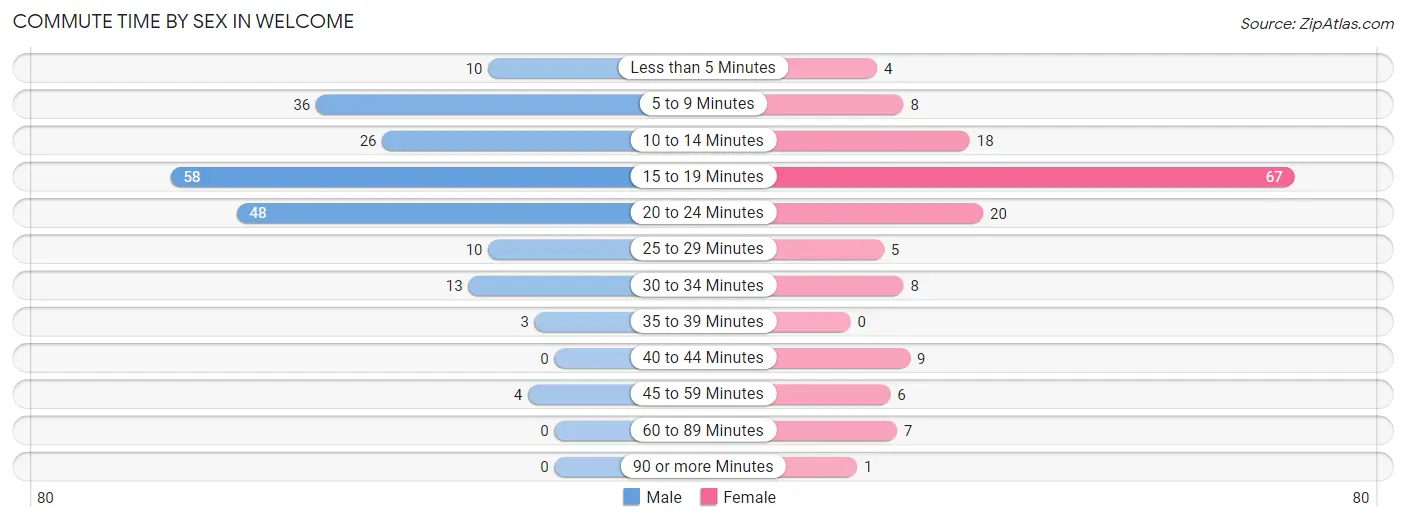
| Commute Time | Male | Female |
| Less than 5 Minutes | 10 (4.8%) | 4 (2.6%) |
| 5 to 9 Minutes | 36 (17.3%) | 8 (5.2%) |
| 10 to 14 Minutes | 26 (12.5%) | 18 (11.8%) |
| 15 to 19 Minutes | 58 (27.9%) | 67 (43.8%) |
| 20 to 24 Minutes | 48 (23.1%) | 20 (13.1%) |
| 25 to 29 Minutes | 10 (4.8%) | 5 (3.3%) |
| 30 to 34 Minutes | 13 (6.2%) | 8 (5.2%) |
| 35 to 39 Minutes | 3 (1.4%) | 0 (0.0%) |
| 40 to 44 Minutes | 0 (0.0%) | 9 (5.9%) |
| 45 to 59 Minutes | 4 (1.9%) | 6 (3.9%) |
| 60 to 89 Minutes | 0 (0.0%) | 7 (4.6%) |
| 90 or more Minutes | 0 (0.0%) | 1 (0.6%) |
Time of Departure to Work by Sex in Welcome
The most frequent times of departure to work in Welcome are 7:00 AM to 7:29 AM (58, 27.9%) for males and 7:30 AM to 7:59 AM (46, 30.1%) for females.
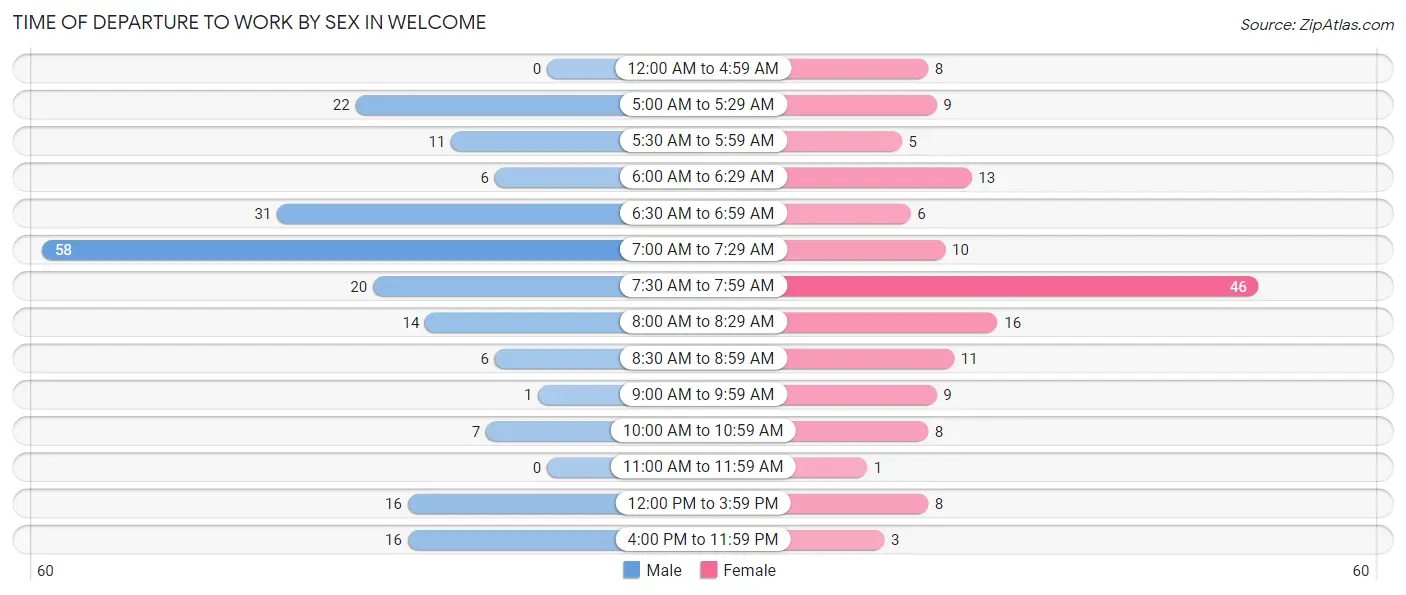
| Time of Departure | Male | Female |
| 12:00 AM to 4:59 AM | 0 (0.0%) | 8 (5.2%) |
| 5:00 AM to 5:29 AM | 22 (10.6%) | 9 (5.9%) |
| 5:30 AM to 5:59 AM | 11 (5.3%) | 5 (3.3%) |
| 6:00 AM to 6:29 AM | 6 (2.9%) | 13 (8.5%) |
| 6:30 AM to 6:59 AM | 31 (14.9%) | 6 (3.9%) |
| 7:00 AM to 7:29 AM | 58 (27.9%) | 10 (6.5%) |
| 7:30 AM to 7:59 AM | 20 (9.6%) | 46 (30.1%) |
| 8:00 AM to 8:29 AM | 14 (6.7%) | 16 (10.5%) |
| 8:30 AM to 8:59 AM | 6 (2.9%) | 11 (7.2%) |
| 9:00 AM to 9:59 AM | 1 (0.5%) | 9 (5.9%) |
| 10:00 AM to 10:59 AM | 7 (3.4%) | 8 (5.2%) |
| 11:00 AM to 11:59 AM | 0 (0.0%) | 1 (0.6%) |
| 12:00 PM to 3:59 PM | 16 (7.7%) | 8 (5.2%) |
| 4:00 PM to 11:59 PM | 16 (7.7%) | 3 (2.0%) |
| Total | 208 (100.0%) | 153 (100.0%) |
Housing Occupancy in Welcome
Occupancy by Ownership in Welcome
Of the total 329 dwellings in Welcome, owner-occupied units account for 281 (85.4%), while renter-occupied units make up 48 (14.6%).
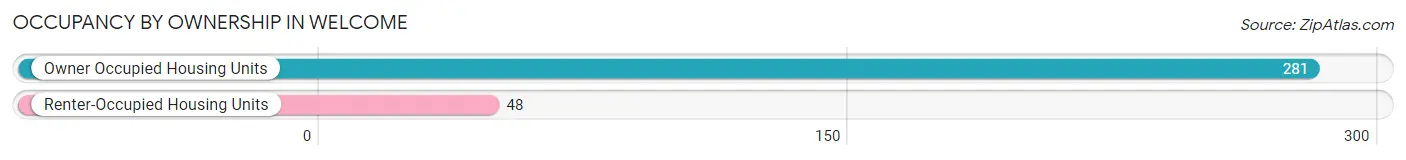
| Occupancy | # Housing Units | % Housing Units |
| Owner Occupied Housing Units | 281 | 85.4% |
| Renter-Occupied Housing Units | 48 | 14.6% |
| Total Occupied Housing Units | 329 | 100.0% |
Occupancy by Household Size in Welcome
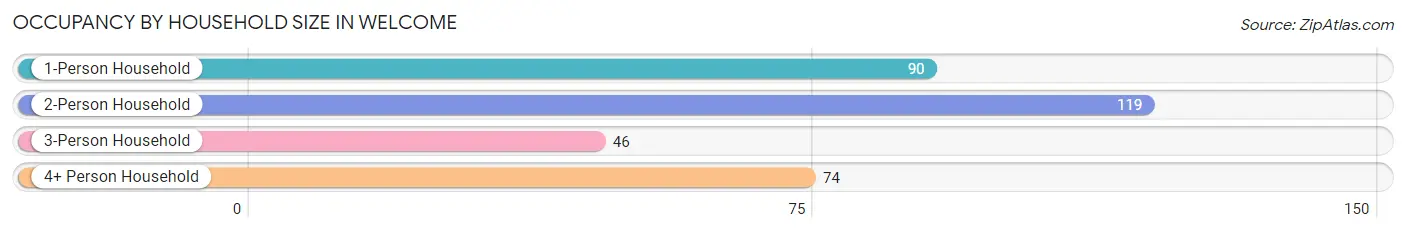
| Household Size | # Housing Units | % Housing Units |
| 1-Person Household | 90 | 27.4% |
| 2-Person Household | 119 | 36.2% |
| 3-Person Household | 46 | 14.0% |
| 4+ Person Household | 74 | 22.5% |
| Total Housing Units | 329 | 100.0% |
Occupancy by Ownership by Household Size in Welcome
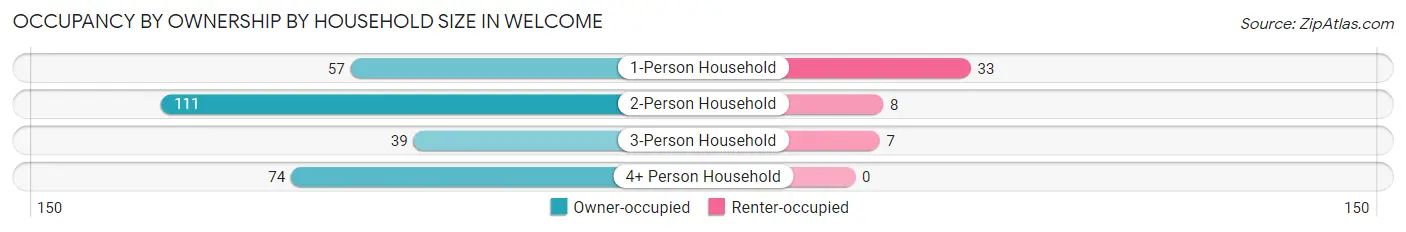
| Household Size | Owner-occupied | Renter-occupied |
| 1-Person Household | 57 (63.3%) | 33 (36.7%) |
| 2-Person Household | 111 (93.3%) | 8 (6.7%) |
| 3-Person Household | 39 (84.8%) | 7 (15.2%) |
| 4+ Person Household | 74 (100.0%) | 0 (0.0%) |
| Total Housing Units | 281 (85.4%) | 48 (14.6%) |
Occupancy by Educational Attainment in Welcome
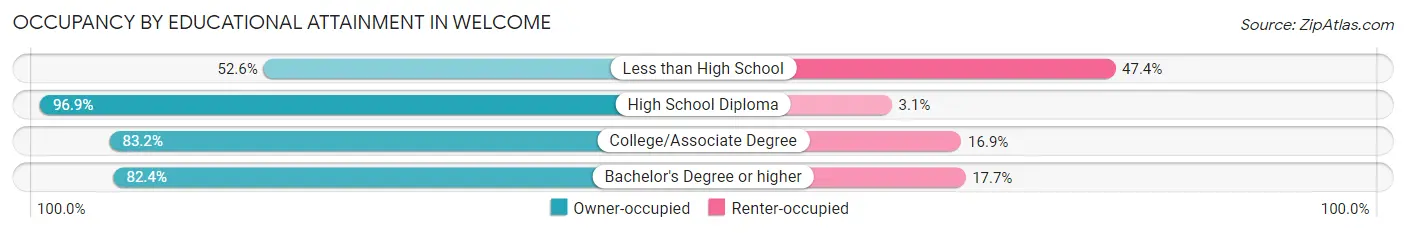
| Household Size | Owner-occupied | Renter-occupied |
| Less than High School | 10 (52.6%) | 9 (47.4%) |
| High School Diploma | 95 (96.9%) | 3 (3.1%) |
| College/Associate Degree | 148 (83.2%) | 30 (16.9%) |
| Bachelor's Degree or higher | 28 (82.4%) | 6 (17.6%) |
Occupancy by Age of Householder in Welcome
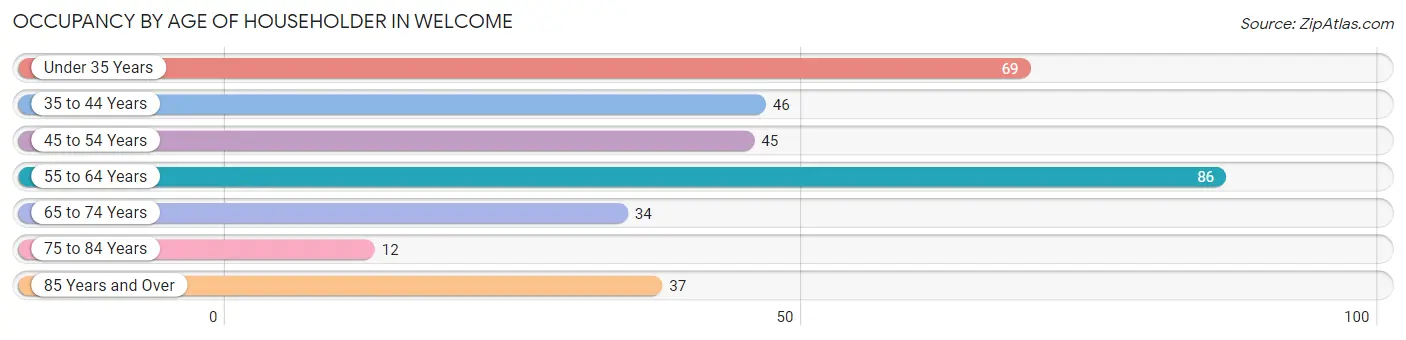
| Age Bracket | # Households | % Households |
| Under 35 Years | 69 | 21.0% |
| 35 to 44 Years | 46 | 14.0% |
| 45 to 54 Years | 45 | 13.7% |
| 55 to 64 Years | 86 | 26.1% |
| 65 to 74 Years | 34 | 10.3% |
| 75 to 84 Years | 12 | 3.6% |
| 85 Years and Over | 37 | 11.3% |
| Total | 329 | 100.0% |
Housing Finances in Welcome
Median Income by Occupancy in Welcome
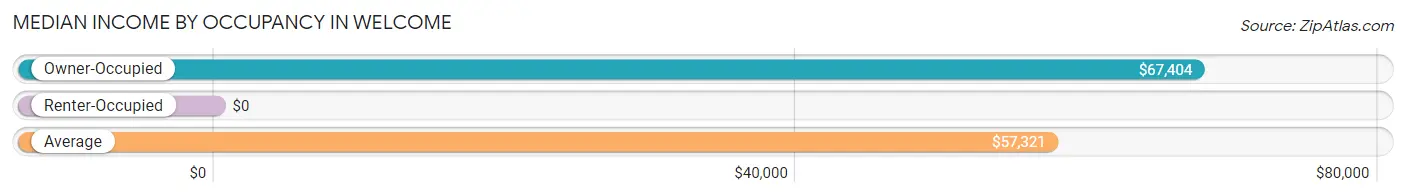
| Occupancy Type | # Households | Median Income |
| Owner-Occupied | 281 (85.4%) | $67,404 |
| Renter-Occupied | 48 (14.6%) | $0 |
| Average | 329 (100.0%) | $57,321 |
Occupancy by Householder Income Bracket in Welcome
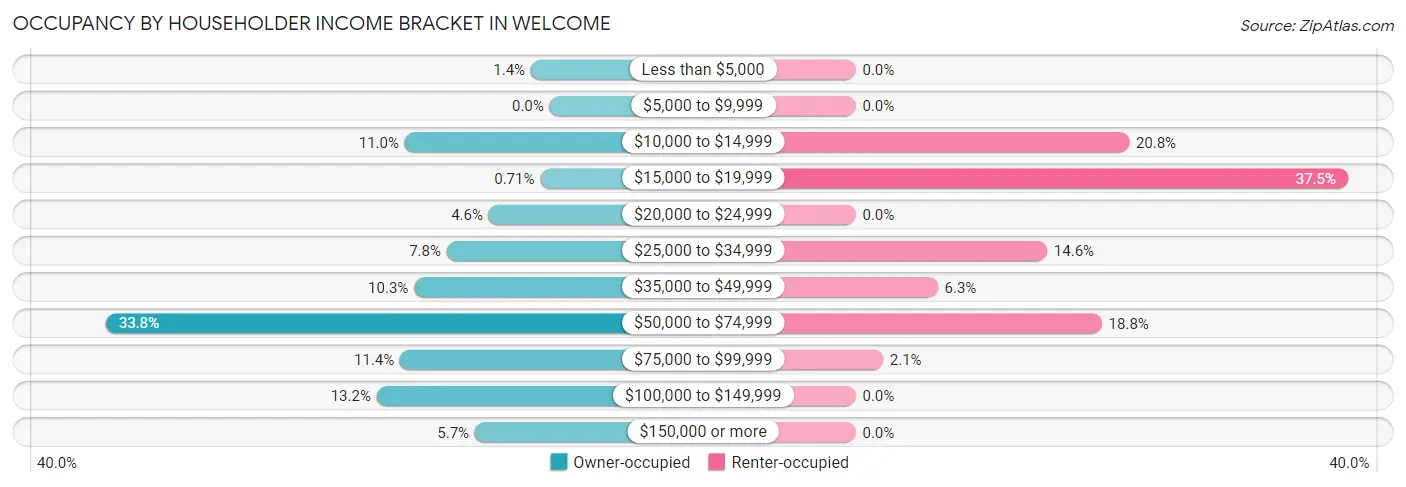
| Income Bracket | Owner-occupied | Renter-occupied |
| Less than $5,000 | 4 (1.4%) | 0 (0.0%) |
| $5,000 to $9,999 | 0 (0.0%) | 0 (0.0%) |
| $10,000 to $14,999 | 31 (11.0%) | 10 (20.8%) |
| $15,000 to $19,999 | 2 (0.7%) | 18 (37.5%) |
| $20,000 to $24,999 | 13 (4.6%) | 0 (0.0%) |
| $25,000 to $34,999 | 22 (7.8%) | 7 (14.6%) |
| $35,000 to $49,999 | 29 (10.3%) | 3 (6.2%) |
| $50,000 to $74,999 | 95 (33.8%) | 9 (18.8%) |
| $75,000 to $99,999 | 32 (11.4%) | 1 (2.1%) |
| $100,000 to $149,999 | 37 (13.2%) | 0 (0.0%) |
| $150,000 or more | 16 (5.7%) | 0 (0.0%) |
| Total | 281 (100.0%) | 48 (100.0%) |
Monthly Housing Cost Tiers in Welcome
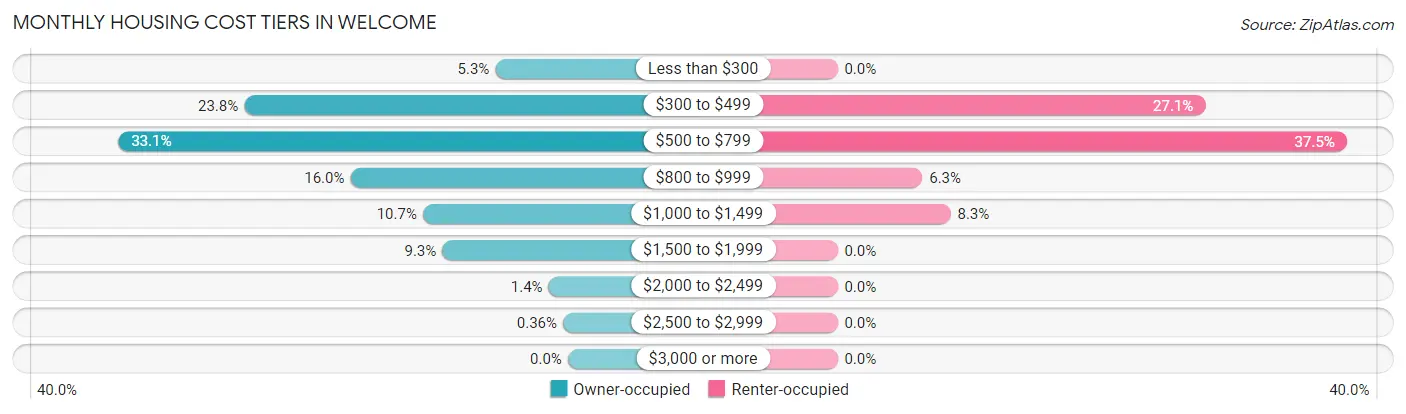
| Monthly Cost | Owner-occupied | Renter-occupied |
| Less than $300 | 15 (5.3%) | 0 (0.0%) |
| $300 to $499 | 67 (23.8%) | 13 (27.1%) |
| $500 to $799 | 93 (33.1%) | 18 (37.5%) |
| $800 to $999 | 45 (16.0%) | 3 (6.2%) |
| $1,000 to $1,499 | 30 (10.7%) | 4 (8.3%) |
| $1,500 to $1,999 | 26 (9.2%) | 0 (0.0%) |
| $2,000 to $2,499 | 4 (1.4%) | 0 (0.0%) |
| $2,500 to $2,999 | 1 (0.4%) | 0 (0.0%) |
| $3,000 or more | 0 (0.0%) | 0 (0.0%) |
| Total | 281 (100.0%) | 48 (100.0%) |
Physical Housing Characteristics in Welcome
Housing Structures in Welcome
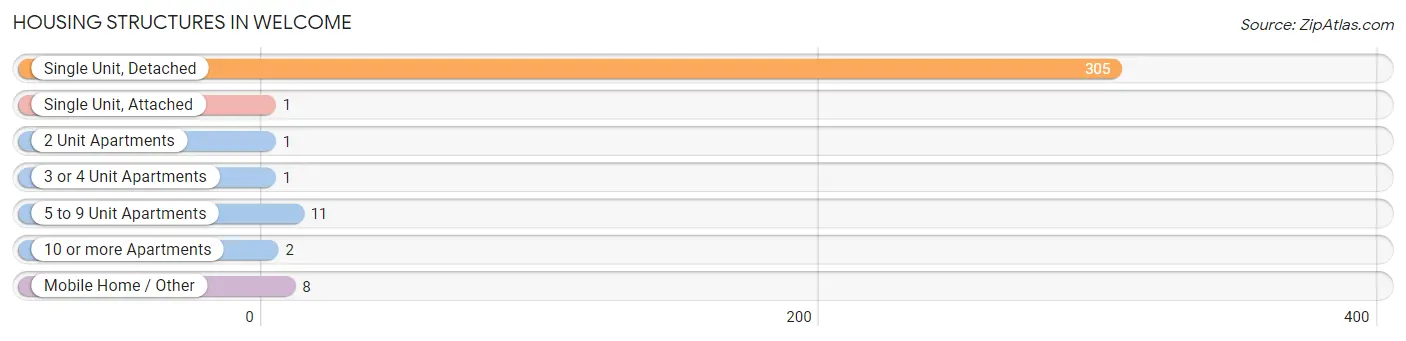
| Structure Type | # Housing Units | % Housing Units |
| Single Unit, Detached | 305 | 92.7% |
| Single Unit, Attached | 1 | 0.3% |
| 2 Unit Apartments | 1 | 0.3% |
| 3 or 4 Unit Apartments | 1 | 0.3% |
| 5 to 9 Unit Apartments | 11 | 3.3% |
| 10 or more Apartments | 2 | 0.6% |
| Mobile Home / Other | 8 | 2.4% |
| Total | 329 | 100.0% |
Housing Structures by Occupancy in Welcome
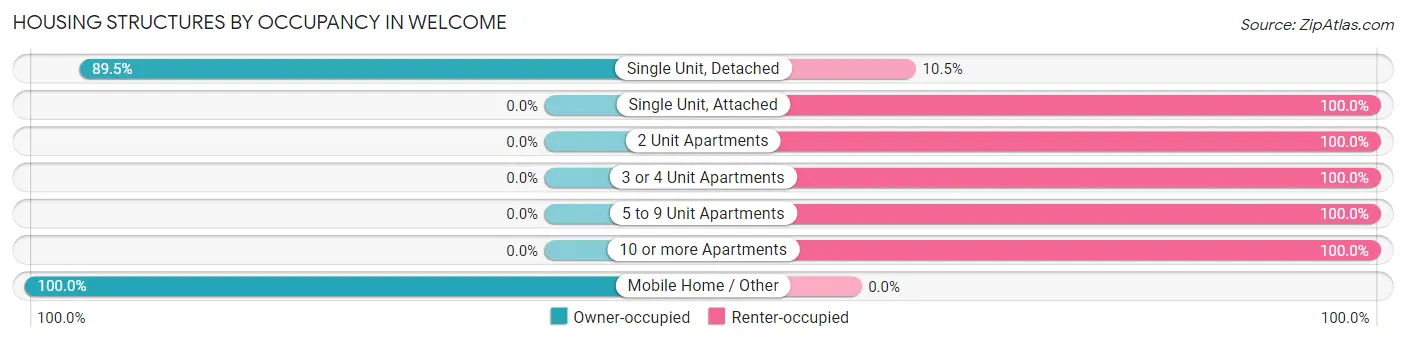
| Structure Type | Owner-occupied | Renter-occupied |
| Single Unit, Detached | 273 (89.5%) | 32 (10.5%) |
| Single Unit, Attached | 0 (0.0%) | 1 (100.0%) |
| 2 Unit Apartments | 0 (0.0%) | 1 (100.0%) |
| 3 or 4 Unit Apartments | 0 (0.0%) | 1 (100.0%) |
| 5 to 9 Unit Apartments | 0 (0.0%) | 11 (100.0%) |
| 10 or more Apartments | 0 (0.0%) | 2 (100.0%) |
| Mobile Home / Other | 8 (100.0%) | 0 (0.0%) |
| Total | 281 (85.4%) | 48 (14.6%) |
Housing Structures by Number of Rooms in Welcome
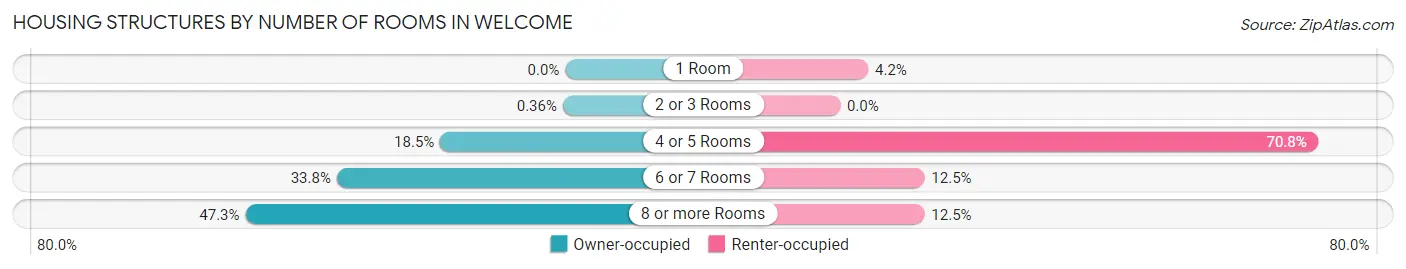
| Number of Rooms | Owner-occupied | Renter-occupied |
| 1 Room | 0 (0.0%) | 2 (4.2%) |
| 2 or 3 Rooms | 1 (0.4%) | 0 (0.0%) |
| 4 or 5 Rooms | 52 (18.5%) | 34 (70.8%) |
| 6 or 7 Rooms | 95 (33.8%) | 6 (12.5%) |
| 8 or more Rooms | 133 (47.3%) | 6 (12.5%) |
| Total | 281 (100.0%) | 48 (100.0%) |
Housing Structure by Heating Type in Welcome
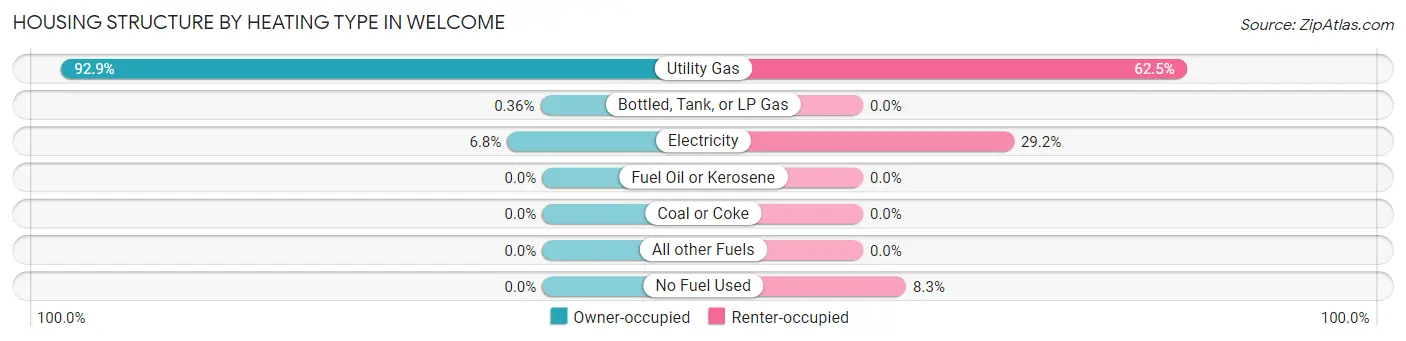
| Heating Type | Owner-occupied | Renter-occupied |
| Utility Gas | 261 (92.9%) | 30 (62.5%) |
| Bottled, Tank, or LP Gas | 1 (0.4%) | 0 (0.0%) |
| Electricity | 19 (6.8%) | 14 (29.2%) |
| Fuel Oil or Kerosene | 0 (0.0%) | 0 (0.0%) |
| Coal or Coke | 0 (0.0%) | 0 (0.0%) |
| All other Fuels | 0 (0.0%) | 0 (0.0%) |
| No Fuel Used | 0 (0.0%) | 4 (8.3%) |
| Total | 281 (100.0%) | 48 (100.0%) |
Household Vehicle Usage in Welcome
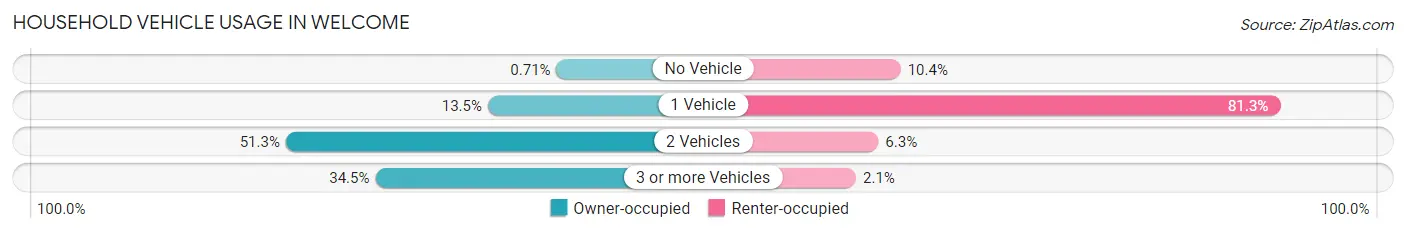
| Vehicles per Household | Owner-occupied | Renter-occupied |
| No Vehicle | 2 (0.7%) | 5 (10.4%) |
| 1 Vehicle | 38 (13.5%) | 39 (81.2%) |
| 2 Vehicles | 144 (51.2%) | 3 (6.2%) |
| 3 or more Vehicles | 97 (34.5%) | 1 (2.1%) |
| Total | 281 (100.0%) | 48 (100.0%) |
Real Estate & Mortgages in Welcome
Real Estate and Mortgage Overview in Welcome
| Characteristic | Without Mortgage | With Mortgage |
| Housing Units | 101 | 180 |
| Median Property Value | $58,600 | $96,000 |
| Median Household Income | $33,125 | $14 |
| Monthly Housing Costs | $435 | $0 |
| Real Estate Taxes | $1,106 | $0 |
Property Value by Mortgage Status in Welcome
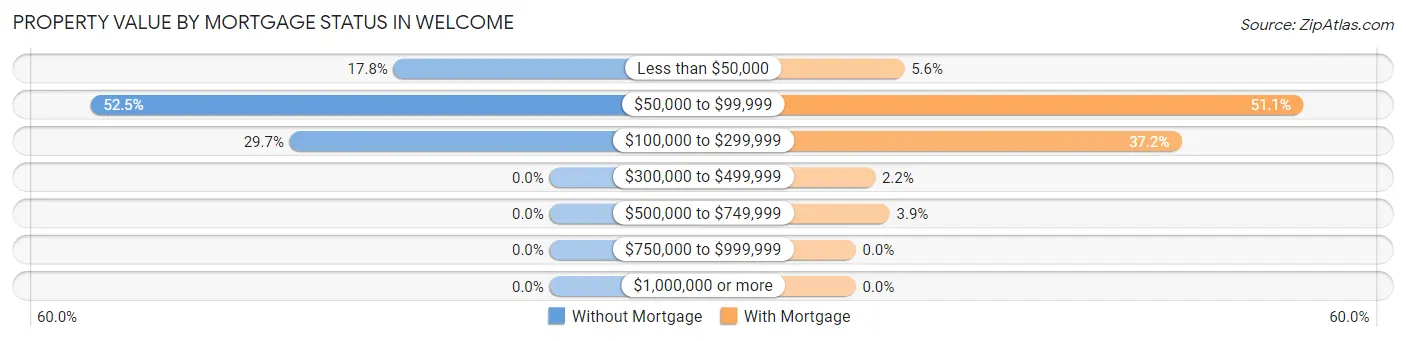
| Property Value | Without Mortgage | With Mortgage |
| Less than $50,000 | 18 (17.8%) | 10 (5.6%) |
| $50,000 to $99,999 | 53 (52.5%) | 92 (51.1%) |
| $100,000 to $299,999 | 30 (29.7%) | 67 (37.2%) |
| $300,000 to $499,999 | 0 (0.0%) | 4 (2.2%) |
| $500,000 to $749,999 | 0 (0.0%) | 7 (3.9%) |
| $750,000 to $999,999 | 0 (0.0%) | 0 (0.0%) |
| $1,000,000 or more | 0 (0.0%) | 0 (0.0%) |
| Total | 101 (100.0%) | 180 (100.0%) |
Household Income by Mortgage Status in Welcome
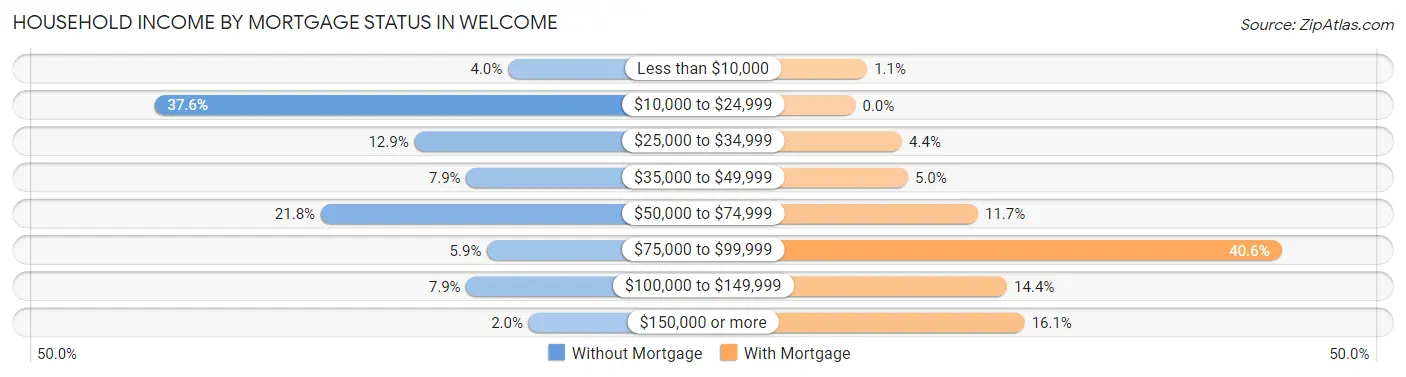
| Household Income | Without Mortgage | With Mortgage |
| Less than $10,000 | 4 (4.0%) | 2 (1.1%) |
| $10,000 to $24,999 | 38 (37.6%) | 0 (0.0%) |
| $25,000 to $34,999 | 13 (12.9%) | 8 (4.4%) |
| $35,000 to $49,999 | 8 (7.9%) | 9 (5.0%) |
| $50,000 to $74,999 | 22 (21.8%) | 21 (11.7%) |
| $75,000 to $99,999 | 6 (5.9%) | 73 (40.6%) |
| $100,000 to $149,999 | 8 (7.9%) | 26 (14.4%) |
| $150,000 or more | 2 (2.0%) | 29 (16.1%) |
| Total | 101 (100.0%) | 180 (100.0%) |
Property Value to Household Income Ratio in Welcome
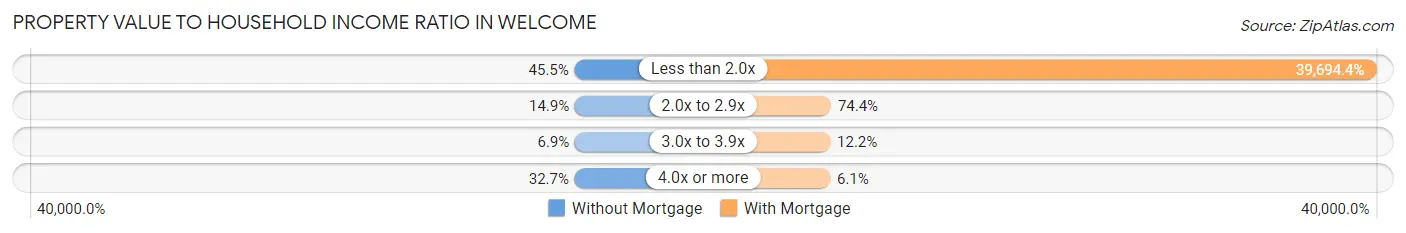
| Value-to-Income Ratio | Without Mortgage | With Mortgage |
| Less than 2.0x | 46 (45.5%) | 71,450 (39,694.4%) |
| 2.0x to 2.9x | 15 (14.8%) | 134 (74.4%) |
| 3.0x to 3.9x | 7 (6.9%) | 22 (12.2%) |
| 4.0x or more | 33 (32.7%) | 11 (6.1%) |
| Total | 101 (100.0%) | 180 (100.0%) |
Real Estate Taxes by Mortgage Status in Welcome
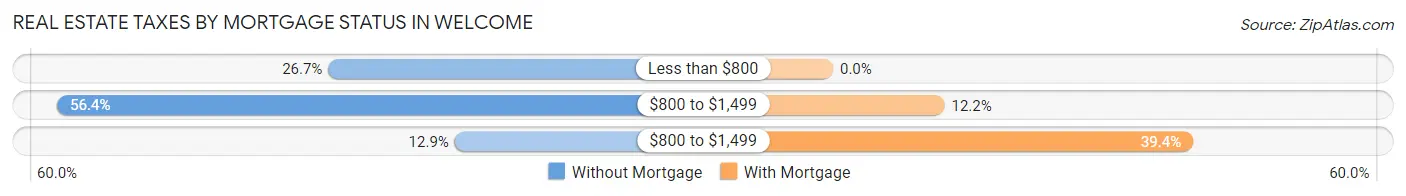
| Property Taxes | Without Mortgage | With Mortgage |
| Less than $800 | 27 (26.7%) | 0 (0.0%) |
| $800 to $1,499 | 57 (56.4%) | 22 (12.2%) |
| $800 to $1,499 | 13 (12.9%) | 71 (39.4%) |
| Total | 101 (100.0%) | 180 (100.0%) |
Health & Disability in Welcome
Health Insurance Coverage by Age in Welcome
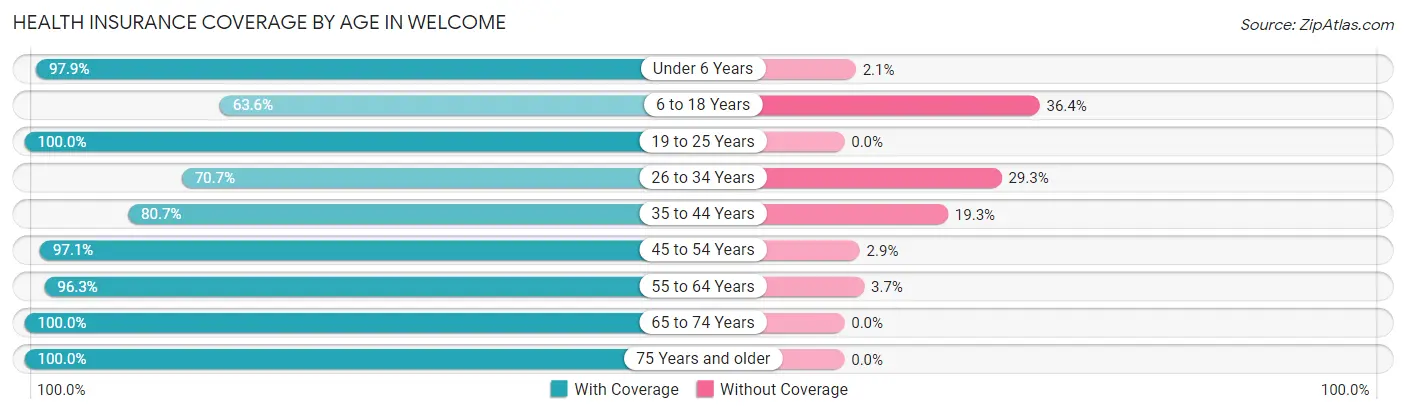
| Age Bracket | With Coverage | Without Coverage |
| Under 6 Years | 46 (97.9%) | 1 (2.1%) |
| 6 to 18 Years | 124 (63.6%) | 71 (36.4%) |
| 19 to 25 Years | 49 (100.0%) | 0 (0.0%) |
| 26 to 34 Years | 82 (70.7%) | 34 (29.3%) |
| 35 to 44 Years | 71 (80.7%) | 17 (19.3%) |
| 45 to 54 Years | 68 (97.1%) | 2 (2.9%) |
| 55 to 64 Years | 130 (96.3%) | 5 (3.7%) |
| 65 to 74 Years | 50 (100.0%) | 0 (0.0%) |
| 75 Years and older | 73 (100.0%) | 0 (0.0%) |
| Total | 693 (84.2%) | 130 (15.8%) |
Health Insurance Coverage by Citizenship Status in Welcome
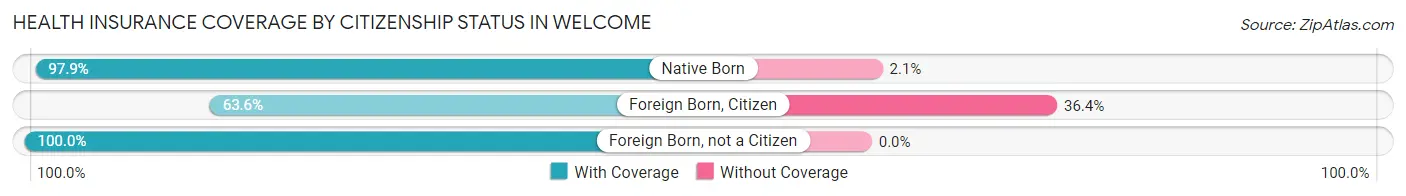
| Citizenship Status | With Coverage | Without Coverage |
| Native Born | 46 (97.9%) | 1 (2.1%) |
| Foreign Born, Citizen | 124 (63.6%) | 71 (36.4%) |
| Foreign Born, not a Citizen | 49 (100.0%) | 0 (0.0%) |
Health Insurance Coverage by Household Income in Welcome
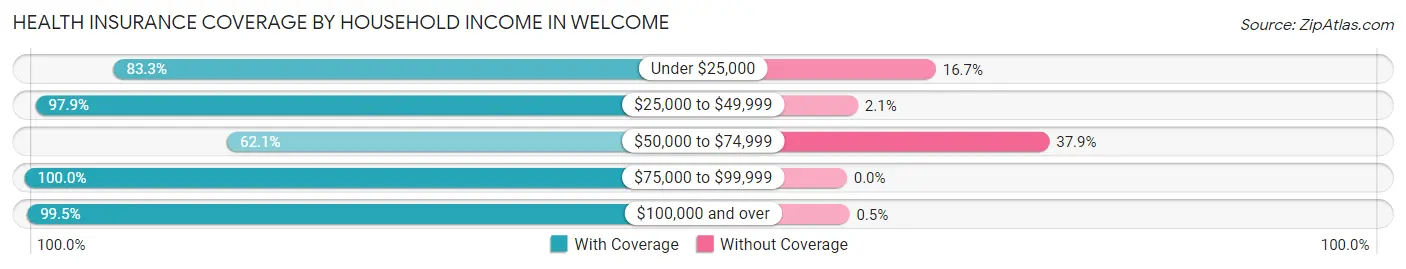
| Household Income | With Coverage | Without Coverage |
| Under $25,000 | 95 (83.3%) | 19 (16.7%) |
| $25,000 to $49,999 | 141 (97.9%) | 3 (2.1%) |
| $50,000 to $74,999 | 175 (62.1%) | 107 (37.9%) |
| $75,000 to $99,999 | 83 (100.0%) | 0 (0.0%) |
| $100,000 and over | 199 (99.5%) | 1 (0.5%) |
Public vs Private Health Insurance Coverage by Age in Welcome
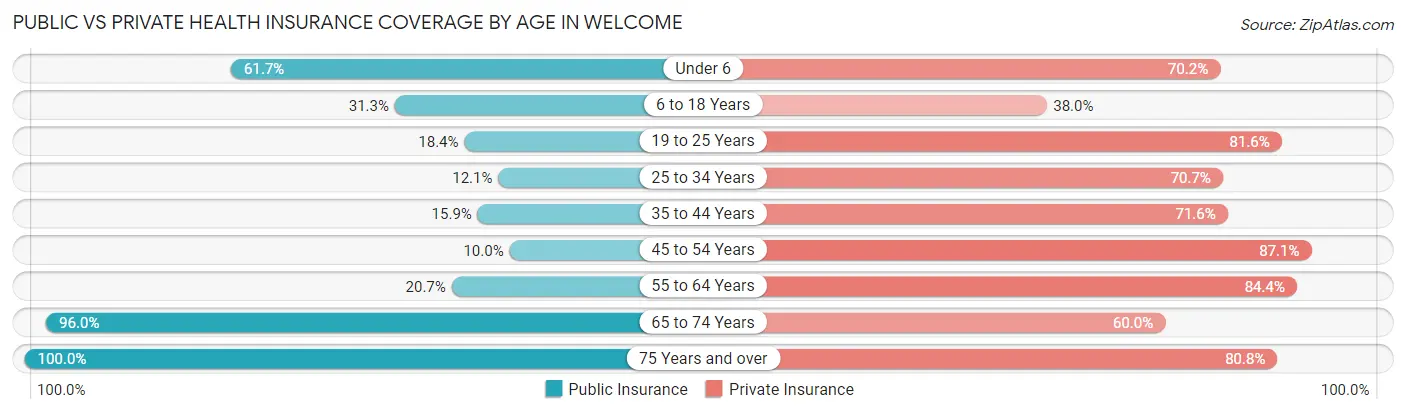
| Age Bracket | Public Insurance | Private Insurance |
| Under 6 | 29 (61.7%) | 33 (70.2%) |
| 6 to 18 Years | 61 (31.3%) | 74 (38.0%) |
| 19 to 25 Years | 9 (18.4%) | 40 (81.6%) |
| 25 to 34 Years | 14 (12.1%) | 82 (70.7%) |
| 35 to 44 Years | 14 (15.9%) | 63 (71.6%) |
| 45 to 54 Years | 7 (10.0%) | 61 (87.1%) |
| 55 to 64 Years | 28 (20.7%) | 114 (84.4%) |
| 65 to 74 Years | 48 (96.0%) | 30 (60.0%) |
| 75 Years and over | 73 (100.0%) | 59 (80.8%) |
| Total | 283 (34.4%) | 556 (67.6%) |
Disability Status by Sex by Age in Welcome
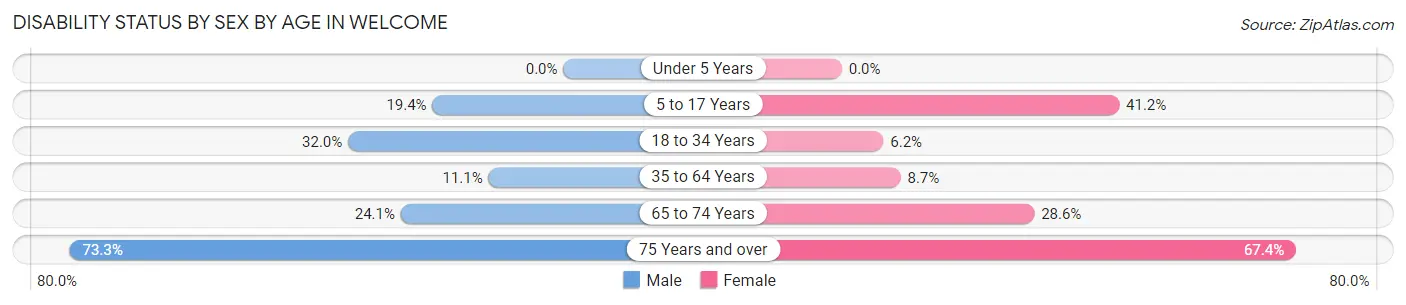
| Age Bracket | Male | Female |
| Under 5 Years | 0 (0.0%) | 0 (0.0%) |
| 5 to 17 Years | 21 (19.4%) | 35 (41.2%) |
| 18 to 34 Years | 31 (32.0%) | 5 (6.2%) |
| 35 to 64 Years | 16 (11.1%) | 13 (8.7%) |
| 65 to 74 Years | 7 (24.1%) | 6 (28.6%) |
| 75 Years and over | 22 (73.3%) | 29 (67.4%) |
Disability Class by Sex by Age in Welcome
Disability Class: Hearing Difficulty
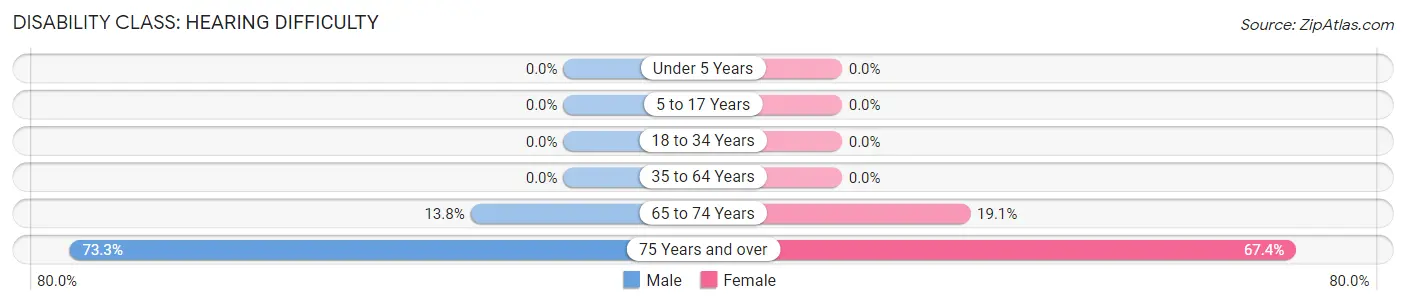
| Age Bracket | Male | Female |
| Under 5 Years | 0 (0.0%) | 0 (0.0%) |
| 5 to 17 Years | 0 (0.0%) | 0 (0.0%) |
| 18 to 34 Years | 0 (0.0%) | 0 (0.0%) |
| 35 to 64 Years | 0 (0.0%) | 0 (0.0%) |
| 65 to 74 Years | 4 (13.8%) | 4 (19.1%) |
| 75 Years and over | 22 (73.3%) | 29 (67.4%) |
Disability Class: Vision Difficulty
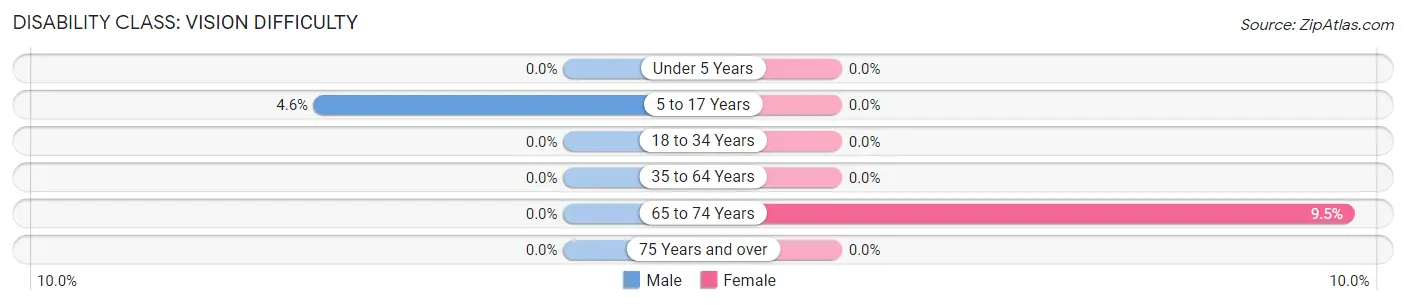
| Age Bracket | Male | Female |
| Under 5 Years | 0 (0.0%) | 0 (0.0%) |
| 5 to 17 Years | 5 (4.6%) | 0 (0.0%) |
| 18 to 34 Years | 0 (0.0%) | 0 (0.0%) |
| 35 to 64 Years | 0 (0.0%) | 0 (0.0%) |
| 65 to 74 Years | 0 (0.0%) | 2 (9.5%) |
| 75 Years and over | 0 (0.0%) | 0 (0.0%) |
Disability Class: Cognitive Difficulty
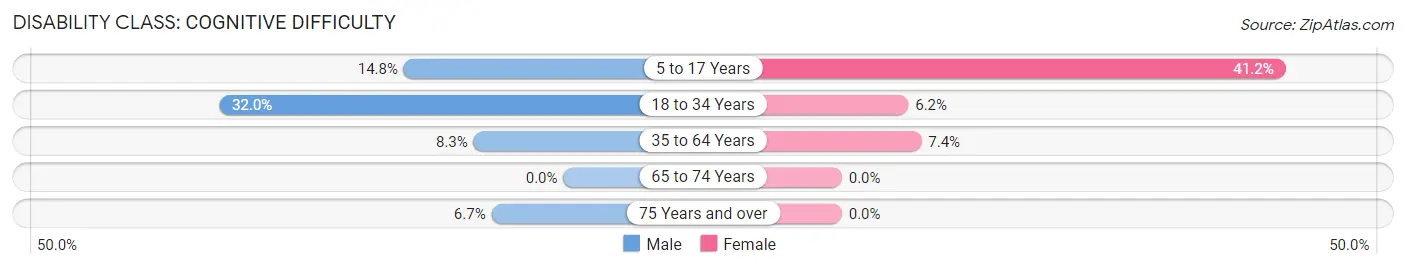
| Age Bracket | Male | Female |
| 5 to 17 Years | 16 (14.8%) | 35 (41.2%) |
| 18 to 34 Years | 31 (32.0%) | 5 (6.2%) |
| 35 to 64 Years | 12 (8.3%) | 11 (7.4%) |
| 65 to 74 Years | 0 (0.0%) | 0 (0.0%) |
| 75 Years and over | 2 (6.7%) | 0 (0.0%) |
Disability Class: Ambulatory Difficulty
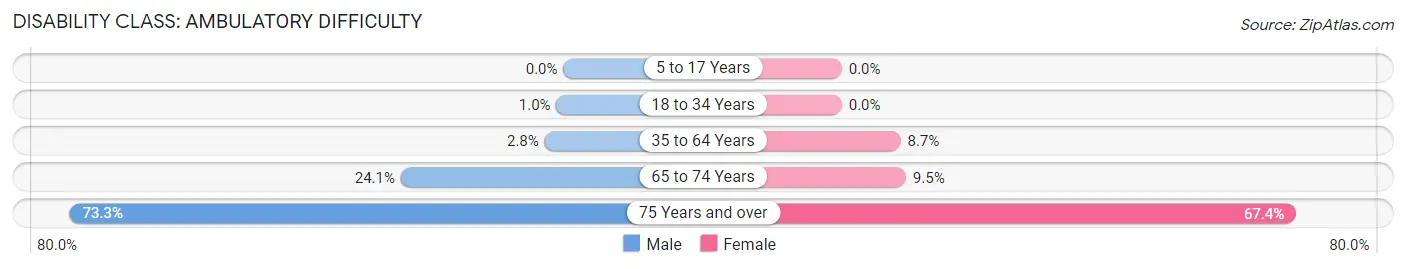
| Age Bracket | Male | Female |
| 5 to 17 Years | 0 (0.0%) | 0 (0.0%) |
| 18 to 34 Years | 1 (1.0%) | 0 (0.0%) |
| 35 to 64 Years | 4 (2.8%) | 13 (8.7%) |
| 65 to 74 Years | 7 (24.1%) | 2 (9.5%) |
| 75 Years and over | 22 (73.3%) | 29 (67.4%) |
Disability Class: Self-Care Difficulty
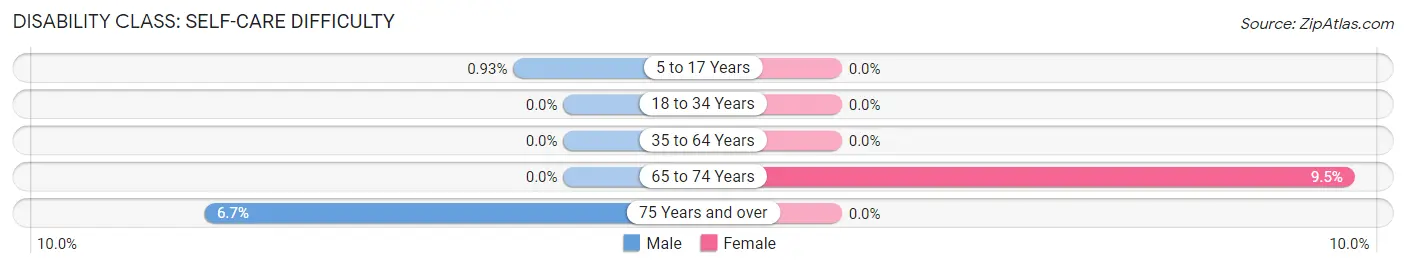
| Age Bracket | Male | Female |
| 5 to 17 Years | 1 (0.9%) | 0 (0.0%) |
| 18 to 34 Years | 0 (0.0%) | 0 (0.0%) |
| 35 to 64 Years | 0 (0.0%) | 0 (0.0%) |
| 65 to 74 Years | 0 (0.0%) | 2 (9.5%) |
| 75 Years and over | 2 (6.7%) | 0 (0.0%) |
Technology Access in Welcome
Computing Device Access in Welcome
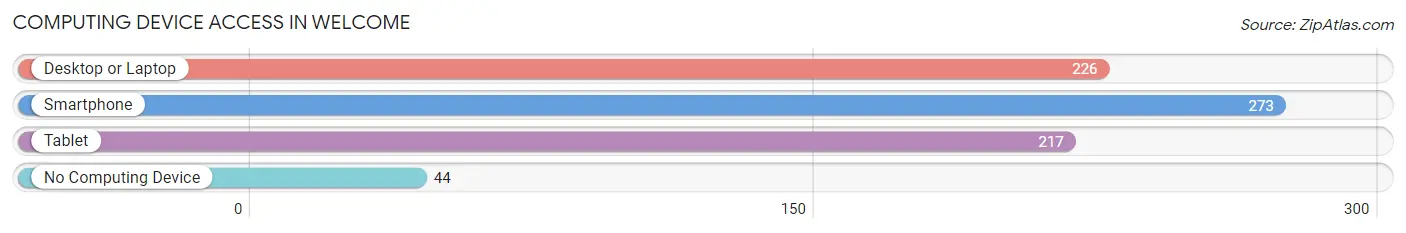
| Device Type | # Households | % Households |
| Desktop or Laptop | 226 | 68.7% |
| Smartphone | 273 | 83.0% |
| Tablet | 217 | 66.0% |
| No Computing Device | 44 | 13.4% |
| Total | 329 | 100.0% |
Internet Access in Welcome
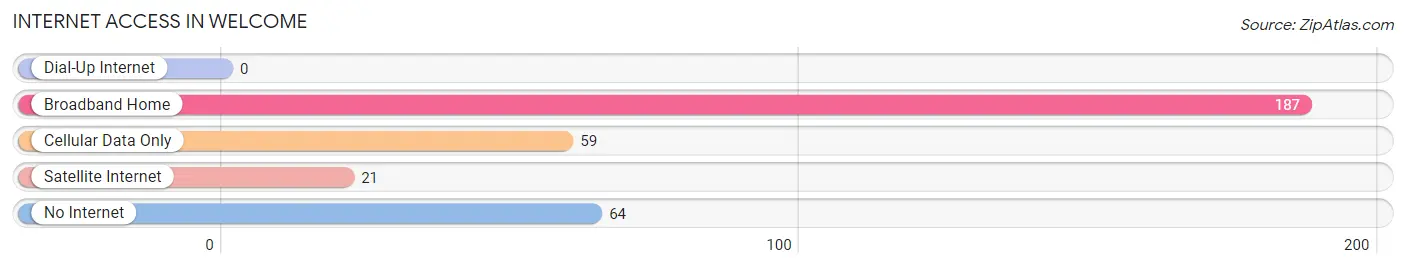
| Internet Type | # Households | % Households |
| Dial-Up Internet | 0 | 0.0% |
| Broadband Home | 187 | 56.8% |
| Cellular Data Only | 59 | 17.9% |
| Satellite Internet | 21 | 6.4% |
| No Internet | 64 | 19.5% |
| Total | 329 | 100.0% |
Welcome Summary
Welcome to Minnesota, a state located in the Midwestern United States. Minnesota is known for its diverse geography, rich history, vibrant economy, and diverse demographics.
Geography
Minnesota is bordered by Wisconsin to the east, Iowa to the south, North Dakota and South Dakota to the west, and the Canadian provinces of Manitoba and Ontario to the north. Minnesota is the 12th largest state in the United States, with an area of 86,943 square miles. The state is divided into 87 counties and contains 87,014 lakes, making it the state with the most lakes in the United States. Minnesota is home to the Boundary Waters Canoe Area Wilderness, the largest wilderness area east of the Mississippi River. The state is also home to the Mississippi National River and Recreation Area, a 72-mile stretch of the Mississippi River that is managed by the National Park Service.
History
Minnesota has a long and rich history. The first inhabitants of the area were Native American tribes, including the Dakota, Ojibwe, and Sioux. The first Europeans to explore the area were French fur traders, who arrived in the late 1600s. In 1805, the United States acquired the area through the Louisiana Purchase. In 1819, the area became part of the Michigan Territory, and in 1834, it became part of the Wisconsin Territory. In 1849, Minnesota became its own territory, and in 1858, it became the 32nd state in the Union.
Economy
Minnesota has a strong and diverse economy. The state’s largest industries are manufacturing, health care, and finance. Minnesota is home to 19 Fortune 500 companies, including 3M, Target, and UnitedHealth Group. The state is also home to a number of major universities, including the University of Minnesota, which is the largest public university in the state.
Demographics
As of 2019, Minnesota had an estimated population of 5.6 million people. The state is home to a diverse population, with the largest racial groups being White (81.2%), Black or African American (5.7%), and Hispanic or Latino (5.2%). The state is also home to a large immigrant population, with the largest groups being from Mexico (17.2%), India (4.2%), and Somalia (3.2%). The median household income in Minnesota is $68,388, and the median age is 37.7 years.
Minnesota is a vibrant and diverse state with a rich history, diverse geography, strong economy, and diverse demographics. From its 87,014 lakes to its 19 Fortune 500 companies, Minnesota has something for everyone.
Common Questions
What is Per Capita Income in Welcome?
Per Capita income in Welcome is $24,664.
What is the Median Family Income in Welcome?
Median Family Income in Welcome is $54,875.
What is the Median Household income in Welcome?
Median Household Income in Welcome is $57,321.
What is Income or Wage Gap in Welcome?
Income or Wage Gap in Welcome is 4.4%.
Women in Welcome earn 95.6 cents for every dollar earned by a man.
What is Inequality or Gini Index in Welcome?
Inequality or Gini Index in Welcome is 0.38.
What is the Total Population of Welcome?
Total Population of Welcome is 824.
What is the Total Male Population of Welcome?
Total Male Population of Welcome is 427.
What is the Total Female Population of Welcome?
Total Female Population of Welcome is 397.
What is the Ratio of Males per 100 Females in Welcome?
There are 107.56 Males per 100 Females in Welcome.
What is the Ratio of Females per 100 Males in Welcome?
There are 92.97 Females per 100 Males in Welcome.
What is the Median Population Age in Welcome?
Median Population Age in Welcome is 35.5 Years.
What is the Average Family Size in Welcome
Average Family Size in Welcome is 3.0 People.
What is the Average Household Size in Welcome
Average Household Size in Welcome is 2.5 People.
How Large is the Labor Force in Welcome?
There are 400 People in the Labor Forcein in Welcome.
What is the Percentage of People in the Labor Force in Welcome?
66.2% of People are in the Labor Force in Welcome.
What is the Unemployment Rate in Welcome?
Unemployment Rate in Welcome is 8.0%.