Warroad, MN Map & Demographics
Warroad Map
Warroad Overview
$31,944
PER CAPITA INCOME
$55,625
AVG FAMILY INCOME
$49,000
AVG HOUSEHOLD INCOME
30.2%
WAGE / INCOME GAP [ % ]
69.8¢/ $1
WAGE / INCOME GAP [ $ ]
0.51
INEQUALITY / GINI INDEX
2,076
TOTAL POPULATION
1,007
MALE POPULATION
1,069
FEMALE POPULATION
94.20
MALES / 100 FEMALES
106.16
FEMALES / 100 MALES
37.7
MEDIAN AGE
3.1
AVG FAMILY SIZE
2.6
AVG HOUSEHOLD SIZE
947
LABOR FORCE [ PEOPLE ]
59.2%
PERCENT IN LABOR FORCE
7.3%
UNEMPLOYMENT RATE
Warroad Zip Codes
Warroad Area Codes
Income in Warroad
Income Overview in Warroad
Per Capita Income in Warroad is $31,944, while median incomes of families and households are $55,625 and $49,000 respectively.
| Characteristic | Number | Measure |
| Per Capita Income | 2,076 | $31,944 |
| Median Family Income | 442 | $55,625 |
| Mean Family Income | 442 | $91,409 |
| Median Household Income | 772 | $49,000 |
| Mean Household Income | 772 | $74,835 |
| Income Deficit | 442 | $0 |
| Wage / Income Gap (%) | 2,076 | 30.15% |
| Wage / Income Gap ($) | 2,076 | 69.85¢ per $1 |
| Gini / Inequality Index | 2,076 | 0.51 |
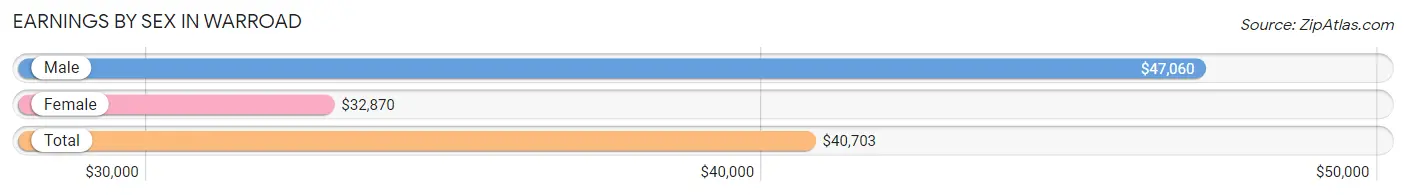
Earnings by Sex in Warroad
Average Earnings in Warroad are $40,703, $47,060 for men and $32,870 for women, a difference of 30.1%.
| Sex | Number | Average Earnings |
| Male | 525 (52.7%) | $47,060 |
| Female | 472 (47.3%) | $32,870 |
| Total | 997 (100.0%) | $40,703 |
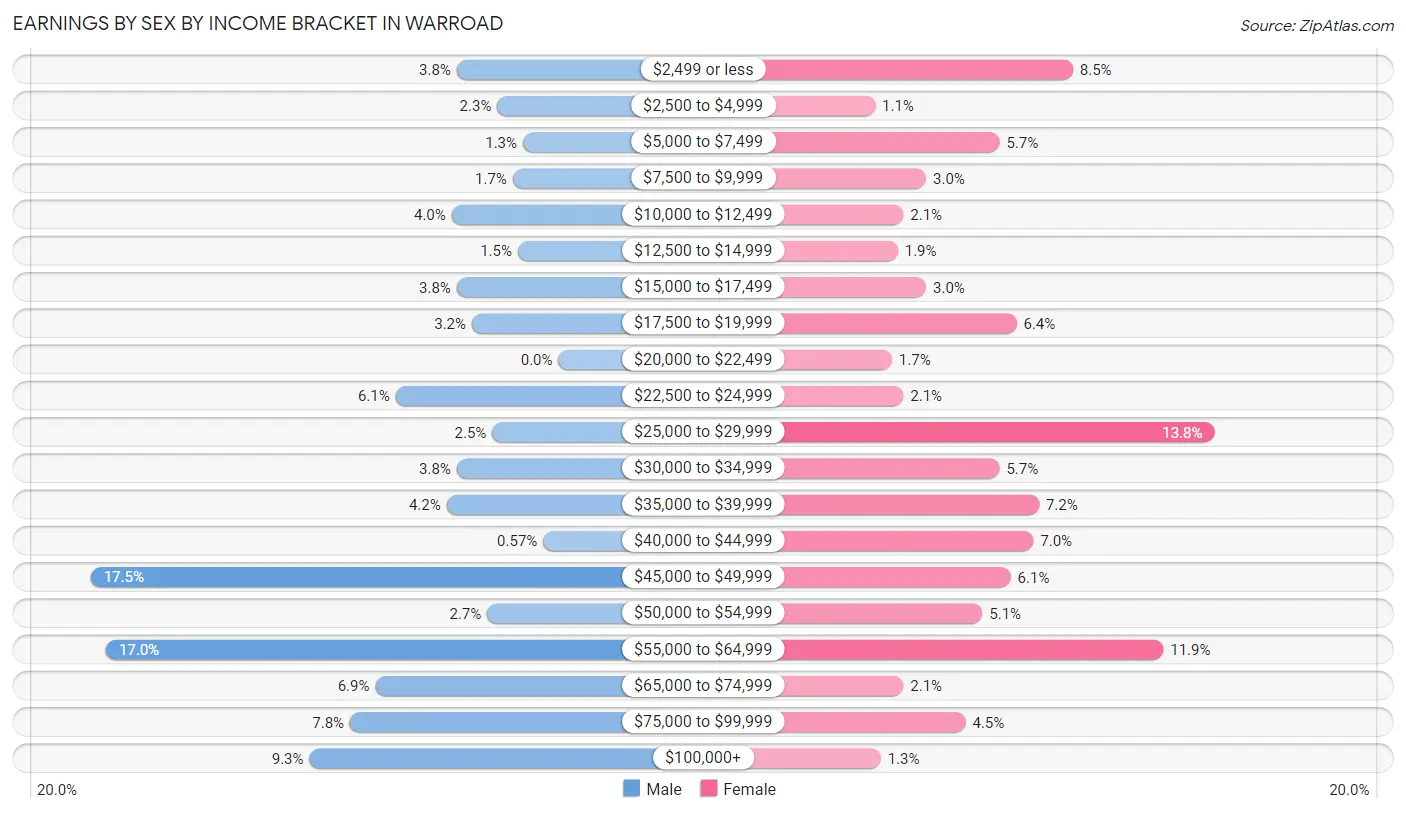
Earnings by Sex by Income Bracket in Warroad
The most common earnings brackets in Warroad are $45,000 to $49,999 for men (92 | 17.5%) and $25,000 to $29,999 for women (65 | 13.8%).
| Income | Male | Female |
| $2,499 or less | 20 (3.8%) | 40 (8.5%) |
| $2,500 to $4,999 | 12 (2.3%) | 5 (1.1%) |
| $5,000 to $7,499 | 7 (1.3%) | 27 (5.7%) |
| $7,500 to $9,999 | 9 (1.7%) | 14 (3.0%) |
| $10,000 to $12,499 | 21 (4.0%) | 10 (2.1%) |
| $12,500 to $14,999 | 8 (1.5%) | 9 (1.9%) |
| $15,000 to $17,499 | 20 (3.8%) | 14 (3.0%) |
| $17,500 to $19,999 | 17 (3.2%) | 30 (6.4%) |
| $20,000 to $22,499 | 0 (0.0%) | 8 (1.7%) |
| $22,500 to $24,999 | 32 (6.1%) | 10 (2.1%) |
| $25,000 to $29,999 | 13 (2.5%) | 65 (13.8%) |
| $30,000 to $34,999 | 20 (3.8%) | 27 (5.7%) |
| $35,000 to $39,999 | 22 (4.2%) | 34 (7.2%) |
| $40,000 to $44,999 | 3 (0.6%) | 33 (7.0%) |
| $45,000 to $49,999 | 92 (17.5%) | 29 (6.1%) |
| $50,000 to $54,999 | 14 (2.7%) | 24 (5.1%) |
| $55,000 to $64,999 | 89 (17.0%) | 56 (11.9%) |
| $65,000 to $74,999 | 36 (6.9%) | 10 (2.1%) |
| $75,000 to $99,999 | 41 (7.8%) | 21 (4.4%) |
| $100,000+ | 49 (9.3%) | 6 (1.3%) |
| Total | 525 (100.0%) | 472 (100.0%) |
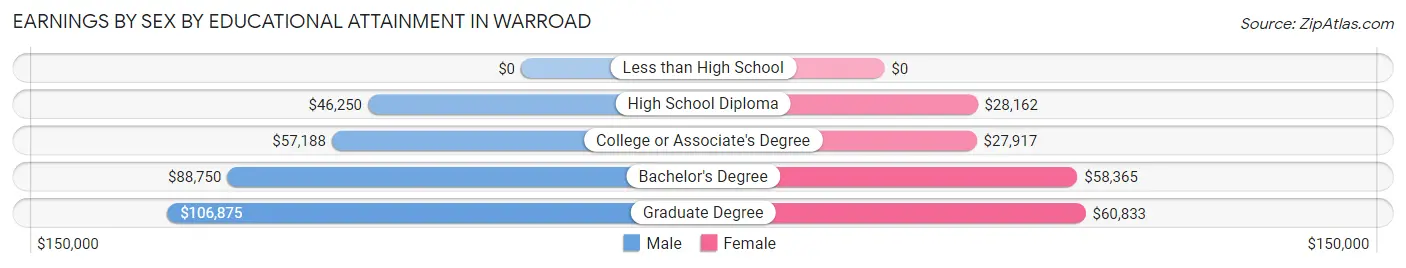
Earnings by Sex by Educational Attainment in Warroad
Average earnings in Warroad are $51,250 for men and $29,922 for women, a difference of 41.6%. Men with an educational attainment of graduate degree enjoy the highest average annual earnings of $106,875, while those with high school diploma education earn the least with $46,250. Women with an educational attainment of graduate degree earn the most with the average annual earnings of $60,833, while those with college or associate's degree education have the smallest earnings of $27,917.
| Educational Attainment | Male Income | Female Income |
| Less than High School | - | - |
| High School Diploma | $46,250 | $28,162 |
| College or Associate's Degree | $57,188 | $27,917 |
| Bachelor's Degree | $88,750 | $58,365 |
| Graduate Degree | $106,875 | $60,833 |
| Total | $51,250 | $29,922 |
Family Income in Warroad
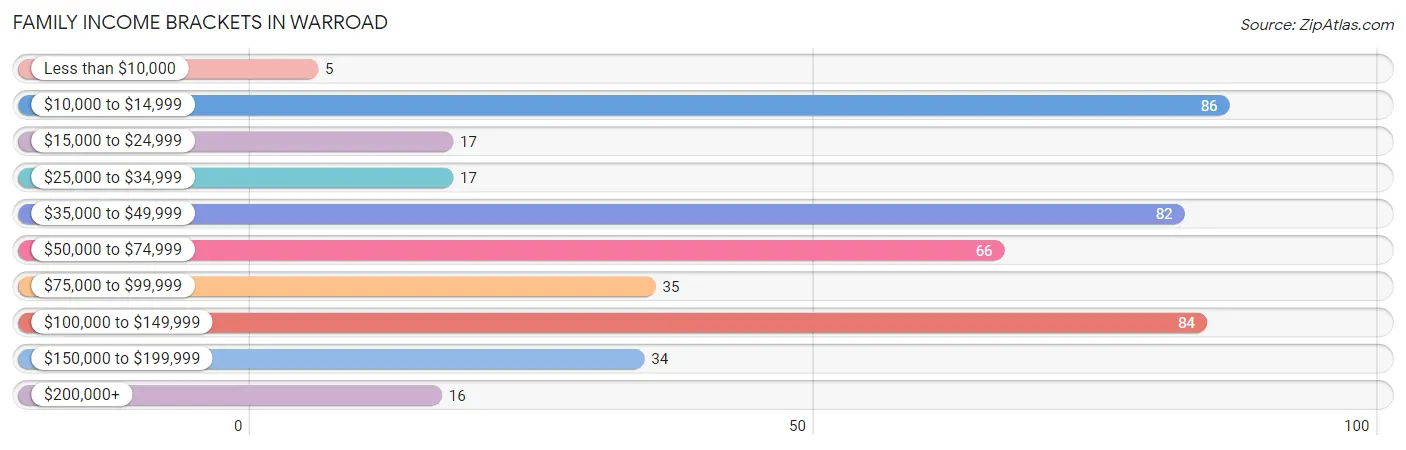
Family Income Brackets in Warroad
According to the Warroad family income data, there are 86 families falling into the $10,000 to $14,999 income range, which is the most common income bracket and makes up 19.5% of all families. Conversely, the less than $10,000 income bracket is the least frequent group with only 5 families (1.1%) belonging to this category.
| Income Bracket | # Families | % Families |
| Less than $10,000 | 5 | 1.1% |
| $10,000 to $14,999 | 86 | 19.5% |
| $15,000 to $24,999 | 17 | 3.8% |
| $25,000 to $34,999 | 17 | 3.8% |
| $35,000 to $49,999 | 82 | 18.6% |
| $50,000 to $74,999 | 66 | 14.9% |
| $75,000 to $99,999 | 35 | 7.9% |
| $100,000 to $149,999 | 84 | 19.0% |
| $150,000 to $199,999 | 34 | 7.7% |
| $200,000+ | 16 | 3.6% |
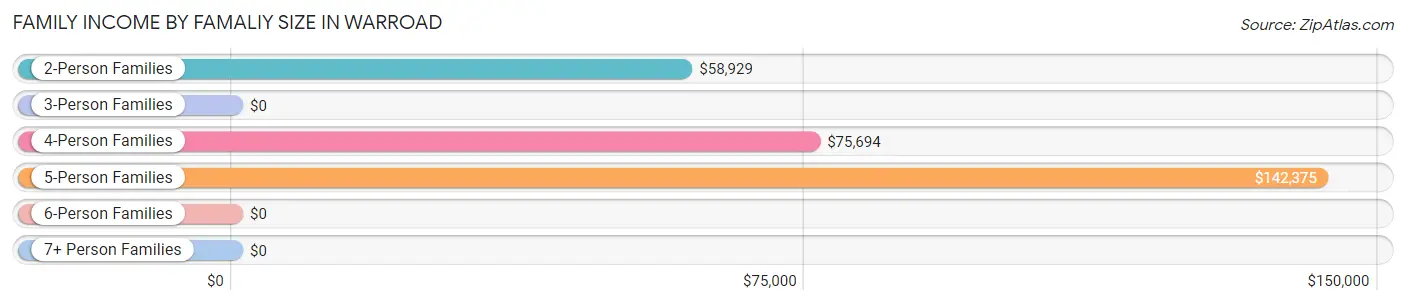
Family Income by Famaliy Size in Warroad
5-person families (47 | 10.6%) account for the highest median family income in Warroad with $142,375 per family, while 2-person families (174 | 39.4%) have the highest median income of $29,464 per family member.
| Income Bracket | # Families | Median Income |
| 2-Person Families | 174 (39.4%) | $58,929 |
| 3-Person Families | 167 (37.8%) | $0 |
| 4-Person Families | 49 (11.1%) | $75,694 |
| 5-Person Families | 47 (10.6%) | $142,375 |
| 6-Person Families | 0 (0.0%) | $0 |
| 7+ Person Families | 5 (1.1%) | $0 |
| Total | 442 (100.0%) | $55,625 |
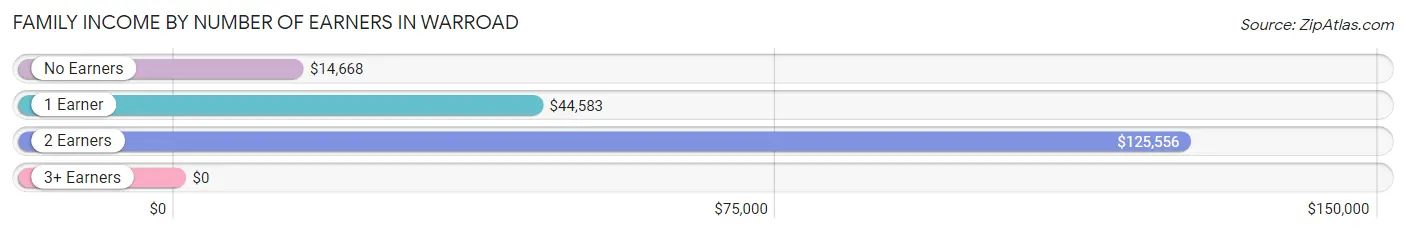
Family Income by Number of Earners in Warroad
| Number of Earners | # Families | Median Income |
| No Earners | 119 (26.9%) | $14,668 |
| 1 Earner | 138 (31.2%) | $44,583 |
| 2 Earners | 142 (32.1%) | $125,556 |
| 3+ Earners | 43 (9.7%) | $0 |
| Total | 442 (100.0%) | $55,625 |
Household Income in Warroad
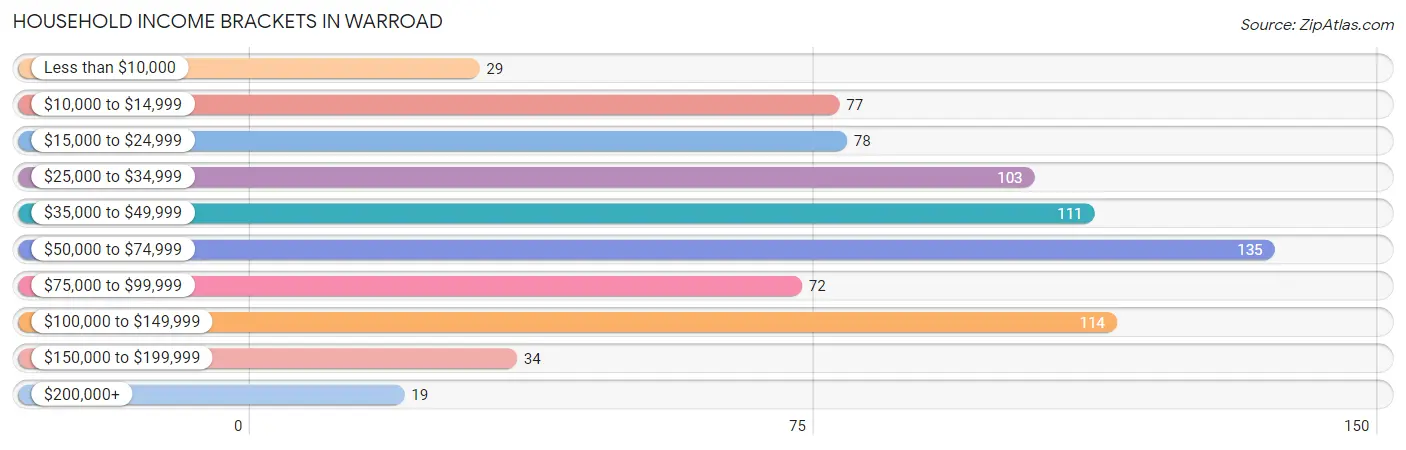
Household Income Brackets in Warroad
With 135 households falling in the category, the $50,000 to $74,999 income range is the most frequent in Warroad, accounting for 17.5% of all households. In contrast, only 19 households (2.5%) fall into the $200,000+ income bracket, making it the least populous group.
| Income Bracket | # Households | % Households |
| Less than $10,000 | 29 | 3.8% |
| $10,000 to $14,999 | 77 | 10.0% |
| $15,000 to $24,999 | 78 | 10.1% |
| $25,000 to $34,999 | 103 | 13.3% |
| $35,000 to $49,999 | 111 | 14.4% |
| $50,000 to $74,999 | 135 | 17.5% |
| $75,000 to $99,999 | 72 | 9.3% |
| $100,000 to $149,999 | 114 | 14.8% |
| $150,000 to $199,999 | 34 | 4.4% |
| $200,000+ | 19 | 2.5% |
Household Income by Householder Age in Warroad
The median household income in Warroad is $49,000, with the highest median household income of $79,792 found in the 25 to 44 years age bracket for the primary householder. A total of 183 households (23.7%) fall into this category. Meanwhile, the 15 to 24 years age bracket for the primary householder has the lowest median household income of $0, with 103 households (13.3%) in this group.
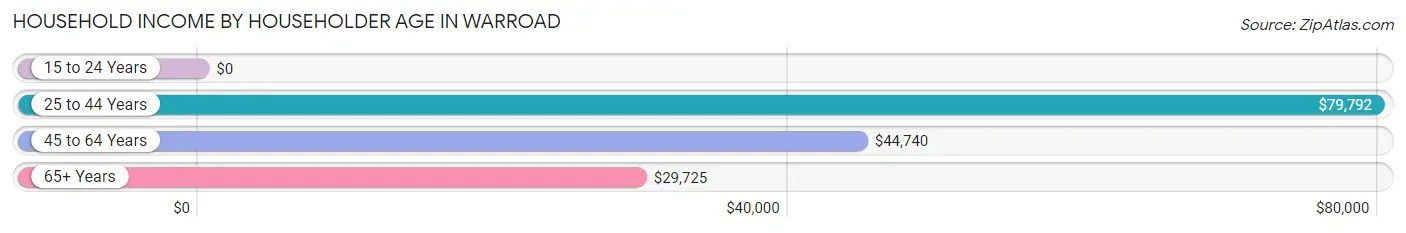
| Income Bracket | # Households | Median Income |
| 15 to 24 Years | 103 (13.3%) | $0 |
| 25 to 44 Years | 183 (23.7%) | $79,792 |
| 45 to 64 Years | 265 (34.3%) | $44,740 |
| 65+ Years | 221 (28.6%) | $29,725 |
| Total | 772 (100.0%) | $49,000 |
Poverty in Warroad
Income Below Poverty by Sex and Age in Warroad
With 14.2% poverty level for males and 26.6% for females among the residents of Warroad, under 5 year old males and 15 year old females are the most vulnerable to poverty, with 22 males (66.7%) and 40 females (93.0%) in their respective age groups living below the poverty level.
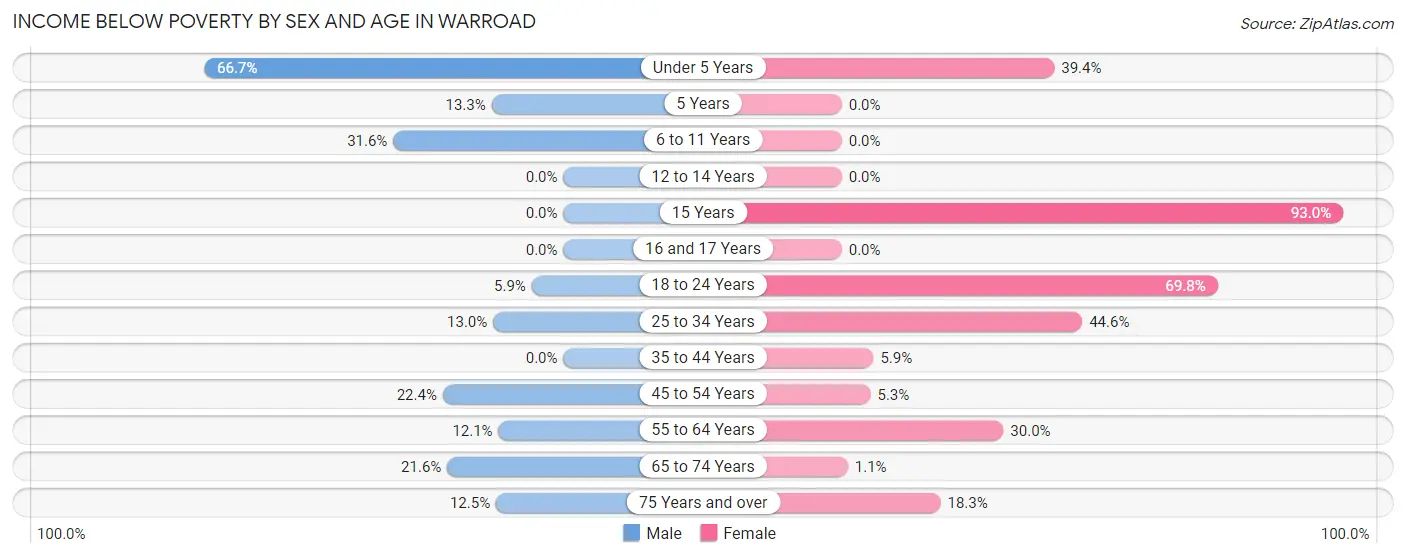
| Age Bracket | Male | Female |
| Under 5 Years | 22 (66.7%) | 28 (39.4%) |
| 5 Years | 4 (13.3%) | 0 (0.0%) |
| 6 to 11 Years | 36 (31.6%) | 0 (0.0%) |
| 12 to 14 Years | 0 (0.0%) | 0 (0.0%) |
| 15 Years | 0 (0.0%) | 40 (93.0%) |
| 16 and 17 Years | 0 (0.0%) | 0 (0.0%) |
| 18 to 24 Years | 7 (5.9%) | 83 (69.8%) |
| 25 to 34 Years | 9 (13.0%) | 54 (44.6%) |
| 35 to 44 Years | 0 (0.0%) | 6 (5.9%) |
| 45 to 54 Years | 30 (22.4%) | 7 (5.3%) |
| 55 to 64 Years | 10 (12.0%) | 36 (30.0%) |
| 65 to 74 Years | 11 (21.6%) | 1 (1.1%) |
| 75 Years and over | 8 (12.5%) | 22 (18.3%) |
| Total | 137 (14.2%) | 277 (26.6%) |
Income Above Poverty by Sex and Age in Warroad
According to the poverty statistics in Warroad, males aged 12 to 14 years and females aged 6 to 11 years are the age groups that are most secure financially, with 100.0% of males and 100.0% of females in these age groups living above the poverty line.
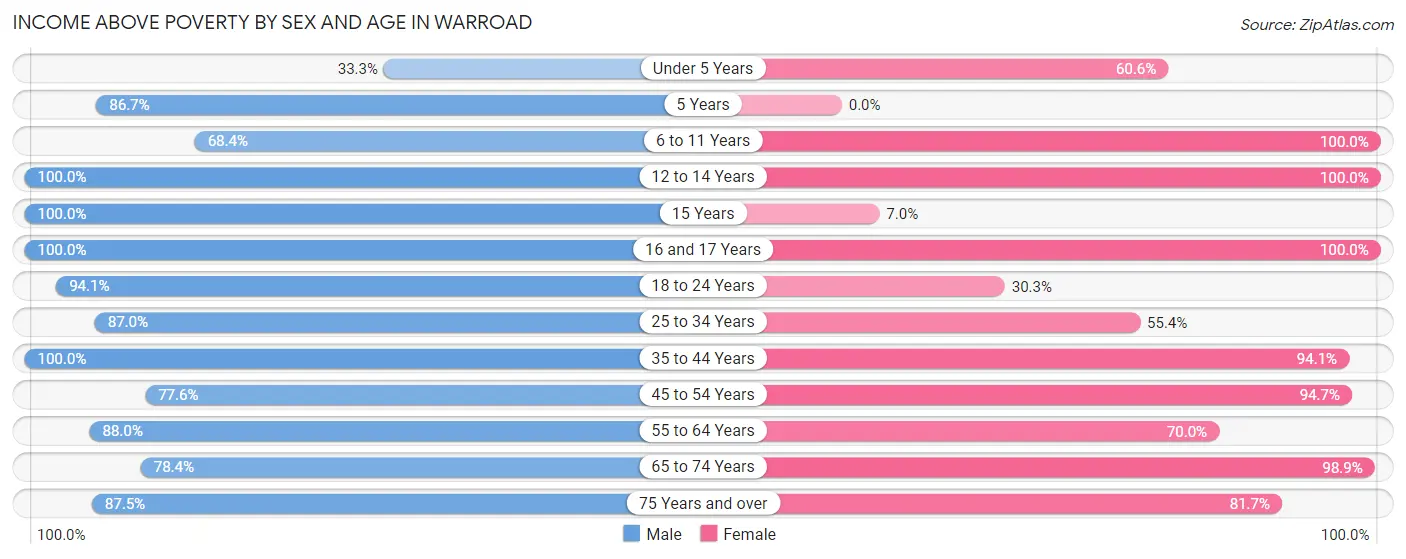
| Age Bracket | Male | Female |
| Under 5 Years | 11 (33.3%) | 43 (60.6%) |
| 5 Years | 26 (86.7%) | 0 (0.0%) |
| 6 to 11 Years | 78 (68.4%) | 99 (100.0%) |
| 12 to 14 Years | 44 (100.0%) | 12 (100.0%) |
| 15 Years | 23 (100.0%) | 3 (7.0%) |
| 16 and 17 Years | 26 (100.0%) | 16 (100.0%) |
| 18 to 24 Years | 112 (94.1%) | 36 (30.2%) |
| 25 to 34 Years | 60 (87.0%) | 67 (55.4%) |
| 35 to 44 Years | 177 (100.0%) | 96 (94.1%) |
| 45 to 54 Years | 104 (77.6%) | 124 (94.7%) |
| 55 to 64 Years | 73 (87.9%) | 84 (70.0%) |
| 65 to 74 Years | 40 (78.4%) | 88 (98.9%) |
| 75 Years and over | 56 (87.5%) | 98 (81.7%) |
| Total | 830 (85.8%) | 766 (73.4%) |
Income Below Poverty Among Married-Couple Families in Warroad
The poverty statistics for married-couple families in Warroad show that 5.3% or 15 of the total 281 families live below the poverty line. Families with no children have the highest poverty rate of 8.6%, comprising of 15 families. On the other hand, families with 1 or 2 children have the lowest poverty rate of 0.0%, which includes 0 families.
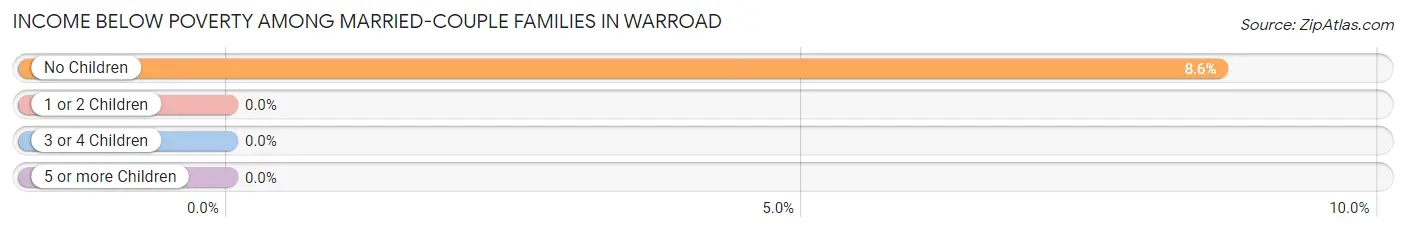
| Children | Above Poverty | Below Poverty |
| No Children | 159 (91.4%) | 15 (8.6%) |
| 1 or 2 Children | 73 (100.0%) | 0 (0.0%) |
| 3 or 4 Children | 31 (100.0%) | 0 (0.0%) |
| 5 or more Children | 3 (100.0%) | 0 (0.0%) |
| Total | 266 (94.7%) | 15 (5.3%) |
Income Below Poverty Among Single-Parent Households in Warroad
According to the poverty data in Warroad, 11.8% or 4 single-father households and 70.1% or 89 single-mother households are living below the poverty line. Among single-father households, those with no children have the highest poverty rate, with 4 households (33.3%) experiencing poverty. Likewise, among single-mother households, those with 1 or 2 children have the highest poverty rate, with 89 households (74.8%) falling below the poverty line.
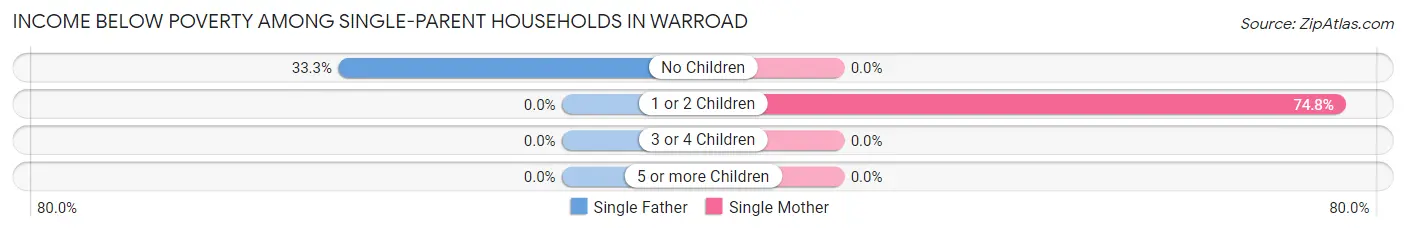
| Children | Single Father | Single Mother |
| No Children | 4 (33.3%) | 0 (0.0%) |
| 1 or 2 Children | 0 (0.0%) | 89 (74.8%) |
| 3 or 4 Children | 0 (0.0%) | 0 (0.0%) |
| 5 or more Children | 0 (0.0%) | 0 (0.0%) |
| Total | 4 (11.8%) | 89 (70.1%) |
Income Below Poverty Among Married-Couple vs Single-Parent Households in Warroad
The poverty data for Warroad shows that 15 of the married-couple family households (5.3%) and 93 of the single-parent households (57.8%) are living below the poverty level. Within the married-couple family households, those with no children have the highest poverty rate, with 15 households (8.6%) falling below the poverty line. Among the single-parent households, those with 1 or 2 children have the highest poverty rate, with 89 household (69.5%) living below poverty.
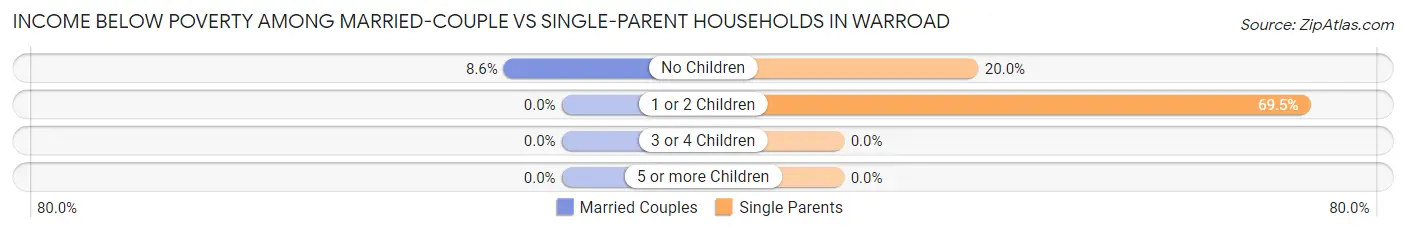
| Children | Married-Couple Families | Single-Parent Households |
| No Children | 15 (8.6%) | 4 (20.0%) |
| 1 or 2 Children | 0 (0.0%) | 89 (69.5%) |
| 3 or 4 Children | 0 (0.0%) | 0 (0.0%) |
| 5 or more Children | 0 (0.0%) | 0 (0.0%) |
| Total | 15 (5.3%) | 93 (57.8%) |
Race in Warroad
The most populous races in Warroad are White / Caucasian (1,880 | 90.6%), Asian (88 | 4.2%), and Two or more Races (57 | 2.8%).
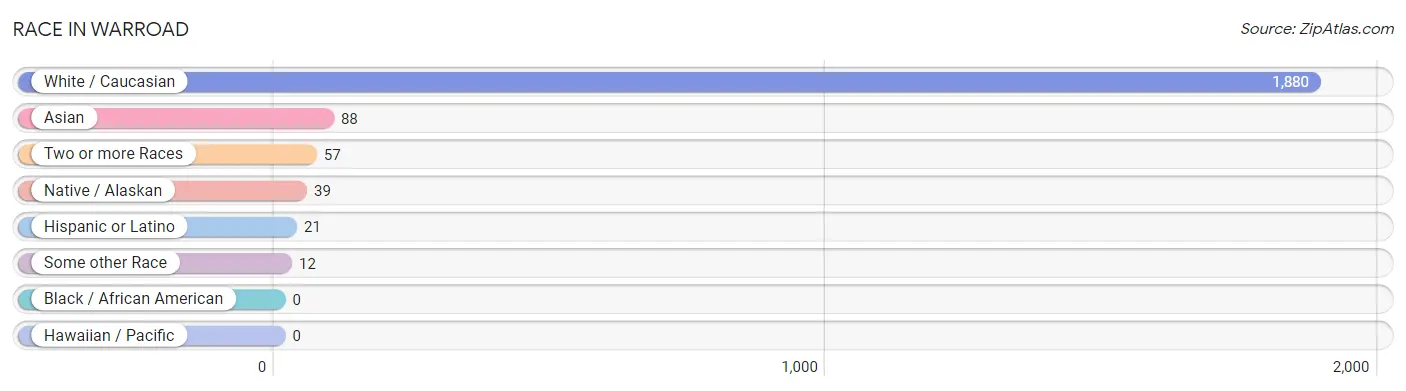
| Race | # Population | % Population |
| Asian | 88 | 4.2% |
| Black / African American | 0 | 0.0% |
| Hawaiian / Pacific | 0 | 0.0% |
| Hispanic or Latino | 21 | 1.0% |
| Native / Alaskan | 39 | 1.9% |
| White / Caucasian | 1,880 | 90.6% |
| Two or more Races | 57 | 2.8% |
| Some other Race | 12 | 0.6% |
| Total | 2,076 | 100.0% |
Ancestry in Warroad
The most populous ancestries reported in Warroad are Norwegian (479 | 23.1%), German (425 | 20.5%), Swedish (178 | 8.6%), Irish (119 | 5.7%), and Polish (87 | 4.2%), together accounting for 62.0% of all Warroad residents.
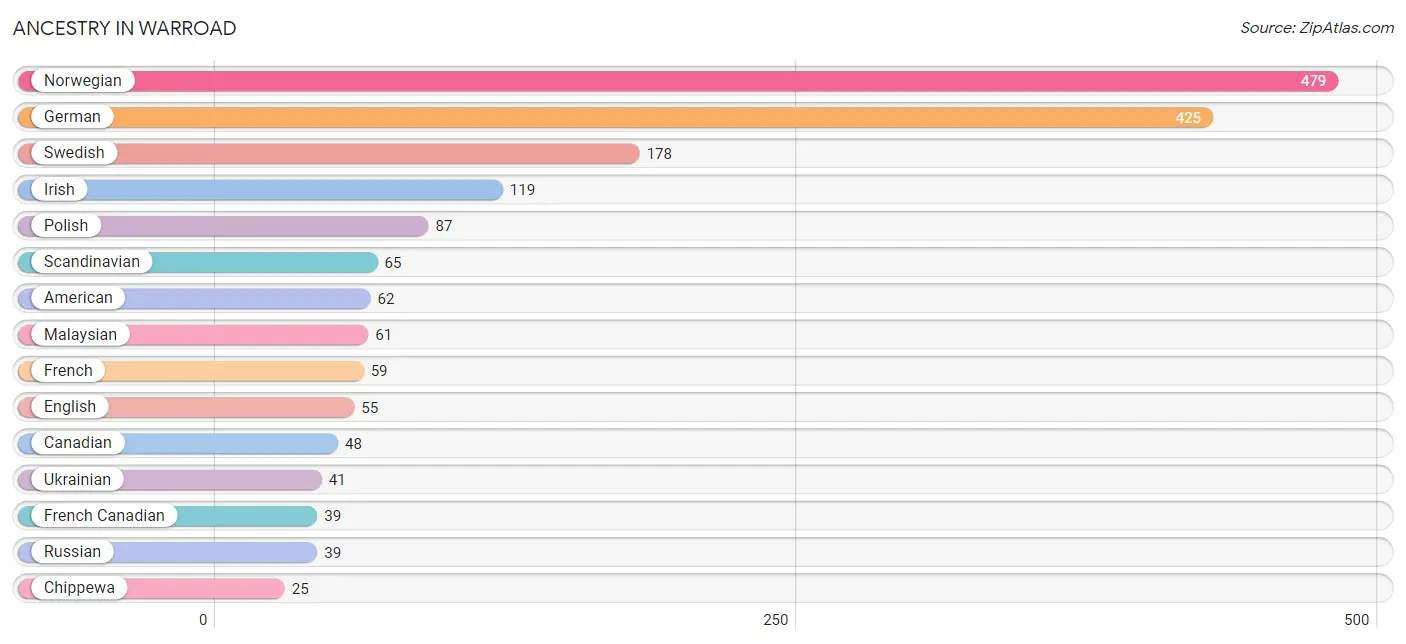
| Ancestry | # Population | % Population |
| American | 62 | 3.0% |
| Bangladeshi | 4 | 0.2% |
| Burmese | 4 | 0.2% |
| Canadian | 48 | 2.3% |
| Chippewa | 25 | 1.2% |
| Croatian | 6 | 0.3% |
| Czechoslovakian | 16 | 0.8% |
| Danish | 11 | 0.5% |
| Dutch | 3 | 0.1% |
| English | 55 | 2.6% |
| European | 11 | 0.5% |
| Finnish | 7 | 0.3% |
| French | 59 | 2.8% |
| French Canadian | 39 | 1.9% |
| German | 425 | 20.5% |
| Hungarian | 2 | 0.1% |
| Irish | 119 | 5.7% |
| Italian | 23 | 1.1% |
| Korean | 25 | 1.2% |
| Malaysian | 61 | 2.9% |
| Mexican | 18 | 0.9% |
| Norwegian | 479 | 23.1% |
| Polish | 87 | 4.2% |
| Russian | 39 | 1.9% |
| Scandinavian | 65 | 3.1% |
| Scotch-Irish | 3 | 0.1% |
| Sioux | 8 | 0.4% |
| Slovak | 3 | 0.1% |
| Swedish | 178 | 8.6% |
| Ukrainian | 41 | 2.0% | View All 30 Rows |
Immigrants in Warroad
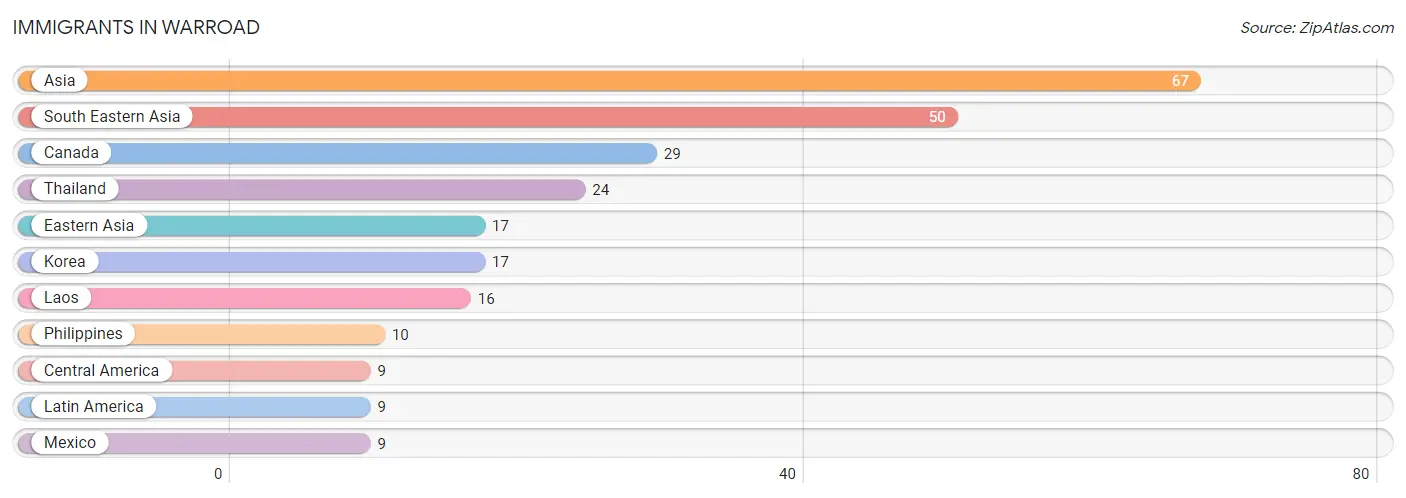
The most numerous immigrant groups reported in Warroad came from Asia (67 | 3.2%), South Eastern Asia (50 | 2.4%), Canada (29 | 1.4%), Thailand (24 | 1.2%), and Eastern Asia (17 | 0.8%), together accounting for 9.0% of all Warroad residents.
| Immigration Origin | # Population | % Population |
| Asia | 67 | 3.2% |
| Canada | 29 | 1.4% |
| Central America | 9 | 0.4% |
| Eastern Asia | 17 | 0.8% |
| Korea | 17 | 0.8% |
| Laos | 16 | 0.8% |
| Latin America | 9 | 0.4% |
| Mexico | 9 | 0.4% |
| Philippines | 10 | 0.5% |
| South Eastern Asia | 50 | 2.4% |
| Thailand | 24 | 1.2% | View All 11 Rows |
Sex and Age in Warroad
Sex and Age in Warroad
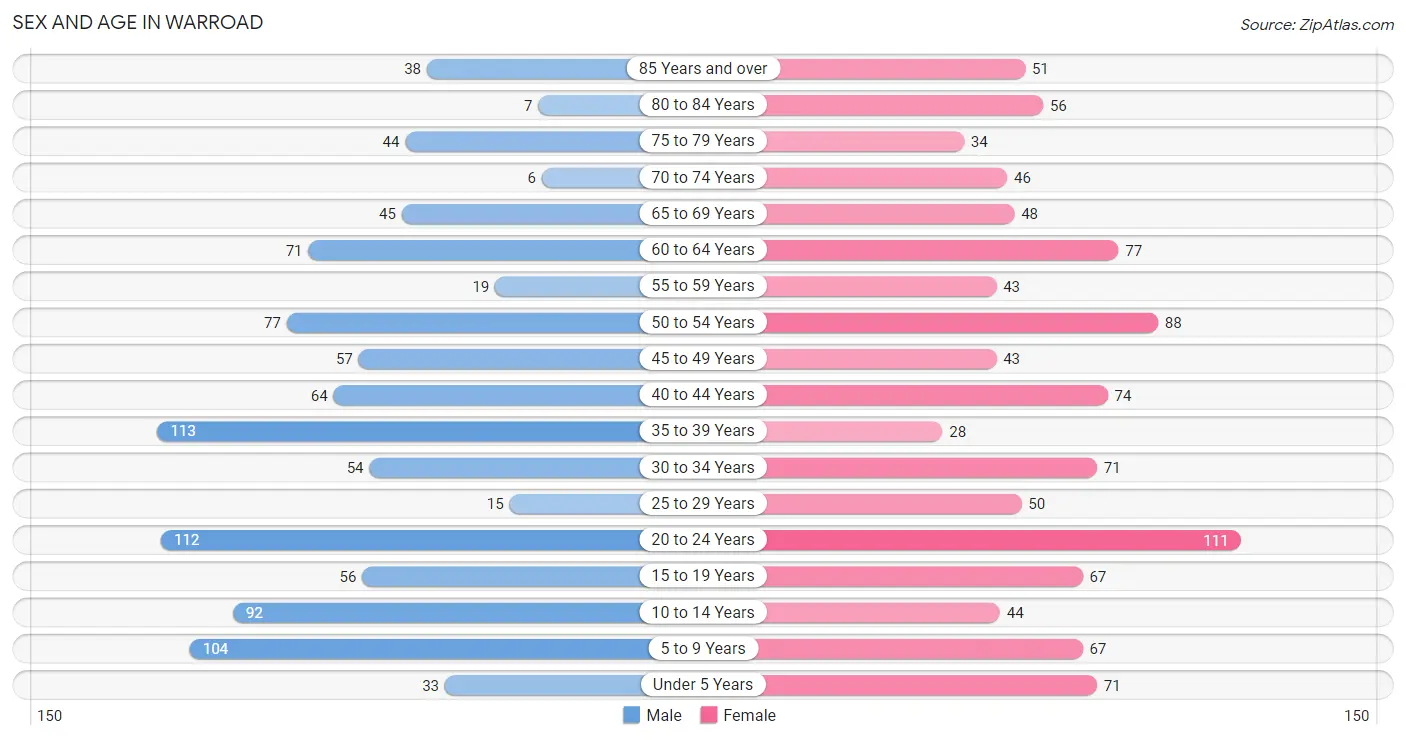
The most populous age groups in Warroad are 35 to 39 Years (113 | 11.2%) for men and 20 to 24 Years (111 | 10.4%) for women.
| Age Bracket | Male | Female |
| Under 5 Years | 33 (3.3%) | 71 (6.6%) |
| 5 to 9 Years | 104 (10.3%) | 67 (6.3%) |
| 10 to 14 Years | 92 (9.1%) | 44 (4.1%) |
| 15 to 19 Years | 56 (5.6%) | 67 (6.3%) |
| 20 to 24 Years | 112 (11.1%) | 111 (10.4%) |
| 25 to 29 Years | 15 (1.5%) | 50 (4.7%) |
| 30 to 34 Years | 54 (5.4%) | 71 (6.6%) |
| 35 to 39 Years | 113 (11.2%) | 28 (2.6%) |
| 40 to 44 Years | 64 (6.4%) | 74 (6.9%) |
| 45 to 49 Years | 57 (5.7%) | 43 (4.0%) |
| 50 to 54 Years | 77 (7.6%) | 88 (8.2%) |
| 55 to 59 Years | 19 (1.9%) | 43 (4.0%) |
| 60 to 64 Years | 71 (7.0%) | 77 (7.2%) |
| 65 to 69 Years | 45 (4.5%) | 48 (4.5%) |
| 70 to 74 Years | 6 (0.6%) | 46 (4.3%) |
| 75 to 79 Years | 44 (4.4%) | 34 (3.2%) |
| 80 to 84 Years | 7 (0.7%) | 56 (5.2%) |
| 85 Years and over | 38 (3.8%) | 51 (4.8%) |
| Total | 1,007 (100.0%) | 1,069 (100.0%) |
Families and Households in Warroad
Median Family Size in Warroad
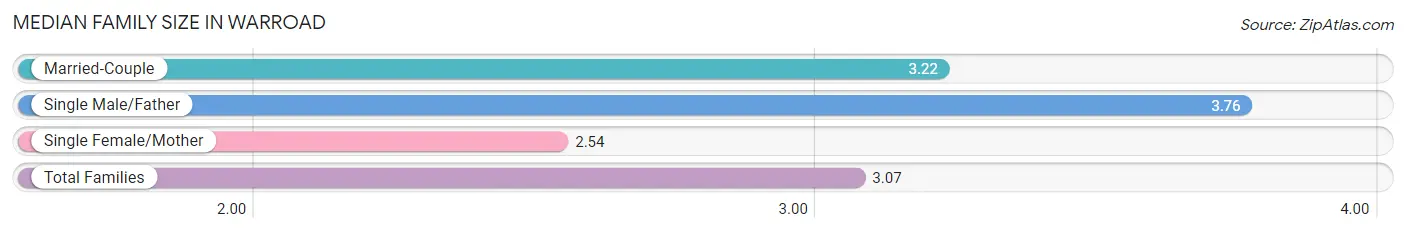
The median family size in Warroad is 3.07 persons per family, with single male/father families (34 | 7.7%) accounting for the largest median family size of 3.76 persons per family. On the other hand, single female/mother families (127 | 28.7%) represent the smallest median family size with 2.54 persons per family.
| Family Type | # Families | Family Size |
| Married-Couple | 281 (63.6%) | 3.22 |
| Single Male/Father | 34 (7.7%) | 3.76 |
| Single Female/Mother | 127 (28.7%) | 2.54 |
| Total Families | 442 (100.0%) | 3.07 |
Median Household Size in Warroad
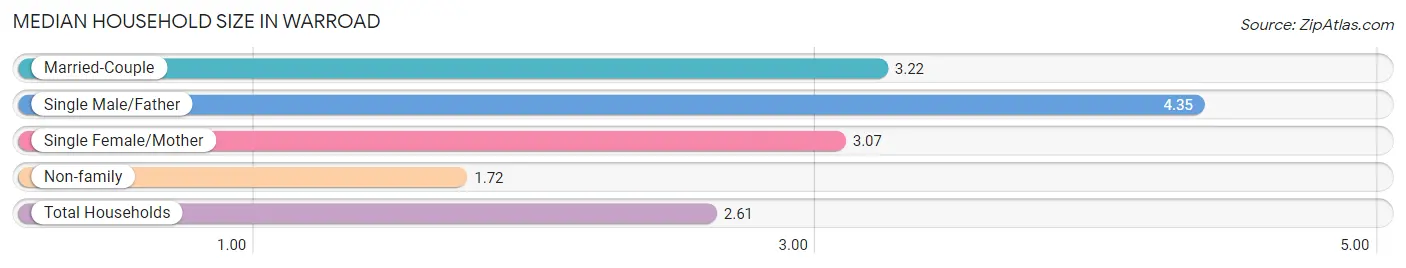
The median household size in Warroad is 2.61 persons per household, with single male/father households (34 | 4.4%) accounting for the largest median household size of 4.35 persons per household. non-family households (330 | 42.7%) represent the smallest median household size with 1.72 persons per household.
| Household Type | # Households | Household Size |
| Married-Couple | 281 (36.4%) | 3.22 |
| Single Male/Father | 34 (4.4%) | 4.35 |
| Single Female/Mother | 127 (16.5%) | 3.07 |
| Non-family | 330 (42.7%) | 1.72 |
| Total Households | 772 (100.0%) | 2.61 |
Household Size by Marriage Status in Warroad
Out of a total of 772 households in Warroad, 442 (57.3%) are family households, while 330 (42.7%) are nonfamily households. The most numerous type of family households are 2-person households, comprising 169, and the most common type of nonfamily households are 1-person households, comprising 268.
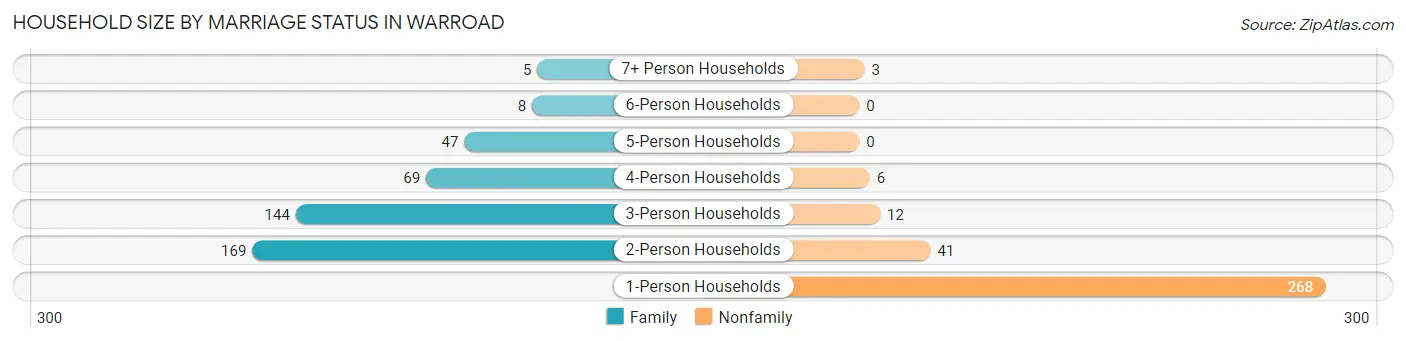
| Household Size | Family Households | Nonfamily Households |
| 1-Person Households | - | 268 (34.7%) |
| 2-Person Households | 169 (21.9%) | 41 (5.3%) |
| 3-Person Households | 144 (18.6%) | 12 (1.5%) |
| 4-Person Households | 69 (8.9%) | 6 (0.8%) |
| 5-Person Households | 47 (6.1%) | 0 (0.0%) |
| 6-Person Households | 8 (1.0%) | 0 (0.0%) |
| 7+ Person Households | 5 (0.6%) | 3 (0.4%) |
| Total | 442 (57.3%) | 330 (42.7%) |
Female Fertility in Warroad
Fertility by Age in Warroad
| Age Bracket | Women with Births | Births / 1,000 Women |
| 15 to 19 years | 0 (0.0%) | 0.0 |
| 20 to 34 years | 0 (0.0%) | 0.0 |
| 35 to 50 years | 0 (0.0%) | 0.0 |
| Total | 0 (0.0%) | 0.0 |
Fertility by Age by Marriage Status in Warroad
| Age Bracket | Married | Unmarried |
| 15 to 19 years | 0 (0.0%) | 0 (0.0%) |
| 20 to 34 years | 0 (0.0%) | 0 (0.0%) |
| 35 to 50 years | 0 (0.0%) | 0 (0.0%) |
| Total | 0 (0.0%) | 0 (0.0%) |
Fertility by Education in Warroad
| Educational Attainment | Women with Births | Births / 1,000 Women |
| Less than High School | 0 (0.0%) | 0.0 |
| High School Diploma | 0 (0.0%) | 0.0 |
| College or Associate's Degree | 0 (0.0%) | 0.0 |
| Bachelor's Degree | 0 (0.0%) | 0.0 |
| Graduate Degree | 0 (0.0%) | 0.0 |
| Total | 0 (0.0%) | 0.0 |
Fertility by Education by Marriage Status in Warroad
| Educational Attainment | Married | Unmarried |
| Less than High School | 0 (0.0%) | 0 (0.0%) |
| High School Diploma | 0 (0.0%) | 0 (0.0%) |
| College or Associate's Degree | 0 (0.0%) | 0 (0.0%) |
| Bachelor's Degree | 0 (0.0%) | 0 (0.0%) |
| Graduate Degree | 0 (0.0%) | 0 (0.0%) |
| Total | 0 (0.0%) | 0 (0.0%) |
Employment Characteristics in Warroad
Employment by Class of Employer in Warroad
Among the 859 employed individuals in Warroad, private company employees (659 | 76.7%), self-employed (not incorporated) (64 | 7.4%), and local government employees (44 | 5.1%) make up the most common classes of employment.
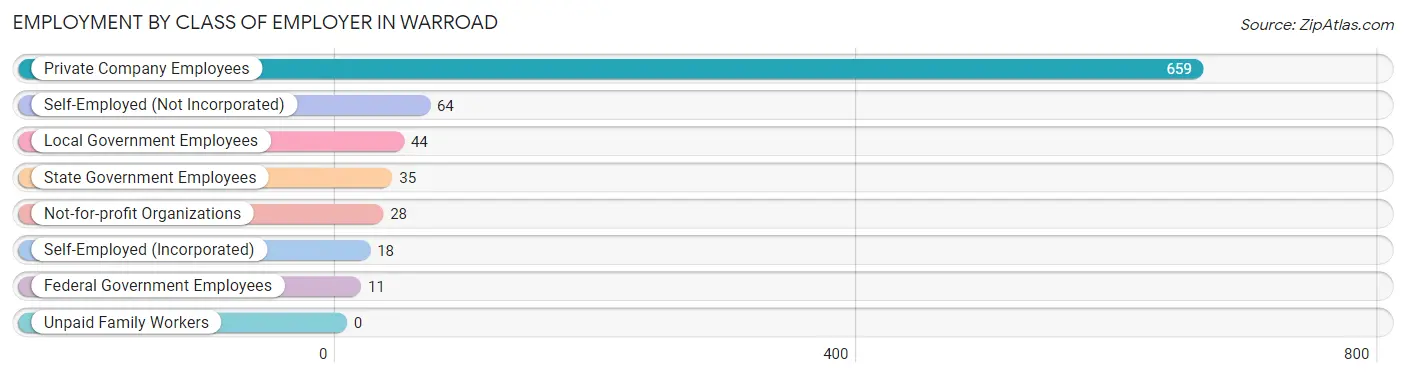
| Employer Class | # Employees | % Employees |
| Private Company Employees | 659 | 76.7% |
| Self-Employed (Incorporated) | 18 | 2.1% |
| Self-Employed (Not Incorporated) | 64 | 7.4% |
| Not-for-profit Organizations | 28 | 3.3% |
| Local Government Employees | 44 | 5.1% |
| State Government Employees | 35 | 4.1% |
| Federal Government Employees | 11 | 1.3% |
| Unpaid Family Workers | 0 | 0.0% |
| Total | 859 | 100.0% |
Employment Status by Age in Warroad
According to the labor force statistics for Warroad, out of the total population over 16 years of age (1,599), 59.2% or 947 individuals are in the labor force, with 7.3% or 69 of them unemployed. The age group with the highest labor force participation rate is 35 to 44 years, with 93.5% or 261 individuals in the labor force. Within the labor force, the 16 to 19 years age range has the highest percentage of unemployed individuals, with 44.4% or 8 of them being unemployed.
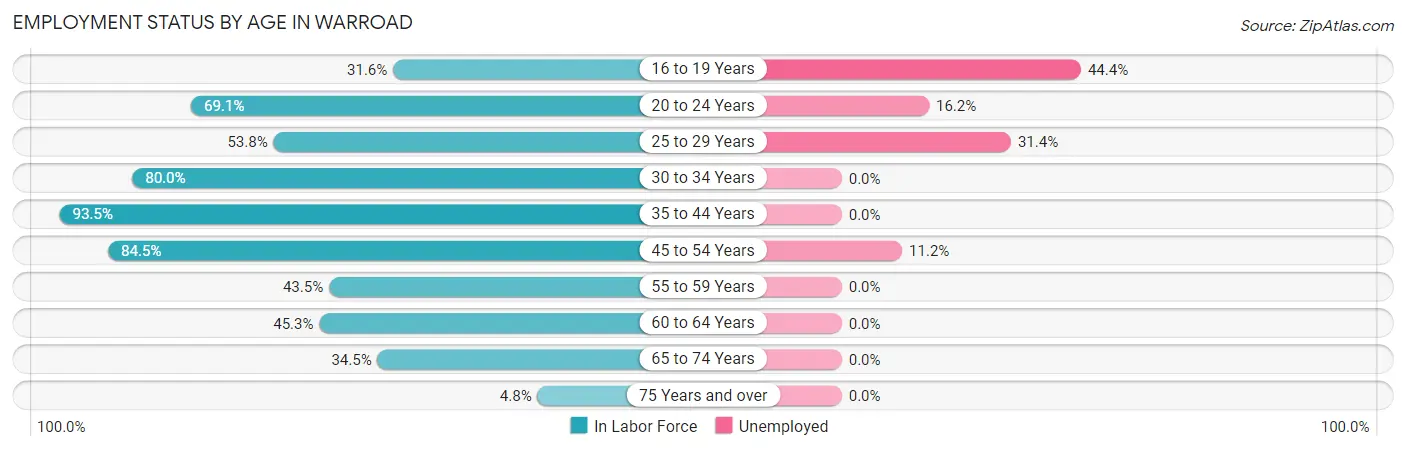
| Age Bracket | In Labor Force | Unemployed |
| 16 to 19 Years | 18 (31.6%) | 8 (44.4%) |
| 20 to 24 Years | 154 (69.1%) | 25 (16.2%) |
| 25 to 29 Years | 35 (53.8%) | 11 (31.4%) |
| 30 to 34 Years | 100 (80.0%) | 0 (0.0%) |
| 35 to 44 Years | 261 (93.5%) | 0 (0.0%) |
| 45 to 54 Years | 224 (84.5%) | 25 (11.2%) |
| 55 to 59 Years | 27 (43.5%) | 0 (0.0%) |
| 60 to 64 Years | 67 (45.3%) | 0 (0.0%) |
| 65 to 74 Years | 50 (34.5%) | 0 (0.0%) |
| 75 Years and over | 11 (4.8%) | 0 (0.0%) |
| Total | 947 (59.2%) | 69 (7.3%) |
Employment Status by Educational Attainment in Warroad
According to labor force statistics for Warroad, 75.6% of individuals (714) out of the total population between 25 and 64 years of age (944) are in the labor force, with 5.0% or 36 of them being unemployed. The group with the highest labor force participation rate are those with the educational attainment of bachelor's degree or higher, with 84.6% or 159 individuals in the labor force. Within the labor force, individuals with high school diploma education have the highest percentage of unemployment, with 7.2% or 18 of them being unemployed.
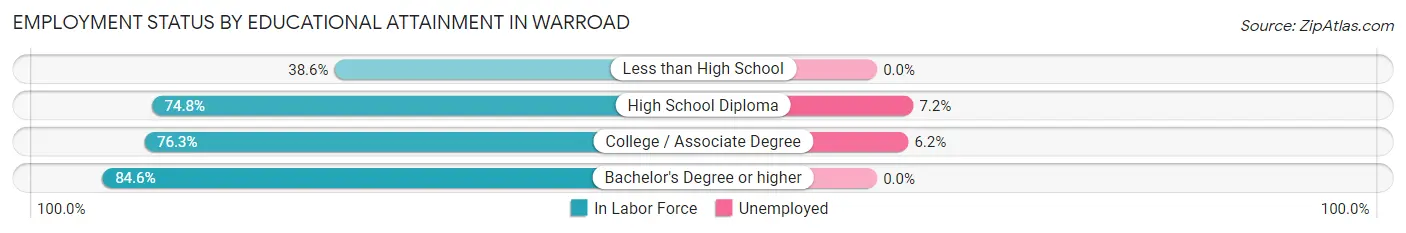
| Educational Attainment | In Labor Force | Unemployed |
| Less than High School | 17 (38.6%) | 0 (0.0%) |
| High School Diploma | 249 (74.8%) | 24 (7.2%) |
| College / Associate Degree | 289 (76.3%) | 23 (6.2%) |
| Bachelor's Degree or higher | 159 (84.6%) | 0 (0.0%) |
| Total | 714 (75.6%) | 47 (5.0%) |
Employment Occupations by Sex in Warroad
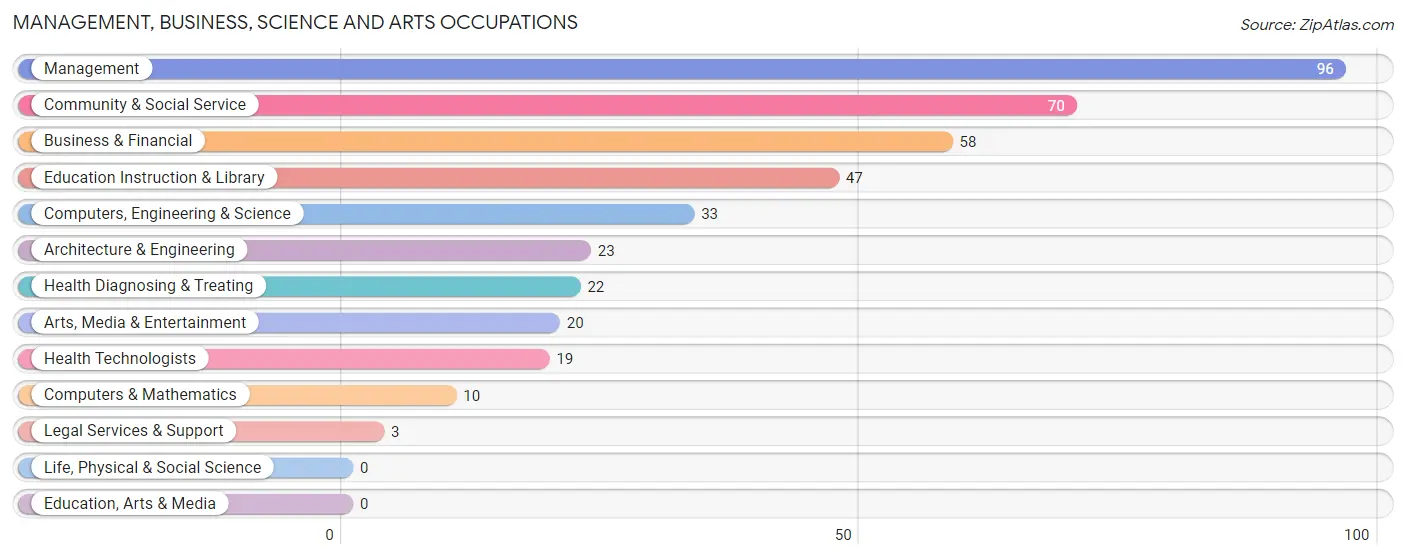
Management, Business, Science and Arts Occupations
The most common Management, Business, Science and Arts occupations in Warroad are Management (96 | 10.9%), Community & Social Service (70 | 8.0%), Business & Financial (58 | 6.6%), Education Instruction & Library (47 | 5.3%), and Computers, Engineering & Science (33 | 3.8%).
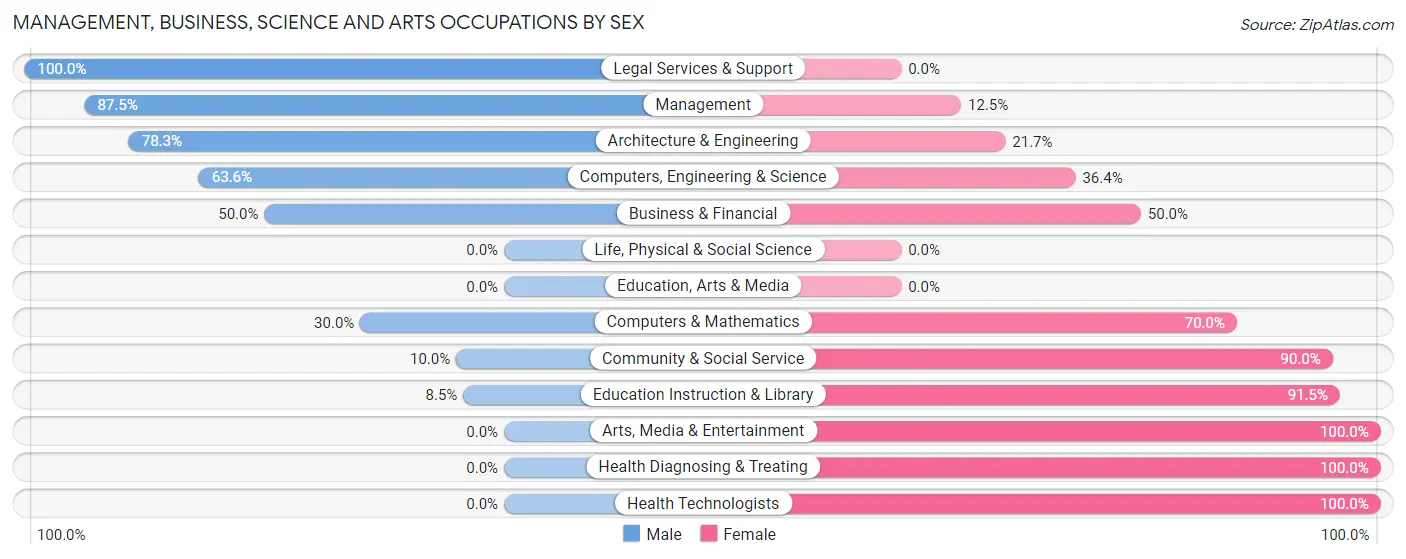
Management, Business, Science and Arts Occupations by Sex
Within the Management, Business, Science and Arts occupations in Warroad, the most male-oriented occupations are Legal Services & Support (100.0%), Management (87.5%), and Architecture & Engineering (78.3%), while the most female-oriented occupations are Arts, Media & Entertainment (100.0%), Health Diagnosing & Treating (100.0%), and Health Technologists (100.0%).
| Occupation | Male | Female |
| Management | 84 (87.5%) | 12 (12.5%) |
| Business & Financial | 29 (50.0%) | 29 (50.0%) |
| Computers, Engineering & Science | 21 (63.6%) | 12 (36.4%) |
| Computers & Mathematics | 3 (30.0%) | 7 (70.0%) |
| Architecture & Engineering | 18 (78.3%) | 5 (21.7%) |
| Life, Physical & Social Science | 0 (0.0%) | 0 (0.0%) |
| Community & Social Service | 7 (10.0%) | 63 (90.0%) |
| Education, Arts & Media | 0 (0.0%) | 0 (0.0%) |
| Legal Services & Support | 3 (100.0%) | 0 (0.0%) |
| Education Instruction & Library | 4 (8.5%) | 43 (91.5%) |
| Arts, Media & Entertainment | 0 (0.0%) | 20 (100.0%) |
| Health Diagnosing & Treating | 0 (0.0%) | 22 (100.0%) |
| Health Technologists | 0 (0.0%) | 19 (100.0%) |
| Total (Category) | 141 (50.5%) | 138 (49.5%) |
| Total (Overall) | 502 (57.2%) | 376 (42.8%) |
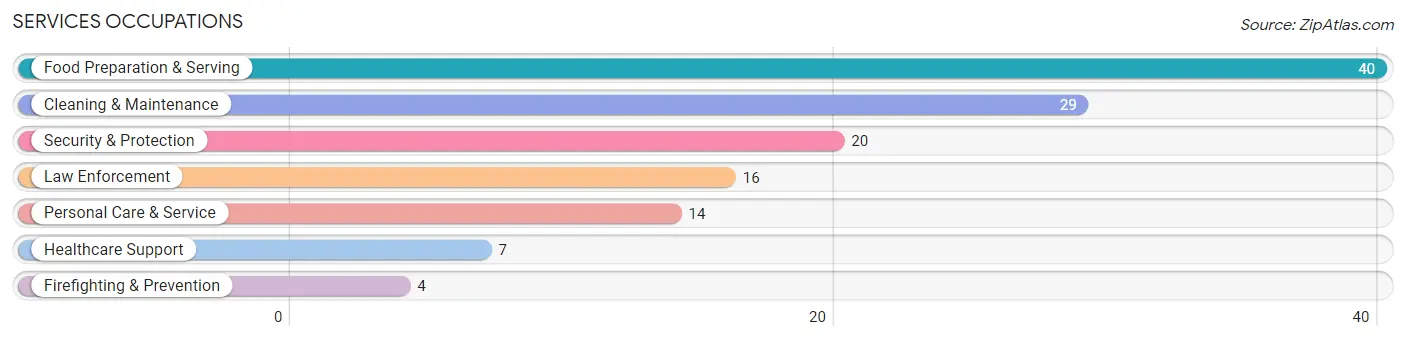
Services Occupations
The most common Services occupations in Warroad are Food Preparation & Serving (40 | 4.6%), Cleaning & Maintenance (29 | 3.3%), Security & Protection (20 | 2.3%), Law Enforcement (16 | 1.8%), and Personal Care & Service (14 | 1.6%).
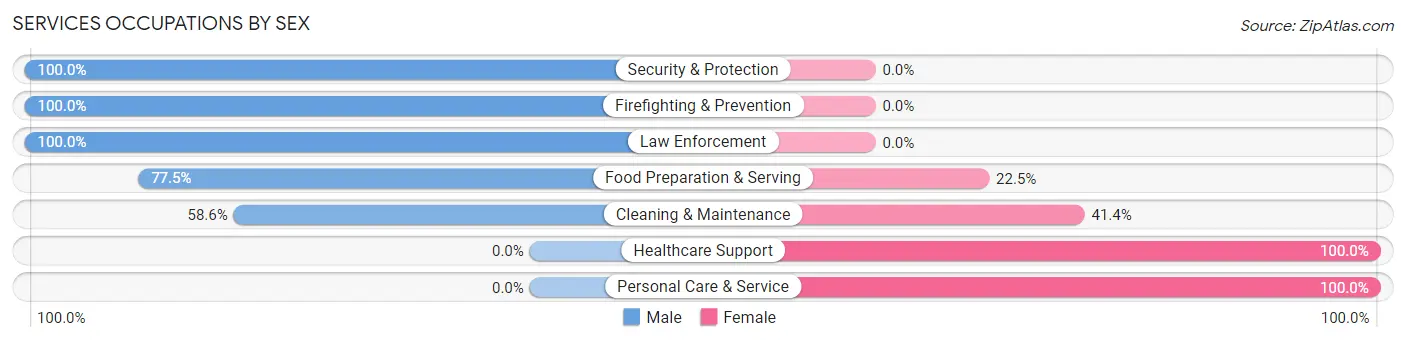
Services Occupations by Sex
Within the Services occupations in Warroad, the most male-oriented occupations are Security & Protection (100.0%), Firefighting & Prevention (100.0%), and Law Enforcement (100.0%), while the most female-oriented occupations are Healthcare Support (100.0%), Personal Care & Service (100.0%), and Cleaning & Maintenance (41.4%).
| Occupation | Male | Female |
| Healthcare Support | 0 (0.0%) | 7 (100.0%) |
| Security & Protection | 20 (100.0%) | 0 (0.0%) |
| Firefighting & Prevention | 4 (100.0%) | 0 (0.0%) |
| Law Enforcement | 16 (100.0%) | 0 (0.0%) |
| Food Preparation & Serving | 31 (77.5%) | 9 (22.5%) |
| Cleaning & Maintenance | 17 (58.6%) | 12 (41.4%) |
| Personal Care & Service | 0 (0.0%) | 14 (100.0%) |
| Total (Category) | 68 (61.8%) | 42 (38.2%) |
| Total (Overall) | 502 (57.2%) | 376 (42.8%) |
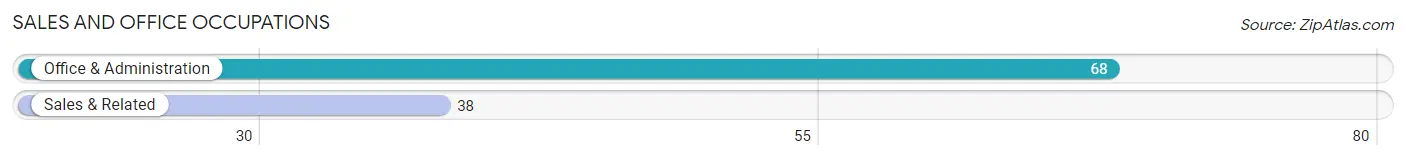
Sales and Office Occupations
The most common Sales and Office occupations in Warroad are Office & Administration (68 | 7.7%), and Sales & Related (38 | 4.3%).
Sales and Office Occupations by Sex
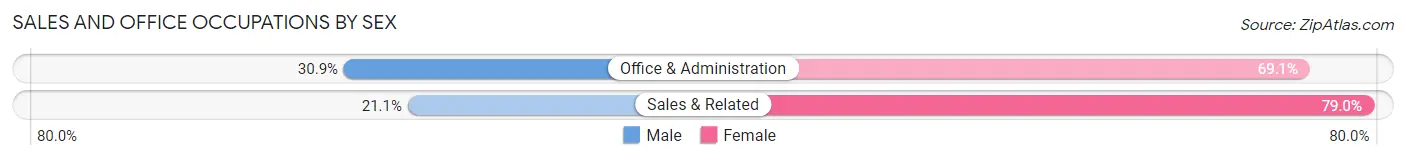
| Occupation | Male | Female |
| Sales & Related | 8 (21.0%) | 30 (78.9%) |
| Office & Administration | 21 (30.9%) | 47 (69.1%) |
| Total (Category) | 29 (27.4%) | 77 (72.6%) |
| Total (Overall) | 502 (57.2%) | 376 (42.8%) |
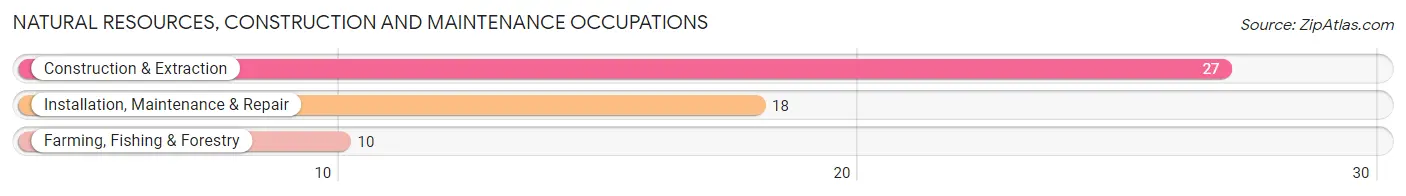
Natural Resources, Construction and Maintenance Occupations
The most common Natural Resources, Construction and Maintenance occupations in Warroad are Construction & Extraction (27 | 3.1%), Installation, Maintenance & Repair (18 | 2.1%), and Farming, Fishing & Forestry (10 | 1.1%).
Natural Resources, Construction and Maintenance Occupations by Sex
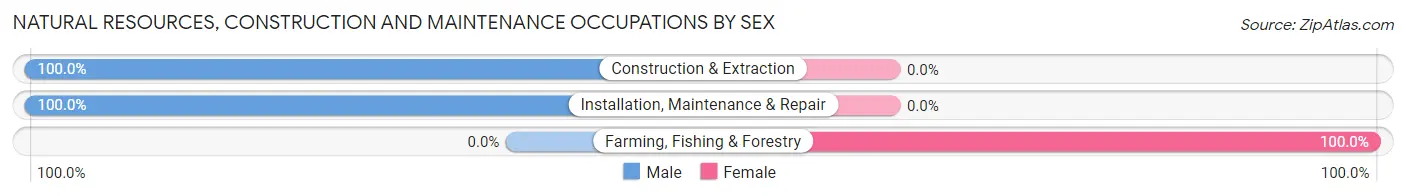
| Occupation | Male | Female |
| Farming, Fishing & Forestry | 0 (0.0%) | 10 (100.0%) |
| Construction & Extraction | 27 (100.0%) | 0 (0.0%) |
| Installation, Maintenance & Repair | 18 (100.0%) | 0 (0.0%) |
| Total (Category) | 45 (81.8%) | 10 (18.2%) |
| Total (Overall) | 502 (57.2%) | 376 (42.8%) |
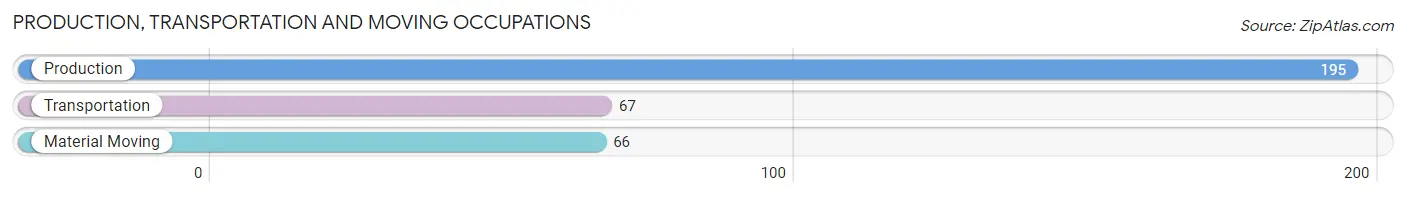
Production, Transportation and Moving Occupations
The most common Production, Transportation and Moving occupations in Warroad are Production (195 | 22.2%), Transportation (67 | 7.6%), and Material Moving (66 | 7.5%).
Production, Transportation and Moving Occupations by Sex
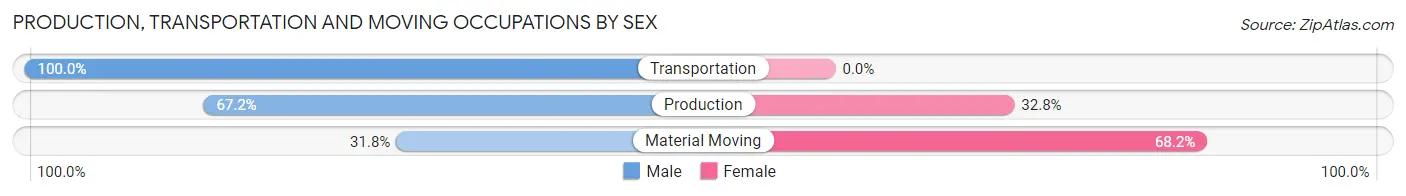
| Occupation | Male | Female |
| Production | 131 (67.2%) | 64 (32.8%) |
| Transportation | 67 (100.0%) | 0 (0.0%) |
| Material Moving | 21 (31.8%) | 45 (68.2%) |
| Total (Category) | 219 (66.8%) | 109 (33.2%) |
| Total (Overall) | 502 (57.2%) | 376 (42.8%) |
Employment Industries by Sex in Warroad
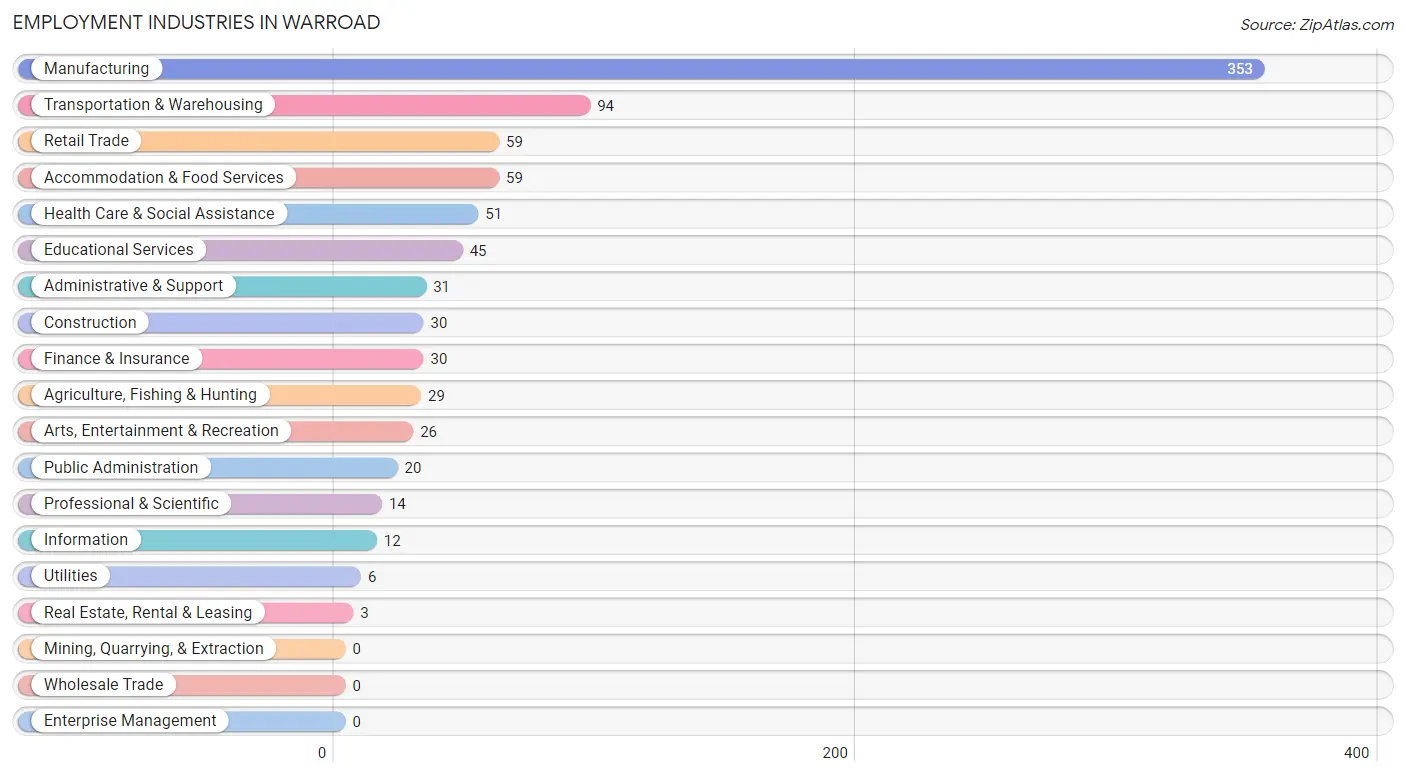
Employment Industries in Warroad
The major employment industries in Warroad include Manufacturing (353 | 40.2%), Transportation & Warehousing (94 | 10.7%), Retail Trade (59 | 6.7%), Accommodation & Food Services (59 | 6.7%), and Health Care & Social Assistance (51 | 5.8%).
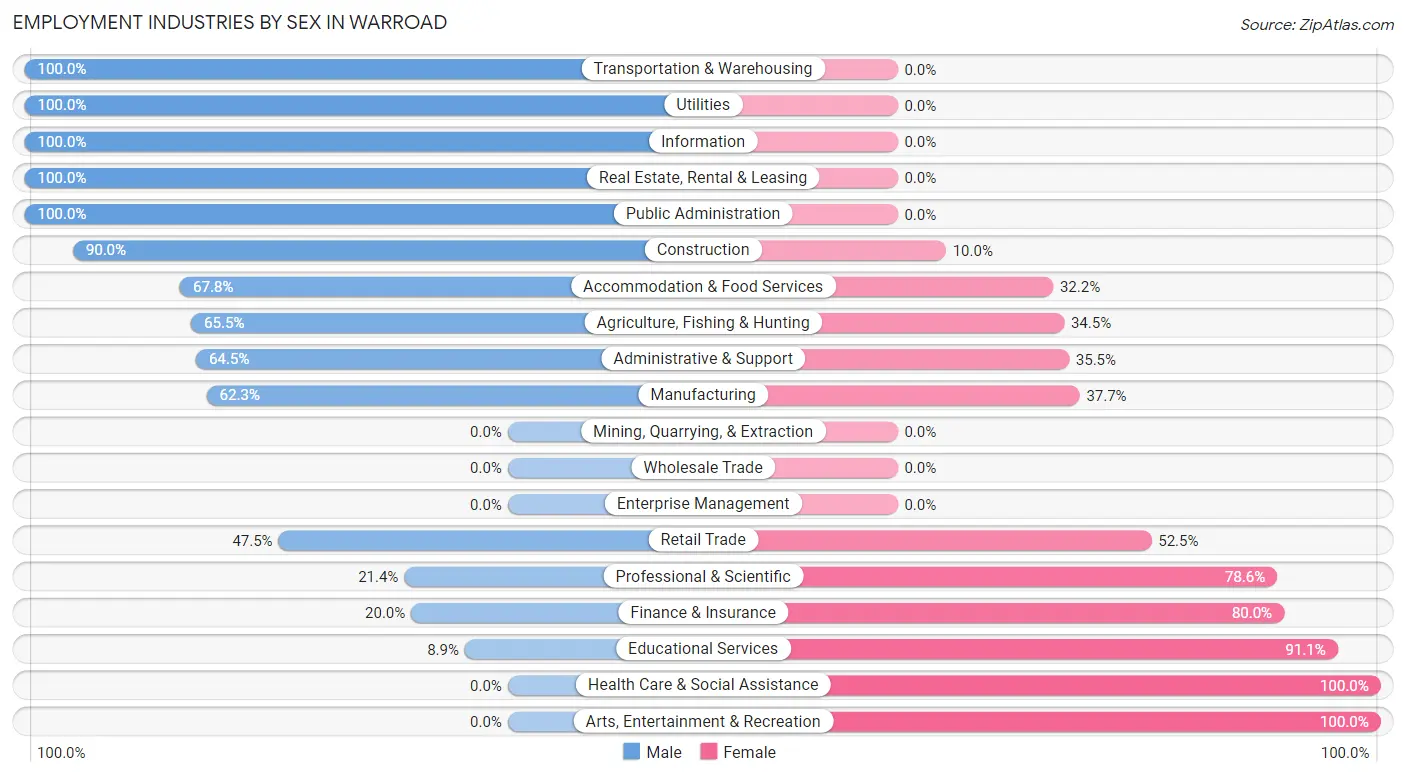
Employment Industries by Sex in Warroad
The Warroad industries that see more men than women are Transportation & Warehousing (100.0%), Utilities (100.0%), and Information (100.0%), whereas the industries that tend to have a higher number of women are Health Care & Social Assistance (100.0%), Arts, Entertainment & Recreation (100.0%), and Educational Services (91.1%).
| Industry | Male | Female |
| Agriculture, Fishing & Hunting | 19 (65.5%) | 10 (34.5%) |
| Mining, Quarrying, & Extraction | 0 (0.0%) | 0 (0.0%) |
| Construction | 27 (90.0%) | 3 (10.0%) |
| Manufacturing | 220 (62.3%) | 133 (37.7%) |
| Wholesale Trade | 0 (0.0%) | 0 (0.0%) |
| Retail Trade | 28 (47.5%) | 31 (52.5%) |
| Transportation & Warehousing | 94 (100.0%) | 0 (0.0%) |
| Utilities | 6 (100.0%) | 0 (0.0%) |
| Information | 12 (100.0%) | 0 (0.0%) |
| Finance & Insurance | 6 (20.0%) | 24 (80.0%) |
| Real Estate, Rental & Leasing | 3 (100.0%) | 0 (0.0%) |
| Professional & Scientific | 3 (21.4%) | 11 (78.6%) |
| Enterprise Management | 0 (0.0%) | 0 (0.0%) |
| Administrative & Support | 20 (64.5%) | 11 (35.5%) |
| Educational Services | 4 (8.9%) | 41 (91.1%) |
| Health Care & Social Assistance | 0 (0.0%) | 51 (100.0%) |
| Arts, Entertainment & Recreation | 0 (0.0%) | 26 (100.0%) |
| Accommodation & Food Services | 40 (67.8%) | 19 (32.2%) |
| Public Administration | 20 (100.0%) | 0 (0.0%) |
| Total | 502 (57.2%) | 376 (42.8%) |
Education in Warroad
School Enrollment in Warroad
The most common levels of schooling among the 475 students in Warroad are middle school (156 | 32.8%), elementary school (133 | 28.0%), and high school (75 | 15.8%).
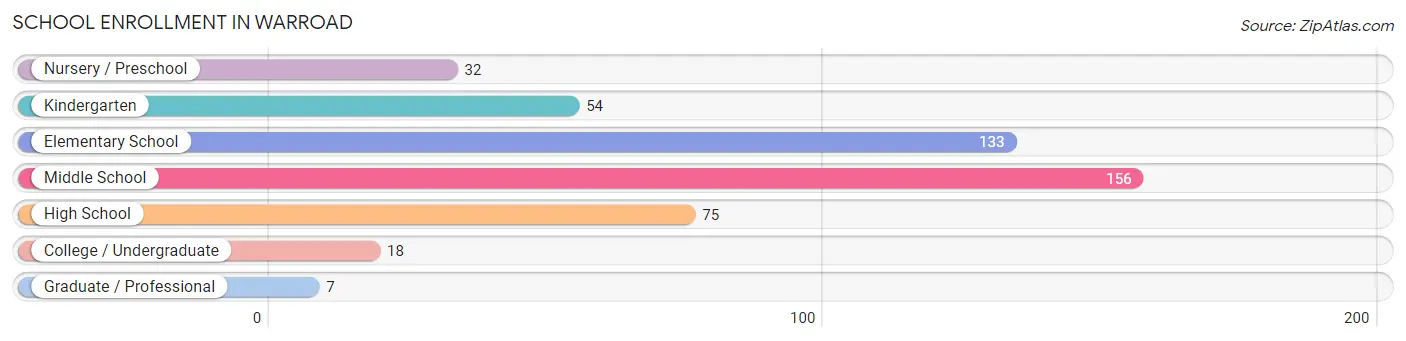
| School Level | # Students | % Students |
| Nursery / Preschool | 32 | 6.7% |
| Kindergarten | 54 | 11.4% |
| Elementary School | 133 | 28.0% |
| Middle School | 156 | 32.8% |
| High School | 75 | 15.8% |
| College / Undergraduate | 18 | 3.8% |
| Graduate / Professional | 7 | 1.5% |
| Total | 475 | 100.0% |
School Enrollment by Age by Funding Source in Warroad
Out of a total of 475 students who are enrolled in schools in Warroad, 21 (4.4%) attend a private institution, while the remaining 454 (95.6%) are enrolled in public schools. The age group of 20 to 24 year olds has the highest likelihood of being enrolled in private schools, with 18 (100.0% in the age bracket) enrolled. Conversely, the age group of 3 to 4 year olds has the lowest likelihood of being enrolled in a private school, with 38 (100.0% in the age bracket) attending a public institution.
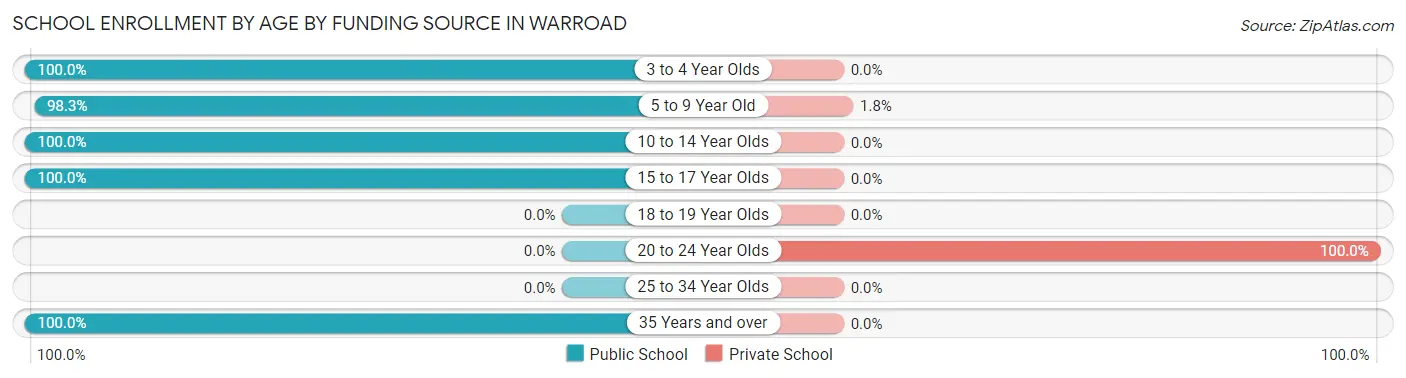
| Age Bracket | Public School | Private School |
| 3 to 4 Year Olds | 38 (100.0%) | 0 (0.0%) |
| 5 to 9 Year Old | 168 (98.3%) | 3 (1.8%) |
| 10 to 14 Year Olds | 133 (100.0%) | 0 (0.0%) |
| 15 to 17 Year Olds | 108 (100.0%) | 0 (0.0%) |
| 18 to 19 Year Olds | 0 (0.0%) | 0 (0.0%) |
| 20 to 24 Year Olds | 0 (0.0%) | 18 (100.0%) |
| 25 to 34 Year Olds | 0 (0.0%) | 0 (0.0%) |
| 35 Years and over | 7 (100.0%) | 0 (0.0%) |
| Total | 454 (95.6%) | 21 (4.4%) |
Educational Attainment by Field of Study in Warroad
Business (56 | 24.2%), education (46 | 19.9%), liberal arts & history (31 | 13.4%), engineering (28 | 12.1%), and computers & mathematics (17 | 7.4%) are the most common fields of study among 231 individuals in Warroad who have obtained a bachelor's degree or higher.
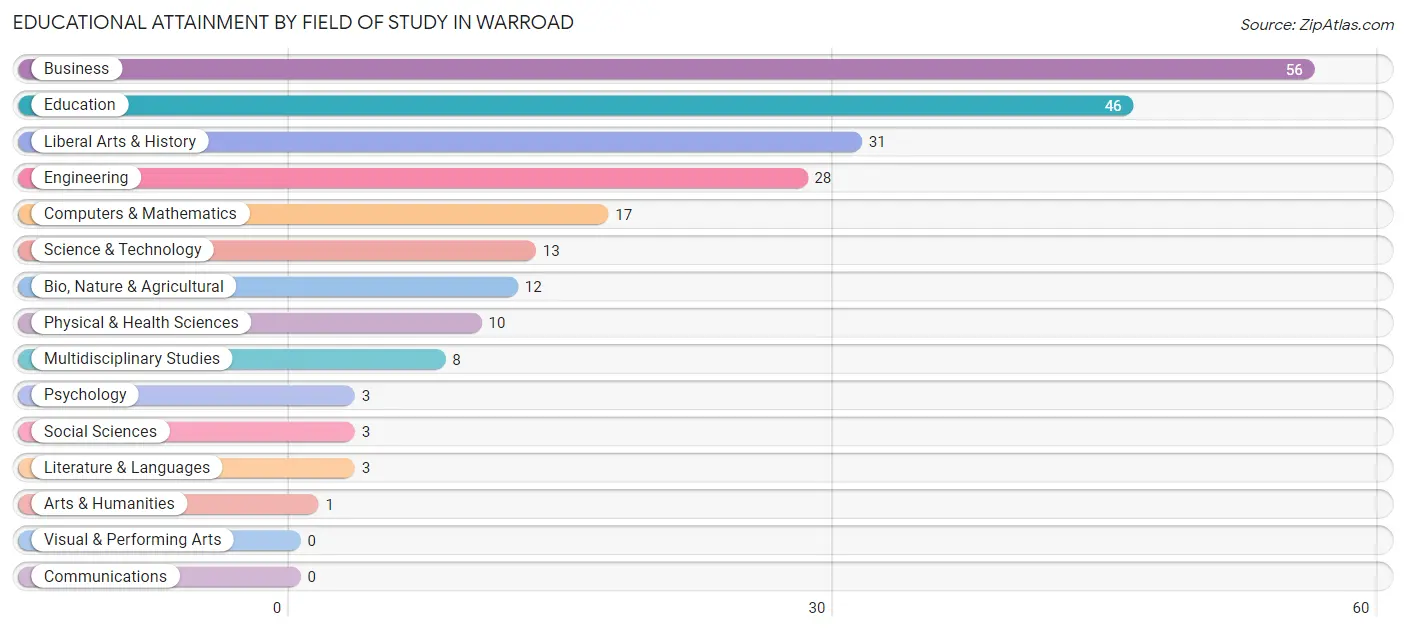
| Field of Study | # Graduates | % Graduates |
| Computers & Mathematics | 17 | 7.4% |
| Bio, Nature & Agricultural | 12 | 5.2% |
| Physical & Health Sciences | 10 | 4.3% |
| Psychology | 3 | 1.3% |
| Social Sciences | 3 | 1.3% |
| Engineering | 28 | 12.1% |
| Multidisciplinary Studies | 8 | 3.5% |
| Science & Technology | 13 | 5.6% |
| Business | 56 | 24.2% |
| Education | 46 | 19.9% |
| Literature & Languages | 3 | 1.3% |
| Liberal Arts & History | 31 | 13.4% |
| Visual & Performing Arts | 0 | 0.0% |
| Communications | 0 | 0.0% |
| Arts & Humanities | 1 | 0.4% |
| Total | 231 | 100.0% |
Transportation & Commute in Warroad
Vehicle Availability by Sex in Warroad
The most prevalent vehicle ownership categories in Warroad are males with 2 vehicles (171, accounting for 35.4%) and females with 2 vehicles (157, making up 45.7%).
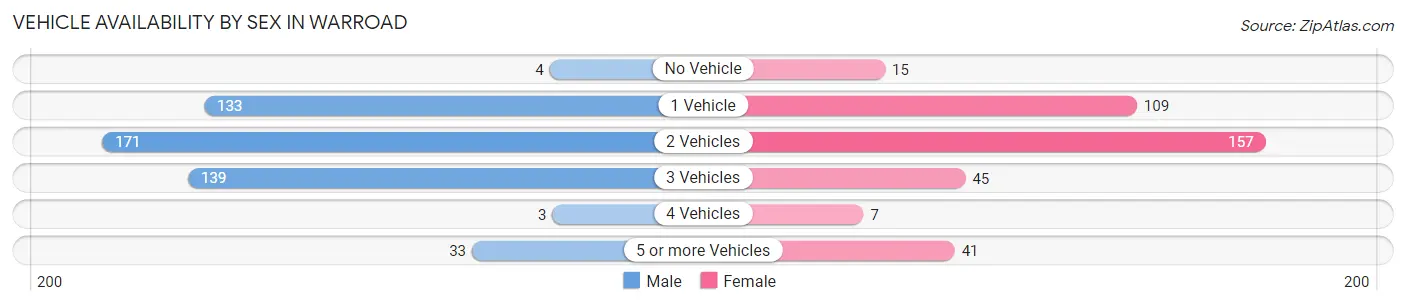
| Vehicles Available | Male | Female |
| No Vehicle | 4 (0.8%) | 15 (4.0%) |
| 1 Vehicle | 133 (27.5%) | 109 (29.1%) |
| 2 Vehicles | 171 (35.4%) | 157 (42.0%) |
| 3 Vehicles | 139 (28.8%) | 45 (12.0%) |
| 4 Vehicles | 3 (0.6%) | 7 (1.9%) |
| 5 or more Vehicles | 33 (6.8%) | 41 (11.0%) |
| Total | 483 (100.0%) | 374 (100.0%) |
Commute Time in Warroad
The most frequently occuring commute durations in Warroad are 5 to 9 minutes (304 commuters, 38.1%), 10 to 14 minutes (124 commuters, 15.6%), and less than 5 minutes (111 commuters, 13.9%).
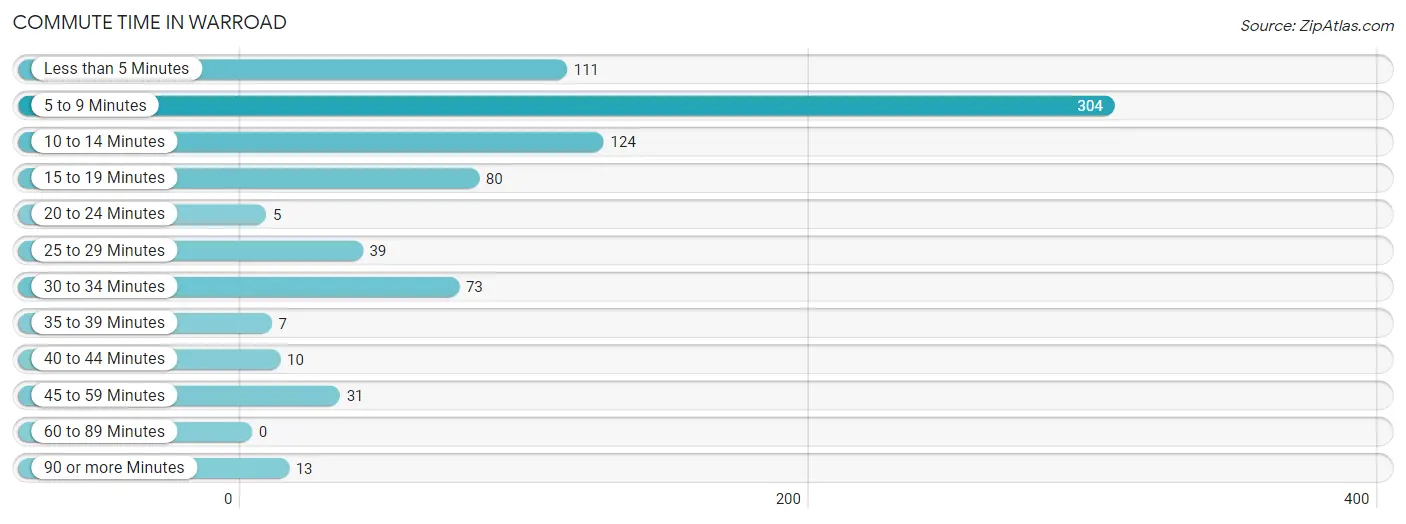
| Commute Time | # Commuters | % Commuters |
| Less than 5 Minutes | 111 | 13.9% |
| 5 to 9 Minutes | 304 | 38.1% |
| 10 to 14 Minutes | 124 | 15.6% |
| 15 to 19 Minutes | 80 | 10.0% |
| 20 to 24 Minutes | 5 | 0.6% |
| 25 to 29 Minutes | 39 | 4.9% |
| 30 to 34 Minutes | 73 | 9.2% |
| 35 to 39 Minutes | 7 | 0.9% |
| 40 to 44 Minutes | 10 | 1.3% |
| 45 to 59 Minutes | 31 | 3.9% |
| 60 to 89 Minutes | 0 | 0.0% |
| 90 or more Minutes | 13 | 1.6% |
Commute Time by Sex in Warroad
The most common commute times in Warroad are 5 to 9 minutes (133 commuters, 29.2%) for males and 5 to 9 minutes (171 commuters, 50.1%) for females.
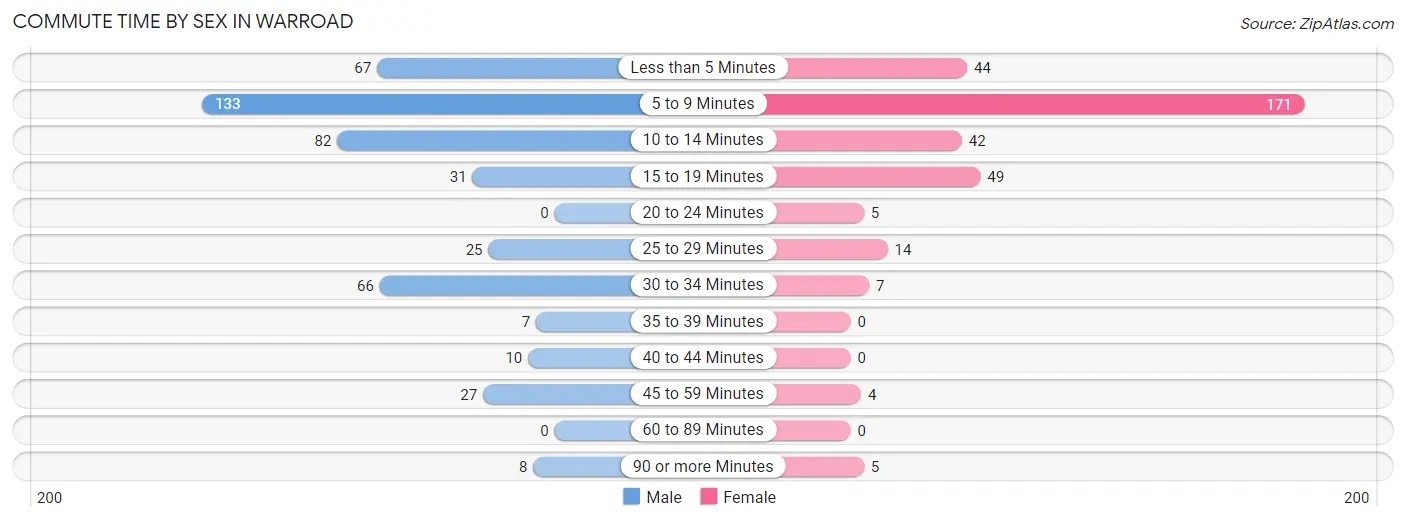
| Commute Time | Male | Female |
| Less than 5 Minutes | 67 (14.7%) | 44 (12.9%) |
| 5 to 9 Minutes | 133 (29.2%) | 171 (50.1%) |
| 10 to 14 Minutes | 82 (18.0%) | 42 (12.3%) |
| 15 to 19 Minutes | 31 (6.8%) | 49 (14.4%) |
| 20 to 24 Minutes | 0 (0.0%) | 5 (1.5%) |
| 25 to 29 Minutes | 25 (5.5%) | 14 (4.1%) |
| 30 to 34 Minutes | 66 (14.5%) | 7 (2.1%) |
| 35 to 39 Minutes | 7 (1.5%) | 0 (0.0%) |
| 40 to 44 Minutes | 10 (2.2%) | 0 (0.0%) |
| 45 to 59 Minutes | 27 (5.9%) | 4 (1.2%) |
| 60 to 89 Minutes | 0 (0.0%) | 0 (0.0%) |
| 90 or more Minutes | 8 (1.8%) | 5 (1.5%) |
Time of Departure to Work by Sex in Warroad
The most frequent times of departure to work in Warroad are 6:00 AM to 6:29 AM (78, 17.1%) for males and 7:30 AM to 7:59 AM (95, 27.9%) for females.
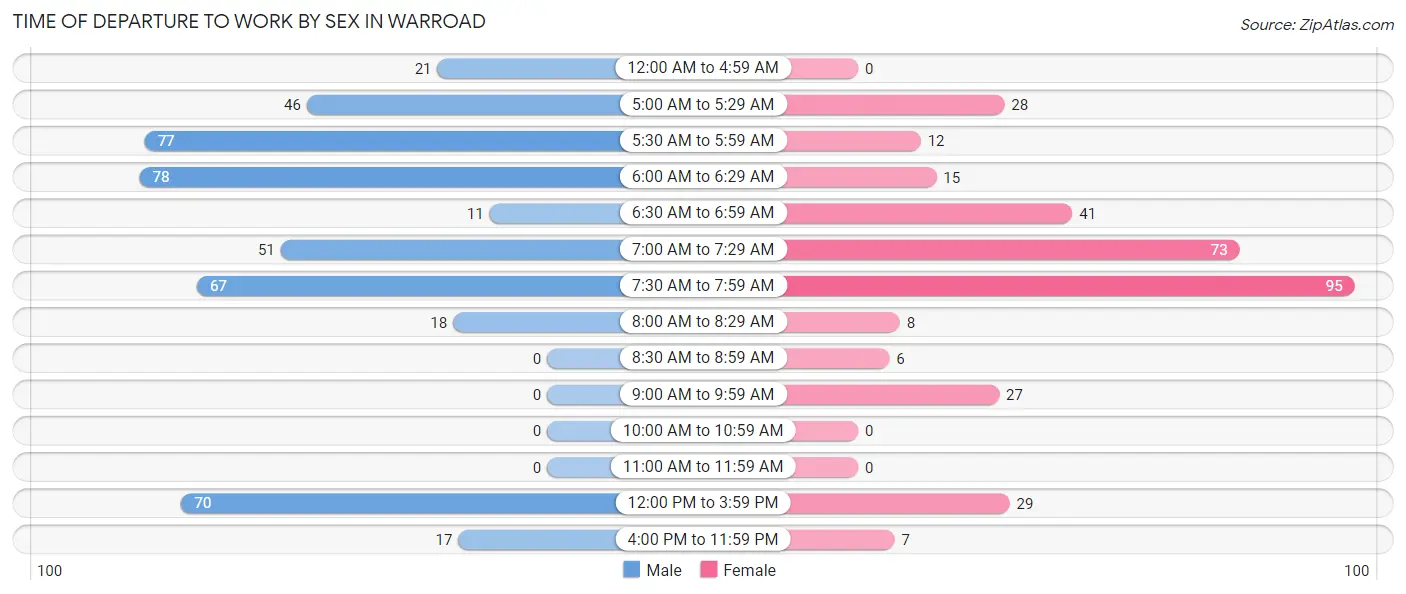
| Time of Departure | Male | Female |
| 12:00 AM to 4:59 AM | 21 (4.6%) | 0 (0.0%) |
| 5:00 AM to 5:29 AM | 46 (10.1%) | 28 (8.2%) |
| 5:30 AM to 5:59 AM | 77 (16.9%) | 12 (3.5%) |
| 6:00 AM to 6:29 AM | 78 (17.1%) | 15 (4.4%) |
| 6:30 AM to 6:59 AM | 11 (2.4%) | 41 (12.0%) |
| 7:00 AM to 7:29 AM | 51 (11.2%) | 73 (21.4%) |
| 7:30 AM to 7:59 AM | 67 (14.7%) | 95 (27.9%) |
| 8:00 AM to 8:29 AM | 18 (4.0%) | 8 (2.4%) |
| 8:30 AM to 8:59 AM | 0 (0.0%) | 6 (1.8%) |
| 9:00 AM to 9:59 AM | 0 (0.0%) | 27 (7.9%) |
| 10:00 AM to 10:59 AM | 0 (0.0%) | 0 (0.0%) |
| 11:00 AM to 11:59 AM | 0 (0.0%) | 0 (0.0%) |
| 12:00 PM to 3:59 PM | 70 (15.3%) | 29 (8.5%) |
| 4:00 PM to 11:59 PM | 17 (3.7%) | 7 (2.1%) |
| Total | 456 (100.0%) | 341 (100.0%) |
Housing Occupancy in Warroad
Occupancy by Ownership in Warroad
Of the total 772 dwellings in Warroad, owner-occupied units account for 395 (51.2%), while renter-occupied units make up 377 (48.8%).
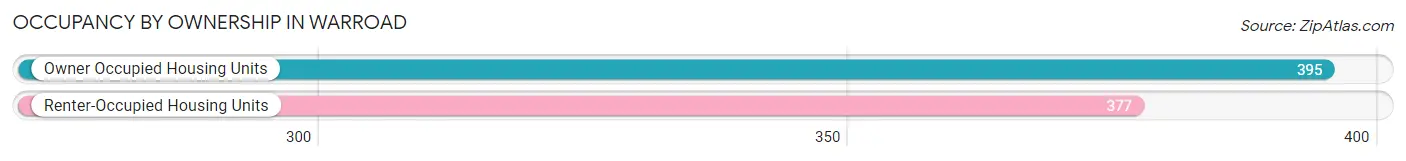
| Occupancy | # Housing Units | % Housing Units |
| Owner Occupied Housing Units | 395 | 51.2% |
| Renter-Occupied Housing Units | 377 | 48.8% |
| Total Occupied Housing Units | 772 | 100.0% |
Occupancy by Household Size in Warroad
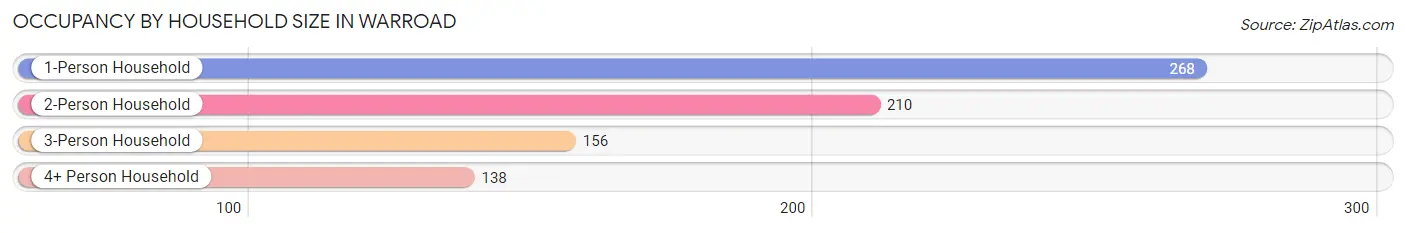
| Household Size | # Housing Units | % Housing Units |
| 1-Person Household | 268 | 34.7% |
| 2-Person Household | 210 | 27.2% |
| 3-Person Household | 156 | 20.2% |
| 4+ Person Household | 138 | 17.9% |
| Total Housing Units | 772 | 100.0% |
Occupancy by Ownership by Household Size in Warroad
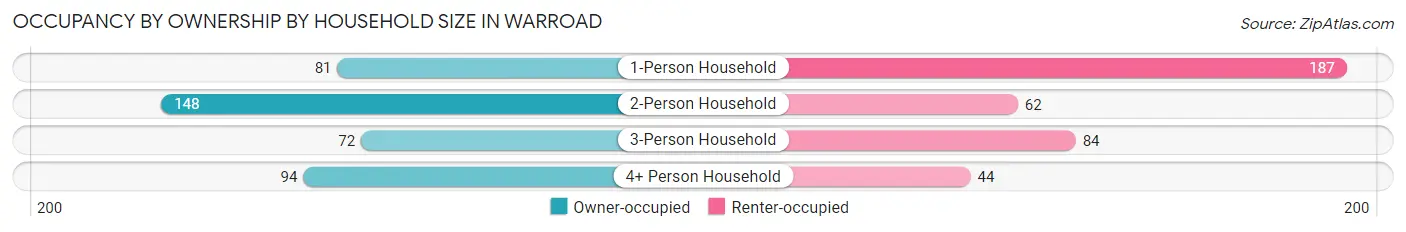
| Household Size | Owner-occupied | Renter-occupied |
| 1-Person Household | 81 (30.2%) | 187 (69.8%) |
| 2-Person Household | 148 (70.5%) | 62 (29.5%) |
| 3-Person Household | 72 (46.2%) | 84 (53.8%) |
| 4+ Person Household | 94 (68.1%) | 44 (31.9%) |
| Total Housing Units | 395 (51.2%) | 377 (48.8%) |
Occupancy by Educational Attainment in Warroad
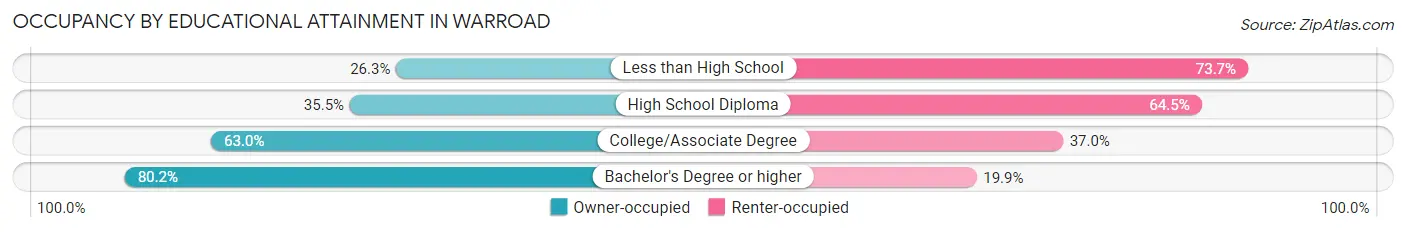
| Household Size | Owner-occupied | Renter-occupied |
| Less than High School | 30 (26.3%) | 84 (73.7%) |
| High School Diploma | 93 (35.5%) | 169 (64.5%) |
| College/Associate Degree | 167 (63.0%) | 98 (37.0%) |
| Bachelor's Degree or higher | 105 (80.1%) | 26 (19.9%) |
Occupancy by Age of Householder in Warroad
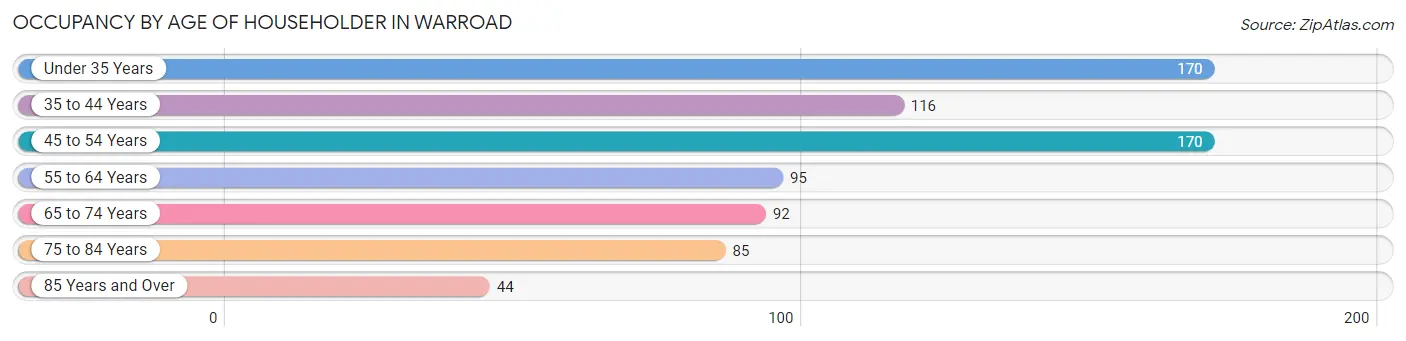
| Age Bracket | # Households | % Households |
| Under 35 Years | 170 | 22.0% |
| 35 to 44 Years | 116 | 15.0% |
| 45 to 54 Years | 170 | 22.0% |
| 55 to 64 Years | 95 | 12.3% |
| 65 to 74 Years | 92 | 11.9% |
| 75 to 84 Years | 85 | 11.0% |
| 85 Years and Over | 44 | 5.7% |
| Total | 772 | 100.0% |
Housing Finances in Warroad
Median Income by Occupancy in Warroad
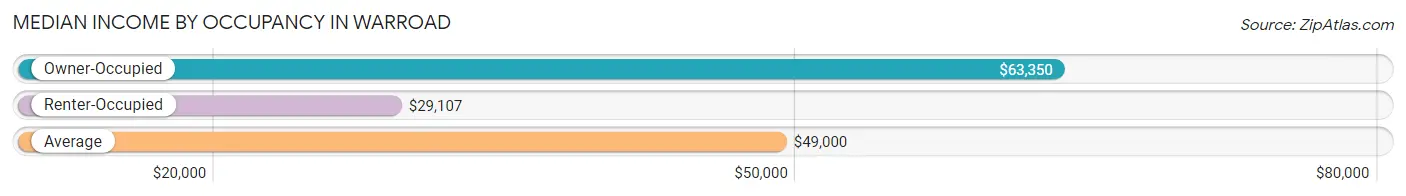
| Occupancy Type | # Households | Median Income |
| Owner-Occupied | 395 (51.2%) | $63,350 |
| Renter-Occupied | 377 (48.8%) | $29,107 |
| Average | 772 (100.0%) | $49,000 |
Occupancy by Householder Income Bracket in Warroad
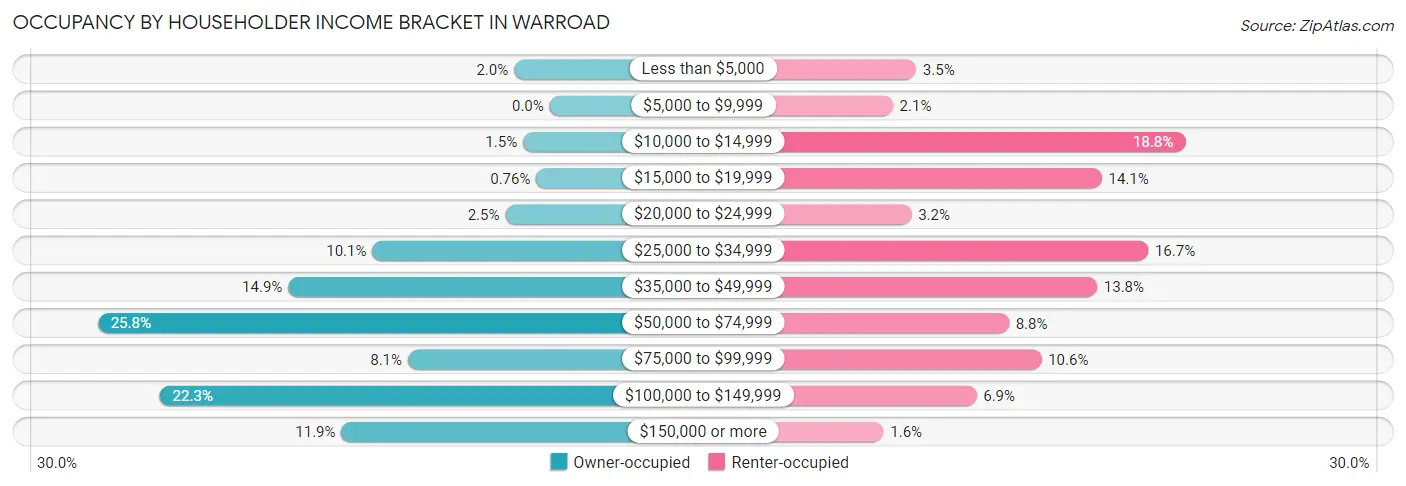
| Income Bracket | Owner-occupied | Renter-occupied |
| Less than $5,000 | 8 (2.0%) | 13 (3.5%) |
| $5,000 to $9,999 | 0 (0.0%) | 8 (2.1%) |
| $10,000 to $14,999 | 6 (1.5%) | 71 (18.8%) |
| $15,000 to $19,999 | 3 (0.8%) | 53 (14.1%) |
| $20,000 to $24,999 | 10 (2.5%) | 12 (3.2%) |
| $25,000 to $34,999 | 40 (10.1%) | 63 (16.7%) |
| $35,000 to $49,999 | 59 (14.9%) | 52 (13.8%) |
| $50,000 to $74,999 | 102 (25.8%) | 33 (8.7%) |
| $75,000 to $99,999 | 32 (8.1%) | 40 (10.6%) |
| $100,000 to $149,999 | 88 (22.3%) | 26 (6.9%) |
| $150,000 or more | 47 (11.9%) | 6 (1.6%) |
| Total | 395 (100.0%) | 377 (100.0%) |
Monthly Housing Cost Tiers in Warroad
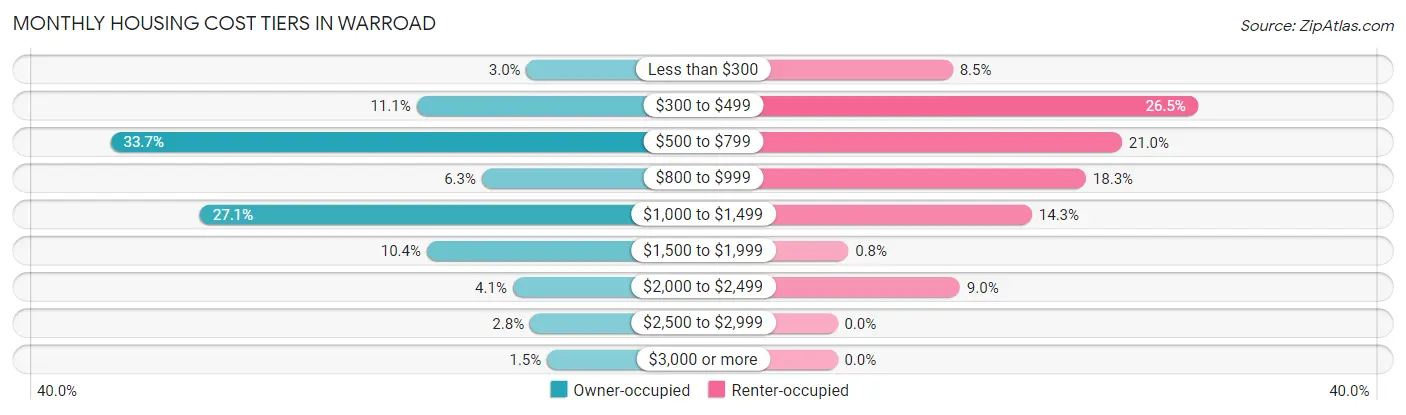
| Monthly Cost | Owner-occupied | Renter-occupied |
| Less than $300 | 12 (3.0%) | 32 (8.5%) |
| $300 to $499 | 44 (11.1%) | 100 (26.5%) |
| $500 to $799 | 133 (33.7%) | 79 (20.9%) |
| $800 to $999 | 25 (6.3%) | 69 (18.3%) |
| $1,000 to $1,499 | 107 (27.1%) | 54 (14.3%) |
| $1,500 to $1,999 | 41 (10.4%) | 3 (0.8%) |
| $2,000 to $2,499 | 16 (4.1%) | 34 (9.0%) |
| $2,500 to $2,999 | 11 (2.8%) | 0 (0.0%) |
| $3,000 or more | 6 (1.5%) | 0 (0.0%) |
| Total | 395 (100.0%) | 377 (100.0%) |
Physical Housing Characteristics in Warroad
Housing Structures in Warroad
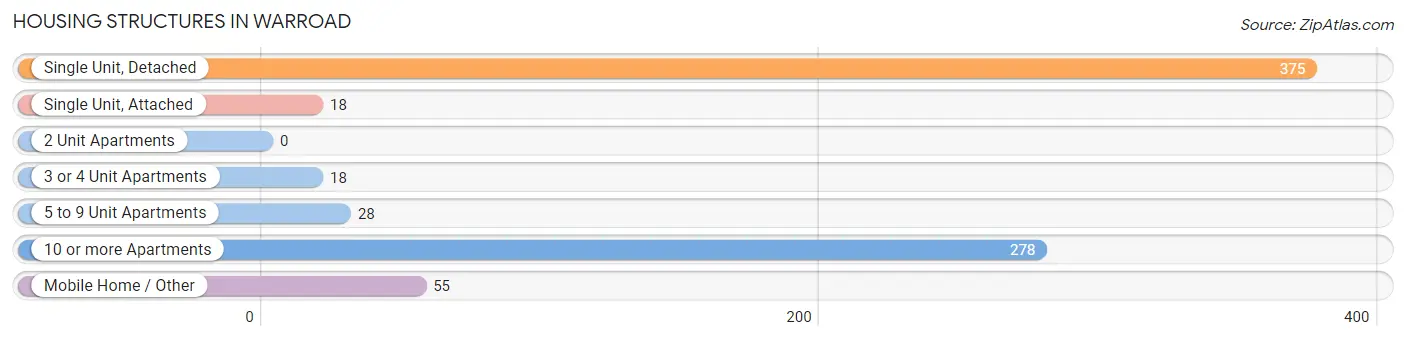
| Structure Type | # Housing Units | % Housing Units |
| Single Unit, Detached | 375 | 48.6% |
| Single Unit, Attached | 18 | 2.3% |
| 2 Unit Apartments | 0 | 0.0% |
| 3 or 4 Unit Apartments | 18 | 2.3% |
| 5 to 9 Unit Apartments | 28 | 3.6% |
| 10 or more Apartments | 278 | 36.0% |
| Mobile Home / Other | 55 | 7.1% |
| Total | 772 | 100.0% |
Housing Structures by Occupancy in Warroad
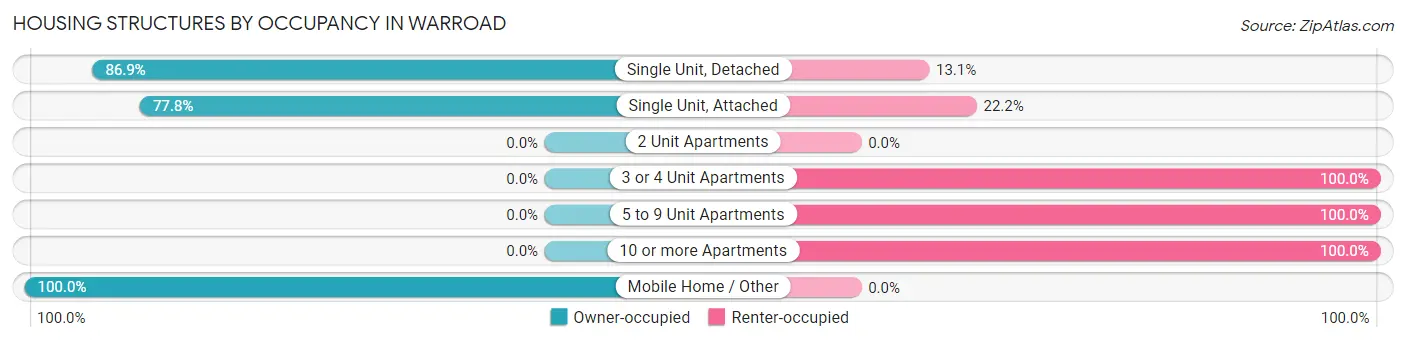
| Structure Type | Owner-occupied | Renter-occupied |
| Single Unit, Detached | 326 (86.9%) | 49 (13.1%) |
| Single Unit, Attached | 14 (77.8%) | 4 (22.2%) |
| 2 Unit Apartments | 0 (0.0%) | 0 (0.0%) |
| 3 or 4 Unit Apartments | 0 (0.0%) | 18 (100.0%) |
| 5 to 9 Unit Apartments | 0 (0.0%) | 28 (100.0%) |
| 10 or more Apartments | 0 (0.0%) | 278 (100.0%) |
| Mobile Home / Other | 55 (100.0%) | 0 (0.0%) |
| Total | 395 (51.2%) | 377 (48.8%) |
Housing Structures by Number of Rooms in Warroad
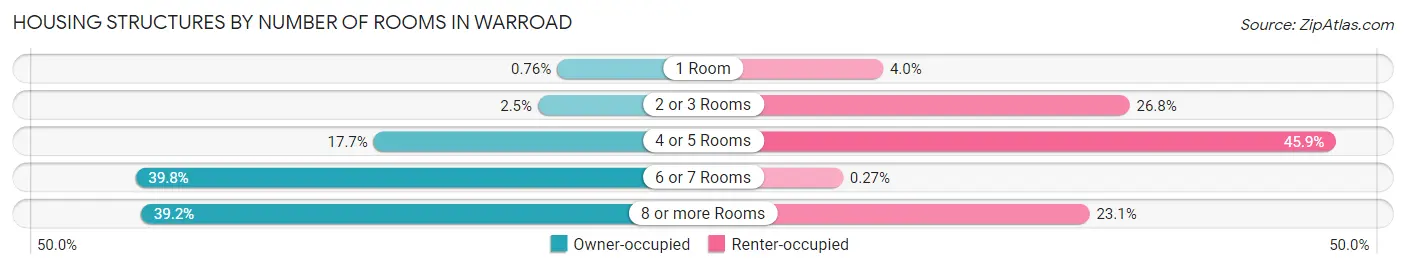
| Number of Rooms | Owner-occupied | Renter-occupied |
| 1 Room | 3 (0.8%) | 15 (4.0%) |
| 2 or 3 Rooms | 10 (2.5%) | 101 (26.8%) |
| 4 or 5 Rooms | 70 (17.7%) | 173 (45.9%) |
| 6 or 7 Rooms | 157 (39.8%) | 1 (0.3%) |
| 8 or more Rooms | 155 (39.2%) | 87 (23.1%) |
| Total | 395 (100.0%) | 377 (100.0%) |
Housing Structure by Heating Type in Warroad
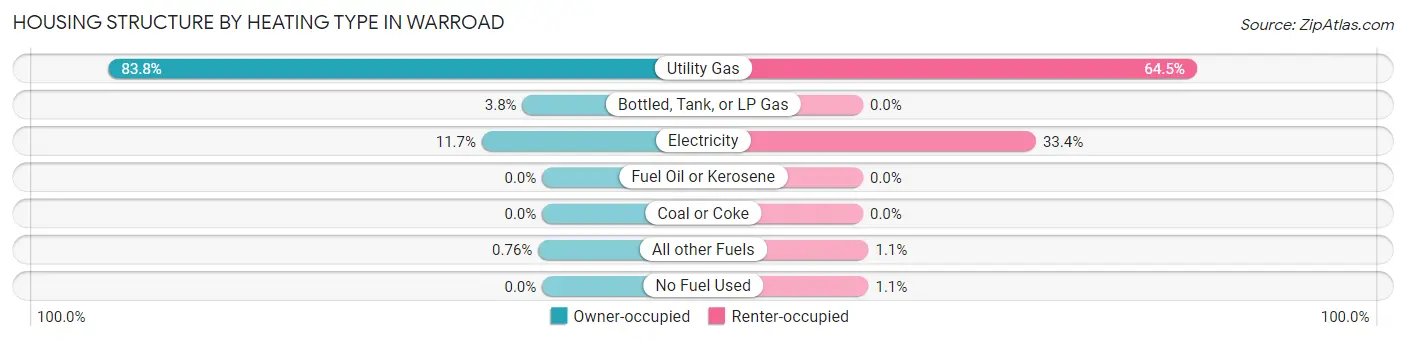
| Heating Type | Owner-occupied | Renter-occupied |
| Utility Gas | 331 (83.8%) | 243 (64.5%) |
| Bottled, Tank, or LP Gas | 15 (3.8%) | 0 (0.0%) |
| Electricity | 46 (11.7%) | 126 (33.4%) |
| Fuel Oil or Kerosene | 0 (0.0%) | 0 (0.0%) |
| Coal or Coke | 0 (0.0%) | 0 (0.0%) |
| All other Fuels | 3 (0.8%) | 4 (1.1%) |
| No Fuel Used | 0 (0.0%) | 4 (1.1%) |
| Total | 395 (100.0%) | 377 (100.0%) |
Household Vehicle Usage in Warroad
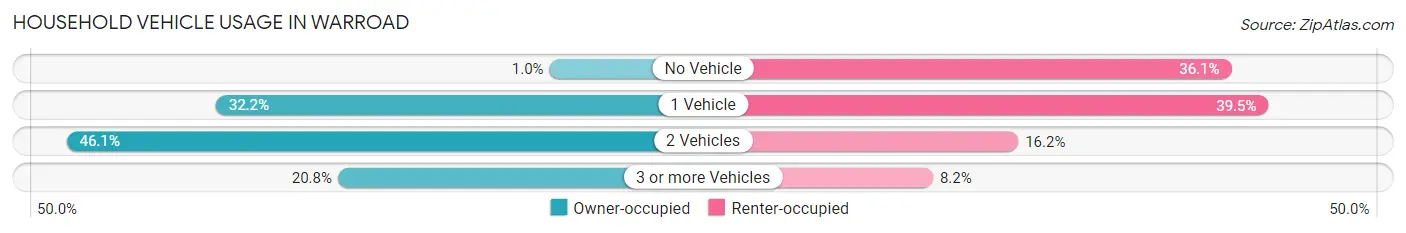
| Vehicles per Household | Owner-occupied | Renter-occupied |
| No Vehicle | 4 (1.0%) | 136 (36.1%) |
| 1 Vehicle | 127 (32.2%) | 149 (39.5%) |
| 2 Vehicles | 182 (46.1%) | 61 (16.2%) |
| 3 or more Vehicles | 82 (20.8%) | 31 (8.2%) |
| Total | 395 (100.0%) | 377 (100.0%) |
Real Estate & Mortgages in Warroad
Real Estate and Mortgage Overview in Warroad
| Characteristic | Without Mortgage | With Mortgage |
| Housing Units | 168 | 227 |
| Median Property Value | $157,500 | $175,900 |
| Median Household Income | $58,393 | $25 |
| Monthly Housing Costs | $545 | $6 |
| Real Estate Taxes | $1,250 | $4 |
Property Value by Mortgage Status in Warroad
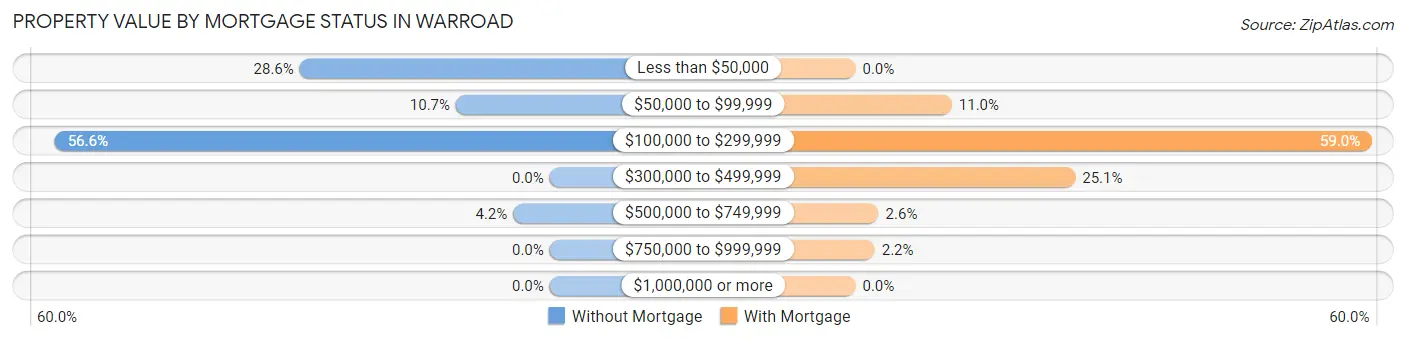
| Property Value | Without Mortgage | With Mortgage |
| Less than $50,000 | 48 (28.6%) | 0 (0.0%) |
| $50,000 to $99,999 | 18 (10.7%) | 25 (11.0%) |
| $100,000 to $299,999 | 95 (56.6%) | 134 (59.0%) |
| $300,000 to $499,999 | 0 (0.0%) | 57 (25.1%) |
| $500,000 to $749,999 | 7 (4.2%) | 6 (2.6%) |
| $750,000 to $999,999 | 0 (0.0%) | 5 (2.2%) |
| $1,000,000 or more | 0 (0.0%) | 0 (0.0%) |
| Total | 168 (100.0%) | 227 (100.0%) |
Household Income by Mortgage Status in Warroad
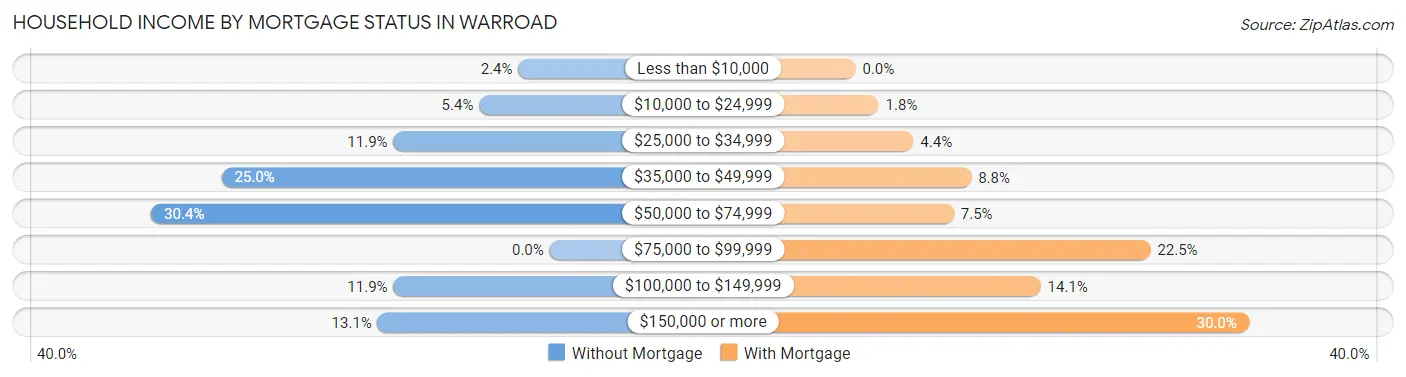
| Household Income | Without Mortgage | With Mortgage |
| Less than $10,000 | 4 (2.4%) | 0 (0.0%) |
| $10,000 to $24,999 | 9 (5.4%) | 4 (1.8%) |
| $25,000 to $34,999 | 20 (11.9%) | 10 (4.4%) |
| $35,000 to $49,999 | 42 (25.0%) | 20 (8.8%) |
| $50,000 to $74,999 | 51 (30.4%) | 17 (7.5%) |
| $75,000 to $99,999 | 0 (0.0%) | 51 (22.5%) |
| $100,000 to $149,999 | 20 (11.9%) | 32 (14.1%) |
| $150,000 or more | 22 (13.1%) | 68 (30.0%) |
| Total | 168 (100.0%) | 227 (100.0%) |
Property Value to Household Income Ratio in Warroad
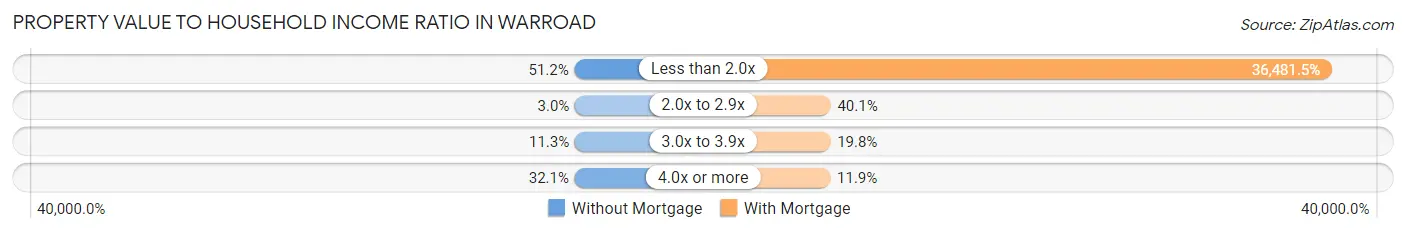
| Value-to-Income Ratio | Without Mortgage | With Mortgage |
| Less than 2.0x | 86 (51.2%) | 82,813 (36,481.5%) |
| 2.0x to 2.9x | 5 (3.0%) | 91 (40.1%) |
| 3.0x to 3.9x | 19 (11.3%) | 45 (19.8%) |
| 4.0x or more | 54 (32.1%) | 27 (11.9%) |
| Total | 168 (100.0%) | 227 (100.0%) |
Real Estate Taxes by Mortgage Status in Warroad
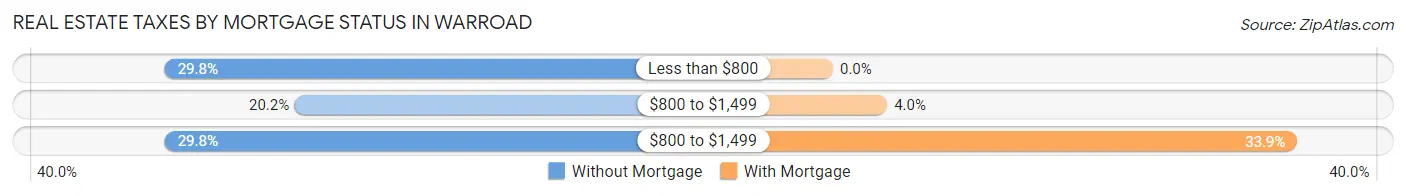
| Property Taxes | Without Mortgage | With Mortgage |
| Less than $800 | 50 (29.8%) | 0 (0.0%) |
| $800 to $1,499 | 34 (20.2%) | 9 (4.0%) |
| $800 to $1,499 | 50 (29.8%) | 77 (33.9%) |
| Total | 168 (100.0%) | 227 (100.0%) |
Health & Disability in Warroad
Health Insurance Coverage by Age in Warroad
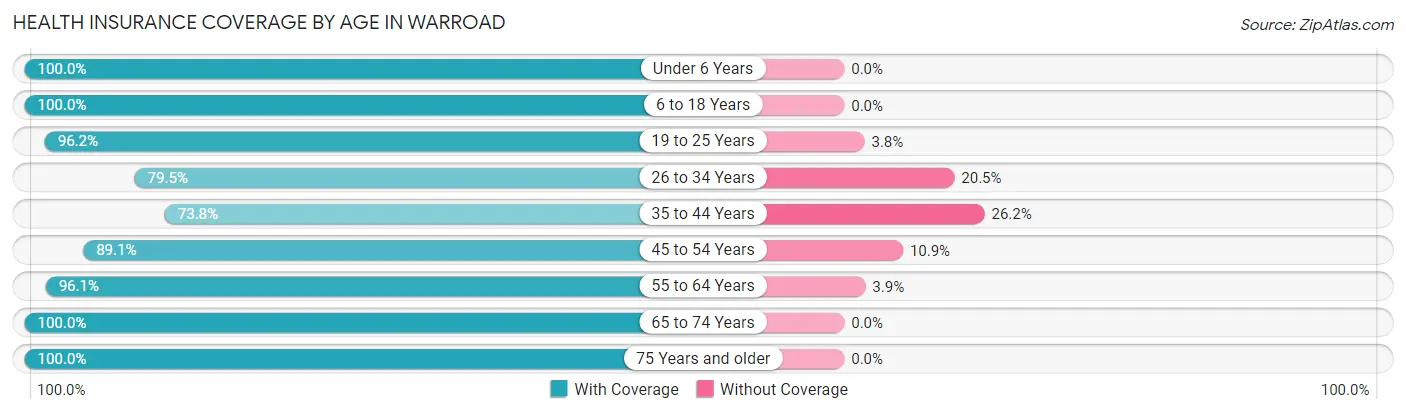
| Age Bracket | With Coverage | Without Coverage |
| Under 6 Years | 134 (100.0%) | 0 (0.0%) |
| 6 to 18 Years | 385 (100.0%) | 0 (0.0%) |
| 19 to 25 Years | 229 (96.2%) | 9 (3.8%) |
| 26 to 34 Years | 151 (79.5%) | 39 (20.5%) |
| 35 to 44 Years | 206 (73.8%) | 73 (26.2%) |
| 45 to 54 Years | 236 (89.1%) | 29 (10.9%) |
| 55 to 64 Years | 195 (96.1%) | 8 (3.9%) |
| 65 to 74 Years | 140 (100.0%) | 0 (0.0%) |
| 75 Years and older | 184 (100.0%) | 0 (0.0%) |
| Total | 1,860 (92.2%) | 158 (7.8%) |
Health Insurance Coverage by Citizenship Status in Warroad
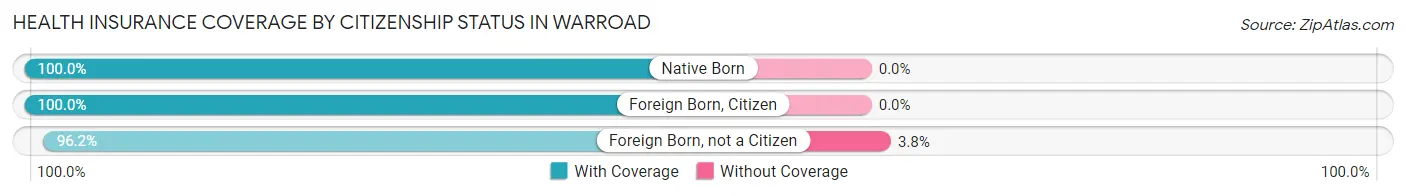
| Citizenship Status | With Coverage | Without Coverage |
| Native Born | 134 (100.0%) | 0 (0.0%) |
| Foreign Born, Citizen | 385 (100.0%) | 0 (0.0%) |
| Foreign Born, not a Citizen | 229 (96.2%) | 9 (3.8%) |
Health Insurance Coverage by Household Income in Warroad
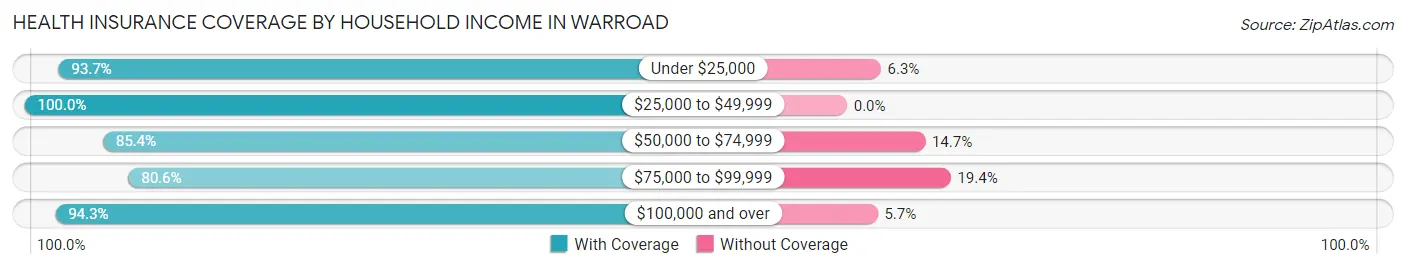
| Household Income | With Coverage | Without Coverage |
| Under $25,000 | 251 (93.7%) | 17 (6.3%) |
| $25,000 to $49,999 | 387 (100.0%) | 0 (0.0%) |
| $50,000 to $74,999 | 233 (85.4%) | 40 (14.6%) |
| $75,000 to $99,999 | 228 (80.6%) | 55 (19.4%) |
| $100,000 and over | 756 (94.3%) | 46 (5.7%) |
Public vs Private Health Insurance Coverage by Age in Warroad
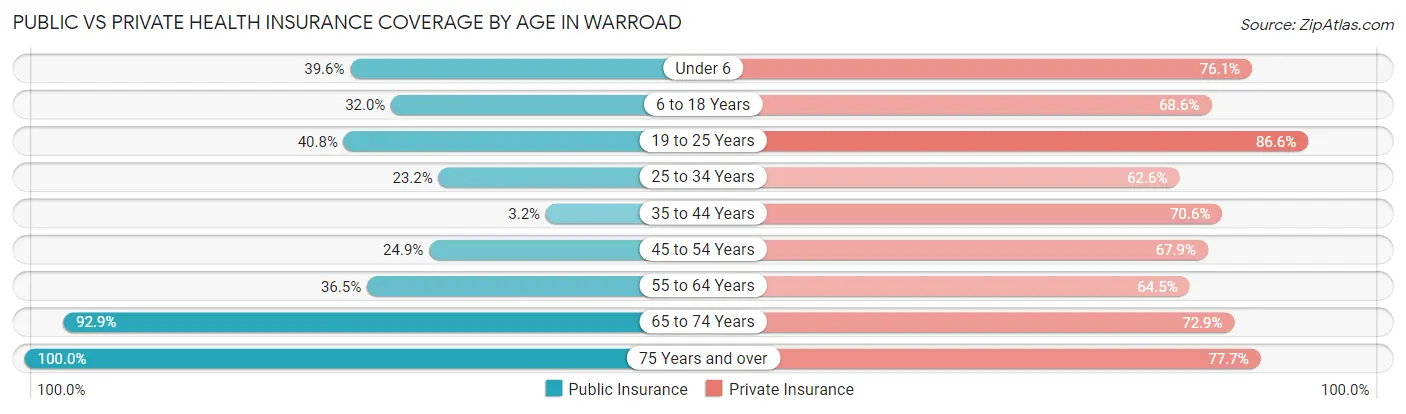
| Age Bracket | Public Insurance | Private Insurance |
| Under 6 | 53 (39.6%) | 102 (76.1%) |
| 6 to 18 Years | 123 (32.0%) | 264 (68.6%) |
| 19 to 25 Years | 97 (40.8%) | 206 (86.6%) |
| 25 to 34 Years | 44 (23.2%) | 119 (62.6%) |
| 35 to 44 Years | 9 (3.2%) | 197 (70.6%) |
| 45 to 54 Years | 66 (24.9%) | 180 (67.9%) |
| 55 to 64 Years | 74 (36.4%) | 131 (64.5%) |
| 65 to 74 Years | 130 (92.9%) | 102 (72.9%) |
| 75 Years and over | 184 (100.0%) | 143 (77.7%) |
| Total | 780 (38.7%) | 1,444 (71.6%) |
Disability Status by Sex by Age in Warroad
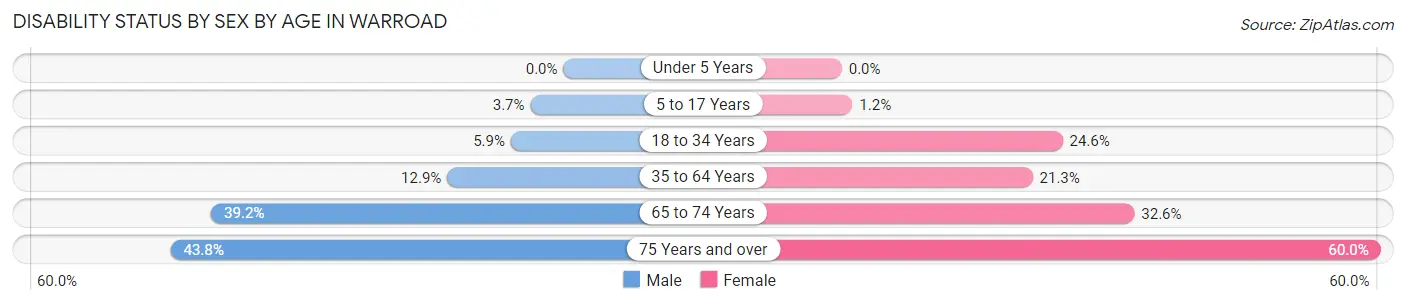
| Age Bracket | Male | Female |
| Under 5 Years | 0 (0.0%) | 0 (0.0%) |
| 5 to 17 Years | 9 (3.7%) | 2 (1.2%) |
| 18 to 34 Years | 11 (5.9%) | 59 (24.6%) |
| 35 to 64 Years | 51 (12.9%) | 75 (21.2%) |
| 65 to 74 Years | 20 (39.2%) | 29 (32.6%) |
| 75 Years and over | 28 (43.8%) | 72 (60.0%) |
Disability Class by Sex by Age in Warroad
Disability Class: Hearing Difficulty
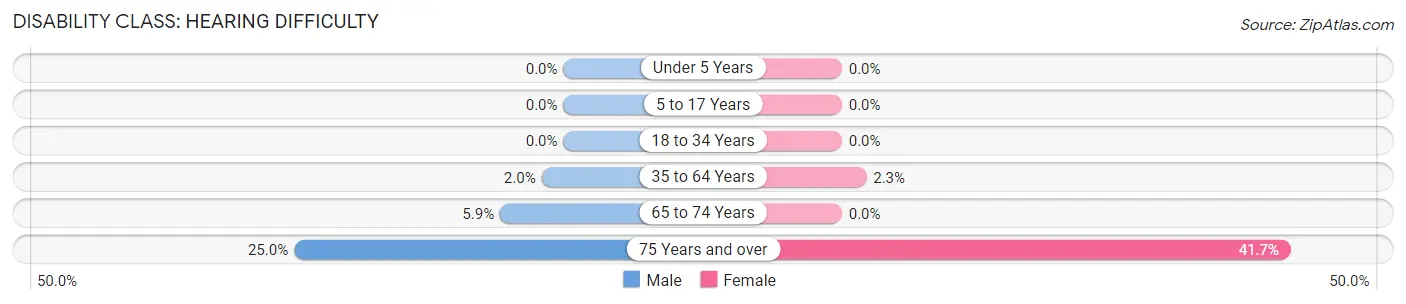
| Age Bracket | Male | Female |
| Under 5 Years | 0 (0.0%) | 0 (0.0%) |
| 5 to 17 Years | 0 (0.0%) | 0 (0.0%) |
| 18 to 34 Years | 0 (0.0%) | 0 (0.0%) |
| 35 to 64 Years | 8 (2.0%) | 8 (2.3%) |
| 65 to 74 Years | 3 (5.9%) | 0 (0.0%) |
| 75 Years and over | 16 (25.0%) | 50 (41.7%) |
Disability Class: Vision Difficulty
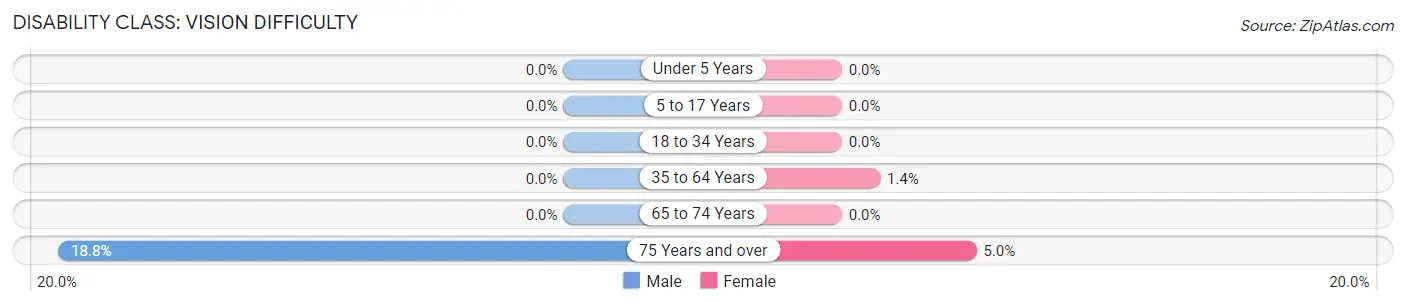
| Age Bracket | Male | Female |
| Under 5 Years | 0 (0.0%) | 0 (0.0%) |
| 5 to 17 Years | 0 (0.0%) | 0 (0.0%) |
| 18 to 34 Years | 0 (0.0%) | 0 (0.0%) |
| 35 to 64 Years | 0 (0.0%) | 5 (1.4%) |
| 65 to 74 Years | 0 (0.0%) | 0 (0.0%) |
| 75 Years and over | 12 (18.8%) | 6 (5.0%) |
Disability Class: Cognitive Difficulty
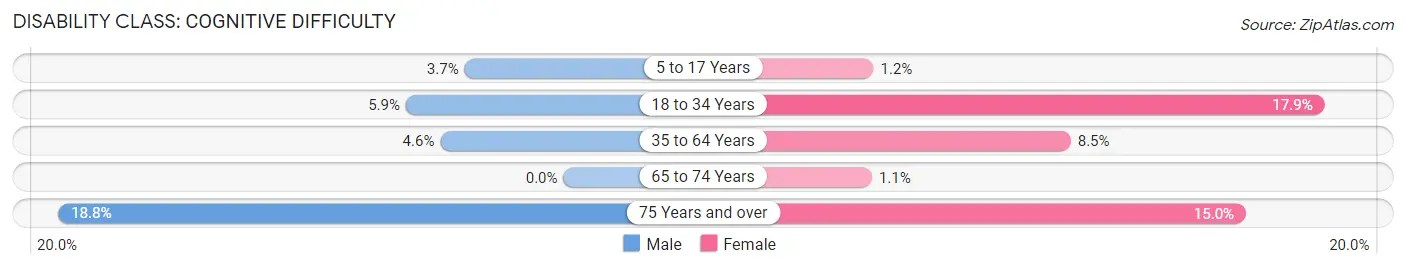
| Age Bracket | Male | Female |
| 5 to 17 Years | 9 (3.7%) | 2 (1.2%) |
| 18 to 34 Years | 11 (5.9%) | 43 (17.9%) |
| 35 to 64 Years | 18 (4.6%) | 30 (8.5%) |
| 65 to 74 Years | 0 (0.0%) | 1 (1.1%) |
| 75 Years and over | 12 (18.8%) | 18 (15.0%) |
Disability Class: Ambulatory Difficulty
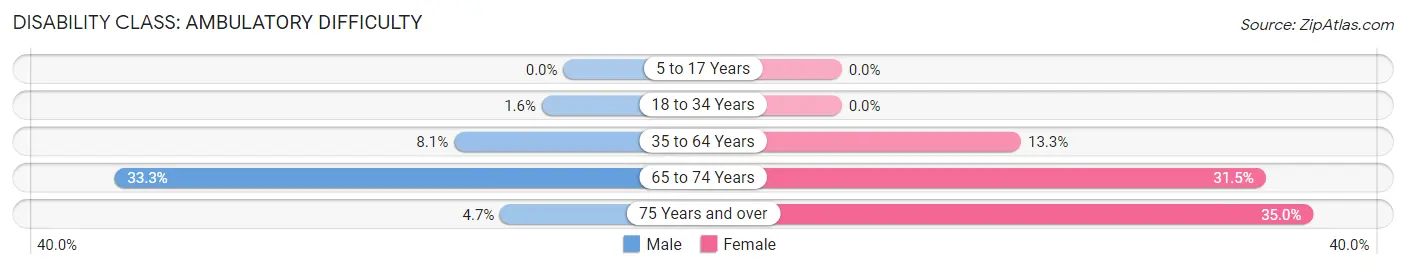
| Age Bracket | Male | Female |
| 5 to 17 Years | 0 (0.0%) | 0 (0.0%) |
| 18 to 34 Years | 3 (1.6%) | 0 (0.0%) |
| 35 to 64 Years | 32 (8.1%) | 47 (13.3%) |
| 65 to 74 Years | 17 (33.3%) | 28 (31.5%) |
| 75 Years and over | 3 (4.7%) | 42 (35.0%) |
Disability Class: Self-Care Difficulty
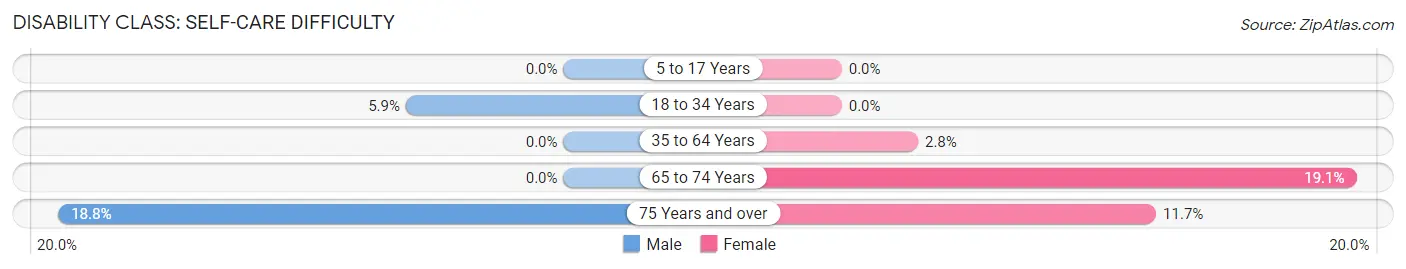
| Age Bracket | Male | Female |
| 5 to 17 Years | 0 (0.0%) | 0 (0.0%) |
| 18 to 34 Years | 11 (5.9%) | 0 (0.0%) |
| 35 to 64 Years | 0 (0.0%) | 10 (2.8%) |
| 65 to 74 Years | 0 (0.0%) | 17 (19.1%) |
| 75 Years and over | 12 (18.8%) | 14 (11.7%) |
Technology Access in Warroad
Computing Device Access in Warroad
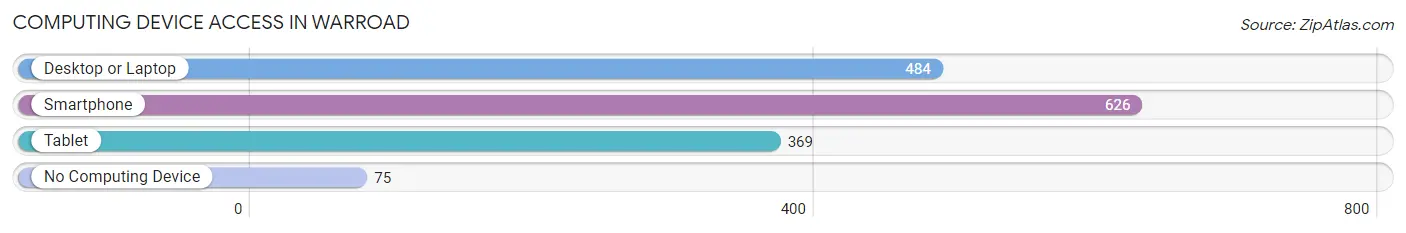
| Device Type | # Households | % Households |
| Desktop or Laptop | 484 | 62.7% |
| Smartphone | 626 | 81.1% |
| Tablet | 369 | 47.8% |
| No Computing Device | 75 | 9.7% |
| Total | 772 | 100.0% |
Internet Access in Warroad
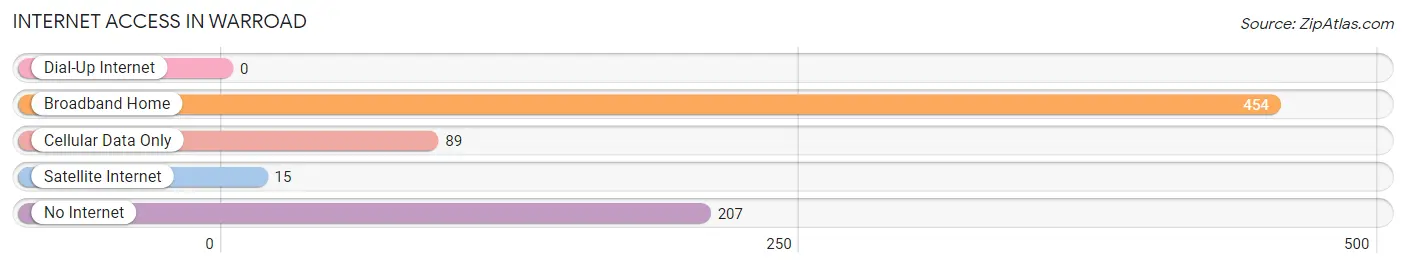
| Internet Type | # Households | % Households |
| Dial-Up Internet | 0 | 0.0% |
| Broadband Home | 454 | 58.8% |
| Cellular Data Only | 89 | 11.5% |
| Satellite Internet | 15 | 1.9% |
| No Internet | 207 | 26.8% |
| Total | 772 | 100.0% |
Warroad Summary
History
The city of Warroad, Minnesota is located in the northwest corner of the state, along the Canadian border. It is the county seat of Roseau County and is situated on the shores of Lake of the Woods. The city was founded in 1887 by the Northern Pacific Railroad and was named after the nearby Warroad River. The city was originally a logging and fishing village, but it soon became a major trading center for the region.
The first settlers in the area were the Ojibwe people, who had been living in the area for centuries. The first European settlers arrived in the late 1800s, and the city was officially incorporated in 1887. The city quickly grew, and by the early 1900s, it had become a major trading center for the region.
The city was also home to a large lumber industry, which provided jobs for many of the residents. The lumber industry was so successful that the city was nicknamed “The Lumber Capital of the World.” The city also had a thriving fishing industry, and it was home to several canneries.
The city was also home to a large Finnish population, and it was known as the “Finnish Capital of the World.” The Finnish culture was very prominent in the city, and it was home to several Finnish-American organizations.
The city was also home to a large military base during World War II. The base was home to the U.S. Army Air Corps and the U.S. Navy. The base was closed in 1945, but it left a lasting impact on the city.
Geography
Warroad is located in the northwest corner of Minnesota, along the Canadian border. It is situated on the shores of Lake of the Woods, and it is the county seat of Roseau County. The city is located in a region of rolling hills and forests, and it is surrounded by several lakes and rivers. The city is located about 70 miles north of Grand Forks, North Dakota, and about 200 miles northwest of Minneapolis.
The city has a total area of 4.2 square miles, and it has a population of 1,781 people, as of the 2010 census. The city is located in a humid continental climate zone, and it has warm summers and cold winters. The average temperature in the summer is around 70 degrees Fahrenheit, and the average temperature in the winter is around 10 degrees Fahrenheit.
Economy
The economy of Warroad is largely based on the lumber industry, which has been a major part of the city’s economy since its founding. The city is home to several lumber mills, and it is also home to several wood-related businesses. The city is also home to several manufacturing companies, and it is a major center for the production of paper products.
The city is also home to several tourism-related businesses, and it is a popular destination for fishing and hunting. The city is also home to several retail stores, and it is a major shopping destination for the region.
Demographics
As of the 2010 census, the population of Warroad was 1,781 people. The racial makeup of the city was 97.2% White, 0.3% African American, 0.3% Native American, 0.3% Asian, 0.1% Pacific Islander, 0.6% from other races, and 1.2% from two or more races. The median household income in the city was $41,250, and the median family income was $50,000. The per capita income in the city was $20,845.
The city is home to a large Finnish-American population, and it is known as the “Finnish Capital of the World.” The city is also home to a large military population, and it is home to several veterans organizations. The city is also home to a large Catholic population, and it is home to several Catholic churches.
Common Questions
What is Per Capita Income in Warroad?
Per Capita income in Warroad is $31,944.
What is the Median Family Income in Warroad?
Median Family Income in Warroad is $55,625.
What is the Median Household income in Warroad?
Median Household Income in Warroad is $49,000.
What is Income or Wage Gap in Warroad?
Income or Wage Gap in Warroad is 30.2%.
Women in Warroad earn 69.8 cents for every dollar earned by a man.
What is Inequality or Gini Index in Warroad?
Inequality or Gini Index in Warroad is 0.51.
What is the Total Population of Warroad?
Total Population of Warroad is 2,076.
What is the Total Male Population of Warroad?
Total Male Population of Warroad is 1,007.
What is the Total Female Population of Warroad?
Total Female Population of Warroad is 1,069.
What is the Ratio of Males per 100 Females in Warroad?
There are 94.20 Males per 100 Females in Warroad.
What is the Ratio of Females per 100 Males in Warroad?
There are 106.16 Females per 100 Males in Warroad.
What is the Median Population Age in Warroad?
Median Population Age in Warroad is 37.7 Years.
What is the Average Family Size in Warroad
Average Family Size in Warroad is 3.1 People.
What is the Average Household Size in Warroad
Average Household Size in Warroad is 2.6 People.
How Large is the Labor Force in Warroad?
There are 947 People in the Labor Forcein in Warroad.
What is the Percentage of People in the Labor Force in Warroad?
59.2% of People are in the Labor Force in Warroad.
What is the Unemployment Rate in Warroad?
Unemployment Rate in Warroad is 7.3%.