Warba, MN Map & Demographics
Warba Map
Warba Overview
$26,314
PER CAPITA INCOME
$55,417
AVG FAMILY INCOME
$44,375
AVG HOUSEHOLD INCOME
13.6%
WAGE / INCOME GAP [ % ]
86.4¢/ $1
WAGE / INCOME GAP [ $ ]
0.44
INEQUALITY / GINI INDEX
161
TOTAL POPULATION
91
MALE POPULATION
70
FEMALE POPULATION
130.00
MALES / 100 FEMALES
76.92
FEMALES / 100 MALES
46.6
MEDIAN AGE
2.9
AVG FAMILY SIZE
2.4
AVG HOUSEHOLD SIZE
67
LABOR FORCE [ PEOPLE ]
54.0%
PERCENT IN LABOR FORCE
10.4%
UNEMPLOYMENT RATE
Warba Zip Codes
Warba Area Codes
Income in Warba
Income Overview in Warba
Per Capita Income in Warba is $26,314, while median incomes of families and households are $55,417 and $44,375 respectively.
| Characteristic | Number | Measure |
| Per Capita Income | 161 | $26,314 |
| Median Family Income | 46 | $55,417 |
| Mean Family Income | 46 | $69,970 |
| Median Household Income | 68 | $44,375 |
| Mean Household Income | 68 | $59,428 |
| Income Deficit | 46 | $0 |
| Wage / Income Gap (%) | 161 | 13.64% |
| Wage / Income Gap ($) | 161 | 86.36¢ per $1 |
| Gini / Inequality Index | 161 | 0.44 |
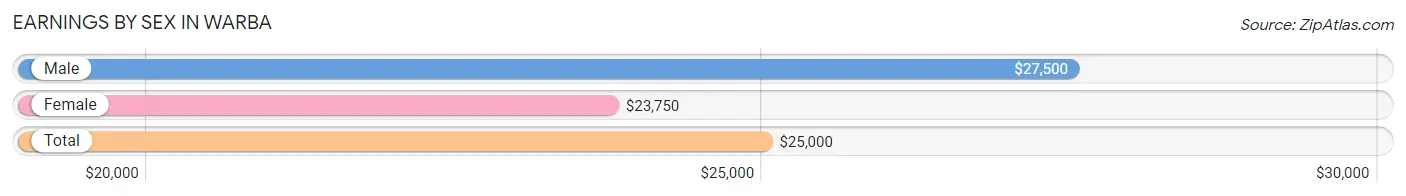
Earnings by Sex in Warba
Average Earnings in Warba are $25,000, $27,500 for men and $23,750 for women, a difference of 13.6%.
| Sex | Number | Average Earnings |
| Male | 40 (58.8%) | $27,500 |
| Female | 28 (41.2%) | $23,750 |
| Total | 68 (100.0%) | $25,000 |
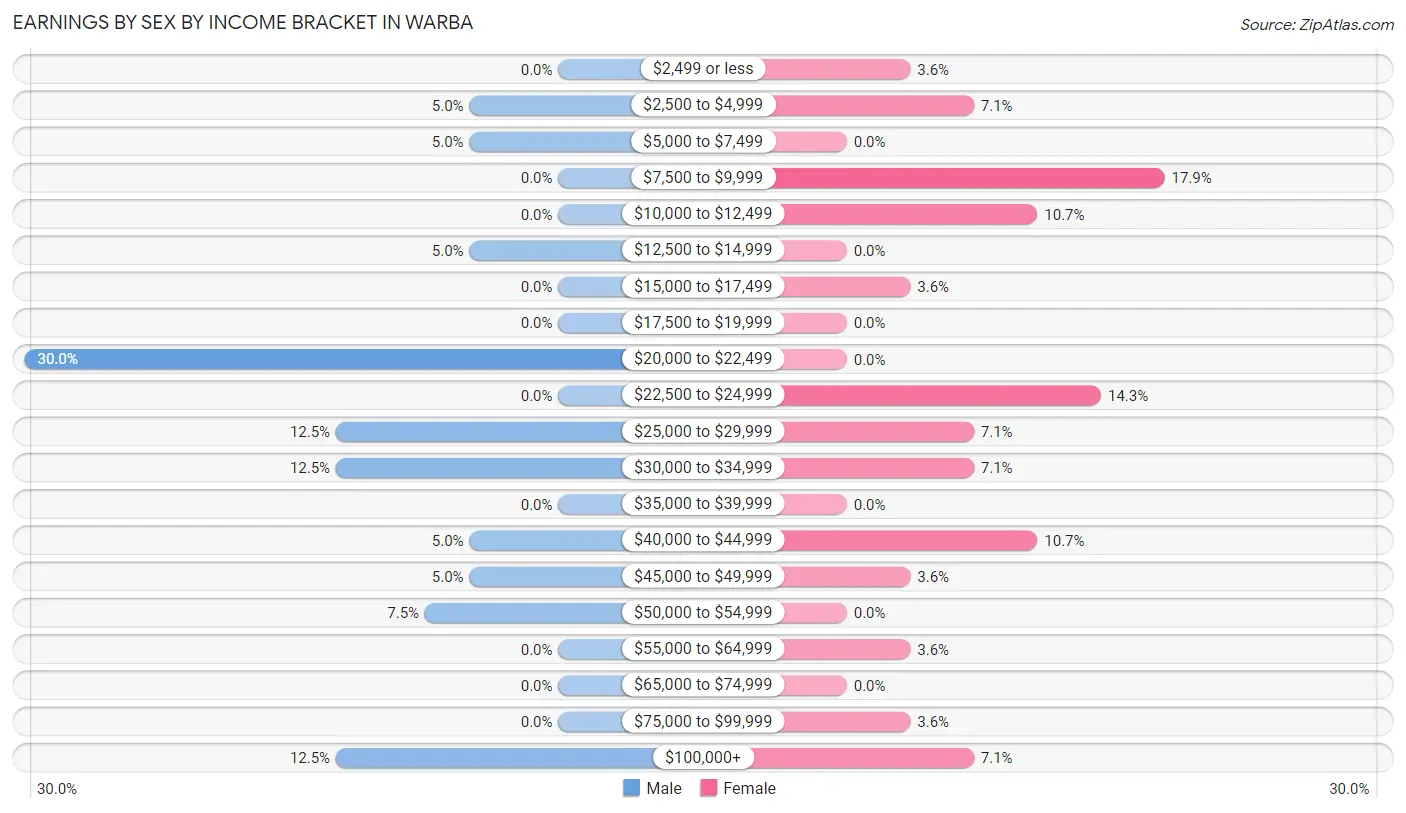
Earnings by Sex by Income Bracket in Warba
The most common earnings brackets in Warba are $20,000 to $22,499 for men (12 | 30.0%) and $7,500 to $9,999 for women (5 | 17.9%).
| Income | Male | Female |
| $2,499 or less | 0 (0.0%) | 1 (3.6%) |
| $2,500 to $4,999 | 2 (5.0%) | 2 (7.1%) |
| $5,000 to $7,499 | 2 (5.0%) | 0 (0.0%) |
| $7,500 to $9,999 | 0 (0.0%) | 5 (17.9%) |
| $10,000 to $12,499 | 0 (0.0%) | 3 (10.7%) |
| $12,500 to $14,999 | 2 (5.0%) | 0 (0.0%) |
| $15,000 to $17,499 | 0 (0.0%) | 1 (3.6%) |
| $17,500 to $19,999 | 0 (0.0%) | 0 (0.0%) |
| $20,000 to $22,499 | 12 (30.0%) | 0 (0.0%) |
| $22,500 to $24,999 | 0 (0.0%) | 4 (14.3%) |
| $25,000 to $29,999 | 5 (12.5%) | 2 (7.1%) |
| $30,000 to $34,999 | 5 (12.5%) | 2 (7.1%) |
| $35,000 to $39,999 | 0 (0.0%) | 0 (0.0%) |
| $40,000 to $44,999 | 2 (5.0%) | 3 (10.7%) |
| $45,000 to $49,999 | 2 (5.0%) | 1 (3.6%) |
| $50,000 to $54,999 | 3 (7.5%) | 0 (0.0%) |
| $55,000 to $64,999 | 0 (0.0%) | 1 (3.6%) |
| $65,000 to $74,999 | 0 (0.0%) | 0 (0.0%) |
| $75,000 to $99,999 | 0 (0.0%) | 1 (3.6%) |
| $100,000+ | 5 (12.5%) | 2 (7.1%) |
| Total | 40 (100.0%) | 28 (100.0%) |
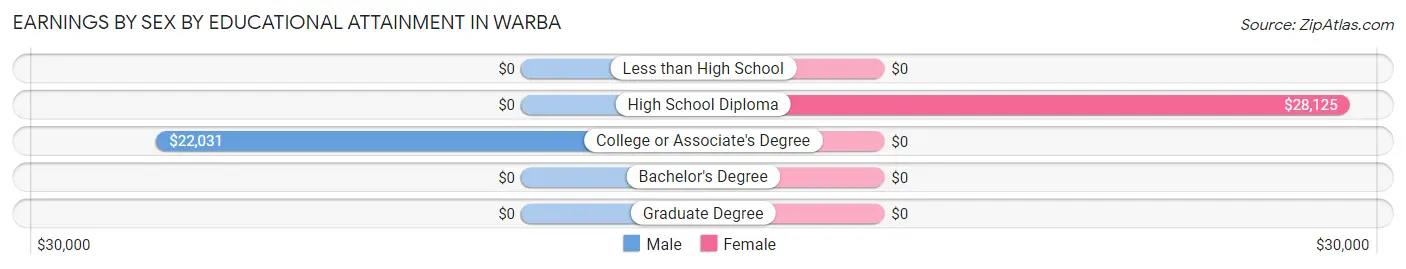
Earnings by Sex by Educational Attainment in Warba
| Educational Attainment | Male Income | Female Income |
| Less than High School | - | - |
| High School Diploma | - | - |
| College or Associate's Degree | $22,031 | $0 |
| Bachelor's Degree | - | - |
| Graduate Degree | - | - |
| Total | $26,875 | $0 |
Family Income in Warba
Family Income Brackets in Warba
According to the Warba family income data, there are 18 families falling into the $50,000 to $74,999 income range, which is the most common income bracket and makes up 39.1% of all families.
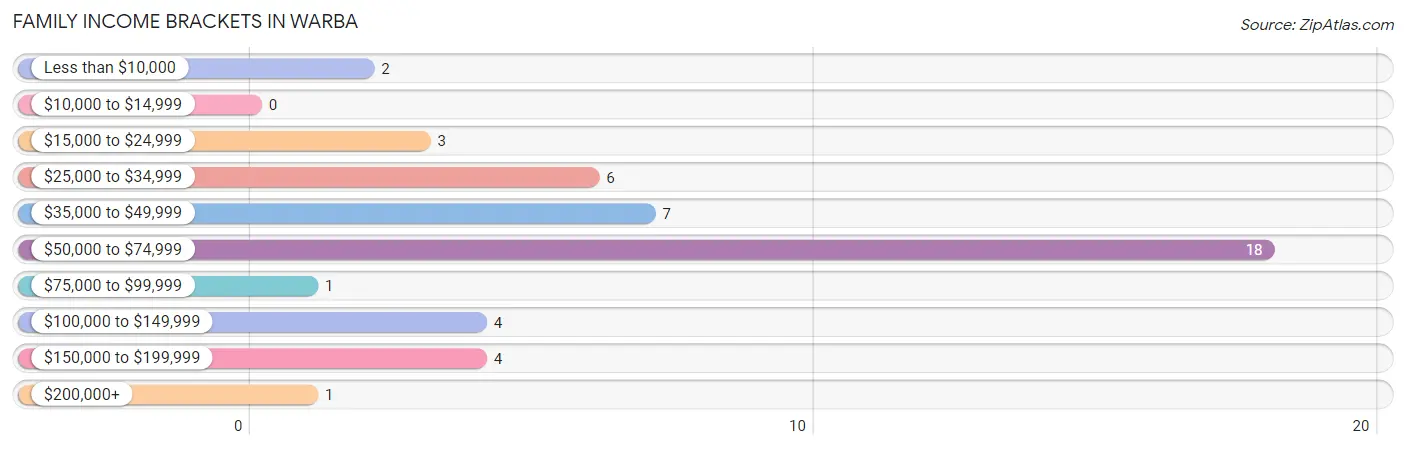
| Income Bracket | # Families | % Families |
| Less than $10,000 | 2 | 4.3% |
| $10,000 to $14,999 | 0 | 0.0% |
| $15,000 to $24,999 | 3 | 6.5% |
| $25,000 to $34,999 | 6 | 13.0% |
| $35,000 to $49,999 | 7 | 15.2% |
| $50,000 to $74,999 | 18 | 39.1% |
| $75,000 to $99,999 | 1 | 2.2% |
| $100,000 to $149,999 | 4 | 8.7% |
| $150,000 to $199,999 | 4 | 8.7% |
| $200,000+ | 1 | 2.2% |
Family Income by Famaliy Size in Warba
2-person families (34 | 73.9%) account for the highest median family income in Warba with $55,417 per family, while 2-person families (34 | 73.9%) have the highest median income of $27,708 per family member.
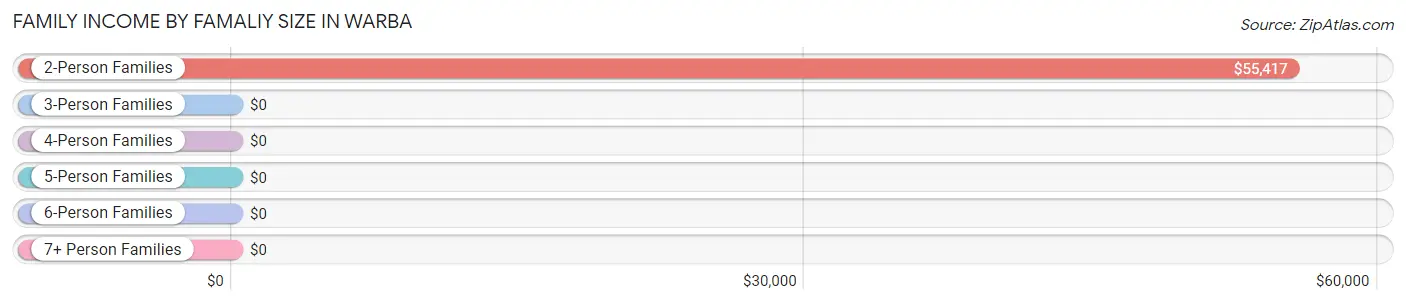
| Income Bracket | # Families | Median Income |
| 2-Person Families | 34 (73.9%) | $55,417 |
| 3-Person Families | 3 (6.5%) | $0 |
| 4-Person Families | 7 (15.2%) | $0 |
| 5-Person Families | 2 (4.3%) | $0 |
| 6-Person Families | 0 (0.0%) | $0 |
| 7+ Person Families | 0 (0.0%) | $0 |
| Total | 46 (100.0%) | $55,417 |
Family Income by Number of Earners in Warba
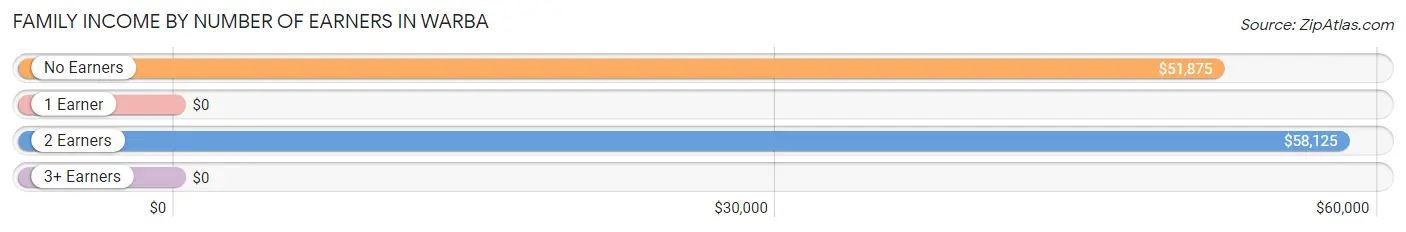
| Number of Earners | # Families | Median Income |
| No Earners | 15 (32.6%) | $51,875 |
| 1 Earner | 16 (34.8%) | $0 |
| 2 Earners | 15 (32.6%) | $58,125 |
| 3+ Earners | 0 (0.0%) | $0 |
| Total | 46 (100.0%) | $55,417 |
Household Income in Warba
Household Income Brackets in Warba
With 19 households falling in the category, the $50,000 to $74,999 income range is the most frequent in Warba, accounting for 27.9% of all households. In contrast, only 1 households (1.5%) fall into the $200,000+ income bracket, making it the least populous group.
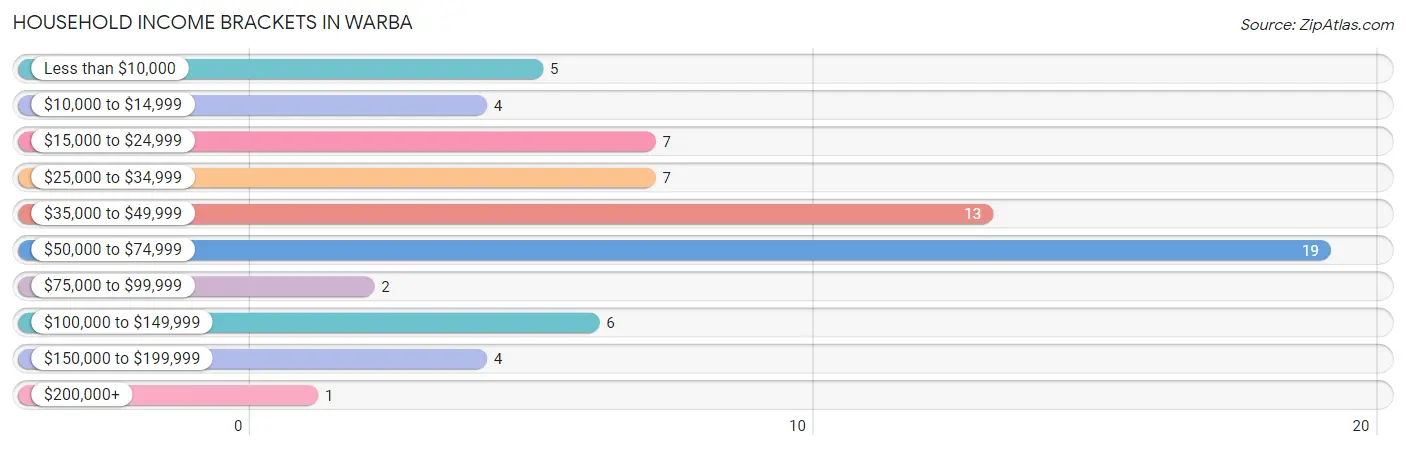
| Income Bracket | # Households | % Households |
| Less than $10,000 | 5 | 7.4% |
| $10,000 to $14,999 | 4 | 5.9% |
| $15,000 to $24,999 | 7 | 10.3% |
| $25,000 to $34,999 | 7 | 10.3% |
| $35,000 to $49,999 | 13 | 19.1% |
| $50,000 to $74,999 | 19 | 27.9% |
| $75,000 to $99,999 | 2 | 2.9% |
| $100,000 to $149,999 | 6 | 8.8% |
| $150,000 to $199,999 | 4 | 5.9% |
| $200,000+ | 1 | 1.5% |
Household Income by Householder Age in Warba
The median household income in Warba is $44,375, with the highest median household income of $48,750 found in the 25 to 44 years age bracket for the primary householder. A total of 14 households (20.6%) fall into this category. Meanwhile, the 15 to 24 years age bracket for the primary householder has the lowest median household income of $0, with 3 households (4.4%) in this group.
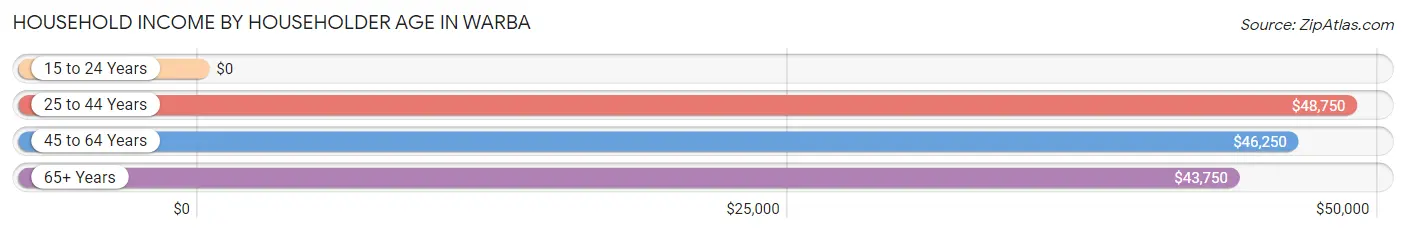
| Income Bracket | # Households | Median Income |
| 15 to 24 Years | 3 (4.4%) | $0 |
| 25 to 44 Years | 14 (20.6%) | $48,750 |
| 45 to 64 Years | 23 (33.8%) | $46,250 |
| 65+ Years | 28 (41.2%) | $43,750 |
| Total | 68 (100.0%) | $44,375 |
Poverty in Warba
Income Below Poverty by Sex and Age in Warba
With 24.2% poverty level for males and 12.9% for females among the residents of Warba, under 5 year old males and 5 year old females are the most vulnerable to poverty, with 15 males (93.8%) and 1 females (100.0%) in their respective age groups living below the poverty level.
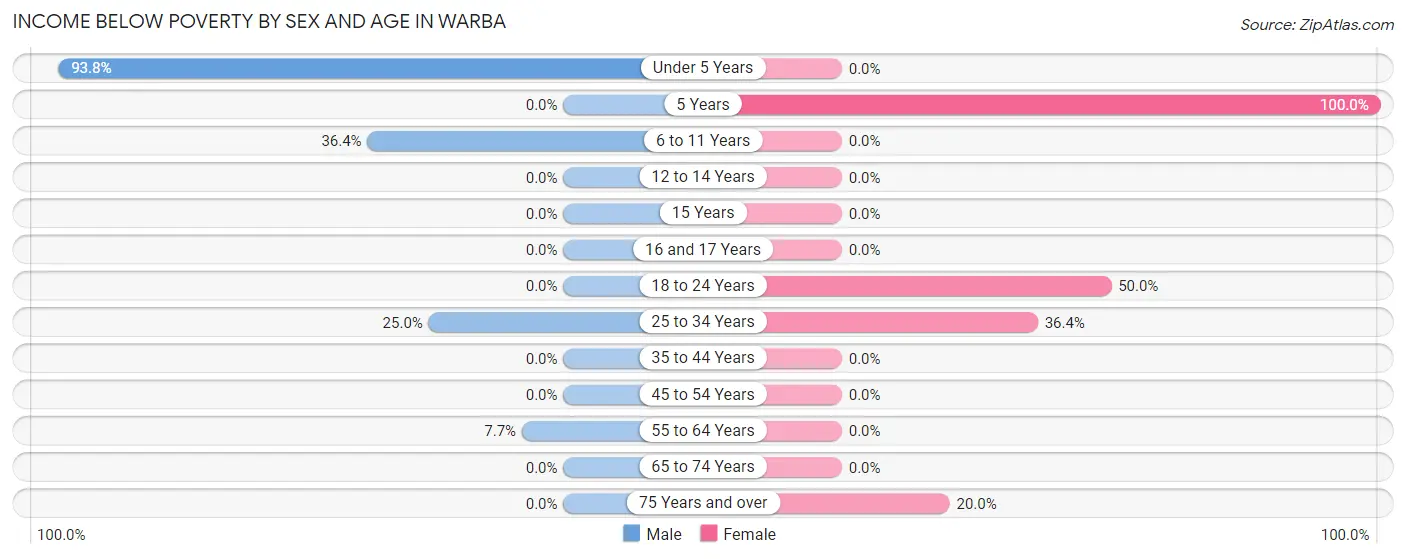
| Age Bracket | Male | Female |
| Under 5 Years | 15 (93.8%) | 0 (0.0%) |
| 5 Years | 0 (0.0%) | 1 (100.0%) |
| 6 to 11 Years | 4 (36.4%) | 0 (0.0%) |
| 12 to 14 Years | 0 (0.0%) | 0 (0.0%) |
| 15 Years | 0 (0.0%) | 0 (0.0%) |
| 16 and 17 Years | 0 (0.0%) | 0 (0.0%) |
| 18 to 24 Years | 0 (0.0%) | 2 (50.0%) |
| 25 to 34 Years | 2 (25.0%) | 4 (36.4%) |
| 35 to 44 Years | 0 (0.0%) | 0 (0.0%) |
| 45 to 54 Years | 0 (0.0%) | 0 (0.0%) |
| 55 to 64 Years | 1 (7.7%) | 0 (0.0%) |
| 65 to 74 Years | 0 (0.0%) | 0 (0.0%) |
| 75 Years and over | 0 (0.0%) | 2 (20.0%) |
| Total | 22 (24.2%) | 9 (12.9%) |
Income Above Poverty by Sex and Age in Warba
According to the poverty statistics in Warba, males aged 12 to 14 years and females aged under 5 years are the age groups that are most secure financially, with 100.0% of males and 100.0% of females in these age groups living above the poverty line.
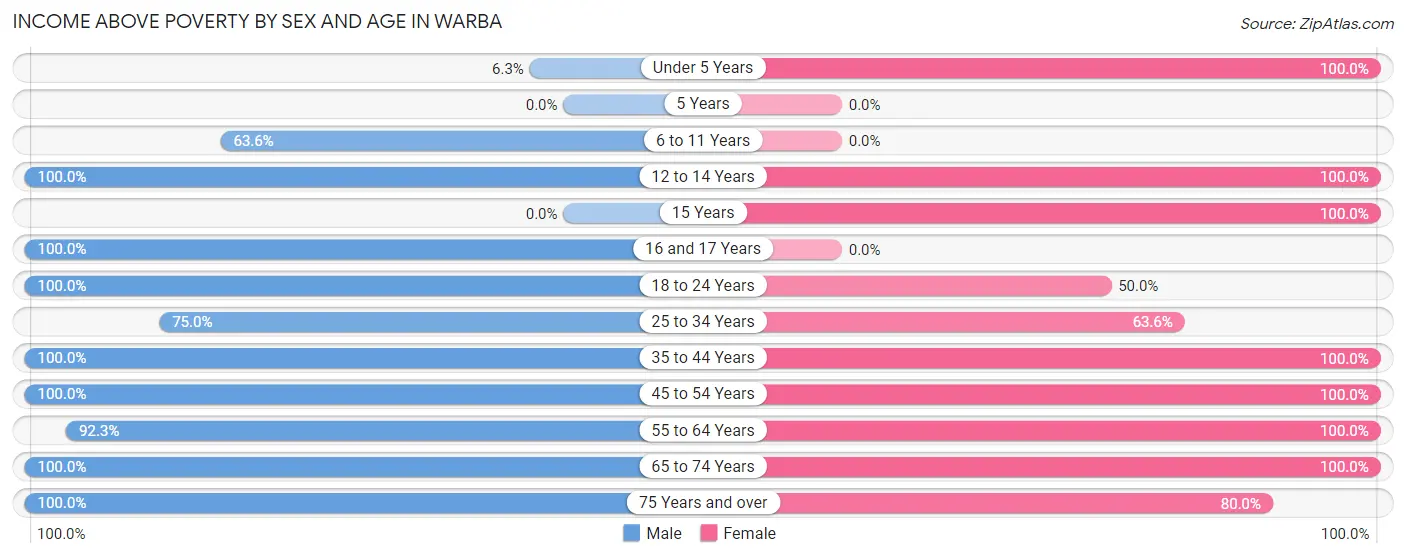
| Age Bracket | Male | Female |
| Under 5 Years | 1 (6.2%) | 1 (100.0%) |
| 5 Years | 0 (0.0%) | 0 (0.0%) |
| 6 to 11 Years | 7 (63.6%) | 0 (0.0%) |
| 12 to 14 Years | 3 (100.0%) | 3 (100.0%) |
| 15 Years | 0 (0.0%) | 2 (100.0%) |
| 16 and 17 Years | 2 (100.0%) | 0 (0.0%) |
| 18 to 24 Years | 1 (100.0%) | 2 (50.0%) |
| 25 to 34 Years | 6 (75.0%) | 7 (63.6%) |
| 35 to 44 Years | 9 (100.0%) | 4 (100.0%) |
| 45 to 54 Years | 8 (100.0%) | 6 (100.0%) |
| 55 to 64 Years | 12 (92.3%) | 14 (100.0%) |
| 65 to 74 Years | 15 (100.0%) | 14 (100.0%) |
| 75 Years and over | 5 (100.0%) | 8 (80.0%) |
| Total | 69 (75.8%) | 61 (87.1%) |
Income Below Poverty Among Married-Couple Families in Warba
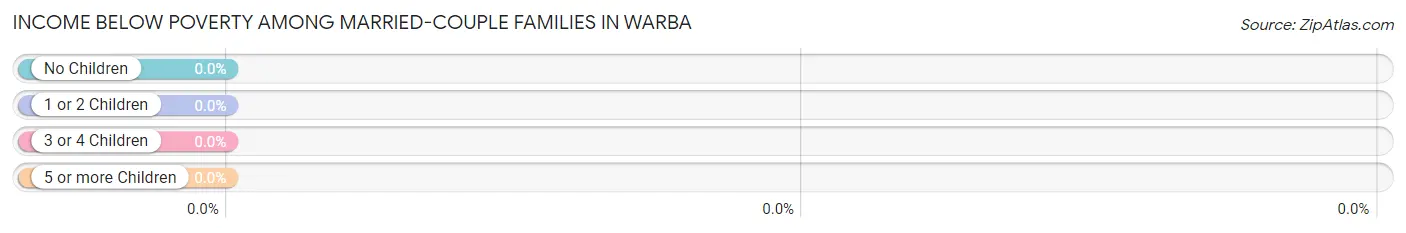
| Children | Above Poverty | Below Poverty |
| No Children | 34 (100.0%) | 0 (0.0%) |
| 1 or 2 Children | 7 (100.0%) | 0 (0.0%) |
| 3 or 4 Children | 0 (0.0%) | 0 (0.0%) |
| 5 or more Children | 0 (0.0%) | 0 (0.0%) |
| Total | 41 (100.0%) | 0 (0.0%) |
Income Below Poverty Among Single-Parent Households in Warba
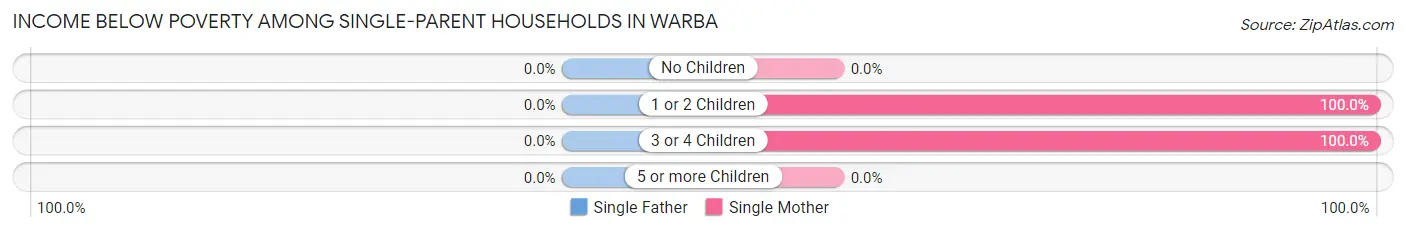
| Children | Single Father | Single Mother |
| No Children | 0 (0.0%) | 0 (0.0%) |
| 1 or 2 Children | 0 (0.0%) | 3 (100.0%) |
| 3 or 4 Children | 0 (0.0%) | 2 (100.0%) |
| 5 or more Children | 0 (0.0%) | 0 (0.0%) |
| Total | 0 (0.0%) | 5 (100.0%) |
Income Below Poverty Among Married-Couple vs Single-Parent Households in Warba
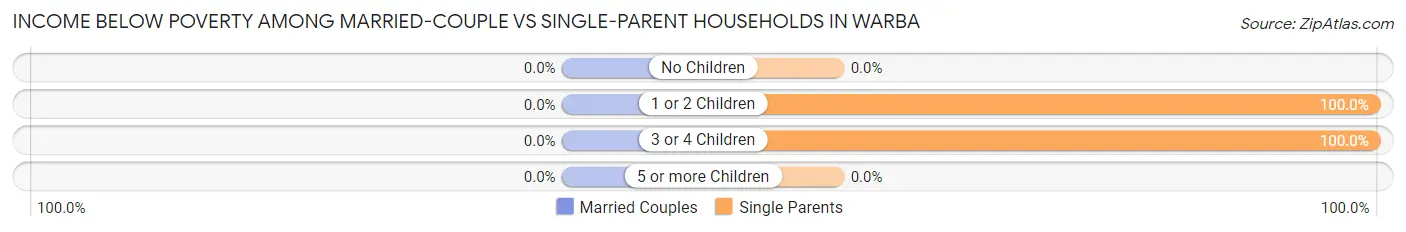
| Children | Married-Couple Families | Single-Parent Households |
| No Children | 0 (0.0%) | 0 (0.0%) |
| 1 or 2 Children | 0 (0.0%) | 3 (100.0%) |
| 3 or 4 Children | 0 (0.0%) | 2 (100.0%) |
| 5 or more Children | 0 (0.0%) | 0 (0.0%) |
| Total | 0 (0.0%) | 5 (100.0%) |
Race in Warba
The most populous races in Warba are White / Caucasian (130 | 80.7%), Black / African American (16 | 9.9%), and Two or more Races (13 | 8.1%).
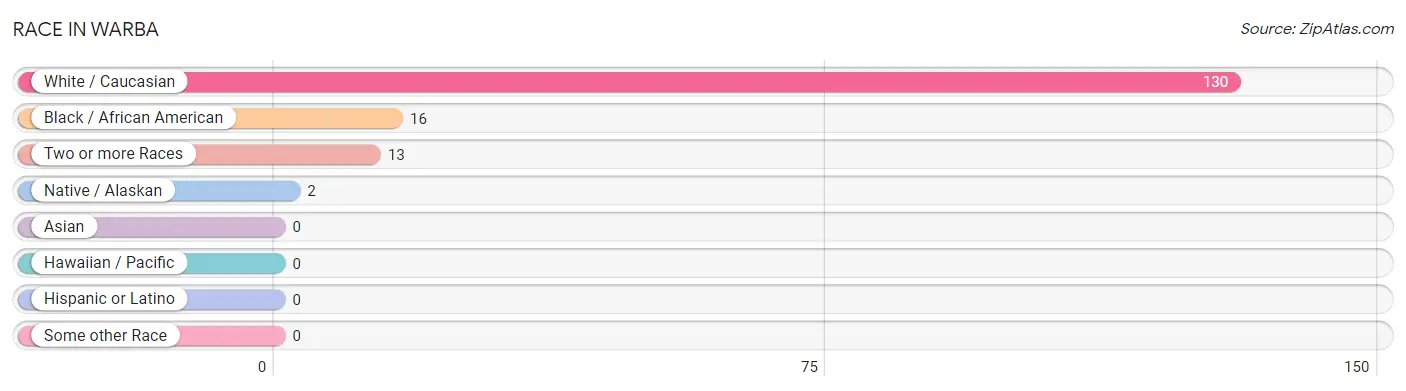
| Race | # Population | % Population |
| Asian | 0 | 0.0% |
| Black / African American | 16 | 9.9% |
| Hawaiian / Pacific | 0 | 0.0% |
| Hispanic or Latino | 0 | 0.0% |
| Native / Alaskan | 2 | 1.2% |
| White / Caucasian | 130 | 80.7% |
| Two or more Races | 13 | 8.1% |
| Some other Race | 0 | 0.0% |
| Total | 161 | 100.0% |
Ancestry in Warba
The most populous ancestries reported in Warba are German (45 | 28.0%), Irish (34 | 21.1%), Norwegian (11 | 6.8%), Swedish (11 | 6.8%), and French (6 | 3.7%), together accounting for 66.5% of all Warba residents.
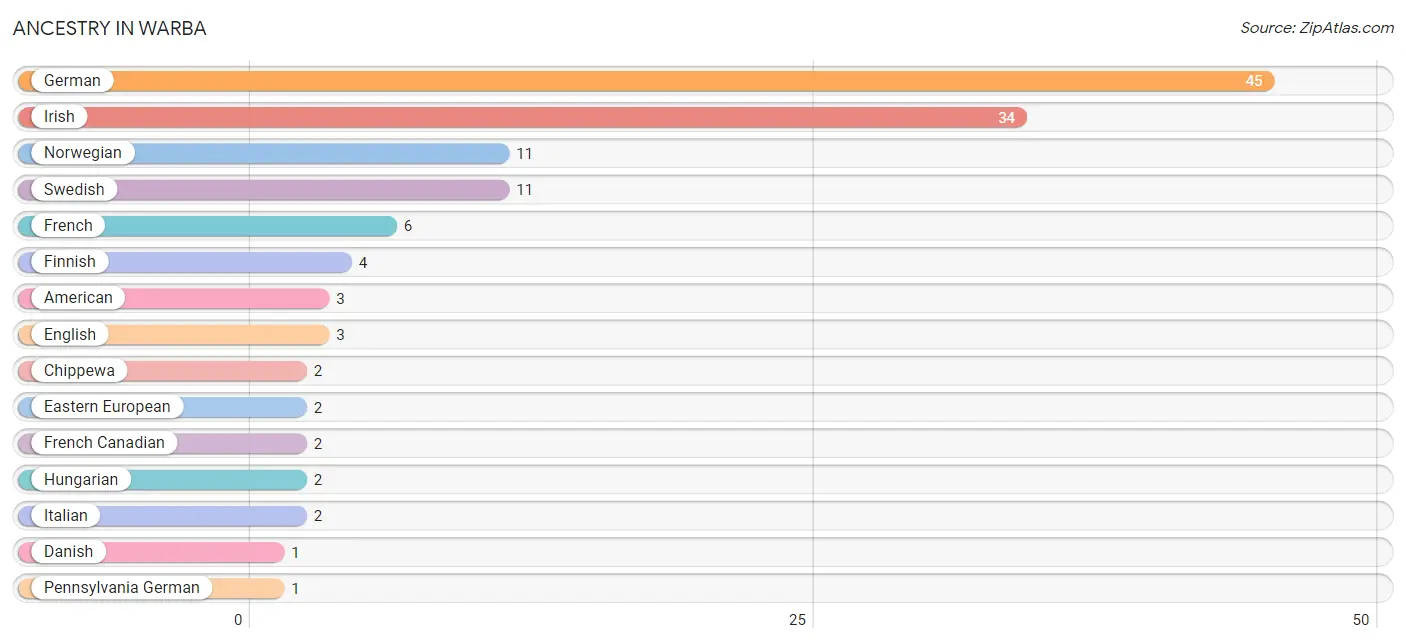
| Ancestry | # Population | % Population |
| American | 3 | 1.9% |
| Chippewa | 2 | 1.2% |
| Danish | 1 | 0.6% |
| Eastern European | 2 | 1.2% |
| English | 3 | 1.9% |
| Finnish | 4 | 2.5% |
| French | 6 | 3.7% |
| French Canadian | 2 | 1.2% |
| German | 45 | 28.0% |
| Hungarian | 2 | 1.2% |
| Irish | 34 | 21.1% |
| Italian | 2 | 1.2% |
| Norwegian | 11 | 6.8% |
| Pennsylvania German | 1 | 0.6% |
| Scandinavian | 1 | 0.6% |
| Serbian | 1 | 0.6% |
| Swedish | 11 | 6.8% |
| Swiss | 1 | 0.6% | View All 18 Rows |
Immigrants in Warba

| Immigration Origin | # Population | % Population | View All 0 Rows |
Sex and Age in Warba
Sex and Age in Warba
The most populous age groups in Warba are Under 5 Years (16 | 17.6%) for men and 65 to 69 Years (13 | 18.6%) for women.
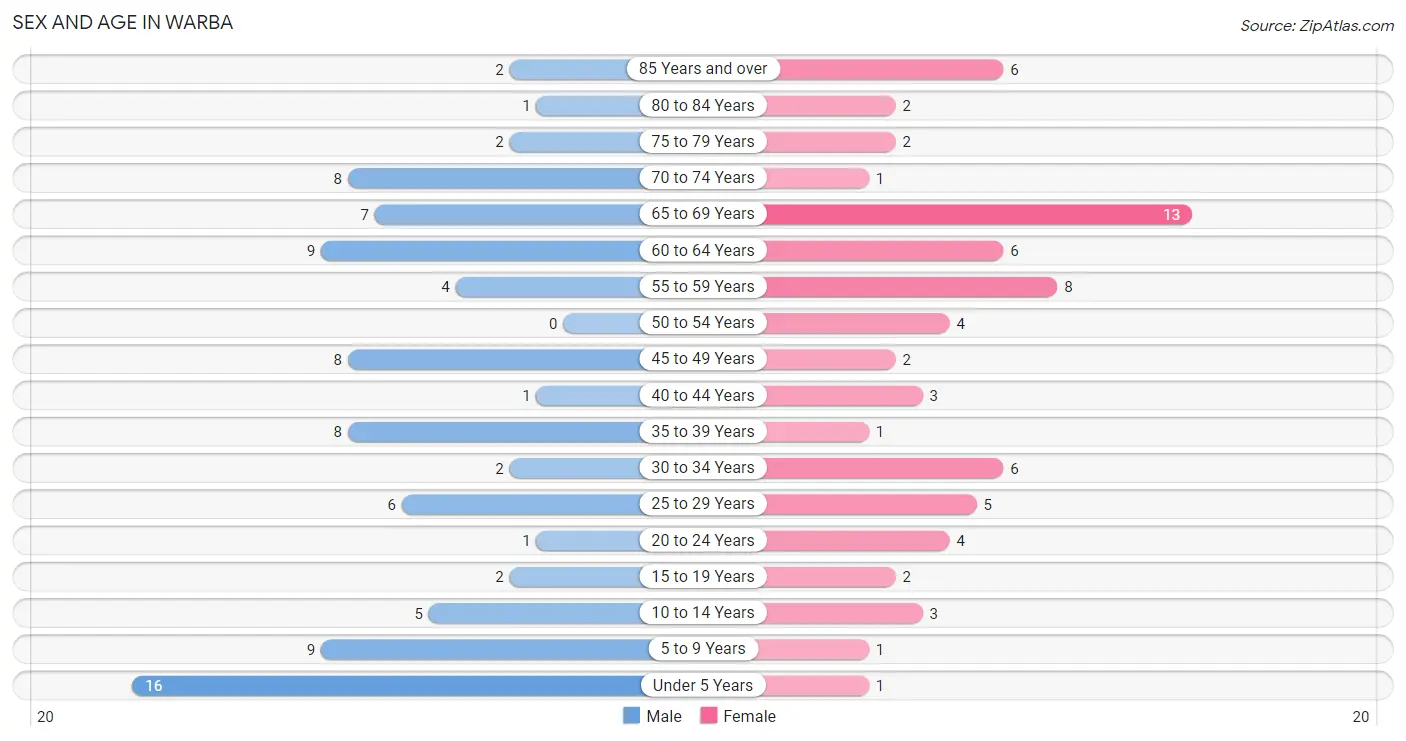
| Age Bracket | Male | Female |
| Under 5 Years | 16 (17.6%) | 1 (1.4%) |
| 5 to 9 Years | 9 (9.9%) | 1 (1.4%) |
| 10 to 14 Years | 5 (5.5%) | 3 (4.3%) |
| 15 to 19 Years | 2 (2.2%) | 2 (2.9%) |
| 20 to 24 Years | 1 (1.1%) | 4 (5.7%) |
| 25 to 29 Years | 6 (6.6%) | 5 (7.1%) |
| 30 to 34 Years | 2 (2.2%) | 6 (8.6%) |
| 35 to 39 Years | 8 (8.8%) | 1 (1.4%) |
| 40 to 44 Years | 1 (1.1%) | 3 (4.3%) |
| 45 to 49 Years | 8 (8.8%) | 2 (2.9%) |
| 50 to 54 Years | 0 (0.0%) | 4 (5.7%) |
| 55 to 59 Years | 4 (4.4%) | 8 (11.4%) |
| 60 to 64 Years | 9 (9.9%) | 6 (8.6%) |
| 65 to 69 Years | 7 (7.7%) | 13 (18.6%) |
| 70 to 74 Years | 8 (8.8%) | 1 (1.4%) |
| 75 to 79 Years | 2 (2.2%) | 2 (2.9%) |
| 80 to 84 Years | 1 (1.1%) | 2 (2.9%) |
| 85 Years and over | 2 (2.2%) | 6 (8.6%) |
| Total | 91 (100.0%) | 70 (100.0%) |
Families and Households in Warba
Median Family Size in Warba
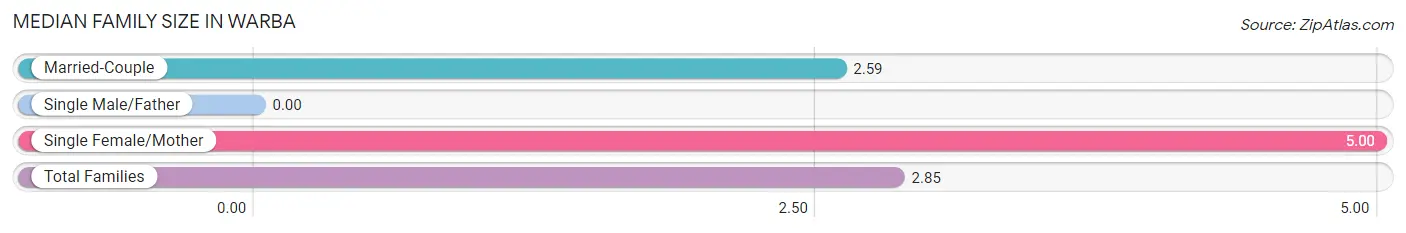
| Family Type | # Families | Family Size |
| Married-Couple | 41 (89.1%) | 2.59 |
| Single Male/Father | 0 (0.0%) | - |
| Single Female/Mother | 5 (10.9%) | 5.00 |
| Total Families | 46 (100.0%) | 2.85 |
Median Household Size in Warba
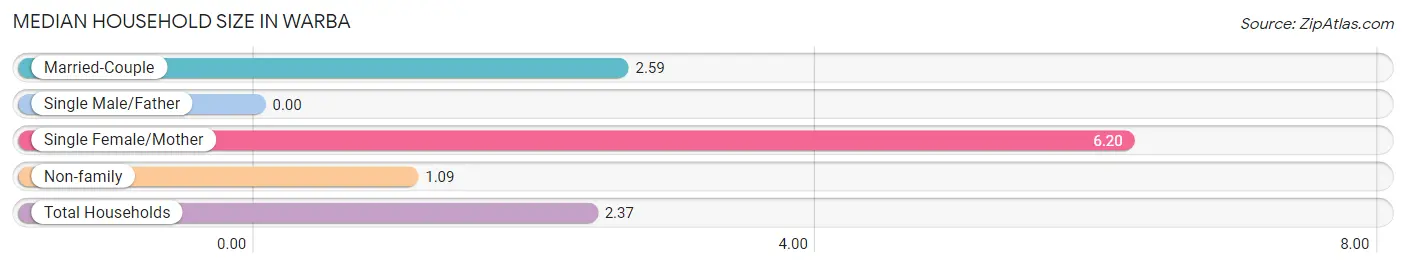
| Household Type | # Households | Household Size |
| Married-Couple | 41 (60.3%) | 2.59 |
| Single Male/Father | 0 (0.0%) | - |
| Single Female/Mother | 5 (7.3%) | 6.20 |
| Non-family | 22 (32.4%) | 1.09 |
| Total Households | 68 (100.0%) | 2.37 |
Household Size by Marriage Status in Warba
Out of a total of 68 households in Warba, 46 (67.6%) are family households, while 22 (32.4%) are nonfamily households. The most numerous type of family households are 2-person households, comprising 34, and the most common type of nonfamily households are 1-person households, comprising 19.
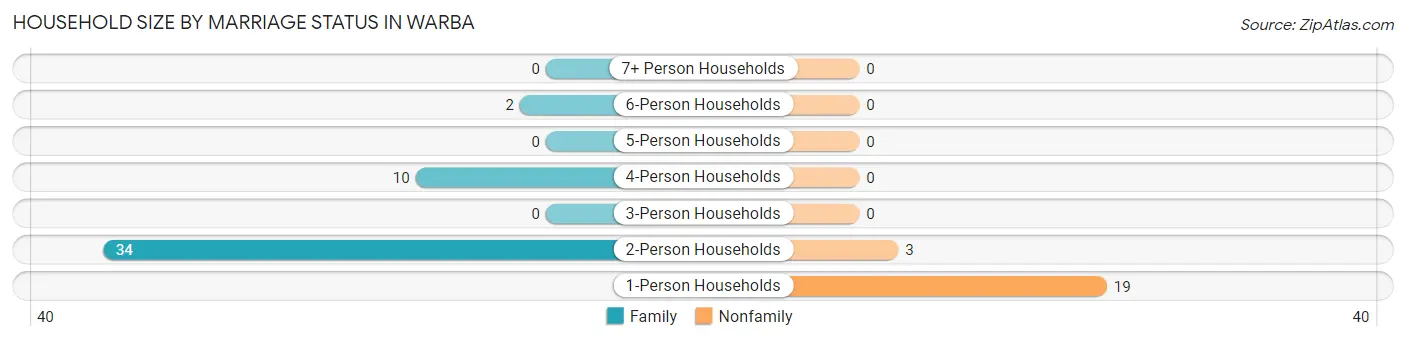
| Household Size | Family Households | Nonfamily Households |
| 1-Person Households | - | 19 (27.9%) |
| 2-Person Households | 34 (50.0%) | 3 (4.4%) |
| 3-Person Households | 0 (0.0%) | 0 (0.0%) |
| 4-Person Households | 10 (14.7%) | 0 (0.0%) |
| 5-Person Households | 0 (0.0%) | 0 (0.0%) |
| 6-Person Households | 2 (2.9%) | 0 (0.0%) |
| 7+ Person Households | 0 (0.0%) | 0 (0.0%) |
| Total | 46 (67.6%) | 22 (32.4%) |
Female Fertility in Warba
Fertility by Age in Warba
| Age Bracket | Women with Births | Births / 1,000 Women |
| 15 to 19 years | 0 (0.0%) | 0.0 |
| 20 to 34 years | 0 (0.0%) | 0.0 |
| 35 to 50 years | 0 (0.0%) | 0.0 |
| Total | 0 (0.0%) | 0.0 |
Fertility by Age by Marriage Status in Warba
| Age Bracket | Married | Unmarried |
| 15 to 19 years | 0 (0.0%) | 0 (0.0%) |
| 20 to 34 years | 0 (0.0%) | 0 (0.0%) |
| 35 to 50 years | 0 (0.0%) | 0 (0.0%) |
| Total | 0 (0.0%) | 0 (0.0%) |
Fertility by Education in Warba
| Educational Attainment | Women with Births | Births / 1,000 Women |
| Less than High School | 0 (0.0%) | 0.0 |
| High School Diploma | 0 (0.0%) | 0.0 |
| College or Associate's Degree | 0 (0.0%) | 0.0 |
| Bachelor's Degree | 0 (0.0%) | 0.0 |
| Graduate Degree | 0 (0.0%) | 0.0 |
| Total | 0 (0.0%) | 0.0 |
Fertility by Education by Marriage Status in Warba
| Educational Attainment | Married | Unmarried |
| Less than High School | 0 (0.0%) | 0 (0.0%) |
| High School Diploma | 0 (0.0%) | 0 (0.0%) |
| College or Associate's Degree | 0 (0.0%) | 0 (0.0%) |
| Bachelor's Degree | 0 (0.0%) | 0 (0.0%) |
| Graduate Degree | 0 (0.0%) | 0 (0.0%) |
| Total | 0 (0.0%) | 0 (0.0%) |
Employment Characteristics in Warba
Employment by Class of Employer in Warba
Among the 60 employed individuals in Warba, private company employees (43 | 71.7%), self-employed (not incorporated) (6 | 10.0%), and not-for-profit organizations (4 | 6.7%) make up the most common classes of employment.
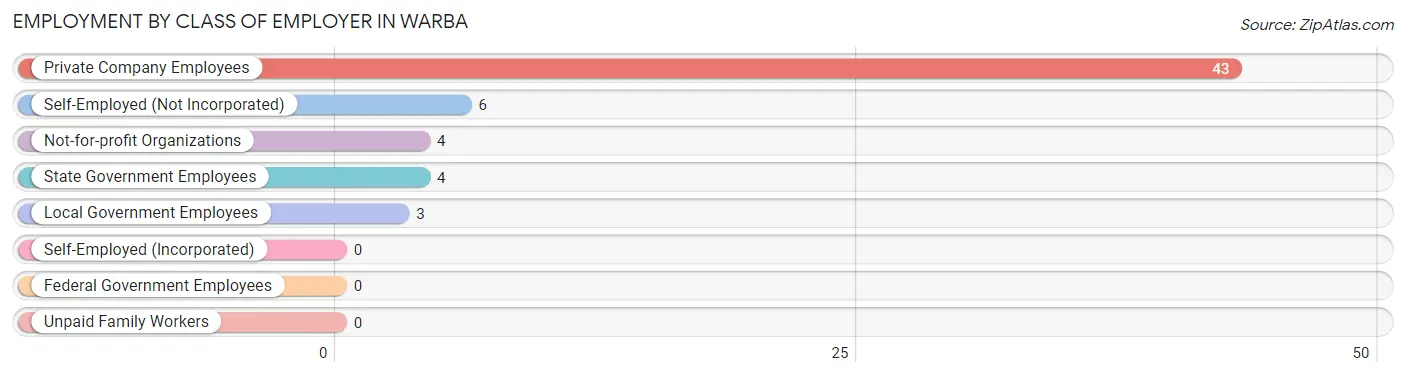
| Employer Class | # Employees | % Employees |
| Private Company Employees | 43 | 71.7% |
| Self-Employed (Incorporated) | 0 | 0.0% |
| Self-Employed (Not Incorporated) | 6 | 10.0% |
| Not-for-profit Organizations | 4 | 6.7% |
| Local Government Employees | 3 | 5.0% |
| State Government Employees | 4 | 6.7% |
| Federal Government Employees | 0 | 0.0% |
| Unpaid Family Workers | 0 | 0.0% |
| Total | 60 | 100.0% |
Employment Status by Age in Warba
According to the labor force statistics for Warba, out of the total population over 16 years of age (124), 54.0% or 67 individuals are in the labor force, with 10.4% or 7 of them unemployed. The age group with the highest labor force participation rate is 20 to 24 years, with 100.0% or 5 individuals in the labor force. Within the labor force, the 60 to 64 years age range has the highest percentage of unemployed individuals, with 50.0% or 3 of them being unemployed.
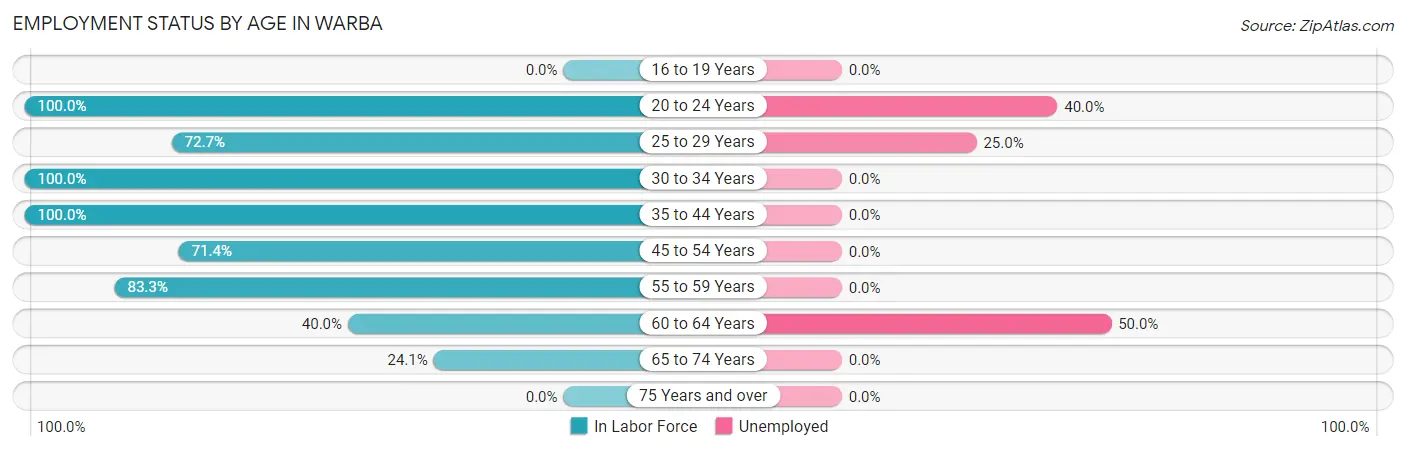
| Age Bracket | In Labor Force | Unemployed |
| 16 to 19 Years | 0 (0.0%) | 0 (0.0%) |
| 20 to 24 Years | 5 (100.0%) | 2 (40.0%) |
| 25 to 29 Years | 8 (72.7%) | 2 (25.0%) |
| 30 to 34 Years | 8 (100.0%) | 0 (0.0%) |
| 35 to 44 Years | 13 (100.0%) | 0 (0.0%) |
| 45 to 54 Years | 10 (71.4%) | 0 (0.0%) |
| 55 to 59 Years | 10 (83.3%) | 0 (0.0%) |
| 60 to 64 Years | 6 (40.0%) | 3 (50.0%) |
| 65 to 74 Years | 7 (24.1%) | 0 (0.0%) |
| 75 Years and over | 0 (0.0%) | 0 (0.0%) |
| Total | 67 (54.0%) | 7 (10.4%) |
Employment Status by Educational Attainment in Warba
According to labor force statistics for Warba, 75.3% of individuals (55) out of the total population between 25 and 64 years of age (73) are in the labor force, with 9.1% or 5 of them being unemployed. The group with the highest labor force participation rate are those with the educational attainment of less than high school, with 100.0% or 3 individuals in the labor force. Within the labor force, individuals with less than high school education have the highest percentage of unemployment, with 66.7% or 2 of them being unemployed.
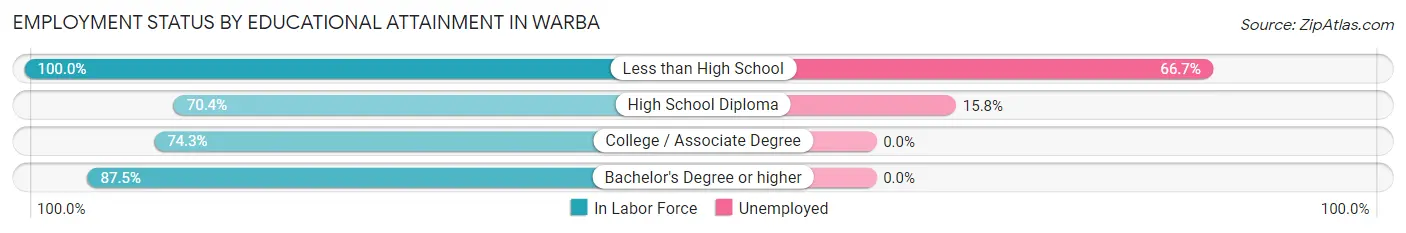
| Educational Attainment | In Labor Force | Unemployed |
| Less than High School | 3 (100.0%) | 2 (66.7%) |
| High School Diploma | 19 (70.4%) | 4 (15.8%) |
| College / Associate Degree | 26 (74.3%) | 0 (0.0%) |
| Bachelor's Degree or higher | 7 (87.5%) | 0 (0.0%) |
| Total | 55 (75.3%) | 7 (9.1%) |
Employment Occupations by Sex in Warba
Management, Business, Science and Arts Occupations
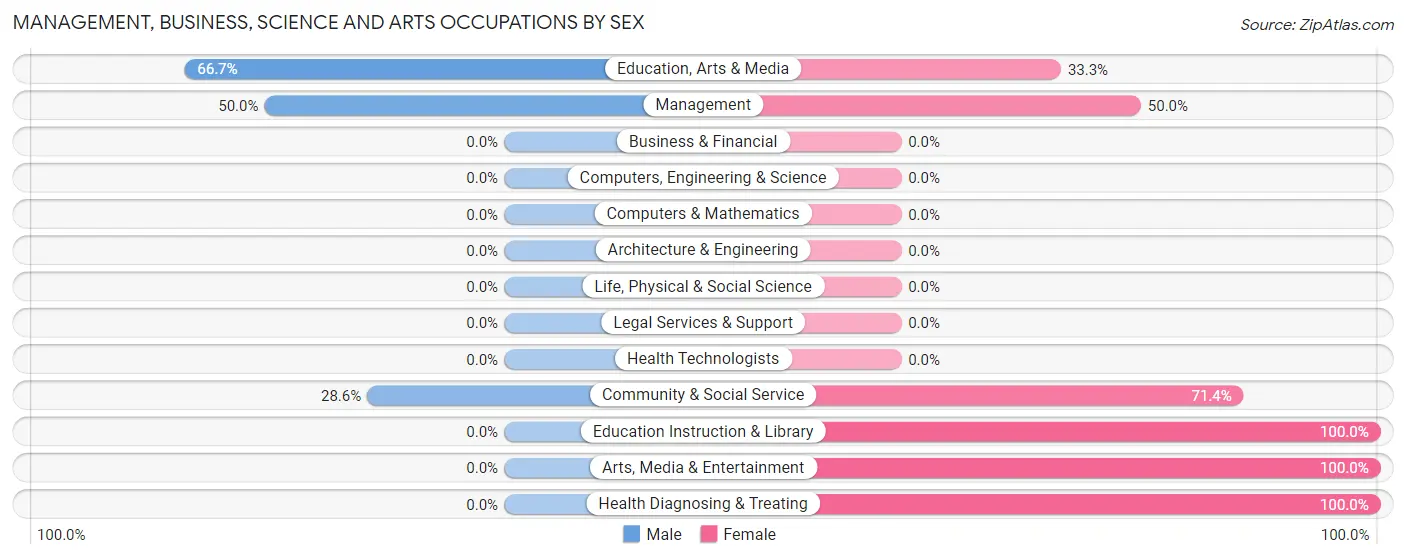
The most common Management, Business, Science and Arts occupations in Warba are Community & Social Service (7 | 11.7%), Education, Arts & Media (3 | 5.0%), Health Diagnosing & Treating (3 | 5.0%), Management (2 | 3.3%), and Education Instruction & Library (2 | 3.3%).
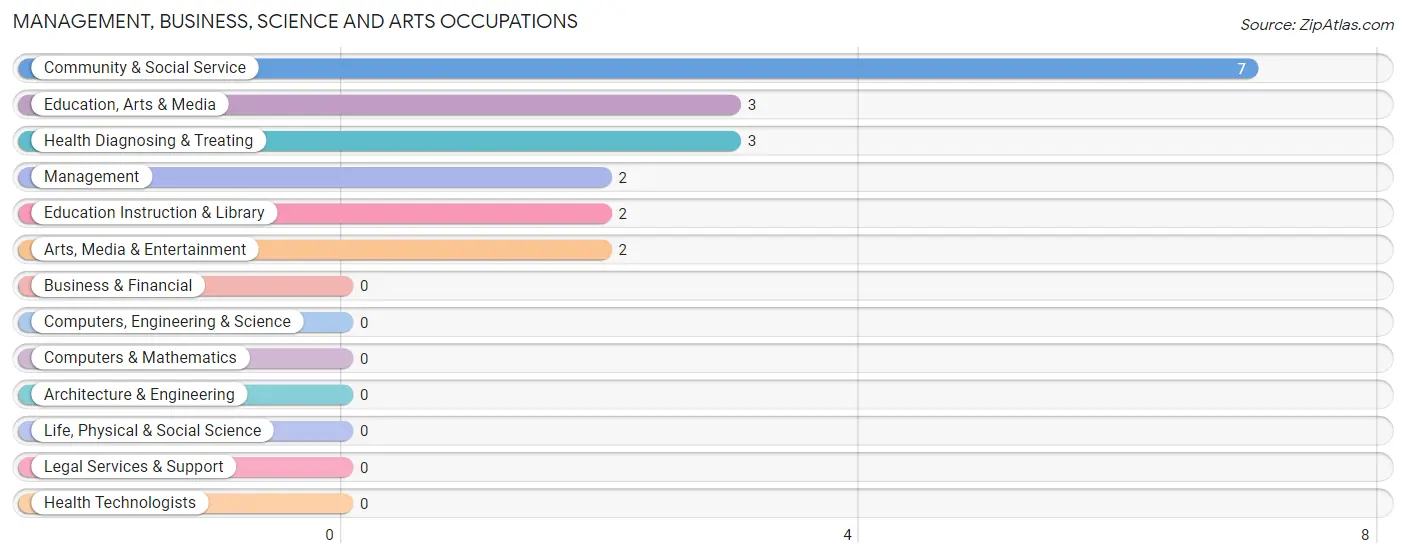
Management, Business, Science and Arts Occupations by Sex
Within the Management, Business, Science and Arts occupations in Warba, the most male-oriented occupations are Education, Arts & Media (66.7%), Management (50.0%), and Community & Social Service (28.6%), while the most female-oriented occupations are Education Instruction & Library (100.0%), Arts, Media & Entertainment (100.0%), and Health Diagnosing & Treating (100.0%).
| Occupation | Male | Female |
| Management | 1 (50.0%) | 1 (50.0%) |
| Business & Financial | 0 (0.0%) | 0 (0.0%) |
| Computers, Engineering & Science | 0 (0.0%) | 0 (0.0%) |
| Computers & Mathematics | 0 (0.0%) | 0 (0.0%) |
| Architecture & Engineering | 0 (0.0%) | 0 (0.0%) |
| Life, Physical & Social Science | 0 (0.0%) | 0 (0.0%) |
| Community & Social Service | 2 (28.6%) | 5 (71.4%) |
| Education, Arts & Media | 2 (66.7%) | 1 (33.3%) |
| Legal Services & Support | 0 (0.0%) | 0 (0.0%) |
| Education Instruction & Library | 0 (0.0%) | 2 (100.0%) |
| Arts, Media & Entertainment | 0 (0.0%) | 2 (100.0%) |
| Health Diagnosing & Treating | 0 (0.0%) | 3 (100.0%) |
| Health Technologists | 0 (0.0%) | 0 (0.0%) |
| Total (Category) | 3 (25.0%) | 9 (75.0%) |
| Total (Overall) | 37 (61.7%) | 23 (38.3%) |
Services Occupations
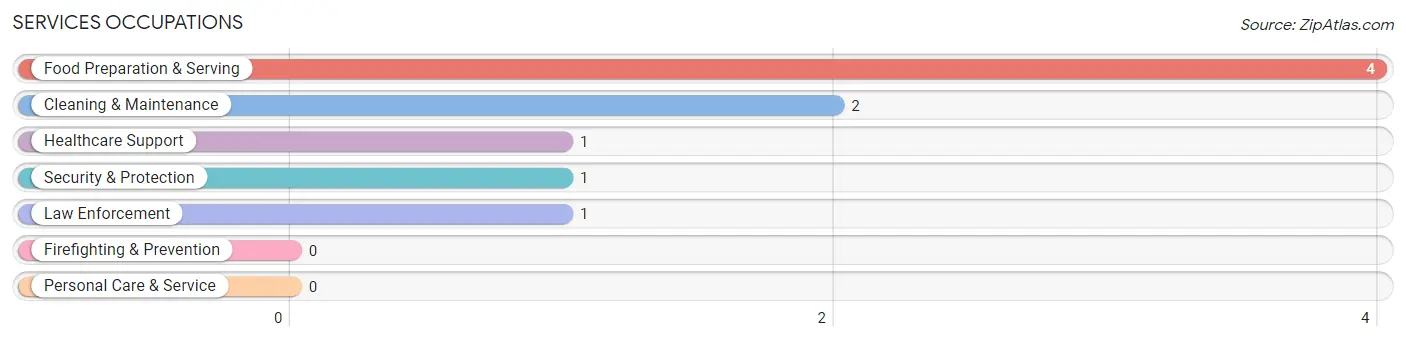
The most common Services occupations in Warba are Food Preparation & Serving (4 | 6.7%), Cleaning & Maintenance (2 | 3.3%), Healthcare Support (1 | 1.7%), Security & Protection (1 | 1.7%), and Law Enforcement (1 | 1.7%).
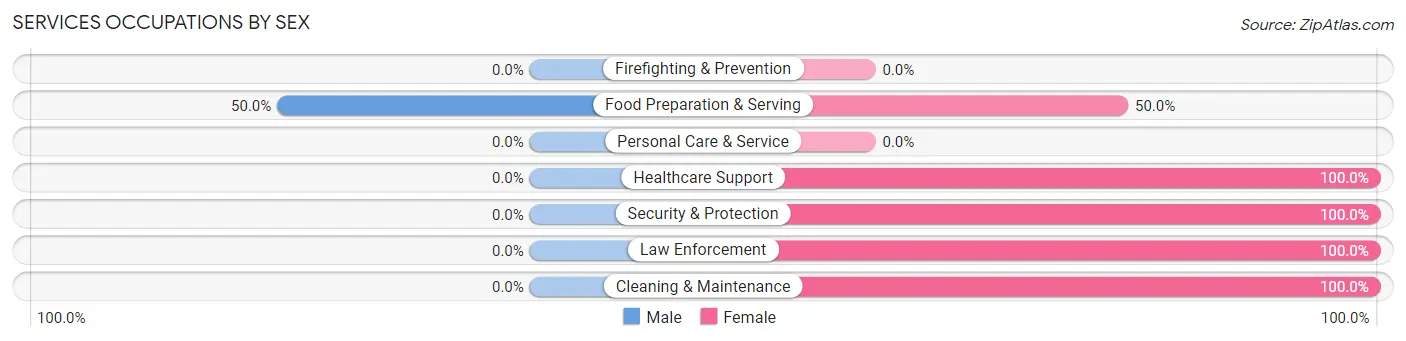
Services Occupations by Sex
| Occupation | Male | Female |
| Healthcare Support | 0 (0.0%) | 1 (100.0%) |
| Security & Protection | 0 (0.0%) | 1 (100.0%) |
| Firefighting & Prevention | 0 (0.0%) | 0 (0.0%) |
| Law Enforcement | 0 (0.0%) | 1 (100.0%) |
| Food Preparation & Serving | 2 (50.0%) | 2 (50.0%) |
| Cleaning & Maintenance | 0 (0.0%) | 2 (100.0%) |
| Personal Care & Service | 0 (0.0%) | 0 (0.0%) |
| Total (Category) | 2 (25.0%) | 6 (75.0%) |
| Total (Overall) | 37 (61.7%) | 23 (38.3%) |
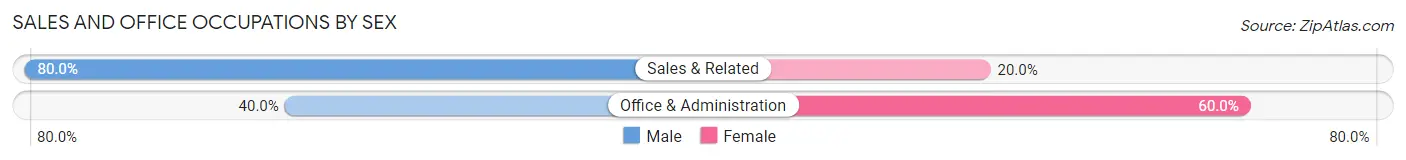
Sales and Office Occupations
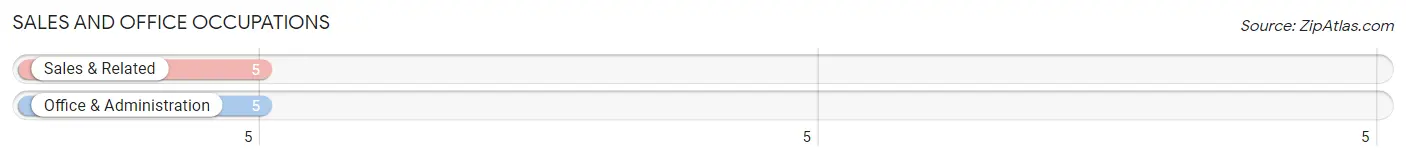
The most common Sales and Office occupations in Warba are Sales & Related (5 | 8.3%), and Office & Administration (5 | 8.3%).
Sales and Office Occupations by Sex
| Occupation | Male | Female |
| Sales & Related | 4 (80.0%) | 1 (20.0%) |
| Office & Administration | 2 (40.0%) | 3 (60.0%) |
| Total (Category) | 6 (60.0%) | 4 (40.0%) |
| Total (Overall) | 37 (61.7%) | 23 (38.3%) |
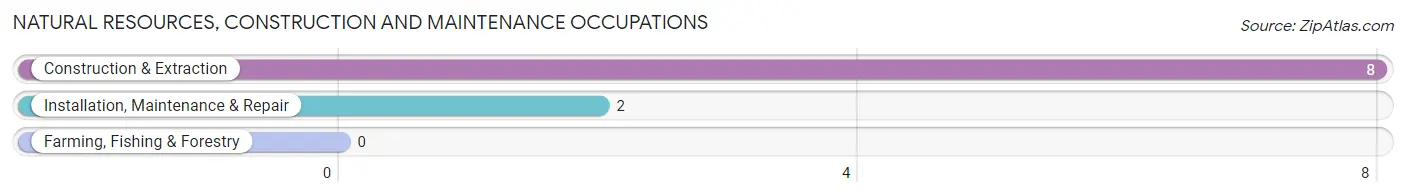
Natural Resources, Construction and Maintenance Occupations
The most common Natural Resources, Construction and Maintenance occupations in Warba are Construction & Extraction (8 | 13.3%), and Installation, Maintenance & Repair (2 | 3.3%).
Natural Resources, Construction and Maintenance Occupations by Sex
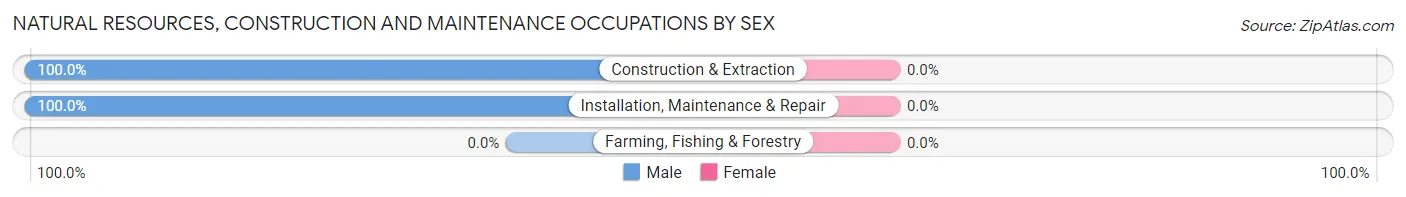
| Occupation | Male | Female |
| Farming, Fishing & Forestry | 0 (0.0%) | 0 (0.0%) |
| Construction & Extraction | 8 (100.0%) | 0 (0.0%) |
| Installation, Maintenance & Repair | 2 (100.0%) | 0 (0.0%) |
| Total (Category) | 10 (100.0%) | 0 (0.0%) |
| Total (Overall) | 37 (61.7%) | 23 (38.3%) |
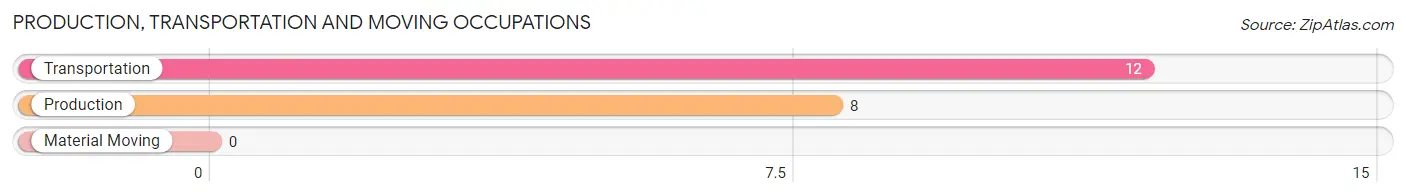
Production, Transportation and Moving Occupations
The most common Production, Transportation and Moving occupations in Warba are Transportation (12 | 20.0%), and Production (8 | 13.3%).
Production, Transportation and Moving Occupations by Sex
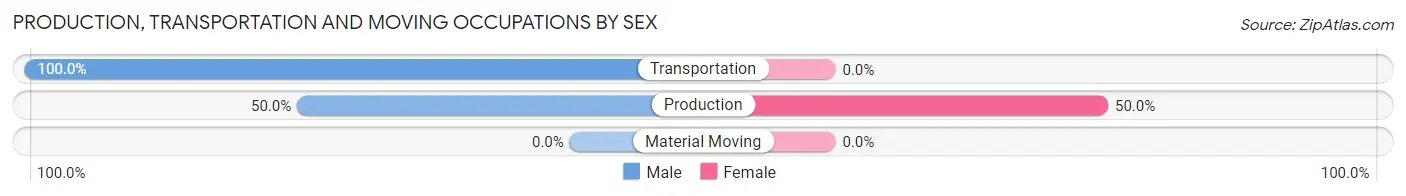
| Occupation | Male | Female |
| Production | 4 (50.0%) | 4 (50.0%) |
| Transportation | 12 (100.0%) | 0 (0.0%) |
| Material Moving | 0 (0.0%) | 0 (0.0%) |
| Total (Category) | 16 (80.0%) | 4 (20.0%) |
| Total (Overall) | 37 (61.7%) | 23 (38.3%) |
Employment Industries by Sex in Warba
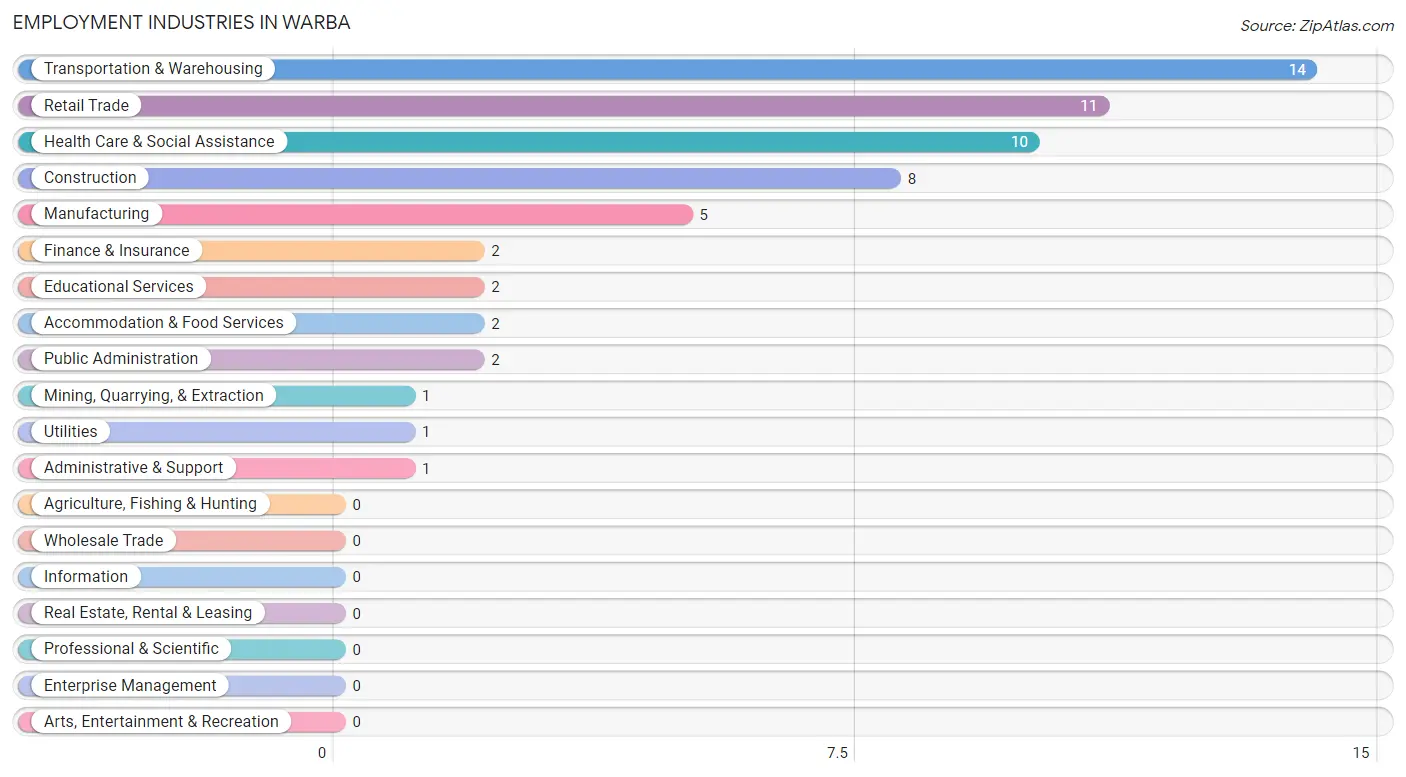
Employment Industries in Warba
The major employment industries in Warba include Transportation & Warehousing (14 | 23.3%), Retail Trade (11 | 18.3%), Health Care & Social Assistance (10 | 16.7%), Construction (8 | 13.3%), and Manufacturing (5 | 8.3%).
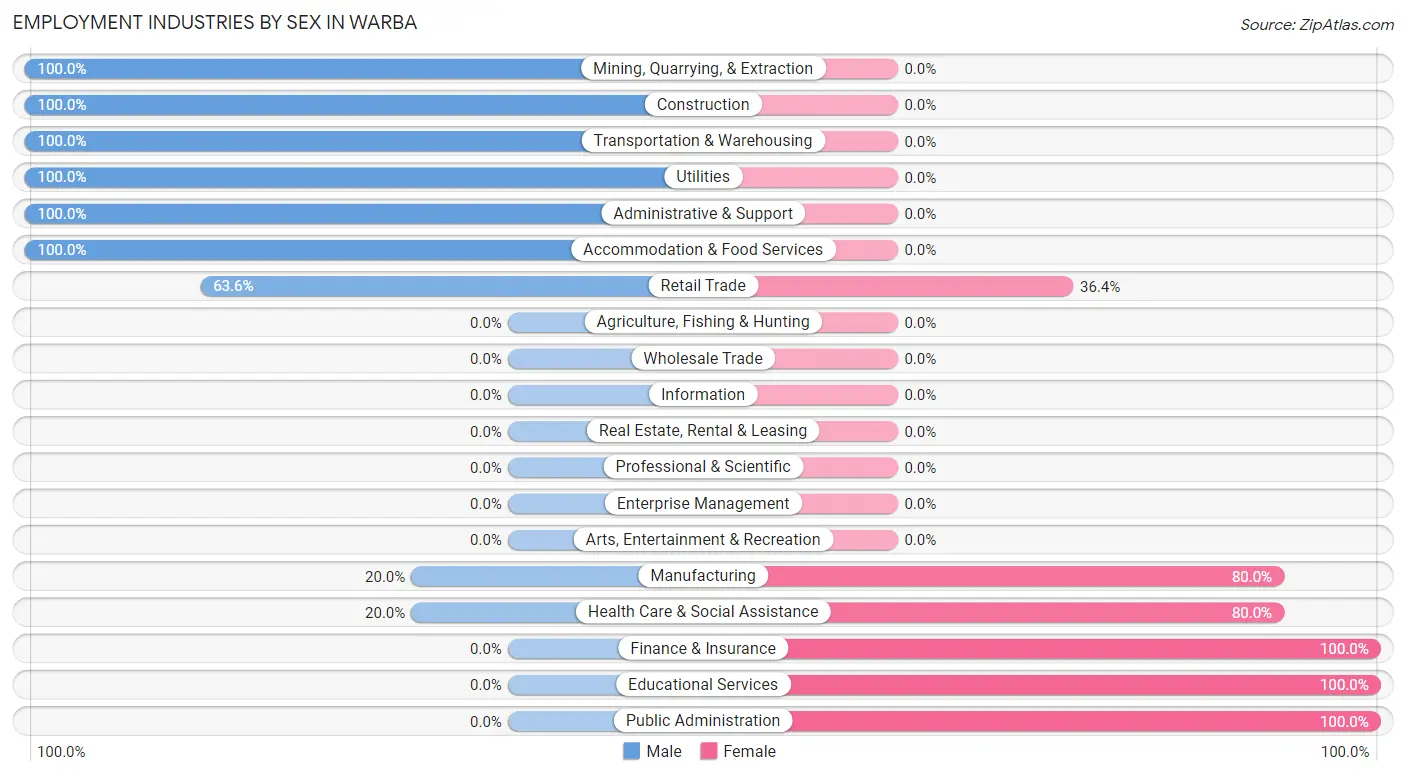
Employment Industries by Sex in Warba
The Warba industries that see more men than women are Mining, Quarrying, & Extraction (100.0%), Construction (100.0%), and Transportation & Warehousing (100.0%), whereas the industries that tend to have a higher number of women are Finance & Insurance (100.0%), Educational Services (100.0%), and Public Administration (100.0%).
| Industry | Male | Female |
| Agriculture, Fishing & Hunting | 0 (0.0%) | 0 (0.0%) |
| Mining, Quarrying, & Extraction | 1 (100.0%) | 0 (0.0%) |
| Construction | 8 (100.0%) | 0 (0.0%) |
| Manufacturing | 1 (20.0%) | 4 (80.0%) |
| Wholesale Trade | 0 (0.0%) | 0 (0.0%) |
| Retail Trade | 7 (63.6%) | 4 (36.4%) |
| Transportation & Warehousing | 14 (100.0%) | 0 (0.0%) |
| Utilities | 1 (100.0%) | 0 (0.0%) |
| Information | 0 (0.0%) | 0 (0.0%) |
| Finance & Insurance | 0 (0.0%) | 2 (100.0%) |
| Real Estate, Rental & Leasing | 0 (0.0%) | 0 (0.0%) |
| Professional & Scientific | 0 (0.0%) | 0 (0.0%) |
| Enterprise Management | 0 (0.0%) | 0 (0.0%) |
| Administrative & Support | 1 (100.0%) | 0 (0.0%) |
| Educational Services | 0 (0.0%) | 2 (100.0%) |
| Health Care & Social Assistance | 2 (20.0%) | 8 (80.0%) |
| Arts, Entertainment & Recreation | 0 (0.0%) | 0 (0.0%) |
| Accommodation & Food Services | 2 (100.0%) | 0 (0.0%) |
| Public Administration | 0 (0.0%) | 2 (100.0%) |
| Total | 37 (61.7%) | 23 (38.3%) |
Education in Warba
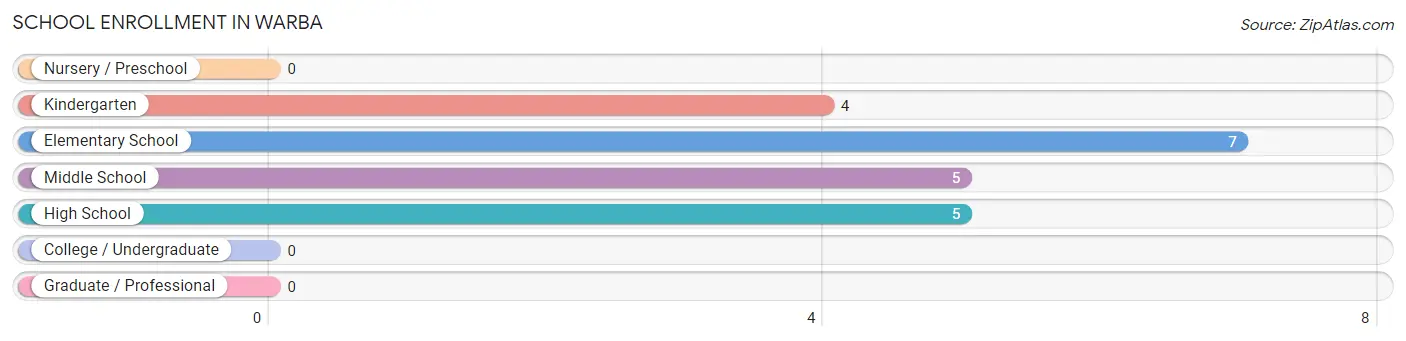
School Enrollment in Warba
The most common levels of schooling among the 21 students in Warba are elementary school (7 | 33.3%), middle school (5 | 23.8%), and high school (5 | 23.8%).
| School Level | # Students | % Students |
| Nursery / Preschool | 0 | 0.0% |
| Kindergarten | 4 | 19.1% |
| Elementary School | 7 | 33.3% |
| Middle School | 5 | 23.8% |
| High School | 5 | 23.8% |
| College / Undergraduate | 0 | 0.0% |
| Graduate / Professional | 0 | 0.0% |
| Total | 21 | 100.0% |
School Enrollment by Age by Funding Source in Warba
Out of a total of 21 students who are enrolled in schools in Warba, 4 (19.0%) attend a private institution, while the remaining 17 (81.0%) are enrolled in public schools. The age group of 5 to 9 year old has the highest likelihood of being enrolled in private schools, with 4 (44.4% in the age bracket) enrolled. Conversely, the age group of 10 to 14 year olds has the lowest likelihood of being enrolled in a private school, with 8 (100.0% in the age bracket) attending a public institution.
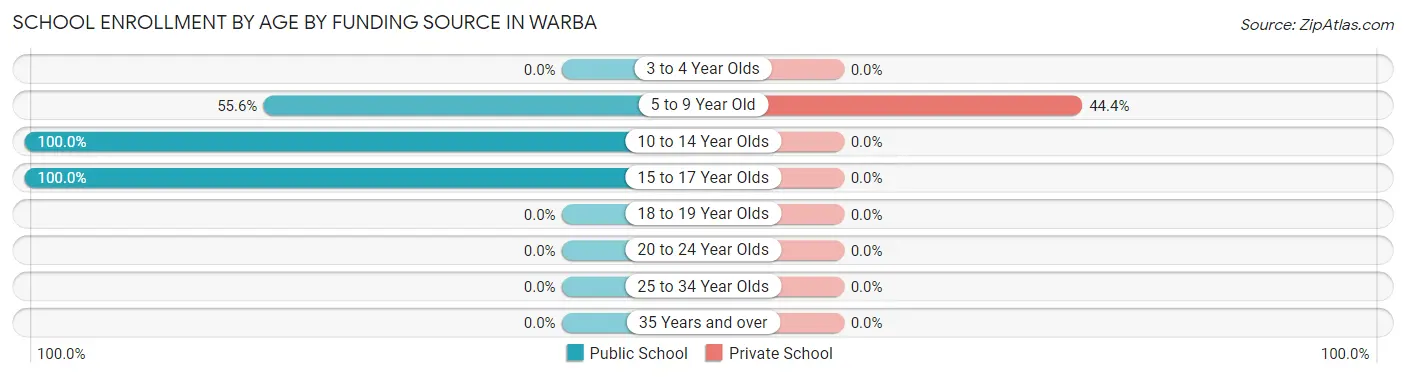
| Age Bracket | Public School | Private School |
| 3 to 4 Year Olds | 0 (0.0%) | 0 (0.0%) |
| 5 to 9 Year Old | 5 (55.6%) | 4 (44.4%) |
| 10 to 14 Year Olds | 8 (100.0%) | 0 (0.0%) |
| 15 to 17 Year Olds | 4 (100.0%) | 0 (0.0%) |
| 18 to 19 Year Olds | 0 (0.0%) | 0 (0.0%) |
| 20 to 24 Year Olds | 0 (0.0%) | 0 (0.0%) |
| 25 to 34 Year Olds | 0 (0.0%) | 0 (0.0%) |
| 35 Years and over | 0 (0.0%) | 0 (0.0%) |
| Total | 17 (81.0%) | 4 (19.0%) |
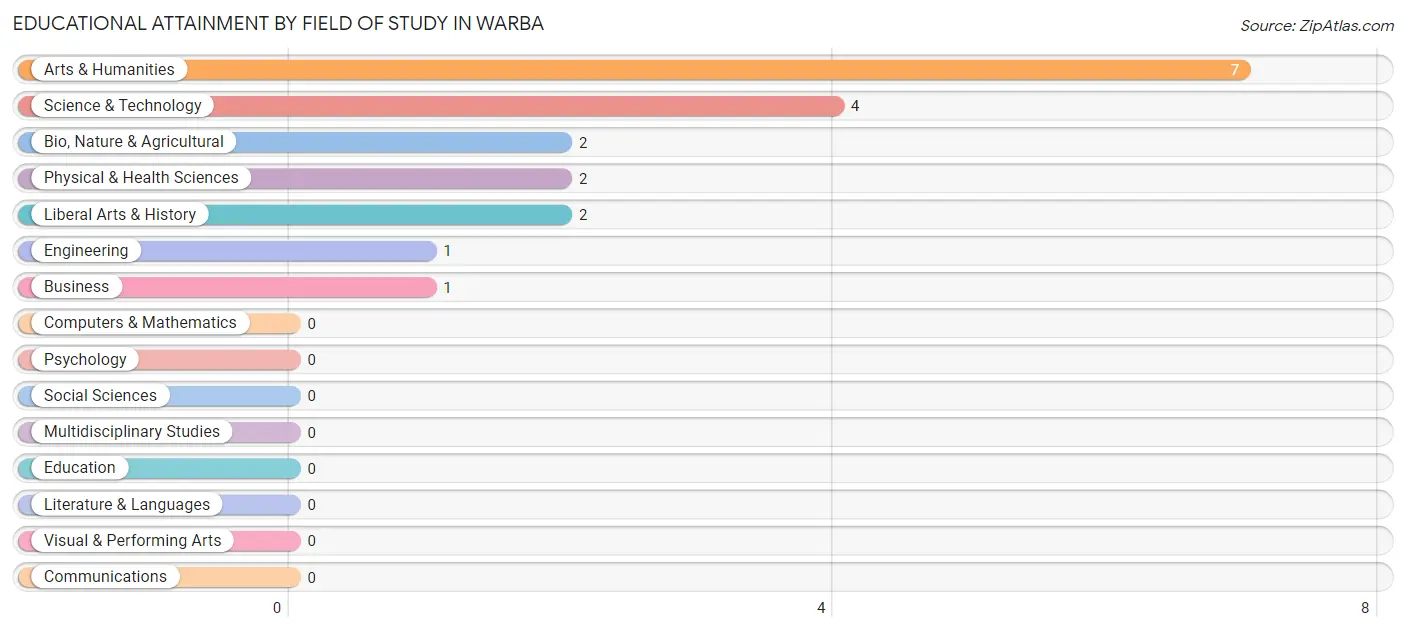
Educational Attainment by Field of Study in Warba
Arts & humanities (7 | 36.8%), science & technology (4 | 21.0%), bio, nature & agricultural (2 | 10.5%), physical & health sciences (2 | 10.5%), and liberal arts & history (2 | 10.5%) are the most common fields of study among 19 individuals in Warba who have obtained a bachelor's degree or higher.
| Field of Study | # Graduates | % Graduates |
| Computers & Mathematics | 0 | 0.0% |
| Bio, Nature & Agricultural | 2 | 10.5% |
| Physical & Health Sciences | 2 | 10.5% |
| Psychology | 0 | 0.0% |
| Social Sciences | 0 | 0.0% |
| Engineering | 1 | 5.3% |
| Multidisciplinary Studies | 0 | 0.0% |
| Science & Technology | 4 | 21.0% |
| Business | 1 | 5.3% |
| Education | 0 | 0.0% |
| Literature & Languages | 0 | 0.0% |
| Liberal Arts & History | 2 | 10.5% |
| Visual & Performing Arts | 0 | 0.0% |
| Communications | 0 | 0.0% |
| Arts & Humanities | 7 | 36.8% |
| Total | 19 | 100.0% |
Transportation & Commute in Warba
Vehicle Availability by Sex in Warba
The most prevalent vehicle ownership categories in Warba are males with 2 vehicles (19, accounting for 51.3%) and females with 2 vehicles (16, making up 82.6%).
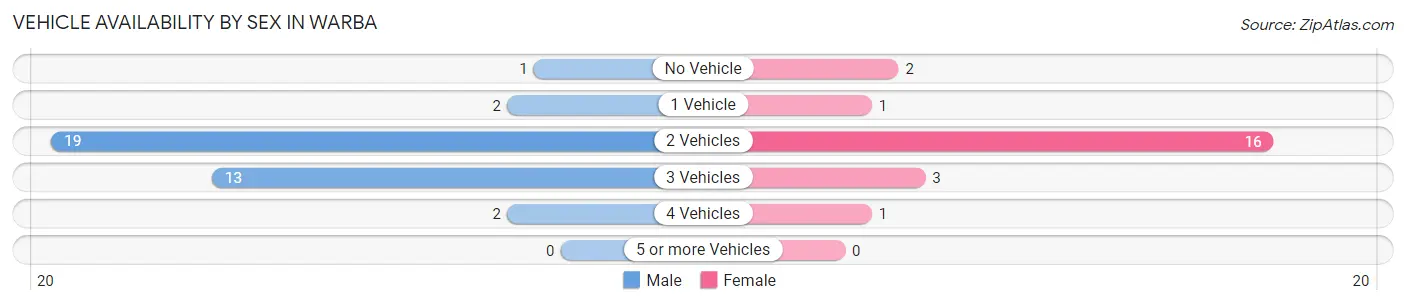
| Vehicles Available | Male | Female |
| No Vehicle | 1 (2.7%) | 2 (8.7%) |
| 1 Vehicle | 2 (5.4%) | 1 (4.3%) |
| 2 Vehicles | 19 (51.3%) | 16 (69.6%) |
| 3 Vehicles | 13 (35.1%) | 3 (13.0%) |
| 4 Vehicles | 2 (5.4%) | 1 (4.3%) |
| 5 or more Vehicles | 0 (0.0%) | 0 (0.0%) |
| Total | 37 (100.0%) | 23 (100.0%) |
Commute Time in Warba
The most frequently occuring commute durations in Warba are 25 to 29 minutes (12 commuters, 20.0%), 20 to 24 minutes (9 commuters, 15.0%), and 90 or more minutes (9 commuters, 15.0%).
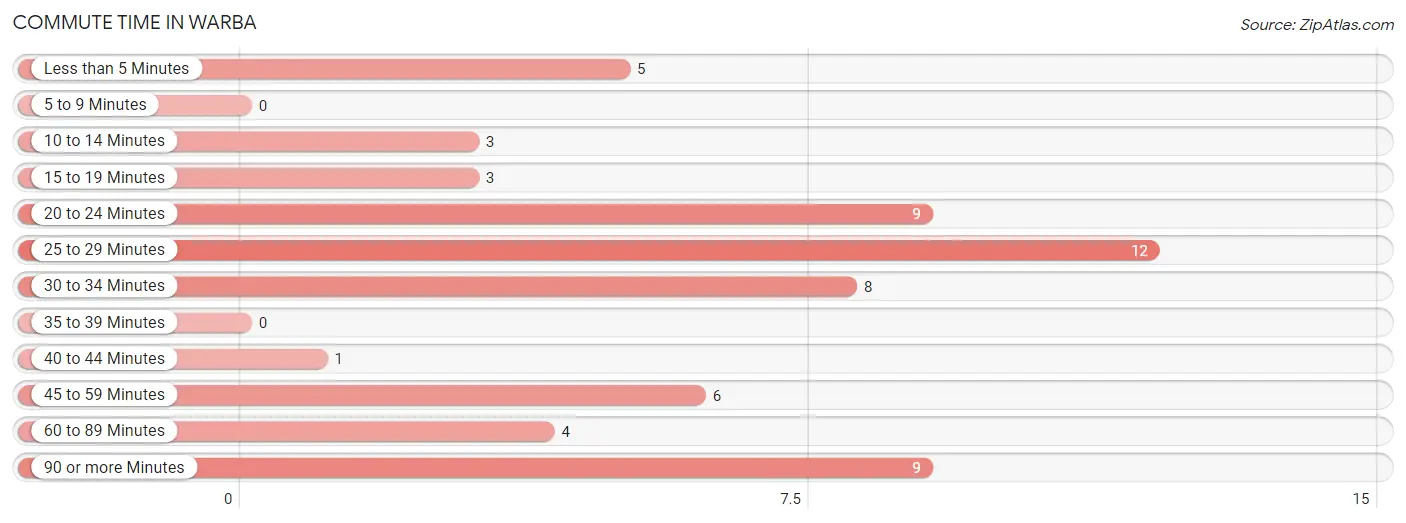
| Commute Time | # Commuters | % Commuters |
| Less than 5 Minutes | 5 | 8.3% |
| 5 to 9 Minutes | 0 | 0.0% |
| 10 to 14 Minutes | 3 | 5.0% |
| 15 to 19 Minutes | 3 | 5.0% |
| 20 to 24 Minutes | 9 | 15.0% |
| 25 to 29 Minutes | 12 | 20.0% |
| 30 to 34 Minutes | 8 | 13.3% |
| 35 to 39 Minutes | 0 | 0.0% |
| 40 to 44 Minutes | 1 | 1.7% |
| 45 to 59 Minutes | 6 | 10.0% |
| 60 to 89 Minutes | 4 | 6.7% |
| 90 or more Minutes | 9 | 15.0% |
Commute Time by Sex in Warba
The most common commute times in Warba are 25 to 29 minutes (7 commuters, 18.9%) for males and 25 to 29 minutes (5 commuters, 21.7%) for females.
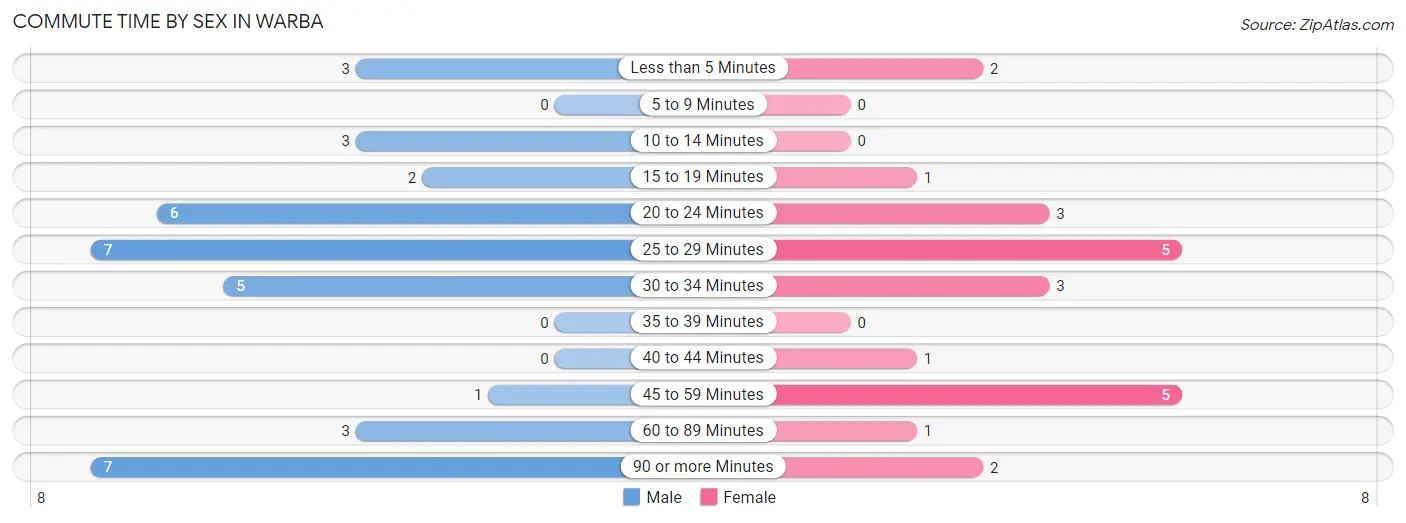
| Commute Time | Male | Female |
| Less than 5 Minutes | 3 (8.1%) | 2 (8.7%) |
| 5 to 9 Minutes | 0 (0.0%) | 0 (0.0%) |
| 10 to 14 Minutes | 3 (8.1%) | 0 (0.0%) |
| 15 to 19 Minutes | 2 (5.4%) | 1 (4.3%) |
| 20 to 24 Minutes | 6 (16.2%) | 3 (13.0%) |
| 25 to 29 Minutes | 7 (18.9%) | 5 (21.7%) |
| 30 to 34 Minutes | 5 (13.5%) | 3 (13.0%) |
| 35 to 39 Minutes | 0 (0.0%) | 0 (0.0%) |
| 40 to 44 Minutes | 0 (0.0%) | 1 (4.3%) |
| 45 to 59 Minutes | 1 (2.7%) | 5 (21.7%) |
| 60 to 89 Minutes | 3 (8.1%) | 1 (4.3%) |
| 90 or more Minutes | 7 (18.9%) | 2 (8.7%) |
Time of Departure to Work by Sex in Warba
The most frequent times of departure to work in Warba are 5:30 AM to 5:59 AM (11, 29.7%) for males and 12:00 PM to 3:59 PM (5, 21.7%) for females.
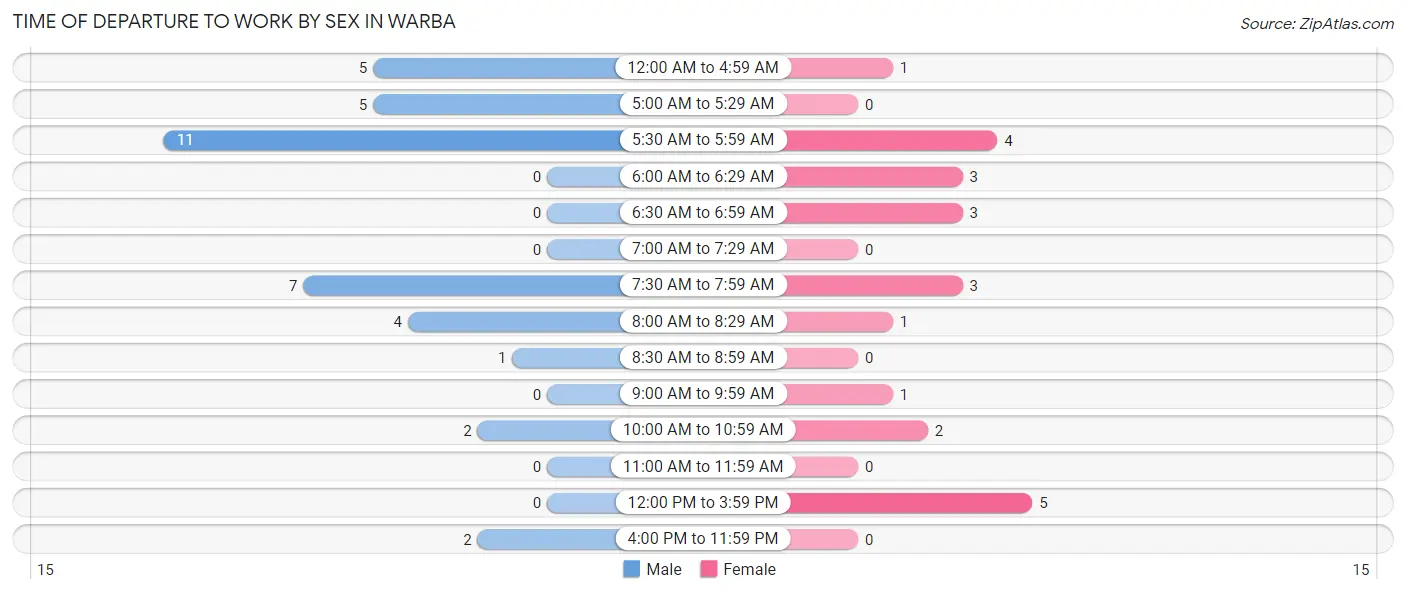
| Time of Departure | Male | Female |
| 12:00 AM to 4:59 AM | 5 (13.5%) | 1 (4.3%) |
| 5:00 AM to 5:29 AM | 5 (13.5%) | 0 (0.0%) |
| 5:30 AM to 5:59 AM | 11 (29.7%) | 4 (17.4%) |
| 6:00 AM to 6:29 AM | 0 (0.0%) | 3 (13.0%) |
| 6:30 AM to 6:59 AM | 0 (0.0%) | 3 (13.0%) |
| 7:00 AM to 7:29 AM | 0 (0.0%) | 0 (0.0%) |
| 7:30 AM to 7:59 AM | 7 (18.9%) | 3 (13.0%) |
| 8:00 AM to 8:29 AM | 4 (10.8%) | 1 (4.3%) |
| 8:30 AM to 8:59 AM | 1 (2.7%) | 0 (0.0%) |
| 9:00 AM to 9:59 AM | 0 (0.0%) | 1 (4.3%) |
| 10:00 AM to 10:59 AM | 2 (5.4%) | 2 (8.7%) |
| 11:00 AM to 11:59 AM | 0 (0.0%) | 0 (0.0%) |
| 12:00 PM to 3:59 PM | 0 (0.0%) | 5 (21.7%) |
| 4:00 PM to 11:59 PM | 2 (5.4%) | 0 (0.0%) |
| Total | 37 (100.0%) | 23 (100.0%) |
Housing Occupancy in Warba
Occupancy by Ownership in Warba
Of the total 68 dwellings in Warba, owner-occupied units account for 47 (69.1%), while renter-occupied units make up 21 (30.9%).
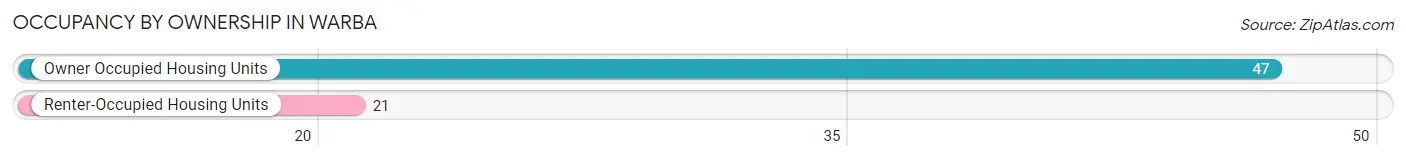
| Occupancy | # Housing Units | % Housing Units |
| Owner Occupied Housing Units | 47 | 69.1% |
| Renter-Occupied Housing Units | 21 | 30.9% |
| Total Occupied Housing Units | 68 | 100.0% |
Occupancy by Household Size in Warba
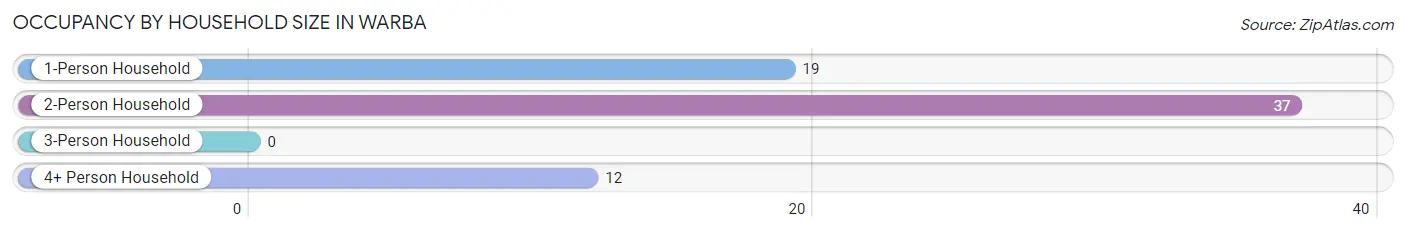
| Household Size | # Housing Units | % Housing Units |
| 1-Person Household | 19 | 27.9% |
| 2-Person Household | 37 | 54.4% |
| 3-Person Household | 0 | 0.0% |
| 4+ Person Household | 12 | 17.6% |
| Total Housing Units | 68 | 100.0% |
Occupancy by Ownership by Household Size in Warba
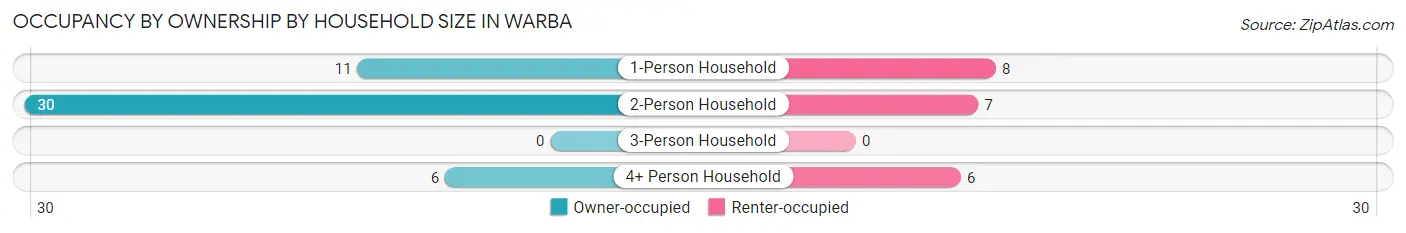
| Household Size | Owner-occupied | Renter-occupied |
| 1-Person Household | 11 (57.9%) | 8 (42.1%) |
| 2-Person Household | 30 (81.1%) | 7 (18.9%) |
| 3-Person Household | 0 (0.0%) | 0 (0.0%) |
| 4+ Person Household | 6 (50.0%) | 6 (50.0%) |
| Total Housing Units | 47 (69.1%) | 21 (30.9%) |
Occupancy by Educational Attainment in Warba
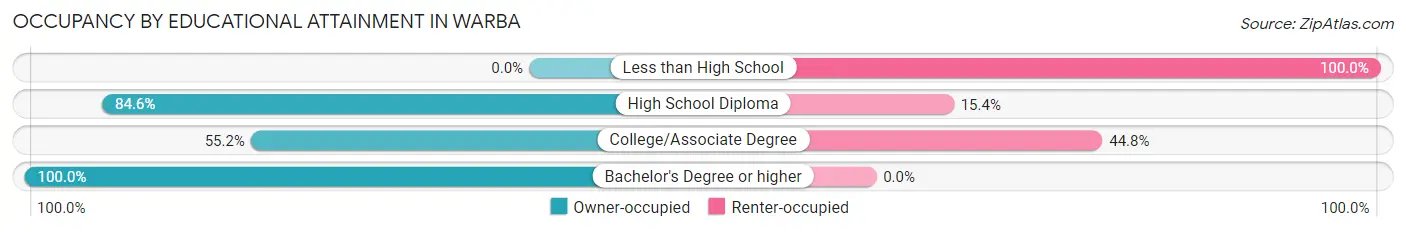
| Household Size | Owner-occupied | Renter-occupied |
| Less than High School | 0 (0.0%) | 4 (100.0%) |
| High School Diploma | 22 (84.6%) | 4 (15.4%) |
| College/Associate Degree | 16 (55.2%) | 13 (44.8%) |
| Bachelor's Degree or higher | 9 (100.0%) | 0 (0.0%) |
Occupancy by Age of Householder in Warba
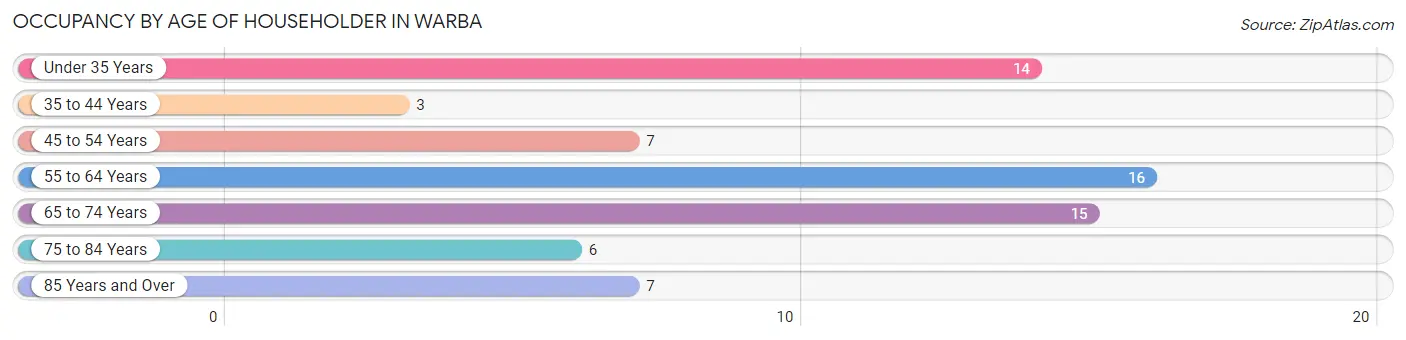
| Age Bracket | # Households | % Households |
| Under 35 Years | 14 | 20.6% |
| 35 to 44 Years | 3 | 4.4% |
| 45 to 54 Years | 7 | 10.3% |
| 55 to 64 Years | 16 | 23.5% |
| 65 to 74 Years | 15 | 22.1% |
| 75 to 84 Years | 6 | 8.8% |
| 85 Years and Over | 7 | 10.3% |
| Total | 68 | 100.0% |
Housing Finances in Warba
Median Income by Occupancy in Warba
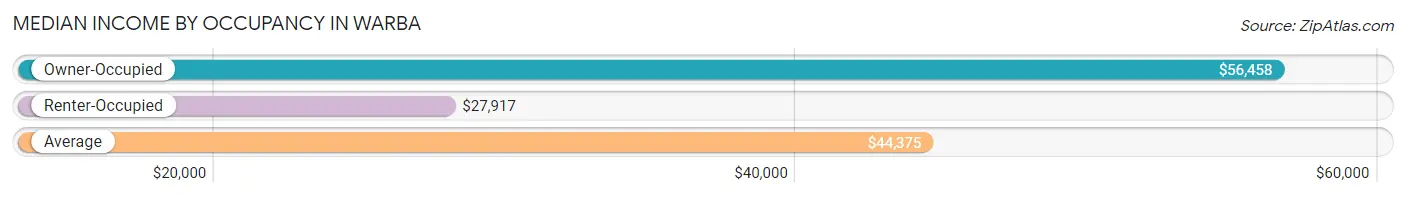
| Occupancy Type | # Households | Median Income |
| Owner-Occupied | 47 (69.1%) | $56,458 |
| Renter-Occupied | 21 (30.9%) | $27,917 |
| Average | 68 (100.0%) | $44,375 |
Occupancy by Householder Income Bracket in Warba
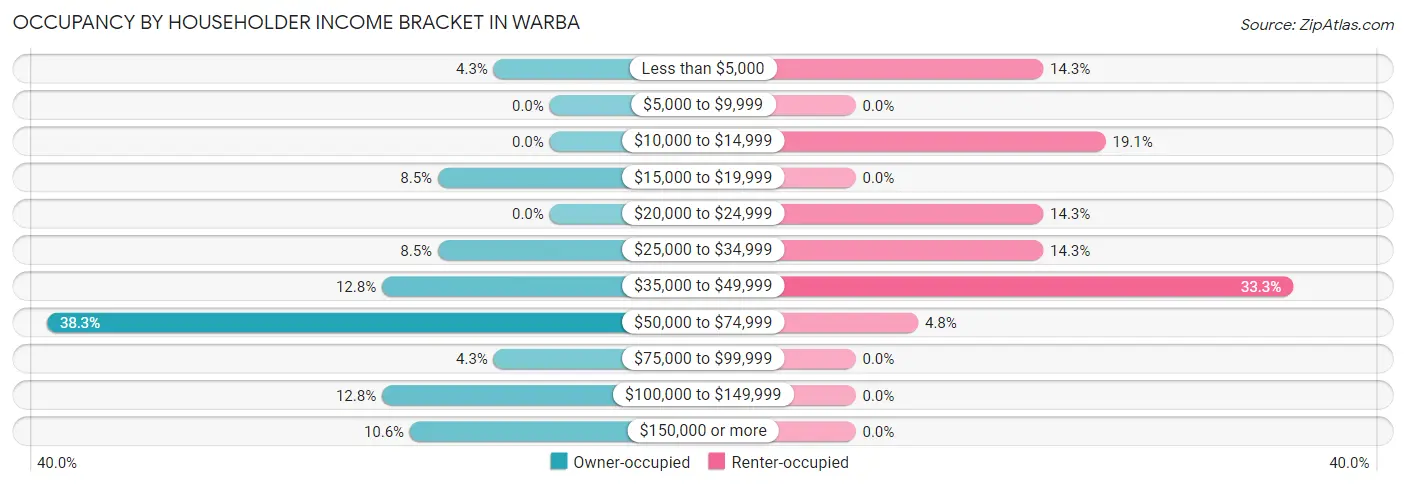
| Income Bracket | Owner-occupied | Renter-occupied |
| Less than $5,000 | 2 (4.3%) | 3 (14.3%) |
| $5,000 to $9,999 | 0 (0.0%) | 0 (0.0%) |
| $10,000 to $14,999 | 0 (0.0%) | 4 (19.1%) |
| $15,000 to $19,999 | 4 (8.5%) | 0 (0.0%) |
| $20,000 to $24,999 | 0 (0.0%) | 3 (14.3%) |
| $25,000 to $34,999 | 4 (8.5%) | 3 (14.3%) |
| $35,000 to $49,999 | 6 (12.8%) | 7 (33.3%) |
| $50,000 to $74,999 | 18 (38.3%) | 1 (4.8%) |
| $75,000 to $99,999 | 2 (4.3%) | 0 (0.0%) |
| $100,000 to $149,999 | 6 (12.8%) | 0 (0.0%) |
| $150,000 or more | 5 (10.6%) | 0 (0.0%) |
| Total | 47 (100.0%) | 21 (100.0%) |
Monthly Housing Cost Tiers in Warba
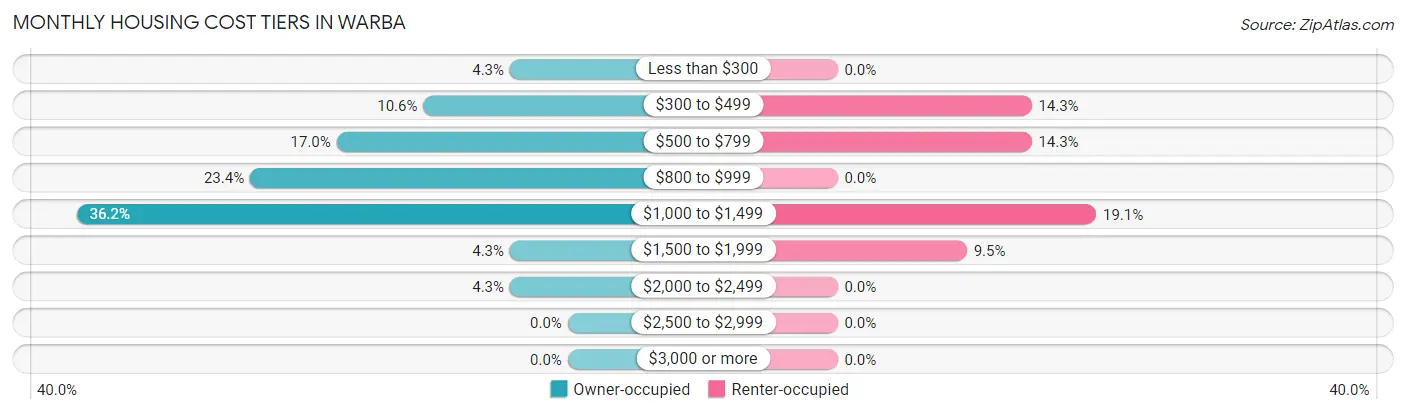
| Monthly Cost | Owner-occupied | Renter-occupied |
| Less than $300 | 2 (4.3%) | 0 (0.0%) |
| $300 to $499 | 5 (10.6%) | 3 (14.3%) |
| $500 to $799 | 8 (17.0%) | 3 (14.3%) |
| $800 to $999 | 11 (23.4%) | 0 (0.0%) |
| $1,000 to $1,499 | 17 (36.2%) | 4 (19.1%) |
| $1,500 to $1,999 | 2 (4.3%) | 2 (9.5%) |
| $2,000 to $2,499 | 2 (4.3%) | 0 (0.0%) |
| $2,500 to $2,999 | 0 (0.0%) | 0 (0.0%) |
| $3,000 or more | 0 (0.0%) | 0 (0.0%) |
| Total | 47 (100.0%) | 21 (100.0%) |
Physical Housing Characteristics in Warba
Housing Structures in Warba
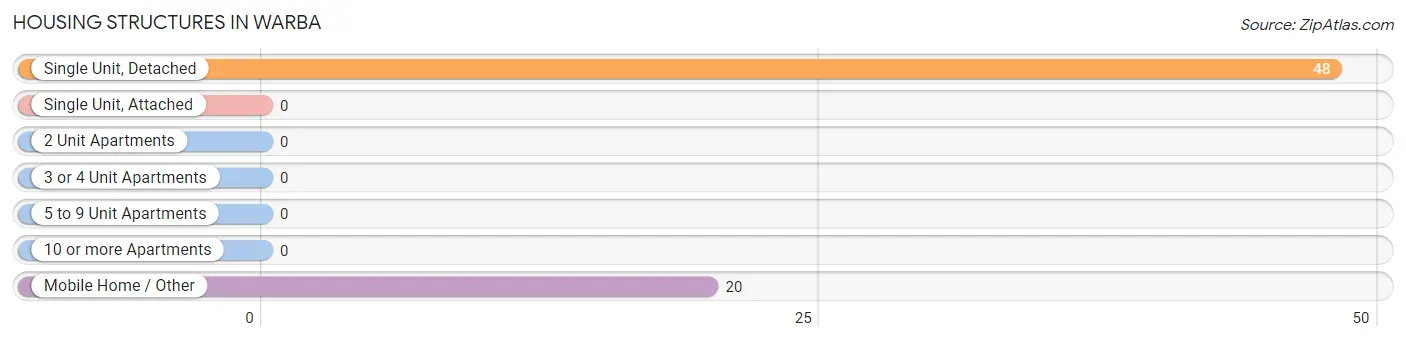
| Structure Type | # Housing Units | % Housing Units |
| Single Unit, Detached | 48 | 70.6% |
| Single Unit, Attached | 0 | 0.0% |
| 2 Unit Apartments | 0 | 0.0% |
| 3 or 4 Unit Apartments | 0 | 0.0% |
| 5 to 9 Unit Apartments | 0 | 0.0% |
| 10 or more Apartments | 0 | 0.0% |
| Mobile Home / Other | 20 | 29.4% |
| Total | 68 | 100.0% |
Housing Structures by Occupancy in Warba
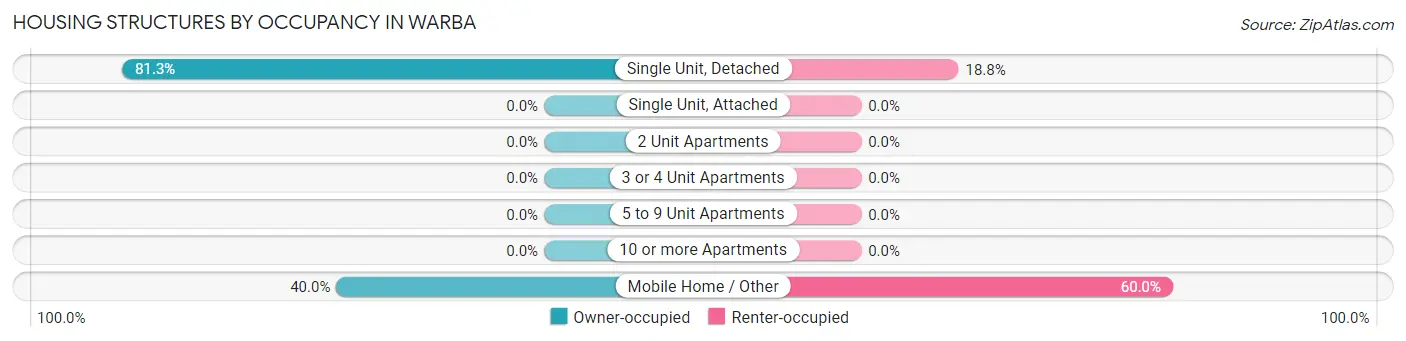
| Structure Type | Owner-occupied | Renter-occupied |
| Single Unit, Detached | 39 (81.2%) | 9 (18.8%) |
| Single Unit, Attached | 0 (0.0%) | 0 (0.0%) |
| 2 Unit Apartments | 0 (0.0%) | 0 (0.0%) |
| 3 or 4 Unit Apartments | 0 (0.0%) | 0 (0.0%) |
| 5 to 9 Unit Apartments | 0 (0.0%) | 0 (0.0%) |
| 10 or more Apartments | 0 (0.0%) | 0 (0.0%) |
| Mobile Home / Other | 8 (40.0%) | 12 (60.0%) |
| Total | 47 (69.1%) | 21 (30.9%) |
Housing Structures by Number of Rooms in Warba
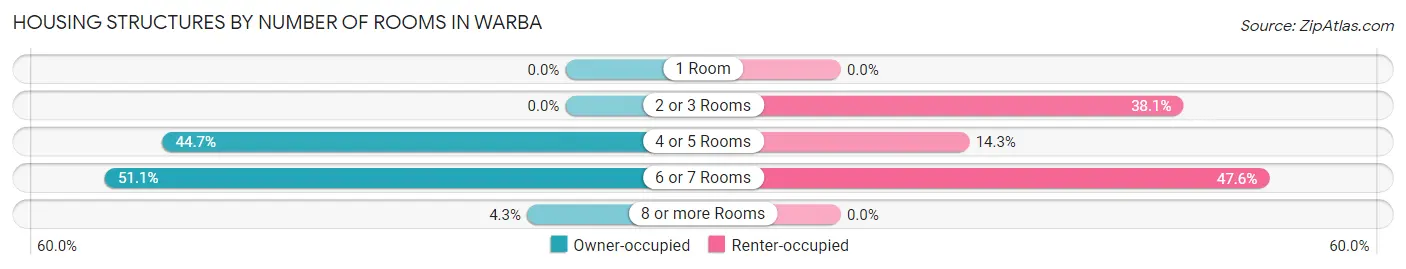
| Number of Rooms | Owner-occupied | Renter-occupied |
| 1 Room | 0 (0.0%) | 0 (0.0%) |
| 2 or 3 Rooms | 0 (0.0%) | 8 (38.1%) |
| 4 or 5 Rooms | 21 (44.7%) | 3 (14.3%) |
| 6 or 7 Rooms | 24 (51.1%) | 10 (47.6%) |
| 8 or more Rooms | 2 (4.3%) | 0 (0.0%) |
| Total | 47 (100.0%) | 21 (100.0%) |
Housing Structure by Heating Type in Warba
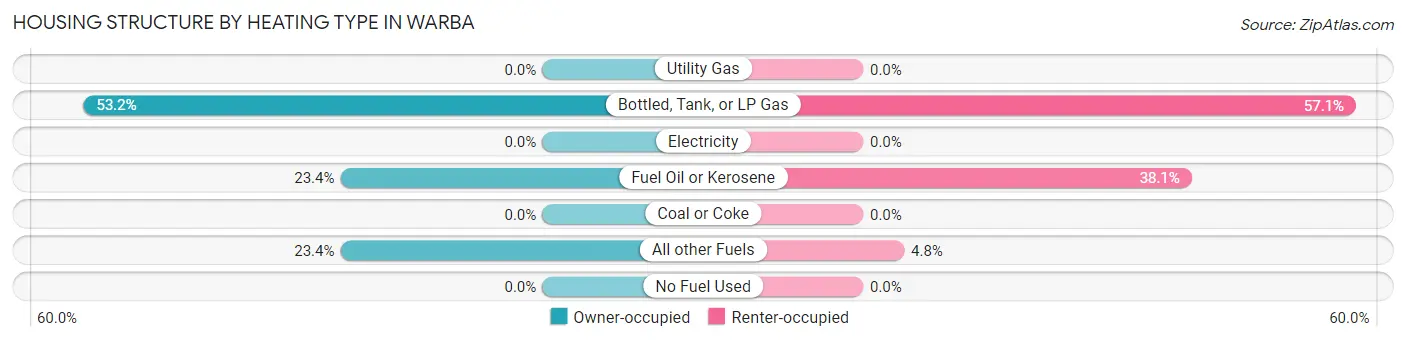
| Heating Type | Owner-occupied | Renter-occupied |
| Utility Gas | 0 (0.0%) | 0 (0.0%) |
| Bottled, Tank, or LP Gas | 25 (53.2%) | 12 (57.1%) |
| Electricity | 0 (0.0%) | 0 (0.0%) |
| Fuel Oil or Kerosene | 11 (23.4%) | 8 (38.1%) |
| Coal or Coke | 0 (0.0%) | 0 (0.0%) |
| All other Fuels | 11 (23.4%) | 1 (4.8%) |
| No Fuel Used | 0 (0.0%) | 0 (0.0%) |
| Total | 47 (100.0%) | 21 (100.0%) |
Household Vehicle Usage in Warba
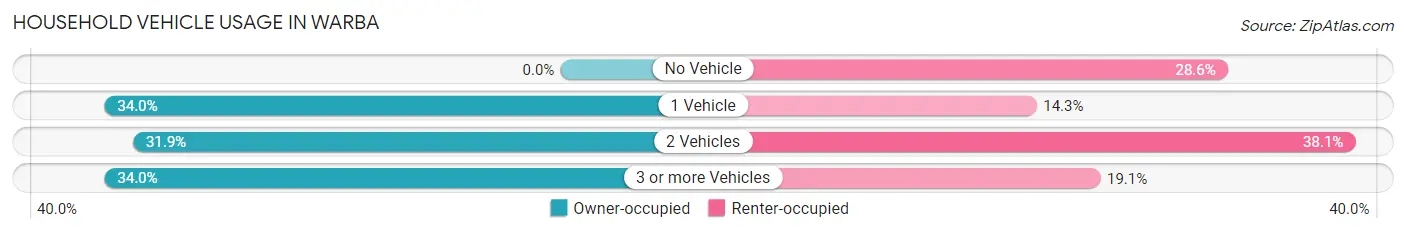
| Vehicles per Household | Owner-occupied | Renter-occupied |
| No Vehicle | 0 (0.0%) | 6 (28.6%) |
| 1 Vehicle | 16 (34.0%) | 3 (14.3%) |
| 2 Vehicles | 15 (31.9%) | 8 (38.1%) |
| 3 or more Vehicles | 16 (34.0%) | 4 (19.1%) |
| Total | 47 (100.0%) | 21 (100.0%) |
Real Estate & Mortgages in Warba
Real Estate and Mortgage Overview in Warba
| Characteristic | Without Mortgage | With Mortgage |
| Housing Units | 16 | 31 |
| Median Property Value | - | - |
| Median Household Income | $48,750 | $5 |
| Monthly Housing Costs | $533 | $0 |
| Real Estate Taxes | - | - |
Property Value by Mortgage Status in Warba
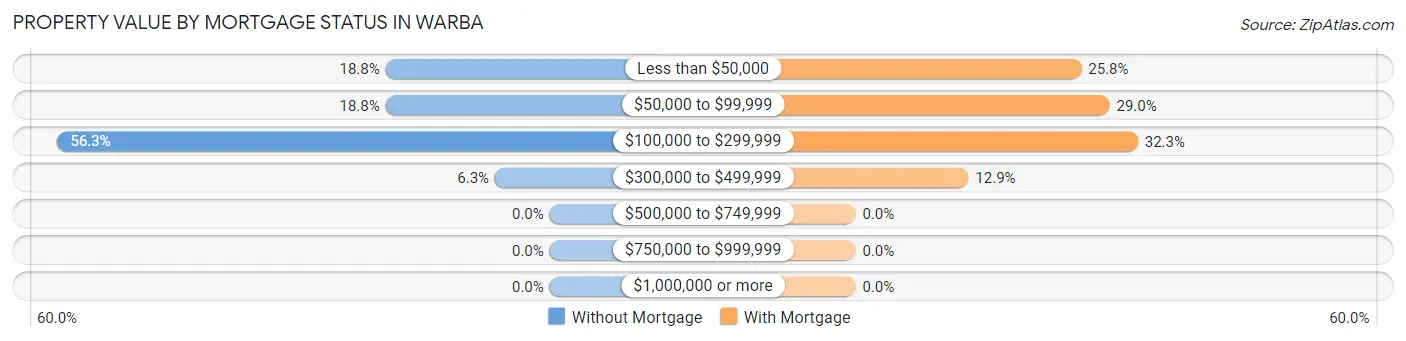
| Property Value | Without Mortgage | With Mortgage |
| Less than $50,000 | 3 (18.8%) | 8 (25.8%) |
| $50,000 to $99,999 | 3 (18.8%) | 9 (29.0%) |
| $100,000 to $299,999 | 9 (56.2%) | 10 (32.3%) |
| $300,000 to $499,999 | 1 (6.2%) | 4 (12.9%) |
| $500,000 to $749,999 | 0 (0.0%) | 0 (0.0%) |
| $750,000 to $999,999 | 0 (0.0%) | 0 (0.0%) |
| $1,000,000 or more | 0 (0.0%) | 0 (0.0%) |
| Total | 16 (100.0%) | 31 (100.0%) |
Household Income by Mortgage Status in Warba
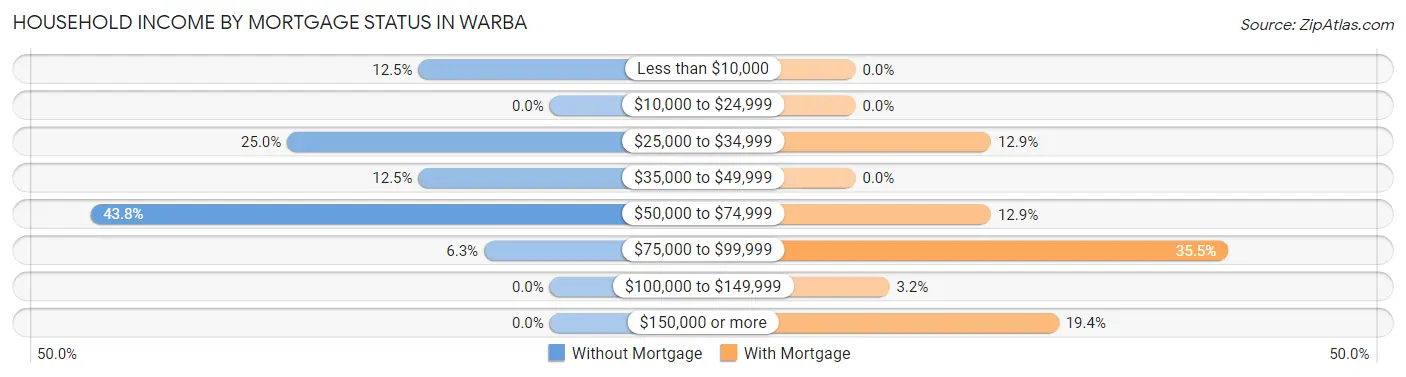
| Household Income | Without Mortgage | With Mortgage |
| Less than $10,000 | 2 (12.5%) | 0 (0.0%) |
| $10,000 to $24,999 | 0 (0.0%) | 0 (0.0%) |
| $25,000 to $34,999 | 4 (25.0%) | 4 (12.9%) |
| $35,000 to $49,999 | 2 (12.5%) | 0 (0.0%) |
| $50,000 to $74,999 | 7 (43.8%) | 4 (12.9%) |
| $75,000 to $99,999 | 1 (6.2%) | 11 (35.5%) |
| $100,000 to $149,999 | 0 (0.0%) | 1 (3.2%) |
| $150,000 or more | 0 (0.0%) | 6 (19.4%) |
| Total | 16 (100.0%) | 31 (100.0%) |
Property Value to Household Income Ratio in Warba
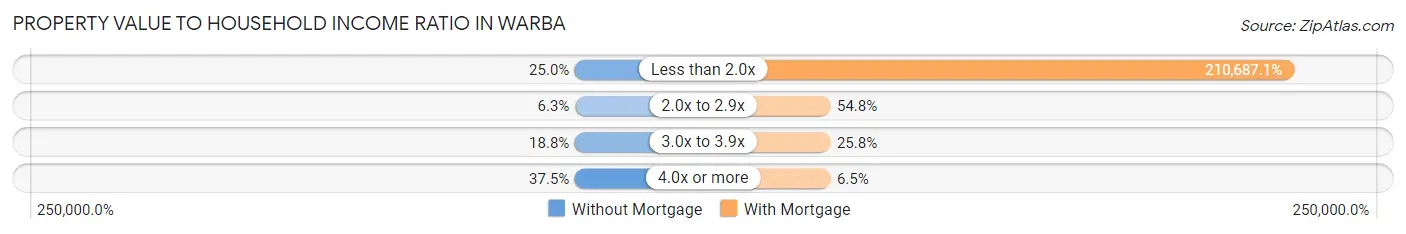
| Value-to-Income Ratio | Without Mortgage | With Mortgage |
| Less than 2.0x | 4 (25.0%) | 65,313 (210,687.1%) |
| 2.0x to 2.9x | 1 (6.2%) | 17 (54.8%) |
| 3.0x to 3.9x | 3 (18.8%) | 8 (25.8%) |
| 4.0x or more | 6 (37.5%) | 2 (6.5%) |
| Total | 16 (100.0%) | 31 (100.0%) |
Real Estate Taxes by Mortgage Status in Warba
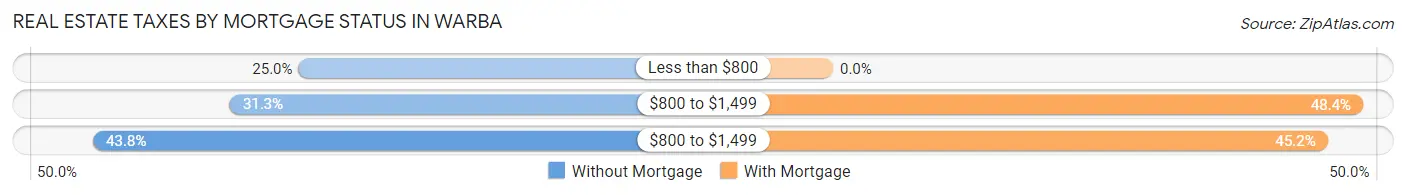
| Property Taxes | Without Mortgage | With Mortgage |
| Less than $800 | 4 (25.0%) | 0 (0.0%) |
| $800 to $1,499 | 5 (31.2%) | 15 (48.4%) |
| $800 to $1,499 | 7 (43.8%) | 14 (45.2%) |
| Total | 16 (100.0%) | 31 (100.0%) |
Health & Disability in Warba
Health Insurance Coverage by Age in Warba
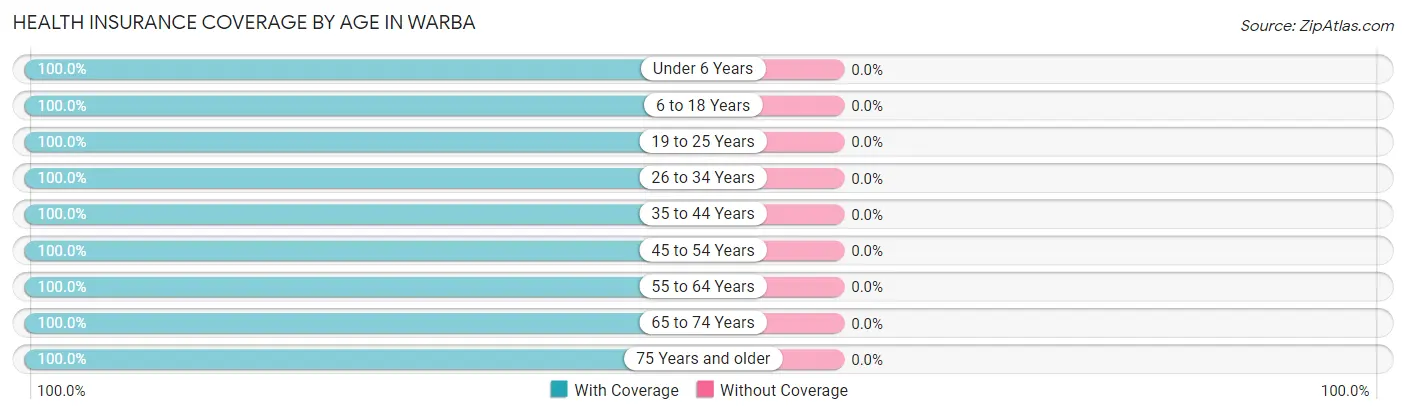
| Age Bracket | With Coverage | Without Coverage |
| Under 6 Years | 18 (100.0%) | 0 (0.0%) |
| 6 to 18 Years | 21 (100.0%) | 0 (0.0%) |
| 19 to 25 Years | 11 (100.0%) | 0 (0.0%) |
| 26 to 34 Years | 13 (100.0%) | 0 (0.0%) |
| 35 to 44 Years | 13 (100.0%) | 0 (0.0%) |
| 45 to 54 Years | 14 (100.0%) | 0 (0.0%) |
| 55 to 64 Years | 27 (100.0%) | 0 (0.0%) |
| 65 to 74 Years | 29 (100.0%) | 0 (0.0%) |
| 75 Years and older | 15 (100.0%) | 0 (0.0%) |
| Total | 161 (100.0%) | 0 (0.0%) |
Health Insurance Coverage by Citizenship Status in Warba
| Citizenship Status | With Coverage | Without Coverage |
| Native Born | 18 (100.0%) | 0 (0.0%) |
| Foreign Born, Citizen | 21 (100.0%) | 0 (0.0%) |
| Foreign Born, not a Citizen | 11 (100.0%) | 0 (0.0%) |
Health Insurance Coverage by Household Income in Warba
| Household Income | With Coverage | Without Coverage |
| Under $25,000 | 30 (100.0%) | 0 (0.0%) |
| $25,000 to $49,999 | 46 (100.0%) | 0 (0.0%) |
| $50,000 to $74,999 | 51 (100.0%) | 0 (0.0%) |
| $75,000 to $99,999 | 4 (100.0%) | 0 (0.0%) |
| $100,000 and over | 30 (100.0%) | 0 (0.0%) |
Public vs Private Health Insurance Coverage by Age in Warba
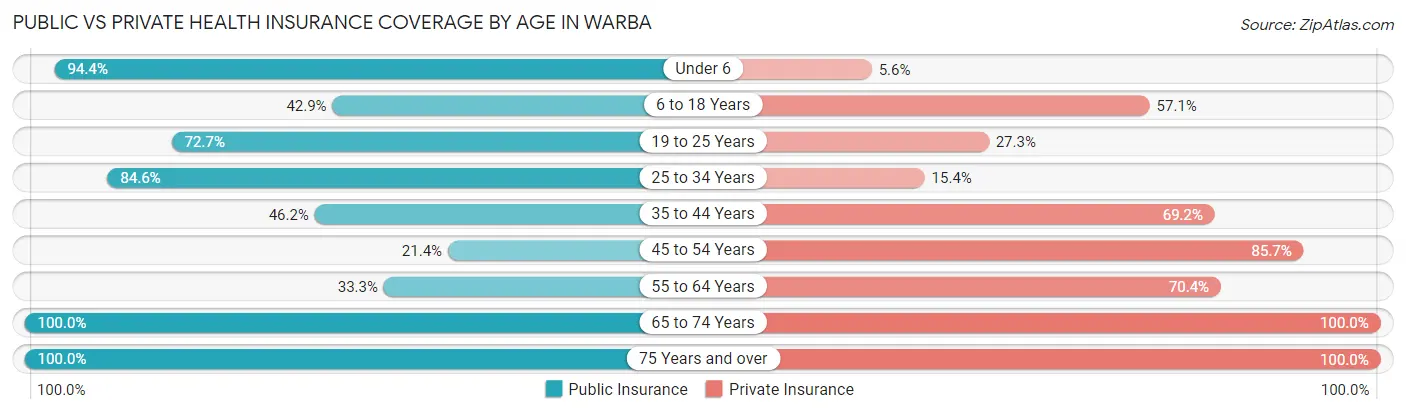
| Age Bracket | Public Insurance | Private Insurance |
| Under 6 | 17 (94.4%) | 1 (5.6%) |
| 6 to 18 Years | 9 (42.9%) | 12 (57.1%) |
| 19 to 25 Years | 8 (72.7%) | 3 (27.3%) |
| 25 to 34 Years | 11 (84.6%) | 2 (15.4%) |
| 35 to 44 Years | 6 (46.2%) | 9 (69.2%) |
| 45 to 54 Years | 3 (21.4%) | 12 (85.7%) |
| 55 to 64 Years | 9 (33.3%) | 19 (70.4%) |
| 65 to 74 Years | 29 (100.0%) | 29 (100.0%) |
| 75 Years and over | 15 (100.0%) | 15 (100.0%) |
| Total | 107 (66.5%) | 102 (63.3%) |
Disability Status by Sex by Age in Warba
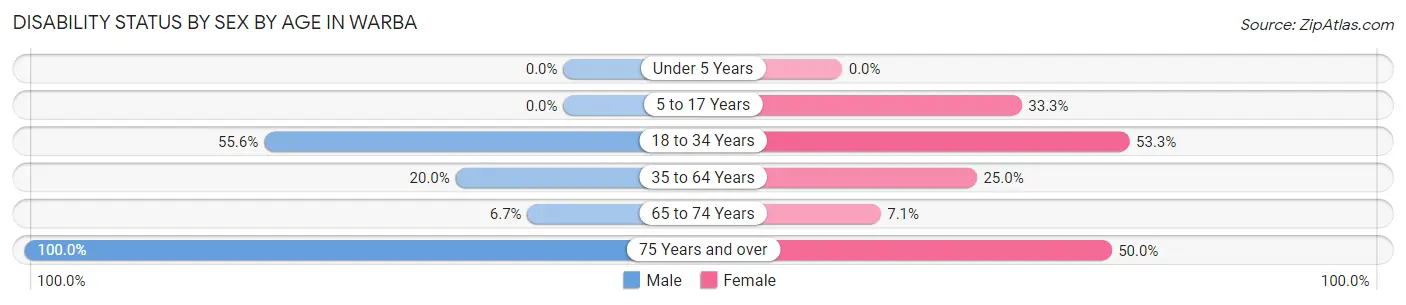
| Age Bracket | Male | Female |
| Under 5 Years | 0 (0.0%) | 0 (0.0%) |
| 5 to 17 Years | 0 (0.0%) | 2 (33.3%) |
| 18 to 34 Years | 5 (55.6%) | 8 (53.3%) |
| 35 to 64 Years | 6 (20.0%) | 6 (25.0%) |
| 65 to 74 Years | 1 (6.7%) | 1 (7.1%) |
| 75 Years and over | 5 (100.0%) | 5 (50.0%) |
Disability Class by Sex by Age in Warba
Disability Class: Hearing Difficulty
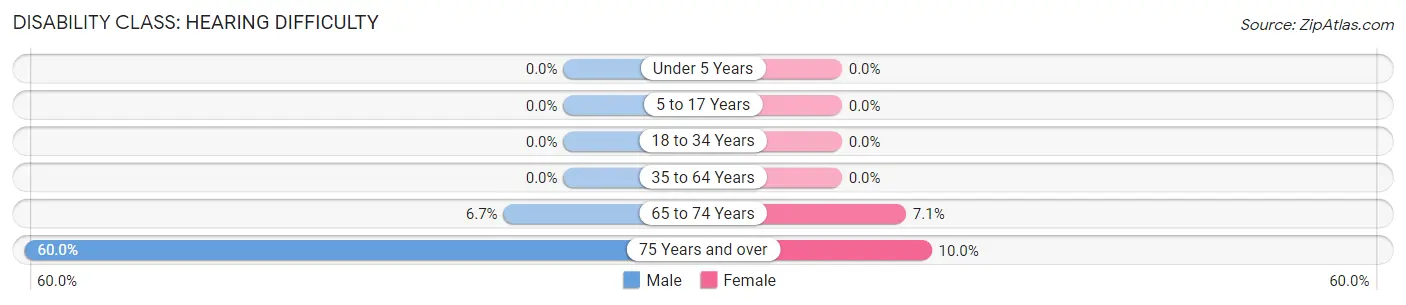
| Age Bracket | Male | Female |
| Under 5 Years | 0 (0.0%) | 0 (0.0%) |
| 5 to 17 Years | 0 (0.0%) | 0 (0.0%) |
| 18 to 34 Years | 0 (0.0%) | 0 (0.0%) |
| 35 to 64 Years | 0 (0.0%) | 0 (0.0%) |
| 65 to 74 Years | 1 (6.7%) | 1 (7.1%) |
| 75 Years and over | 3 (60.0%) | 1 (10.0%) |
Disability Class: Vision Difficulty
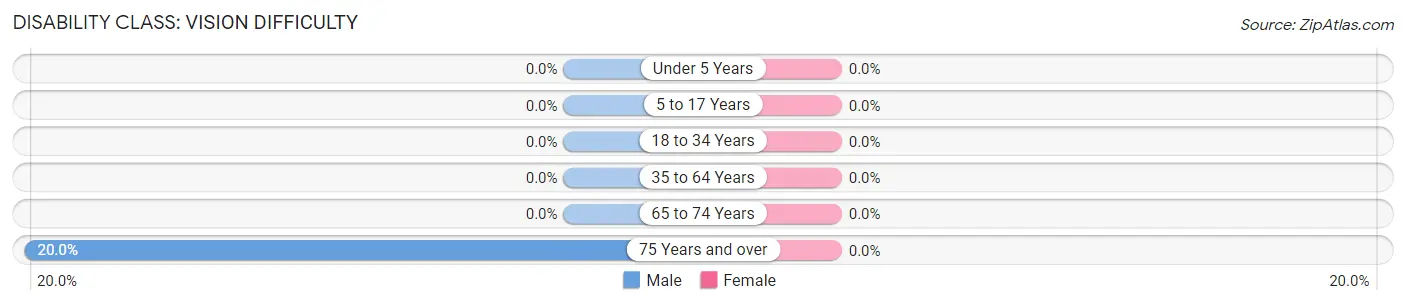
| Age Bracket | Male | Female |
| Under 5 Years | 0 (0.0%) | 0 (0.0%) |
| 5 to 17 Years | 0 (0.0%) | 0 (0.0%) |
| 18 to 34 Years | 0 (0.0%) | 0 (0.0%) |
| 35 to 64 Years | 0 (0.0%) | 0 (0.0%) |
| 65 to 74 Years | 0 (0.0%) | 0 (0.0%) |
| 75 Years and over | 1 (20.0%) | 0 (0.0%) |
Disability Class: Cognitive Difficulty
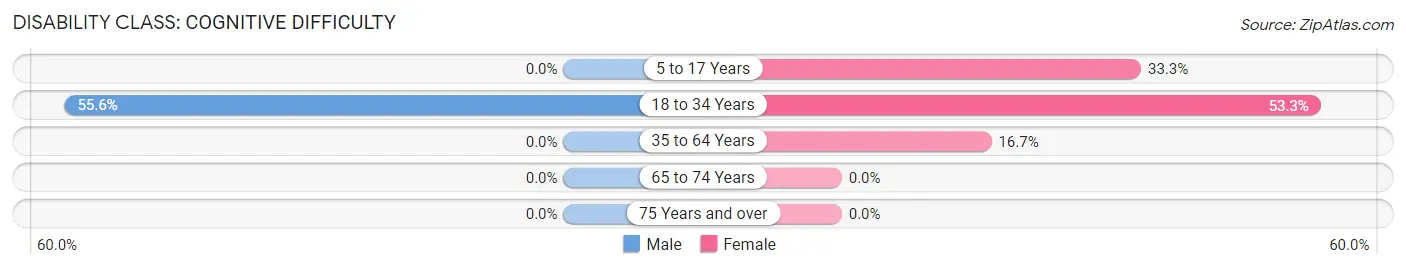
| Age Bracket | Male | Female |
| 5 to 17 Years | 0 (0.0%) | 2 (33.3%) |
| 18 to 34 Years | 5 (55.6%) | 8 (53.3%) |
| 35 to 64 Years | 0 (0.0%) | 4 (16.7%) |
| 65 to 74 Years | 0 (0.0%) | 0 (0.0%) |
| 75 Years and over | 0 (0.0%) | 0 (0.0%) |
Disability Class: Ambulatory Difficulty
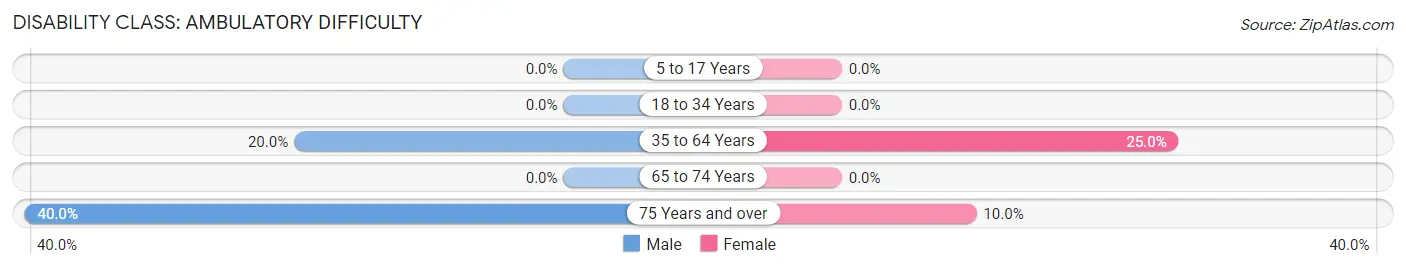
| Age Bracket | Male | Female |
| 5 to 17 Years | 0 (0.0%) | 0 (0.0%) |
| 18 to 34 Years | 0 (0.0%) | 0 (0.0%) |
| 35 to 64 Years | 6 (20.0%) | 6 (25.0%) |
| 65 to 74 Years | 0 (0.0%) | 0 (0.0%) |
| 75 Years and over | 2 (40.0%) | 1 (10.0%) |
Disability Class: Self-Care Difficulty
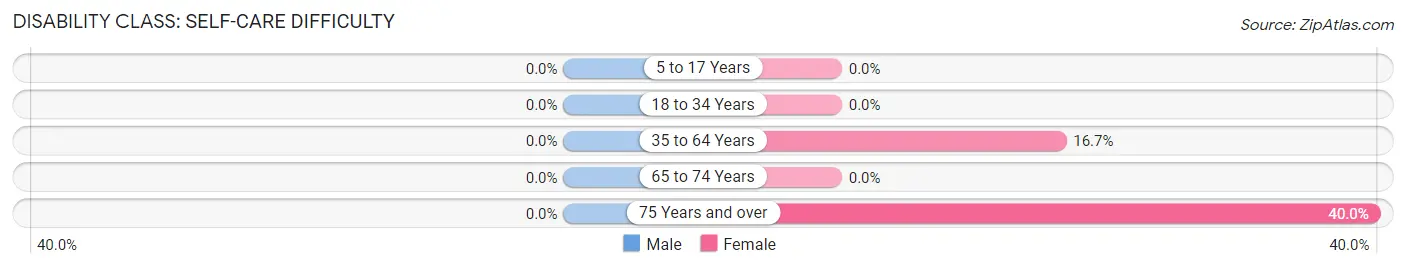
| Age Bracket | Male | Female |
| 5 to 17 Years | 0 (0.0%) | 0 (0.0%) |
| 18 to 34 Years | 0 (0.0%) | 0 (0.0%) |
| 35 to 64 Years | 0 (0.0%) | 4 (16.7%) |
| 65 to 74 Years | 0 (0.0%) | 0 (0.0%) |
| 75 Years and over | 0 (0.0%) | 4 (40.0%) |
Technology Access in Warba
Computing Device Access in Warba
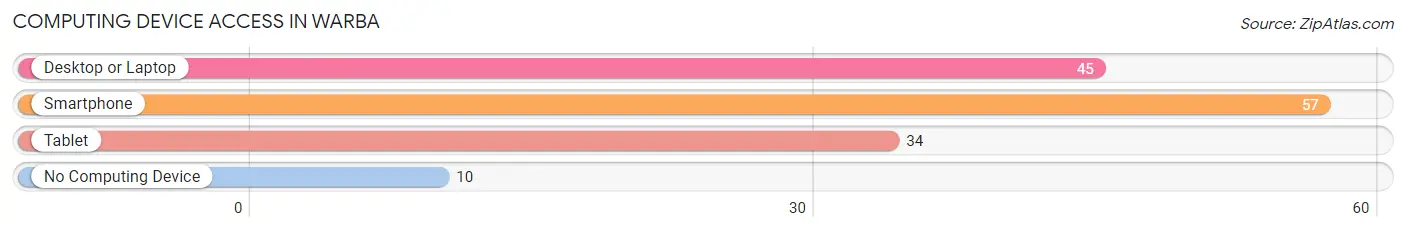
| Device Type | # Households | % Households |
| Desktop or Laptop | 45 | 66.2% |
| Smartphone | 57 | 83.8% |
| Tablet | 34 | 50.0% |
| No Computing Device | 10 | 14.7% |
| Total | 68 | 100.0% |
Internet Access in Warba
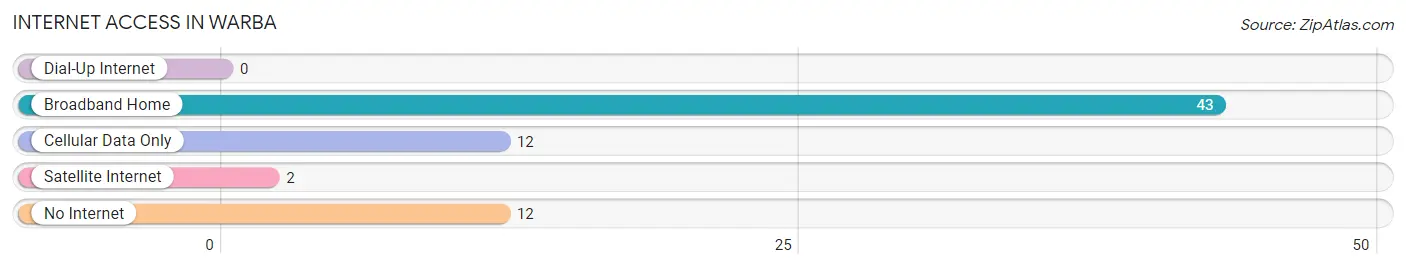
| Internet Type | # Households | % Households |
| Dial-Up Internet | 0 | 0.0% |
| Broadband Home | 43 | 63.2% |
| Cellular Data Only | 12 | 17.6% |
| Satellite Internet | 2 | 2.9% |
| No Internet | 12 | 17.6% |
| Total | 68 | 100.0% |
Warba Summary
Warba, Minnesota is a small town located in the northern part of the state, in Itasca County. It is situated on the banks of the Warba River, and is surrounded by the Chippewa National Forest. The town was founded in 1887, and has a population of just over 500 people.
Geography
Warba is located in the northern part of Minnesota, in Itasca County. It is situated on the banks of the Warba River, and is surrounded by the Chippewa National Forest. The town is located at an elevation of 1,072 feet above sea level. The town is located in a rural area, and is surrounded by forests and lakes. The nearest major city is Grand Rapids, which is located about 25 miles to the south.
Climate
Warba has a humid continental climate, with cold winters and warm summers. The average temperature in the winter is around 10°F, and the average temperature in the summer is around 70°F. The town receives an average of 33 inches of precipitation per year, with most of it falling in the spring and summer months.
Demographics
As of the 2010 census, Warba had a population of 517 people. The racial makeup of the town was 97.3% White, 0.6% Native American, 0.2% Asian, 0.2% from other races, and 1.7% from two or more races. The median age of the population was 44.7 years. The median household income was $37,500, and the median family income was $45,000.
Economy
The economy of Warba is largely based on tourism and forestry. The town is home to several small businesses, including a general store, a gas station, and a restaurant. The town is also home to a sawmill, which provides jobs for many of the town's residents. The town is also home to a number of recreational activities, including fishing, hunting, and camping.
History
Warba was founded in 1887 by a group of settlers from Wisconsin. The town was named after the Warba River, which runs through the area. The town was originally a logging town, and the sawmill was the main source of employment for the town's residents. In the early 1900s, the town began to attract tourists, and the economy shifted to focus more on tourism. The town was incorporated in 1910, and has remained a small, rural community ever since.
Conclusion
Warba, Minnesota is a small town located in the northern part of the state, in Itasca County. It is situated on the banks of the Warba River, and is surrounded by the Chippewa National Forest. The town was founded in 1887, and has a population of just over 500 people. The economy of Warba is largely based on tourism and forestry, and the town is home to several small businesses. The town is also home to a number of recreational activities, including fishing, hunting, and camping. Warba is a small, rural community that has remained largely unchanged since its founding in 1887.
Common Questions
What is Per Capita Income in Warba?
Per Capita income in Warba is $26,314.
What is the Median Family Income in Warba?
Median Family Income in Warba is $55,417.
What is the Median Household income in Warba?
Median Household Income in Warba is $44,375.
What is Income or Wage Gap in Warba?
Income or Wage Gap in Warba is 13.6%.
Women in Warba earn 86.4 cents for every dollar earned by a man.
What is Inequality or Gini Index in Warba?
Inequality or Gini Index in Warba is 0.44.
What is the Total Population of Warba?
Total Population of Warba is 161.
What is the Total Male Population of Warba?
Total Male Population of Warba is 91.
What is the Total Female Population of Warba?
Total Female Population of Warba is 70.
What is the Ratio of Males per 100 Females in Warba?
There are 130.00 Males per 100 Females in Warba.
What is the Ratio of Females per 100 Males in Warba?
There are 76.92 Females per 100 Males in Warba.
What is the Median Population Age in Warba?
Median Population Age in Warba is 46.6 Years.
What is the Average Family Size in Warba
Average Family Size in Warba is 2.9 People.
What is the Average Household Size in Warba
Average Household Size in Warba is 2.4 People.
How Large is the Labor Force in Warba?
There are 67 People in the Labor Forcein in Warba.
What is the Percentage of People in the Labor Force in Warba?
54.0% of People are in the Labor Force in Warba.
What is the Unemployment Rate in Warba?
Unemployment Rate in Warba is 10.4%.