Vergas, MN Map & Demographics
Vergas Map
Vergas Overview
$53,406
PER CAPITA INCOME
$98,125
AVG FAMILY INCOME
$68,125
AVG HOUSEHOLD INCOME
36.9%
WAGE / INCOME GAP [ % ]
63.1¢/ $1
WAGE / INCOME GAP [ $ ]
0.52
INEQUALITY / GINI INDEX
242
TOTAL POPULATION
118
MALE POPULATION
124
FEMALE POPULATION
95.16
MALES / 100 FEMALES
105.08
FEMALES / 100 MALES
57.4
MEDIAN AGE
3.0
AVG FAMILY SIZE
1.9
AVG HOUSEHOLD SIZE
114
LABOR FORCE [ PEOPLE ]
52.3%
PERCENT IN LABOR FORCE
2.6%
UNEMPLOYMENT RATE
Vergas Zip Codes
Vergas Area Codes
Income in Vergas
Income Overview in Vergas
Per Capita Income in Vergas is $53,406, while median incomes of families and households are $98,125 and $68,125 respectively.
| Characteristic | Number | Measure |
| Per Capita Income | 242 | $53,406 |
| Median Family Income | 51 | $98,125 |
| Mean Family Income | 51 | $96,641 |
| Median Household Income | 126 | $68,125 |
| Mean Household Income | 126 | $97,719 |
| Income Deficit | 51 | $0 |
| Wage / Income Gap (%) | 242 | 36.94% |
| Wage / Income Gap ($) | 242 | 63.06¢ per $1 |
| Gini / Inequality Index | 242 | 0.52 |
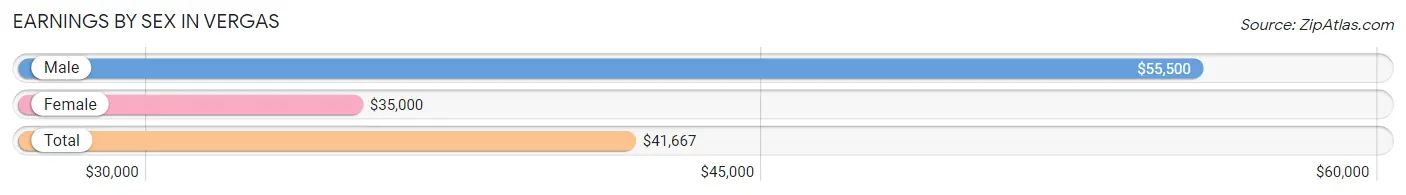
Earnings by Sex in Vergas
Average Earnings in Vergas are $41,667, $55,500 for men and $35,000 for women, a difference of 36.9%.
| Sex | Number | Average Earnings |
| Male | 62 (47.7%) | $55,500 |
| Female | 68 (52.3%) | $35,000 |
| Total | 130 (100.0%) | $41,667 |
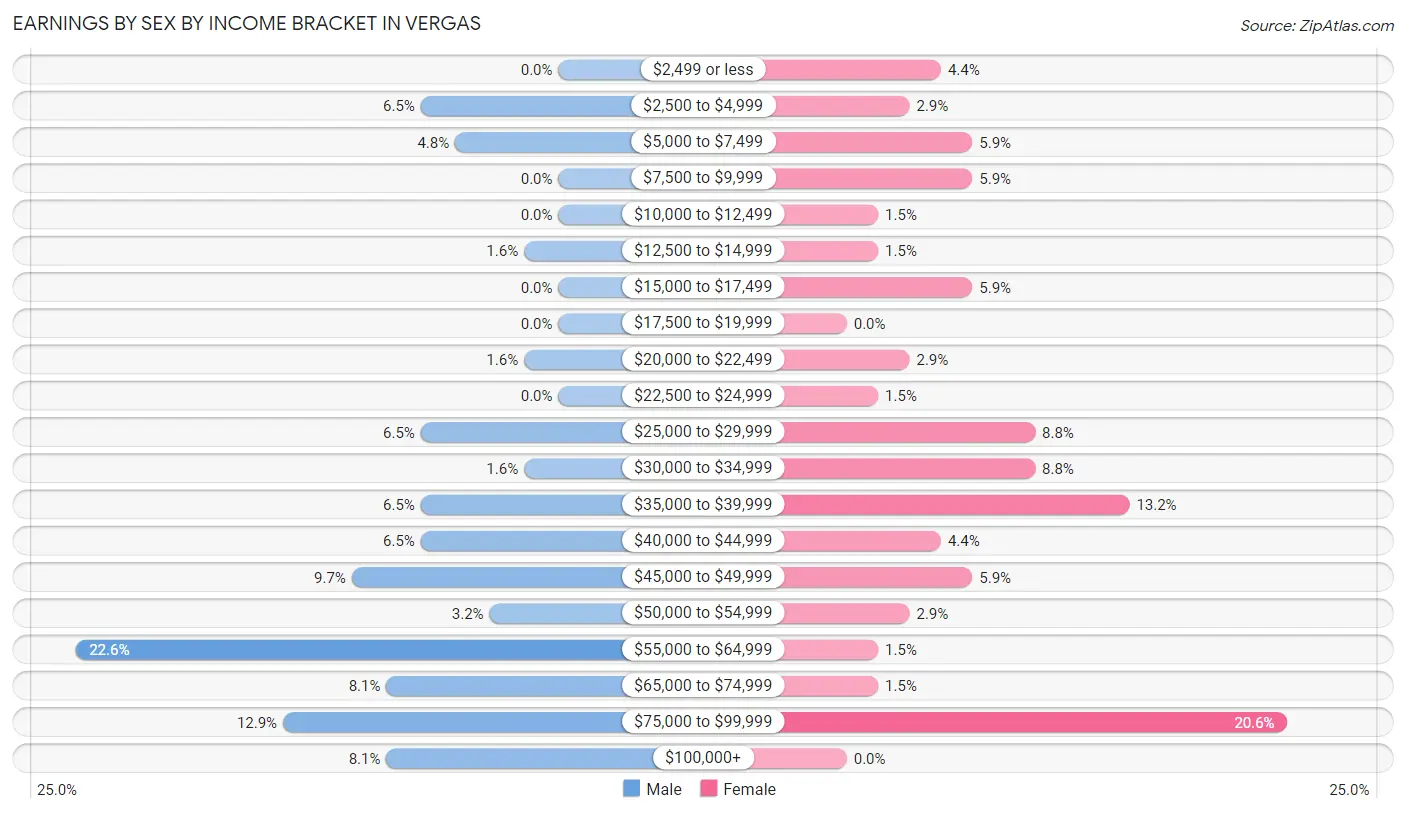
Earnings by Sex by Income Bracket in Vergas
The most common earnings brackets in Vergas are $55,000 to $64,999 for men (14 | 22.6%) and $75,000 to $99,999 for women (14 | 20.6%).
| Income | Male | Female |
| $2,499 or less | 0 (0.0%) | 3 (4.4%) |
| $2,500 to $4,999 | 4 (6.5%) | 2 (2.9%) |
| $5,000 to $7,499 | 3 (4.8%) | 4 (5.9%) |
| $7,500 to $9,999 | 0 (0.0%) | 4 (5.9%) |
| $10,000 to $12,499 | 0 (0.0%) | 1 (1.5%) |
| $12,500 to $14,999 | 1 (1.6%) | 1 (1.5%) |
| $15,000 to $17,499 | 0 (0.0%) | 4 (5.9%) |
| $17,500 to $19,999 | 0 (0.0%) | 0 (0.0%) |
| $20,000 to $22,499 | 1 (1.6%) | 2 (2.9%) |
| $22,500 to $24,999 | 0 (0.0%) | 1 (1.5%) |
| $25,000 to $29,999 | 4 (6.5%) | 6 (8.8%) |
| $30,000 to $34,999 | 1 (1.6%) | 6 (8.8%) |
| $35,000 to $39,999 | 4 (6.5%) | 9 (13.2%) |
| $40,000 to $44,999 | 4 (6.5%) | 3 (4.4%) |
| $45,000 to $49,999 | 6 (9.7%) | 4 (5.9%) |
| $50,000 to $54,999 | 2 (3.2%) | 2 (2.9%) |
| $55,000 to $64,999 | 14 (22.6%) | 1 (1.5%) |
| $65,000 to $74,999 | 5 (8.1%) | 1 (1.5%) |
| $75,000 to $99,999 | 8 (12.9%) | 14 (20.6%) |
| $100,000+ | 5 (8.1%) | 0 (0.0%) |
| Total | 62 (100.0%) | 68 (100.0%) |
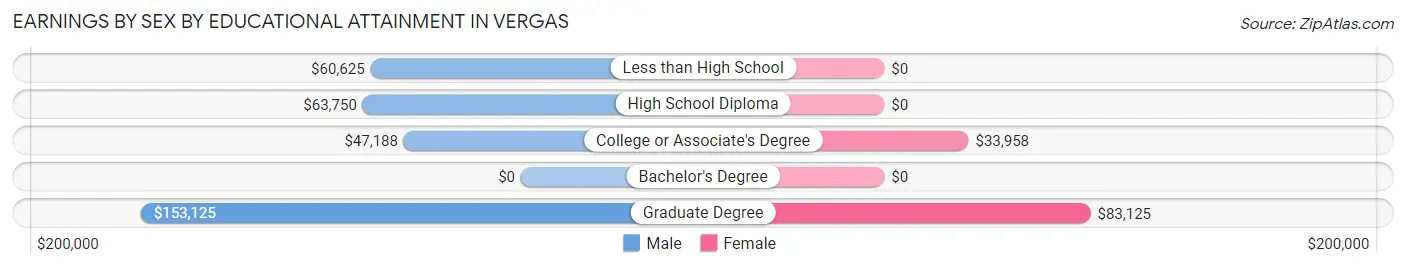
Earnings by Sex by Educational Attainment in Vergas
Average earnings in Vergas are $56,500 for men and $36,667 for women, a difference of 35.1%. Men with an educational attainment of graduate degree enjoy the highest average annual earnings of $153,125, while those with college or associate's degree education earn the least with $47,188. Women with an educational attainment of graduate degree earn the most with the average annual earnings of $83,125, while those with college or associate's degree education have the smallest earnings of $33,958.
| Educational Attainment | Male Income | Female Income |
| Less than High School | $60,625 | $0 |
| High School Diploma | $63,750 | $0 |
| College or Associate's Degree | $47,188 | $33,958 |
| Bachelor's Degree | - | - |
| Graduate Degree | $153,125 | $83,125 |
| Total | $56,500 | $36,667 |
Family Income in Vergas
Family Income Brackets in Vergas
According to the Vergas family income data, there are 16 families falling into the $100,000 to $149,999 income range, which is the most common income bracket and makes up 31.4% of all families.
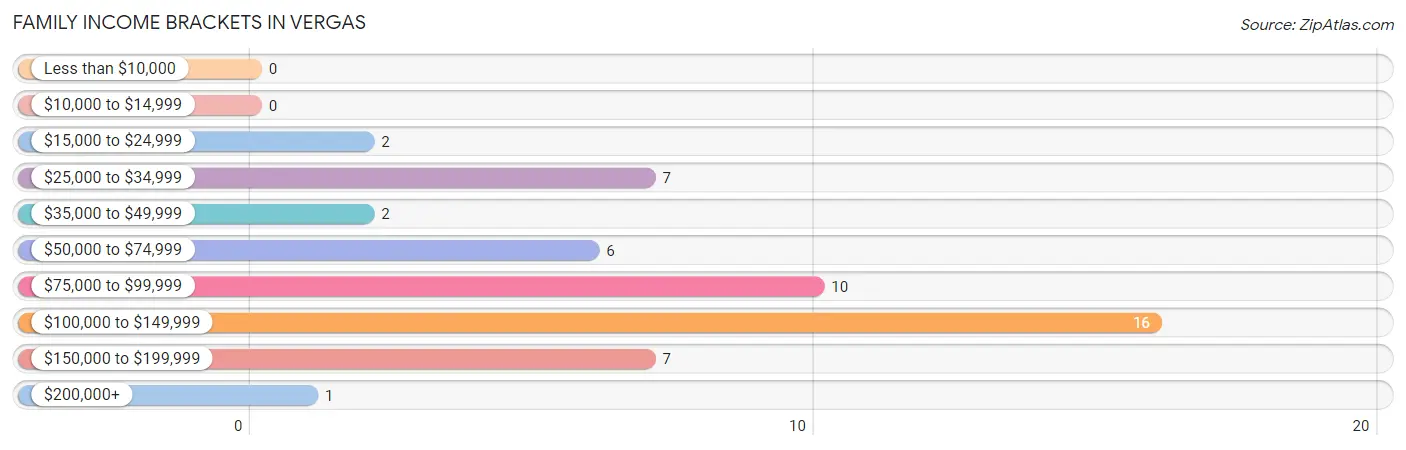
| Income Bracket | # Families | % Families |
| Less than $10,000 | 0 | 0.0% |
| $10,000 to $14,999 | 0 | 0.0% |
| $15,000 to $24,999 | 2 | 3.9% |
| $25,000 to $34,999 | 7 | 13.7% |
| $35,000 to $49,999 | 2 | 3.9% |
| $50,000 to $74,999 | 6 | 11.8% |
| $75,000 to $99,999 | 10 | 19.6% |
| $100,000 to $149,999 | 16 | 31.4% |
| $150,000 to $199,999 | 7 | 13.7% |
| $200,000+ | 1 | 2.0% |
Family Income by Famaliy Size in Vergas
3-person families (10 | 19.6%) account for the highest median family income in Vergas with $121,250 per family, while 2-person families (34 | 66.7%) have the highest median income of $46,250 per family member.
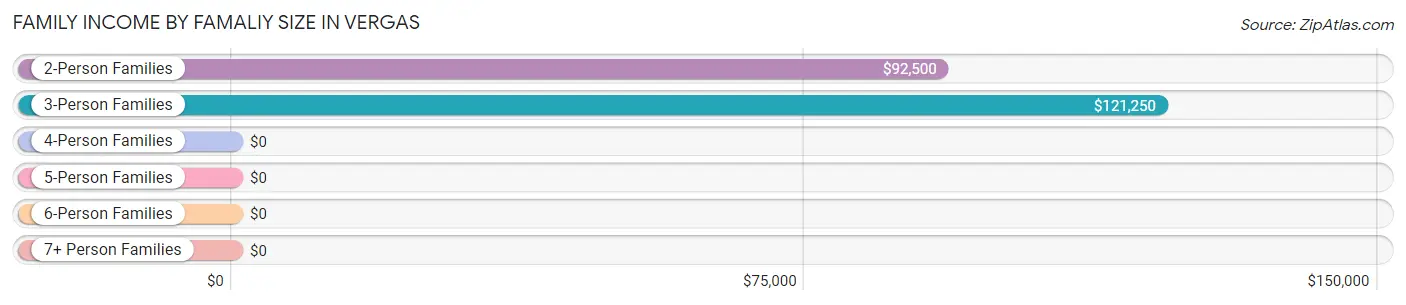
| Income Bracket | # Families | Median Income |
| 2-Person Families | 34 (66.7%) | $92,500 |
| 3-Person Families | 10 (19.6%) | $121,250 |
| 4-Person Families | 4 (7.8%) | $0 |
| 5-Person Families | 0 (0.0%) | $0 |
| 6-Person Families | 1 (2.0%) | $0 |
| 7+ Person Families | 2 (3.9%) | $0 |
| Total | 51 (100.0%) | $98,125 |
Family Income by Number of Earners in Vergas
The median family income in Vergas is $98,125, with families comprising 2 earners (18) having the highest median family income of $123,750, while families with 1 earner (13) have the lowest median family income of $56,250, accounting for 35.3% and 25.5% of families, respectively.
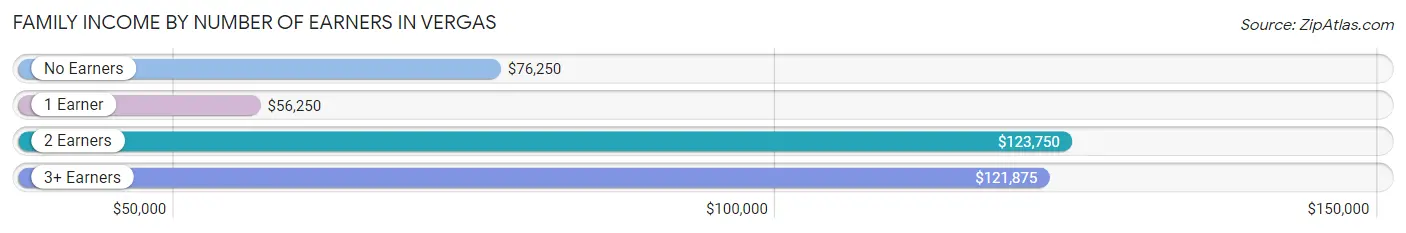
| Number of Earners | # Families | Median Income |
| No Earners | 15 (29.4%) | $76,250 |
| 1 Earner | 13 (25.5%) | $56,250 |
| 2 Earners | 18 (35.3%) | $123,750 |
| 3+ Earners | 5 (9.8%) | $121,875 |
| Total | 51 (100.0%) | $98,125 |
Household Income in Vergas
Household Income Brackets in Vergas
With 24 households falling in the category, the $75,000 to $99,999 income range is the most frequent in Vergas, accounting for 19.1% of all households.
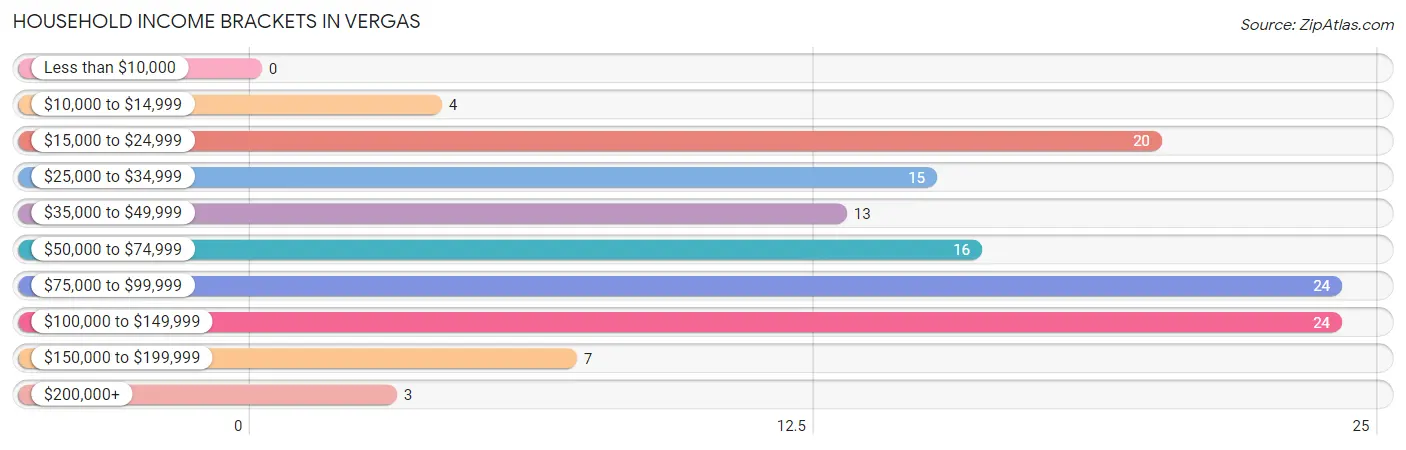
| Income Bracket | # Households | % Households |
| Less than $10,000 | 0 | 0.0% |
| $10,000 to $14,999 | 4 | 3.2% |
| $15,000 to $24,999 | 20 | 15.9% |
| $25,000 to $34,999 | 15 | 11.9% |
| $35,000 to $49,999 | 13 | 10.3% |
| $50,000 to $74,999 | 16 | 12.7% |
| $75,000 to $99,999 | 24 | 19.0% |
| $100,000 to $149,999 | 24 | 19.0% |
| $150,000 to $199,999 | 7 | 5.6% |
| $200,000+ | 3 | 2.4% |
Household Income by Householder Age in Vergas
The median household income in Vergas is $68,125, with the highest median household income of $75,000 found in the 25 to 44 years age bracket for the primary householder. A total of 24 households (19.1%) fall into this category. Meanwhile, the 15 to 24 years age bracket for the primary householder has the lowest median household income of $0, with 1 households (0.8%) in this group.
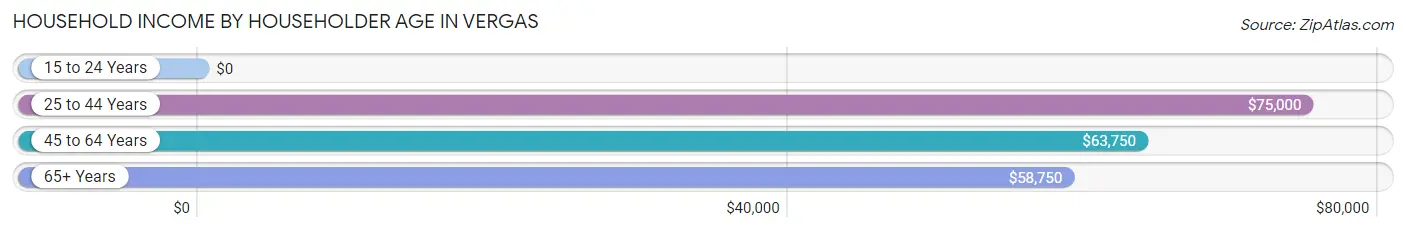
| Income Bracket | # Households | Median Income |
| 15 to 24 Years | 1 (0.8%) | $0 |
| 25 to 44 Years | 24 (19.1%) | $75,000 |
| 45 to 64 Years | 35 (27.8%) | $63,750 |
| 65+ Years | 66 (52.4%) | $58,750 |
| Total | 126 (100.0%) | $68,125 |
Poverty in Vergas
Income Below Poverty by Sex and Age in Vergas
With 7.6% poverty level for males and 2.4% for females among the residents of Vergas, 16 and 17 year old males and 55 to 64 year old females are the most vulnerable to poverty, with 2 males (50.0%) and 2 females (10.5%) in their respective age groups living below the poverty level.
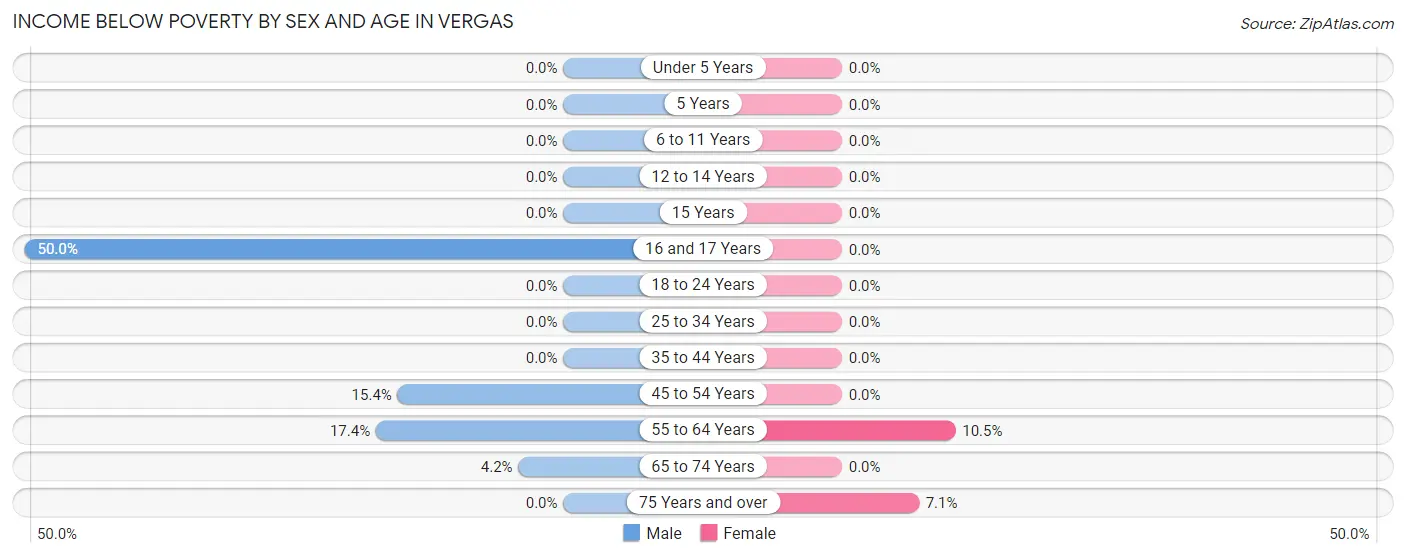
| Age Bracket | Male | Female |
| Under 5 Years | 0 (0.0%) | 0 (0.0%) |
| 5 Years | 0 (0.0%) | 0 (0.0%) |
| 6 to 11 Years | 0 (0.0%) | 0 (0.0%) |
| 12 to 14 Years | 0 (0.0%) | 0 (0.0%) |
| 15 Years | 0 (0.0%) | 0 (0.0%) |
| 16 and 17 Years | 2 (50.0%) | 0 (0.0%) |
| 18 to 24 Years | 0 (0.0%) | 0 (0.0%) |
| 25 to 34 Years | 0 (0.0%) | 0 (0.0%) |
| 35 to 44 Years | 0 (0.0%) | 0 (0.0%) |
| 45 to 54 Years | 2 (15.4%) | 0 (0.0%) |
| 55 to 64 Years | 4 (17.4%) | 2 (10.5%) |
| 65 to 74 Years | 1 (4.2%) | 0 (0.0%) |
| 75 Years and over | 0 (0.0%) | 1 (7.1%) |
| Total | 9 (7.6%) | 3 (2.4%) |
Income Above Poverty by Sex and Age in Vergas
According to the poverty statistics in Vergas, males aged under 5 years and females aged 6 to 11 years are the age groups that are most secure financially, with 100.0% of males and 100.0% of females in these age groups living above the poverty line.
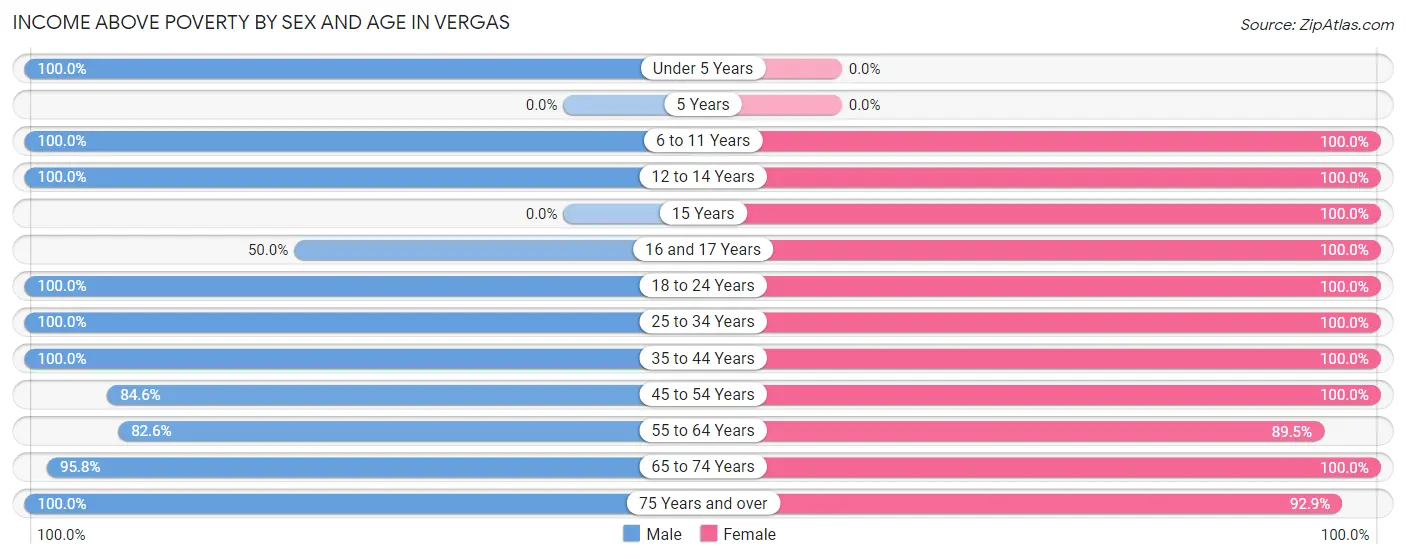
| Age Bracket | Male | Female |
| Under 5 Years | 4 (100.0%) | 0 (0.0%) |
| 5 Years | 0 (0.0%) | 0 (0.0%) |
| 6 to 11 Years | 9 (100.0%) | 5 (100.0%) |
| 12 to 14 Years | 2 (100.0%) | 2 (100.0%) |
| 15 Years | 0 (0.0%) | 2 (100.0%) |
| 16 and 17 Years | 2 (50.0%) | 5 (100.0%) |
| 18 to 24 Years | 4 (100.0%) | 6 (100.0%) |
| 25 to 34 Years | 6 (100.0%) | 2 (100.0%) |
| 35 to 44 Years | 21 (100.0%) | 19 (100.0%) |
| 45 to 54 Years | 11 (84.6%) | 8 (100.0%) |
| 55 to 64 Years | 19 (82.6%) | 17 (89.5%) |
| 65 to 74 Years | 23 (95.8%) | 42 (100.0%) |
| 75 Years and over | 8 (100.0%) | 13 (92.9%) |
| Total | 109 (92.4%) | 121 (97.6%) |
Income Below Poverty Among Married-Couple Families in Vergas
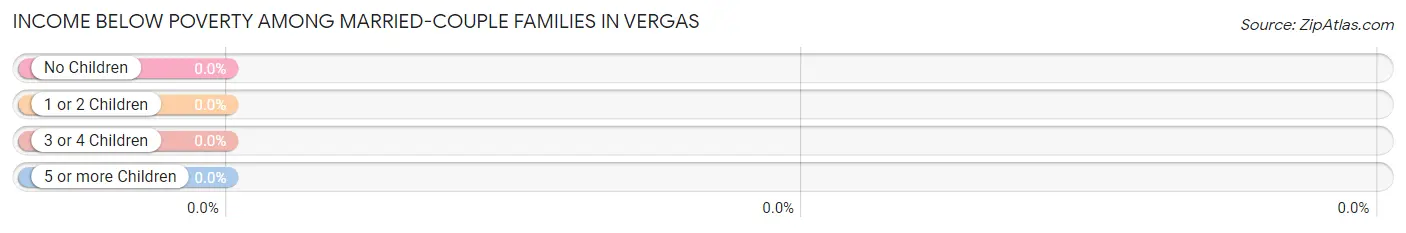
| Children | Above Poverty | Below Poverty |
| No Children | 34 (100.0%) | 0 (0.0%) |
| 1 or 2 Children | 5 (100.0%) | 0 (0.0%) |
| 3 or 4 Children | 1 (100.0%) | 0 (0.0%) |
| 5 or more Children | 2 (100.0%) | 0 (0.0%) |
| Total | 42 (100.0%) | 0 (0.0%) |
Income Below Poverty Among Single-Parent Households in Vergas
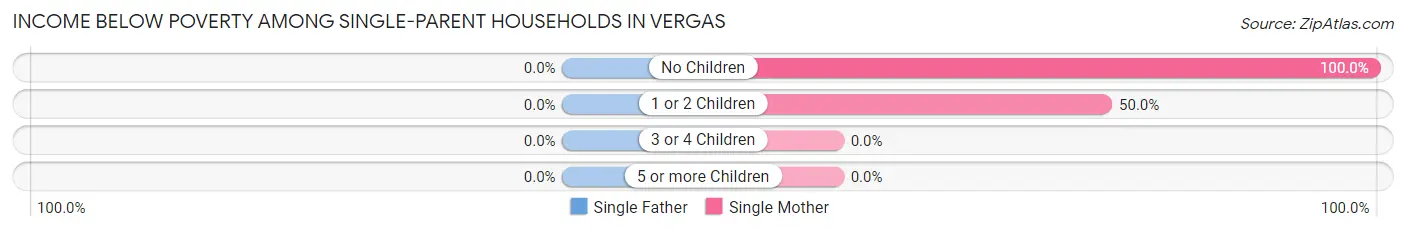
| Children | Single Father | Single Mother |
| No Children | 0 (0.0%) | 1 (100.0%) |
| 1 or 2 Children | 0 (0.0%) | 1 (50.0%) |
| 3 or 4 Children | 0 (0.0%) | 0 (0.0%) |
| 5 or more Children | 0 (0.0%) | 0 (0.0%) |
| Total | 0 (0.0%) | 2 (66.7%) |
Income Below Poverty Among Married-Couple vs Single-Parent Households in Vergas
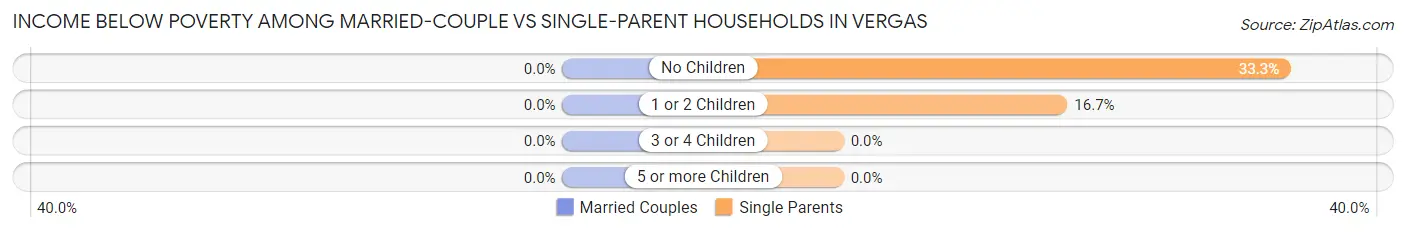
| Children | Married-Couple Families | Single-Parent Households |
| No Children | 0 (0.0%) | 1 (33.3%) |
| 1 or 2 Children | 0 (0.0%) | 1 (16.7%) |
| 3 or 4 Children | 0 (0.0%) | 0 (0.0%) |
| 5 or more Children | 0 (0.0%) | 0 (0.0%) |
| Total | 0 (0.0%) | 2 (22.2%) |
Race in Vergas
The most populous races in Vergas are White / Caucasian (239 | 98.8%), Asian (3 | 1.2%), and Hispanic or Latino (2 | 0.8%).
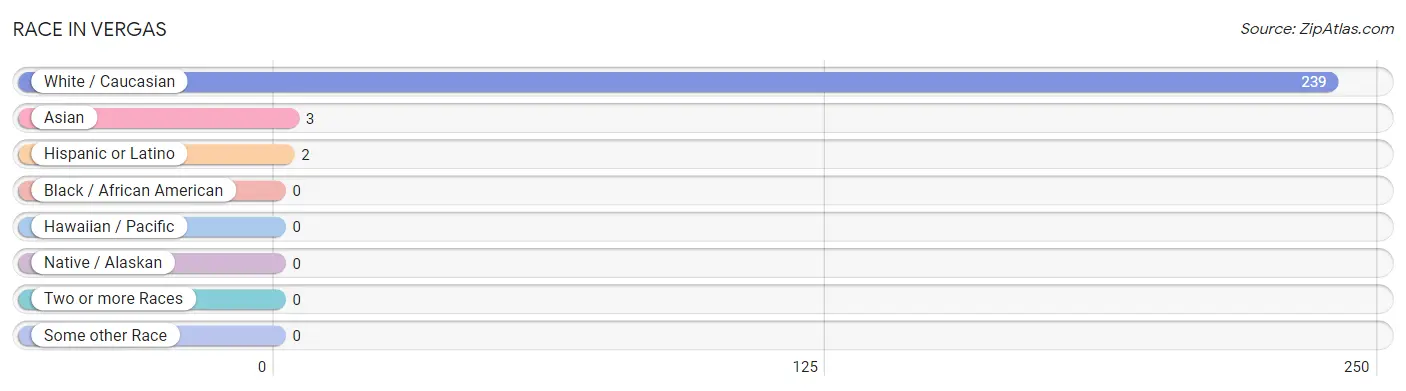
| Race | # Population | % Population |
| Asian | 3 | 1.2% |
| Black / African American | 0 | 0.0% |
| Hawaiian / Pacific | 0 | 0.0% |
| Hispanic or Latino | 2 | 0.8% |
| Native / Alaskan | 0 | 0.0% |
| White / Caucasian | 239 | 98.8% |
| Two or more Races | 0 | 0.0% |
| Some other Race | 0 | 0.0% |
| Total | 242 | 100.0% |
Ancestry in Vergas
The most populous ancestries reported in Vergas are German (123 | 50.8%), Norwegian (50 | 20.7%), American (29 | 12.0%), Swedish (28 | 11.6%), and English (11 | 4.5%), together accounting for 99.6% of all Vergas residents.
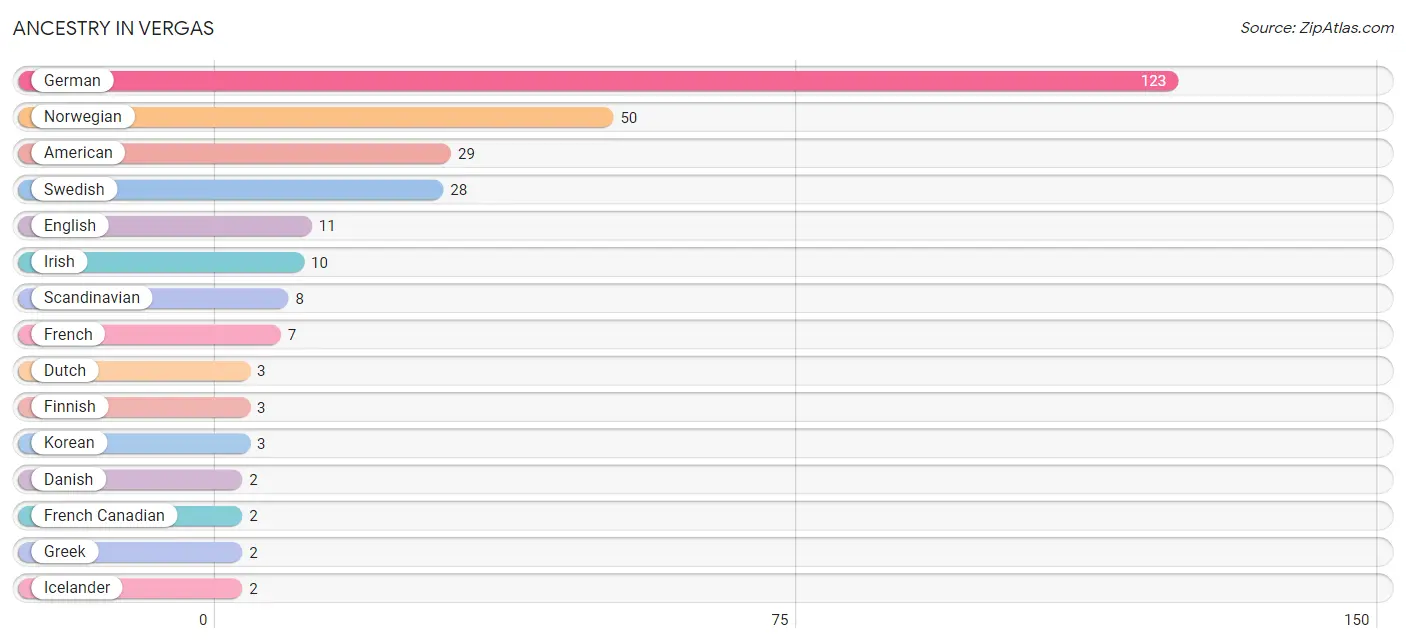
| Ancestry | # Population | % Population |
| American | 29 | 12.0% |
| Czech | 1 | 0.4% |
| Danish | 2 | 0.8% |
| Dutch | 3 | 1.2% |
| English | 11 | 4.5% |
| Finnish | 3 | 1.2% |
| French | 7 | 2.9% |
| French Canadian | 2 | 0.8% |
| German | 123 | 50.8% |
| Greek | 2 | 0.8% |
| Icelander | 2 | 0.8% |
| Irish | 10 | 4.1% |
| Korean | 3 | 1.2% |
| Norwegian | 50 | 20.7% |
| Polish | 2 | 0.8% |
| Romanian | 2 | 0.8% |
| Russian | 2 | 0.8% |
| Scandinavian | 8 | 3.3% |
| Slovak | 2 | 0.8% |
| Swedish | 28 | 11.6% |
| Swiss | 1 | 0.4% |
| Welsh | 1 | 0.4% | View All 22 Rows |
Immigrants in Vergas
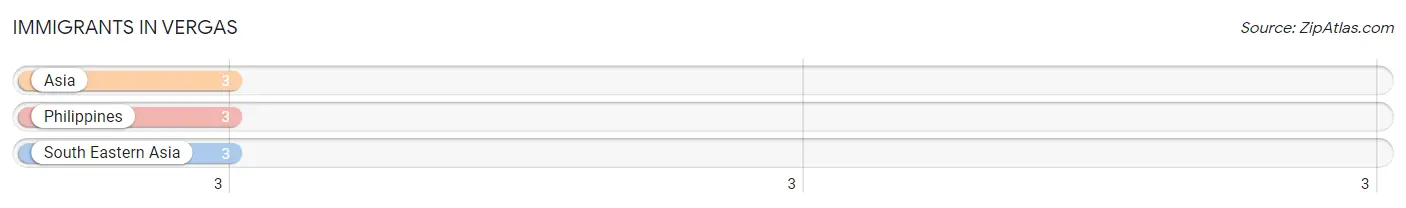
The most numerous immigrant groups reported in Vergas came from Asia (3 | 1.2%), Philippines (3 | 1.2%), and South Eastern Asia (3 | 1.2%), together accounting for 3.7% of all Vergas residents.
| Immigration Origin | # Population | % Population |
| Asia | 3 | 1.2% |
| Philippines | 3 | 1.2% |
| South Eastern Asia | 3 | 1.2% | View All 3 Rows |
Sex and Age in Vergas
Sex and Age in Vergas
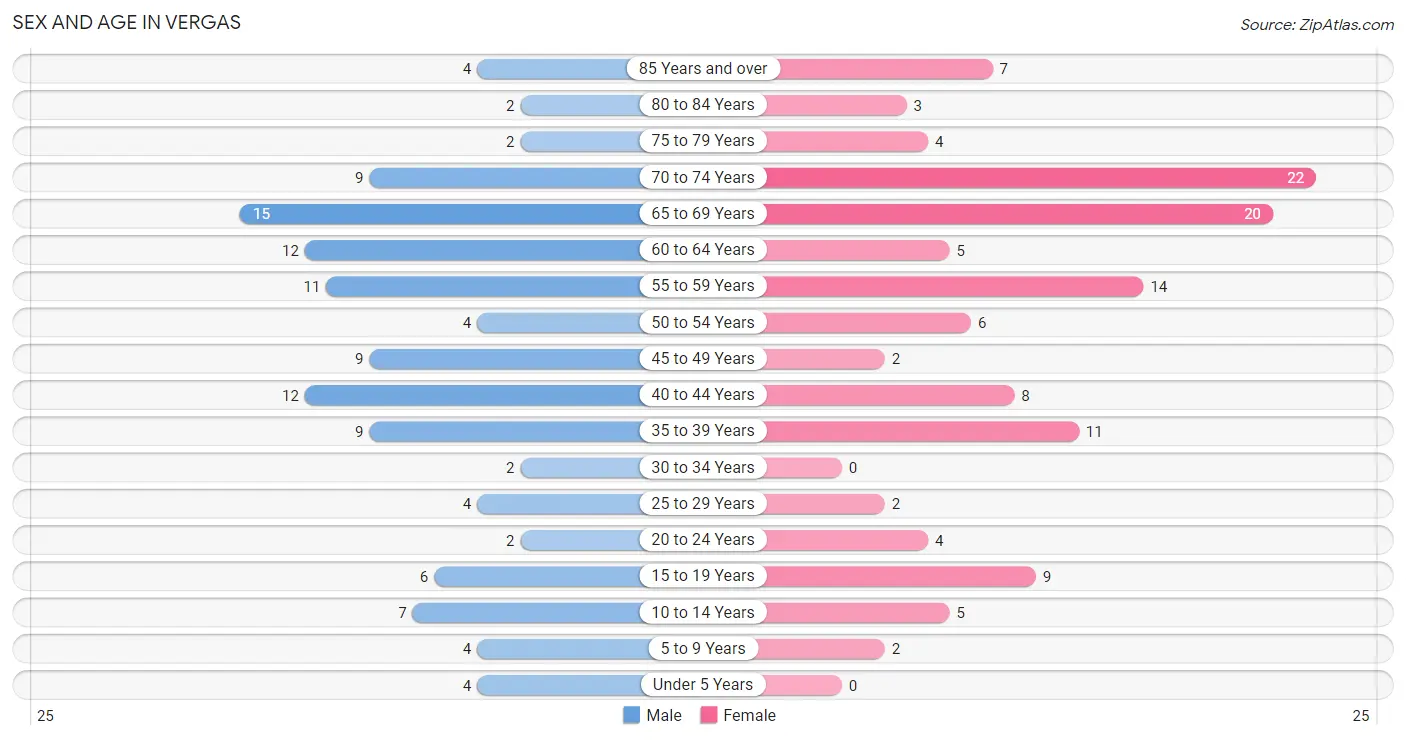
The most populous age groups in Vergas are 65 to 69 Years (15 | 12.7%) for men and 70 to 74 Years (22 | 17.7%) for women.
| Age Bracket | Male | Female |
| Under 5 Years | 4 (3.4%) | 0 (0.0%) |
| 5 to 9 Years | 4 (3.4%) | 2 (1.6%) |
| 10 to 14 Years | 7 (5.9%) | 5 (4.0%) |
| 15 to 19 Years | 6 (5.1%) | 9 (7.3%) |
| 20 to 24 Years | 2 (1.7%) | 4 (3.2%) |
| 25 to 29 Years | 4 (3.4%) | 2 (1.6%) |
| 30 to 34 Years | 2 (1.7%) | 0 (0.0%) |
| 35 to 39 Years | 9 (7.6%) | 11 (8.9%) |
| 40 to 44 Years | 12 (10.2%) | 8 (6.5%) |
| 45 to 49 Years | 9 (7.6%) | 2 (1.6%) |
| 50 to 54 Years | 4 (3.4%) | 6 (4.8%) |
| 55 to 59 Years | 11 (9.3%) | 14 (11.3%) |
| 60 to 64 Years | 12 (10.2%) | 5 (4.0%) |
| 65 to 69 Years | 15 (12.7%) | 20 (16.1%) |
| 70 to 74 Years | 9 (7.6%) | 22 (17.7%) |
| 75 to 79 Years | 2 (1.7%) | 4 (3.2%) |
| 80 to 84 Years | 2 (1.7%) | 3 (2.4%) |
| 85 Years and over | 4 (3.4%) | 7 (5.7%) |
| Total | 118 (100.0%) | 124 (100.0%) |
Families and Households in Vergas
Median Family Size in Vergas
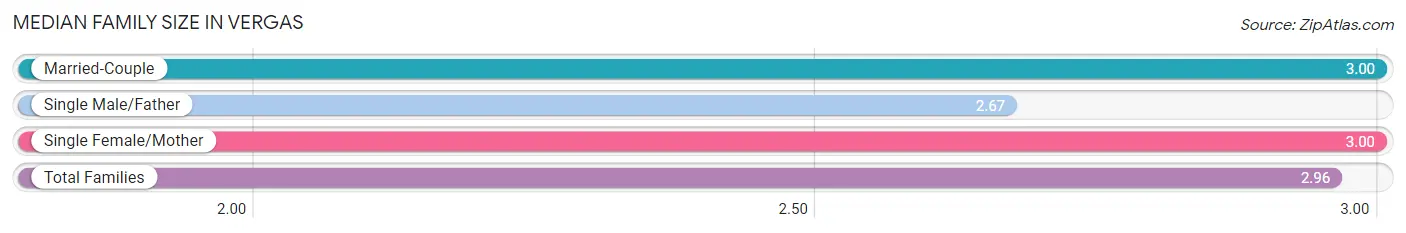
The median family size in Vergas is 2.96 persons per family, with married-couple families (42 | 82.4%) accounting for the largest median family size of 3 persons per family. On the other hand, single male/father families (6 | 11.8%) represent the smallest median family size with 2.67 persons per family.
| Family Type | # Families | Family Size |
| Married-Couple | 42 (82.4%) | 3.00 |
| Single Male/Father | 6 (11.8%) | 2.67 |
| Single Female/Mother | 3 (5.9%) | 3.00 |
| Total Families | 51 (100.0%) | 2.96 |
Median Household Size in Vergas
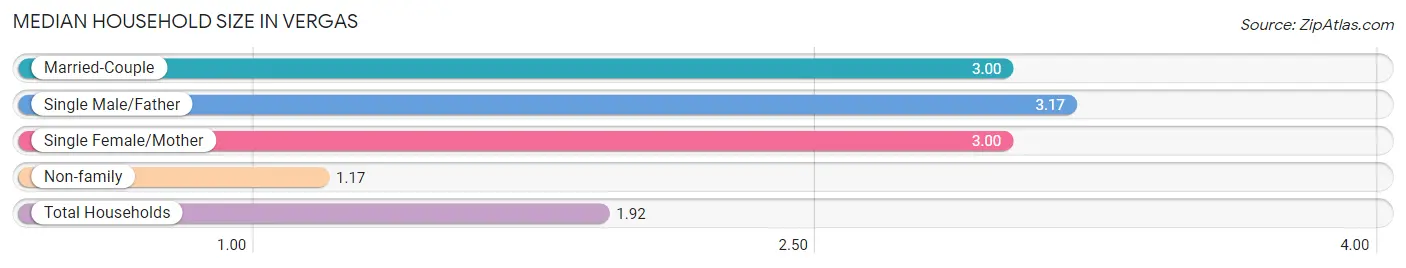
The median household size in Vergas is 1.92 persons per household, with single male/father households (6 | 4.8%) accounting for the largest median household size of 3.17 persons per household. non-family households (75 | 59.5%) represent the smallest median household size with 1.17 persons per household.
| Household Type | # Households | Household Size |
| Married-Couple | 42 (33.3%) | 3.00 |
| Single Male/Father | 6 (4.8%) | 3.17 |
| Single Female/Mother | 3 (2.4%) | 3.00 |
| Non-family | 75 (59.5%) | 1.17 |
| Total Households | 126 (100.0%) | 1.92 |
Household Size by Marriage Status in Vergas
Out of a total of 126 households in Vergas, 51 (40.5%) are family households, while 75 (59.5%) are nonfamily households. The most numerous type of family households are 2-person households, comprising 31, and the most common type of nonfamily households are 1-person households, comprising 65.
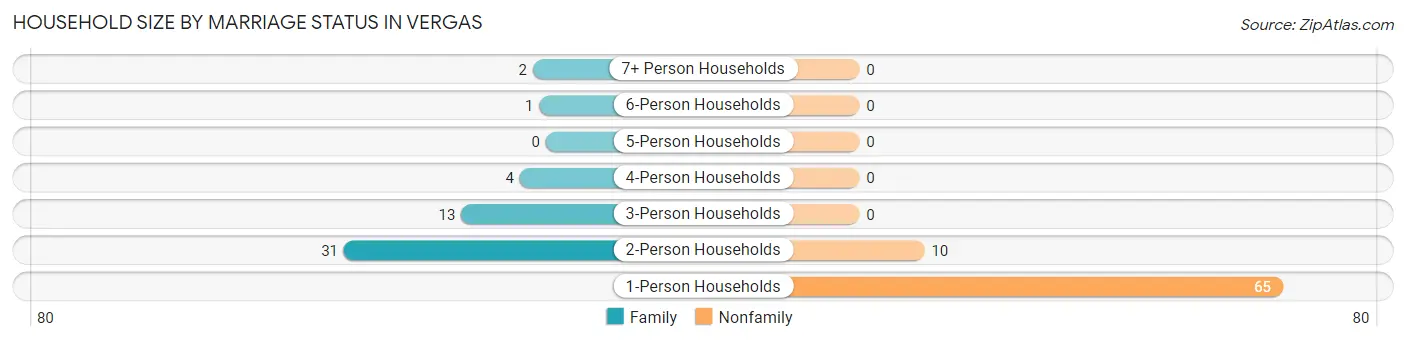
| Household Size | Family Households | Nonfamily Households |
| 1-Person Households | - | 65 (51.6%) |
| 2-Person Households | 31 (24.6%) | 10 (7.9%) |
| 3-Person Households | 13 (10.3%) | 0 (0.0%) |
| 4-Person Households | 4 (3.2%) | 0 (0.0%) |
| 5-Person Households | 0 (0.0%) | 0 (0.0%) |
| 6-Person Households | 1 (0.8%) | 0 (0.0%) |
| 7+ Person Households | 2 (1.6%) | 0 (0.0%) |
| Total | 51 (40.5%) | 75 (59.5%) |
Female Fertility in Vergas
Fertility by Age in Vergas
| Age Bracket | Women with Births | Births / 1,000 Women |
| 15 to 19 years | 0 (0.0%) | 0.0 |
| 20 to 34 years | 0 (0.0%) | 0.0 |
| 35 to 50 years | 0 (0.0%) | 0.0 |
| Total | 0 (0.0%) | 0.0 |
Fertility by Age by Marriage Status in Vergas
| Age Bracket | Married | Unmarried |
| 15 to 19 years | 0 (0.0%) | 0 (0.0%) |
| 20 to 34 years | 0 (0.0%) | 0 (0.0%) |
| 35 to 50 years | 0 (0.0%) | 0 (0.0%) |
| Total | 0 (0.0%) | 0 (0.0%) |
Fertility by Education in Vergas
| Educational Attainment | Women with Births | Births / 1,000 Women |
| Less than High School | 0 (0.0%) | 0.0 |
| High School Diploma | 0 (0.0%) | 0.0 |
| College or Associate's Degree | 0 (0.0%) | 0.0 |
| Bachelor's Degree | 0 (0.0%) | 0.0 |
| Graduate Degree | 0 (0.0%) | 0.0 |
| Total | 0 (0.0%) | 0.0 |
Fertility by Education by Marriage Status in Vergas
| Educational Attainment | Married | Unmarried |
| Less than High School | 0 (0.0%) | 0 (0.0%) |
| High School Diploma | 0 (0.0%) | 0 (0.0%) |
| College or Associate's Degree | 0 (0.0%) | 0 (0.0%) |
| Bachelor's Degree | 0 (0.0%) | 0 (0.0%) |
| Graduate Degree | 0 (0.0%) | 0 (0.0%) |
| Total | 0 (0.0%) | 0 (0.0%) |
Employment Characteristics in Vergas
Employment by Class of Employer in Vergas
Among the 111 employed individuals in Vergas, private company employees (61 | 54.9%), not-for-profit organizations (16 | 14.4%), and local government employees (14 | 12.6%) make up the most common classes of employment.
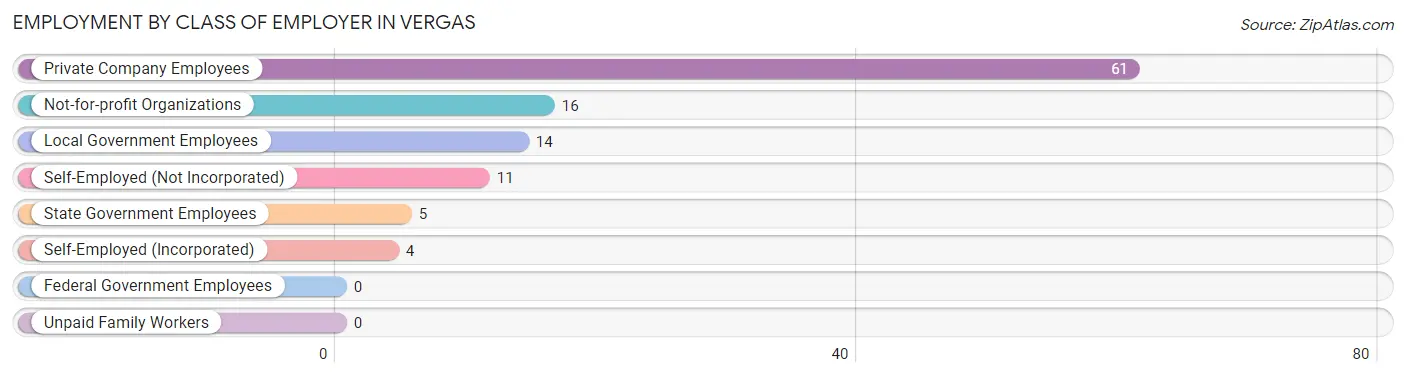
| Employer Class | # Employees | % Employees |
| Private Company Employees | 61 | 54.9% |
| Self-Employed (Incorporated) | 4 | 3.6% |
| Self-Employed (Not Incorporated) | 11 | 9.9% |
| Not-for-profit Organizations | 16 | 14.4% |
| Local Government Employees | 14 | 12.6% |
| State Government Employees | 5 | 4.5% |
| Federal Government Employees | 0 | 0.0% |
| Unpaid Family Workers | 0 | 0.0% |
| Total | 111 | 100.0% |
Employment Status by Age in Vergas
According to the labor force statistics for Vergas, out of the total population over 16 years of age (218), 52.3% or 114 individuals are in the labor force, with 2.6% or 3 of them unemployed. The age group with the highest labor force participation rate is 25 to 29 years, with 100.0% or 6 individuals in the labor force. Within the labor force, the 16 to 19 years age range has the highest percentage of unemployed individuals, with 25.0% or 2 of them being unemployed.
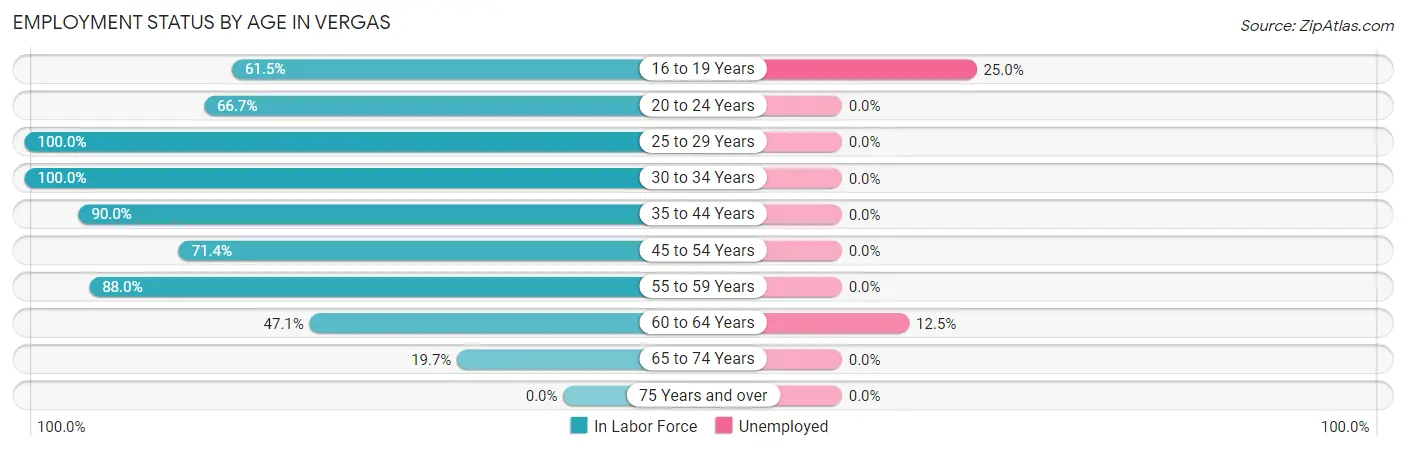
| Age Bracket | In Labor Force | Unemployed |
| 16 to 19 Years | 8 (61.5%) | 2 (25.0%) |
| 20 to 24 Years | 4 (66.7%) | 0 (0.0%) |
| 25 to 29 Years | 6 (100.0%) | 0 (0.0%) |
| 30 to 34 Years | 2 (100.0%) | 0 (0.0%) |
| 35 to 44 Years | 36 (90.0%) | 0 (0.0%) |
| 45 to 54 Years | 15 (71.4%) | 0 (0.0%) |
| 55 to 59 Years | 22 (88.0%) | 0 (0.0%) |
| 60 to 64 Years | 8 (47.1%) | 1 (12.5%) |
| 65 to 74 Years | 13 (19.7%) | 0 (0.0%) |
| 75 Years and over | 0 (0.0%) | 0 (0.0%) |
| Total | 114 (52.3%) | 3 (2.6%) |
Employment Status by Educational Attainment in Vergas
According to labor force statistics for Vergas, 80.2% of individuals (89) out of the total population between 25 and 64 years of age (111) are in the labor force, with 1.1% or 1 of them being unemployed. The group with the highest labor force participation rate are those with the educational attainment of bachelor's degree or higher, with 90.9% or 20 individuals in the labor force. Within the labor force, individuals with high school diploma education have the highest percentage of unemployment, with 5.3% or 1 of them being unemployed.
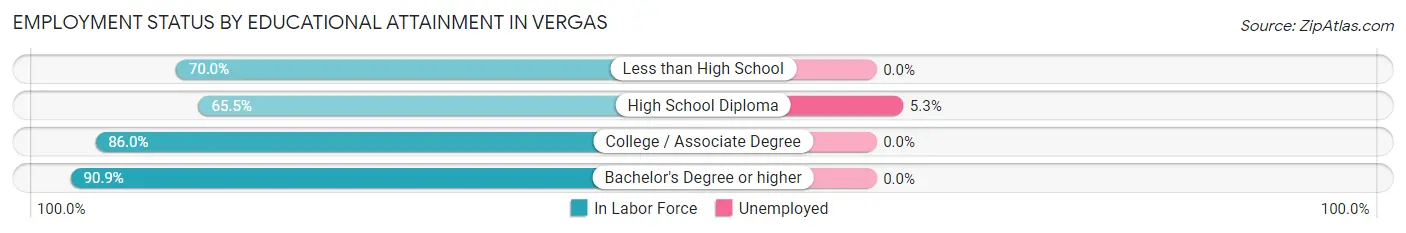
| Educational Attainment | In Labor Force | Unemployed |
| Less than High School | 7 (70.0%) | 0 (0.0%) |
| High School Diploma | 19 (65.5%) | 2 (5.3%) |
| College / Associate Degree | 43 (86.0%) | 0 (0.0%) |
| Bachelor's Degree or higher | 20 (90.9%) | 0 (0.0%) |
| Total | 89 (80.2%) | 1 (1.1%) |
Employment Occupations by Sex in Vergas
Management, Business, Science and Arts Occupations
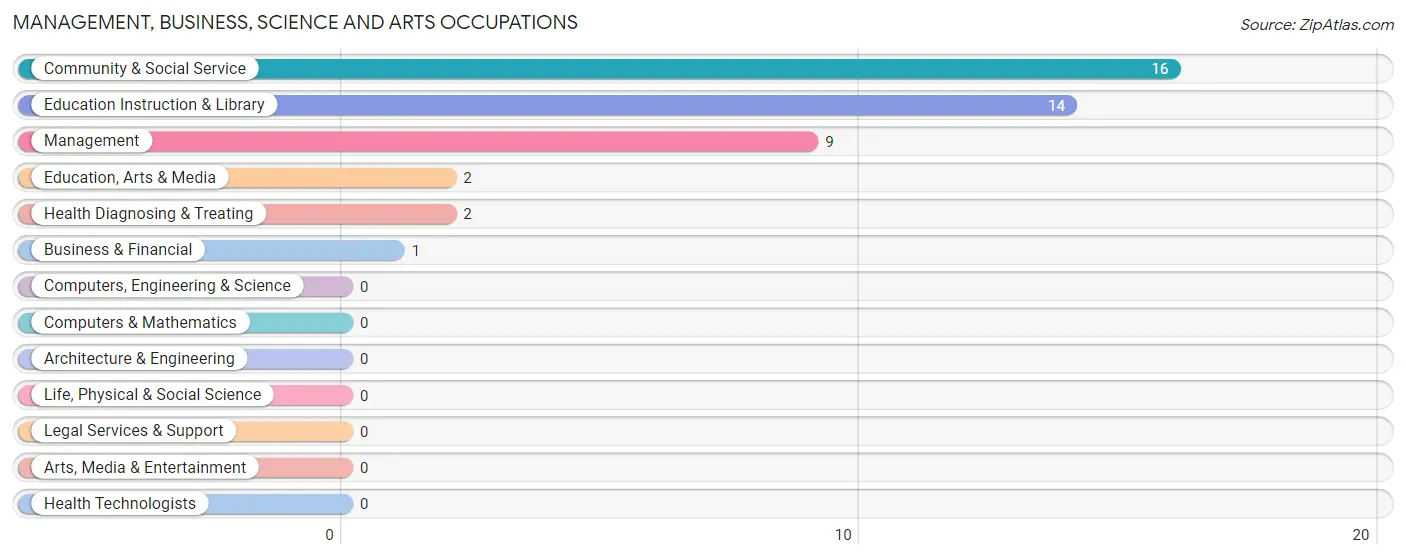
The most common Management, Business, Science and Arts occupations in Vergas are Community & Social Service (16 | 14.4%), Education Instruction & Library (14 | 12.6%), Management (9 | 8.1%), Education, Arts & Media (2 | 1.8%), and Health Diagnosing & Treating (2 | 1.8%).
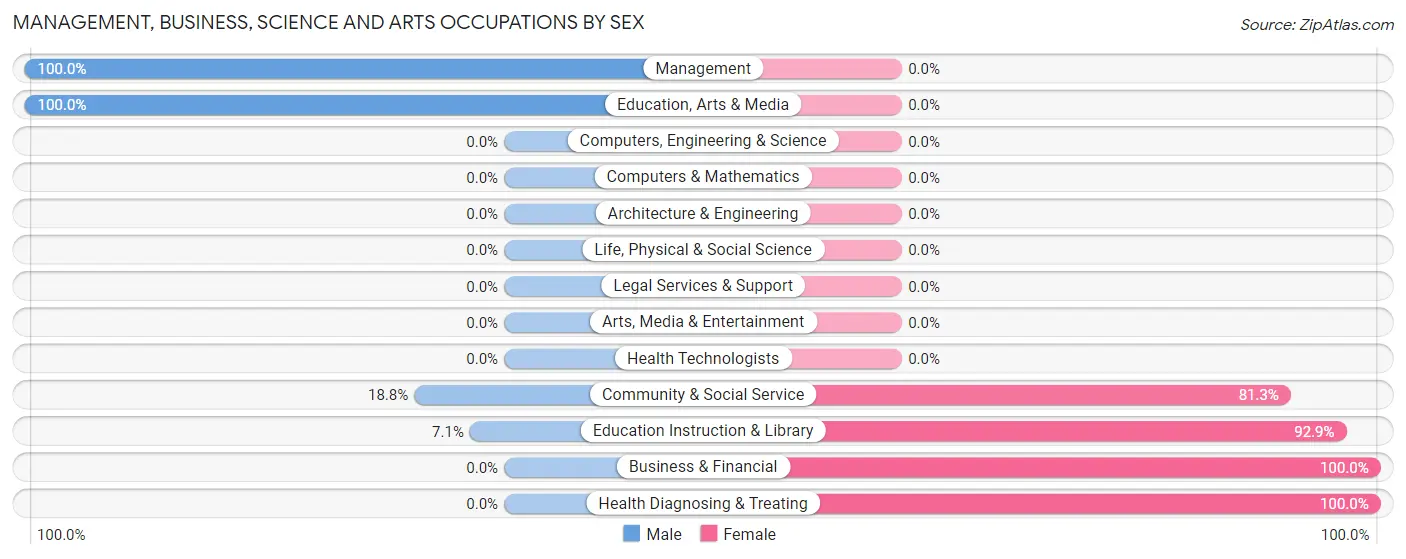
Management, Business, Science and Arts Occupations by Sex
Within the Management, Business, Science and Arts occupations in Vergas, the most male-oriented occupations are Management (100.0%), Education, Arts & Media (100.0%), and Community & Social Service (18.8%), while the most female-oriented occupations are Business & Financial (100.0%), Health Diagnosing & Treating (100.0%), and Education Instruction & Library (92.9%).
| Occupation | Male | Female |
| Management | 9 (100.0%) | 0 (0.0%) |
| Business & Financial | 0 (0.0%) | 1 (100.0%) |
| Computers, Engineering & Science | 0 (0.0%) | 0 (0.0%) |
| Computers & Mathematics | 0 (0.0%) | 0 (0.0%) |
| Architecture & Engineering | 0 (0.0%) | 0 (0.0%) |
| Life, Physical & Social Science | 0 (0.0%) | 0 (0.0%) |
| Community & Social Service | 3 (18.8%) | 13 (81.2%) |
| Education, Arts & Media | 2 (100.0%) | 0 (0.0%) |
| Legal Services & Support | 0 (0.0%) | 0 (0.0%) |
| Education Instruction & Library | 1 (7.1%) | 13 (92.9%) |
| Arts, Media & Entertainment | 0 (0.0%) | 0 (0.0%) |
| Health Diagnosing & Treating | 0 (0.0%) | 2 (100.0%) |
| Health Technologists | 0 (0.0%) | 0 (0.0%) |
| Total (Category) | 12 (42.9%) | 16 (57.1%) |
| Total (Overall) | 58 (52.2%) | 53 (47.7%) |
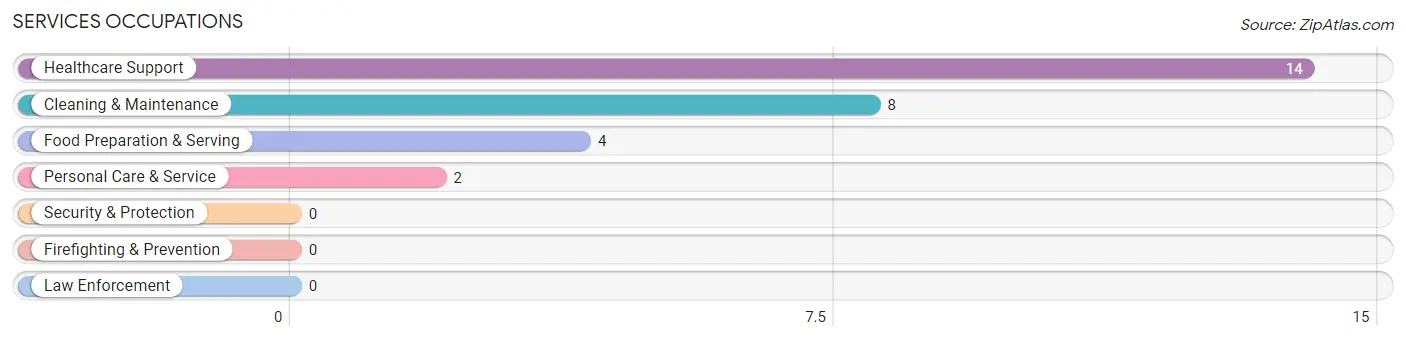
Services Occupations
The most common Services occupations in Vergas are Healthcare Support (14 | 12.6%), Cleaning & Maintenance (8 | 7.2%), Food Preparation & Serving (4 | 3.6%), and Personal Care & Service (2 | 1.8%).
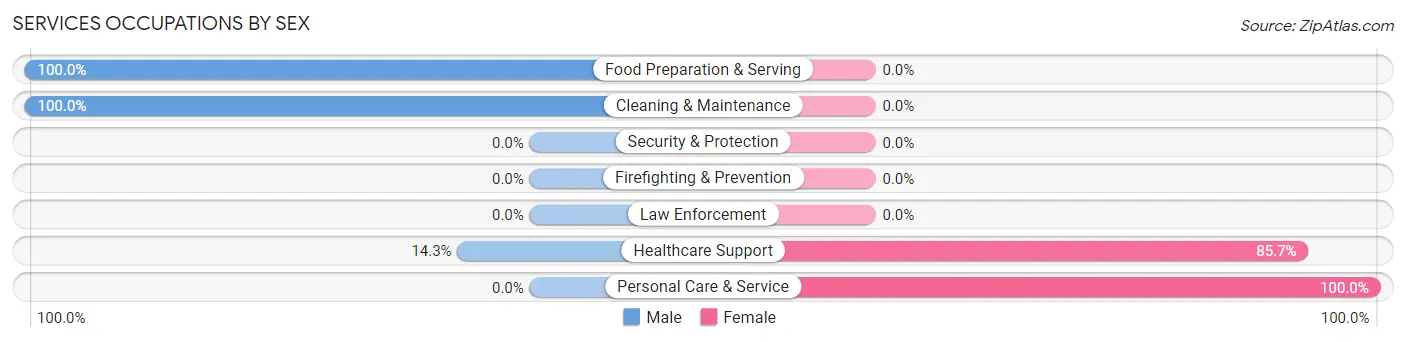
Services Occupations by Sex
Within the Services occupations in Vergas, the most male-oriented occupations are Food Preparation & Serving (100.0%), Cleaning & Maintenance (100.0%), and Healthcare Support (14.3%), while the most female-oriented occupations are Personal Care & Service (100.0%), and Healthcare Support (85.7%).
| Occupation | Male | Female |
| Healthcare Support | 2 (14.3%) | 12 (85.7%) |
| Security & Protection | 0 (0.0%) | 0 (0.0%) |
| Firefighting & Prevention | 0 (0.0%) | 0 (0.0%) |
| Law Enforcement | 0 (0.0%) | 0 (0.0%) |
| Food Preparation & Serving | 4 (100.0%) | 0 (0.0%) |
| Cleaning & Maintenance | 8 (100.0%) | 0 (0.0%) |
| Personal Care & Service | 0 (0.0%) | 2 (100.0%) |
| Total (Category) | 14 (50.0%) | 14 (50.0%) |
| Total (Overall) | 58 (52.2%) | 53 (47.7%) |
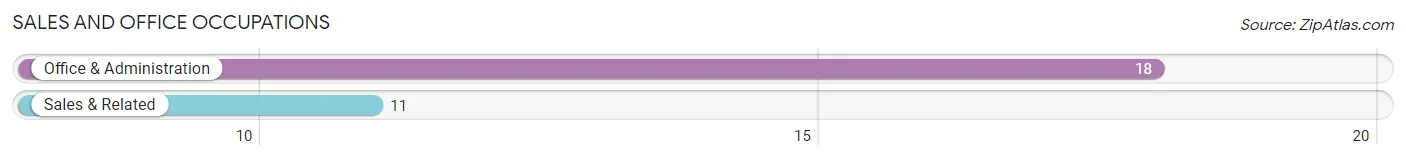
Sales and Office Occupations
The most common Sales and Office occupations in Vergas are Office & Administration (18 | 16.2%), and Sales & Related (11 | 9.9%).
Sales and Office Occupations by Sex
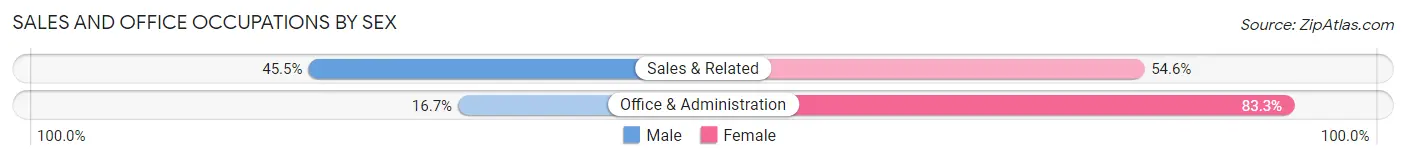
| Occupation | Male | Female |
| Sales & Related | 5 (45.5%) | 6 (54.5%) |
| Office & Administration | 3 (16.7%) | 15 (83.3%) |
| Total (Category) | 8 (27.6%) | 21 (72.4%) |
| Total (Overall) | 58 (52.2%) | 53 (47.7%) |
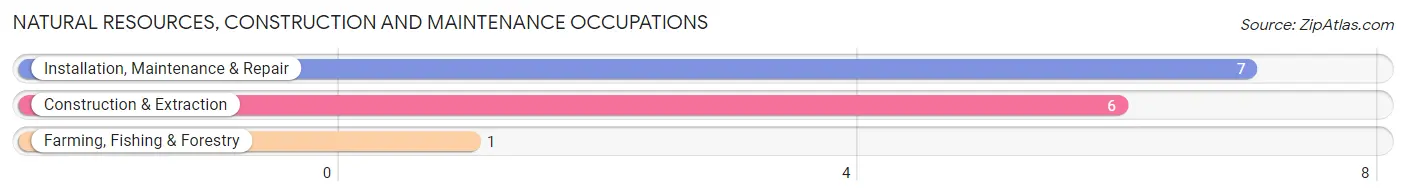
Natural Resources, Construction and Maintenance Occupations
The most common Natural Resources, Construction and Maintenance occupations in Vergas are Installation, Maintenance & Repair (7 | 6.3%), Construction & Extraction (6 | 5.4%), and Farming, Fishing & Forestry (1 | 0.9%).
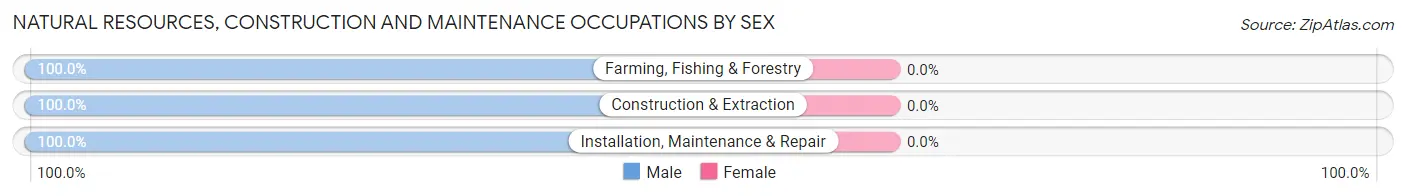
Natural Resources, Construction and Maintenance Occupations by Sex
| Occupation | Male | Female |
| Farming, Fishing & Forestry | 1 (100.0%) | 0 (0.0%) |
| Construction & Extraction | 6 (100.0%) | 0 (0.0%) |
| Installation, Maintenance & Repair | 7 (100.0%) | 0 (0.0%) |
| Total (Category) | 14 (100.0%) | 0 (0.0%) |
| Total (Overall) | 58 (52.2%) | 53 (47.7%) |
Production, Transportation and Moving Occupations
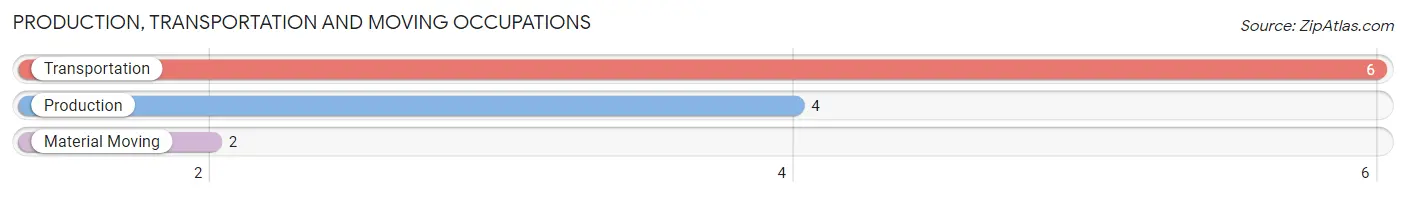
The most common Production, Transportation and Moving occupations in Vergas are Transportation (6 | 5.4%), Production (4 | 3.6%), and Material Moving (2 | 1.8%).
Production, Transportation and Moving Occupations by Sex
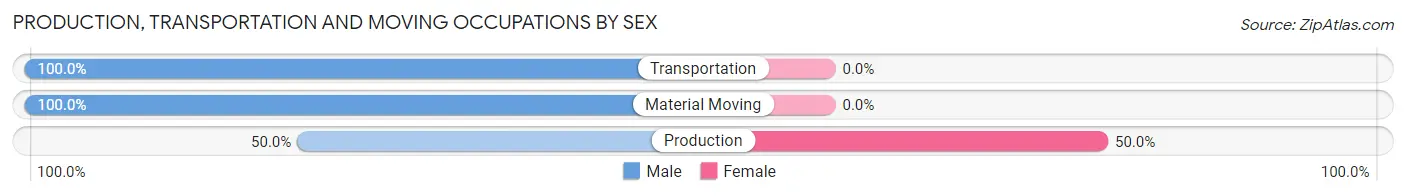
| Occupation | Male | Female |
| Production | 2 (50.0%) | 2 (50.0%) |
| Transportation | 6 (100.0%) | 0 (0.0%) |
| Material Moving | 2 (100.0%) | 0 (0.0%) |
| Total (Category) | 10 (83.3%) | 2 (16.7%) |
| Total (Overall) | 58 (52.2%) | 53 (47.7%) |
Employment Industries by Sex in Vergas
Employment Industries in Vergas
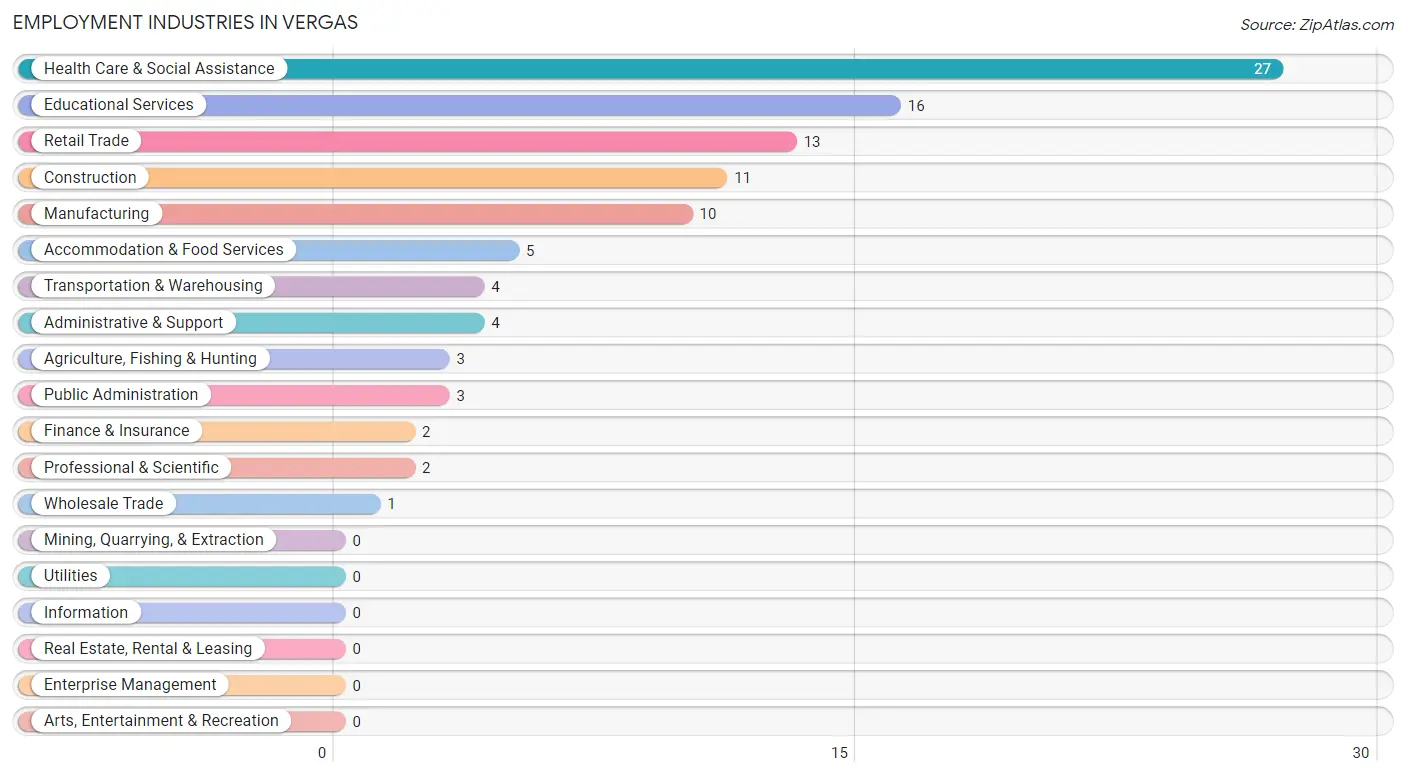
The major employment industries in Vergas include Health Care & Social Assistance (27 | 24.3%), Educational Services (16 | 14.4%), Retail Trade (13 | 11.7%), Construction (11 | 9.9%), and Manufacturing (10 | 9.0%).
Employment Industries by Sex in Vergas
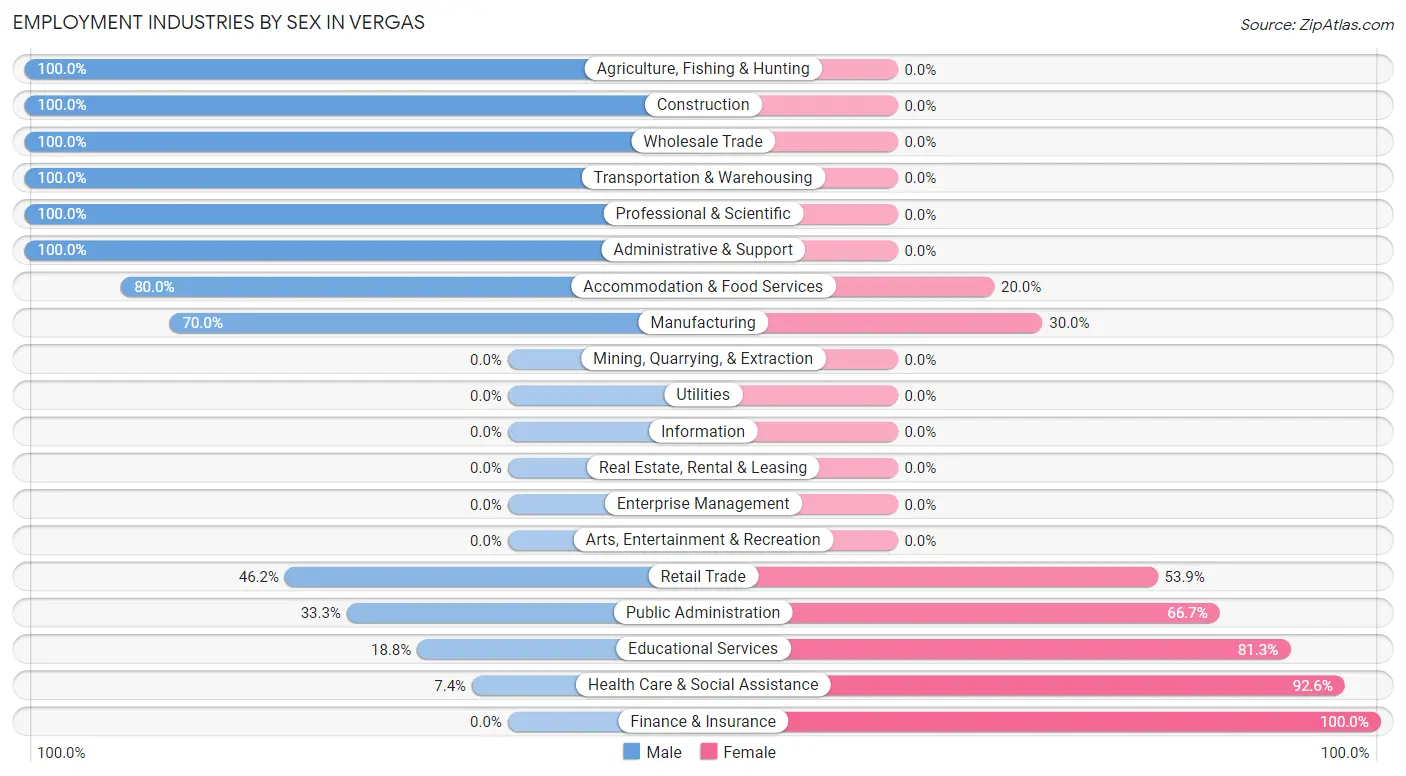
The Vergas industries that see more men than women are Agriculture, Fishing & Hunting (100.0%), Construction (100.0%), and Wholesale Trade (100.0%), whereas the industries that tend to have a higher number of women are Finance & Insurance (100.0%), Health Care & Social Assistance (92.6%), and Educational Services (81.2%).
| Industry | Male | Female |
| Agriculture, Fishing & Hunting | 3 (100.0%) | 0 (0.0%) |
| Mining, Quarrying, & Extraction | 0 (0.0%) | 0 (0.0%) |
| Construction | 11 (100.0%) | 0 (0.0%) |
| Manufacturing | 7 (70.0%) | 3 (30.0%) |
| Wholesale Trade | 1 (100.0%) | 0 (0.0%) |
| Retail Trade | 6 (46.2%) | 7 (53.8%) |
| Transportation & Warehousing | 4 (100.0%) | 0 (0.0%) |
| Utilities | 0 (0.0%) | 0 (0.0%) |
| Information | 0 (0.0%) | 0 (0.0%) |
| Finance & Insurance | 0 (0.0%) | 2 (100.0%) |
| Real Estate, Rental & Leasing | 0 (0.0%) | 0 (0.0%) |
| Professional & Scientific | 2 (100.0%) | 0 (0.0%) |
| Enterprise Management | 0 (0.0%) | 0 (0.0%) |
| Administrative & Support | 4 (100.0%) | 0 (0.0%) |
| Educational Services | 3 (18.8%) | 13 (81.2%) |
| Health Care & Social Assistance | 2 (7.4%) | 25 (92.6%) |
| Arts, Entertainment & Recreation | 0 (0.0%) | 0 (0.0%) |
| Accommodation & Food Services | 4 (80.0%) | 1 (20.0%) |
| Public Administration | 1 (33.3%) | 2 (66.7%) |
| Total | 58 (52.2%) | 53 (47.7%) |
Education in Vergas
School Enrollment in Vergas
The most common levels of schooling among the 36 students in Vergas are middle school (12 | 33.3%), high school (11 | 30.6%), and elementary school (6 | 16.7%).
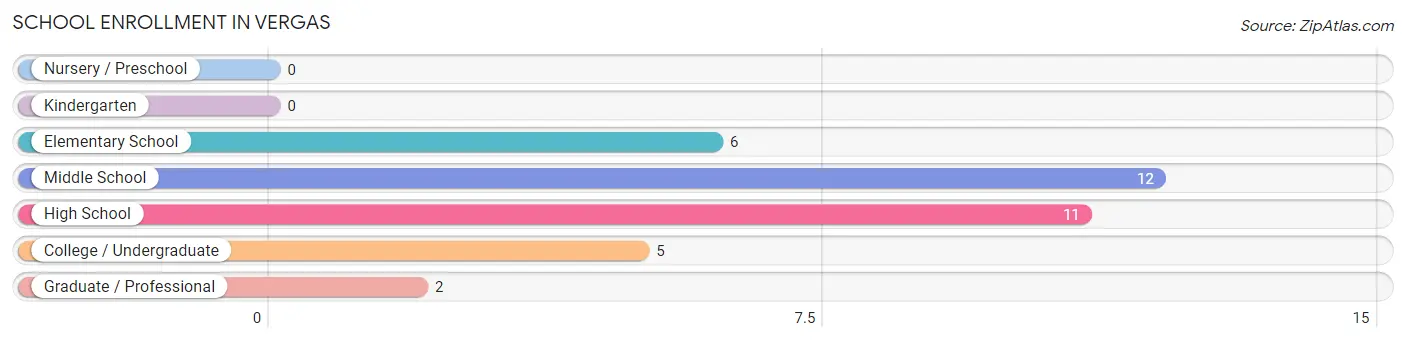
| School Level | # Students | % Students |
| Nursery / Preschool | 0 | 0.0% |
| Kindergarten | 0 | 0.0% |
| Elementary School | 6 | 16.7% |
| Middle School | 12 | 33.3% |
| High School | 11 | 30.6% |
| College / Undergraduate | 5 | 13.9% |
| Graduate / Professional | 2 | 5.6% |
| Total | 36 | 100.0% |
School Enrollment by Age by Funding Source in Vergas
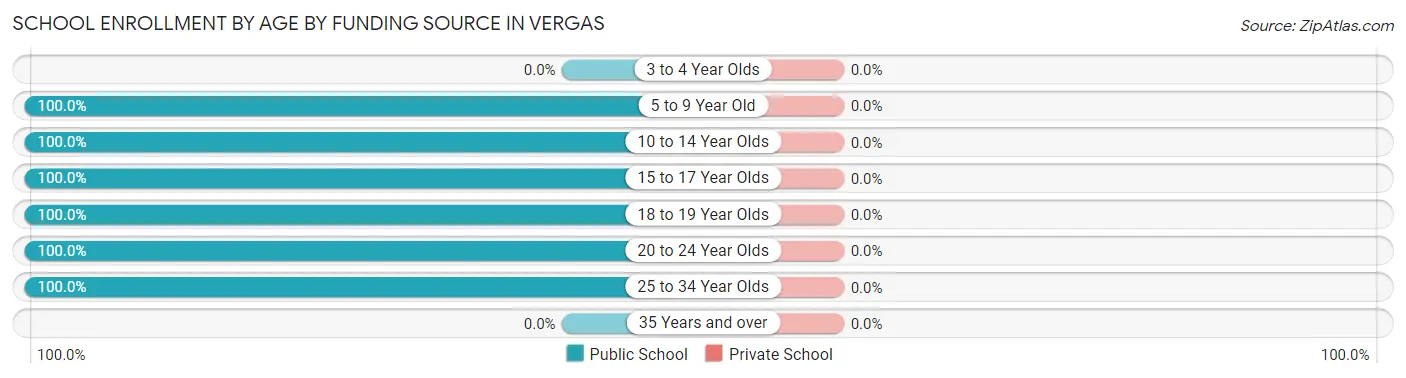
| Age Bracket | Public School | Private School |
| 3 to 4 Year Olds | 0 (0.0%) | 0 (0.0%) |
| 5 to 9 Year Old | 6 (100.0%) | 0 (0.0%) |
| 10 to 14 Year Olds | 12 (100.0%) | 0 (0.0%) |
| 15 to 17 Year Olds | 11 (100.0%) | 0 (0.0%) |
| 18 to 19 Year Olds | 2 (100.0%) | 0 (0.0%) |
| 20 to 24 Year Olds | 3 (100.0%) | 0 (0.0%) |
| 25 to 34 Year Olds | 2 (100.0%) | 0 (0.0%) |
| 35 Years and over | 0 (0.0%) | 0 (0.0%) |
| Total | 36 (100.0%) | 0 (0.0%) |
Educational Attainment by Field of Study in Vergas
Education (20 | 41.7%), arts & humanities (9 | 18.8%), business (6 | 12.5%), social sciences (4 | 8.3%), and computers & mathematics (3 | 6.2%) are the most common fields of study among 48 individuals in Vergas who have obtained a bachelor's degree or higher.
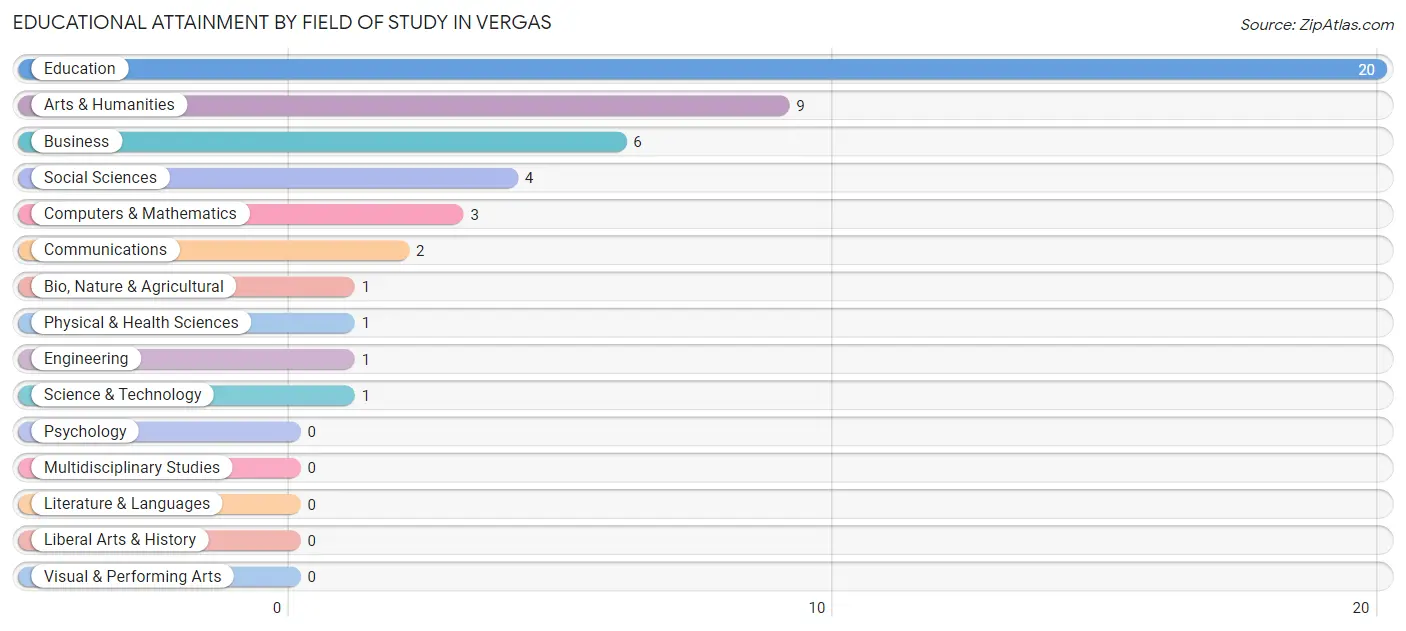
| Field of Study | # Graduates | % Graduates |
| Computers & Mathematics | 3 | 6.2% |
| Bio, Nature & Agricultural | 1 | 2.1% |
| Physical & Health Sciences | 1 | 2.1% |
| Psychology | 0 | 0.0% |
| Social Sciences | 4 | 8.3% |
| Engineering | 1 | 2.1% |
| Multidisciplinary Studies | 0 | 0.0% |
| Science & Technology | 1 | 2.1% |
| Business | 6 | 12.5% |
| Education | 20 | 41.7% |
| Literature & Languages | 0 | 0.0% |
| Liberal Arts & History | 0 | 0.0% |
| Visual & Performing Arts | 0 | 0.0% |
| Communications | 2 | 4.2% |
| Arts & Humanities | 9 | 18.8% |
| Total | 48 | 100.0% |
Transportation & Commute in Vergas
Vehicle Availability by Sex in Vergas
The most prevalent vehicle ownership categories in Vergas are males with 2 vehicles (26, accounting for 44.8%) and females with 2 vehicles (14, making up 49.1%).
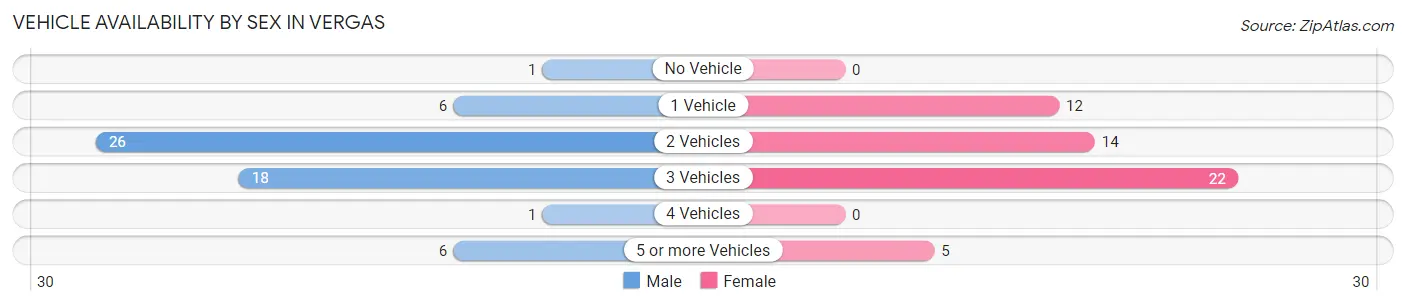
| Vehicles Available | Male | Female |
| No Vehicle | 1 (1.7%) | 0 (0.0%) |
| 1 Vehicle | 6 (10.3%) | 12 (22.6%) |
| 2 Vehicles | 26 (44.8%) | 14 (26.4%) |
| 3 Vehicles | 18 (31.0%) | 22 (41.5%) |
| 4 Vehicles | 1 (1.7%) | 0 (0.0%) |
| 5 or more Vehicles | 6 (10.3%) | 5 (9.4%) |
| Total | 58 (100.0%) | 53 (100.0%) |
Commute Time in Vergas
The most frequently occuring commute durations in Vergas are 20 to 24 minutes (30 commuters, 28.0%), 15 to 19 minutes (18 commuters, 16.8%), and 30 to 34 minutes (14 commuters, 13.1%).
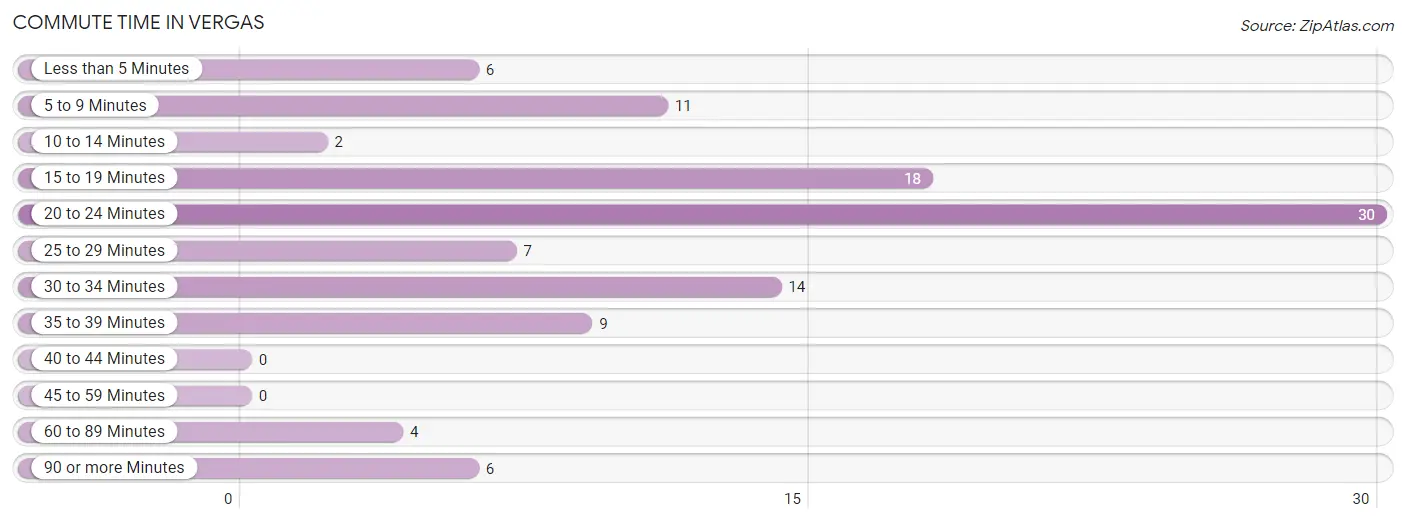
| Commute Time | # Commuters | % Commuters |
| Less than 5 Minutes | 6 | 5.6% |
| 5 to 9 Minutes | 11 | 10.3% |
| 10 to 14 Minutes | 2 | 1.9% |
| 15 to 19 Minutes | 18 | 16.8% |
| 20 to 24 Minutes | 30 | 28.0% |
| 25 to 29 Minutes | 7 | 6.5% |
| 30 to 34 Minutes | 14 | 13.1% |
| 35 to 39 Minutes | 9 | 8.4% |
| 40 to 44 Minutes | 0 | 0.0% |
| 45 to 59 Minutes | 0 | 0.0% |
| 60 to 89 Minutes | 4 | 3.7% |
| 90 or more Minutes | 6 | 5.6% |
Commute Time by Sex in Vergas
The most common commute times in Vergas are 20 to 24 minutes (14 commuters, 25.0%) for males and 20 to 24 minutes (16 commuters, 31.4%) for females.
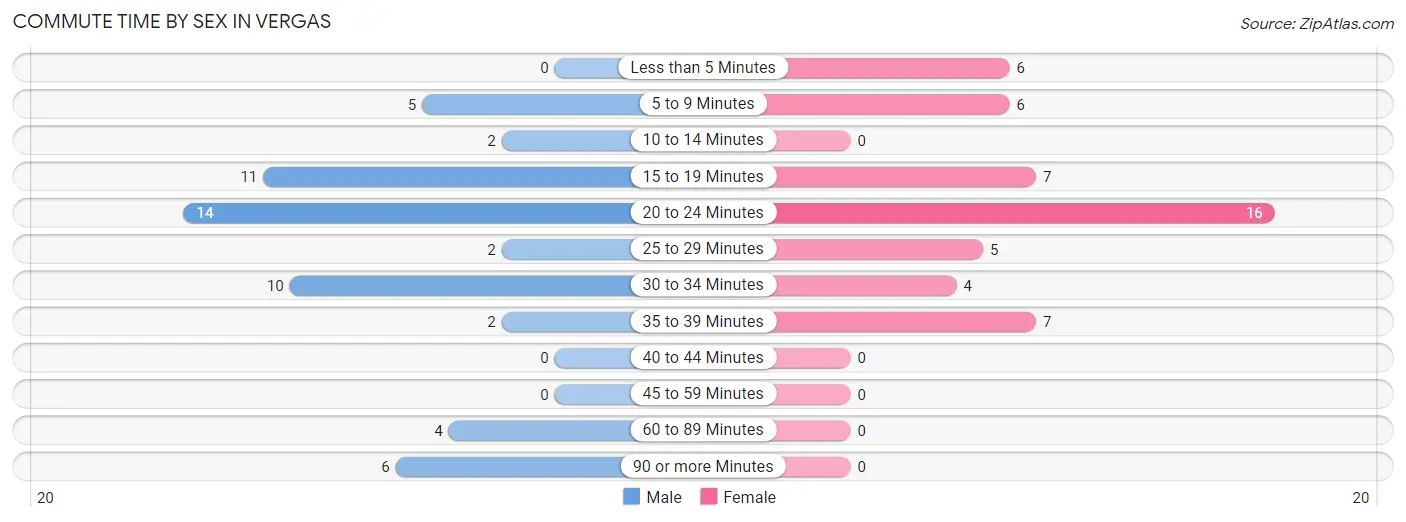
| Commute Time | Male | Female |
| Less than 5 Minutes | 0 (0.0%) | 6 (11.8%) |
| 5 to 9 Minutes | 5 (8.9%) | 6 (11.8%) |
| 10 to 14 Minutes | 2 (3.6%) | 0 (0.0%) |
| 15 to 19 Minutes | 11 (19.6%) | 7 (13.7%) |
| 20 to 24 Minutes | 14 (25.0%) | 16 (31.4%) |
| 25 to 29 Minutes | 2 (3.6%) | 5 (9.8%) |
| 30 to 34 Minutes | 10 (17.9%) | 4 (7.8%) |
| 35 to 39 Minutes | 2 (3.6%) | 7 (13.7%) |
| 40 to 44 Minutes | 0 (0.0%) | 0 (0.0%) |
| 45 to 59 Minutes | 0 (0.0%) | 0 (0.0%) |
| 60 to 89 Minutes | 4 (7.1%) | 0 (0.0%) |
| 90 or more Minutes | 6 (10.7%) | 0 (0.0%) |
Time of Departure to Work by Sex in Vergas
The most frequent times of departure to work in Vergas are 6:00 AM to 6:29 AM (10, 17.9%) for males and 7:30 AM to 7:59 AM (12, 23.5%) for females.
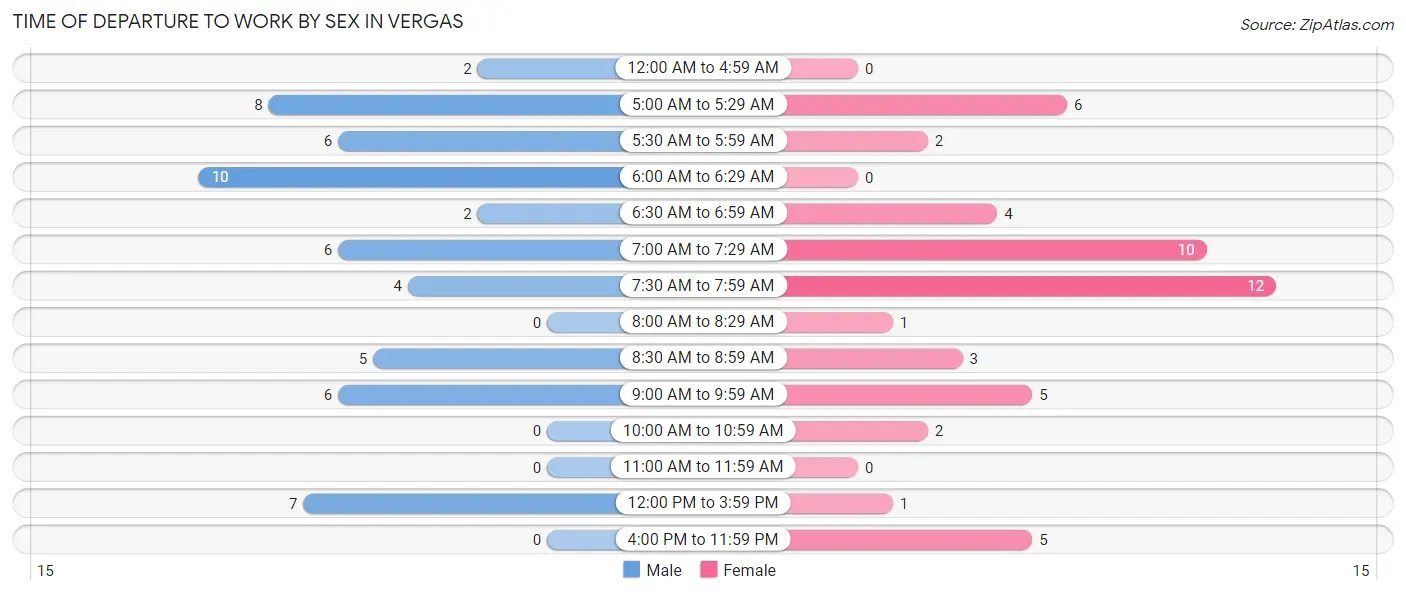
| Time of Departure | Male | Female |
| 12:00 AM to 4:59 AM | 2 (3.6%) | 0 (0.0%) |
| 5:00 AM to 5:29 AM | 8 (14.3%) | 6 (11.8%) |
| 5:30 AM to 5:59 AM | 6 (10.7%) | 2 (3.9%) |
| 6:00 AM to 6:29 AM | 10 (17.9%) | 0 (0.0%) |
| 6:30 AM to 6:59 AM | 2 (3.6%) | 4 (7.8%) |
| 7:00 AM to 7:29 AM | 6 (10.7%) | 10 (19.6%) |
| 7:30 AM to 7:59 AM | 4 (7.1%) | 12 (23.5%) |
| 8:00 AM to 8:29 AM | 0 (0.0%) | 1 (2.0%) |
| 8:30 AM to 8:59 AM | 5 (8.9%) | 3 (5.9%) |
| 9:00 AM to 9:59 AM | 6 (10.7%) | 5 (9.8%) |
| 10:00 AM to 10:59 AM | 0 (0.0%) | 2 (3.9%) |
| 11:00 AM to 11:59 AM | 0 (0.0%) | 0 (0.0%) |
| 12:00 PM to 3:59 PM | 7 (12.5%) | 1 (2.0%) |
| 4:00 PM to 11:59 PM | 0 (0.0%) | 5 (9.8%) |
| Total | 56 (100.0%) | 51 (100.0%) |
Housing Occupancy in Vergas
Occupancy by Ownership in Vergas
Of the total 126 dwellings in Vergas, owner-occupied units account for 98 (77.8%), while renter-occupied units make up 28 (22.2%).
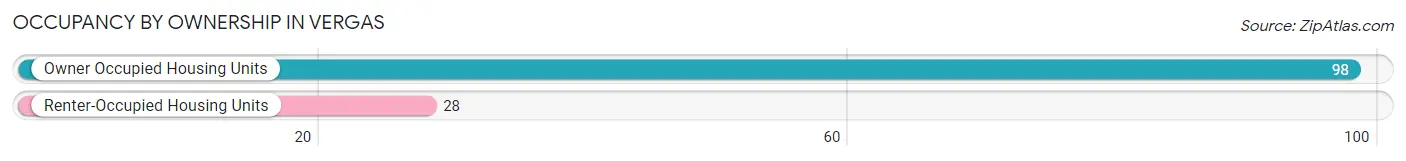
| Occupancy | # Housing Units | % Housing Units |
| Owner Occupied Housing Units | 98 | 77.8% |
| Renter-Occupied Housing Units | 28 | 22.2% |
| Total Occupied Housing Units | 126 | 100.0% |
Occupancy by Household Size in Vergas
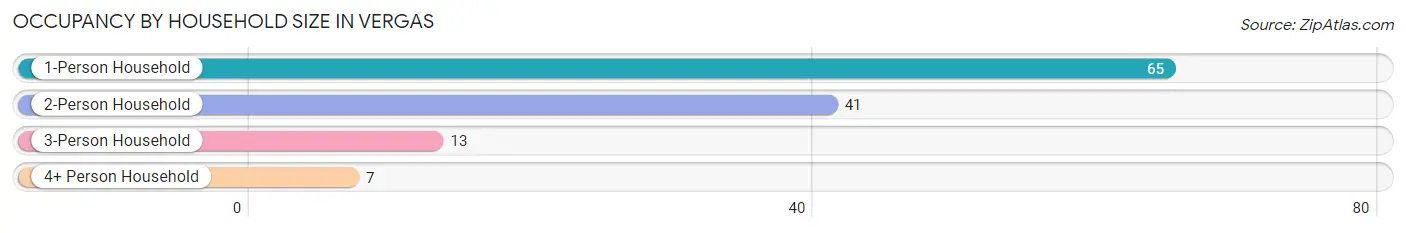
| Household Size | # Housing Units | % Housing Units |
| 1-Person Household | 65 | 51.6% |
| 2-Person Household | 41 | 32.5% |
| 3-Person Household | 13 | 10.3% |
| 4+ Person Household | 7 | 5.6% |
| Total Housing Units | 126 | 100.0% |
Occupancy by Ownership by Household Size in Vergas
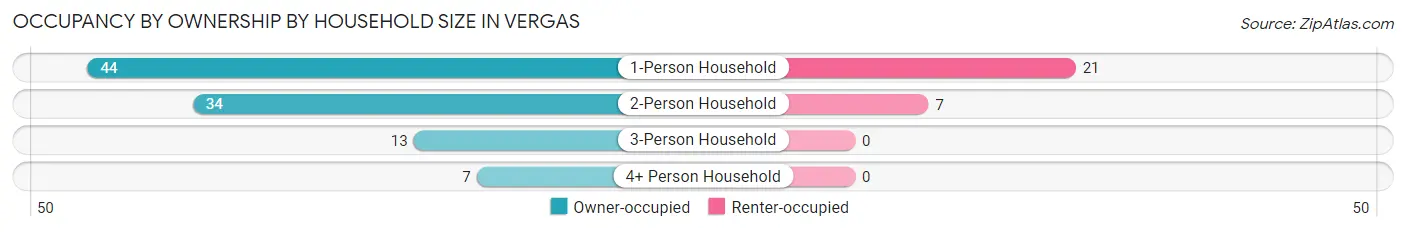
| Household Size | Owner-occupied | Renter-occupied |
| 1-Person Household | 44 (67.7%) | 21 (32.3%) |
| 2-Person Household | 34 (82.9%) | 7 (17.1%) |
| 3-Person Household | 13 (100.0%) | 0 (0.0%) |
| 4+ Person Household | 7 (100.0%) | 0 (0.0%) |
| Total Housing Units | 98 (77.8%) | 28 (22.2%) |
Occupancy by Educational Attainment in Vergas
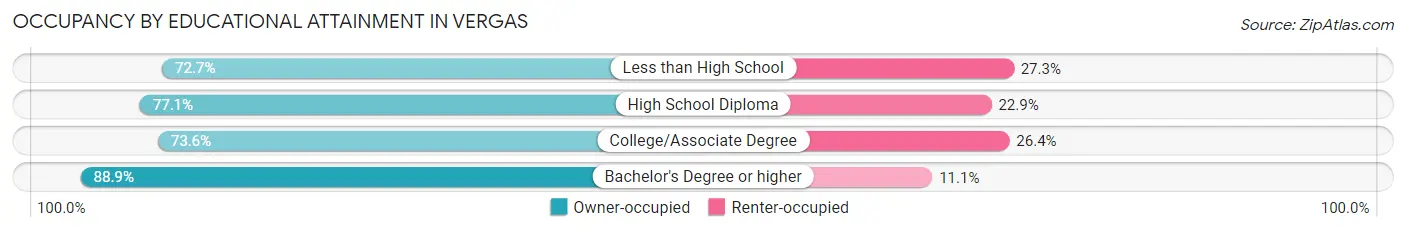
| Household Size | Owner-occupied | Renter-occupied |
| Less than High School | 8 (72.7%) | 3 (27.3%) |
| High School Diploma | 27 (77.1%) | 8 (22.9%) |
| College/Associate Degree | 39 (73.6%) | 14 (26.4%) |
| Bachelor's Degree or higher | 24 (88.9%) | 3 (11.1%) |
Occupancy by Age of Householder in Vergas
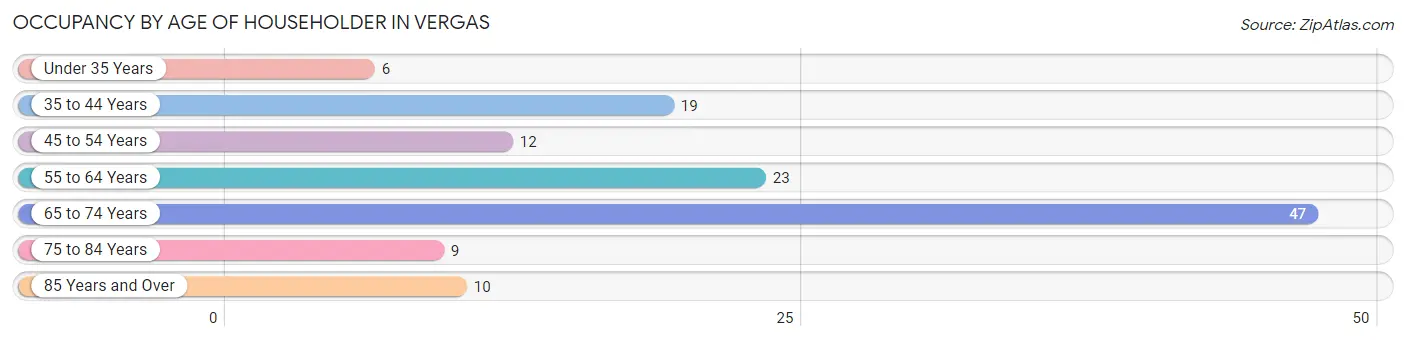
| Age Bracket | # Households | % Households |
| Under 35 Years | 6 | 4.8% |
| 35 to 44 Years | 19 | 15.1% |
| 45 to 54 Years | 12 | 9.5% |
| 55 to 64 Years | 23 | 18.2% |
| 65 to 74 Years | 47 | 37.3% |
| 75 to 84 Years | 9 | 7.1% |
| 85 Years and Over | 10 | 7.9% |
| Total | 126 | 100.0% |
Housing Finances in Vergas
Median Income by Occupancy in Vergas
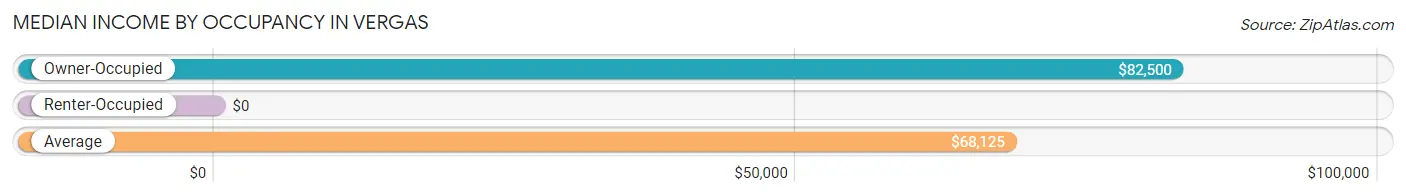
| Occupancy Type | # Households | Median Income |
| Owner-Occupied | 98 (77.8%) | $82,500 |
| Renter-Occupied | 28 (22.2%) | $0 |
| Average | 126 (100.0%) | $68,125 |
Occupancy by Householder Income Bracket in Vergas
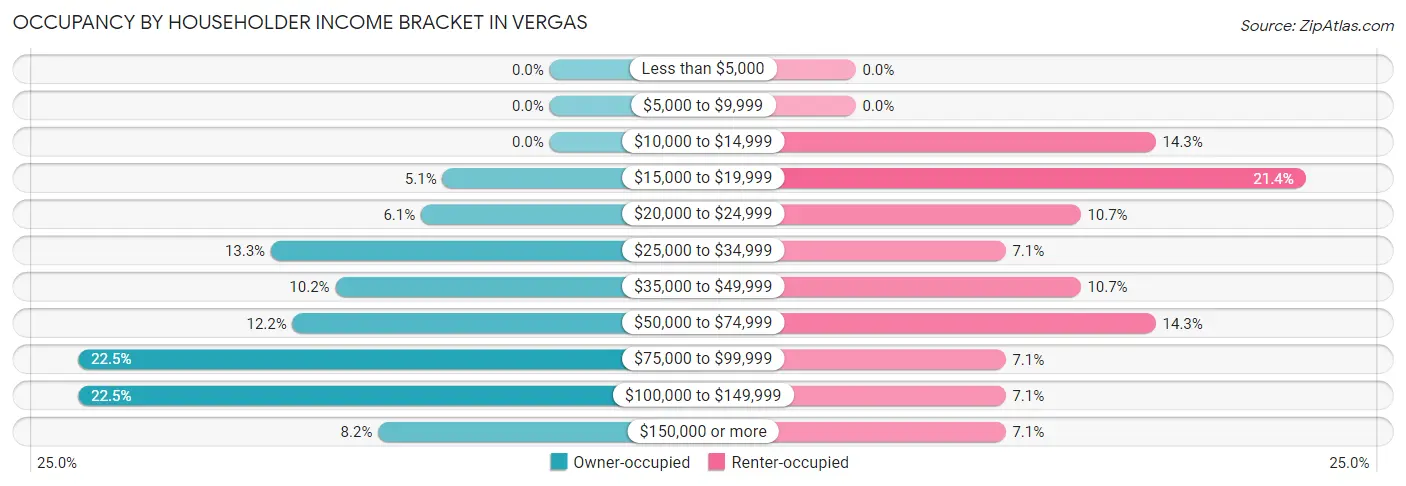
| Income Bracket | Owner-occupied | Renter-occupied |
| Less than $5,000 | 0 (0.0%) | 0 (0.0%) |
| $5,000 to $9,999 | 0 (0.0%) | 0 (0.0%) |
| $10,000 to $14,999 | 0 (0.0%) | 4 (14.3%) |
| $15,000 to $19,999 | 5 (5.1%) | 6 (21.4%) |
| $20,000 to $24,999 | 6 (6.1%) | 3 (10.7%) |
| $25,000 to $34,999 | 13 (13.3%) | 2 (7.1%) |
| $35,000 to $49,999 | 10 (10.2%) | 3 (10.7%) |
| $50,000 to $74,999 | 12 (12.2%) | 4 (14.3%) |
| $75,000 to $99,999 | 22 (22.5%) | 2 (7.1%) |
| $100,000 to $149,999 | 22 (22.5%) | 2 (7.1%) |
| $150,000 or more | 8 (8.2%) | 2 (7.1%) |
| Total | 98 (100.0%) | 28 (100.0%) |
Monthly Housing Cost Tiers in Vergas
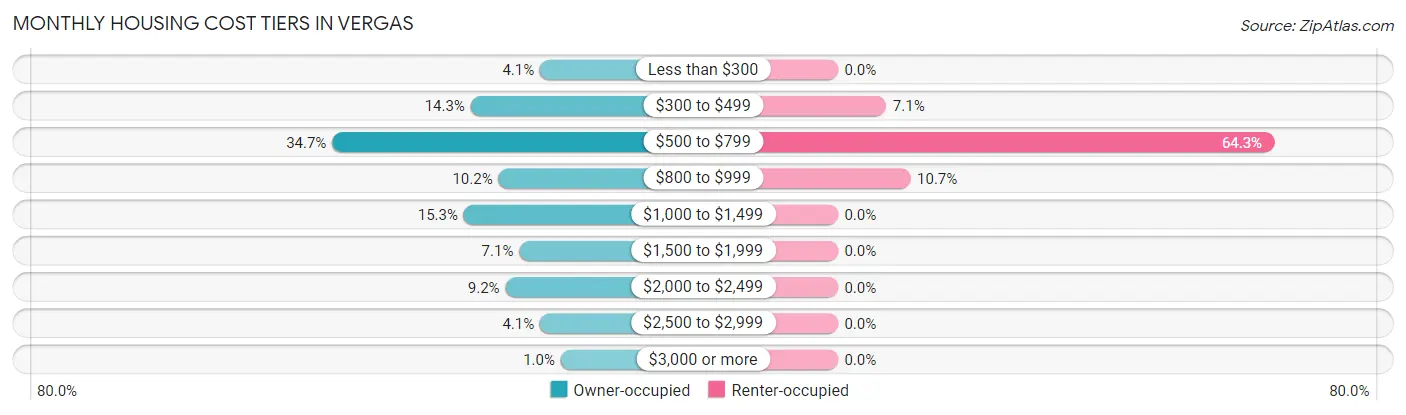
| Monthly Cost | Owner-occupied | Renter-occupied |
| Less than $300 | 4 (4.1%) | 0 (0.0%) |
| $300 to $499 | 14 (14.3%) | 2 (7.1%) |
| $500 to $799 | 34 (34.7%) | 18 (64.3%) |
| $800 to $999 | 10 (10.2%) | 3 (10.7%) |
| $1,000 to $1,499 | 15 (15.3%) | 0 (0.0%) |
| $1,500 to $1,999 | 7 (7.1%) | 0 (0.0%) |
| $2,000 to $2,499 | 9 (9.2%) | 0 (0.0%) |
| $2,500 to $2,999 | 4 (4.1%) | 0 (0.0%) |
| $3,000 or more | 1 (1.0%) | 0 (0.0%) |
| Total | 98 (100.0%) | 28 (100.0%) |
Physical Housing Characteristics in Vergas
Housing Structures in Vergas
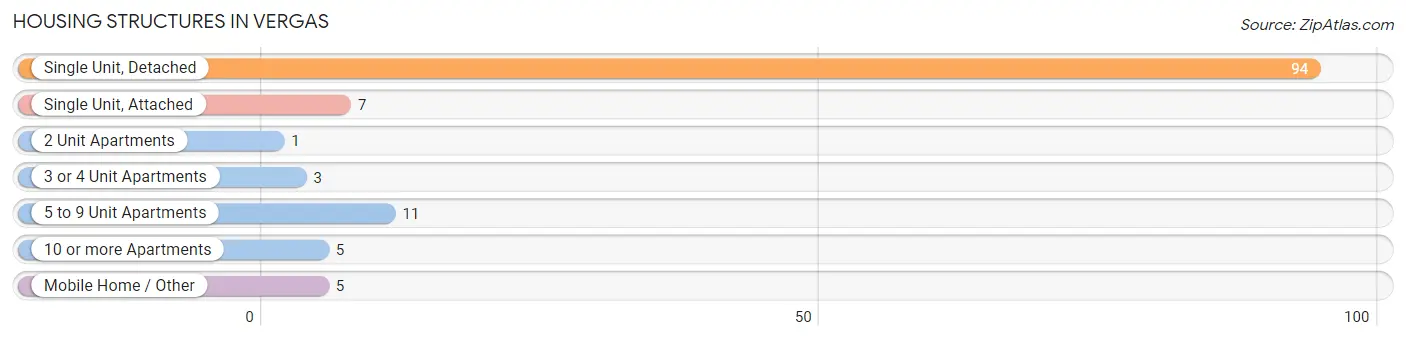
| Structure Type | # Housing Units | % Housing Units |
| Single Unit, Detached | 94 | 74.6% |
| Single Unit, Attached | 7 | 5.6% |
| 2 Unit Apartments | 1 | 0.8% |
| 3 or 4 Unit Apartments | 3 | 2.4% |
| 5 to 9 Unit Apartments | 11 | 8.7% |
| 10 or more Apartments | 5 | 4.0% |
| Mobile Home / Other | 5 | 4.0% |
| Total | 126 | 100.0% |
Housing Structures by Occupancy in Vergas
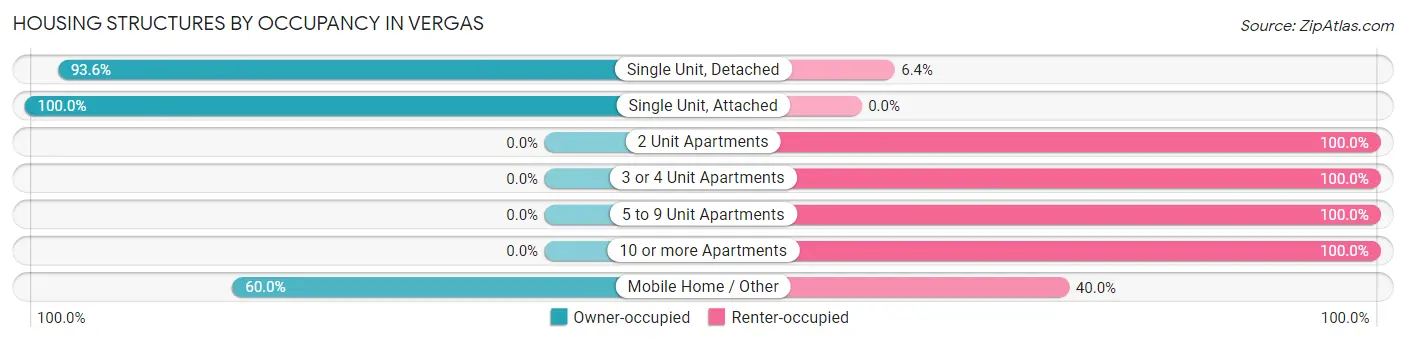
| Structure Type | Owner-occupied | Renter-occupied |
| Single Unit, Detached | 88 (93.6%) | 6 (6.4%) |
| Single Unit, Attached | 7 (100.0%) | 0 (0.0%) |
| 2 Unit Apartments | 0 (0.0%) | 1 (100.0%) |
| 3 or 4 Unit Apartments | 0 (0.0%) | 3 (100.0%) |
| 5 to 9 Unit Apartments | 0 (0.0%) | 11 (100.0%) |
| 10 or more Apartments | 0 (0.0%) | 5 (100.0%) |
| Mobile Home / Other | 3 (60.0%) | 2 (40.0%) |
| Total | 98 (77.8%) | 28 (22.2%) |
Housing Structures by Number of Rooms in Vergas
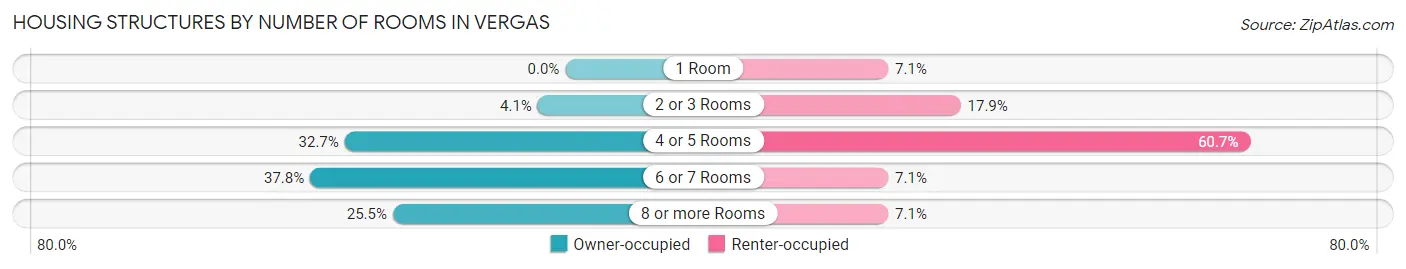
| Number of Rooms | Owner-occupied | Renter-occupied |
| 1 Room | 0 (0.0%) | 2 (7.1%) |
| 2 or 3 Rooms | 4 (4.1%) | 5 (17.9%) |
| 4 or 5 Rooms | 32 (32.7%) | 17 (60.7%) |
| 6 or 7 Rooms | 37 (37.8%) | 2 (7.1%) |
| 8 or more Rooms | 25 (25.5%) | 2 (7.1%) |
| Total | 98 (100.0%) | 28 (100.0%) |
Housing Structure by Heating Type in Vergas
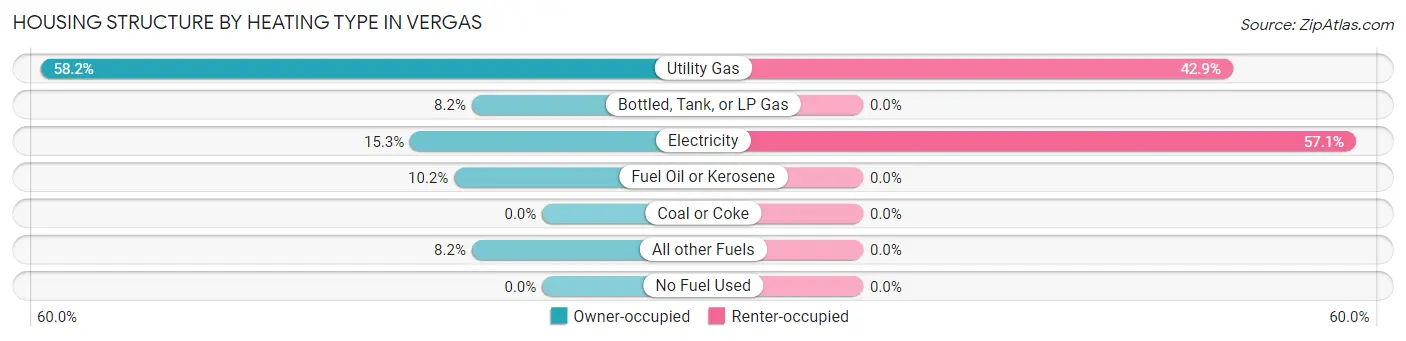
| Heating Type | Owner-occupied | Renter-occupied |
| Utility Gas | 57 (58.2%) | 12 (42.9%) |
| Bottled, Tank, or LP Gas | 8 (8.2%) | 0 (0.0%) |
| Electricity | 15 (15.3%) | 16 (57.1%) |
| Fuel Oil or Kerosene | 10 (10.2%) | 0 (0.0%) |
| Coal or Coke | 0 (0.0%) | 0 (0.0%) |
| All other Fuels | 8 (8.2%) | 0 (0.0%) |
| No Fuel Used | 0 (0.0%) | 0 (0.0%) |
| Total | 98 (100.0%) | 28 (100.0%) |
Household Vehicle Usage in Vergas
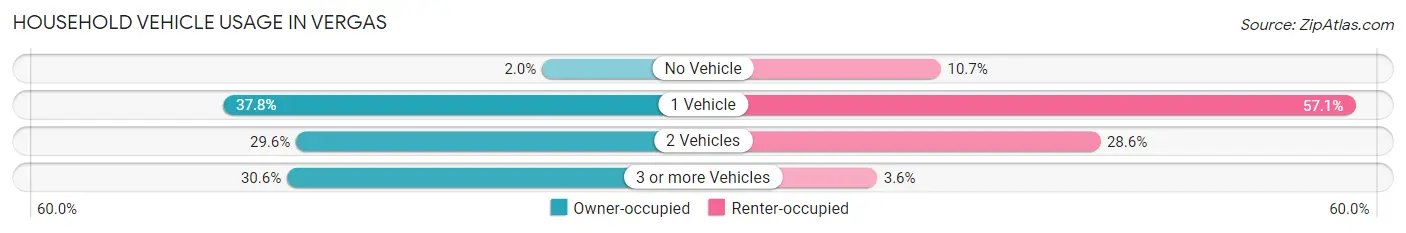
| Vehicles per Household | Owner-occupied | Renter-occupied |
| No Vehicle | 2 (2.0%) | 3 (10.7%) |
| 1 Vehicle | 37 (37.8%) | 16 (57.1%) |
| 2 Vehicles | 29 (29.6%) | 8 (28.6%) |
| 3 or more Vehicles | 30 (30.6%) | 1 (3.6%) |
| Total | 98 (100.0%) | 28 (100.0%) |
Real Estate & Mortgages in Vergas
Real Estate and Mortgage Overview in Vergas
| Characteristic | Without Mortgage | With Mortgage |
| Housing Units | 49 | 49 |
| Median Property Value | $157,600 | $162,500 |
| Median Household Income | $93,750 | $4 |
| Monthly Housing Costs | $541 | $1 |
| Real Estate Taxes | $1,671 | $0 |
Property Value by Mortgage Status in Vergas
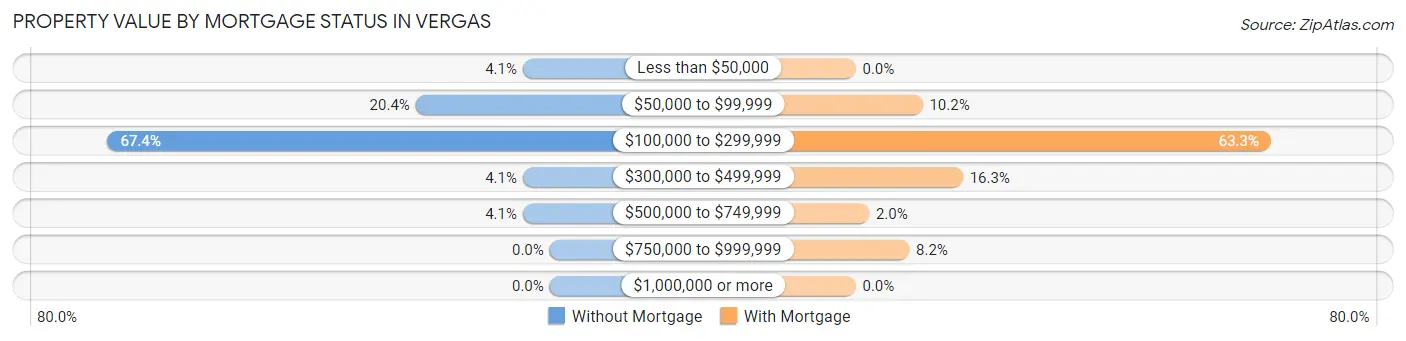
| Property Value | Without Mortgage | With Mortgage |
| Less than $50,000 | 2 (4.1%) | 0 (0.0%) |
| $50,000 to $99,999 | 10 (20.4%) | 5 (10.2%) |
| $100,000 to $299,999 | 33 (67.3%) | 31 (63.3%) |
| $300,000 to $499,999 | 2 (4.1%) | 8 (16.3%) |
| $500,000 to $749,999 | 2 (4.1%) | 1 (2.0%) |
| $750,000 to $999,999 | 0 (0.0%) | 4 (8.2%) |
| $1,000,000 or more | 0 (0.0%) | 0 (0.0%) |
| Total | 49 (100.0%) | 49 (100.0%) |
Household Income by Mortgage Status in Vergas
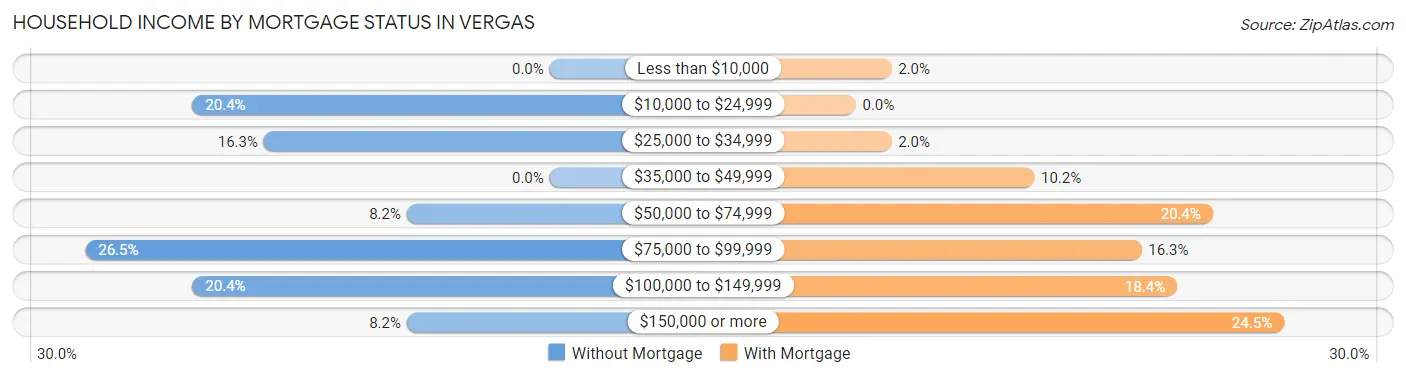
| Household Income | Without Mortgage | With Mortgage |
| Less than $10,000 | 0 (0.0%) | 1 (2.0%) |
| $10,000 to $24,999 | 10 (20.4%) | 0 (0.0%) |
| $25,000 to $34,999 | 8 (16.3%) | 1 (2.0%) |
| $35,000 to $49,999 | 0 (0.0%) | 5 (10.2%) |
| $50,000 to $74,999 | 4 (8.2%) | 10 (20.4%) |
| $75,000 to $99,999 | 13 (26.5%) | 8 (16.3%) |
| $100,000 to $149,999 | 10 (20.4%) | 9 (18.4%) |
| $150,000 or more | 4 (8.2%) | 12 (24.5%) |
| Total | 49 (100.0%) | 49 (100.0%) |
Property Value to Household Income Ratio in Vergas
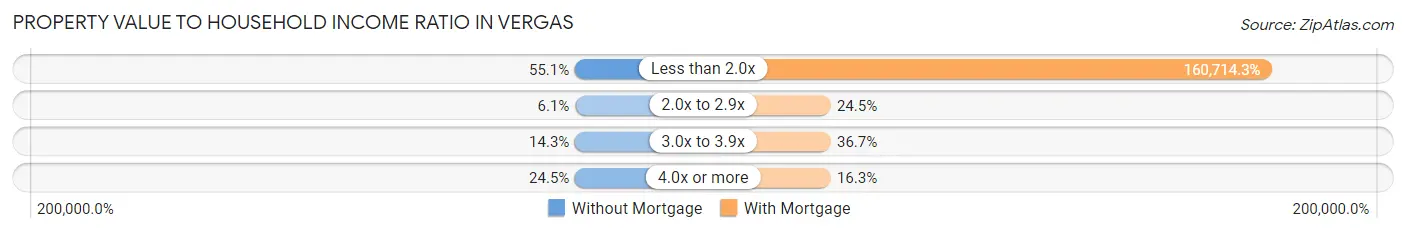
| Value-to-Income Ratio | Without Mortgage | With Mortgage |
| Less than 2.0x | 27 (55.1%) | 78,750 (160,714.3%) |
| 2.0x to 2.9x | 3 (6.1%) | 12 (24.5%) |
| 3.0x to 3.9x | 7 (14.3%) | 18 (36.7%) |
| 4.0x or more | 12 (24.5%) | 8 (16.3%) |
| Total | 49 (100.0%) | 49 (100.0%) |
Real Estate Taxes by Mortgage Status in Vergas
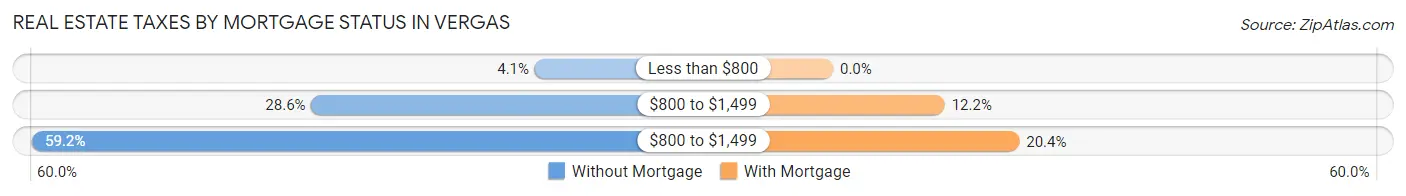
| Property Taxes | Without Mortgage | With Mortgage |
| Less than $800 | 2 (4.1%) | 0 (0.0%) |
| $800 to $1,499 | 14 (28.6%) | 6 (12.2%) |
| $800 to $1,499 | 29 (59.2%) | 10 (20.4%) |
| Total | 49 (100.0%) | 49 (100.0%) |
Health & Disability in Vergas
Health Insurance Coverage by Age in Vergas
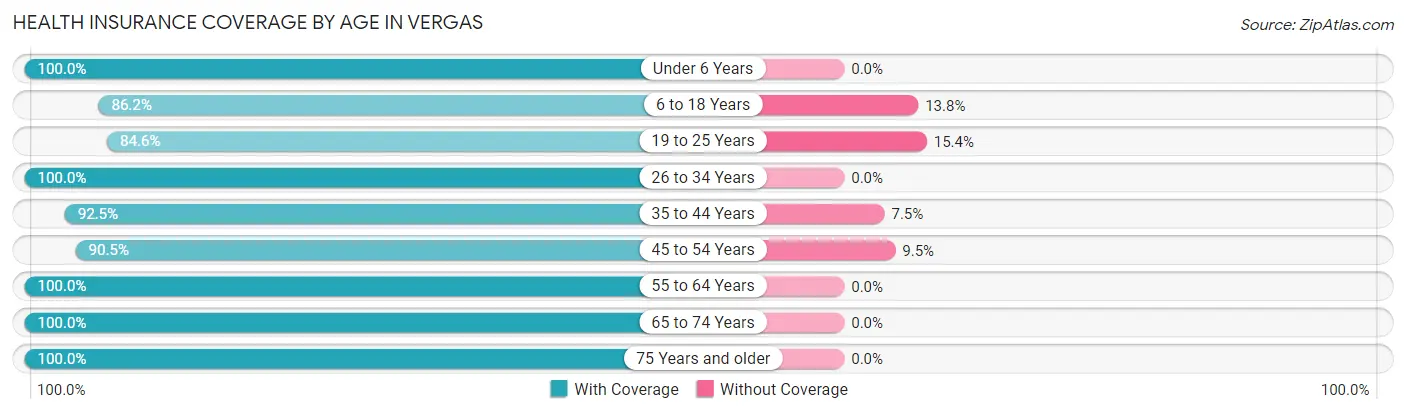
| Age Bracket | With Coverage | Without Coverage |
| Under 6 Years | 4 (100.0%) | 0 (0.0%) |
| 6 to 18 Years | 25 (86.2%) | 4 (13.8%) |
| 19 to 25 Years | 11 (84.6%) | 2 (15.4%) |
| 26 to 34 Years | 5 (100.0%) | 0 (0.0%) |
| 35 to 44 Years | 37 (92.5%) | 3 (7.5%) |
| 45 to 54 Years | 19 (90.5%) | 2 (9.5%) |
| 55 to 64 Years | 42 (100.0%) | 0 (0.0%) |
| 65 to 74 Years | 66 (100.0%) | 0 (0.0%) |
| 75 Years and older | 22 (100.0%) | 0 (0.0%) |
| Total | 231 (95.5%) | 11 (4.5%) |
Health Insurance Coverage by Citizenship Status in Vergas
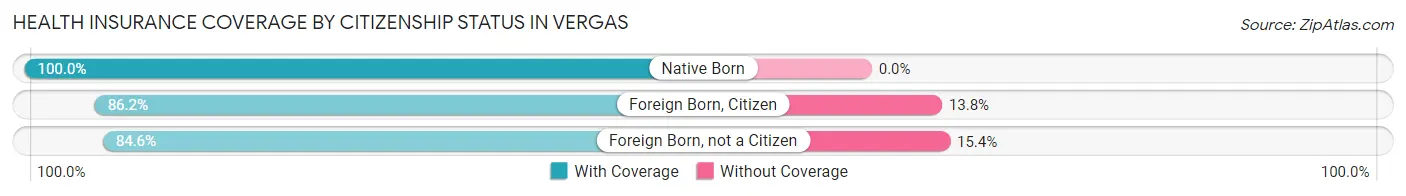
| Citizenship Status | With Coverage | Without Coverage |
| Native Born | 4 (100.0%) | 0 (0.0%) |
| Foreign Born, Citizen | 25 (86.2%) | 4 (13.8%) |
| Foreign Born, not a Citizen | 11 (84.6%) | 2 (15.4%) |
Health Insurance Coverage by Household Income in Vergas
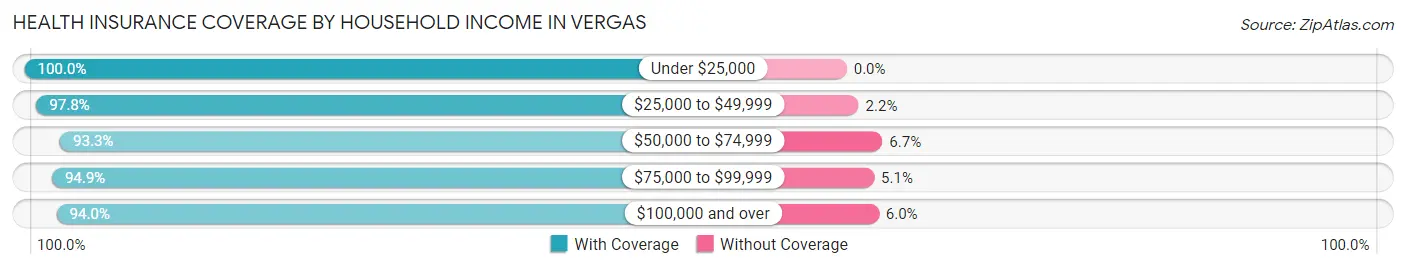
| Household Income | With Coverage | Without Coverage |
| Under $25,000 | 28 (100.0%) | 0 (0.0%) |
| $25,000 to $49,999 | 44 (97.8%) | 1 (2.2%) |
| $50,000 to $74,999 | 28 (93.3%) | 2 (6.7%) |
| $75,000 to $99,999 | 37 (94.9%) | 2 (5.1%) |
| $100,000 and over | 94 (94.0%) | 6 (6.0%) |
Public vs Private Health Insurance Coverage by Age in Vergas
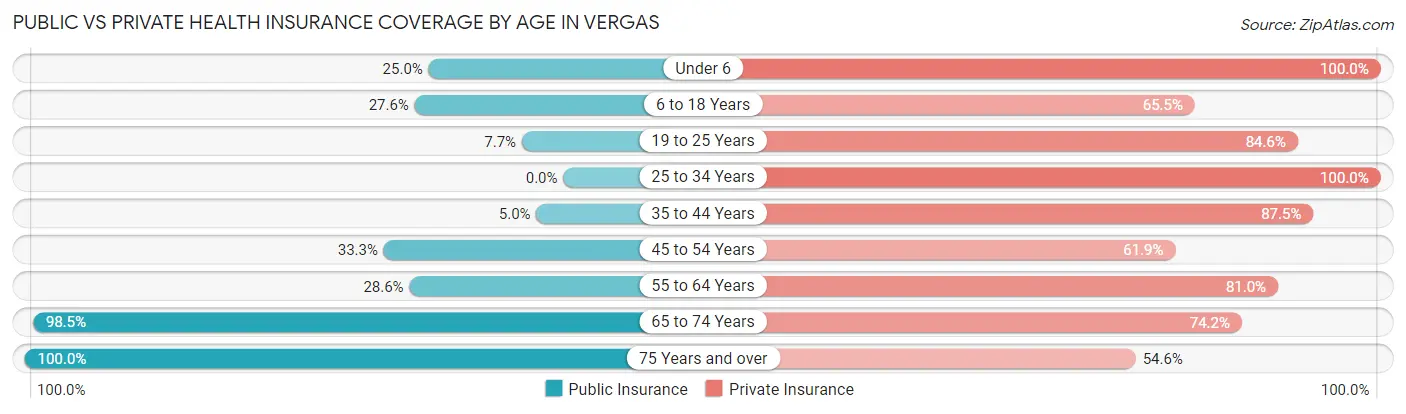
| Age Bracket | Public Insurance | Private Insurance |
| Under 6 | 1 (25.0%) | 4 (100.0%) |
| 6 to 18 Years | 8 (27.6%) | 19 (65.5%) |
| 19 to 25 Years | 1 (7.7%) | 11 (84.6%) |
| 25 to 34 Years | 0 (0.0%) | 5 (100.0%) |
| 35 to 44 Years | 2 (5.0%) | 35 (87.5%) |
| 45 to 54 Years | 7 (33.3%) | 13 (61.9%) |
| 55 to 64 Years | 12 (28.6%) | 34 (80.9%) |
| 65 to 74 Years | 65 (98.5%) | 49 (74.2%) |
| 75 Years and over | 22 (100.0%) | 12 (54.5%) |
| Total | 118 (48.8%) | 182 (75.2%) |
Disability Status by Sex by Age in Vergas
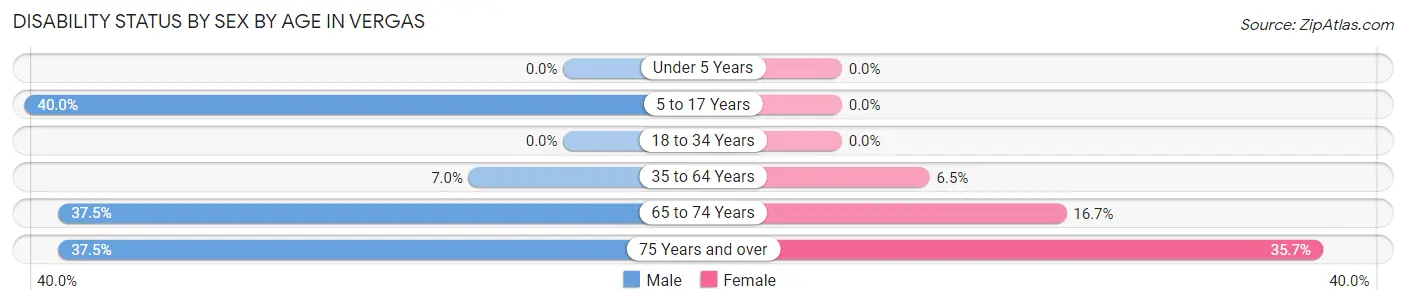
| Age Bracket | Male | Female |
| Under 5 Years | 0 (0.0%) | 0 (0.0%) |
| 5 to 17 Years | 6 (40.0%) | 0 (0.0%) |
| 18 to 34 Years | 0 (0.0%) | 0 (0.0%) |
| 35 to 64 Years | 4 (7.0%) | 3 (6.5%) |
| 65 to 74 Years | 9 (37.5%) | 7 (16.7%) |
| 75 Years and over | 3 (37.5%) | 5 (35.7%) |
Disability Class by Sex by Age in Vergas
Disability Class: Hearing Difficulty
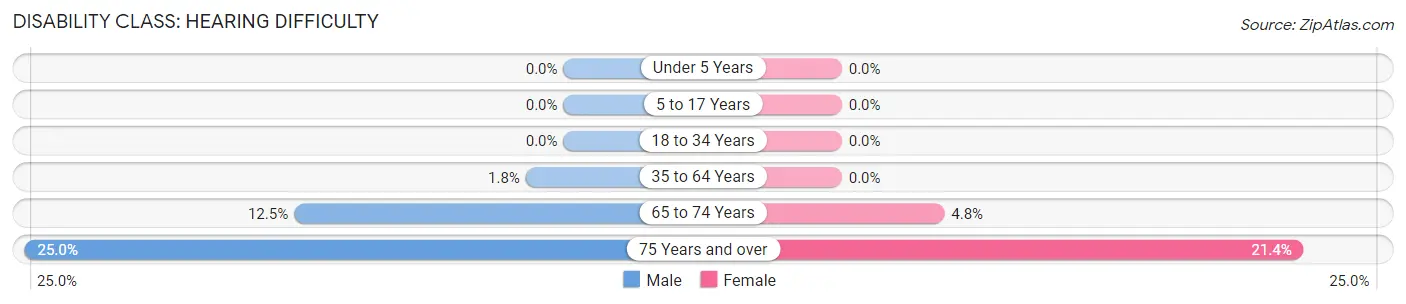
| Age Bracket | Male | Female |
| Under 5 Years | 0 (0.0%) | 0 (0.0%) |
| 5 to 17 Years | 0 (0.0%) | 0 (0.0%) |
| 18 to 34 Years | 0 (0.0%) | 0 (0.0%) |
| 35 to 64 Years | 1 (1.8%) | 0 (0.0%) |
| 65 to 74 Years | 3 (12.5%) | 2 (4.8%) |
| 75 Years and over | 2 (25.0%) | 3 (21.4%) |
Disability Class: Vision Difficulty
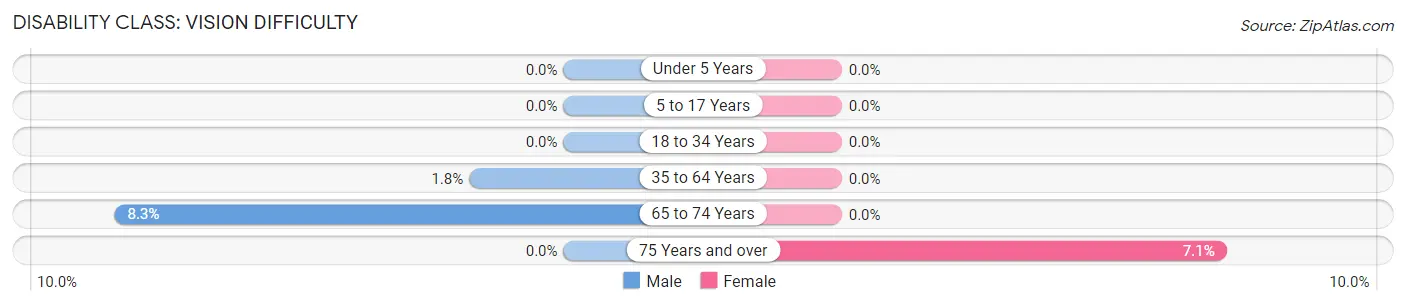
| Age Bracket | Male | Female |
| Under 5 Years | 0 (0.0%) | 0 (0.0%) |
| 5 to 17 Years | 0 (0.0%) | 0 (0.0%) |
| 18 to 34 Years | 0 (0.0%) | 0 (0.0%) |
| 35 to 64 Years | 1 (1.8%) | 0 (0.0%) |
| 65 to 74 Years | 2 (8.3%) | 0 (0.0%) |
| 75 Years and over | 0 (0.0%) | 1 (7.1%) |
Disability Class: Cognitive Difficulty
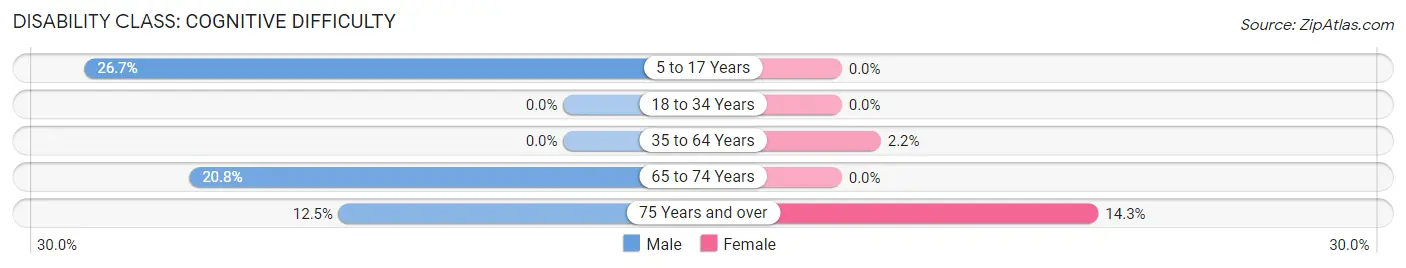
| Age Bracket | Male | Female |
| 5 to 17 Years | 4 (26.7%) | 0 (0.0%) |
| 18 to 34 Years | 0 (0.0%) | 0 (0.0%) |
| 35 to 64 Years | 0 (0.0%) | 1 (2.2%) |
| 65 to 74 Years | 5 (20.8%) | 0 (0.0%) |
| 75 Years and over | 1 (12.5%) | 2 (14.3%) |
Disability Class: Ambulatory Difficulty
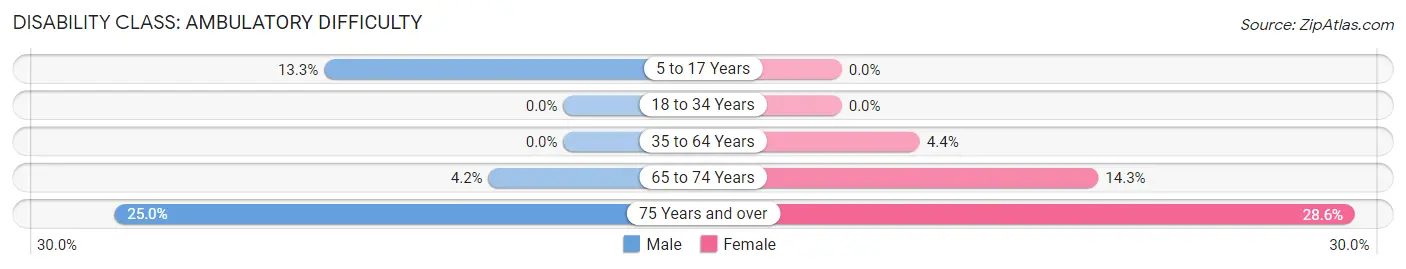
| Age Bracket | Male | Female |
| 5 to 17 Years | 2 (13.3%) | 0 (0.0%) |
| 18 to 34 Years | 0 (0.0%) | 0 (0.0%) |
| 35 to 64 Years | 0 (0.0%) | 2 (4.3%) |
| 65 to 74 Years | 1 (4.2%) | 6 (14.3%) |
| 75 Years and over | 2 (25.0%) | 4 (28.6%) |
Disability Class: Self-Care Difficulty
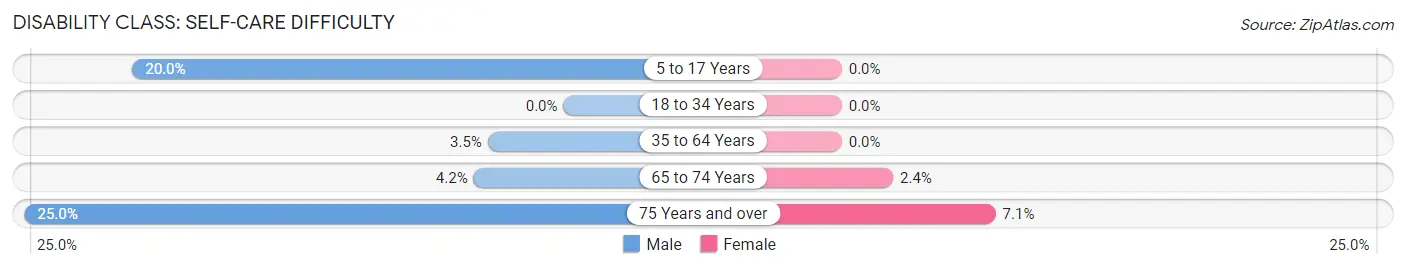
| Age Bracket | Male | Female |
| 5 to 17 Years | 3 (20.0%) | 0 (0.0%) |
| 18 to 34 Years | 0 (0.0%) | 0 (0.0%) |
| 35 to 64 Years | 2 (3.5%) | 0 (0.0%) |
| 65 to 74 Years | 1 (4.2%) | 1 (2.4%) |
| 75 Years and over | 2 (25.0%) | 1 (7.1%) |
Technology Access in Vergas
Computing Device Access in Vergas
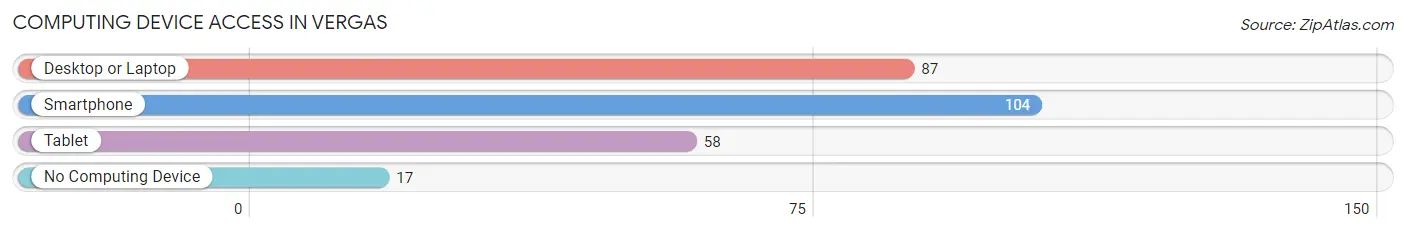
| Device Type | # Households | % Households |
| Desktop or Laptop | 87 | 69.1% |
| Smartphone | 104 | 82.5% |
| Tablet | 58 | 46.0% |
| No Computing Device | 17 | 13.5% |
| Total | 126 | 100.0% |
Internet Access in Vergas
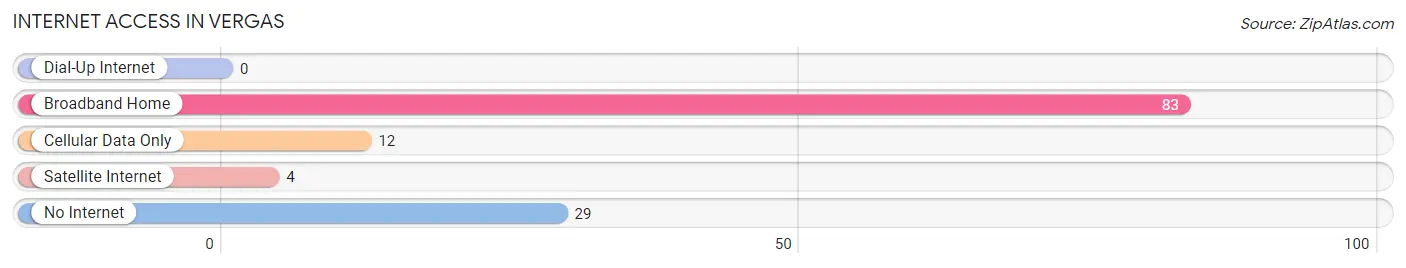
| Internet Type | # Households | % Households |
| Dial-Up Internet | 0 | 0.0% |
| Broadband Home | 83 | 65.9% |
| Cellular Data Only | 12 | 9.5% |
| Satellite Internet | 4 | 3.2% |
| No Internet | 29 | 23.0% |
| Total | 126 | 100.0% |
Vergas Summary
Vergas, Minnesota is a small city located in Otter Tail County in the west-central part of the state. It is situated on the western shore of Otter Tail Lake, one of the largest lakes in Minnesota. The city has a population of approximately 1,000 people and is part of the Fergus Falls Metropolitan Statistical Area.
History
Vergas was founded in 1881 by a group of settlers from Norway. The city was named after the Norwegian city of Vergas, which is located in the county of Nordland. The settlers were attracted to the area by the abundance of timber and the potential for farming. The first settlers built a sawmill and a gristmill, and the town quickly grew. By the early 1900s, Vergas had become a thriving community with a variety of businesses, including a hotel, a bank, a general store, and a post office.
In the early 1900s, Vergas was a popular tourist destination. The city was known for its beautiful scenery and its many lakes. Visitors came to enjoy the fishing, swimming, and boating. The city also had a thriving lumber industry, and the sawmills provided employment for many of the residents.
Geography
Vergas is located in the west-central part of Minnesota, in Otter Tail County. The city is situated on the western shore of Otter Tail Lake, one of the largest lakes in the state. The lake is approximately 10 miles long and 5 miles wide. The city is surrounded by rolling hills and forests, and the area is known for its beautiful scenery.
The city of Vergas has a total area of 1.2 square miles, all of which is land. The city is located at an elevation of 1,072 feet above sea level.
Economy
The economy of Vergas is largely based on tourism and agriculture. The city is a popular destination for fishing, swimming, and boating. The city also has a thriving lumber industry, and the sawmills provide employment for many of the residents.
The city is home to several small businesses, including restaurants, retail stores, and service providers. The city also has a small manufacturing sector, which produces a variety of products, including furniture, clothing, and food products.
Demographics
As of the 2010 census, the population of Vergas was 1,000 people. The racial makeup of the city was 97.2% White, 0.7% African American, 0.3% Native American, 0.3% Asian, 0.1% Pacific Islander, and 1.4% from other races. The median household income was $41,250, and the median family income was $50,000.
The city has a large Norwegian-American population, and the city celebrates its Norwegian heritage with an annual Norwegian festival. The city also has a large population of retirees, and the median age of the population is 44.7 years.
Conclusion
Vergas, Minnesota is a small city located in Otter Tail County in the west-central part of the state. It is situated on the western shore of Otter Tail Lake, one of the largest lakes in Minnesota. The city has a population of approximately 1,000 people and is part of the Fergus Falls Metropolitan Statistical Area. The economy of Vergas is largely based on tourism and agriculture, and the city is a popular destination for fishing, swimming, and boating. The city also has a large Norwegian-American population, and the city celebrates its Norwegian heritage with an annual Norwegian festival.
Common Questions
What is Per Capita Income in Vergas?
Per Capita income in Vergas is $53,406.
What is the Median Family Income in Vergas?
Median Family Income in Vergas is $98,125.
What is the Median Household income in Vergas?
Median Household Income in Vergas is $68,125.
What is Income or Wage Gap in Vergas?
Income or Wage Gap in Vergas is 36.9%.
Women in Vergas earn 63.1 cents for every dollar earned by a man.
What is Inequality or Gini Index in Vergas?
Inequality or Gini Index in Vergas is 0.52.
What is the Total Population of Vergas?
Total Population of Vergas is 242.
What is the Total Male Population of Vergas?
Total Male Population of Vergas is 118.
What is the Total Female Population of Vergas?
Total Female Population of Vergas is 124.
What is the Ratio of Males per 100 Females in Vergas?
There are 95.16 Males per 100 Females in Vergas.
What is the Ratio of Females per 100 Males in Vergas?
There are 105.08 Females per 100 Males in Vergas.
What is the Median Population Age in Vergas?
Median Population Age in Vergas is 57.4 Years.
What is the Average Family Size in Vergas
Average Family Size in Vergas is 3.0 People.
What is the Average Household Size in Vergas
Average Household Size in Vergas is 1.9 People.
How Large is the Labor Force in Vergas?
There are 114 People in the Labor Forcein in Vergas.
What is the Percentage of People in the Labor Force in Vergas?
52.3% of People are in the Labor Force in Vergas.
What is the Unemployment Rate in Vergas?
Unemployment Rate in Vergas is 2.6%.