Tamarack, MN Map & Demographics
Tamarack Map
Tamarack Overview
$27,043
PER CAPITA INCOME
$47,292
AVG HOUSEHOLD INCOME
0.34
INEQUALITY / GINI INDEX
76
TOTAL POPULATION
48
MALE POPULATION
28
FEMALE POPULATION
171.43
MALES / 100 FEMALES
58.33
FEMALES / 100 MALES
55.1
MEDIAN AGE
2.5
AVG FAMILY SIZE
2.3
AVG HOUSEHOLD SIZE
37
LABOR FORCE [ PEOPLE ]
54.4%
PERCENT IN LABOR FORCE
5.4%
UNEMPLOYMENT RATE
Tamarack Zip Codes
Tamarack Area Codes
Income in Tamarack
Income Overview in Tamarack
| Characteristic | Number | Measure |
| Per Capita Income | 76 | $27,043 |
| Median Family Income | 19 | $0 |
| Mean Family Income | 19 | $54,668 |
| Median Household Income | 33 | $47,292 |
| Mean Household Income | 33 | $62,297 |
| Income Deficit | 19 | $0 |
| Wage / Income Gap (%) | 76 | 0.00% |
| Wage / Income Gap ($) | 76 | 100.00¢ per $1 |
| Gini / Inequality Index | 76 | 0.34 |
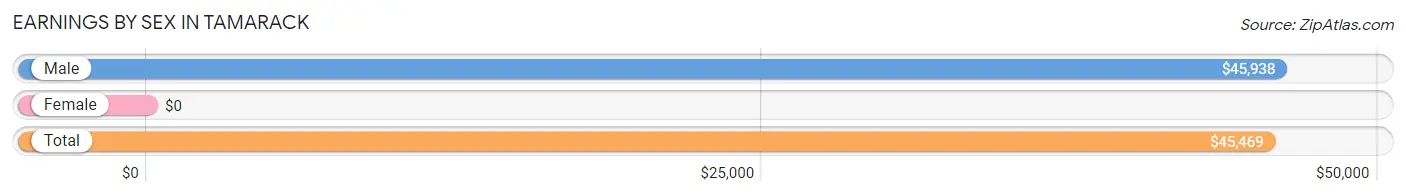
Earnings by Sex in Tamarack
| Sex | Number | Average Earnings |
| Male | 25 (64.1%) | $45,938 |
| Female | 14 (35.9%) | $0 |
| Total | 39 (100.0%) | $45,469 |
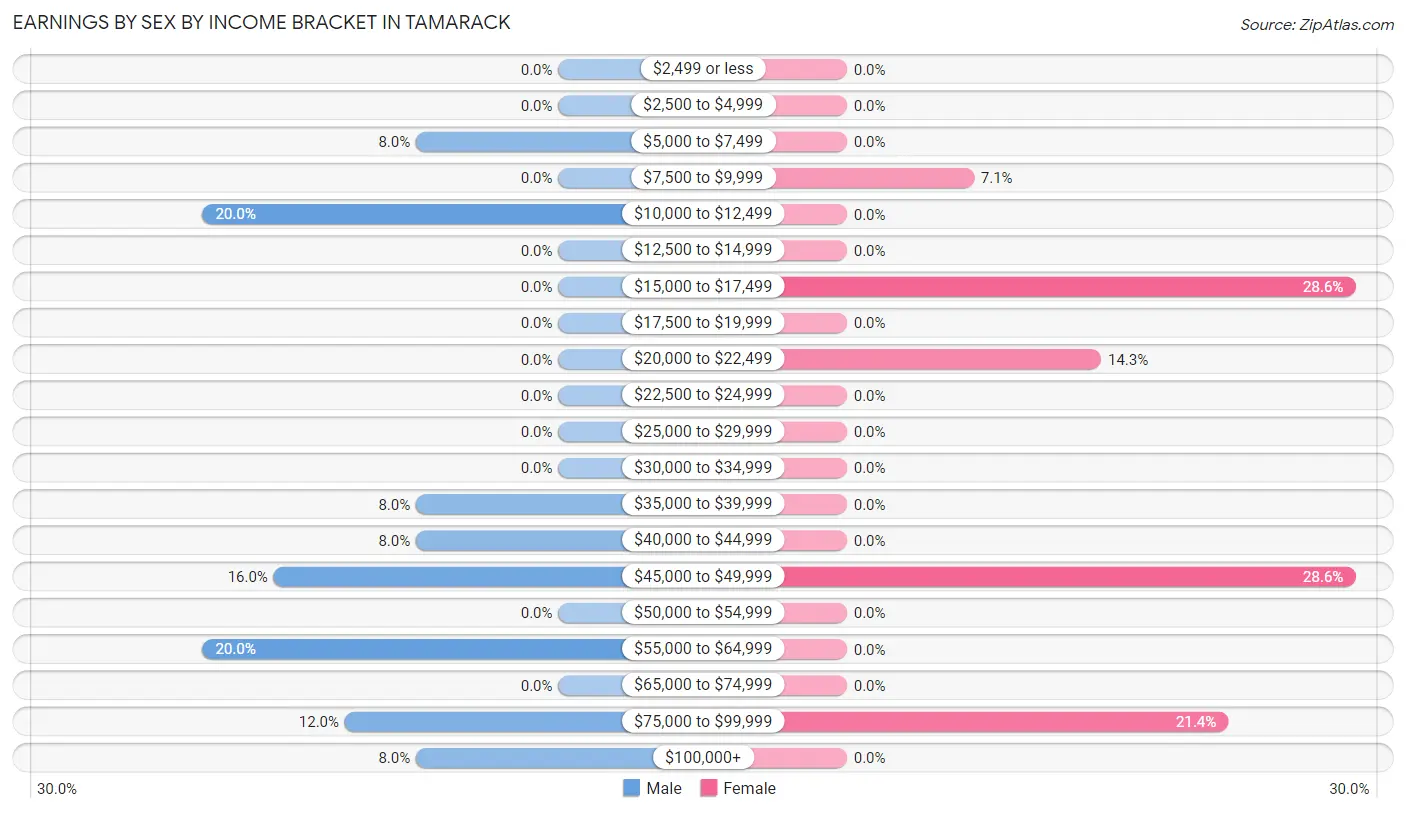
Earnings by Sex by Income Bracket in Tamarack
The most common earnings brackets in Tamarack are $10,000 to $12,499 for men (5 | 20.0%) and $15,000 to $17,499 for women (4 | 28.6%).
| Income | Male | Female |
| $2,499 or less | 0 (0.0%) | 0 (0.0%) |
| $2,500 to $4,999 | 0 (0.0%) | 0 (0.0%) |
| $5,000 to $7,499 | 2 (8.0%) | 0 (0.0%) |
| $7,500 to $9,999 | 0 (0.0%) | 1 (7.1%) |
| $10,000 to $12,499 | 5 (20.0%) | 0 (0.0%) |
| $12,500 to $14,999 | 0 (0.0%) | 0 (0.0%) |
| $15,000 to $17,499 | 0 (0.0%) | 4 (28.6%) |
| $17,500 to $19,999 | 0 (0.0%) | 0 (0.0%) |
| $20,000 to $22,499 | 0 (0.0%) | 2 (14.3%) |
| $22,500 to $24,999 | 0 (0.0%) | 0 (0.0%) |
| $25,000 to $29,999 | 0 (0.0%) | 0 (0.0%) |
| $30,000 to $34,999 | 0 (0.0%) | 0 (0.0%) |
| $35,000 to $39,999 | 2 (8.0%) | 0 (0.0%) |
| $40,000 to $44,999 | 2 (8.0%) | 0 (0.0%) |
| $45,000 to $49,999 | 4 (16.0%) | 4 (28.6%) |
| $50,000 to $54,999 | 0 (0.0%) | 0 (0.0%) |
| $55,000 to $64,999 | 5 (20.0%) | 0 (0.0%) |
| $65,000 to $74,999 | 0 (0.0%) | 0 (0.0%) |
| $75,000 to $99,999 | 3 (12.0%) | 3 (21.4%) |
| $100,000+ | 2 (8.0%) | 0 (0.0%) |
| Total | 25 (100.0%) | 14 (100.0%) |
Earnings by Sex by Educational Attainment in Tamarack
| Educational Attainment | Male Income | Female Income |
| Less than High School | - | - |
| High School Diploma | - | - |
| College or Associate's Degree | - | - |
| Bachelor's Degree | - | - |
| Graduate Degree | - | - |
| Total | $53,750 | $0 |
Family Income in Tamarack
Family Income Brackets in Tamarack
According to the Tamarack family income data, there are 9 families falling into the $10,000 to $14,999 income range, which is the most common income bracket and makes up 47.4% of all families.
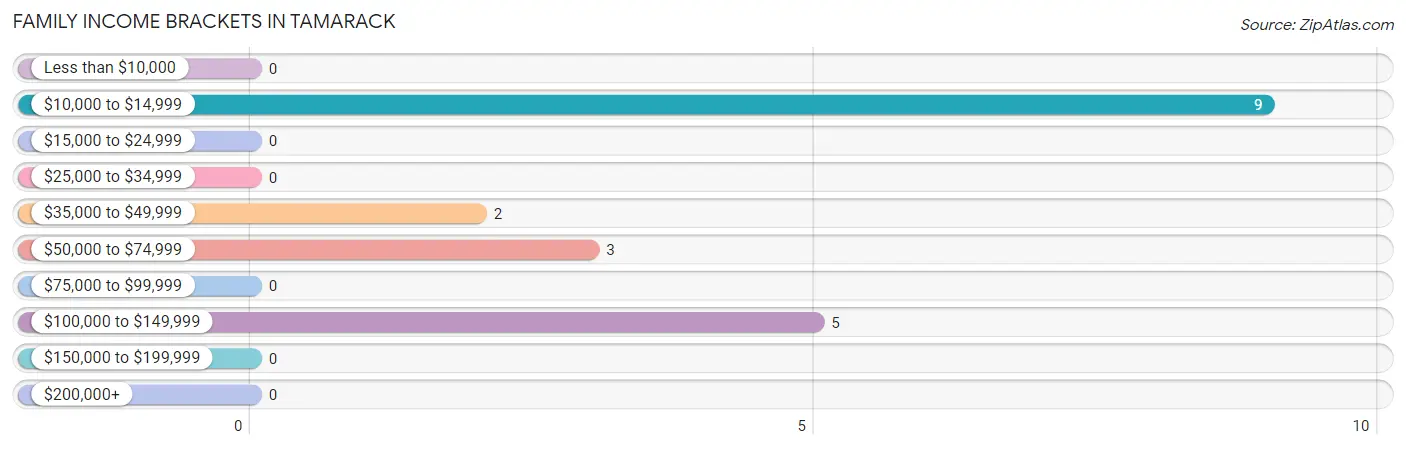
| Income Bracket | # Families | % Families |
| Less than $10,000 | 0 | 0.0% |
| $10,000 to $14,999 | 9 | 47.4% |
| $15,000 to $24,999 | 0 | 0.0% |
| $25,000 to $34,999 | 0 | 0.0% |
| $35,000 to $49,999 | 2 | 10.5% |
| $50,000 to $74,999 | 3 | 15.8% |
| $75,000 to $99,999 | 0 | 0.0% |
| $100,000 to $149,999 | 5 | 26.3% |
| $150,000 to $199,999 | 0 | 0.0% |
| $200,000+ | 0 | 0.0% |
Family Income by Famaliy Size in Tamarack
| Income Bracket | # Families | Median Income |
| 2-Person Families | 12 (63.2%) | $0 |
| 3-Person Families | 7 (36.8%) | $0 |
| 4-Person Families | 0 (0.0%) | $0 |
| 5-Person Families | 0 (0.0%) | $0 |
| 6-Person Families | 0 (0.0%) | $0 |
| 7+ Person Families | 0 (0.0%) | $0 |
| Total | 19 (100.0%) | $0 |
Family Income by Number of Earners in Tamarack
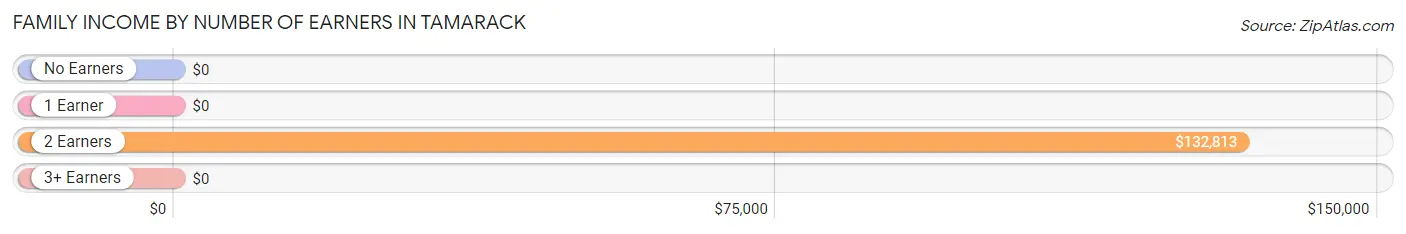
| Number of Earners | # Families | Median Income |
| No Earners | 5 (26.3%) | $0 |
| 1 Earner | 7 (36.8%) | $0 |
| 2 Earners | 7 (36.8%) | $132,813 |
| 3+ Earners | 0 (0.0%) | $0 |
| Total | 19 (100.0%) | $0 |
Household Income in Tamarack
Household Income Brackets in Tamarack
With 10 households falling in the category, the $35,000 to $49,999 income range is the most frequent in Tamarack, accounting for 30.3% of all households.
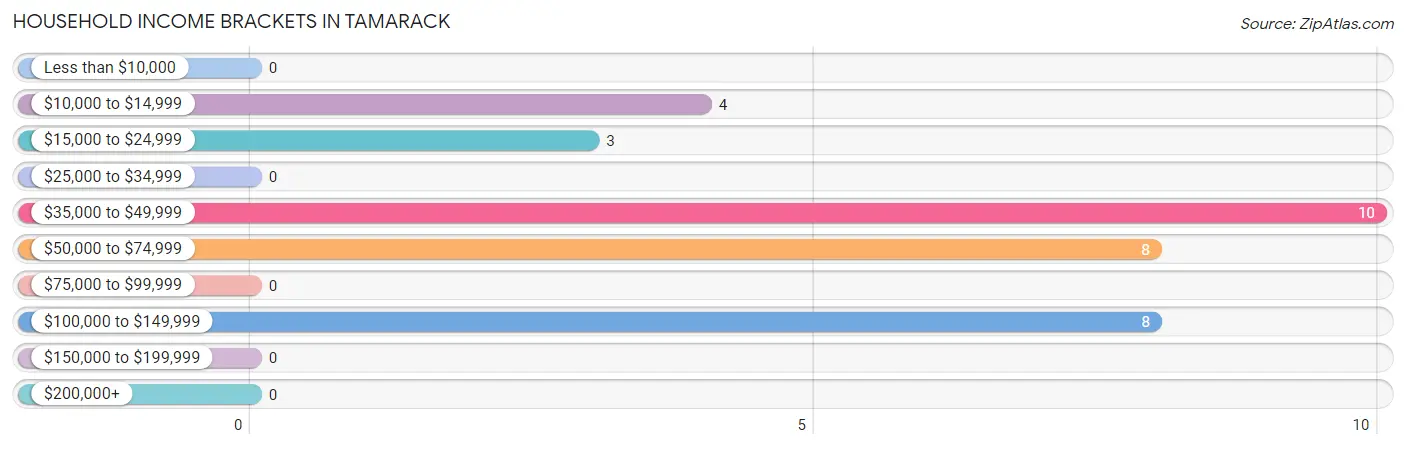
| Income Bracket | # Households | % Households |
| Less than $10,000 | 0 | 0.0% |
| $10,000 to $14,999 | 4 | 12.1% |
| $15,000 to $24,999 | 3 | 9.1% |
| $25,000 to $34,999 | 0 | 0.0% |
| $35,000 to $49,999 | 10 | 30.3% |
| $50,000 to $74,999 | 8 | 24.2% |
| $75,000 to $99,999 | 0 | 0.0% |
| $100,000 to $149,999 | 8 | 24.2% |
| $150,000 to $199,999 | 0 | 0.0% |
| $200,000+ | 0 | 0.0% |
Household Income by Householder Age in Tamarack
The median household income in Tamarack is $47,292, with the highest median household income of $71,607 found in the 45 to 64 years age bracket for the primary householder. A total of 21 households (63.6%) fall into this category.
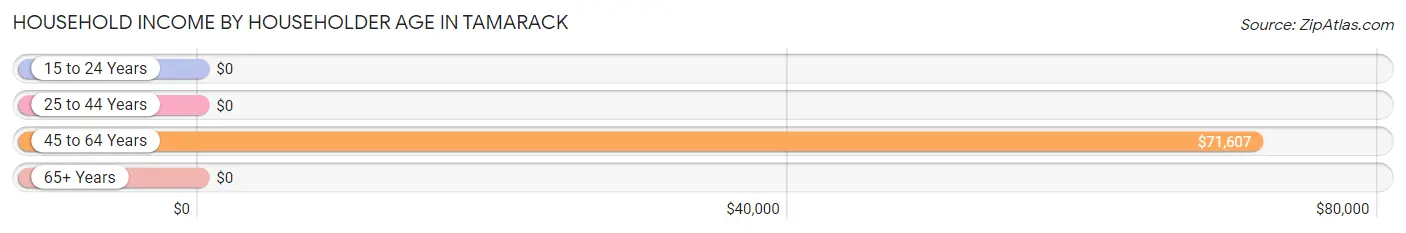
| Income Bracket | # Households | Median Income |
| 15 to 24 Years | 0 (0.0%) | $0 |
| 25 to 44 Years | 6 (18.2%) | $0 |
| 45 to 64 Years | 21 (63.6%) | $71,607 |
| 65+ Years | 6 (18.2%) | $0 |
| Total | 33 (100.0%) | $47,292 |
Poverty in Tamarack
Income Below Poverty by Sex and Age in Tamarack
With 54.2% poverty level for males and 35.7% for females among the residents of Tamarack, 18 to 24 year old males and 45 to 54 year old females are the most vulnerable to poverty, with 5 males (100.0%) and 5 females (83.3%) in their respective age groups living below the poverty level.
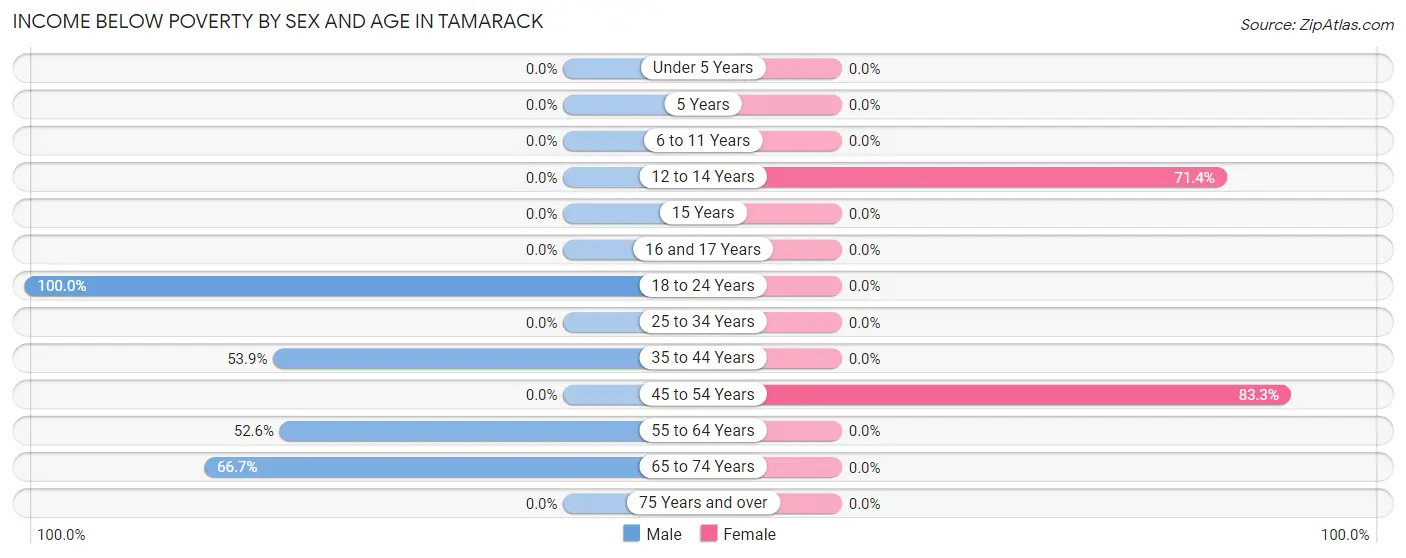
| Age Bracket | Male | Female |
| Under 5 Years | 0 (0.0%) | 0 (0.0%) |
| 5 Years | 0 (0.0%) | 0 (0.0%) |
| 6 to 11 Years | 0 (0.0%) | 0 (0.0%) |
| 12 to 14 Years | 0 (0.0%) | 5 (71.4%) |
| 15 Years | 0 (0.0%) | 0 (0.0%) |
| 16 and 17 Years | 0 (0.0%) | 0 (0.0%) |
| 18 to 24 Years | 5 (100.0%) | 0 (0.0%) |
| 25 to 34 Years | 0 (0.0%) | 0 (0.0%) |
| 35 to 44 Years | 7 (53.8%) | 0 (0.0%) |
| 45 to 54 Years | 0 (0.0%) | 5 (83.3%) |
| 55 to 64 Years | 10 (52.6%) | 0 (0.0%) |
| 65 to 74 Years | 4 (66.7%) | 0 (0.0%) |
| 75 Years and over | 0 (0.0%) | 0 (0.0%) |
| Total | 26 (54.2%) | 10 (35.7%) |
Income Above Poverty by Sex and Age in Tamarack
According to the poverty statistics in Tamarack, males aged 45 to 54 years and females aged 15 years are the age groups that are most secure financially, with 100.0% of males and 100.0% of females in these age groups living above the poverty line.
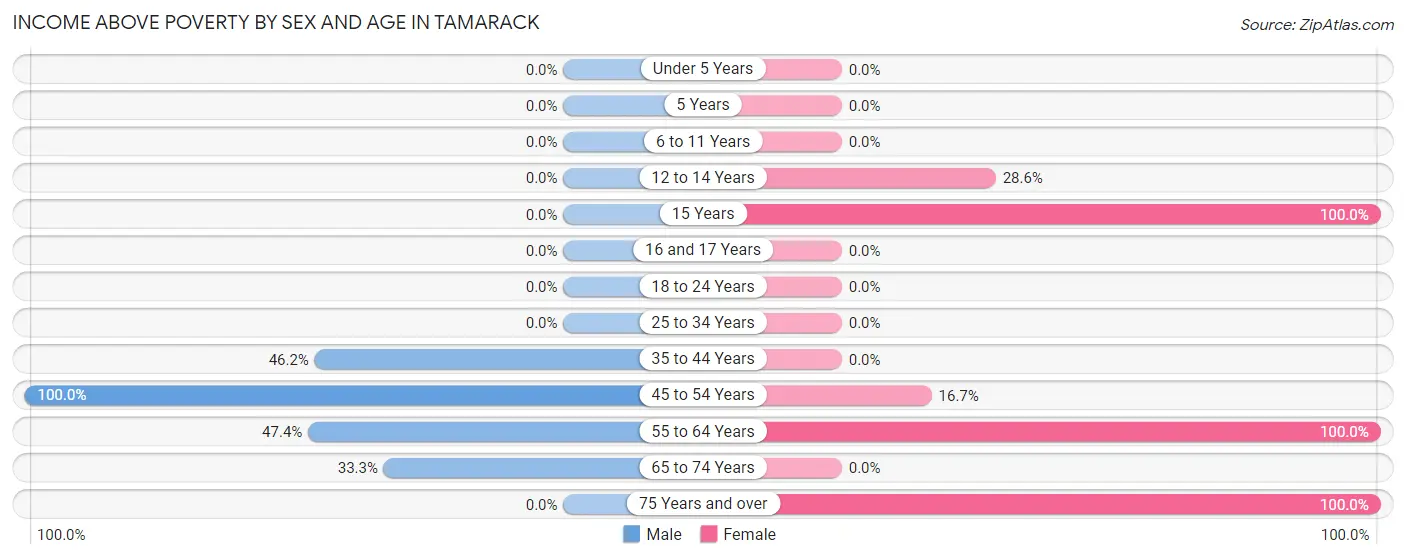
| Age Bracket | Male | Female |
| Under 5 Years | 0 (0.0%) | 0 (0.0%) |
| 5 Years | 0 (0.0%) | 0 (0.0%) |
| 6 to 11 Years | 0 (0.0%) | 0 (0.0%) |
| 12 to 14 Years | 0 (0.0%) | 2 (28.6%) |
| 15 Years | 0 (0.0%) | 1 (100.0%) |
| 16 and 17 Years | 0 (0.0%) | 0 (0.0%) |
| 18 to 24 Years | 0 (0.0%) | 0 (0.0%) |
| 25 to 34 Years | 0 (0.0%) | 0 (0.0%) |
| 35 to 44 Years | 6 (46.2%) | 0 (0.0%) |
| 45 to 54 Years | 5 (100.0%) | 1 (16.7%) |
| 55 to 64 Years | 9 (47.4%) | 13 (100.0%) |
| 65 to 74 Years | 2 (33.3%) | 0 (0.0%) |
| 75 Years and over | 0 (0.0%) | 1 (100.0%) |
| Total | 22 (45.8%) | 18 (64.3%) |
Income Below Poverty Among Married-Couple Families in Tamarack
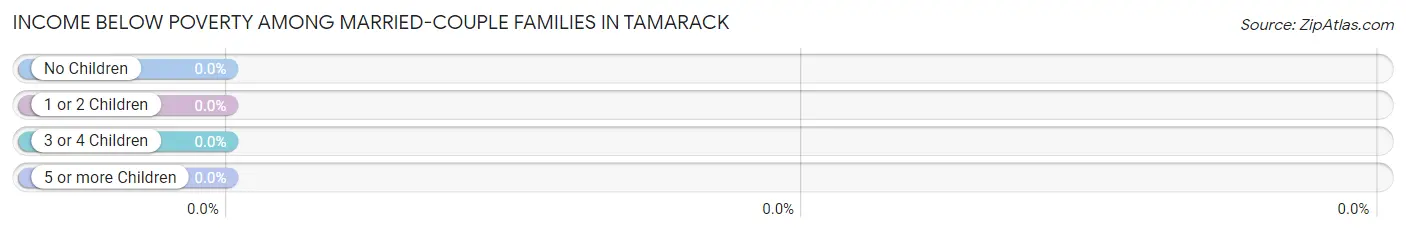
| Children | Above Poverty | Below Poverty |
| No Children | 8 (100.0%) | 0 (0.0%) |
| 1 or 2 Children | 0 (0.0%) | 0 (0.0%) |
| 3 or 4 Children | 0 (0.0%) | 0 (0.0%) |
| 5 or more Children | 0 (0.0%) | 0 (0.0%) |
| Total | 8 (100.0%) | 0 (0.0%) |
Income Below Poverty Among Single-Parent Households in Tamarack
According to the poverty data in Tamarack, 100.0% or 4 single-father households and 71.4% or 5 single-mother households are living below the poverty line. Among single-father households, those with no children have the highest poverty rate, with 4 households (100.0%) experiencing poverty. Likewise, among single-mother households, those with 1 or 2 children have the highest poverty rate, with 5 households (71.4%) falling below the poverty line.
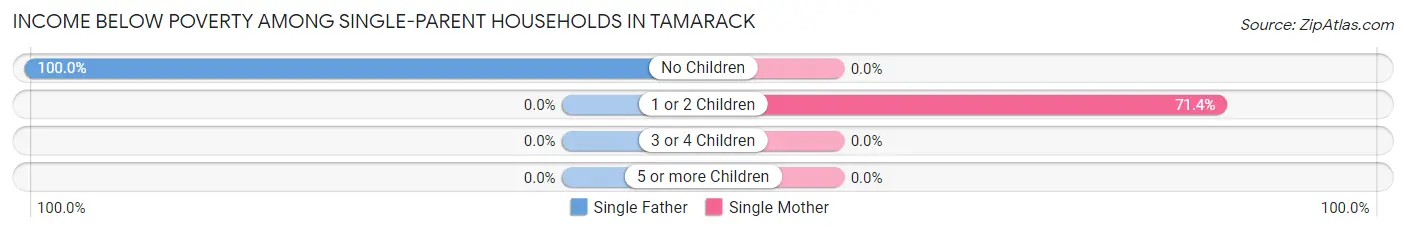
| Children | Single Father | Single Mother |
| No Children | 4 (100.0%) | 0 (0.0%) |
| 1 or 2 Children | 0 (0.0%) | 5 (71.4%) |
| 3 or 4 Children | 0 (0.0%) | 0 (0.0%) |
| 5 or more Children | 0 (0.0%) | 0 (0.0%) |
| Total | 4 (100.0%) | 5 (71.4%) |
Income Below Poverty Among Married-Couple vs Single-Parent Households in Tamarack
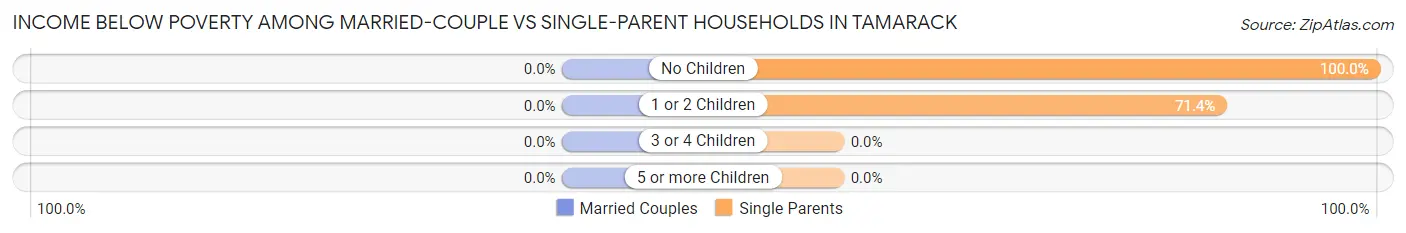
| Children | Married-Couple Families | Single-Parent Households |
| No Children | 0 (0.0%) | 4 (100.0%) |
| 1 or 2 Children | 0 (0.0%) | 5 (71.4%) |
| 3 or 4 Children | 0 (0.0%) | 0 (0.0%) |
| 5 or more Children | 0 (0.0%) | 0 (0.0%) |
| Total | 0 (0.0%) | 9 (81.8%) |
Race in Tamarack
The most populous races in Tamarack are White / Caucasian (65 | 85.5%), and Black / African American (11 | 14.5%).
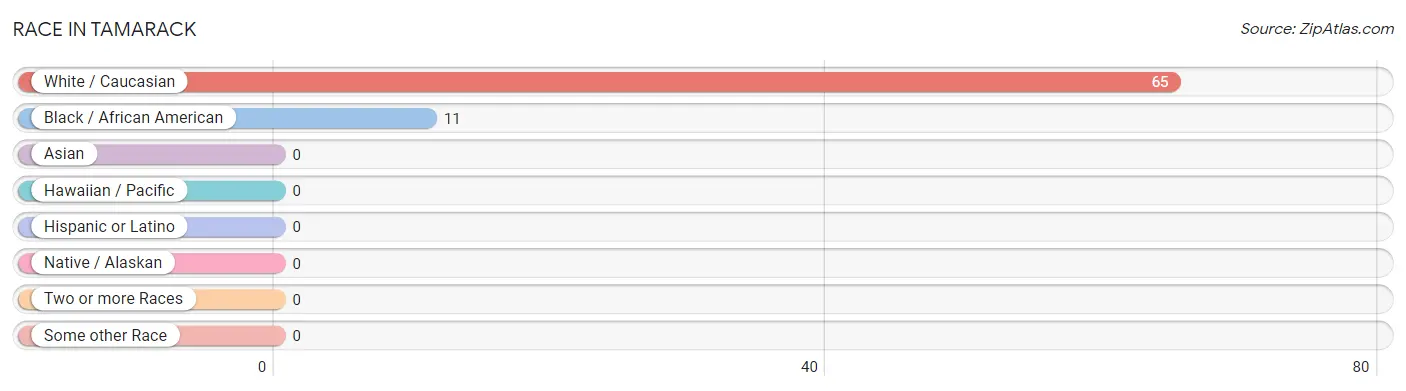
| Race | # Population | % Population |
| Asian | 0 | 0.0% |
| Black / African American | 11 | 14.5% |
| Hawaiian / Pacific | 0 | 0.0% |
| Hispanic or Latino | 0 | 0.0% |
| Native / Alaskan | 0 | 0.0% |
| White / Caucasian | 65 | 85.5% |
| Two or more Races | 0 | 0.0% |
| Some other Race | 0 | 0.0% |
| Total | 76 | 100.0% |
Ancestry in Tamarack
The most populous ancestries reported in Tamarack are American (26 | 34.2%), German (16 | 21.0%), Finnish (12 | 15.8%), Danish (9 | 11.8%), and Irish (5 | 6.6%), together accounting for 89.5% of all Tamarack residents.
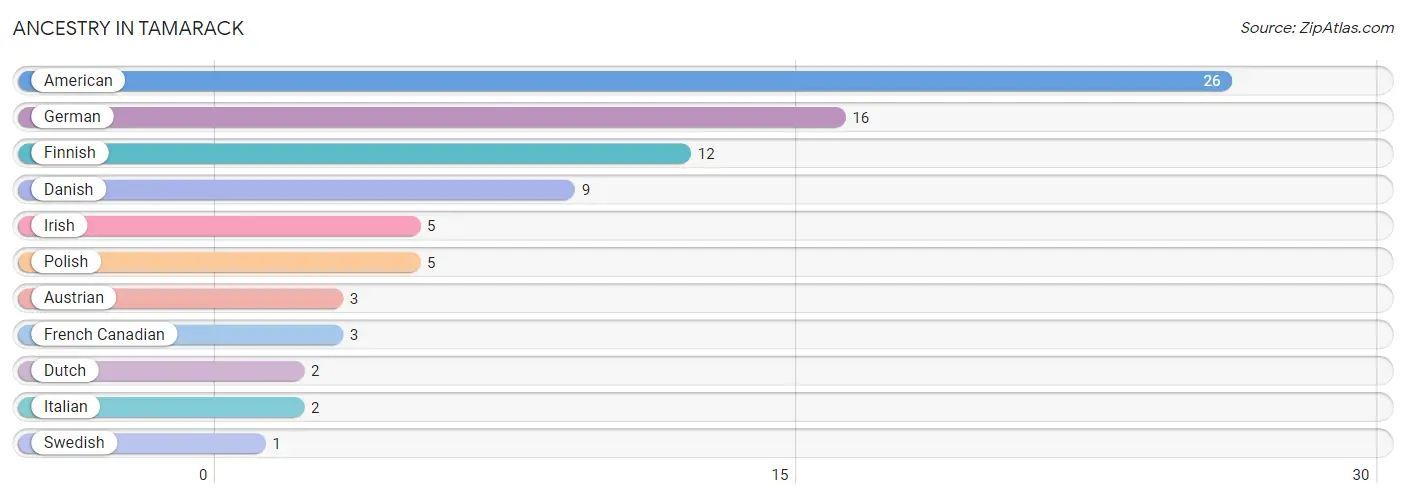
| Ancestry | # Population | % Population |
| American | 26 | 34.2% |
| Austrian | 3 | 4.0% |
| Danish | 9 | 11.8% |
| Dutch | 2 | 2.6% |
| Finnish | 12 | 15.8% |
| French Canadian | 3 | 4.0% |
| German | 16 | 21.0% |
| Irish | 5 | 6.6% |
| Italian | 2 | 2.6% |
| Polish | 5 | 6.6% |
| Swedish | 1 | 1.3% | View All 11 Rows |
Immigrants in Tamarack

| Immigration Origin | # Population | % Population | View All 0 Rows |
Sex and Age in Tamarack
Sex and Age in Tamarack
The most populous age groups in Tamarack are 60 to 64 Years (16 | 33.3%) for men and 55 to 59 Years (8 | 28.6%) for women.
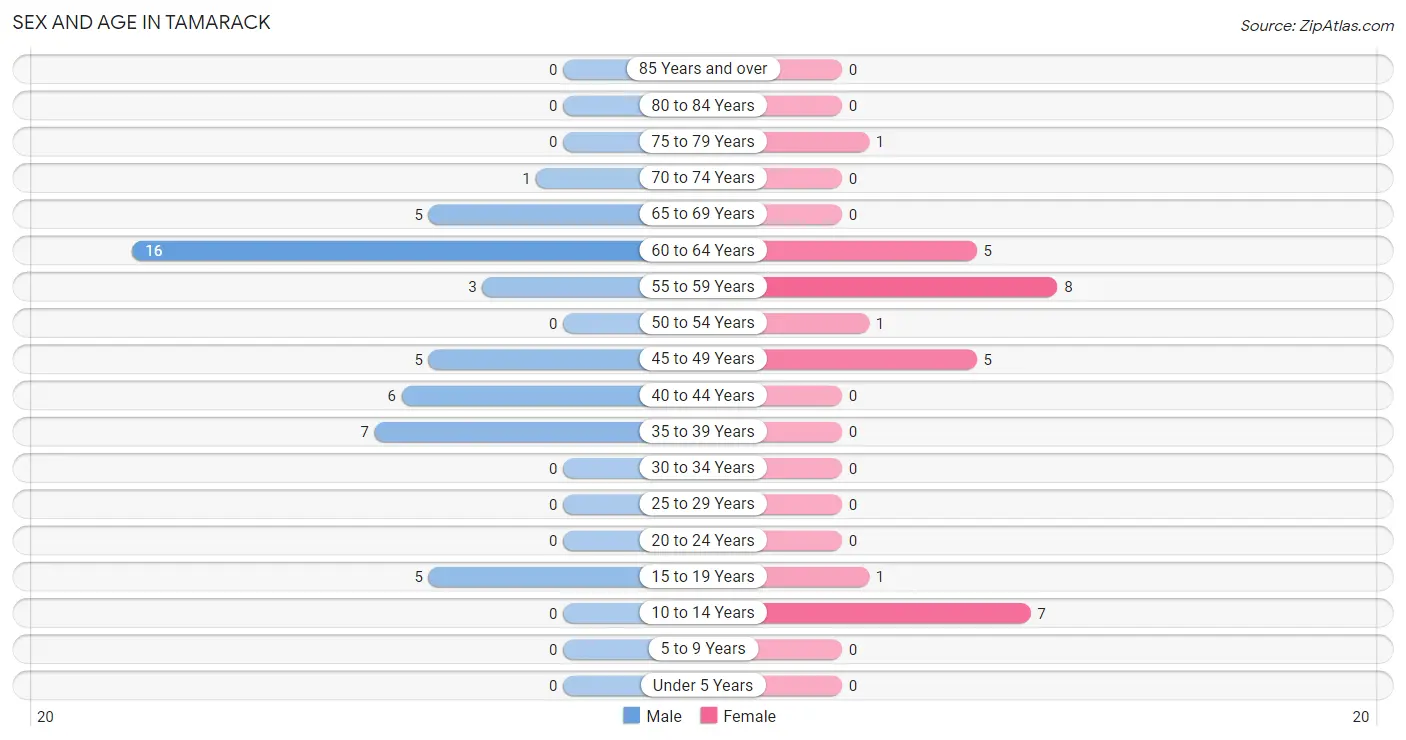
| Age Bracket | Male | Female |
| Under 5 Years | 0 (0.0%) | 0 (0.0%) |
| 5 to 9 Years | 0 (0.0%) | 0 (0.0%) |
| 10 to 14 Years | 0 (0.0%) | 7 (25.0%) |
| 15 to 19 Years | 5 (10.4%) | 1 (3.6%) |
| 20 to 24 Years | 0 (0.0%) | 0 (0.0%) |
| 25 to 29 Years | 0 (0.0%) | 0 (0.0%) |
| 30 to 34 Years | 0 (0.0%) | 0 (0.0%) |
| 35 to 39 Years | 7 (14.6%) | 0 (0.0%) |
| 40 to 44 Years | 6 (12.5%) | 0 (0.0%) |
| 45 to 49 Years | 5 (10.4%) | 5 (17.9%) |
| 50 to 54 Years | 0 (0.0%) | 1 (3.6%) |
| 55 to 59 Years | 3 (6.2%) | 8 (28.6%) |
| 60 to 64 Years | 16 (33.3%) | 5 (17.9%) |
| 65 to 69 Years | 5 (10.4%) | 0 (0.0%) |
| 70 to 74 Years | 1 (2.1%) | 0 (0.0%) |
| 75 to 79 Years | 0 (0.0%) | 1 (3.6%) |
| 80 to 84 Years | 0 (0.0%) | 0 (0.0%) |
| 85 Years and over | 0 (0.0%) | 0 (0.0%) |
| Total | 48 (100.0%) | 28 (100.0%) |
Families and Households in Tamarack
Median Family Size in Tamarack
The median family size in Tamarack is 2.47 persons per family, with single female/mother families (7 | 36.8%) accounting for the largest median family size of 2.86 persons per family. On the other hand, married-couple families (8 | 42.1%) represent the smallest median family size with 2.00 persons per family.
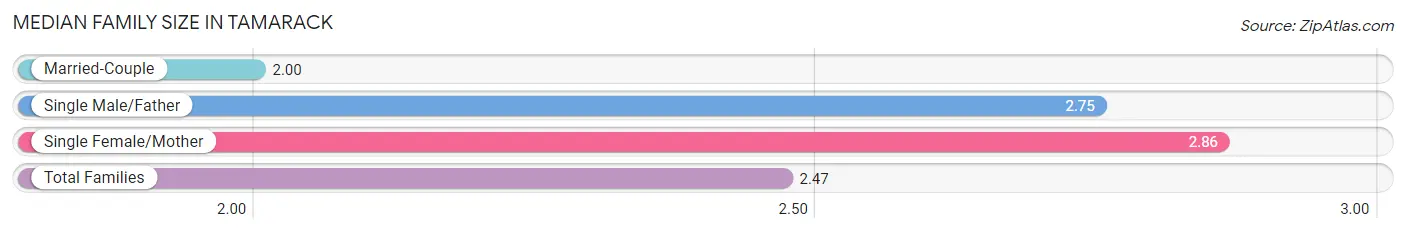
| Family Type | # Families | Family Size |
| Married-Couple | 8 (42.1%) | 2.00 |
| Single Male/Father | 4 (21.0%) | 2.75 |
| Single Female/Mother | 7 (36.8%) | 2.86 |
| Total Families | 19 (100.0%) | 2.47 |
Median Household Size in Tamarack
The median household size in Tamarack is 2.30 persons per household, with single female/mother households (7 | 21.2%) accounting for the largest median household size of 4.57 persons per household. non-family households (14 | 42.4%) represent the smallest median household size with 1.21 persons per household.
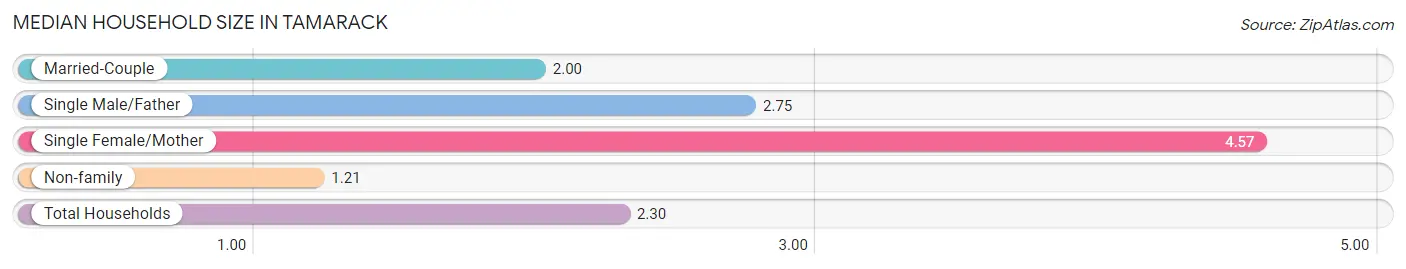
| Household Type | # Households | Household Size |
| Married-Couple | 8 (24.2%) | 2.00 |
| Single Male/Father | 4 (12.1%) | 2.75 |
| Single Female/Mother | 7 (21.2%) | 4.57 |
| Non-family | 14 (42.4%) | 1.21 |
| Total Households | 33 (100.0%) | 2.30 |
Household Size by Marriage Status in Tamarack
Out of a total of 33 households in Tamarack, 19 (57.6%) are family households, while 14 (42.4%) are nonfamily households. The most numerous type of family households are 2-person households, comprising 12, and the most common type of nonfamily households are 1-person households, comprising 11.
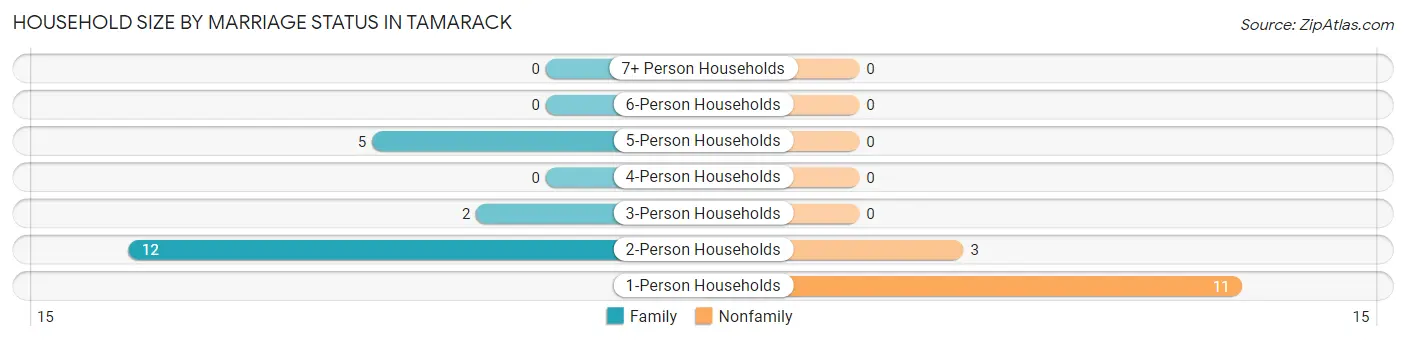
| Household Size | Family Households | Nonfamily Households |
| 1-Person Households | - | 11 (33.3%) |
| 2-Person Households | 12 (36.4%) | 3 (9.1%) |
| 3-Person Households | 2 (6.1%) | 0 (0.0%) |
| 4-Person Households | 0 (0.0%) | 0 (0.0%) |
| 5-Person Households | 5 (15.1%) | 0 (0.0%) |
| 6-Person Households | 0 (0.0%) | 0 (0.0%) |
| 7+ Person Households | 0 (0.0%) | 0 (0.0%) |
| Total | 19 (57.6%) | 14 (42.4%) |
Female Fertility in Tamarack
Fertility by Age in Tamarack
| Age Bracket | Women with Births | Births / 1,000 Women |
| 15 to 19 years | 0 (0.0%) | 0.0 |
| 20 to 34 years | 0 (0.0%) | 0.0 |
| 35 to 50 years | 0 (0.0%) | 0.0 |
| Total | 0 (0.0%) | 0.0 |
Fertility by Age by Marriage Status in Tamarack
| Age Bracket | Married | Unmarried |
| 15 to 19 years | 0 (0.0%) | 0 (0.0%) |
| 20 to 34 years | 0 (0.0%) | 0 (0.0%) |
| 35 to 50 years | 0 (0.0%) | 0 (0.0%) |
| Total | 0 (0.0%) | 0 (0.0%) |
Fertility by Education in Tamarack
| Educational Attainment | Women with Births | Births / 1,000 Women |
| Less than High School | 0 (0.0%) | 0.0 |
| High School Diploma | 0 (0.0%) | 0.0 |
| College or Associate's Degree | 0 (0.0%) | 0.0 |
| Bachelor's Degree | 0 (0.0%) | 0.0 |
| Graduate Degree | 0 (0.0%) | 0.0 |
| Total | 0 (0.0%) | 0.0 |
Fertility by Education by Marriage Status in Tamarack
| Educational Attainment | Married | Unmarried |
| Less than High School | 0 (0.0%) | 0 (0.0%) |
| High School Diploma | 0 (0.0%) | 0 (0.0%) |
| College or Associate's Degree | 0 (0.0%) | 0 (0.0%) |
| Bachelor's Degree | 0 (0.0%) | 0 (0.0%) |
| Graduate Degree | 0 (0.0%) | 0 (0.0%) |
| Total | 0 (0.0%) | 0 (0.0%) |
Employment Characteristics in Tamarack
Employment by Class of Employer in Tamarack
Among the 31 employed individuals in Tamarack, private company employees (26 | 83.9%), local government employees (3 | 9.7%), and not-for-profit organizations (2 | 6.5%) make up the most common classes of employment.
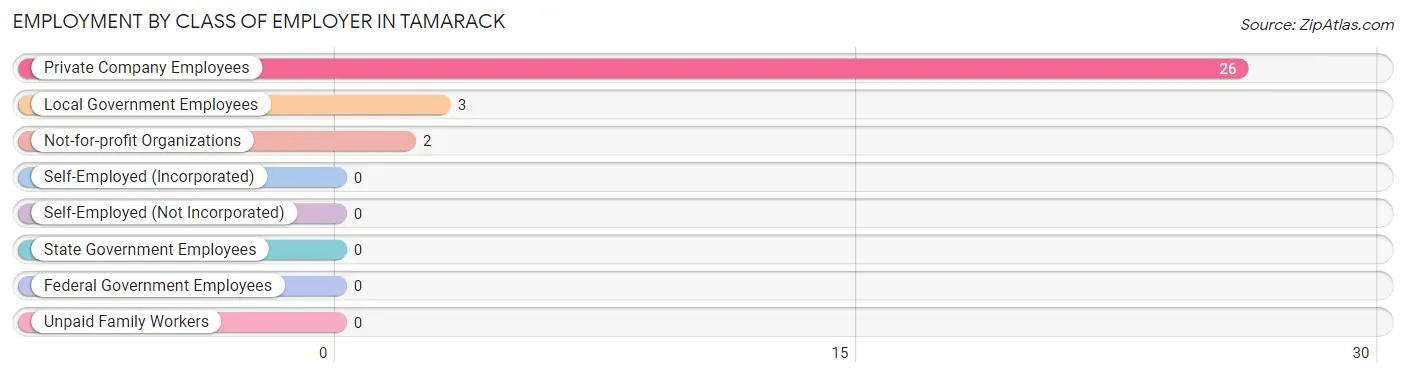
| Employer Class | # Employees | % Employees |
| Private Company Employees | 26 | 83.9% |
| Self-Employed (Incorporated) | 0 | 0.0% |
| Self-Employed (Not Incorporated) | 0 | 0.0% |
| Not-for-profit Organizations | 2 | 6.5% |
| Local Government Employees | 3 | 9.7% |
| State Government Employees | 0 | 0.0% |
| Federal Government Employees | 0 | 0.0% |
| Unpaid Family Workers | 0 | 0.0% |
| Total | 31 | 100.0% |
Employment Status by Age in Tamarack
According to the labor force statistics for Tamarack, out of the total population over 16 years of age (68), 54.4% or 37 individuals are in the labor force, with 5.4% or 2 of them unemployed. The age group with the highest labor force participation rate is 16 to 19 years, with 100.0% or 5 individuals in the labor force. Within the labor force, the 60 to 64 years age range has the highest percentage of unemployed individuals, with 18.2% or 2 of them being unemployed.
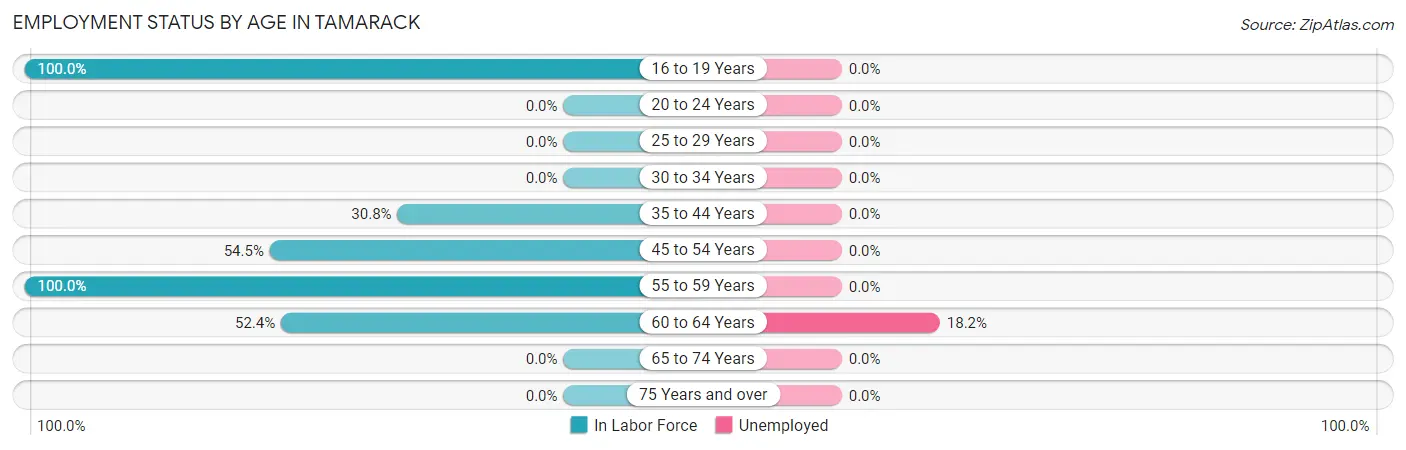
| Age Bracket | In Labor Force | Unemployed |
| 16 to 19 Years | 5 (100.0%) | 0 (0.0%) |
| 20 to 24 Years | 0 (0.0%) | 0 (0.0%) |
| 25 to 29 Years | 0 (0.0%) | 0 (0.0%) |
| 30 to 34 Years | 0 (0.0%) | 0 (0.0%) |
| 35 to 44 Years | 4 (30.8%) | 0 (0.0%) |
| 45 to 54 Years | 6 (54.5%) | 0 (0.0%) |
| 55 to 59 Years | 11 (100.0%) | 0 (0.0%) |
| 60 to 64 Years | 11 (52.4%) | 2 (18.2%) |
| 65 to 74 Years | 0 (0.0%) | 0 (0.0%) |
| 75 Years and over | 0 (0.0%) | 0 (0.0%) |
| Total | 37 (54.4%) | 2 (5.4%) |
Employment Status by Educational Attainment in Tamarack
According to labor force statistics for Tamarack, 57.1% of individuals (32) out of the total population between 25 and 64 years of age (56) are in the labor force, with 6.3% or 2 of them being unemployed. The group with the highest labor force participation rate are those with the educational attainment of bachelor's degree or higher, with 100.0% or 1 individuals in the labor force. Within the labor force, individuals with college / associate degree education have the highest percentage of unemployment, with 10.0% or 2 of them being unemployed.
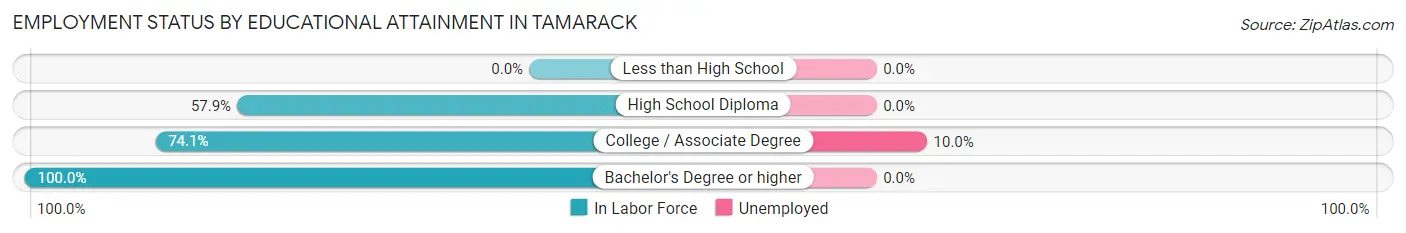
| Educational Attainment | In Labor Force | Unemployed |
| Less than High School | 0 (0.0%) | 0 (0.0%) |
| High School Diploma | 11 (57.9%) | 0 (0.0%) |
| College / Associate Degree | 20 (74.1%) | 3 (10.0%) |
| Bachelor's Degree or higher | 1 (100.0%) | 0 (0.0%) |
| Total | 32 (57.1%) | 4 (6.3%) |
Employment Occupations by Sex in Tamarack
Management, Business, Science and Arts Occupations
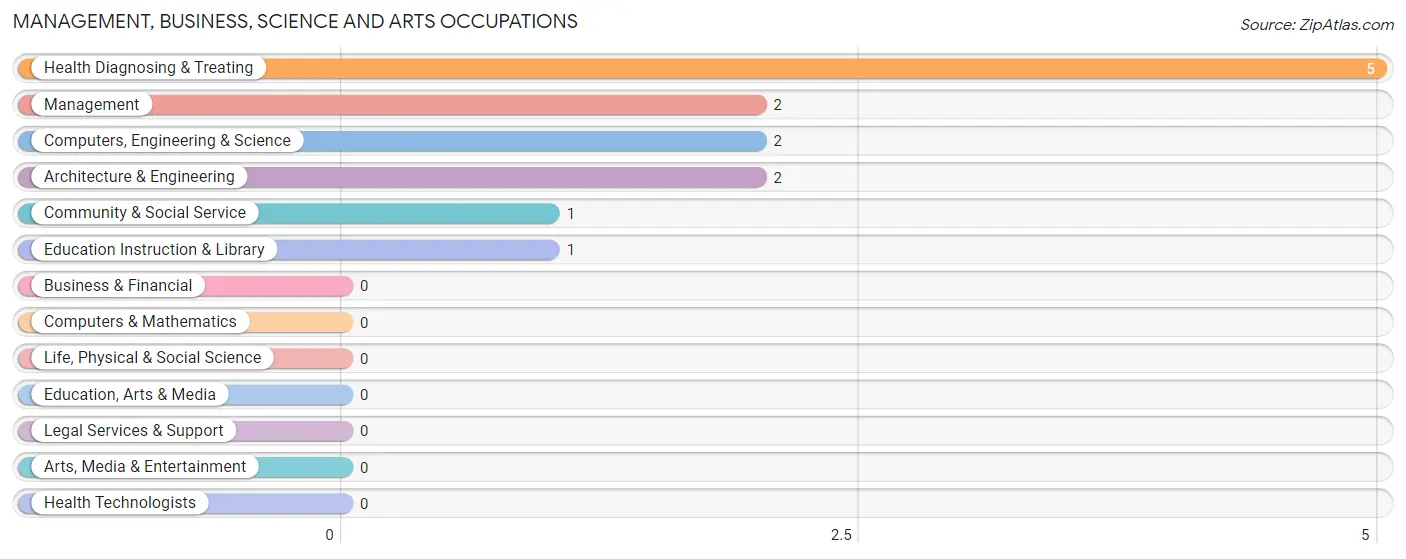
The most common Management, Business, Science and Arts occupations in Tamarack are Health Diagnosing & Treating (5 | 14.3%), Management (2 | 5.7%), Computers, Engineering & Science (2 | 5.7%), Architecture & Engineering (2 | 5.7%), and Community & Social Service (1 | 2.9%).
Management, Business, Science and Arts Occupations by Sex
Within the Management, Business, Science and Arts occupations in Tamarack, the most male-oriented occupations are Management (100.0%), Computers, Engineering & Science (100.0%), and Architecture & Engineering (100.0%), while the most female-oriented occupations are Community & Social Service (100.0%), Education Instruction & Library (100.0%), and Health Diagnosing & Treating (40.0%).
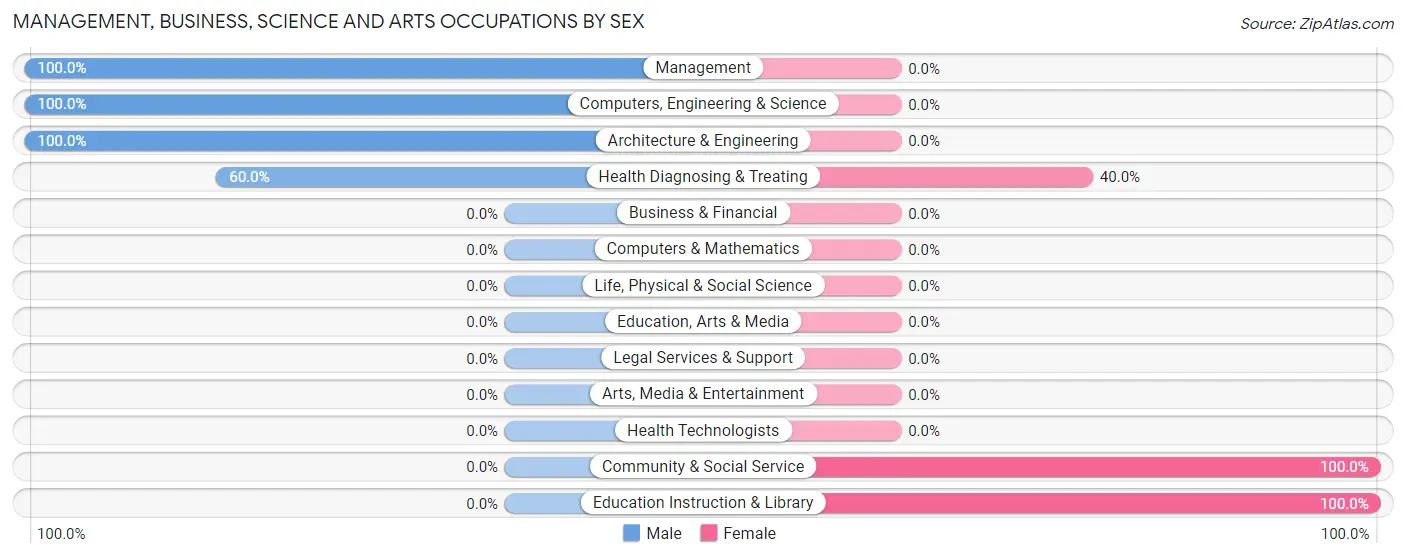
| Occupation | Male | Female |
| Management | 2 (100.0%) | 0 (0.0%) |
| Business & Financial | 0 (0.0%) | 0 (0.0%) |
| Computers, Engineering & Science | 2 (100.0%) | 0 (0.0%) |
| Computers & Mathematics | 0 (0.0%) | 0 (0.0%) |
| Architecture & Engineering | 2 (100.0%) | 0 (0.0%) |
| Life, Physical & Social Science | 0 (0.0%) | 0 (0.0%) |
| Community & Social Service | 0 (0.0%) | 1 (100.0%) |
| Education, Arts & Media | 0 (0.0%) | 0 (0.0%) |
| Legal Services & Support | 0 (0.0%) | 0 (0.0%) |
| Education Instruction & Library | 0 (0.0%) | 1 (100.0%) |
| Arts, Media & Entertainment | 0 (0.0%) | 0 (0.0%) |
| Health Diagnosing & Treating | 3 (60.0%) | 2 (40.0%) |
| Health Technologists | 0 (0.0%) | 0 (0.0%) |
| Total (Category) | 7 (70.0%) | 3 (30.0%) |
| Total (Overall) | 21 (60.0%) | 14 (40.0%) |
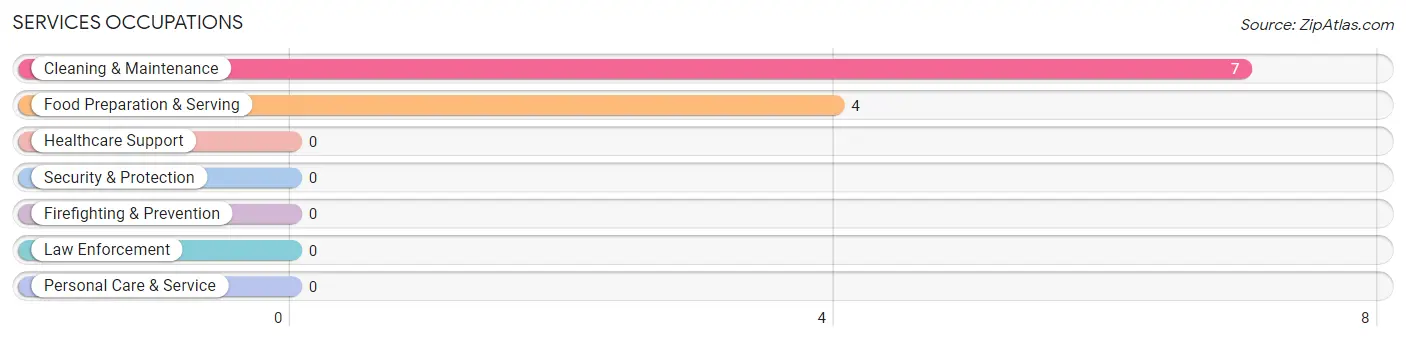
Services Occupations
The most common Services occupations in Tamarack are Cleaning & Maintenance (7 | 20.0%), and Food Preparation & Serving (4 | 11.4%).
Services Occupations by Sex
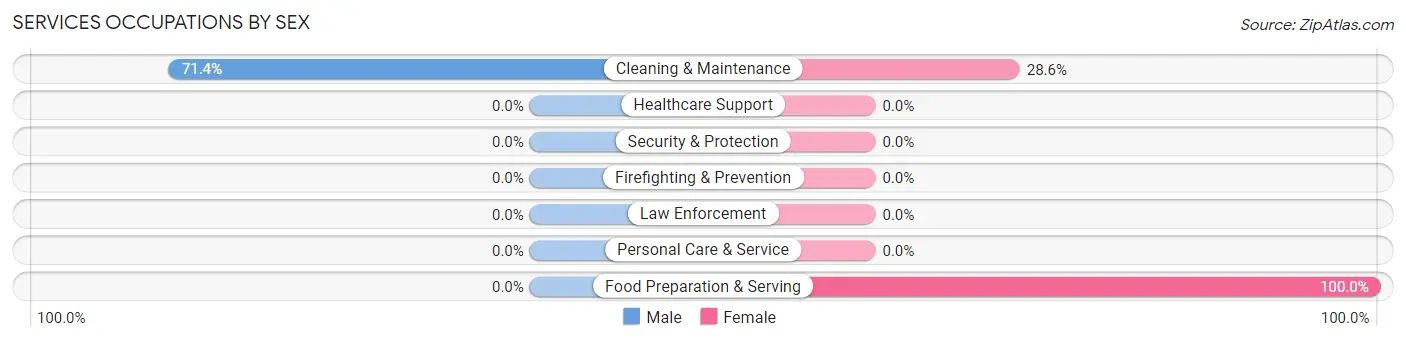
| Occupation | Male | Female |
| Healthcare Support | 0 (0.0%) | 0 (0.0%) |
| Security & Protection | 0 (0.0%) | 0 (0.0%) |
| Firefighting & Prevention | 0 (0.0%) | 0 (0.0%) |
| Law Enforcement | 0 (0.0%) | 0 (0.0%) |
| Food Preparation & Serving | 0 (0.0%) | 4 (100.0%) |
| Cleaning & Maintenance | 5 (71.4%) | 2 (28.6%) |
| Personal Care & Service | 0 (0.0%) | 0 (0.0%) |
| Total (Category) | 5 (45.5%) | 6 (54.5%) |
| Total (Overall) | 21 (60.0%) | 14 (40.0%) |
Sales and Office Occupations
The most common Sales and Office occupations in Tamarack are , and Office & Administration (2 | 5.7%).
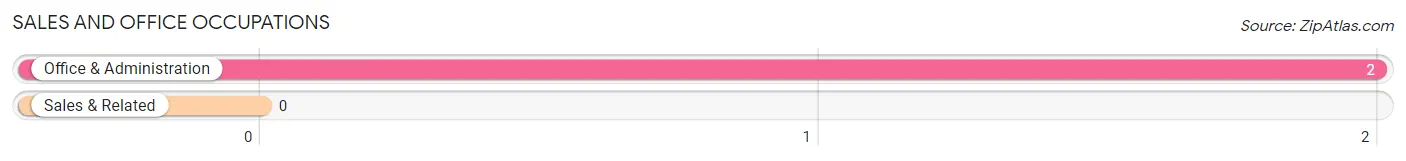
Sales and Office Occupations by Sex
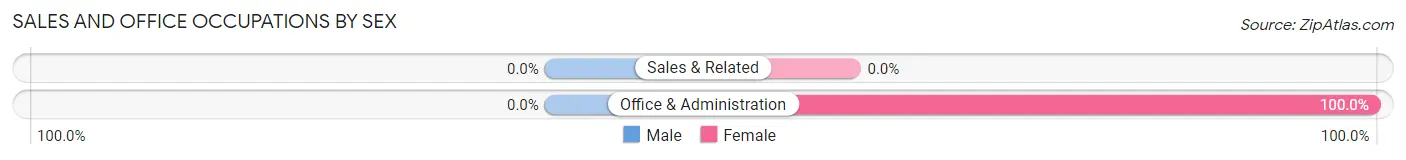
| Occupation | Male | Female |
| Sales & Related | 0 (0.0%) | 0 (0.0%) |
| Office & Administration | 0 (0.0%) | 2 (100.0%) |
| Total (Category) | 0 (0.0%) | 2 (100.0%) |
| Total (Overall) | 21 (60.0%) | 14 (40.0%) |
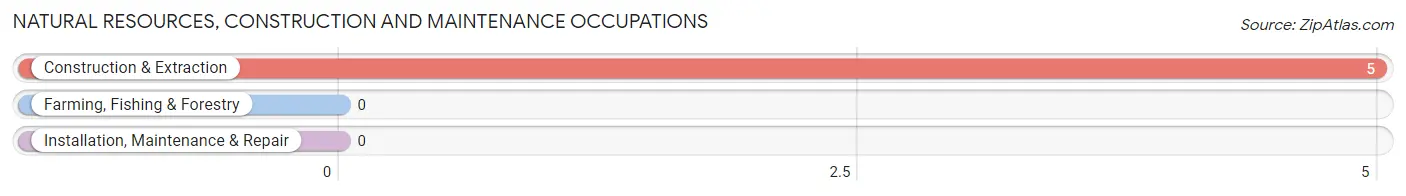
Natural Resources, Construction and Maintenance Occupations
The most common Natural Resources, Construction and Maintenance occupations in Tamarack are , and Construction & Extraction (5 | 14.3%).
Natural Resources, Construction and Maintenance Occupations by Sex
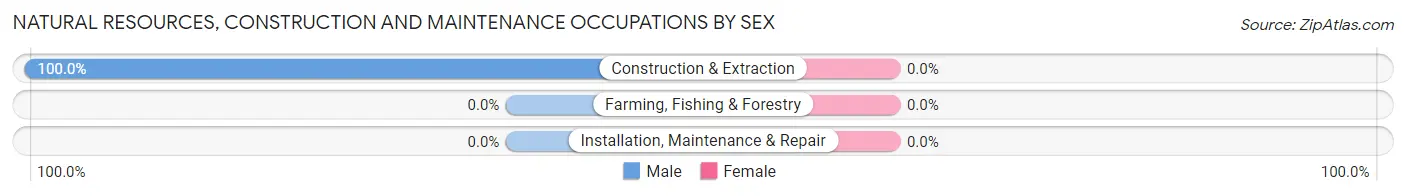
| Occupation | Male | Female |
| Farming, Fishing & Forestry | 0 (0.0%) | 0 (0.0%) |
| Construction & Extraction | 5 (100.0%) | 0 (0.0%) |
| Installation, Maintenance & Repair | 0 (0.0%) | 0 (0.0%) |
| Total (Category) | 5 (100.0%) | 0 (0.0%) |
| Total (Overall) | 21 (60.0%) | 14 (40.0%) |
Production, Transportation and Moving Occupations
The most common Production, Transportation and Moving occupations in Tamarack are , and Production (7 | 20.0%).
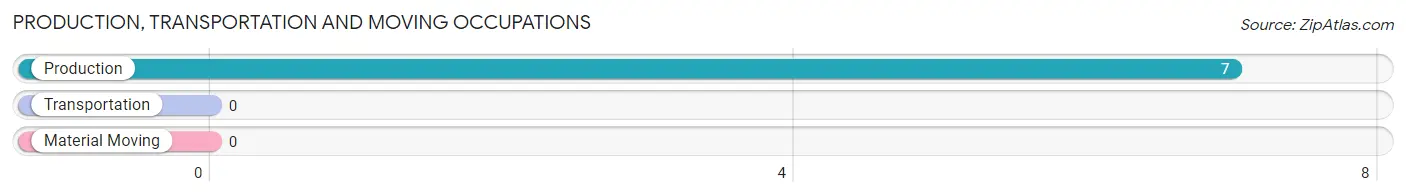
Production, Transportation and Moving Occupations by Sex
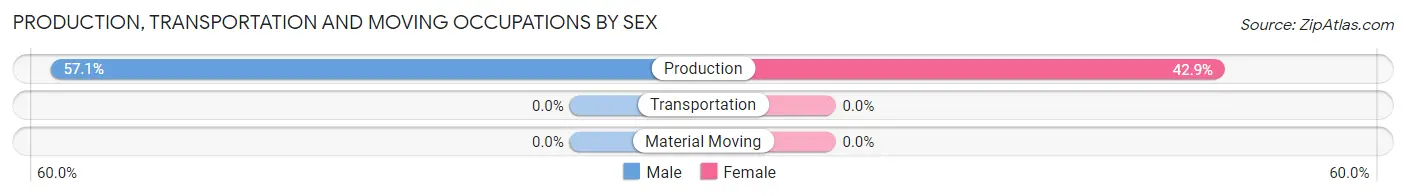
| Occupation | Male | Female |
| Production | 4 (57.1%) | 3 (42.9%) |
| Transportation | 0 (0.0%) | 0 (0.0%) |
| Material Moving | 0 (0.0%) | 0 (0.0%) |
| Total (Category) | 4 (57.1%) | 3 (42.9%) |
| Total (Overall) | 21 (60.0%) | 14 (40.0%) |
Employment Industries by Sex in Tamarack
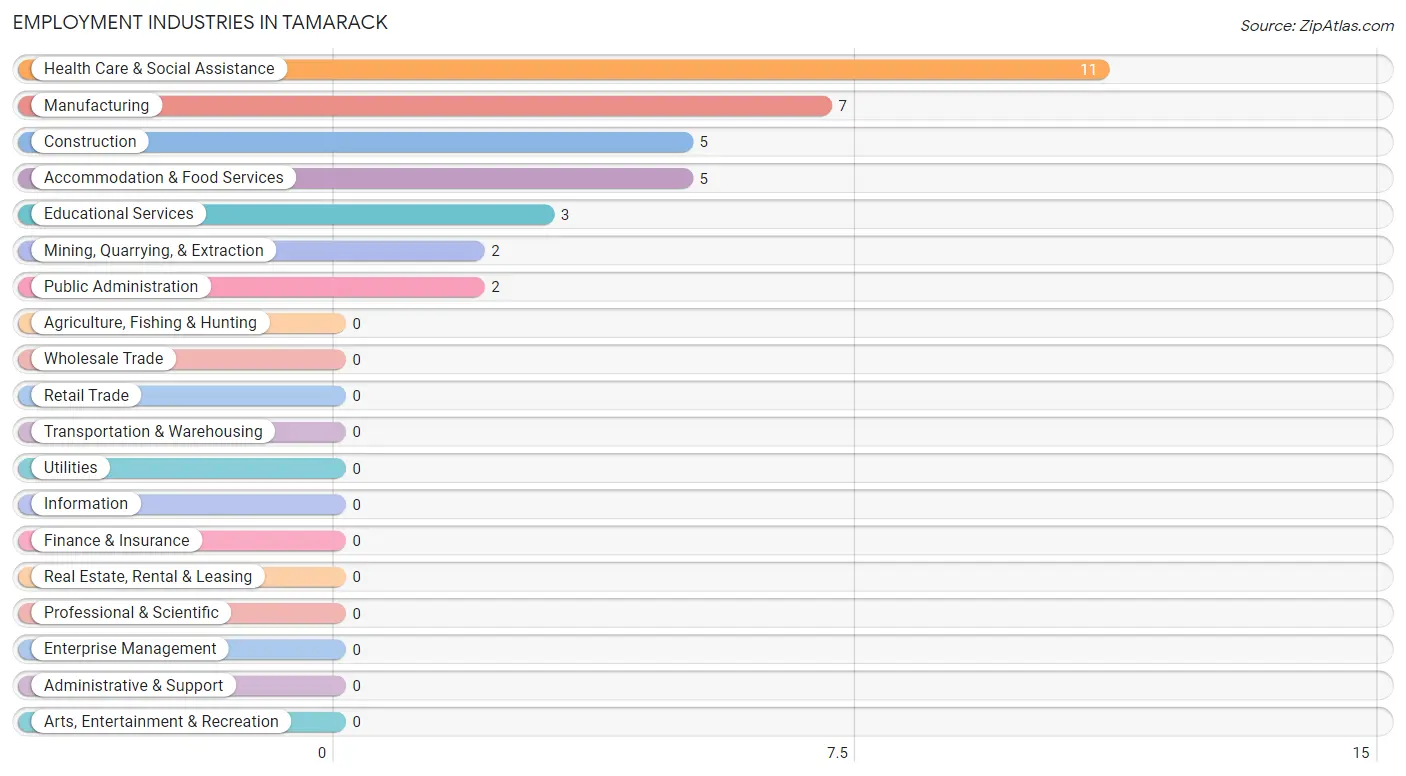
Employment Industries in Tamarack
The major employment industries in Tamarack include Health Care & Social Assistance (11 | 31.4%), Manufacturing (7 | 20.0%), Construction (5 | 14.3%), Accommodation & Food Services (5 | 14.3%), and Educational Services (3 | 8.6%).
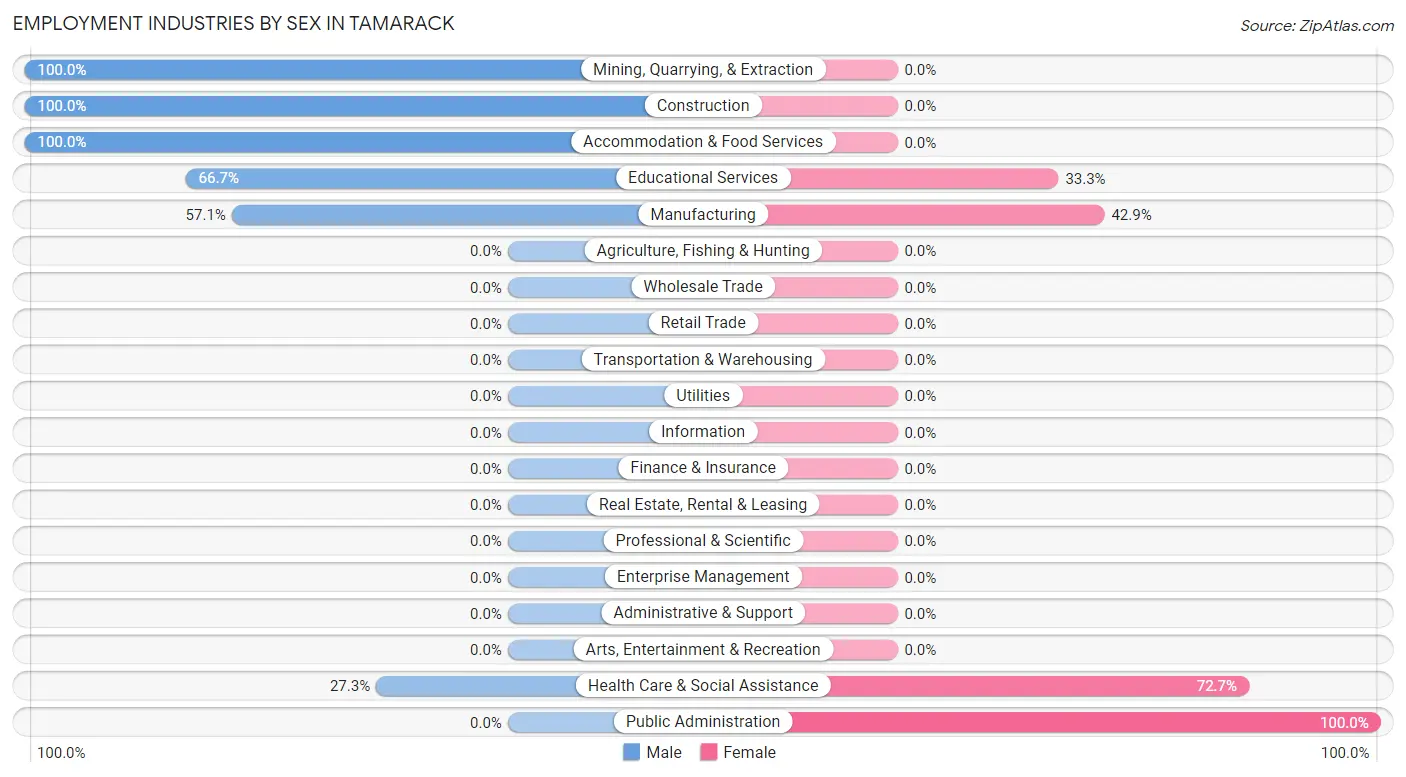
Employment Industries by Sex in Tamarack
The Tamarack industries that see more men than women are Mining, Quarrying, & Extraction (100.0%), Construction (100.0%), and Accommodation & Food Services (100.0%), whereas the industries that tend to have a higher number of women are Public Administration (100.0%), Health Care & Social Assistance (72.7%), and Manufacturing (42.9%).
| Industry | Male | Female |
| Agriculture, Fishing & Hunting | 0 (0.0%) | 0 (0.0%) |
| Mining, Quarrying, & Extraction | 2 (100.0%) | 0 (0.0%) |
| Construction | 5 (100.0%) | 0 (0.0%) |
| Manufacturing | 4 (57.1%) | 3 (42.9%) |
| Wholesale Trade | 0 (0.0%) | 0 (0.0%) |
| Retail Trade | 0 (0.0%) | 0 (0.0%) |
| Transportation & Warehousing | 0 (0.0%) | 0 (0.0%) |
| Utilities | 0 (0.0%) | 0 (0.0%) |
| Information | 0 (0.0%) | 0 (0.0%) |
| Finance & Insurance | 0 (0.0%) | 0 (0.0%) |
| Real Estate, Rental & Leasing | 0 (0.0%) | 0 (0.0%) |
| Professional & Scientific | 0 (0.0%) | 0 (0.0%) |
| Enterprise Management | 0 (0.0%) | 0 (0.0%) |
| Administrative & Support | 0 (0.0%) | 0 (0.0%) |
| Educational Services | 2 (66.7%) | 1 (33.3%) |
| Health Care & Social Assistance | 3 (27.3%) | 8 (72.7%) |
| Arts, Entertainment & Recreation | 0 (0.0%) | 0 (0.0%) |
| Accommodation & Food Services | 5 (100.0%) | 0 (0.0%) |
| Public Administration | 0 (0.0%) | 2 (100.0%) |
| Total | 21 (60.0%) | 14 (40.0%) |
Education in Tamarack
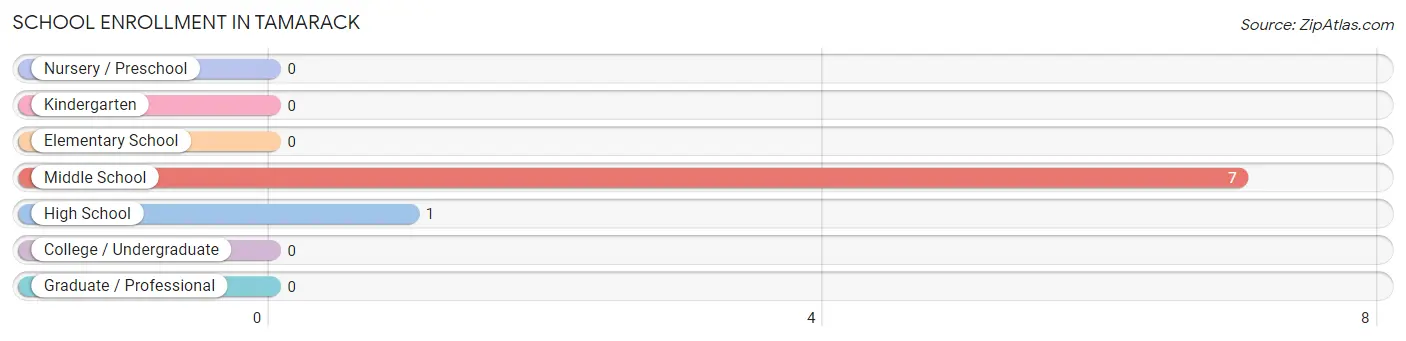
School Enrollment in Tamarack
The most common levels of schooling among the 8 students in Tamarack are middle school (7 | 87.5%), and high school (1 | 12.5%).
| School Level | # Students | % Students |
| Nursery / Preschool | 0 | 0.0% |
| Kindergarten | 0 | 0.0% |
| Elementary School | 0 | 0.0% |
| Middle School | 7 | 87.5% |
| High School | 1 | 12.5% |
| College / Undergraduate | 0 | 0.0% |
| Graduate / Professional | 0 | 0.0% |
| Total | 8 | 100.0% |
School Enrollment by Age by Funding Source in Tamarack
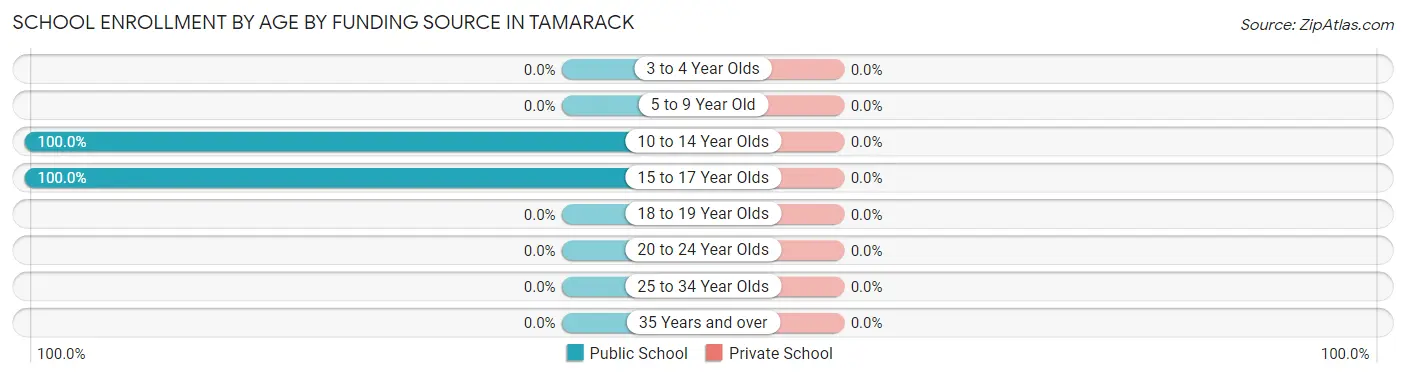
| Age Bracket | Public School | Private School |
| 3 to 4 Year Olds | 0 (0.0%) | 0 (0.0%) |
| 5 to 9 Year Old | 0 (0.0%) | 0 (0.0%) |
| 10 to 14 Year Olds | 7 (100.0%) | 0 (0.0%) |
| 15 to 17 Year Olds | 1 (100.0%) | 0 (0.0%) |
| 18 to 19 Year Olds | 0 (0.0%) | 0 (0.0%) |
| 20 to 24 Year Olds | 0 (0.0%) | 0 (0.0%) |
| 25 to 34 Year Olds | 0 (0.0%) | 0 (0.0%) |
| 35 Years and over | 0 (0.0%) | 0 (0.0%) |
| Total | 8 (100.0%) | 0 (0.0%) |
Educational Attainment by Field of Study in Tamarack
Social sciences (4 | 44.4%), liberal arts & history (4 | 44.4%), and science & technology (1 | 11.1%) are the most common fields of study among 9 individuals in Tamarack who have obtained a bachelor's degree or higher.
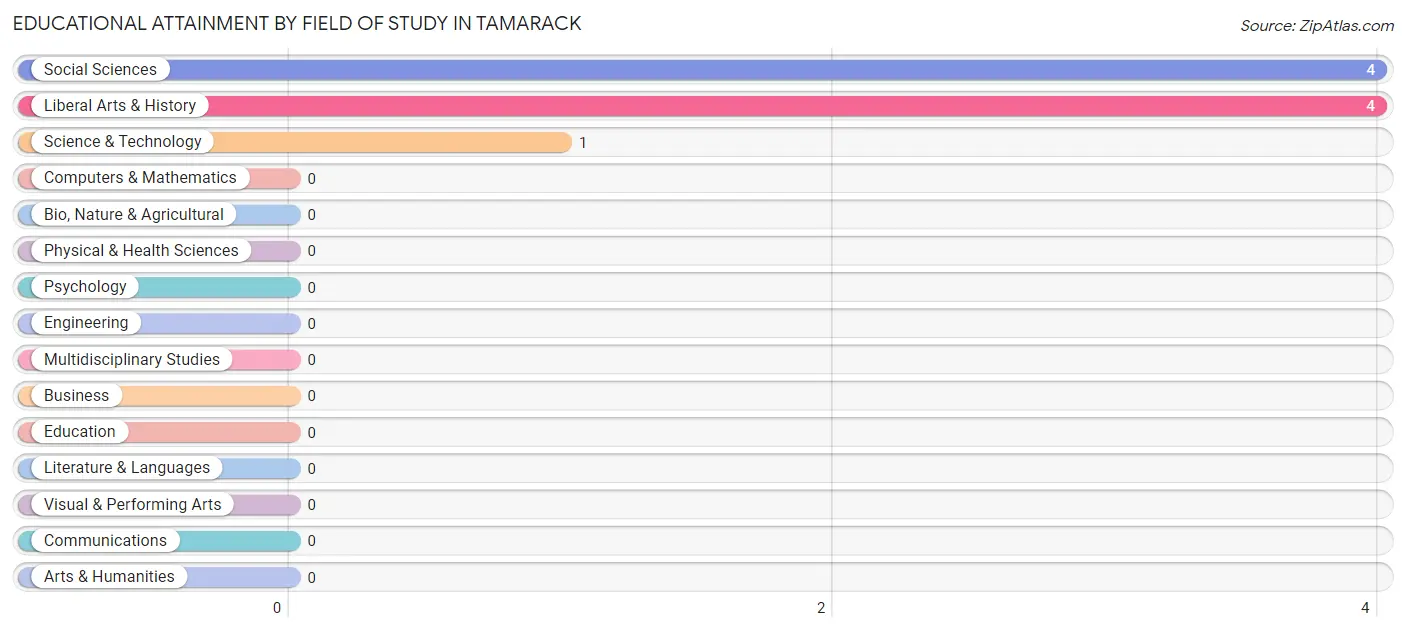
| Field of Study | # Graduates | % Graduates |
| Computers & Mathematics | 0 | 0.0% |
| Bio, Nature & Agricultural | 0 | 0.0% |
| Physical & Health Sciences | 0 | 0.0% |
| Psychology | 0 | 0.0% |
| Social Sciences | 4 | 44.4% |
| Engineering | 0 | 0.0% |
| Multidisciplinary Studies | 0 | 0.0% |
| Science & Technology | 1 | 11.1% |
| Business | 0 | 0.0% |
| Education | 0 | 0.0% |
| Literature & Languages | 0 | 0.0% |
| Liberal Arts & History | 4 | 44.4% |
| Visual & Performing Arts | 0 | 0.0% |
| Communications | 0 | 0.0% |
| Arts & Humanities | 0 | 0.0% |
| Total | 9 | 100.0% |
Transportation & Commute in Tamarack
Vehicle Availability by Sex in Tamarack
The most prevalent vehicle ownership categories in Tamarack are males with 3 vehicles (12, accounting for 57.1%) and females with 3 vehicles (1, making up 120.0%).
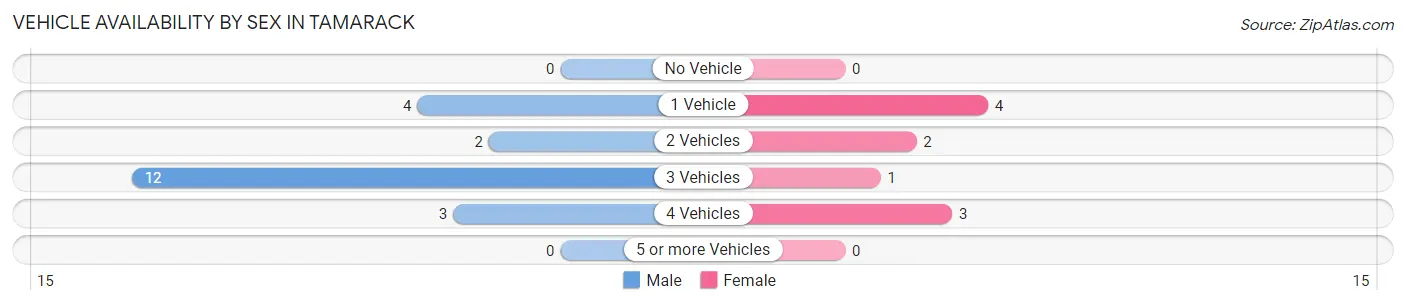
| Vehicles Available | Male | Female |
| No Vehicle | 0 (0.0%) | 0 (0.0%) |
| 1 Vehicle | 4 (19.1%) | 4 (40.0%) |
| 2 Vehicles | 2 (9.5%) | 2 (20.0%) |
| 3 Vehicles | 12 (57.1%) | 1 (10.0%) |
| 4 Vehicles | 3 (14.3%) | 3 (30.0%) |
| 5 or more Vehicles | 0 (0.0%) | 0 (0.0%) |
| Total | 21 (100.0%) | 10 (100.0%) |
Commute Time in Tamarack
The most frequently occuring commute durations in Tamarack are 15 to 19 minutes (14 commuters, 45.2%), 20 to 24 minutes (5 commuters, 16.1%), and 45 to 59 minutes (3 commuters, 9.7%).
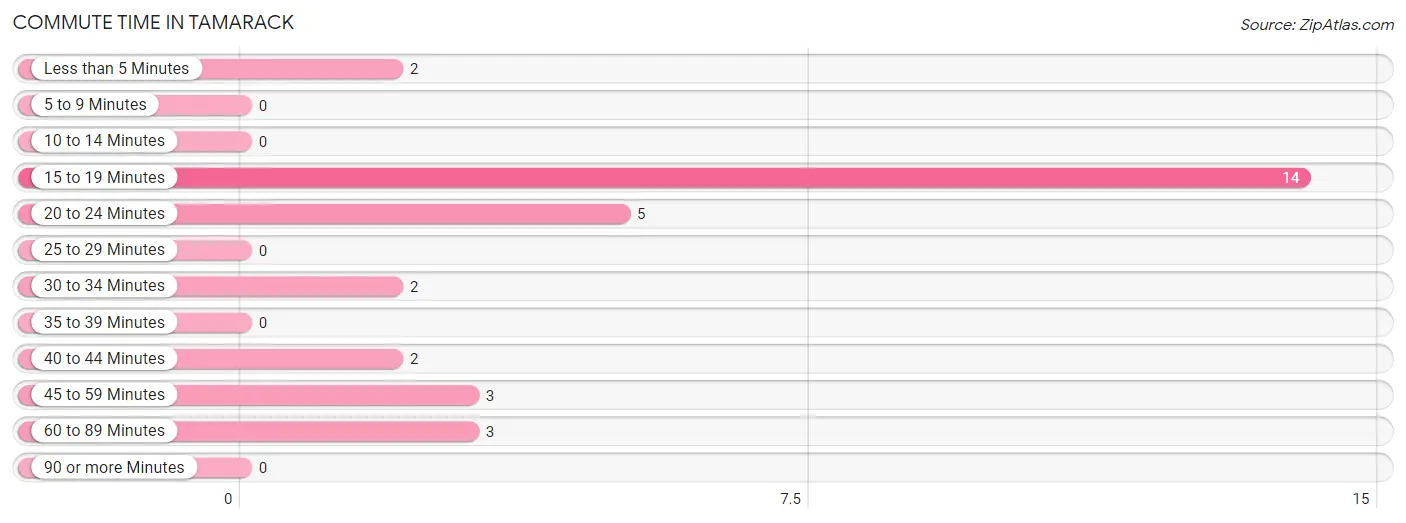
| Commute Time | # Commuters | % Commuters |
| Less than 5 Minutes | 2 | 6.5% |
| 5 to 9 Minutes | 0 | 0.0% |
| 10 to 14 Minutes | 0 | 0.0% |
| 15 to 19 Minutes | 14 | 45.2% |
| 20 to 24 Minutes | 5 | 16.1% |
| 25 to 29 Minutes | 0 | 0.0% |
| 30 to 34 Minutes | 2 | 6.5% |
| 35 to 39 Minutes | 0 | 0.0% |
| 40 to 44 Minutes | 2 | 6.5% |
| 45 to 59 Minutes | 3 | 9.7% |
| 60 to 89 Minutes | 3 | 9.7% |
| 90 or more Minutes | 0 | 0.0% |
Commute Time by Sex in Tamarack
The most common commute times in Tamarack are 15 to 19 minutes (11 commuters, 52.4%) for males and 15 to 19 minutes (3 commuters, 30.0%) for females.
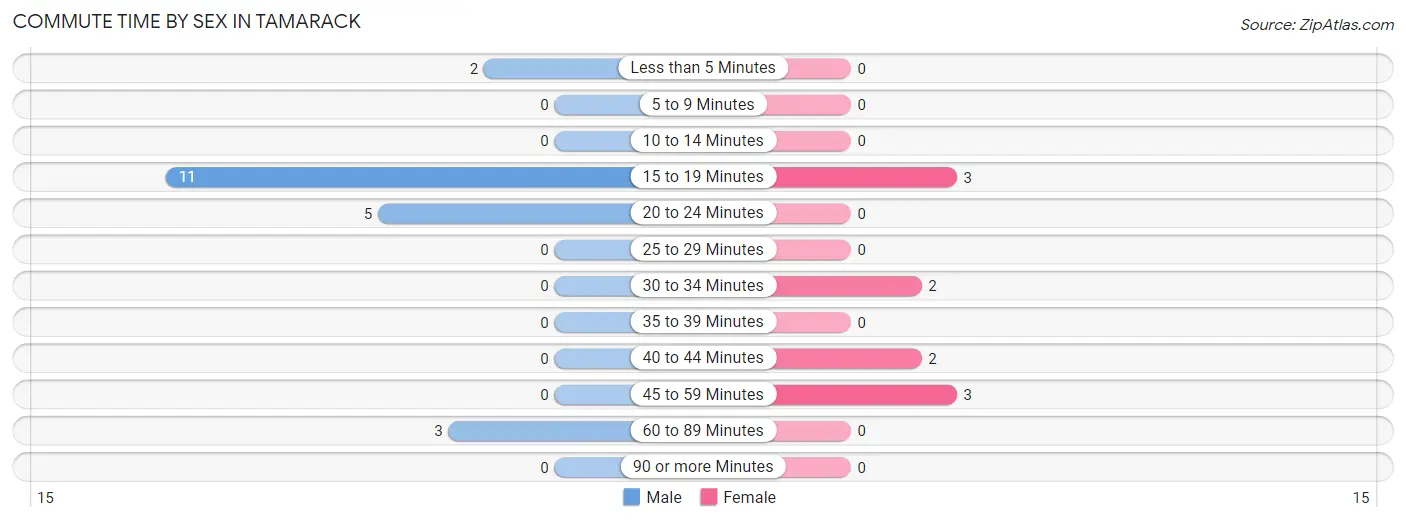
| Commute Time | Male | Female |
| Less than 5 Minutes | 2 (9.5%) | 0 (0.0%) |
| 5 to 9 Minutes | 0 (0.0%) | 0 (0.0%) |
| 10 to 14 Minutes | 0 (0.0%) | 0 (0.0%) |
| 15 to 19 Minutes | 11 (52.4%) | 3 (30.0%) |
| 20 to 24 Minutes | 5 (23.8%) | 0 (0.0%) |
| 25 to 29 Minutes | 0 (0.0%) | 0 (0.0%) |
| 30 to 34 Minutes | 0 (0.0%) | 2 (20.0%) |
| 35 to 39 Minutes | 0 (0.0%) | 0 (0.0%) |
| 40 to 44 Minutes | 0 (0.0%) | 2 (20.0%) |
| 45 to 59 Minutes | 0 (0.0%) | 3 (30.0%) |
| 60 to 89 Minutes | 3 (14.3%) | 0 (0.0%) |
| 90 or more Minutes | 0 (0.0%) | 0 (0.0%) |
Time of Departure to Work by Sex in Tamarack
The most frequent times of departure to work in Tamarack are 7:30 AM to 7:59 AM (12, 57.1%) for males and 12:00 AM to 4:59 AM (3, 30.0%) for females.
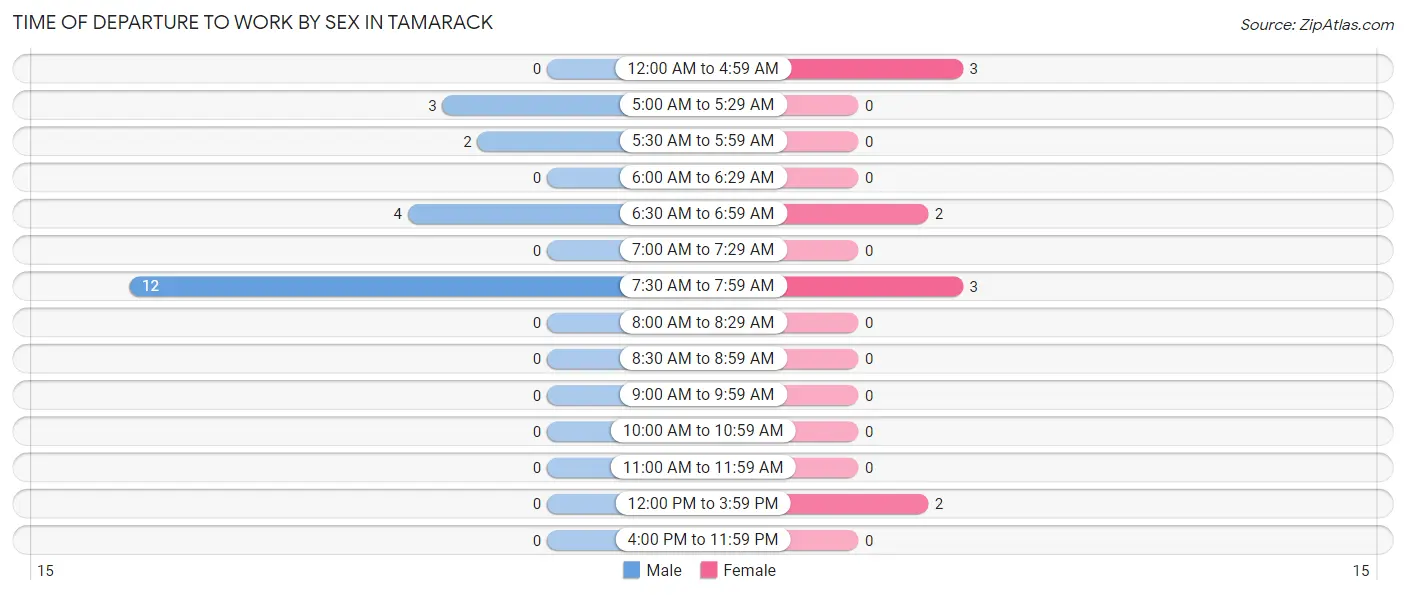
| Time of Departure | Male | Female |
| 12:00 AM to 4:59 AM | 0 (0.0%) | 3 (30.0%) |
| 5:00 AM to 5:29 AM | 3 (14.3%) | 0 (0.0%) |
| 5:30 AM to 5:59 AM | 2 (9.5%) | 0 (0.0%) |
| 6:00 AM to 6:29 AM | 0 (0.0%) | 0 (0.0%) |
| 6:30 AM to 6:59 AM | 4 (19.1%) | 2 (20.0%) |
| 7:00 AM to 7:29 AM | 0 (0.0%) | 0 (0.0%) |
| 7:30 AM to 7:59 AM | 12 (57.1%) | 3 (30.0%) |
| 8:00 AM to 8:29 AM | 0 (0.0%) | 0 (0.0%) |
| 8:30 AM to 8:59 AM | 0 (0.0%) | 0 (0.0%) |
| 9:00 AM to 9:59 AM | 0 (0.0%) | 0 (0.0%) |
| 10:00 AM to 10:59 AM | 0 (0.0%) | 0 (0.0%) |
| 11:00 AM to 11:59 AM | 0 (0.0%) | 0 (0.0%) |
| 12:00 PM to 3:59 PM | 0 (0.0%) | 2 (20.0%) |
| 4:00 PM to 11:59 PM | 0 (0.0%) | 0 (0.0%) |
| Total | 21 (100.0%) | 10 (100.0%) |
Housing Occupancy in Tamarack
Occupancy by Ownership in Tamarack
Of the total 33 dwellings in Tamarack, owner-occupied units account for 28 (84.9%), while renter-occupied units make up 5 (15.1%).
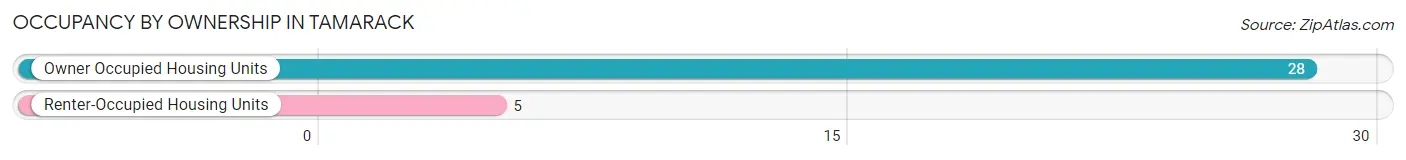
| Occupancy | # Housing Units | % Housing Units |
| Owner Occupied Housing Units | 28 | 84.9% |
| Renter-Occupied Housing Units | 5 | 15.1% |
| Total Occupied Housing Units | 33 | 100.0% |
Occupancy by Household Size in Tamarack
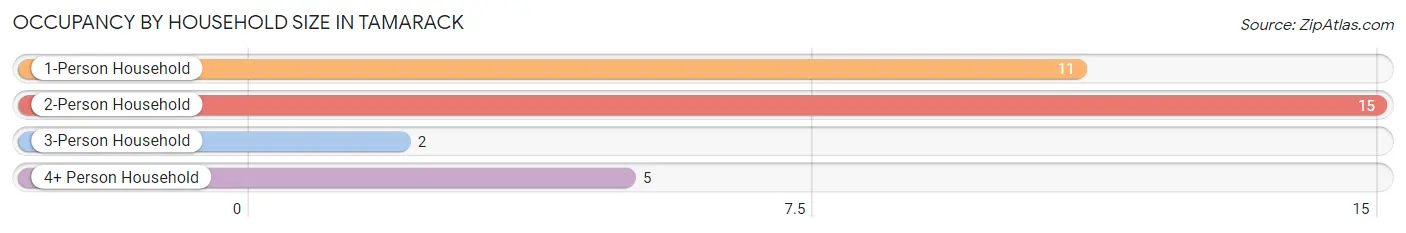
| Household Size | # Housing Units | % Housing Units |
| 1-Person Household | 11 | 33.3% |
| 2-Person Household | 15 | 45.5% |
| 3-Person Household | 2 | 6.1% |
| 4+ Person Household | 5 | 15.1% |
| Total Housing Units | 33 | 100.0% |
Occupancy by Ownership by Household Size in Tamarack
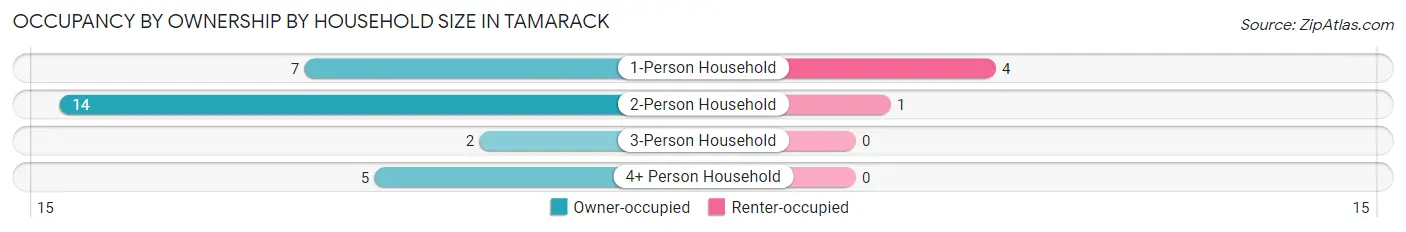
| Household Size | Owner-occupied | Renter-occupied |
| 1-Person Household | 7 (63.6%) | 4 (36.4%) |
| 2-Person Household | 14 (93.3%) | 1 (6.7%) |
| 3-Person Household | 2 (100.0%) | 0 (0.0%) |
| 4+ Person Household | 5 (100.0%) | 0 (0.0%) |
| Total Housing Units | 28 (84.9%) | 5 (15.1%) |
Occupancy by Educational Attainment in Tamarack
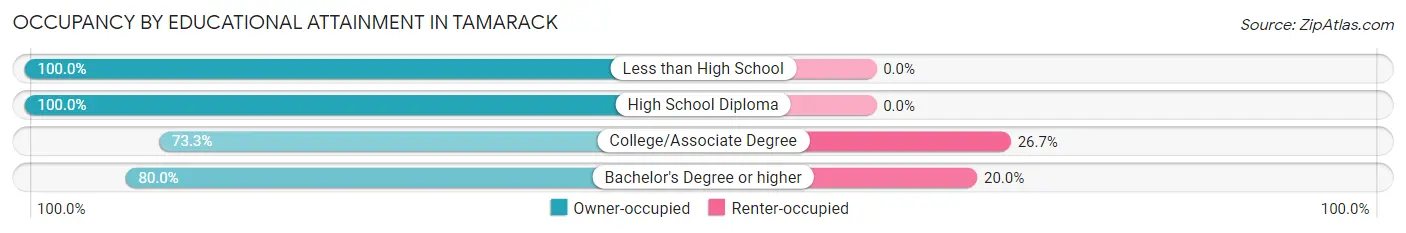
| Household Size | Owner-occupied | Renter-occupied |
| Less than High School | 2 (100.0%) | 0 (0.0%) |
| High School Diploma | 11 (100.0%) | 0 (0.0%) |
| College/Associate Degree | 11 (73.3%) | 4 (26.7%) |
| Bachelor's Degree or higher | 4 (80.0%) | 1 (20.0%) |
Occupancy by Age of Householder in Tamarack
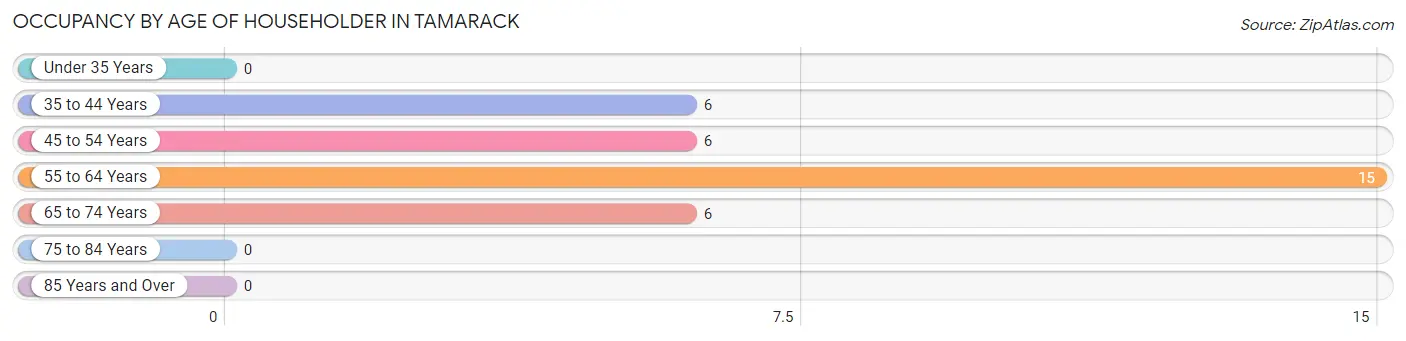
| Age Bracket | # Households | % Households |
| Under 35 Years | 0 | 0.0% |
| 35 to 44 Years | 6 | 18.2% |
| 45 to 54 Years | 6 | 18.2% |
| 55 to 64 Years | 15 | 45.5% |
| 65 to 74 Years | 6 | 18.2% |
| 75 to 84 Years | 0 | 0.0% |
| 85 Years and Over | 0 | 0.0% |
| Total | 33 | 100.0% |
Housing Finances in Tamarack
Median Income by Occupancy in Tamarack
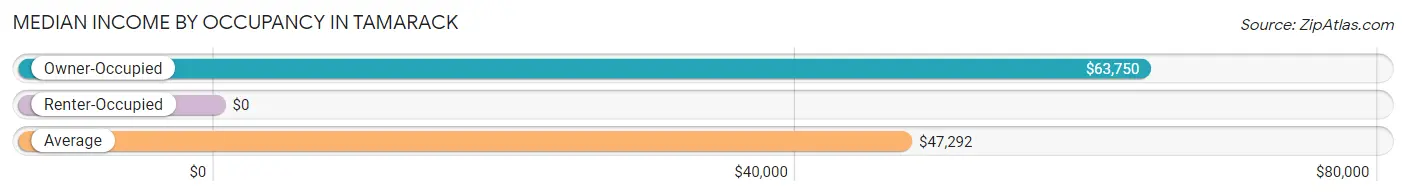
| Occupancy Type | # Households | Median Income |
| Owner-Occupied | 28 (84.9%) | $63,750 |
| Renter-Occupied | 5 (15.1%) | $0 |
| Average | 33 (100.0%) | $47,292 |
Occupancy by Householder Income Bracket in Tamarack
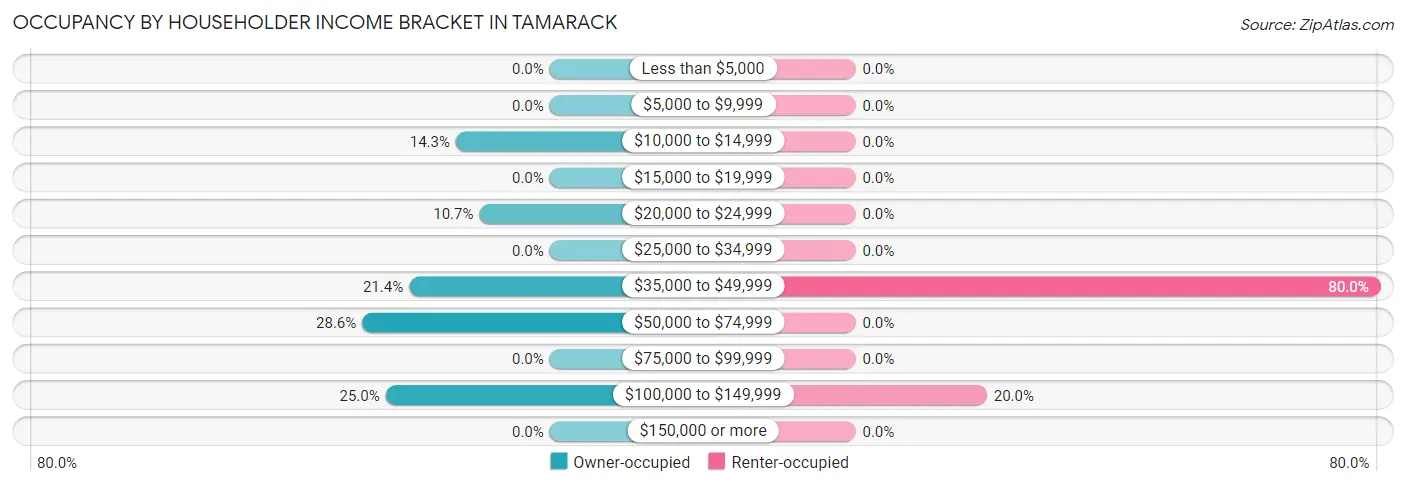
| Income Bracket | Owner-occupied | Renter-occupied |
| Less than $5,000 | 0 (0.0%) | 0 (0.0%) |
| $5,000 to $9,999 | 0 (0.0%) | 0 (0.0%) |
| $10,000 to $14,999 | 4 (14.3%) | 0 (0.0%) |
| $15,000 to $19,999 | 0 (0.0%) | 0 (0.0%) |
| $20,000 to $24,999 | 3 (10.7%) | 0 (0.0%) |
| $25,000 to $34,999 | 0 (0.0%) | 0 (0.0%) |
| $35,000 to $49,999 | 6 (21.4%) | 4 (80.0%) |
| $50,000 to $74,999 | 8 (28.6%) | 0 (0.0%) |
| $75,000 to $99,999 | 0 (0.0%) | 0 (0.0%) |
| $100,000 to $149,999 | 7 (25.0%) | 1 (20.0%) |
| $150,000 or more | 0 (0.0%) | 0 (0.0%) |
| Total | 28 (100.0%) | 5 (100.0%) |
Monthly Housing Cost Tiers in Tamarack
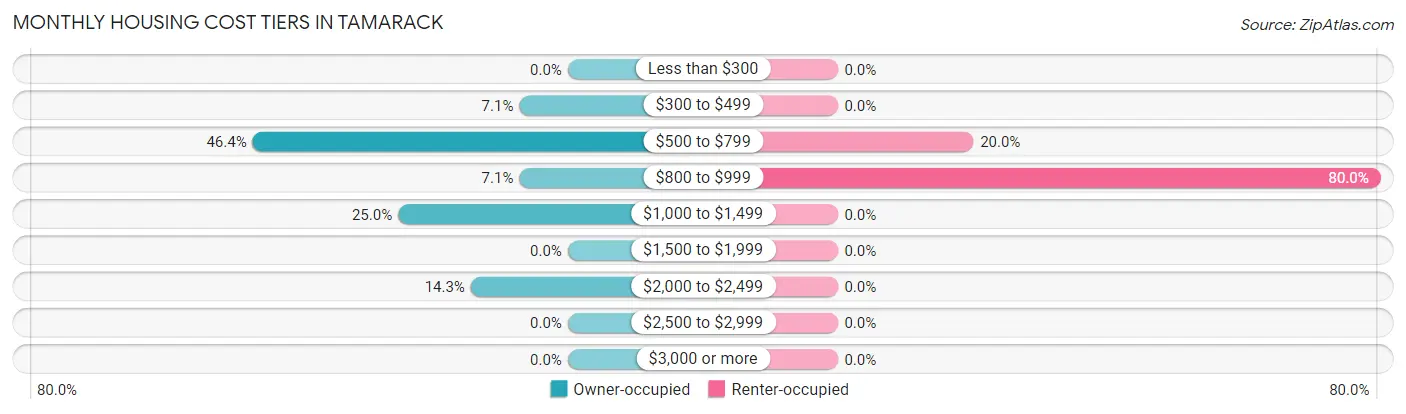
| Monthly Cost | Owner-occupied | Renter-occupied |
| Less than $300 | 0 (0.0%) | 0 (0.0%) |
| $300 to $499 | 2 (7.1%) | 0 (0.0%) |
| $500 to $799 | 13 (46.4%) | 1 (20.0%) |
| $800 to $999 | 2 (7.1%) | 4 (80.0%) |
| $1,000 to $1,499 | 7 (25.0%) | 0 (0.0%) |
| $1,500 to $1,999 | 0 (0.0%) | 0 (0.0%) |
| $2,000 to $2,499 | 4 (14.3%) | 0 (0.0%) |
| $2,500 to $2,999 | 0 (0.0%) | 0 (0.0%) |
| $3,000 or more | 0 (0.0%) | 0 (0.0%) |
| Total | 28 (100.0%) | 5 (100.0%) |
Physical Housing Characteristics in Tamarack
Housing Structures in Tamarack
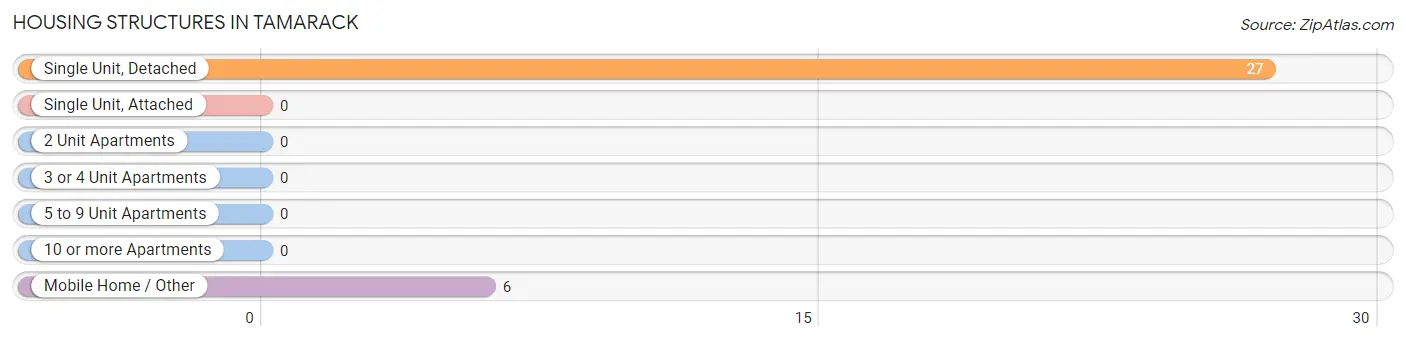
| Structure Type | # Housing Units | % Housing Units |
| Single Unit, Detached | 27 | 81.8% |
| Single Unit, Attached | 0 | 0.0% |
| 2 Unit Apartments | 0 | 0.0% |
| 3 or 4 Unit Apartments | 0 | 0.0% |
| 5 to 9 Unit Apartments | 0 | 0.0% |
| 10 or more Apartments | 0 | 0.0% |
| Mobile Home / Other | 6 | 18.2% |
| Total | 33 | 100.0% |
Housing Structures by Occupancy in Tamarack
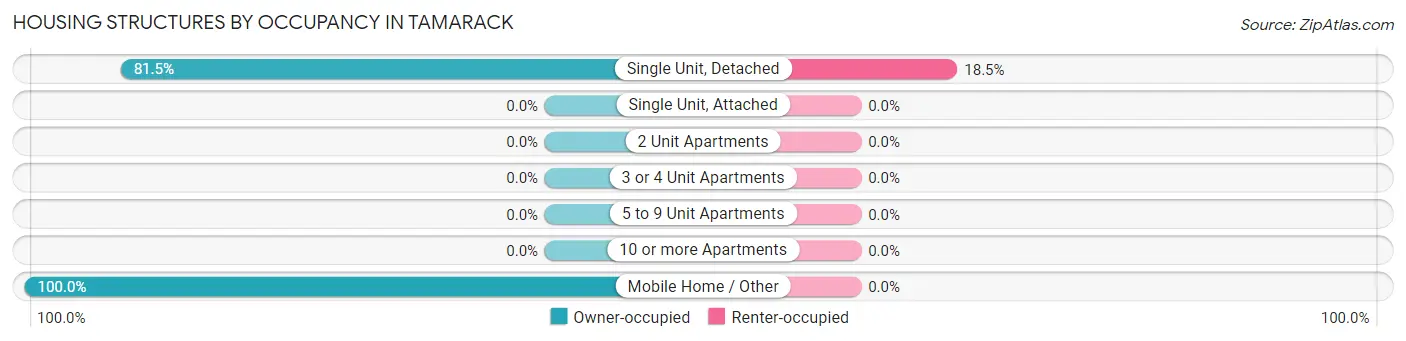
| Structure Type | Owner-occupied | Renter-occupied |
| Single Unit, Detached | 22 (81.5%) | 5 (18.5%) |
| Single Unit, Attached | 0 (0.0%) | 0 (0.0%) |
| 2 Unit Apartments | 0 (0.0%) | 0 (0.0%) |
| 3 or 4 Unit Apartments | 0 (0.0%) | 0 (0.0%) |
| 5 to 9 Unit Apartments | 0 (0.0%) | 0 (0.0%) |
| 10 or more Apartments | 0 (0.0%) | 0 (0.0%) |
| Mobile Home / Other | 6 (100.0%) | 0 (0.0%) |
| Total | 28 (84.9%) | 5 (15.1%) |
Housing Structures by Number of Rooms in Tamarack
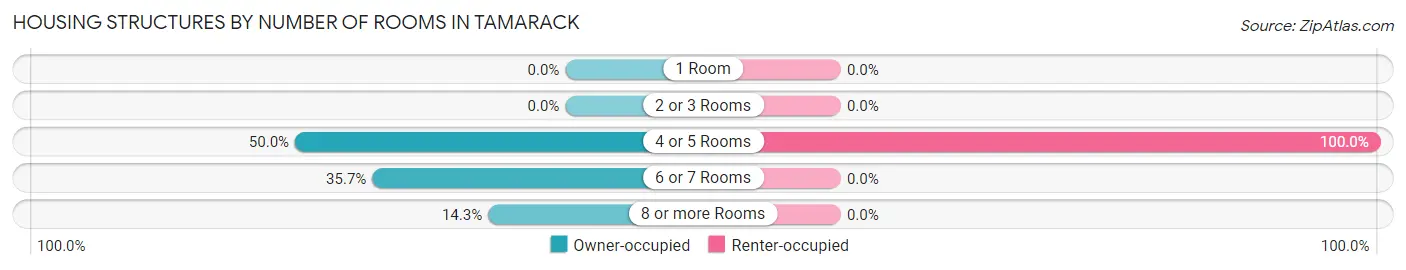
| Number of Rooms | Owner-occupied | Renter-occupied |
| 1 Room | 0 (0.0%) | 0 (0.0%) |
| 2 or 3 Rooms | 0 (0.0%) | 0 (0.0%) |
| 4 or 5 Rooms | 14 (50.0%) | 5 (100.0%) |
| 6 or 7 Rooms | 10 (35.7%) | 0 (0.0%) |
| 8 or more Rooms | 4 (14.3%) | 0 (0.0%) |
| Total | 28 (100.0%) | 5 (100.0%) |
Housing Structure by Heating Type in Tamarack
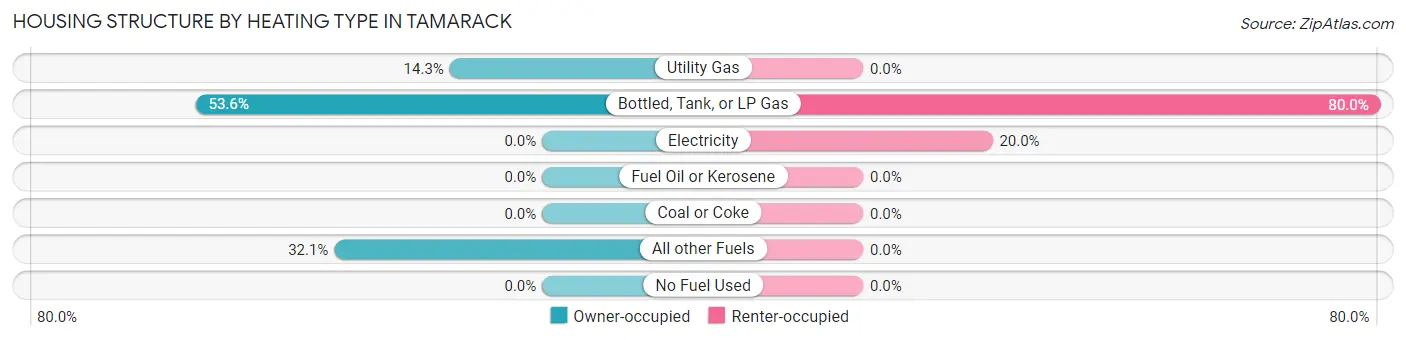
| Heating Type | Owner-occupied | Renter-occupied |
| Utility Gas | 4 (14.3%) | 0 (0.0%) |
| Bottled, Tank, or LP Gas | 15 (53.6%) | 4 (80.0%) |
| Electricity | 0 (0.0%) | 1 (20.0%) |
| Fuel Oil or Kerosene | 0 (0.0%) | 0 (0.0%) |
| Coal or Coke | 0 (0.0%) | 0 (0.0%) |
| All other Fuels | 9 (32.1%) | 0 (0.0%) |
| No Fuel Used | 0 (0.0%) | 0 (0.0%) |
| Total | 28 (100.0%) | 5 (100.0%) |
Household Vehicle Usage in Tamarack
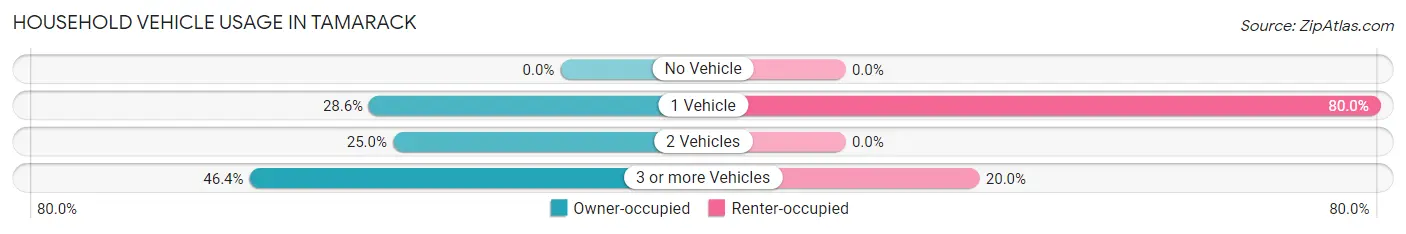
| Vehicles per Household | Owner-occupied | Renter-occupied |
| No Vehicle | 0 (0.0%) | 0 (0.0%) |
| 1 Vehicle | 8 (28.6%) | 4 (80.0%) |
| 2 Vehicles | 7 (25.0%) | 0 (0.0%) |
| 3 or more Vehicles | 13 (46.4%) | 1 (20.0%) |
| Total | 28 (100.0%) | 5 (100.0%) |
Real Estate & Mortgages in Tamarack
Real Estate and Mortgage Overview in Tamarack
| Characteristic | Without Mortgage | With Mortgage |
| Housing Units | 12 | 16 |
| Median Property Value | $175,000 | $121,400 |
| Median Household Income | - | - |
| Monthly Housing Costs | $567 | $0 |
| Real Estate Taxes | - | - |
Property Value by Mortgage Status in Tamarack
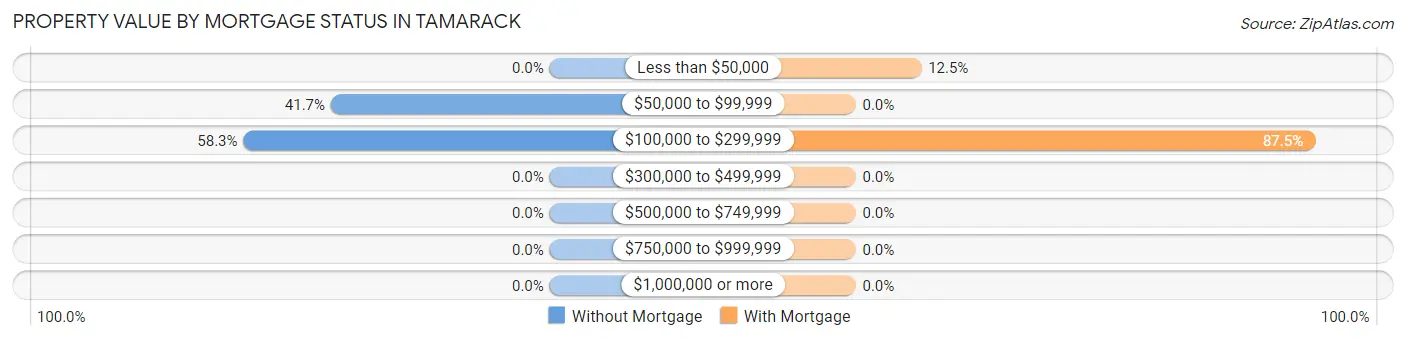
| Property Value | Without Mortgage | With Mortgage |
| Less than $50,000 | 0 (0.0%) | 2 (12.5%) |
| $50,000 to $99,999 | 5 (41.7%) | 0 (0.0%) |
| $100,000 to $299,999 | 7 (58.3%) | 14 (87.5%) |
| $300,000 to $499,999 | 0 (0.0%) | 0 (0.0%) |
| $500,000 to $749,999 | 0 (0.0%) | 0 (0.0%) |
| $750,000 to $999,999 | 0 (0.0%) | 0 (0.0%) |
| $1,000,000 or more | 0 (0.0%) | 0 (0.0%) |
| Total | 12 (100.0%) | 16 (100.0%) |
Household Income by Mortgage Status in Tamarack
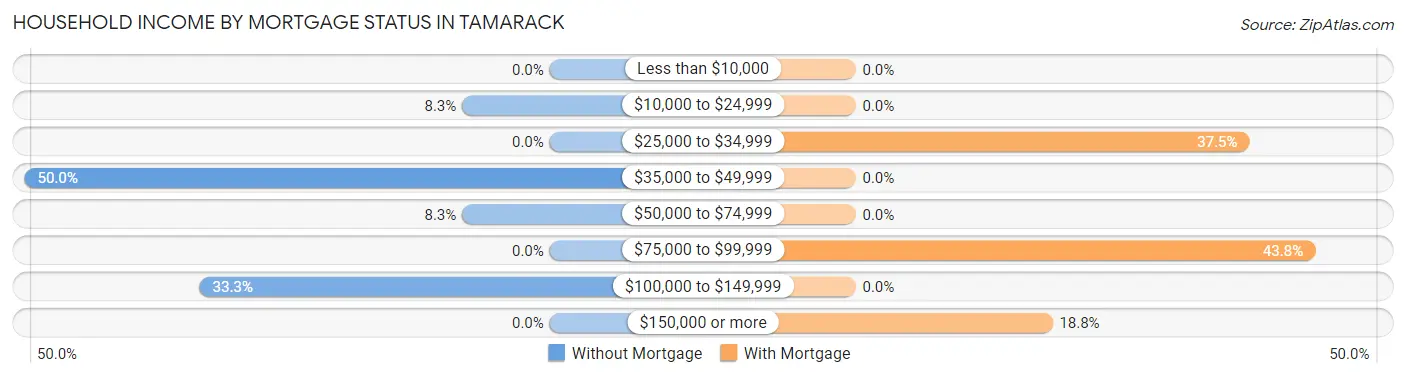
| Household Income | Without Mortgage | With Mortgage |
| Less than $10,000 | 0 (0.0%) | 0 (0.0%) |
| $10,000 to $24,999 | 1 (8.3%) | 0 (0.0%) |
| $25,000 to $34,999 | 0 (0.0%) | 6 (37.5%) |
| $35,000 to $49,999 | 6 (50.0%) | 0 (0.0%) |
| $50,000 to $74,999 | 1 (8.3%) | 0 (0.0%) |
| $75,000 to $99,999 | 0 (0.0%) | 7 (43.8%) |
| $100,000 to $149,999 | 4 (33.3%) | 0 (0.0%) |
| $150,000 or more | 0 (0.0%) | 3 (18.8%) |
| Total | 12 (100.0%) | 16 (100.0%) |
Property Value to Household Income Ratio in Tamarack
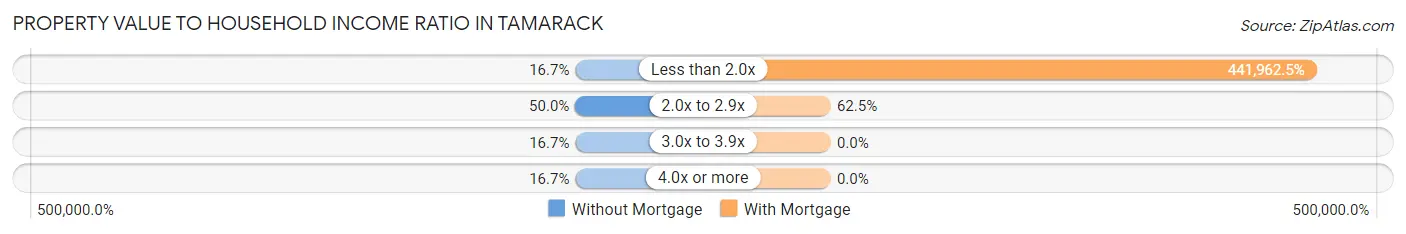
| Value-to-Income Ratio | Without Mortgage | With Mortgage |
| Less than 2.0x | 2 (16.7%) | 70,714 (441,962.5%) |
| 2.0x to 2.9x | 6 (50.0%) | 10 (62.5%) |
| 3.0x to 3.9x | 2 (16.7%) | 0 (0.0%) |
| 4.0x or more | 2 (16.7%) | 0 (0.0%) |
| Total | 12 (100.0%) | 16 (100.0%) |
Real Estate Taxes by Mortgage Status in Tamarack
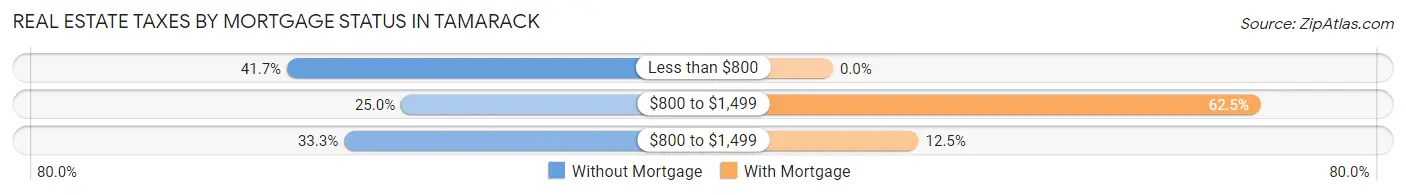
| Property Taxes | Without Mortgage | With Mortgage |
| Less than $800 | 5 (41.7%) | 0 (0.0%) |
| $800 to $1,499 | 3 (25.0%) | 10 (62.5%) |
| $800 to $1,499 | 4 (33.3%) | 2 (12.5%) |
| Total | 12 (100.0%) | 16 (100.0%) |
Health & Disability in Tamarack
Health Insurance Coverage by Age in Tamarack
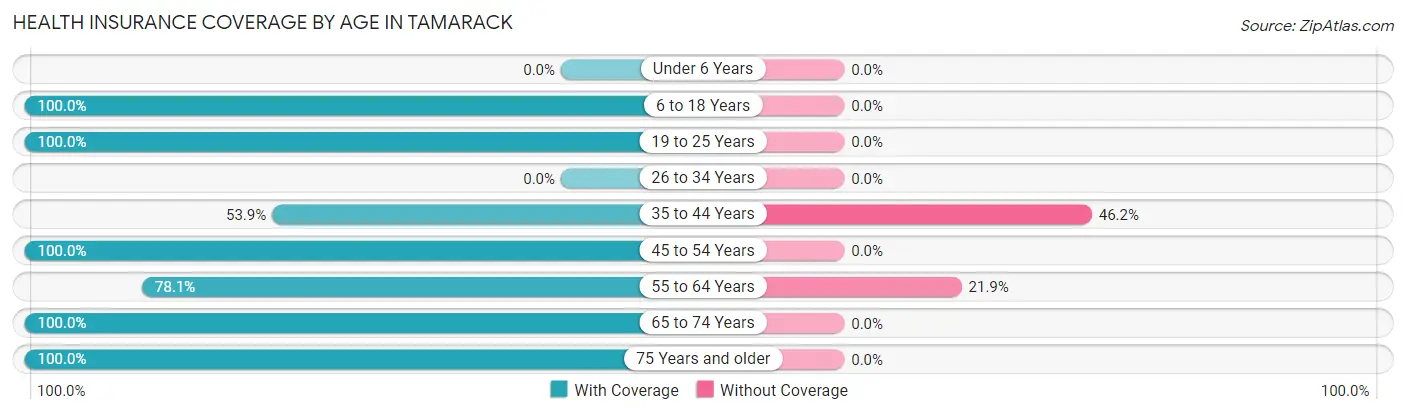
| Age Bracket | With Coverage | Without Coverage |
| Under 6 Years | 0 (0.0%) | 0 (0.0%) |
| 6 to 18 Years | 8 (100.0%) | 0 (0.0%) |
| 19 to 25 Years | 5 (100.0%) | 0 (0.0%) |
| 26 to 34 Years | 0 (0.0%) | 0 (0.0%) |
| 35 to 44 Years | 7 (53.8%) | 6 (46.2%) |
| 45 to 54 Years | 11 (100.0%) | 0 (0.0%) |
| 55 to 64 Years | 25 (78.1%) | 7 (21.9%) |
| 65 to 74 Years | 6 (100.0%) | 0 (0.0%) |
| 75 Years and older | 1 (100.0%) | 0 (0.0%) |
| Total | 63 (82.9%) | 13 (17.1%) |
Health Insurance Coverage by Citizenship Status in Tamarack
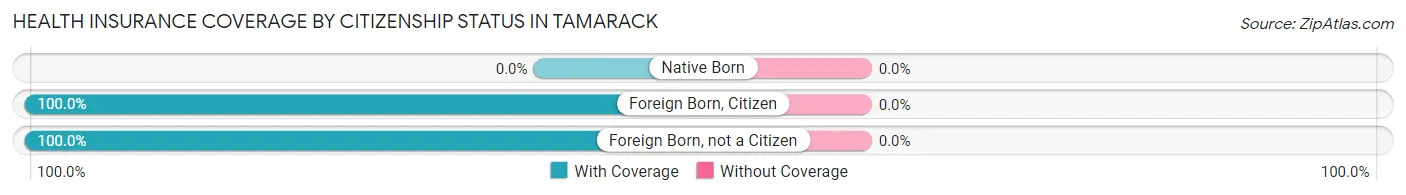
| Citizenship Status | With Coverage | Without Coverage |
| Native Born | 0 (0.0%) | 0 (0.0%) |
| Foreign Born, Citizen | 8 (100.0%) | 0 (0.0%) |
| Foreign Born, not a Citizen | 5 (100.0%) | 0 (0.0%) |
Health Insurance Coverage by Household Income in Tamarack
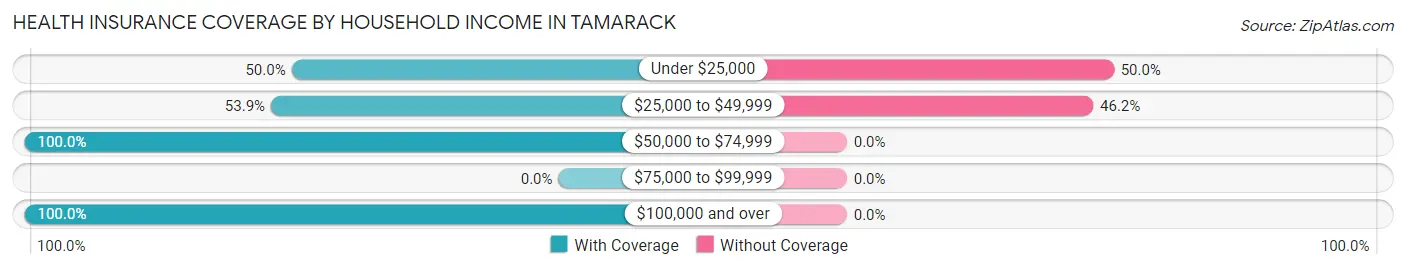
| Household Income | With Coverage | Without Coverage |
| Under $25,000 | 7 (50.0%) | 7 (50.0%) |
| $25,000 to $49,999 | 7 (53.8%) | 6 (46.2%) |
| $50,000 to $74,999 | 33 (100.0%) | 0 (0.0%) |
| $75,000 to $99,999 | 0 (0.0%) | 0 (0.0%) |
| $100,000 and over | 16 (100.0%) | 0 (0.0%) |
Public vs Private Health Insurance Coverage by Age in Tamarack
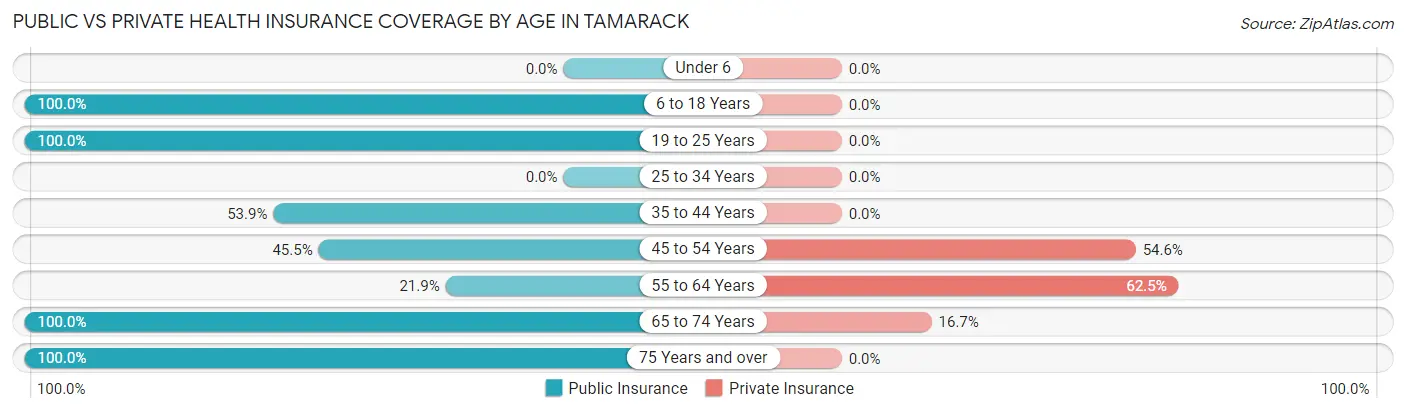
| Age Bracket | Public Insurance | Private Insurance |
| Under 6 | 0 (0.0%) | 0 (0.0%) |
| 6 to 18 Years | 8 (100.0%) | 0 (0.0%) |
| 19 to 25 Years | 5 (100.0%) | 0 (0.0%) |
| 25 to 34 Years | 0 (0.0%) | 0 (0.0%) |
| 35 to 44 Years | 7 (53.8%) | 0 (0.0%) |
| 45 to 54 Years | 5 (45.5%) | 6 (54.5%) |
| 55 to 64 Years | 7 (21.9%) | 20 (62.5%) |
| 65 to 74 Years | 6 (100.0%) | 1 (16.7%) |
| 75 Years and over | 1 (100.0%) | 0 (0.0%) |
| Total | 39 (51.3%) | 27 (35.5%) |
Disability Status by Sex by Age in Tamarack
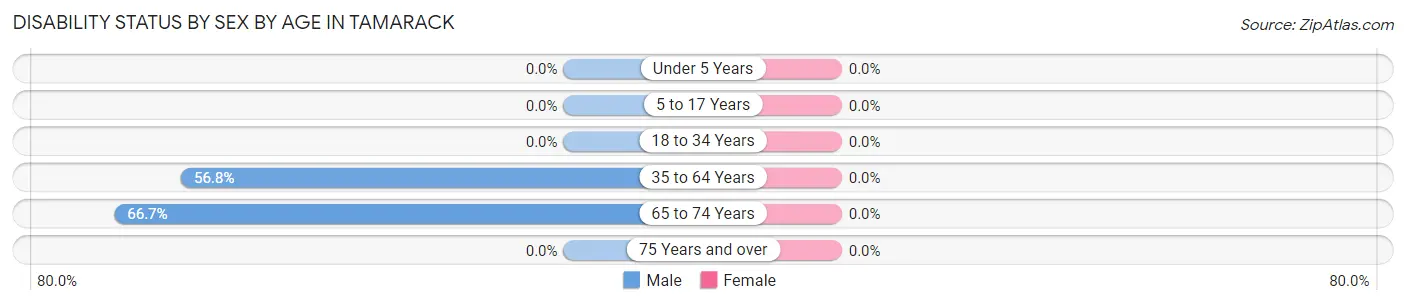
| Age Bracket | Male | Female |
| Under 5 Years | 0 (0.0%) | 0 (0.0%) |
| 5 to 17 Years | 0 (0.0%) | 0 (0.0%) |
| 18 to 34 Years | 0 (0.0%) | 0 (0.0%) |
| 35 to 64 Years | 21 (56.8%) | 0 (0.0%) |
| 65 to 74 Years | 4 (66.7%) | 0 (0.0%) |
| 75 Years and over | 0 (0.0%) | 0 (0.0%) |
Disability Class by Sex by Age in Tamarack
Disability Class: Hearing Difficulty
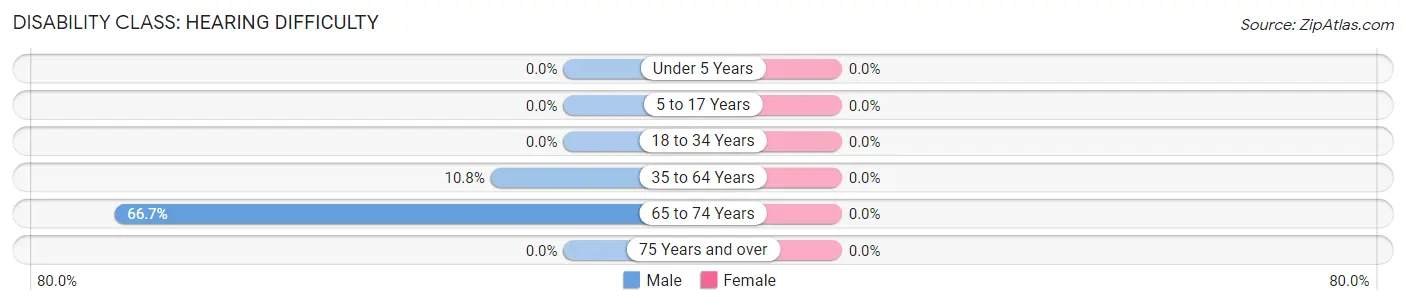
| Age Bracket | Male | Female |
| Under 5 Years | 0 (0.0%) | 0 (0.0%) |
| 5 to 17 Years | 0 (0.0%) | 0 (0.0%) |
| 18 to 34 Years | 0 (0.0%) | 0 (0.0%) |
| 35 to 64 Years | 4 (10.8%) | 0 (0.0%) |
| 65 to 74 Years | 4 (66.7%) | 0 (0.0%) |
| 75 Years and over | 0 (0.0%) | 0 (0.0%) |
Disability Class: Vision Difficulty
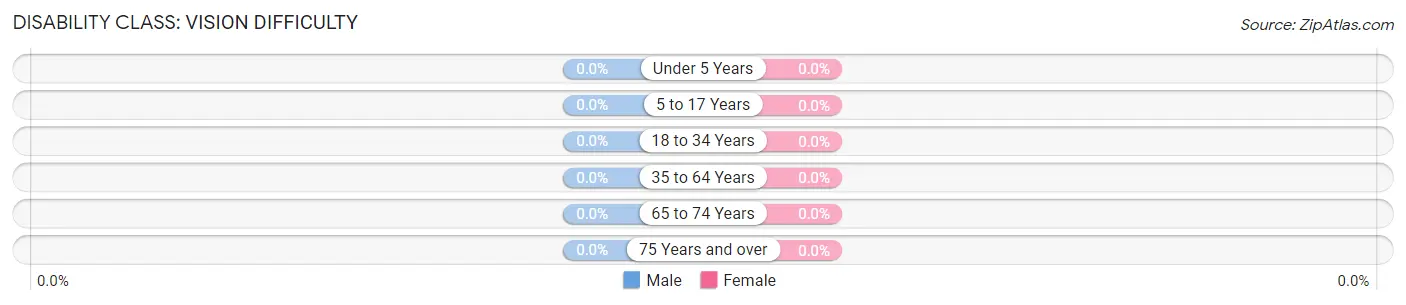
| Age Bracket | Male | Female |
| Under 5 Years | 0 (0.0%) | 0 (0.0%) |
| 5 to 17 Years | 0 (0.0%) | 0 (0.0%) |
| 18 to 34 Years | 0 (0.0%) | 0 (0.0%) |
| 35 to 64 Years | 0 (0.0%) | 0 (0.0%) |
| 65 to 74 Years | 0 (0.0%) | 0 (0.0%) |
| 75 Years and over | 0 (0.0%) | 0 (0.0%) |
Disability Class: Cognitive Difficulty
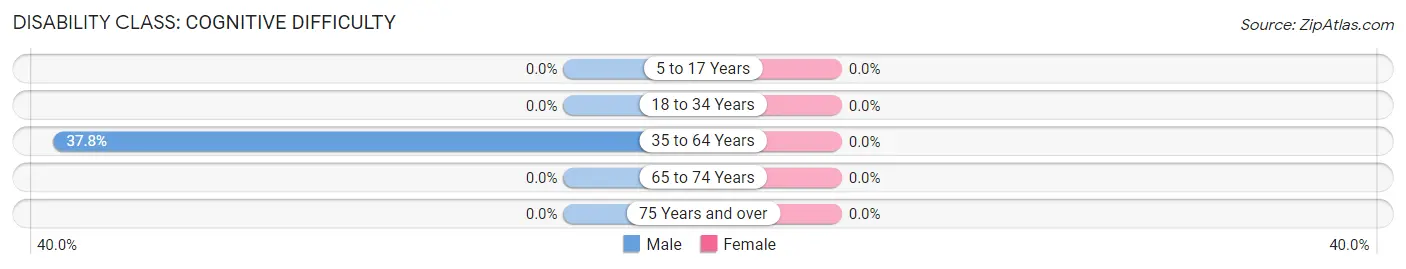
| Age Bracket | Male | Female |
| 5 to 17 Years | 0 (0.0%) | 0 (0.0%) |
| 18 to 34 Years | 0 (0.0%) | 0 (0.0%) |
| 35 to 64 Years | 14 (37.8%) | 0 (0.0%) |
| 65 to 74 Years | 0 (0.0%) | 0 (0.0%) |
| 75 Years and over | 0 (0.0%) | 0 (0.0%) |
Disability Class: Ambulatory Difficulty
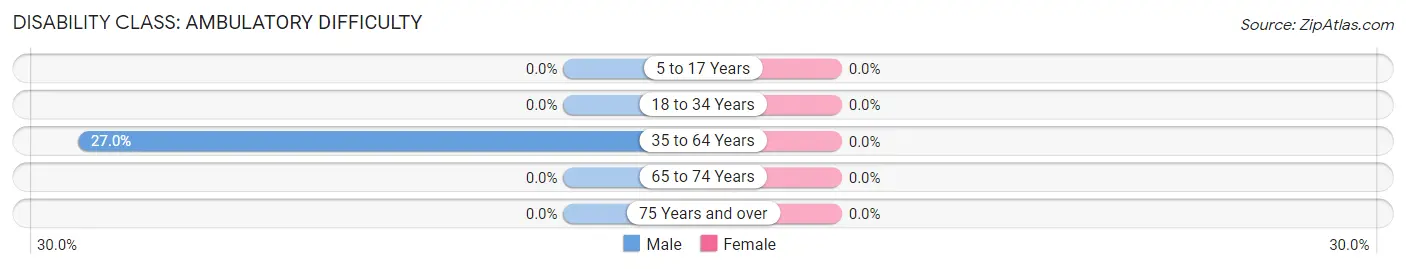
| Age Bracket | Male | Female |
| 5 to 17 Years | 0 (0.0%) | 0 (0.0%) |
| 18 to 34 Years | 0 (0.0%) | 0 (0.0%) |
| 35 to 64 Years | 10 (27.0%) | 0 (0.0%) |
| 65 to 74 Years | 0 (0.0%) | 0 (0.0%) |
| 75 Years and over | 0 (0.0%) | 0 (0.0%) |
Disability Class: Self-Care Difficulty
| Age Bracket | Male | Female |
| 5 to 17 Years | 0 (0.0%) | 0 (0.0%) |
| 18 to 34 Years | 0 (0.0%) | 0 (0.0%) |
| 35 to 64 Years | 0 (0.0%) | 0 (0.0%) |
| 65 to 74 Years | 0 (0.0%) | 0 (0.0%) |
| 75 Years and over | 0 (0.0%) | 0 (0.0%) |
Technology Access in Tamarack
Computing Device Access in Tamarack
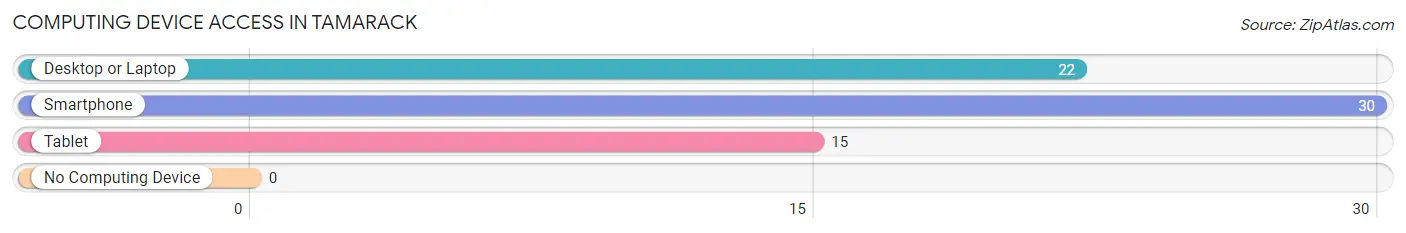
| Device Type | # Households | % Households |
| Desktop or Laptop | 22 | 66.7% |
| Smartphone | 30 | 90.9% |
| Tablet | 15 | 45.5% |
| No Computing Device | 0 | 0.0% |
| Total | 33 | 100.0% |
Internet Access in Tamarack
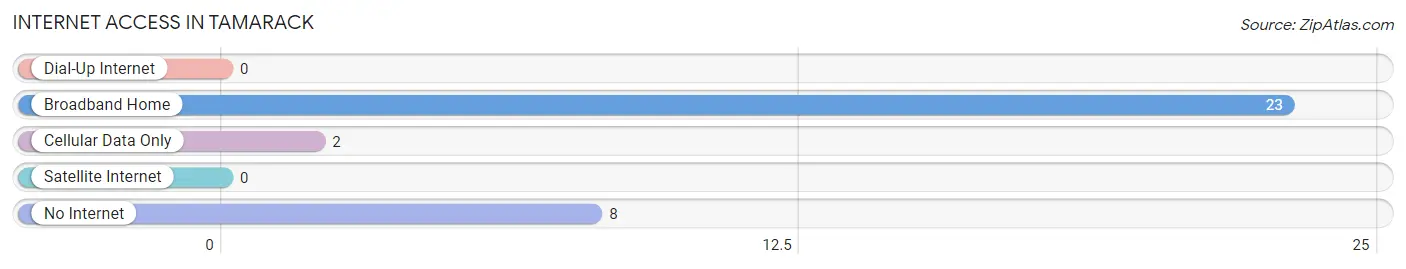
| Internet Type | # Households | % Households |
| Dial-Up Internet | 0 | 0.0% |
| Broadband Home | 23 | 69.7% |
| Cellular Data Only | 2 | 6.1% |
| Satellite Internet | 0 | 0.0% |
| No Internet | 8 | 24.2% |
| Total | 33 | 100.0% |
Tamarack Summary
Tamarack, Minnesota is a small town located in the northern part of the state, near the Canadian border. It is situated in the heart of the Northwoods, surrounded by lakes, rivers, and forests. The town has a population of just over 500 people, and is known for its small-town charm and friendly atmosphere.
History
Tamarack was founded in 1887 by a group of settlers from Wisconsin. The town was named after the tamarack tree, which is native to the area. The settlers were drawn to the area by the abundance of natural resources, including timber, fish, and game. The town quickly grew, and by the early 1900s, it had become a bustling logging and fishing community.
In the 1920s, the town began to experience a decline in population as the logging industry began to decline. However, the town was able to survive due to its proximity to the Canadian border, which allowed for a steady influx of tourists. In the 1950s, the town began to experience a resurgence in population as people began to move to the area for its natural beauty and recreational opportunities.
Geography
Tamarack is located in the northern part of Minnesota, near the Canadian border. It is situated in the heart of the Northwoods, surrounded by lakes, rivers, and forests. The town is located on the shores of Lake Superior, and is just a few miles from the Boundary Waters Canoe Area Wilderness. The town is also close to the Superior National Forest, which provides a variety of outdoor recreational opportunities.
Economy
Tamarack’s economy is largely based on tourism and recreation. The town is a popular destination for fishing, hunting, camping, and other outdoor activities. The town also has a number of small businesses, including restaurants, shops, and lodging. The town is also home to a number of small manufacturing businesses, which produce a variety of products, including furniture, clothing, and sporting goods.
Demographics
As of the 2010 census, the population of Tamarack was 517 people. The town is predominantly white, with a small minority population. The median household income is $37,500, and the median age is 44. The town has a high rate of homeownership, with over 80% of the population owning their own homes.
Tamarack is a small town with a big heart. It is a place where people come to enjoy the outdoors, relax, and experience the small-town charm. The town is a great place to live, work, and raise a family. With its abundance of natural resources, recreational opportunities, and friendly atmosphere, Tamarack is a great place to call home.
Common Questions
What is Per Capita Income in Tamarack?
Per Capita income in Tamarack is $27,043.
What is the Median Household income in Tamarack?
Median Household Income in Tamarack is $47,292.
What is Inequality or Gini Index in Tamarack?
Inequality or Gini Index in Tamarack is 0.34.
What is the Total Population of Tamarack?
Total Population of Tamarack is 76.
What is the Total Male Population of Tamarack?
Total Male Population of Tamarack is 48.
What is the Total Female Population of Tamarack?
Total Female Population of Tamarack is 28.
What is the Ratio of Males per 100 Females in Tamarack?
There are 171.43 Males per 100 Females in Tamarack.
What is the Ratio of Females per 100 Males in Tamarack?
There are 58.33 Females per 100 Males in Tamarack.
What is the Median Population Age in Tamarack?
Median Population Age in Tamarack is 55.1 Years.
What is the Average Family Size in Tamarack
Average Family Size in Tamarack is 2.5 People.
What is the Average Household Size in Tamarack
Average Household Size in Tamarack is 2.3 People.
How Large is the Labor Force in Tamarack?
There are 37 People in the Labor Forcein in Tamarack.
What is the Percentage of People in the Labor Force in Tamarack?
54.4% of People are in the Labor Force in Tamarack.
What is the Unemployment Rate in Tamarack?
Unemployment Rate in Tamarack is 5.4%.