Spring Valley, MN Map & Demographics
Spring Valley Map
Spring Valley Overview
$32,163
PER CAPITA INCOME
$83,125
AVG FAMILY INCOME
$66,250
AVG HOUSEHOLD INCOME
12.2%
WAGE / INCOME GAP [ % ]
87.8¢/ $1
WAGE / INCOME GAP [ $ ]
0.41
INEQUALITY / GINI INDEX
2,512
TOTAL POPULATION
1,215
MALE POPULATION
1,297
FEMALE POPULATION
93.68
MALES / 100 FEMALES
106.75
FEMALES / 100 MALES
38.4
MEDIAN AGE
2.9
AVG FAMILY SIZE
2.4
AVG HOUSEHOLD SIZE
1,355
LABOR FORCE [ PEOPLE ]
67.9%
PERCENT IN LABOR FORCE
3.9%
UNEMPLOYMENT RATE
Spring Valley Zip Codes
Spring Valley Area Codes
Income in Spring Valley
Income Overview in Spring Valley
Per Capita Income in Spring Valley is $32,163, while median incomes of families and households are $83,125 and $66,250 respectively.
| Characteristic | Number | Measure |
| Per Capita Income | 2,512 | $32,163 |
| Median Family Income | 630 | $83,125 |
| Mean Family Income | 630 | $95,857 |
| Median Household Income | 1,031 | $66,250 |
| Mean Household Income | 1,031 | $77,281 |
| Income Deficit | 630 | $0 |
| Wage / Income Gap (%) | 2,512 | 12.23% |
| Wage / Income Gap ($) | 2,512 | 87.77¢ per $1 |
| Gini / Inequality Index | 2,512 | 0.41 |
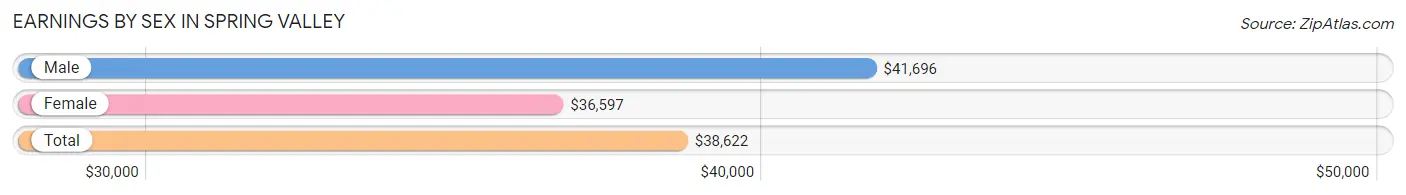
Earnings by Sex in Spring Valley
Average Earnings in Spring Valley are $38,622, $41,696 for men and $36,597 for women, a difference of 12.2%.
| Sex | Number | Average Earnings |
| Male | 634 (46.8%) | $41,696 |
| Female | 720 (53.2%) | $36,597 |
| Total | 1,354 (100.0%) | $38,622 |
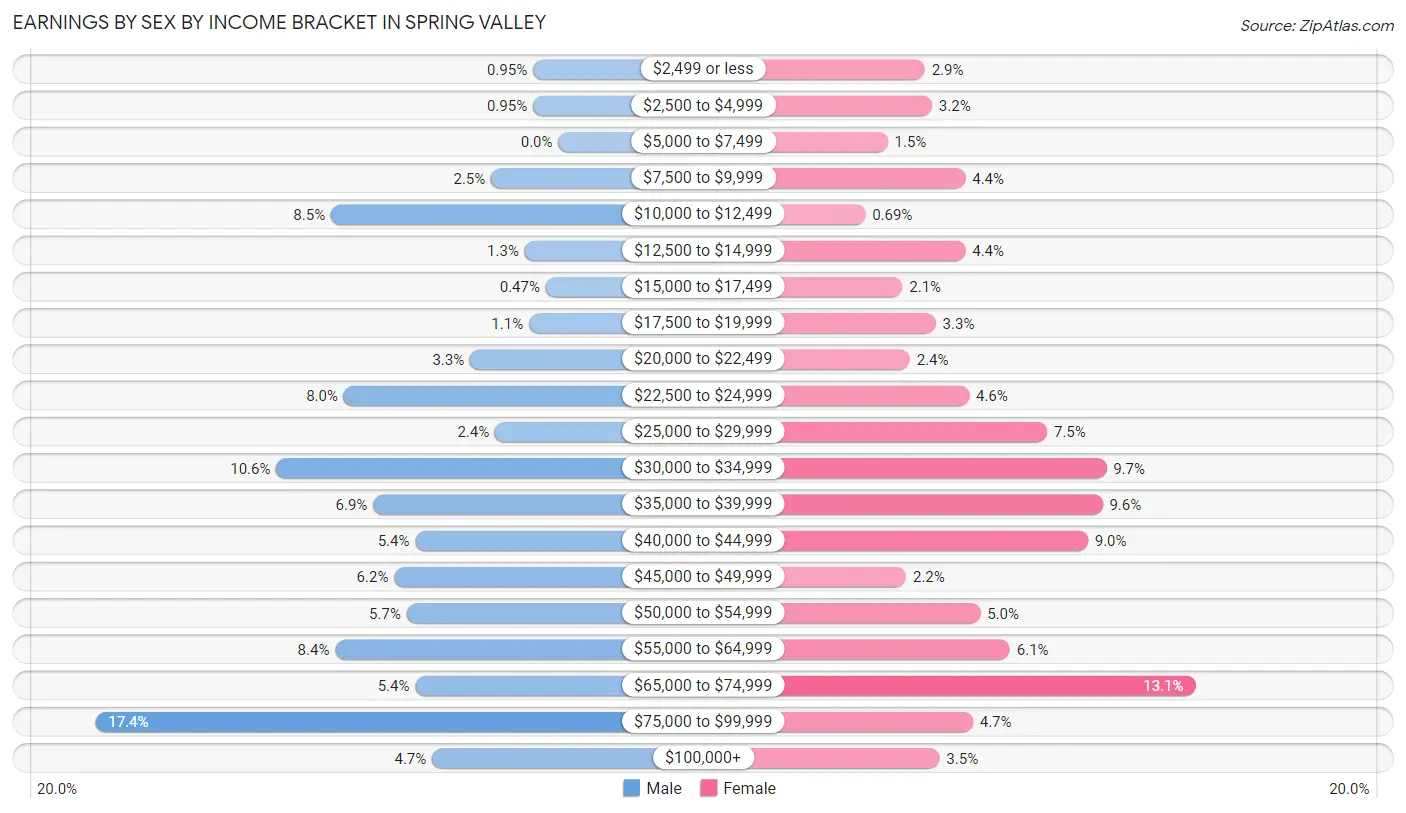
Earnings by Sex by Income Bracket in Spring Valley
The most common earnings brackets in Spring Valley are $75,000 to $99,999 for men (110 | 17.3%) and $65,000 to $74,999 for women (94 | 13.1%).
| Income | Male | Female |
| $2,499 or less | 6 (0.9%) | 21 (2.9%) |
| $2,500 to $4,999 | 6 (0.9%) | 23 (3.2%) |
| $5,000 to $7,499 | 0 (0.0%) | 11 (1.5%) |
| $7,500 to $9,999 | 16 (2.5%) | 32 (4.4%) |
| $10,000 to $12,499 | 54 (8.5%) | 5 (0.7%) |
| $12,500 to $14,999 | 8 (1.3%) | 32 (4.4%) |
| $15,000 to $17,499 | 3 (0.5%) | 15 (2.1%) |
| $17,500 to $19,999 | 7 (1.1%) | 24 (3.3%) |
| $20,000 to $22,499 | 21 (3.3%) | 17 (2.4%) |
| $22,500 to $24,999 | 51 (8.0%) | 33 (4.6%) |
| $25,000 to $29,999 | 15 (2.4%) | 54 (7.5%) |
| $30,000 to $34,999 | 67 (10.6%) | 70 (9.7%) |
| $35,000 to $39,999 | 44 (6.9%) | 69 (9.6%) |
| $40,000 to $44,999 | 34 (5.4%) | 65 (9.0%) |
| $45,000 to $49,999 | 39 (6.1%) | 16 (2.2%) |
| $50,000 to $54,999 | 36 (5.7%) | 36 (5.0%) |
| $55,000 to $64,999 | 53 (8.4%) | 44 (6.1%) |
| $65,000 to $74,999 | 34 (5.4%) | 94 (13.1%) |
| $75,000 to $99,999 | 110 (17.3%) | 34 (4.7%) |
| $100,000+ | 30 (4.7%) | 25 (3.5%) |
| Total | 634 (100.0%) | 720 (100.0%) |
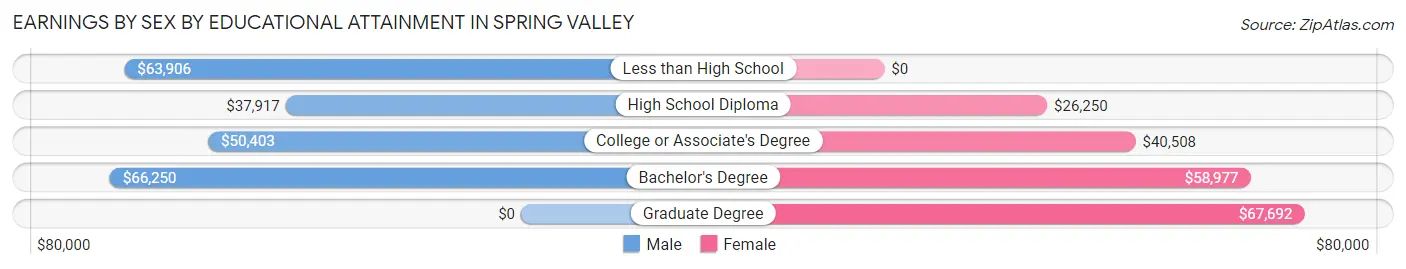
Earnings by Sex by Educational Attainment in Spring Valley
Average earnings in Spring Valley are $46,833 for men and $39,659 for women, a difference of 15.3%. Men with an educational attainment of bachelor's degree enjoy the highest average annual earnings of $66,250, while those with high school diploma education earn the least with $37,917. Women with an educational attainment of graduate degree earn the most with the average annual earnings of $67,692, while those with high school diploma education have the smallest earnings of $26,250.
| Educational Attainment | Male Income | Female Income |
| Less than High School | $63,906 | $0 |
| High School Diploma | $37,917 | $26,250 |
| College or Associate's Degree | $50,403 | $40,508 |
| Bachelor's Degree | $66,250 | $58,977 |
| Graduate Degree | - | - |
| Total | $46,833 | $39,659 |
Family Income in Spring Valley
Family Income Brackets in Spring Valley
According to the Spring Valley family income data, there are 172 families falling into the $100,000 to $149,999 income range, which is the most common income bracket and makes up 27.3% of all families.
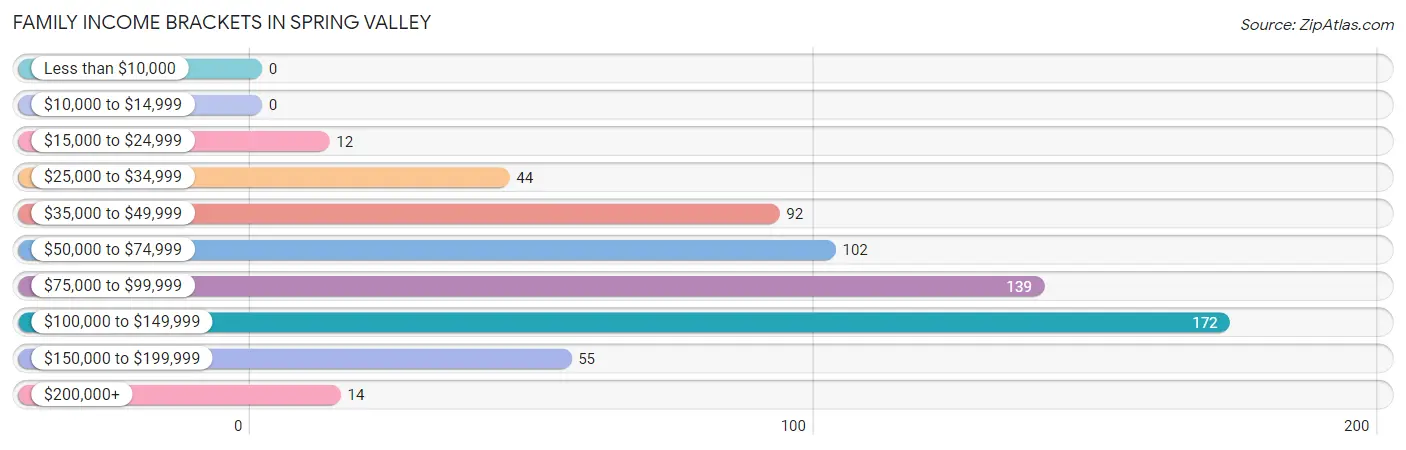
| Income Bracket | # Families | % Families |
| Less than $10,000 | 0 | 0.0% |
| $10,000 to $14,999 | 0 | 0.0% |
| $15,000 to $24,999 | 12 | 1.9% |
| $25,000 to $34,999 | 44 | 7.0% |
| $35,000 to $49,999 | 92 | 14.6% |
| $50,000 to $74,999 | 102 | 16.2% |
| $75,000 to $99,999 | 139 | 22.1% |
| $100,000 to $149,999 | 172 | 27.3% |
| $150,000 to $199,999 | 55 | 8.7% |
| $200,000+ | 14 | 2.2% |
Family Income by Famaliy Size in Spring Valley
4-person families (108 | 17.1%) account for the highest median family income in Spring Valley with $105,313 per family, while 2-person families (351 | 55.7%) have the highest median income of $43,229 per family member.
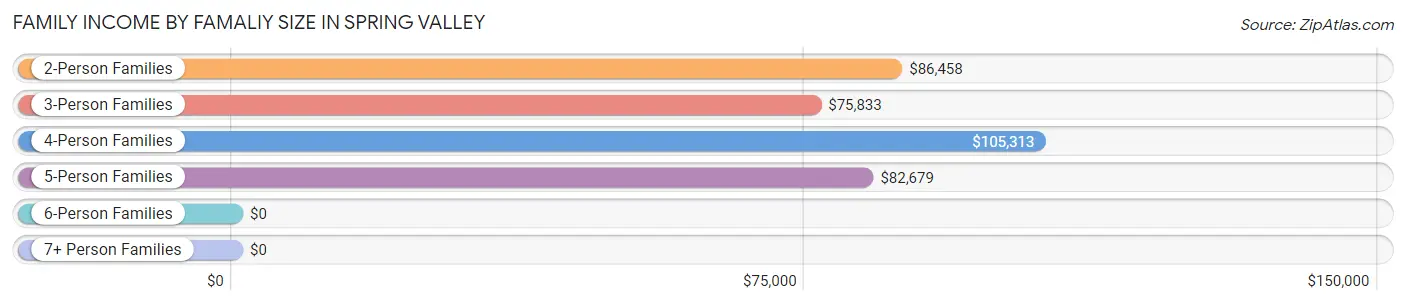
| Income Bracket | # Families | Median Income |
| 2-Person Families | 351 (55.7%) | $86,458 |
| 3-Person Families | 100 (15.9%) | $75,833 |
| 4-Person Families | 108 (17.1%) | $105,313 |
| 5-Person Families | 47 (7.5%) | $82,679 |
| 6-Person Families | 9 (1.4%) | $0 |
| 7+ Person Families | 15 (2.4%) | $0 |
| Total | 630 (100.0%) | $83,125 |
Family Income by Number of Earners in Spring Valley
The median family income in Spring Valley is $83,125, with families comprising 2 earners (300) having the highest median family income of $103,300, while families with no earners (48) have the lowest median family income of $49,375, accounting for 47.6% and 7.6% of families, respectively.
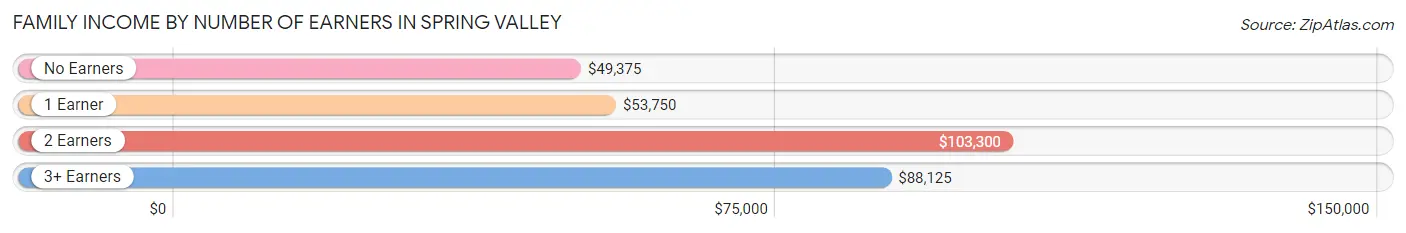
| Number of Earners | # Families | Median Income |
| No Earners | 48 (7.6%) | $49,375 |
| 1 Earner | 218 (34.6%) | $53,750 |
| 2 Earners | 300 (47.6%) | $103,300 |
| 3+ Earners | 64 (10.2%) | $88,125 |
| Total | 630 (100.0%) | $83,125 |
Household Income in Spring Valley
Household Income Brackets in Spring Valley
With 190 households falling in the category, the $100,000 to $149,999 income range is the most frequent in Spring Valley, accounting for 18.4% of all households. In contrast, only 14 households (1.4%) fall into the $200,000+ income bracket, making it the least populous group.
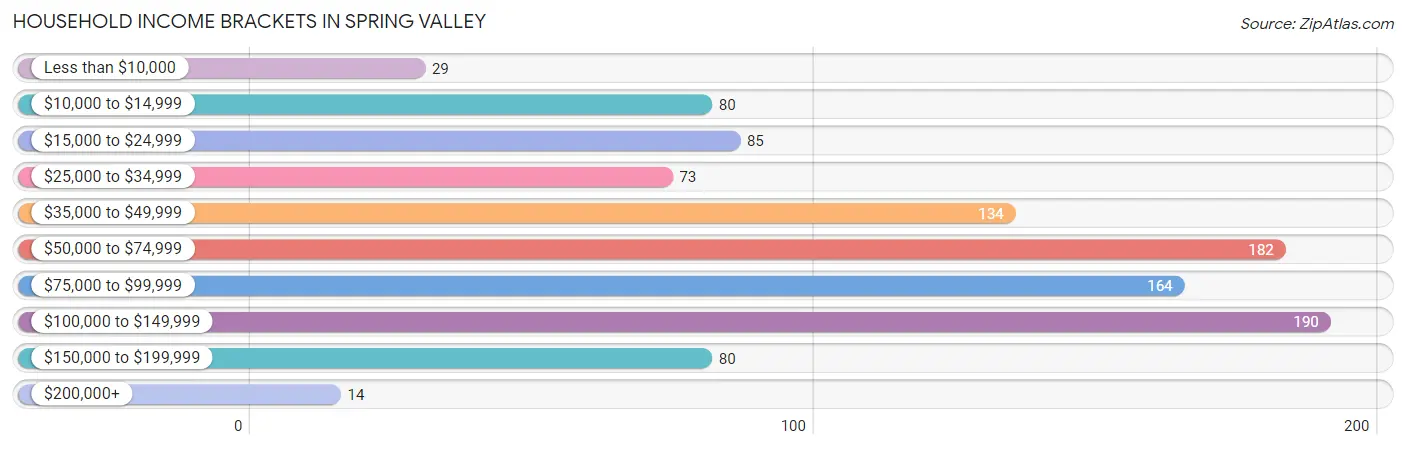
| Income Bracket | # Households | % Households |
| Less than $10,000 | 29 | 2.8% |
| $10,000 to $14,999 | 80 | 7.8% |
| $15,000 to $24,999 | 85 | 8.2% |
| $25,000 to $34,999 | 73 | 7.1% |
| $35,000 to $49,999 | 134 | 13.0% |
| $50,000 to $74,999 | 182 | 17.7% |
| $75,000 to $99,999 | 164 | 15.9% |
| $100,000 to $149,999 | 190 | 18.4% |
| $150,000 to $199,999 | 80 | 7.8% |
| $200,000+ | 14 | 1.4% |
Household Income by Householder Age in Spring Valley
The median household income in Spring Valley is $66,250, with the highest median household income of $93,281 found in the 15 to 24 years age bracket for the primary householder. A total of 51 households (5.0%) fall into this category. Meanwhile, the 65+ years age bracket for the primary householder has the lowest median household income of $45,046, with 293 households (28.4%) in this group.
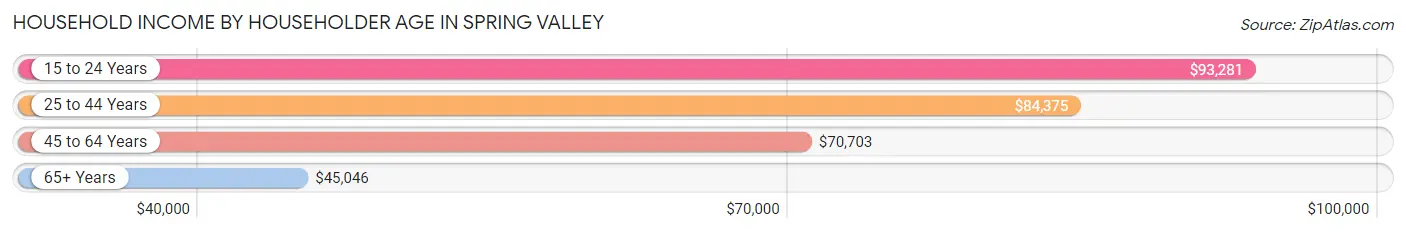
| Income Bracket | # Households | Median Income |
| 15 to 24 Years | 51 (5.0%) | $93,281 |
| 25 to 44 Years | 288 (27.9%) | $84,375 |
| 45 to 64 Years | 399 (38.7%) | $70,703 |
| 65+ Years | 293 (28.4%) | $45,046 |
| Total | 1,031 (100.0%) | $66,250 |
Poverty in Spring Valley
Income Below Poverty by Sex and Age in Spring Valley
With 12.4% poverty level for males and 14.5% for females among the residents of Spring Valley, 6 to 11 year old males and 16 and 17 year old females are the most vulnerable to poverty, with 30 males (31.9%) and 13 females (27.7%) in their respective age groups living below the poverty level.
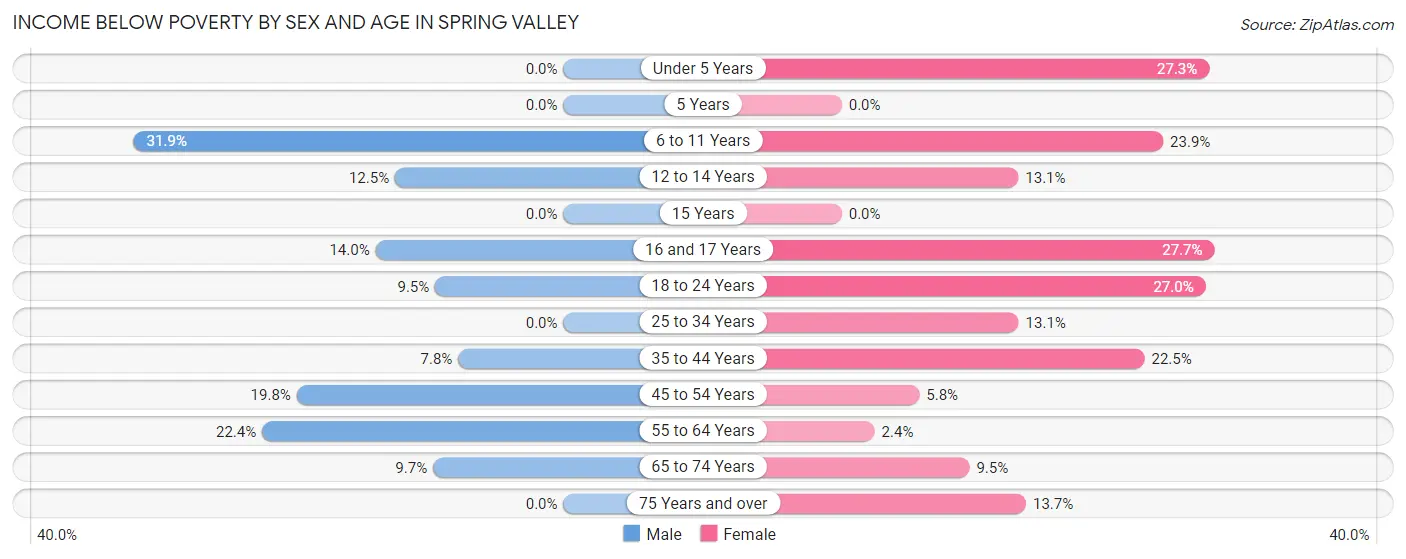
| Age Bracket | Male | Female |
| Under 5 Years | 0 (0.0%) | 21 (27.3%) |
| 5 Years | 0 (0.0%) | 0 (0.0%) |
| 6 to 11 Years | 30 (31.9%) | 21 (23.9%) |
| 12 to 14 Years | 7 (12.5%) | 8 (13.1%) |
| 15 Years | 0 (0.0%) | 0 (0.0%) |
| 16 and 17 Years | 6 (14.0%) | 13 (27.7%) |
| 18 to 24 Years | 12 (9.5%) | 27 (27.0%) |
| 25 to 34 Years | 0 (0.0%) | 26 (13.1%) |
| 35 to 44 Years | 10 (7.8%) | 29 (22.5%) |
| 45 to 54 Years | 20 (19.8%) | 8 (5.8%) |
| 55 to 64 Years | 49 (22.4%) | 4 (2.4%) |
| 65 to 74 Years | 12 (9.7%) | 11 (9.5%) |
| 75 Years and over | 0 (0.0%) | 13 (13.7%) |
| Total | 146 (12.4%) | 181 (14.5%) |
Income Above Poverty by Sex and Age in Spring Valley
According to the poverty statistics in Spring Valley, males aged under 5 years and females aged 5 years are the age groups that are most secure financially, with 100.0% of males and 100.0% of females in these age groups living above the poverty line.
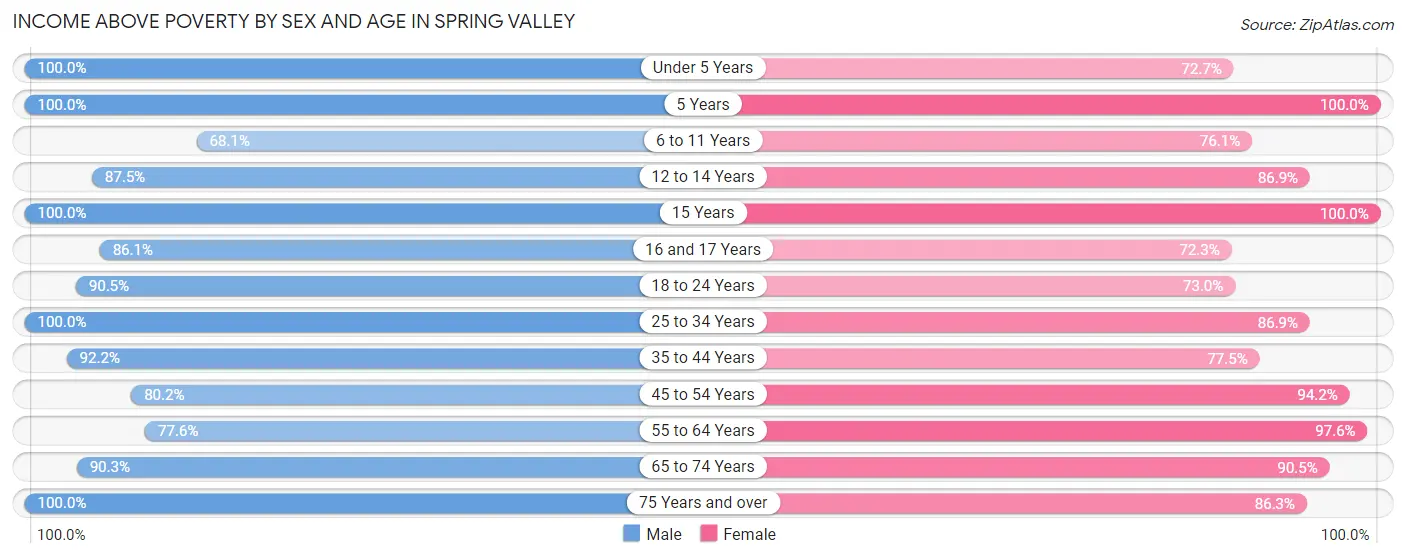
| Age Bracket | Male | Female |
| Under 5 Years | 43 (100.0%) | 56 (72.7%) |
| 5 Years | 10 (100.0%) | 26 (100.0%) |
| 6 to 11 Years | 64 (68.1%) | 67 (76.1%) |
| 12 to 14 Years | 49 (87.5%) | 53 (86.9%) |
| 15 Years | 29 (100.0%) | 8 (100.0%) |
| 16 and 17 Years | 37 (86.1%) | 34 (72.3%) |
| 18 to 24 Years | 114 (90.5%) | 73 (73.0%) |
| 25 to 34 Years | 137 (100.0%) | 172 (86.9%) |
| 35 to 44 Years | 118 (92.2%) | 100 (77.5%) |
| 45 to 54 Years | 81 (80.2%) | 131 (94.2%) |
| 55 to 64 Years | 170 (77.6%) | 160 (97.6%) |
| 65 to 74 Years | 112 (90.3%) | 105 (90.5%) |
| 75 Years and over | 70 (100.0%) | 82 (86.3%) |
| Total | 1,034 (87.6%) | 1,067 (85.5%) |
Income Below Poverty Among Married-Couple Families in Spring Valley
The poverty statistics for married-couple families in Spring Valley show that 1.5% or 7 of the total 453 families live below the poverty line. Families with 3 or 4 children have the highest poverty rate of 12.3%, comprising of 7 families. On the other hand, families with no children have the lowest poverty rate of 0.0%, which includes 0 families.
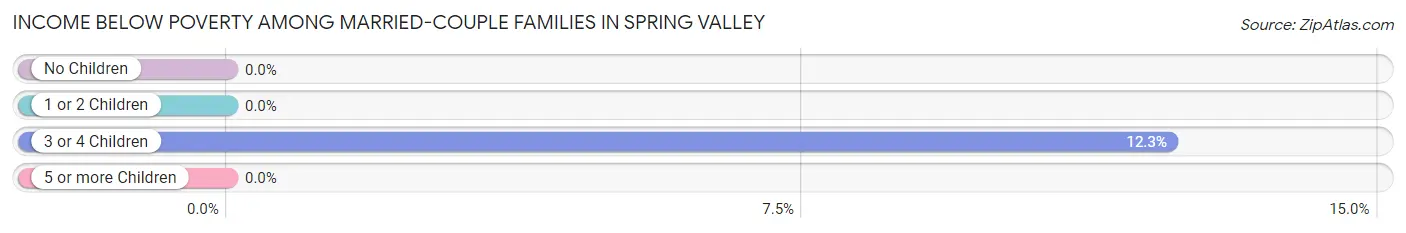
| Children | Above Poverty | Below Poverty |
| No Children | 286 (100.0%) | 0 (0.0%) |
| 1 or 2 Children | 102 (100.0%) | 0 (0.0%) |
| 3 or 4 Children | 50 (87.7%) | 7 (12.3%) |
| 5 or more Children | 8 (100.0%) | 0 (0.0%) |
| Total | 446 (98.5%) | 7 (1.5%) |
Income Below Poverty Among Single-Parent Households in Spring Valley
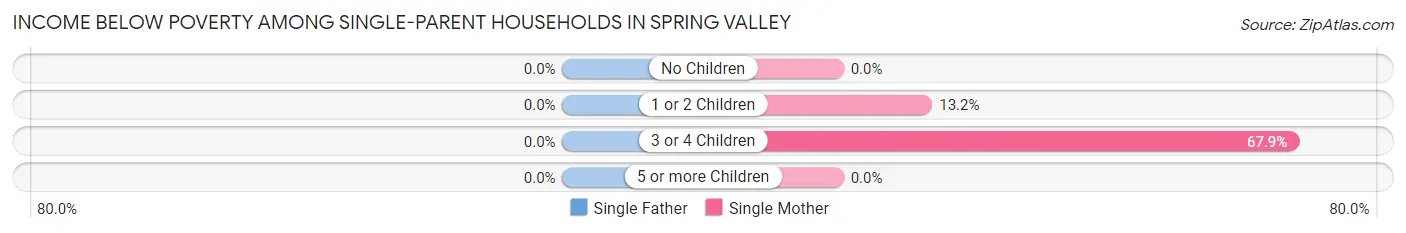
| Children | Single Father | Single Mother |
| No Children | 0 (0.0%) | 0 (0.0%) |
| 1 or 2 Children | 0 (0.0%) | 7 (13.2%) |
| 3 or 4 Children | 0 (0.0%) | 19 (67.9%) |
| 5 or more Children | 0 (0.0%) | 0 (0.0%) |
| Total | 0 (0.0%) | 26 (19.3%) |
Income Below Poverty Among Married-Couple vs Single-Parent Households in Spring Valley
The poverty data for Spring Valley shows that 7 of the married-couple family households (1.5%) and 26 of the single-parent households (14.7%) are living below the poverty level. Within the married-couple family households, those with 3 or 4 children have the highest poverty rate, with 7 households (12.3%) falling below the poverty line. Among the single-parent households, those with 3 or 4 children have the highest poverty rate, with 19 household (67.9%) living below poverty.
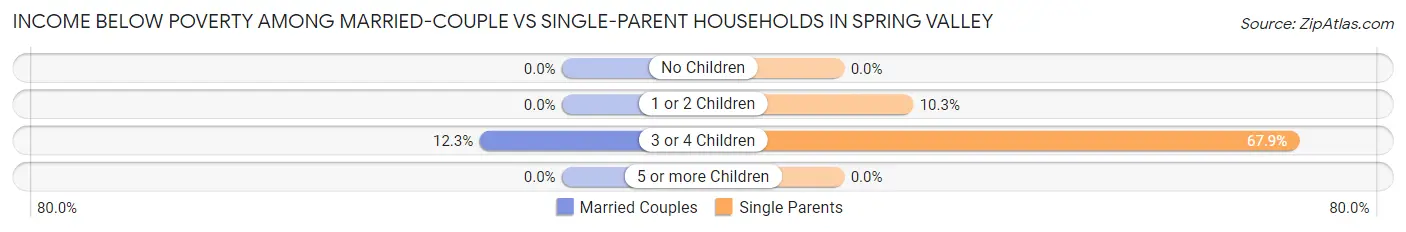
| Children | Married-Couple Families | Single-Parent Households |
| No Children | 0 (0.0%) | 0 (0.0%) |
| 1 or 2 Children | 0 (0.0%) | 7 (10.3%) |
| 3 or 4 Children | 7 (12.3%) | 19 (67.9%) |
| 5 or more Children | 0 (0.0%) | 0 (0.0%) |
| Total | 7 (1.5%) | 26 (14.7%) |
Race in Spring Valley
The most populous races in Spring Valley are White / Caucasian (2,373 | 94.5%), Two or more Races (104 | 4.1%), and Hispanic or Latino (75 | 3.0%).
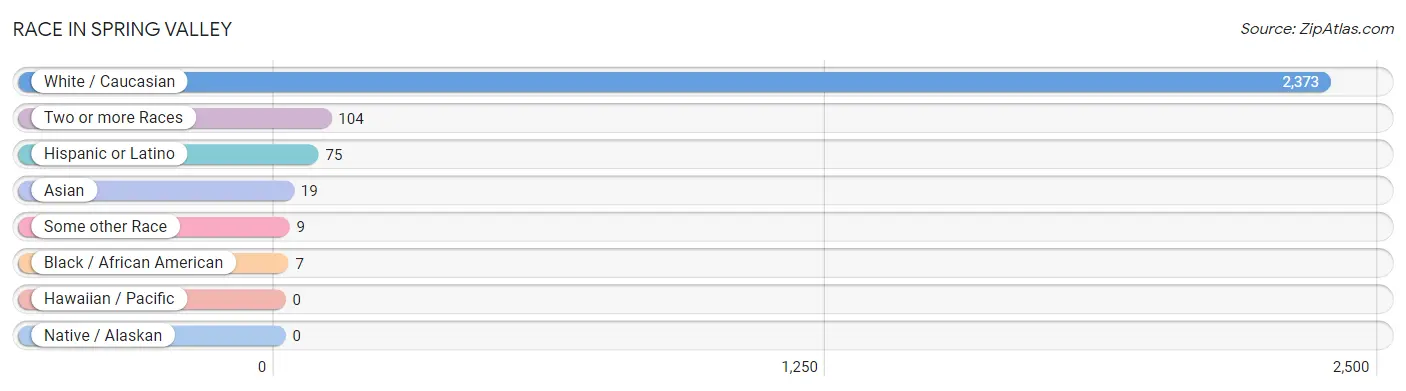
| Race | # Population | % Population |
| Asian | 19 | 0.8% |
| Black / African American | 7 | 0.3% |
| Hawaiian / Pacific | 0 | 0.0% |
| Hispanic or Latino | 75 | 3.0% |
| Native / Alaskan | 0 | 0.0% |
| White / Caucasian | 2,373 | 94.5% |
| Two or more Races | 104 | 4.1% |
| Some other Race | 9 | 0.4% |
| Total | 2,512 | 100.0% |
Ancestry in Spring Valley
The most populous ancestries reported in Spring Valley are German (811 | 32.3%), Norwegian (660 | 26.3%), Irish (216 | 8.6%), American (198 | 7.9%), and English (146 | 5.8%), together accounting for 80.8% of all Spring Valley residents.
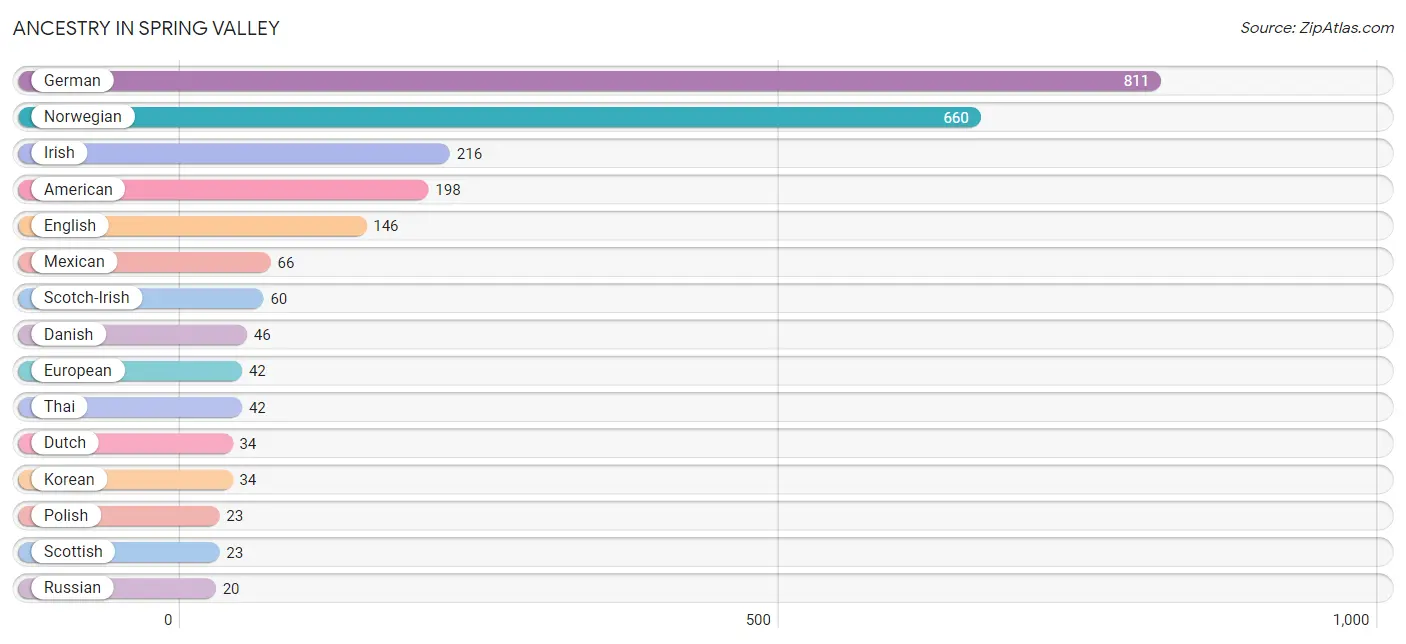
| Ancestry | # Population | % Population |
| American | 198 | 7.9% |
| Cherokee | 7 | 0.3% |
| Czech | 10 | 0.4% |
| Czechoslovakian | 8 | 0.3% |
| Danish | 46 | 1.8% |
| Dutch | 34 | 1.3% |
| English | 146 | 5.8% |
| European | 42 | 1.7% |
| French | 17 | 0.7% |
| French Canadian | 5 | 0.2% |
| German | 811 | 32.3% |
| Irish | 216 | 8.6% |
| Italian | 11 | 0.4% |
| Korean | 34 | 1.3% |
| Luxembourger | 8 | 0.3% |
| Mexican | 66 | 2.6% |
| Norwegian | 660 | 26.3% |
| Polish | 23 | 0.9% |
| Russian | 20 | 0.8% |
| Scandinavian | 14 | 0.6% |
| Scotch-Irish | 60 | 2.4% |
| Scottish | 23 | 0.9% |
| Swedish | 20 | 0.8% |
| Swiss | 3 | 0.1% |
| Thai | 42 | 1.7% |
| Welsh | 4 | 0.2% | View All 26 Rows |
Immigrants in Spring Valley
The most numerous immigrant groups reported in Spring Valley came from Asia (19 | 0.8%), Europe (17 | 0.7%), Germany (13 | 0.5%), Western Europe (13 | 0.5%), and India (12 | 0.5%), together accounting for 3.0% of all Spring Valley residents.
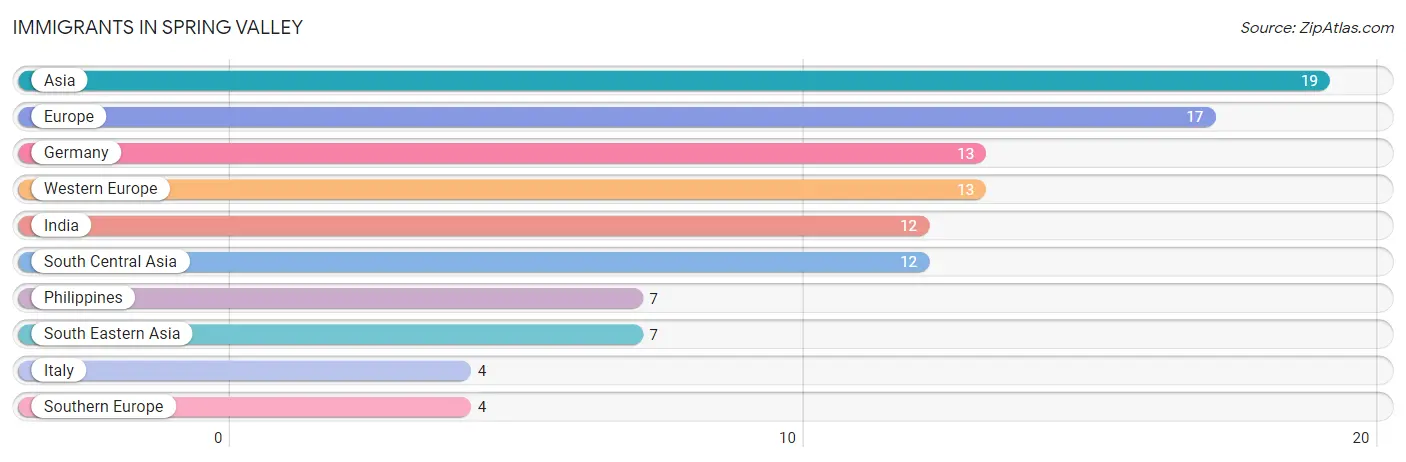
| Immigration Origin | # Population | % Population |
| Asia | 19 | 0.8% |
| Europe | 17 | 0.7% |
| Germany | 13 | 0.5% |
| India | 12 | 0.5% |
| Italy | 4 | 0.2% |
| Philippines | 7 | 0.3% |
| South Central Asia | 12 | 0.5% |
| South Eastern Asia | 7 | 0.3% |
| Southern Europe | 4 | 0.2% |
| Western Europe | 13 | 0.5% | View All 10 Rows |
Sex and Age in Spring Valley
Sex and Age in Spring Valley
The most populous age groups in Spring Valley are 60 to 64 Years (123 | 10.1%) for men and 5 to 9 Years (106 | 8.2%) for women.
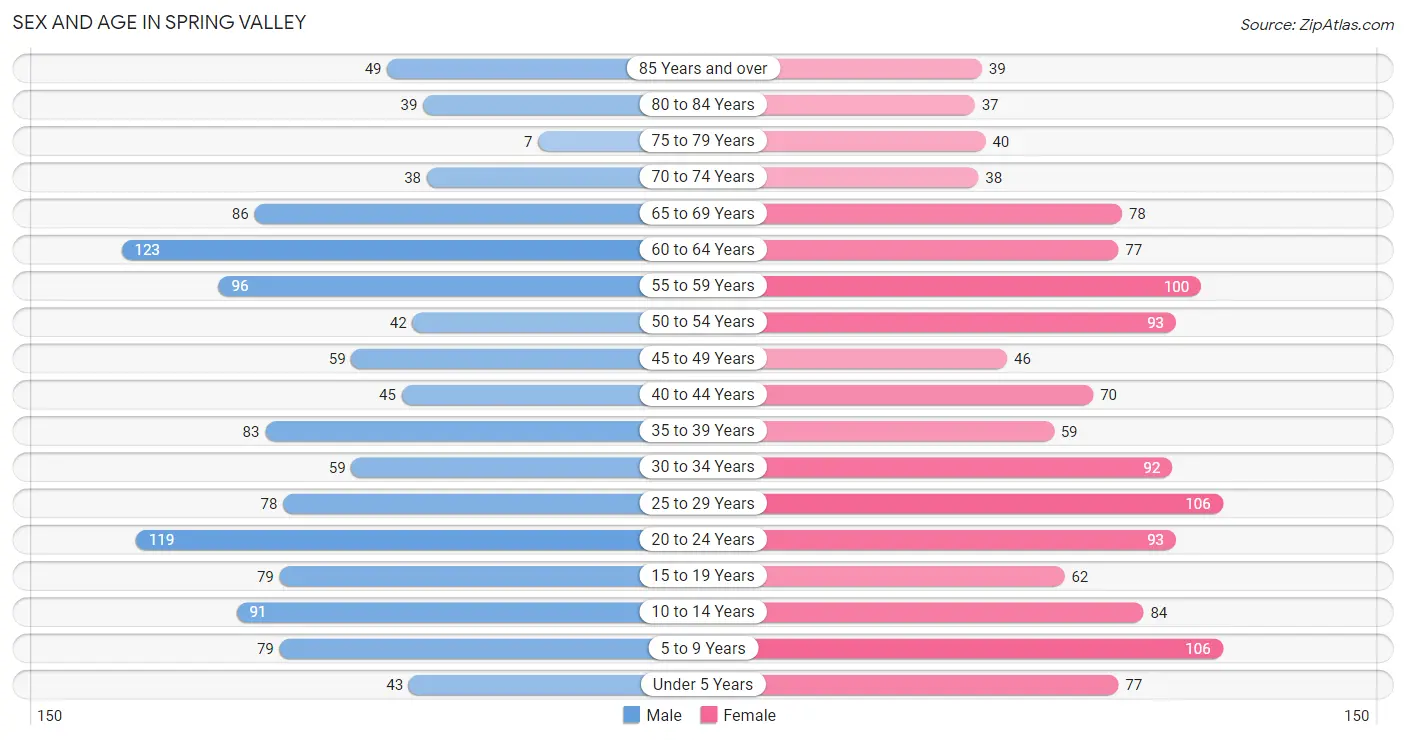
| Age Bracket | Male | Female |
| Under 5 Years | 43 (3.5%) | 77 (5.9%) |
| 5 to 9 Years | 79 (6.5%) | 106 (8.2%) |
| 10 to 14 Years | 91 (7.5%) | 84 (6.5%) |
| 15 to 19 Years | 79 (6.5%) | 62 (4.8%) |
| 20 to 24 Years | 119 (9.8%) | 93 (7.2%) |
| 25 to 29 Years | 78 (6.4%) | 106 (8.2%) |
| 30 to 34 Years | 59 (4.9%) | 92 (7.1%) |
| 35 to 39 Years | 83 (6.8%) | 59 (4.5%) |
| 40 to 44 Years | 45 (3.7%) | 70 (5.4%) |
| 45 to 49 Years | 59 (4.9%) | 46 (3.5%) |
| 50 to 54 Years | 42 (3.5%) | 93 (7.2%) |
| 55 to 59 Years | 96 (7.9%) | 100 (7.7%) |
| 60 to 64 Years | 123 (10.1%) | 77 (5.9%) |
| 65 to 69 Years | 86 (7.1%) | 78 (6.0%) |
| 70 to 74 Years | 38 (3.1%) | 38 (2.9%) |
| 75 to 79 Years | 7 (0.6%) | 40 (3.1%) |
| 80 to 84 Years | 39 (3.2%) | 37 (2.9%) |
| 85 Years and over | 49 (4.0%) | 39 (3.0%) |
| Total | 1,215 (100.0%) | 1,297 (100.0%) |
Families and Households in Spring Valley
Median Family Size in Spring Valley
The median family size in Spring Valley is 2.94 persons per family, with married-couple families (453 | 71.9%) accounting for the largest median family size of 3.02 persons per family. On the other hand, single male/father families (42 | 6.7%) represent the smallest median family size with 2.05 persons per family.
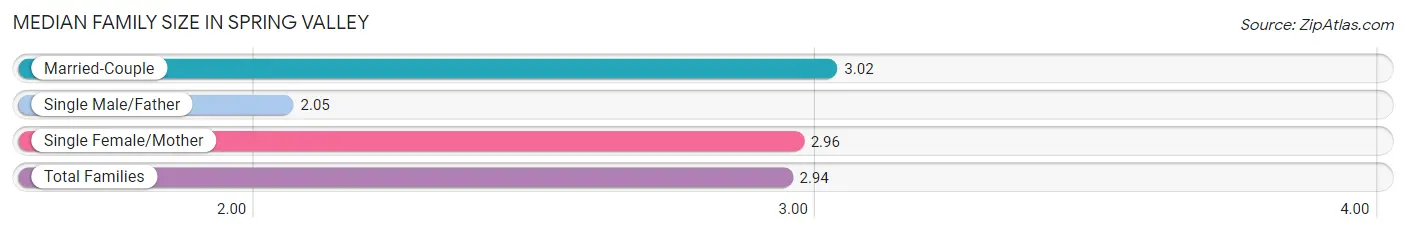
| Family Type | # Families | Family Size |
| Married-Couple | 453 (71.9%) | 3.02 |
| Single Male/Father | 42 (6.7%) | 2.05 |
| Single Female/Mother | 135 (21.4%) | 2.96 |
| Total Families | 630 (100.0%) | 2.94 |
Median Household Size in Spring Valley
The median household size in Spring Valley is 2.38 persons per household, with single male/father households (42 | 4.1%) accounting for the largest median household size of 3.57 persons per household. non-family households (401 | 38.9%) represent the smallest median household size with 1.21 persons per household.
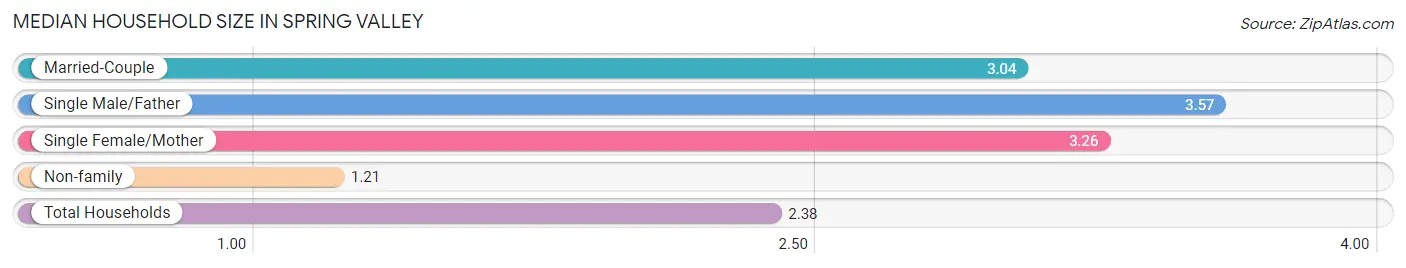
| Household Type | # Households | Household Size |
| Married-Couple | 453 (43.9%) | 3.04 |
| Single Male/Father | 42 (4.1%) | 3.57 |
| Single Female/Mother | 135 (13.1%) | 3.26 |
| Non-family | 401 (38.9%) | 1.21 |
| Total Households | 1,031 (100.0%) | 2.38 |
Household Size by Marriage Status in Spring Valley
Out of a total of 1,031 households in Spring Valley, 630 (61.1%) are family households, while 401 (38.9%) are nonfamily households. The most numerous type of family households are 2-person households, comprising 309, and the most common type of nonfamily households are 1-person households, comprising 344.
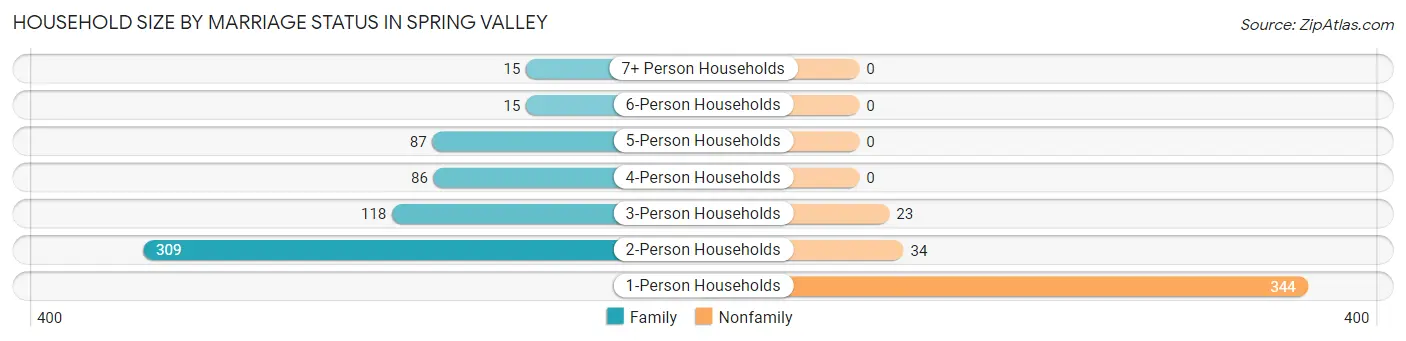
| Household Size | Family Households | Nonfamily Households |
| 1-Person Households | - | 344 (33.4%) |
| 2-Person Households | 309 (30.0%) | 34 (3.3%) |
| 3-Person Households | 118 (11.5%) | 23 (2.2%) |
| 4-Person Households | 86 (8.3%) | 0 (0.0%) |
| 5-Person Households | 87 (8.4%) | 0 (0.0%) |
| 6-Person Households | 15 (1.5%) | 0 (0.0%) |
| 7+ Person Households | 15 (1.5%) | 0 (0.0%) |
| Total | 630 (61.1%) | 401 (38.9%) |
Female Fertility in Spring Valley
Fertility by Age in Spring Valley
Average fertility rate in Spring Valley is 37.0 births per 1,000 women. Women in the age bracket of 20 to 34 years have the highest fertility rate with 69.0 births per 1,000 women. Women in the age bracket of 20 to 34 years acount for 100.0% of all women with births.
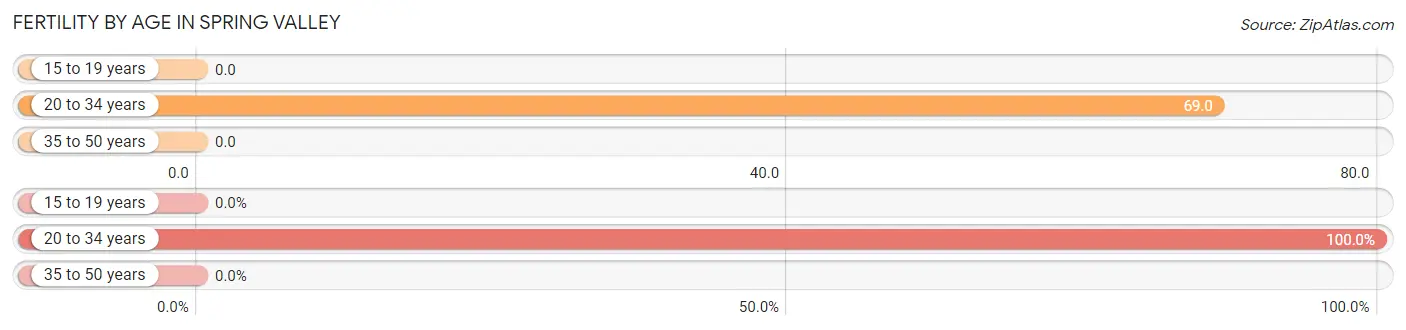
| Age Bracket | Women with Births | Births / 1,000 Women |
| 15 to 19 years | 0 (0.0%) | 0.0 |
| 20 to 34 years | 20 (100.0%) | 69.0 |
| 35 to 50 years | 0 (0.0%) | 0.0 |
| Total | 20 (100.0%) | 37.0 |
Fertility by Age by Marriage Status in Spring Valley
50.0% of women with births (20) in Spring Valley are married. The highest percentage of unmarried women with births falls into 20 to 34 years age bracket with 50.0% of them unmarried at the time of birth, while the lowest percentage of unmarried women with births belong to 20 to 34 years age bracket with 50.0% of them unmarried.
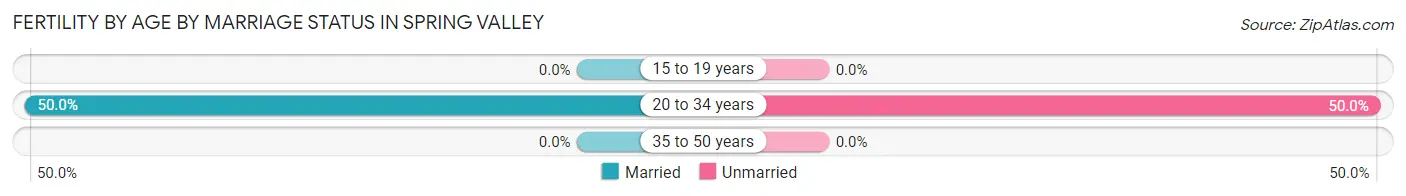
| Age Bracket | Married | Unmarried |
| 15 to 19 years | 0 (0.0%) | 0 (0.0%) |
| 20 to 34 years | 10 (50.0%) | 10 (50.0%) |
| 35 to 50 years | 0 (0.0%) | 0 (0.0%) |
| Total | 10 (50.0%) | 10 (50.0%) |
Fertility by Education in Spring Valley
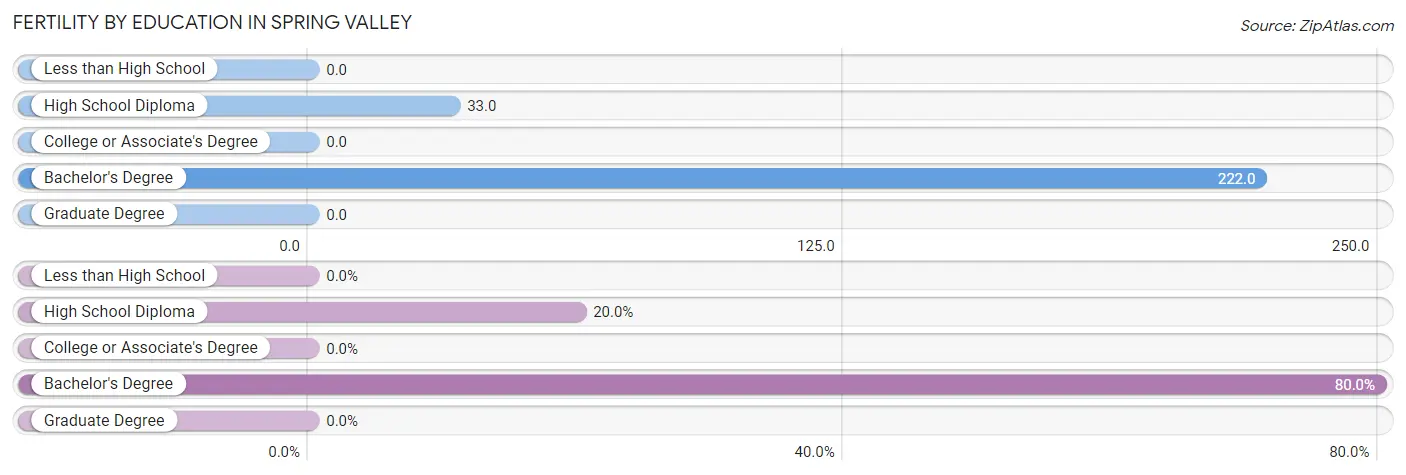
| Educational Attainment | Women with Births | Births / 1,000 Women |
| Less than High School | 0 (0.0%) | 0.0 |
| High School Diploma | 4 (20.0%) | 33.0 |
| College or Associate's Degree | 0 (0.0%) | 0.0 |
| Bachelor's Degree | 16 (80.0%) | 222.0 |
| Graduate Degree | 0 (0.0%) | 0.0 |
| Total | 20 (100.0%) | 37.0 |
Fertility by Education by Marriage Status in Spring Valley
50.0% of women with births in Spring Valley are unmarried. Women with the educational attainment of high school diploma are most likely to be married with 100.0% of them married at childbirth, while women with the educational attainment of bachelor's degree are least likely to be married with 62.5% of them unmarried at childbirth.
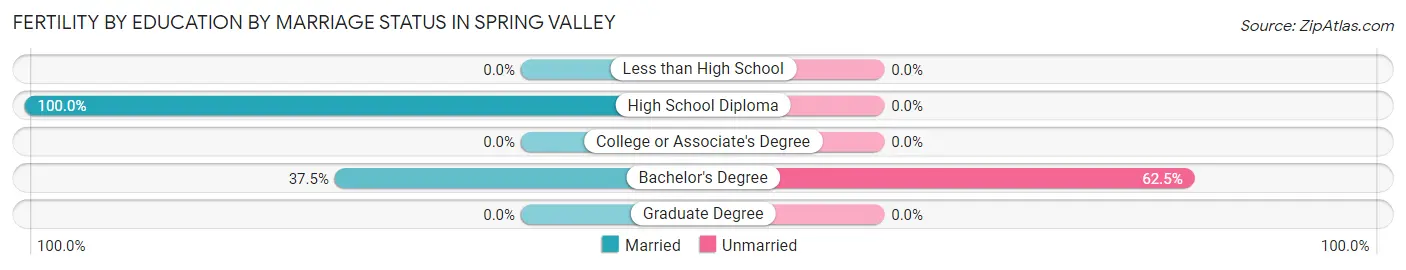
| Educational Attainment | Married | Unmarried |
| Less than High School | 0 (0.0%) | 0 (0.0%) |
| High School Diploma | 4 (100.0%) | 0 (0.0%) |
| College or Associate's Degree | 0 (0.0%) | 0 (0.0%) |
| Bachelor's Degree | 6 (37.5%) | 10 (62.5%) |
| Graduate Degree | 0 (0.0%) | 0 (0.0%) |
| Total | 10 (50.0%) | 10 (50.0%) |
Employment Characteristics in Spring Valley
Employment by Class of Employer in Spring Valley
Among the 1,235 employed individuals in Spring Valley, private company employees (724 | 58.6%), not-for-profit organizations (284 | 23.0%), and self-employed (not incorporated) (111 | 9.0%) make up the most common classes of employment.
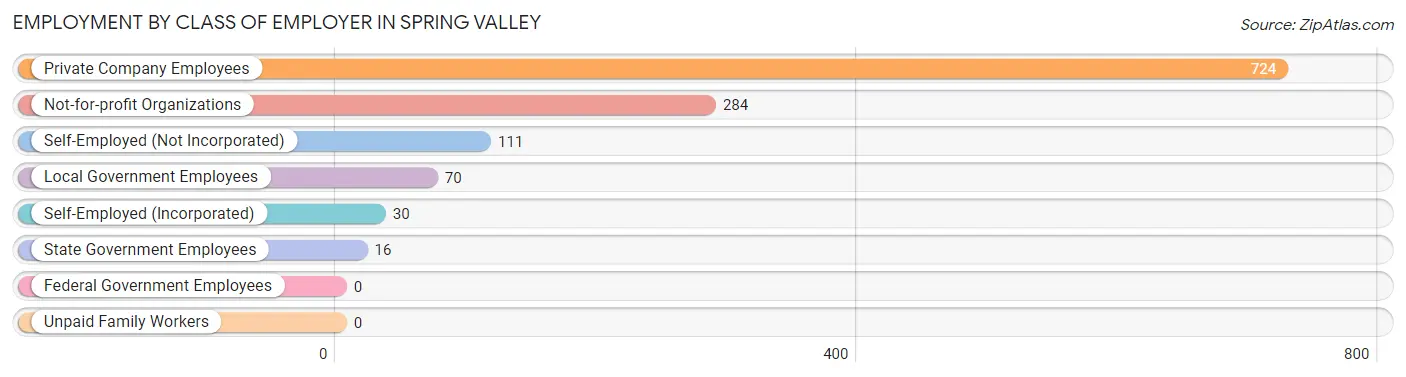
| Employer Class | # Employees | % Employees |
| Private Company Employees | 724 | 58.6% |
| Self-Employed (Incorporated) | 30 | 2.4% |
| Self-Employed (Not Incorporated) | 111 | 9.0% |
| Not-for-profit Organizations | 284 | 23.0% |
| Local Government Employees | 70 | 5.7% |
| State Government Employees | 16 | 1.3% |
| Federal Government Employees | 0 | 0.0% |
| Unpaid Family Workers | 0 | 0.0% |
| Total | 1,235 | 100.0% |
Employment Status by Age in Spring Valley
According to the labor force statistics for Spring Valley, out of the total population over 16 years of age (1,995), 67.9% or 1,355 individuals are in the labor force, with 3.9% or 53 of them unemployed. The age group with the highest labor force participation rate is 25 to 29 years, with 100.0% or 184 individuals in the labor force. Within the labor force, the 20 to 24 years age range has the highest percentage of unemployed individuals, with 13.1% or 26 of them being unemployed.
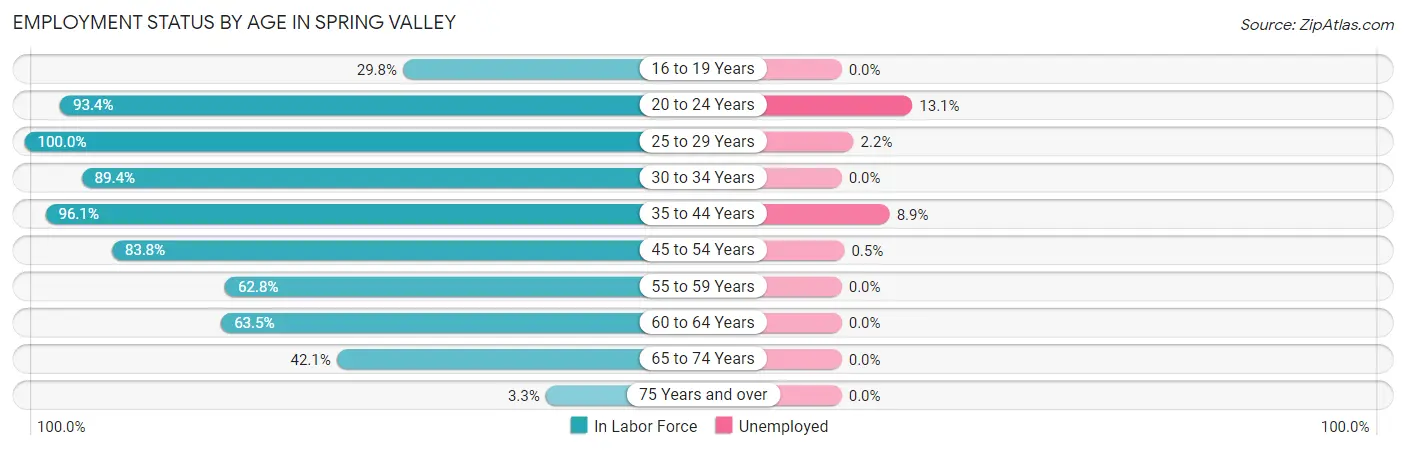
| Age Bracket | In Labor Force | Unemployed |
| 16 to 19 Years | 31 (29.8%) | 0 (0.0%) |
| 20 to 24 Years | 198 (93.4%) | 26 (13.1%) |
| 25 to 29 Years | 184 (100.0%) | 4 (2.2%) |
| 30 to 34 Years | 135 (89.4%) | 0 (0.0%) |
| 35 to 44 Years | 247 (96.1%) | 22 (8.9%) |
| 45 to 54 Years | 201 (83.8%) | 1 (0.5%) |
| 55 to 59 Years | 123 (62.8%) | 0 (0.0%) |
| 60 to 64 Years | 127 (63.5%) | 0 (0.0%) |
| 65 to 74 Years | 101 (42.1%) | 0 (0.0%) |
| 75 Years and over | 7 (3.3%) | 0 (0.0%) |
| Total | 1,355 (67.9%) | 53 (3.9%) |
Employment Status by Educational Attainment in Spring Valley
According to labor force statistics for Spring Valley, 82.8% of individuals (1,017) out of the total population between 25 and 64 years of age (1,228) are in the labor force, with 2.7% or 27 of them being unemployed. The group with the highest labor force participation rate are those with the educational attainment of bachelor's degree or higher, with 97.1% or 204 individuals in the labor force. Within the labor force, individuals with less than high school education have the highest percentage of unemployment, with 40.6% or 26 of them being unemployed.
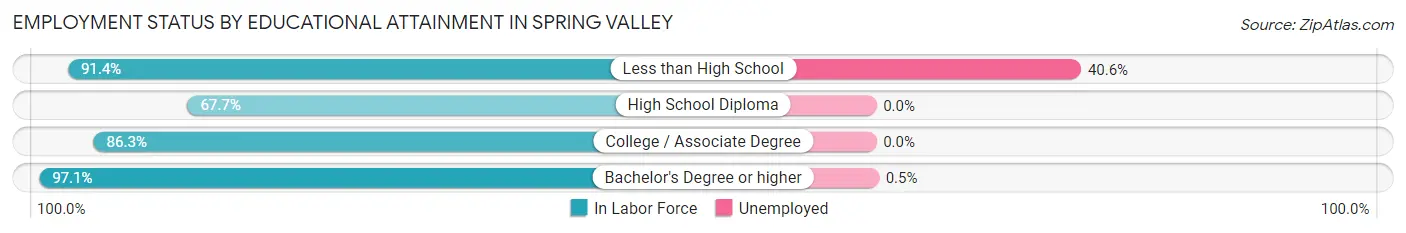
| Educational Attainment | In Labor Force | Unemployed |
| Less than High School | 64 (91.4%) | 28 (40.6%) |
| High School Diploma | 252 (67.7%) | 0 (0.0%) |
| College / Associate Degree | 497 (86.3%) | 0 (0.0%) |
| Bachelor's Degree or higher | 204 (97.1%) | 1 (0.5%) |
| Total | 1,017 (82.8%) | 33 (2.7%) |
Employment Occupations by Sex in Spring Valley
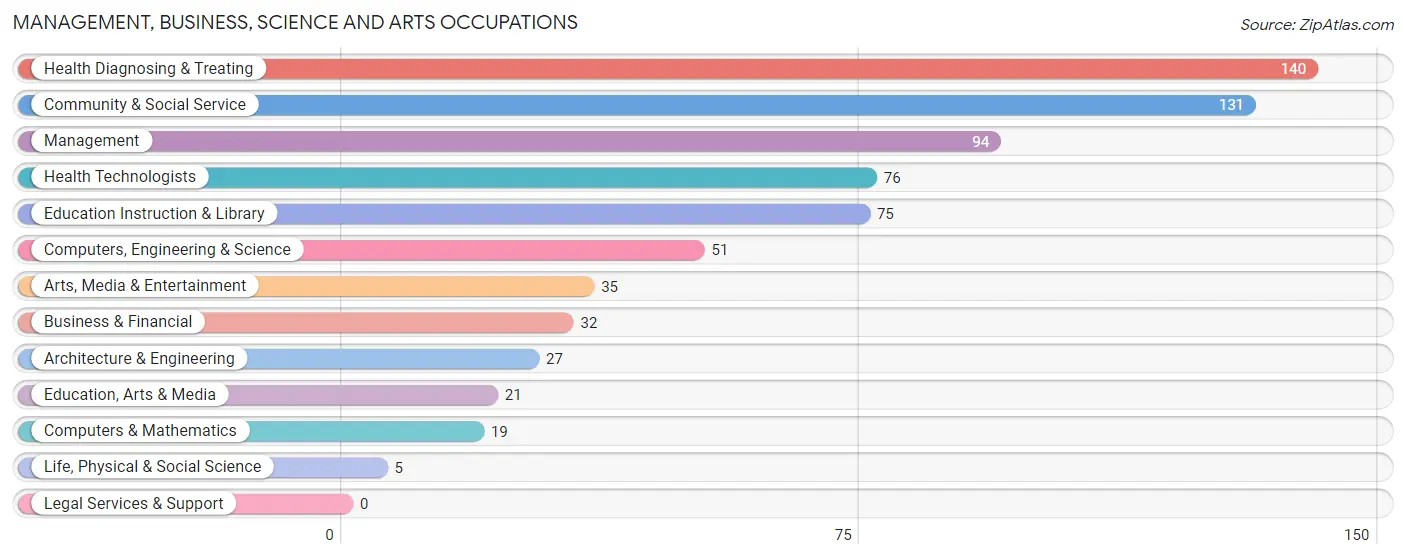
Management, Business, Science and Arts Occupations
The most common Management, Business, Science and Arts occupations in Spring Valley are Health Diagnosing & Treating (140 | 10.8%), Community & Social Service (131 | 10.1%), Management (94 | 7.2%), Health Technologists (76 | 5.8%), and Education Instruction & Library (75 | 5.8%).
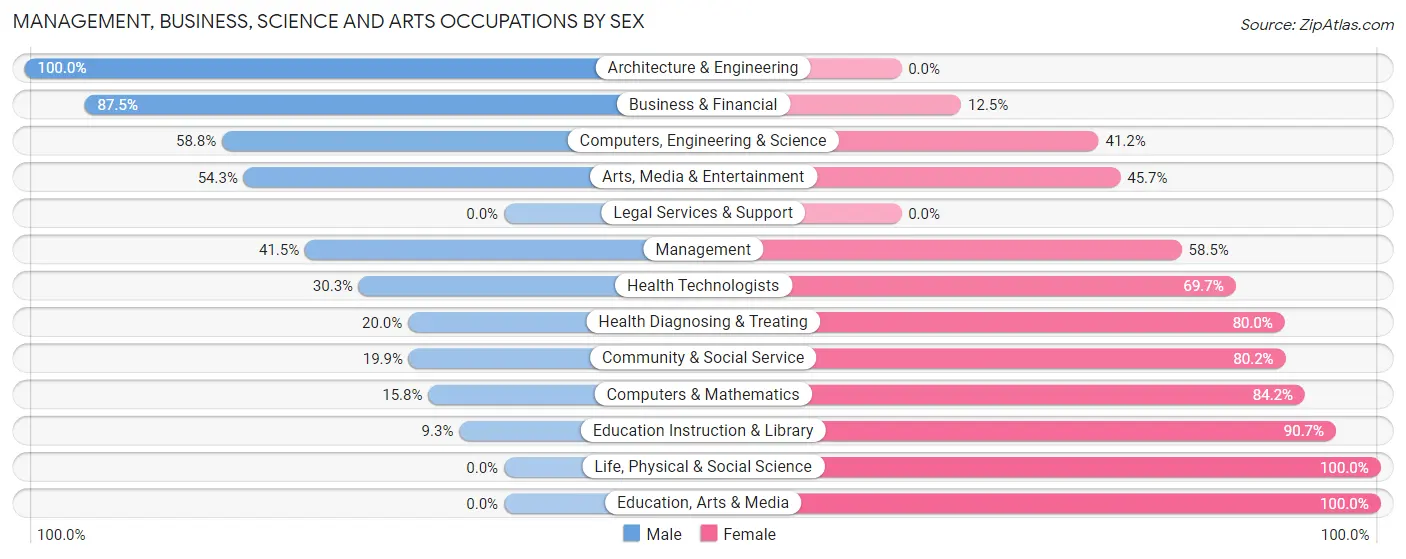
Management, Business, Science and Arts Occupations by Sex
Within the Management, Business, Science and Arts occupations in Spring Valley, the most male-oriented occupations are Architecture & Engineering (100.0%), Business & Financial (87.5%), and Computers, Engineering & Science (58.8%), while the most female-oriented occupations are Life, Physical & Social Science (100.0%), Education, Arts & Media (100.0%), and Education Instruction & Library (90.7%).
| Occupation | Male | Female |
| Management | 39 (41.5%) | 55 (58.5%) |
| Business & Financial | 28 (87.5%) | 4 (12.5%) |
| Computers, Engineering & Science | 30 (58.8%) | 21 (41.2%) |
| Computers & Mathematics | 3 (15.8%) | 16 (84.2%) |
| Architecture & Engineering | 27 (100.0%) | 0 (0.0%) |
| Life, Physical & Social Science | 0 (0.0%) | 5 (100.0%) |
| Community & Social Service | 26 (19.9%) | 105 (80.1%) |
| Education, Arts & Media | 0 (0.0%) | 21 (100.0%) |
| Legal Services & Support | 0 (0.0%) | 0 (0.0%) |
| Education Instruction & Library | 7 (9.3%) | 68 (90.7%) |
| Arts, Media & Entertainment | 19 (54.3%) | 16 (45.7%) |
| Health Diagnosing & Treating | 28 (20.0%) | 112 (80.0%) |
| Health Technologists | 23 (30.3%) | 53 (69.7%) |
| Total (Category) | 151 (33.7%) | 297 (66.3%) |
| Total (Overall) | 604 (46.4%) | 697 (53.6%) |
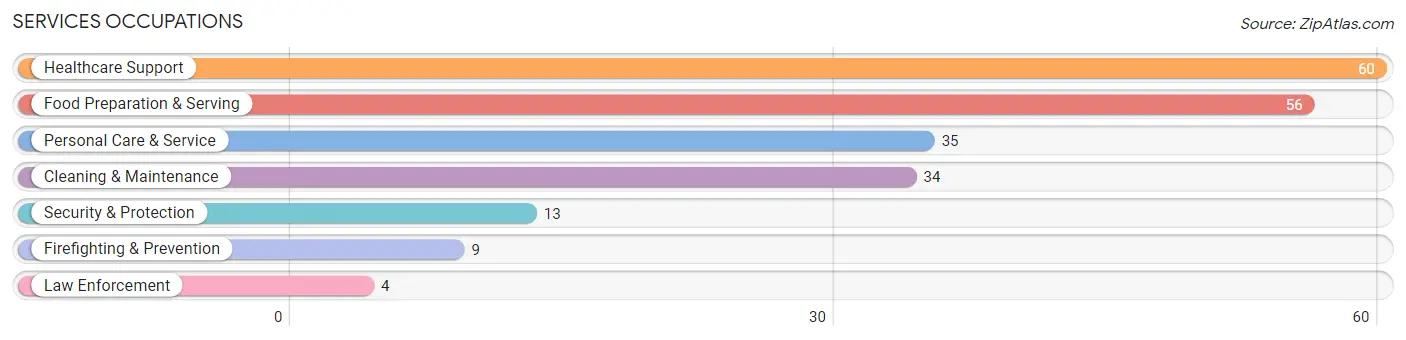
Services Occupations
The most common Services occupations in Spring Valley are Healthcare Support (60 | 4.6%), Food Preparation & Serving (56 | 4.3%), Personal Care & Service (35 | 2.7%), Cleaning & Maintenance (34 | 2.6%), and Security & Protection (13 | 1.0%).
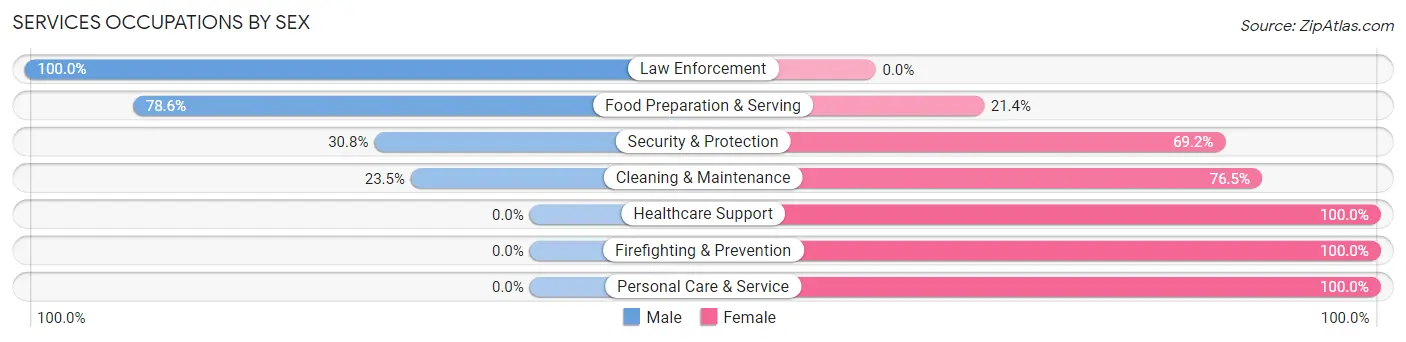
Services Occupations by Sex
Within the Services occupations in Spring Valley, the most male-oriented occupations are Law Enforcement (100.0%), Food Preparation & Serving (78.6%), and Security & Protection (30.8%), while the most female-oriented occupations are Healthcare Support (100.0%), Firefighting & Prevention (100.0%), and Personal Care & Service (100.0%).
| Occupation | Male | Female |
| Healthcare Support | 0 (0.0%) | 60 (100.0%) |
| Security & Protection | 4 (30.8%) | 9 (69.2%) |
| Firefighting & Prevention | 0 (0.0%) | 9 (100.0%) |
| Law Enforcement | 4 (100.0%) | 0 (0.0%) |
| Food Preparation & Serving | 44 (78.6%) | 12 (21.4%) |
| Cleaning & Maintenance | 8 (23.5%) | 26 (76.5%) |
| Personal Care & Service | 0 (0.0%) | 35 (100.0%) |
| Total (Category) | 56 (28.3%) | 142 (71.7%) |
| Total (Overall) | 604 (46.4%) | 697 (53.6%) |
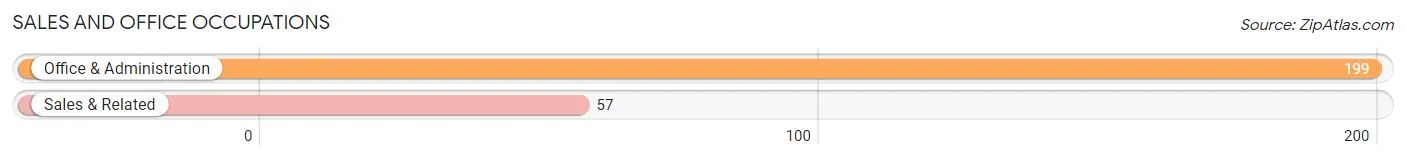
Sales and Office Occupations
The most common Sales and Office occupations in Spring Valley are Office & Administration (199 | 15.3%), and Sales & Related (57 | 4.4%).
Sales and Office Occupations by Sex
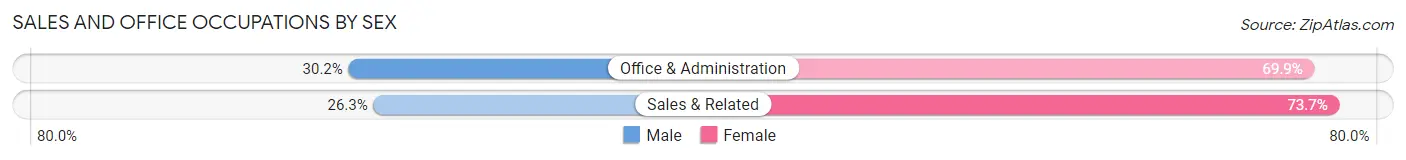
| Occupation | Male | Female |
| Sales & Related | 15 (26.3%) | 42 (73.7%) |
| Office & Administration | 60 (30.1%) | 139 (69.9%) |
| Total (Category) | 75 (29.3%) | 181 (70.7%) |
| Total (Overall) | 604 (46.4%) | 697 (53.6%) |
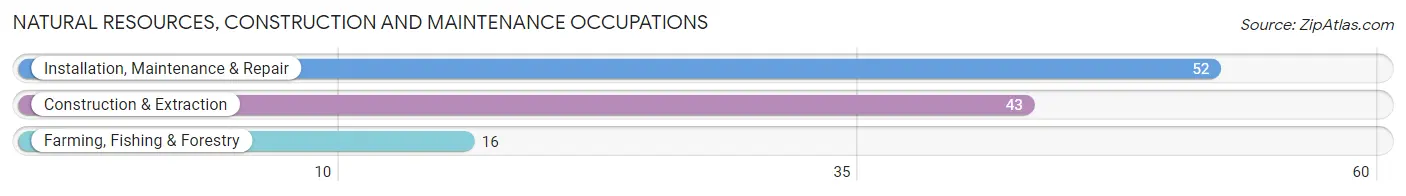
Natural Resources, Construction and Maintenance Occupations
The most common Natural Resources, Construction and Maintenance occupations in Spring Valley are Installation, Maintenance & Repair (52 | 4.0%), Construction & Extraction (43 | 3.3%), and Farming, Fishing & Forestry (16 | 1.2%).
Natural Resources, Construction and Maintenance Occupations by Sex
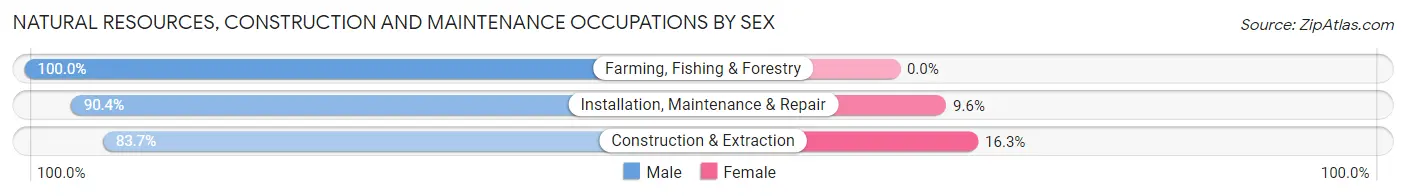
| Occupation | Male | Female |
| Farming, Fishing & Forestry | 16 (100.0%) | 0 (0.0%) |
| Construction & Extraction | 36 (83.7%) | 7 (16.3%) |
| Installation, Maintenance & Repair | 47 (90.4%) | 5 (9.6%) |
| Total (Category) | 99 (89.2%) | 12 (10.8%) |
| Total (Overall) | 604 (46.4%) | 697 (53.6%) |
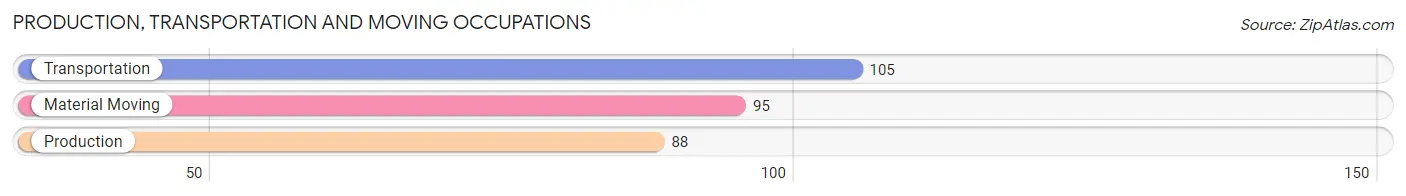
Production, Transportation and Moving Occupations
The most common Production, Transportation and Moving occupations in Spring Valley are Transportation (105 | 8.1%), Material Moving (95 | 7.3%), and Production (88 | 6.8%).
Production, Transportation and Moving Occupations by Sex
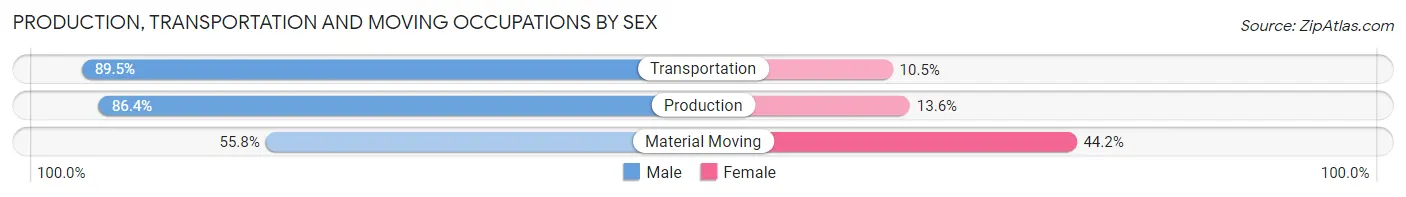
| Occupation | Male | Female |
| Production | 76 (86.4%) | 12 (13.6%) |
| Transportation | 94 (89.5%) | 11 (10.5%) |
| Material Moving | 53 (55.8%) | 42 (44.2%) |
| Total (Category) | 223 (77.4%) | 65 (22.6%) |
| Total (Overall) | 604 (46.4%) | 697 (53.6%) |
Employment Industries by Sex in Spring Valley
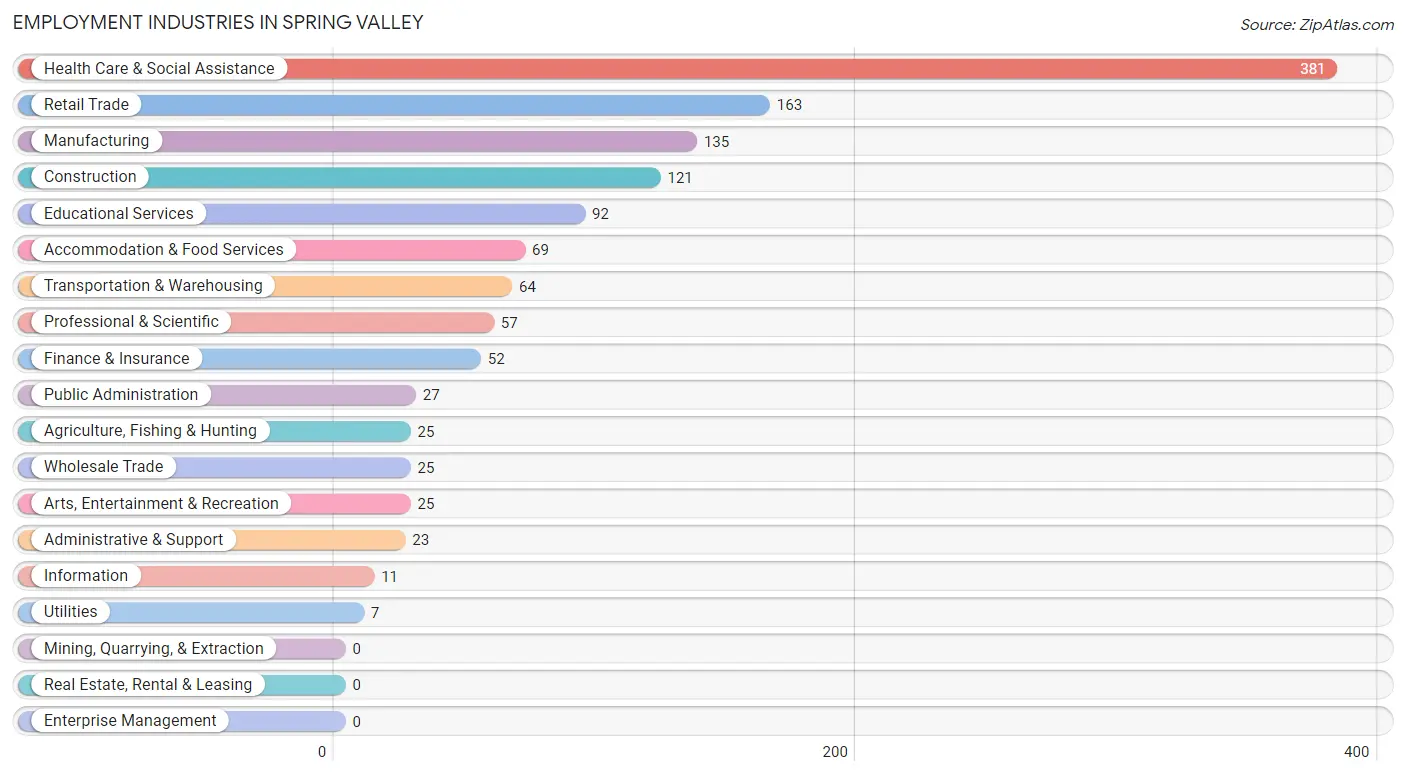
Employment Industries in Spring Valley
The major employment industries in Spring Valley include Health Care & Social Assistance (381 | 29.3%), Retail Trade (163 | 12.5%), Manufacturing (135 | 10.4%), Construction (121 | 9.3%), and Educational Services (92 | 7.1%).
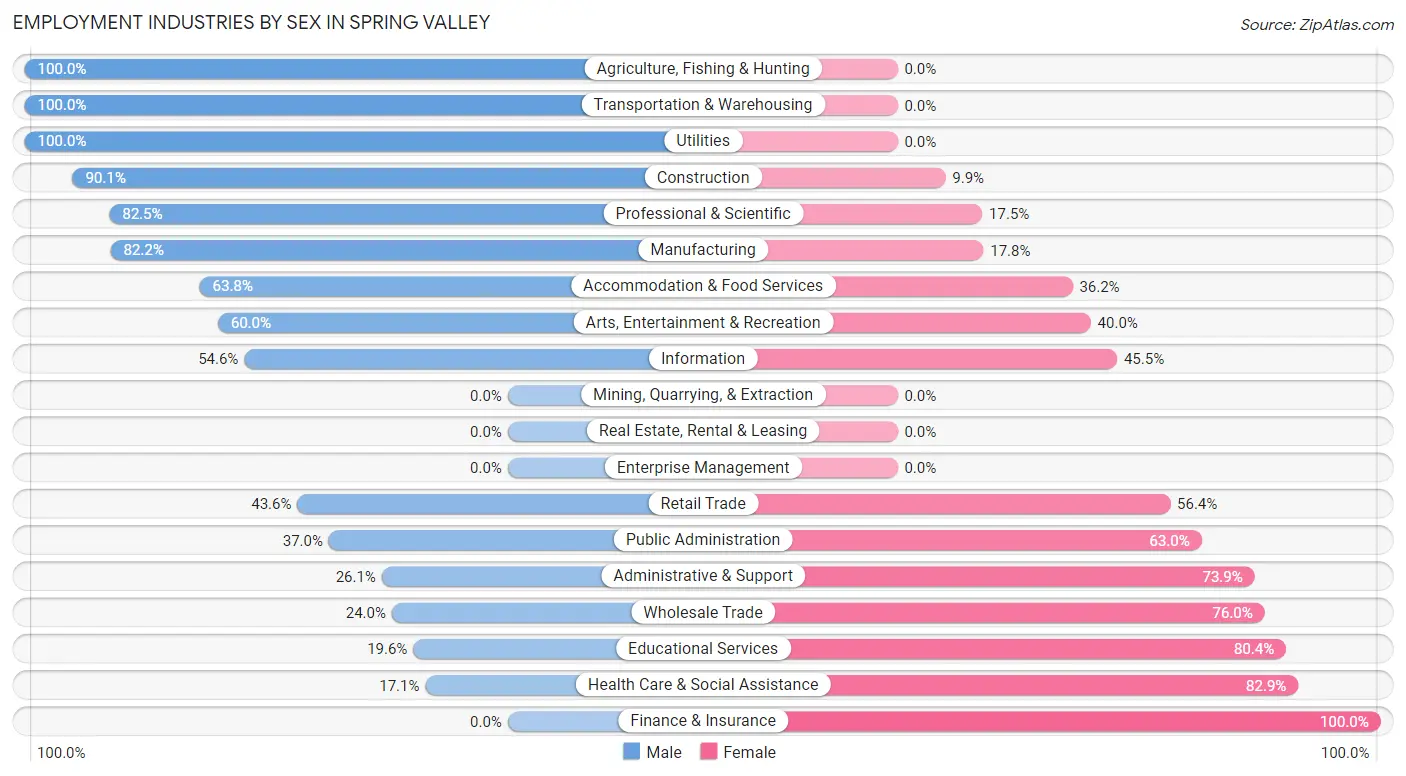
Employment Industries by Sex in Spring Valley
The Spring Valley industries that see more men than women are Agriculture, Fishing & Hunting (100.0%), Transportation & Warehousing (100.0%), and Utilities (100.0%), whereas the industries that tend to have a higher number of women are Finance & Insurance (100.0%), Health Care & Social Assistance (82.9%), and Educational Services (80.4%).
| Industry | Male | Female |
| Agriculture, Fishing & Hunting | 25 (100.0%) | 0 (0.0%) |
| Mining, Quarrying, & Extraction | 0 (0.0%) | 0 (0.0%) |
| Construction | 109 (90.1%) | 12 (9.9%) |
| Manufacturing | 111 (82.2%) | 24 (17.8%) |
| Wholesale Trade | 6 (24.0%) | 19 (76.0%) |
| Retail Trade | 71 (43.6%) | 92 (56.4%) |
| Transportation & Warehousing | 64 (100.0%) | 0 (0.0%) |
| Utilities | 7 (100.0%) | 0 (0.0%) |
| Information | 6 (54.5%) | 5 (45.5%) |
| Finance & Insurance | 0 (0.0%) | 52 (100.0%) |
| Real Estate, Rental & Leasing | 0 (0.0%) | 0 (0.0%) |
| Professional & Scientific | 47 (82.5%) | 10 (17.5%) |
| Enterprise Management | 0 (0.0%) | 0 (0.0%) |
| Administrative & Support | 6 (26.1%) | 17 (73.9%) |
| Educational Services | 18 (19.6%) | 74 (80.4%) |
| Health Care & Social Assistance | 65 (17.1%) | 316 (82.9%) |
| Arts, Entertainment & Recreation | 15 (60.0%) | 10 (40.0%) |
| Accommodation & Food Services | 44 (63.8%) | 25 (36.2%) |
| Public Administration | 10 (37.0%) | 17 (63.0%) |
| Total | 604 (46.4%) | 697 (53.6%) |
Education in Spring Valley
School Enrollment in Spring Valley
The most common levels of schooling among the 584 students in Spring Valley are middle school (168 | 28.8%), high school (133 | 22.8%), and elementary school (124 | 21.2%).
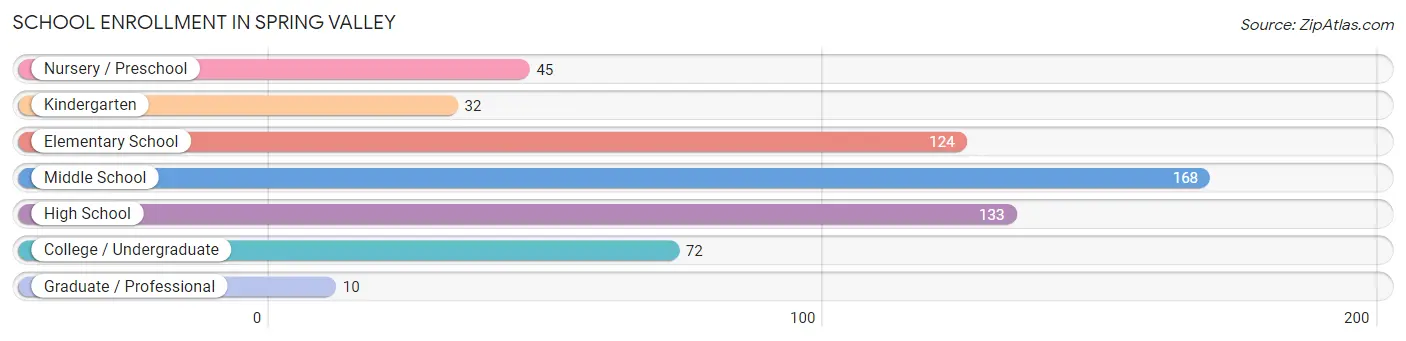
| School Level | # Students | % Students |
| Nursery / Preschool | 45 | 7.7% |
| Kindergarten | 32 | 5.5% |
| Elementary School | 124 | 21.2% |
| Middle School | 168 | 28.8% |
| High School | 133 | 22.8% |
| College / Undergraduate | 72 | 12.3% |
| Graduate / Professional | 10 | 1.7% |
| Total | 584 | 100.0% |
School Enrollment by Age by Funding Source in Spring Valley
Out of a total of 584 students who are enrolled in schools in Spring Valley, 34 (5.8%) attend a private institution, while the remaining 550 (94.2%) are enrolled in public schools. The age group of 35 years and over has the highest likelihood of being enrolled in private schools, with 7 (100.0% in the age bracket) enrolled. Conversely, the age group of 3 to 4 year olds has the lowest likelihood of being enrolled in a private school, with 26 (100.0% in the age bracket) attending a public institution.
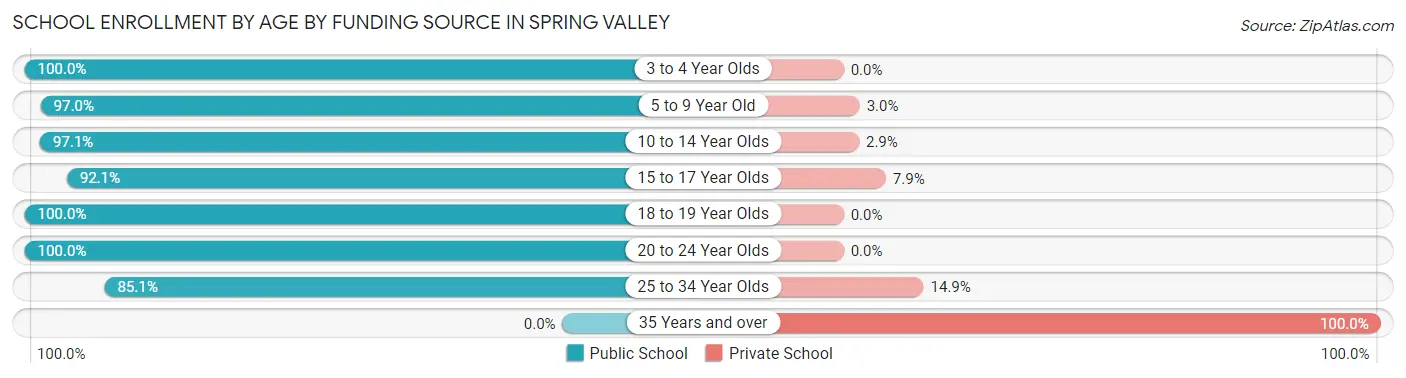
| Age Bracket | Public School | Private School |
| 3 to 4 Year Olds | 26 (100.0%) | 0 (0.0%) |
| 5 to 9 Year Old | 162 (97.0%) | 5 (3.0%) |
| 10 to 14 Year Olds | 170 (97.1%) | 5 (2.9%) |
| 15 to 17 Year Olds | 117 (92.1%) | 10 (7.9%) |
| 18 to 19 Year Olds | 7 (100.0%) | 0 (0.0%) |
| 20 to 24 Year Olds | 28 (100.0%) | 0 (0.0%) |
| 25 to 34 Year Olds | 40 (85.1%) | 7 (14.9%) |
| 35 Years and over | 0 (0.0%) | 7 (100.0%) |
| Total | 550 (94.2%) | 34 (5.8%) |
Educational Attainment by Field of Study in Spring Valley
Education (63 | 18.9%), business (58 | 17.4%), science & technology (52 | 15.6%), communications (30 | 9.0%), and bio, nature & agricultural (26 | 7.8%) are the most common fields of study among 333 individuals in Spring Valley who have obtained a bachelor's degree or higher.
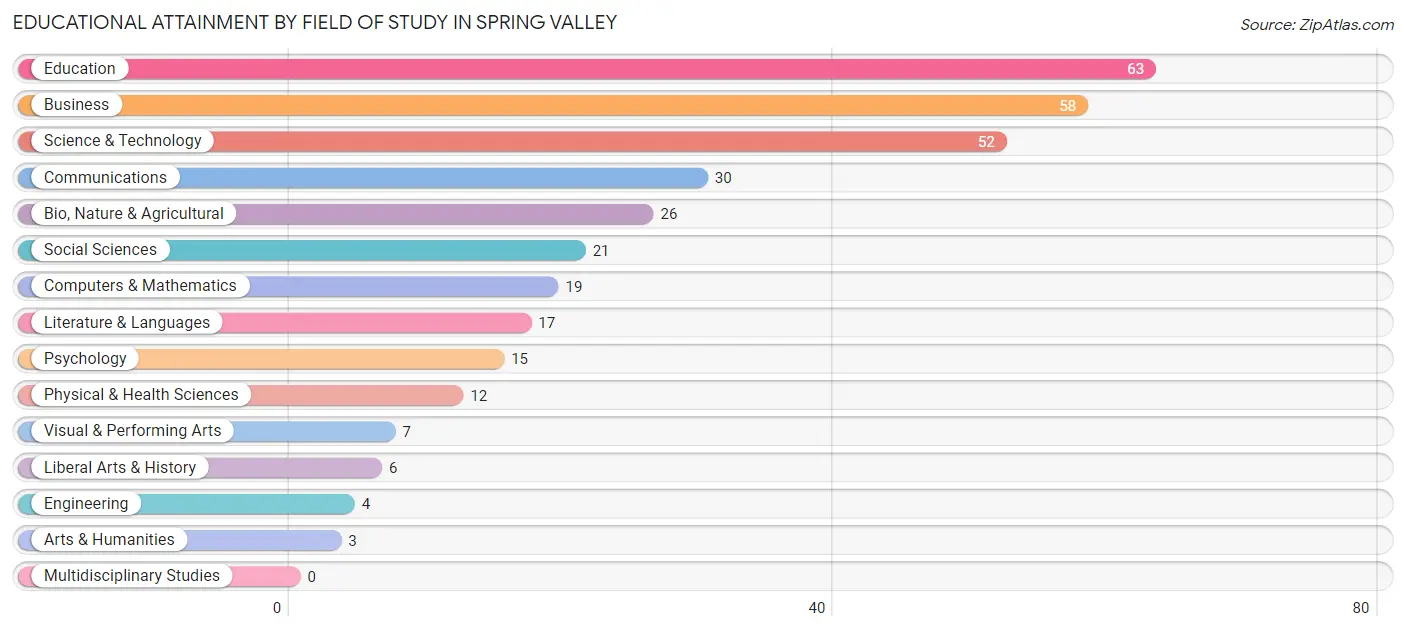
| Field of Study | # Graduates | % Graduates |
| Computers & Mathematics | 19 | 5.7% |
| Bio, Nature & Agricultural | 26 | 7.8% |
| Physical & Health Sciences | 12 | 3.6% |
| Psychology | 15 | 4.5% |
| Social Sciences | 21 | 6.3% |
| Engineering | 4 | 1.2% |
| Multidisciplinary Studies | 0 | 0.0% |
| Science & Technology | 52 | 15.6% |
| Business | 58 | 17.4% |
| Education | 63 | 18.9% |
| Literature & Languages | 17 | 5.1% |
| Liberal Arts & History | 6 | 1.8% |
| Visual & Performing Arts | 7 | 2.1% |
| Communications | 30 | 9.0% |
| Arts & Humanities | 3 | 0.9% |
| Total | 333 | 100.0% |
Transportation & Commute in Spring Valley
Vehicle Availability by Sex in Spring Valley
The most prevalent vehicle ownership categories in Spring Valley are males with 2 vehicles (309, accounting for 53.7%) and females with 2 vehicles (309, making up 46.8%).
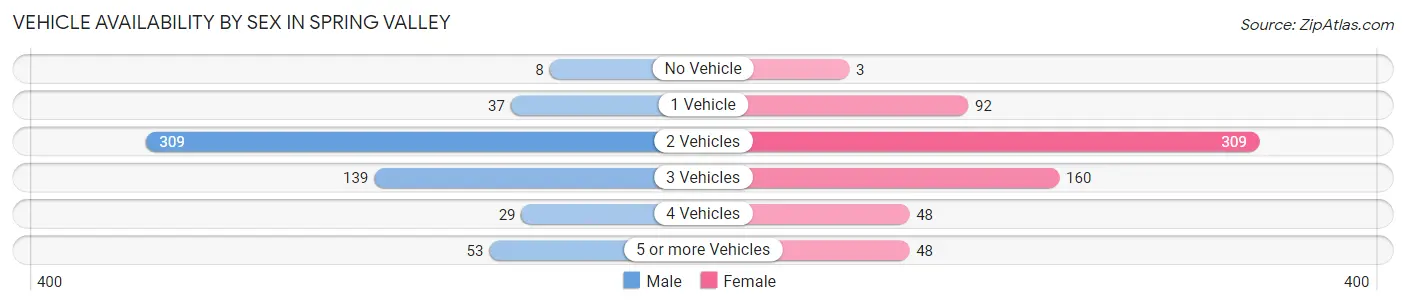
| Vehicles Available | Male | Female |
| No Vehicle | 8 (1.4%) | 3 (0.4%) |
| 1 Vehicle | 37 (6.4%) | 92 (13.9%) |
| 2 Vehicles | 309 (53.7%) | 309 (46.8%) |
| 3 Vehicles | 139 (24.2%) | 160 (24.2%) |
| 4 Vehicles | 29 (5.0%) | 48 (7.3%) |
| 5 or more Vehicles | 53 (9.2%) | 48 (7.3%) |
| Total | 575 (100.0%) | 660 (100.0%) |
Commute Time in Spring Valley
The most frequently occuring commute durations in Spring Valley are 35 to 39 minutes (161 commuters, 14.3%), 45 to 59 minutes (140 commuters, 12.4%), and 30 to 34 minutes (136 commuters, 12.1%).
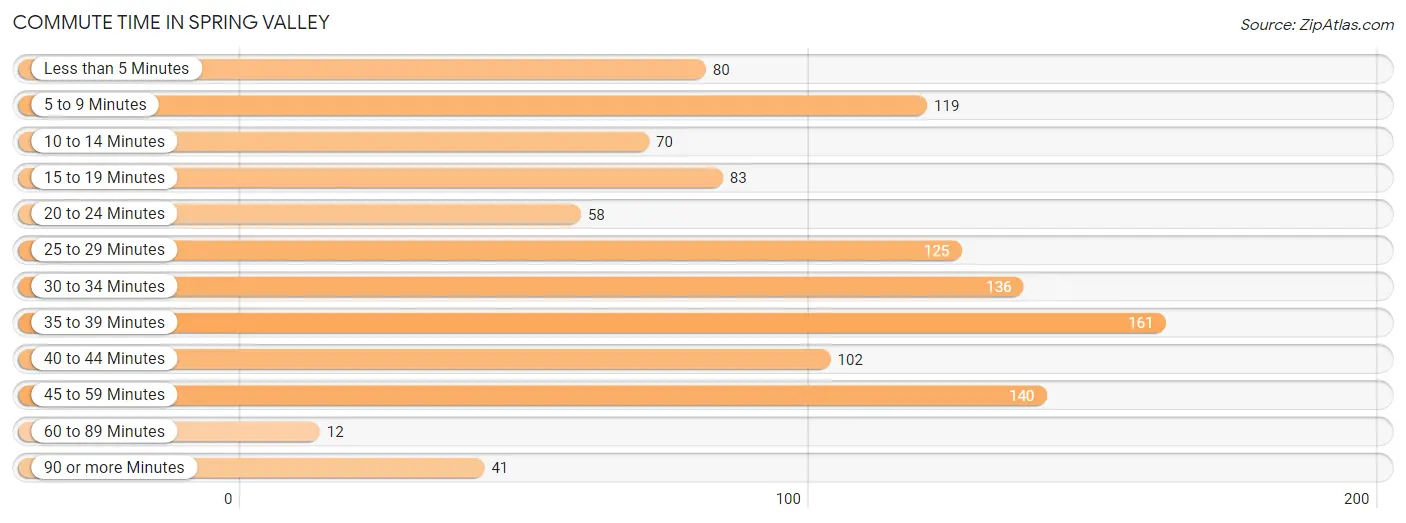
| Commute Time | # Commuters | % Commuters |
| Less than 5 Minutes | 80 | 7.1% |
| 5 to 9 Minutes | 119 | 10.6% |
| 10 to 14 Minutes | 70 | 6.2% |
| 15 to 19 Minutes | 83 | 7.4% |
| 20 to 24 Minutes | 58 | 5.1% |
| 25 to 29 Minutes | 125 | 11.1% |
| 30 to 34 Minutes | 136 | 12.1% |
| 35 to 39 Minutes | 161 | 14.3% |
| 40 to 44 Minutes | 102 | 9.0% |
| 45 to 59 Minutes | 140 | 12.4% |
| 60 to 89 Minutes | 12 | 1.1% |
| 90 or more Minutes | 41 | 3.6% |
Commute Time by Sex in Spring Valley
The most common commute times in Spring Valley are 30 to 34 minutes (73 commuters, 13.4%) for males and 35 to 39 minutes (108 commuters, 18.5%) for females.
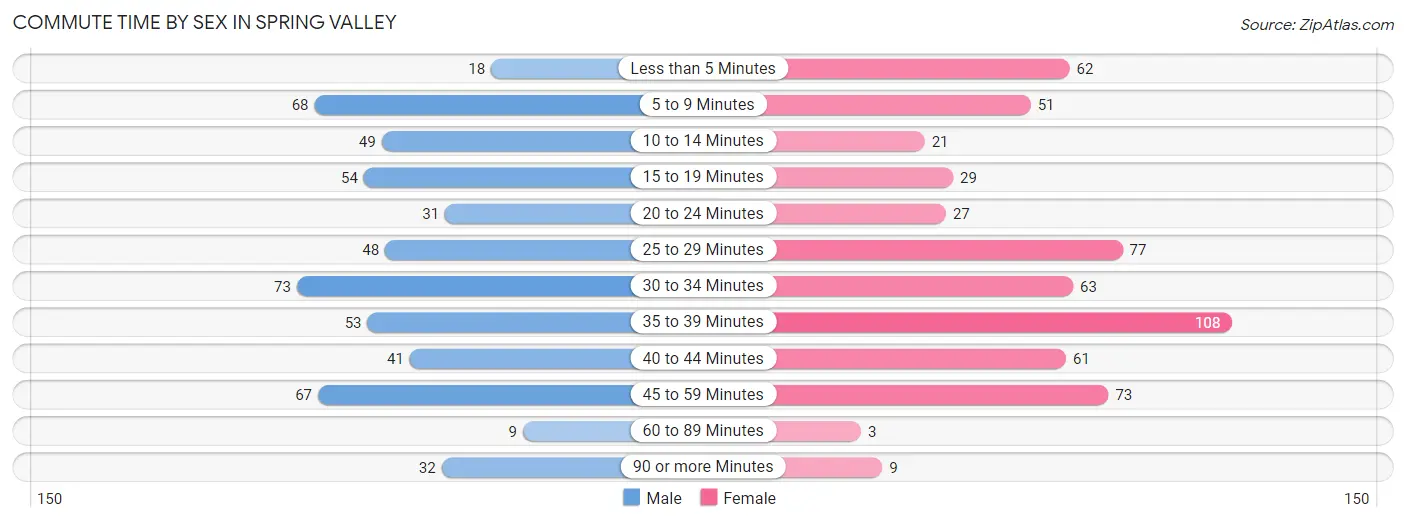
| Commute Time | Male | Female |
| Less than 5 Minutes | 18 (3.3%) | 62 (10.6%) |
| 5 to 9 Minutes | 68 (12.5%) | 51 (8.7%) |
| 10 to 14 Minutes | 49 (9.0%) | 21 (3.6%) |
| 15 to 19 Minutes | 54 (9.9%) | 29 (5.0%) |
| 20 to 24 Minutes | 31 (5.7%) | 27 (4.6%) |
| 25 to 29 Minutes | 48 (8.8%) | 77 (13.2%) |
| 30 to 34 Minutes | 73 (13.4%) | 63 (10.8%) |
| 35 to 39 Minutes | 53 (9.8%) | 108 (18.5%) |
| 40 to 44 Minutes | 41 (7.5%) | 61 (10.4%) |
| 45 to 59 Minutes | 67 (12.3%) | 73 (12.5%) |
| 60 to 89 Minutes | 9 (1.7%) | 3 (0.5%) |
| 90 or more Minutes | 32 (5.9%) | 9 (1.5%) |
Time of Departure to Work by Sex in Spring Valley
The most frequent times of departure to work in Spring Valley are 12:00 AM to 4:59 AM (107, 19.7%) for males and 6:30 AM to 6:59 AM (112, 19.2%) for females.
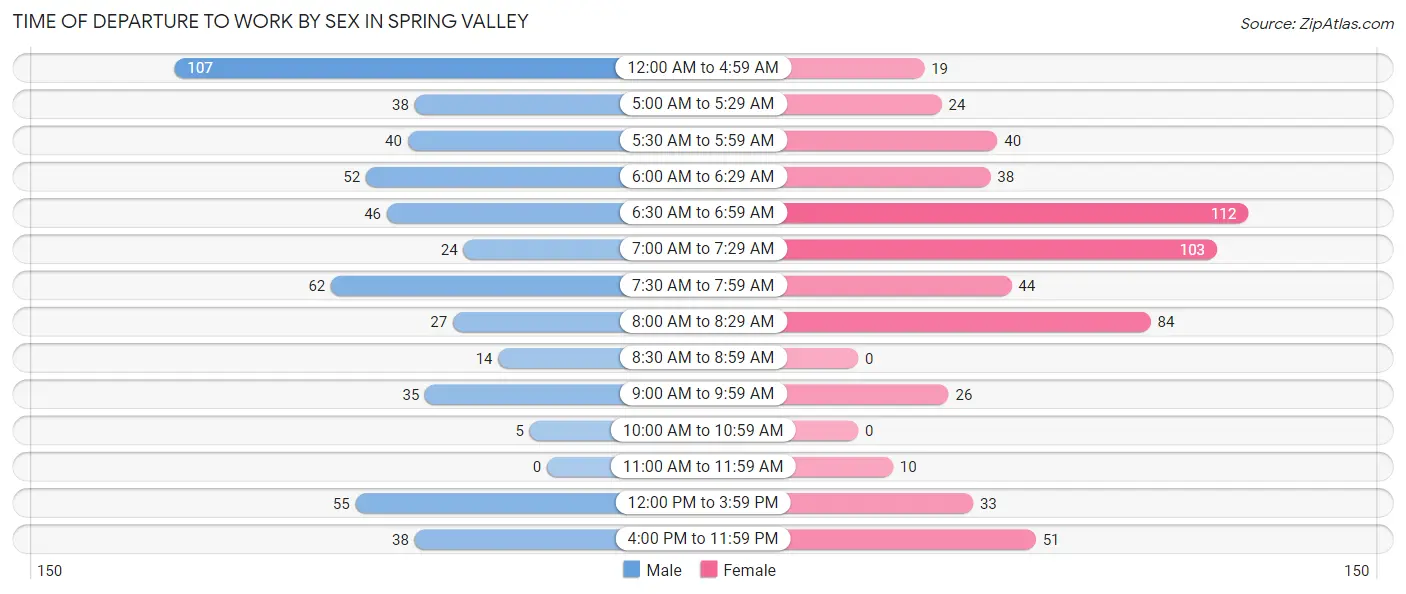
| Time of Departure | Male | Female |
| 12:00 AM to 4:59 AM | 107 (19.7%) | 19 (3.3%) |
| 5:00 AM to 5:29 AM | 38 (7.0%) | 24 (4.1%) |
| 5:30 AM to 5:59 AM | 40 (7.4%) | 40 (6.9%) |
| 6:00 AM to 6:29 AM | 52 (9.6%) | 38 (6.5%) |
| 6:30 AM to 6:59 AM | 46 (8.5%) | 112 (19.2%) |
| 7:00 AM to 7:29 AM | 24 (4.4%) | 103 (17.6%) |
| 7:30 AM to 7:59 AM | 62 (11.4%) | 44 (7.5%) |
| 8:00 AM to 8:29 AM | 27 (5.0%) | 84 (14.4%) |
| 8:30 AM to 8:59 AM | 14 (2.6%) | 0 (0.0%) |
| 9:00 AM to 9:59 AM | 35 (6.5%) | 26 (4.4%) |
| 10:00 AM to 10:59 AM | 5 (0.9%) | 0 (0.0%) |
| 11:00 AM to 11:59 AM | 0 (0.0%) | 10 (1.7%) |
| 12:00 PM to 3:59 PM | 55 (10.1%) | 33 (5.7%) |
| 4:00 PM to 11:59 PM | 38 (7.0%) | 51 (8.7%) |
| Total | 543 (100.0%) | 584 (100.0%) |
Housing Occupancy in Spring Valley
Occupancy by Ownership in Spring Valley
Of the total 1,031 dwellings in Spring Valley, owner-occupied units account for 813 (78.9%), while renter-occupied units make up 218 (21.1%).
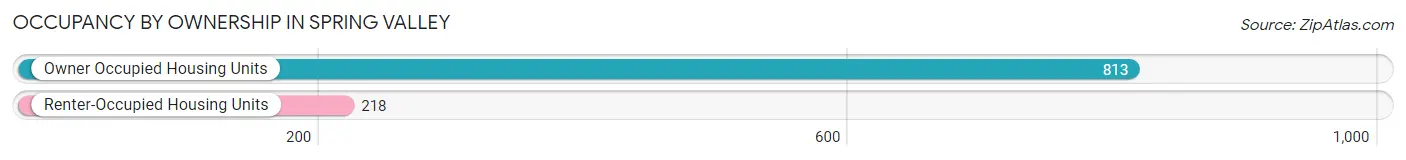
| Occupancy | # Housing Units | % Housing Units |
| Owner Occupied Housing Units | 813 | 78.9% |
| Renter-Occupied Housing Units | 218 | 21.1% |
| Total Occupied Housing Units | 1,031 | 100.0% |
Occupancy by Household Size in Spring Valley
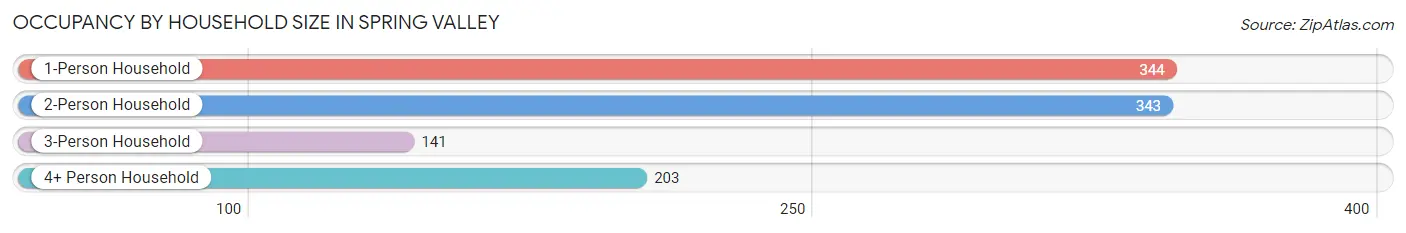
| Household Size | # Housing Units | % Housing Units |
| 1-Person Household | 344 | 33.4% |
| 2-Person Household | 343 | 33.3% |
| 3-Person Household | 141 | 13.7% |
| 4+ Person Household | 203 | 19.7% |
| Total Housing Units | 1,031 | 100.0% |
Occupancy by Ownership by Household Size in Spring Valley
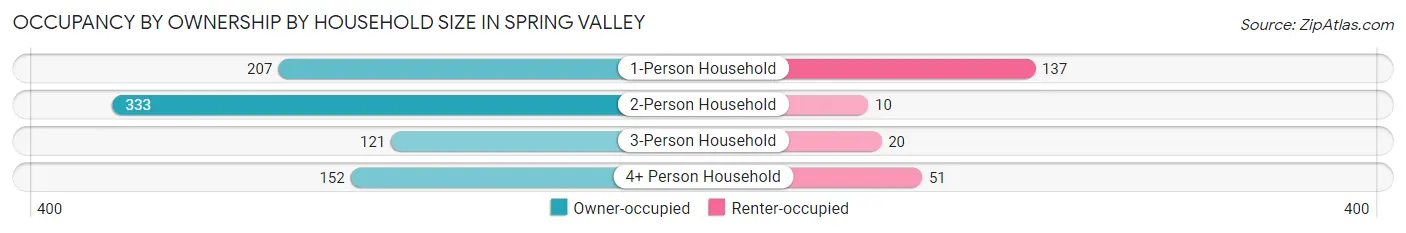
| Household Size | Owner-occupied | Renter-occupied |
| 1-Person Household | 207 (60.2%) | 137 (39.8%) |
| 2-Person Household | 333 (97.1%) | 10 (2.9%) |
| 3-Person Household | 121 (85.8%) | 20 (14.2%) |
| 4+ Person Household | 152 (74.9%) | 51 (25.1%) |
| Total Housing Units | 813 (78.9%) | 218 (21.1%) |
Occupancy by Educational Attainment in Spring Valley
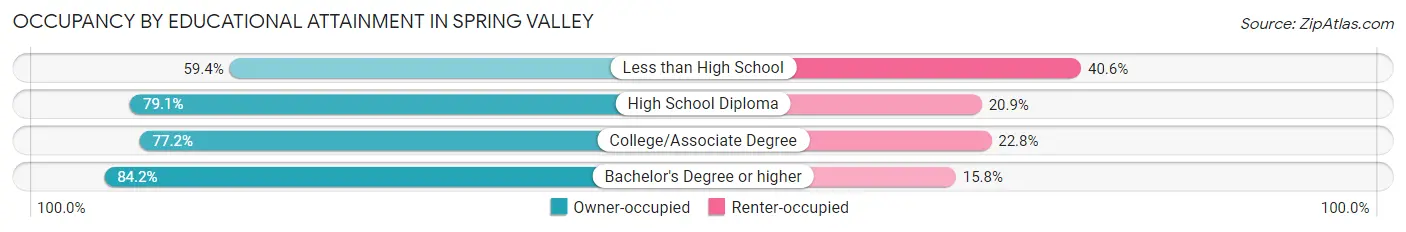
| Household Size | Owner-occupied | Renter-occupied |
| Less than High School | 19 (59.4%) | 13 (40.6%) |
| High School Diploma | 344 (79.1%) | 91 (20.9%) |
| College/Associate Degree | 274 (77.2%) | 81 (22.8%) |
| Bachelor's Degree or higher | 176 (84.2%) | 33 (15.8%) |
Occupancy by Age of Householder in Spring Valley
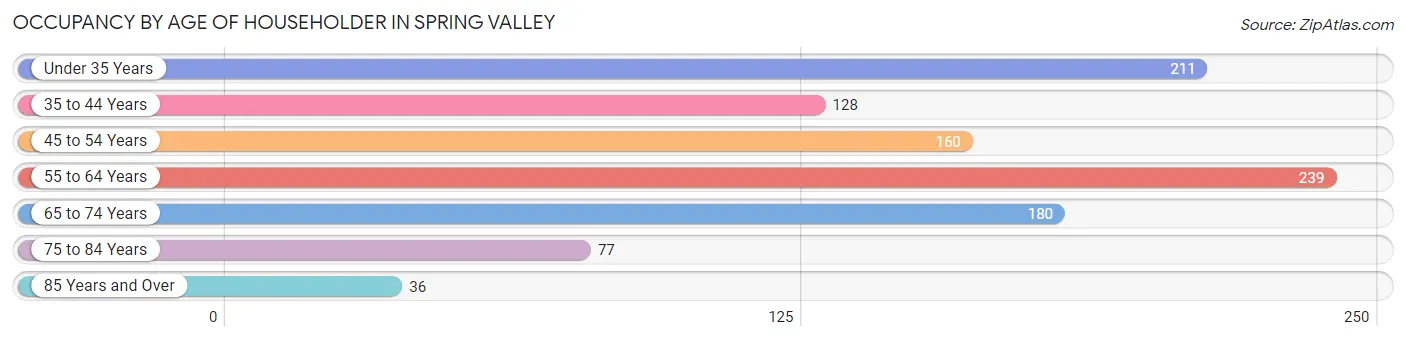
| Age Bracket | # Households | % Households |
| Under 35 Years | 211 | 20.5% |
| 35 to 44 Years | 128 | 12.4% |
| 45 to 54 Years | 160 | 15.5% |
| 55 to 64 Years | 239 | 23.2% |
| 65 to 74 Years | 180 | 17.5% |
| 75 to 84 Years | 77 | 7.5% |
| 85 Years and Over | 36 | 3.5% |
| Total | 1,031 | 100.0% |
Housing Finances in Spring Valley
Median Income by Occupancy in Spring Valley
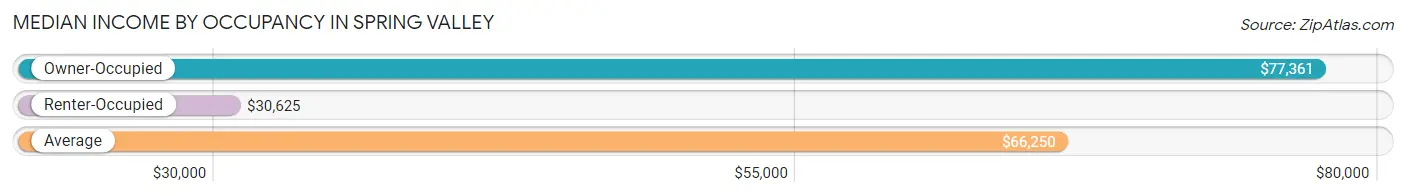
| Occupancy Type | # Households | Median Income |
| Owner-Occupied | 813 (78.9%) | $77,361 |
| Renter-Occupied | 218 (21.1%) | $30,625 |
| Average | 1,031 (100.0%) | $66,250 |
Occupancy by Householder Income Bracket in Spring Valley
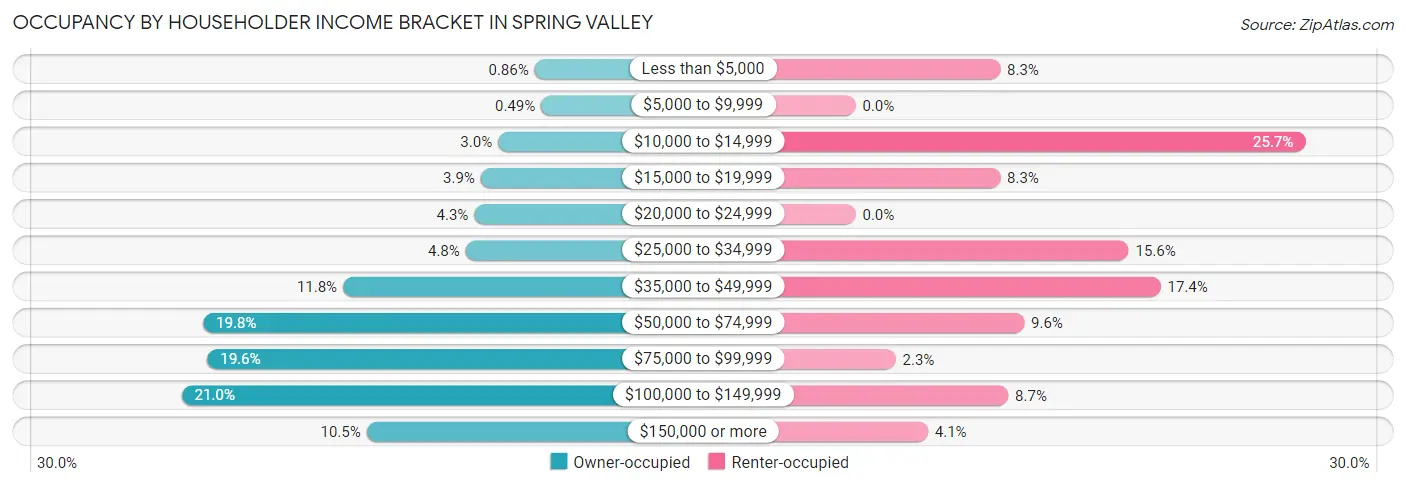
| Income Bracket | Owner-occupied | Renter-occupied |
| Less than $5,000 | 7 (0.9%) | 18 (8.3%) |
| $5,000 to $9,999 | 4 (0.5%) | 0 (0.0%) |
| $10,000 to $14,999 | 24 (2.9%) | 56 (25.7%) |
| $15,000 to $19,999 | 32 (3.9%) | 18 (8.3%) |
| $20,000 to $24,999 | 35 (4.3%) | 0 (0.0%) |
| $25,000 to $34,999 | 39 (4.8%) | 34 (15.6%) |
| $35,000 to $49,999 | 96 (11.8%) | 38 (17.4%) |
| $50,000 to $74,999 | 161 (19.8%) | 21 (9.6%) |
| $75,000 to $99,999 | 159 (19.6%) | 5 (2.3%) |
| $100,000 to $149,999 | 171 (21.0%) | 19 (8.7%) |
| $150,000 or more | 85 (10.5%) | 9 (4.1%) |
| Total | 813 (100.0%) | 218 (100.0%) |
Monthly Housing Cost Tiers in Spring Valley
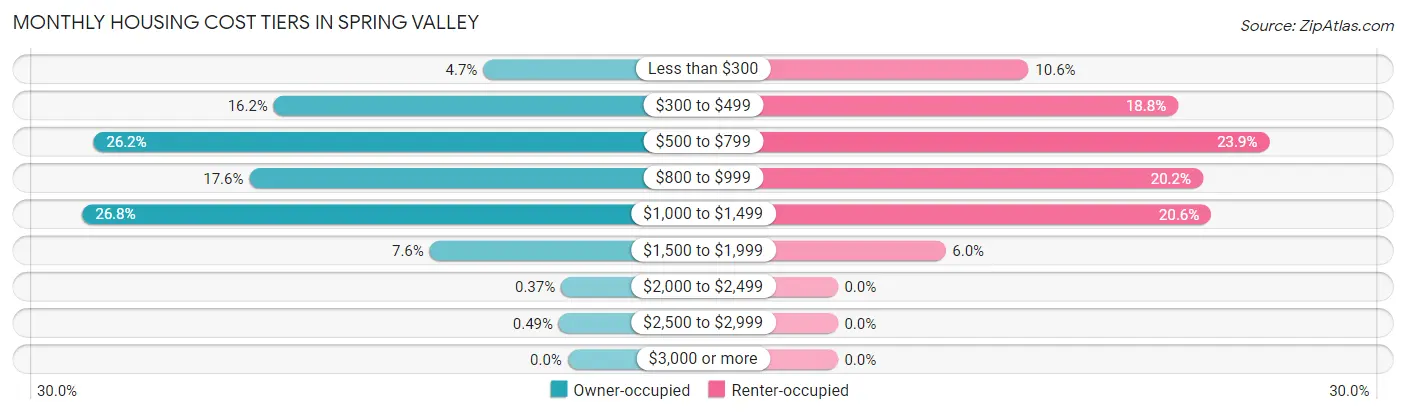
| Monthly Cost | Owner-occupied | Renter-occupied |
| Less than $300 | 38 (4.7%) | 23 (10.5%) |
| $300 to $499 | 132 (16.2%) | 41 (18.8%) |
| $500 to $799 | 213 (26.2%) | 52 (23.8%) |
| $800 to $999 | 143 (17.6%) | 44 (20.2%) |
| $1,000 to $1,499 | 218 (26.8%) | 45 (20.6%) |
| $1,500 to $1,999 | 62 (7.6%) | 13 (6.0%) |
| $2,000 to $2,499 | 3 (0.4%) | 0 (0.0%) |
| $2,500 to $2,999 | 4 (0.5%) | 0 (0.0%) |
| $3,000 or more | 0 (0.0%) | 0 (0.0%) |
| Total | 813 (100.0%) | 218 (100.0%) |
Physical Housing Characteristics in Spring Valley
Housing Structures in Spring Valley
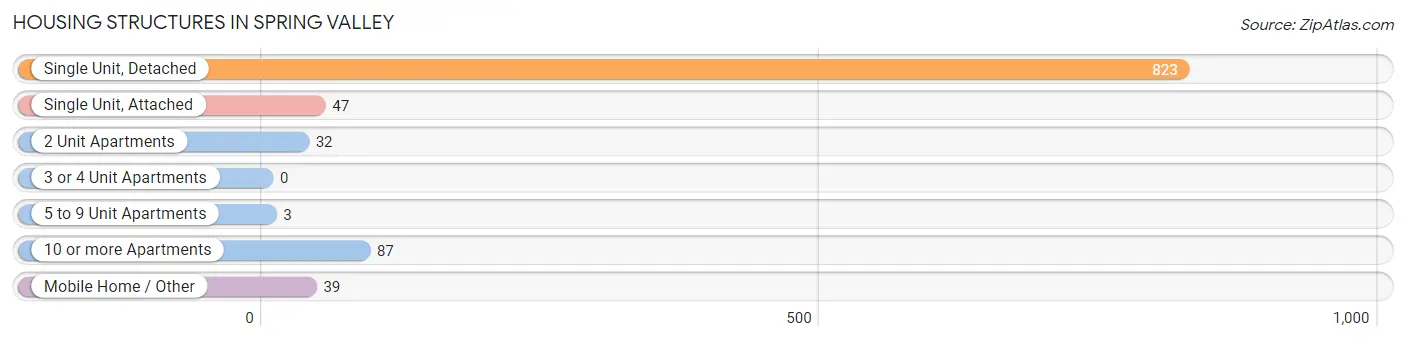
| Structure Type | # Housing Units | % Housing Units |
| Single Unit, Detached | 823 | 79.8% |
| Single Unit, Attached | 47 | 4.6% |
| 2 Unit Apartments | 32 | 3.1% |
| 3 or 4 Unit Apartments | 0 | 0.0% |
| 5 to 9 Unit Apartments | 3 | 0.3% |
| 10 or more Apartments | 87 | 8.4% |
| Mobile Home / Other | 39 | 3.8% |
| Total | 1,031 | 100.0% |
Housing Structures by Occupancy in Spring Valley
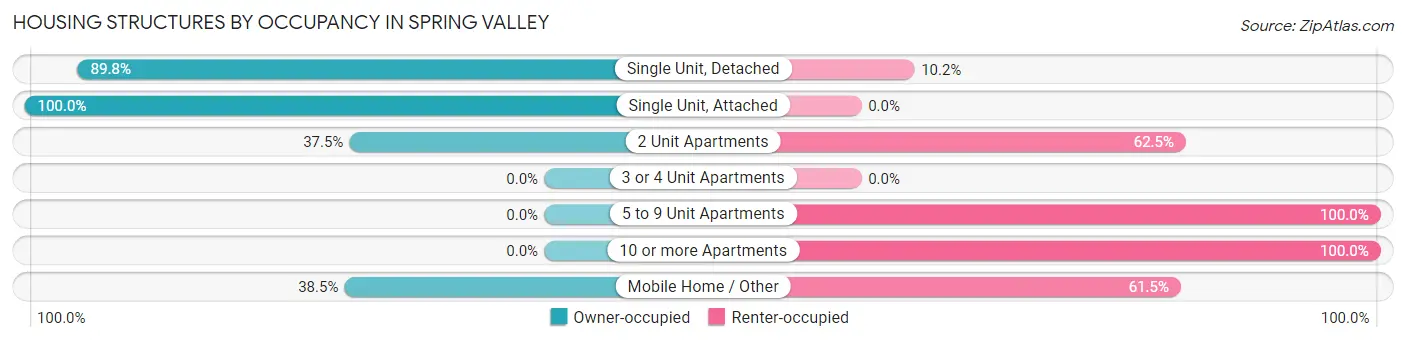
| Structure Type | Owner-occupied | Renter-occupied |
| Single Unit, Detached | 739 (89.8%) | 84 (10.2%) |
| Single Unit, Attached | 47 (100.0%) | 0 (0.0%) |
| 2 Unit Apartments | 12 (37.5%) | 20 (62.5%) |
| 3 or 4 Unit Apartments | 0 (0.0%) | 0 (0.0%) |
| 5 to 9 Unit Apartments | 0 (0.0%) | 3 (100.0%) |
| 10 or more Apartments | 0 (0.0%) | 87 (100.0%) |
| Mobile Home / Other | 15 (38.5%) | 24 (61.5%) |
| Total | 813 (78.9%) | 218 (21.1%) |
Housing Structures by Number of Rooms in Spring Valley
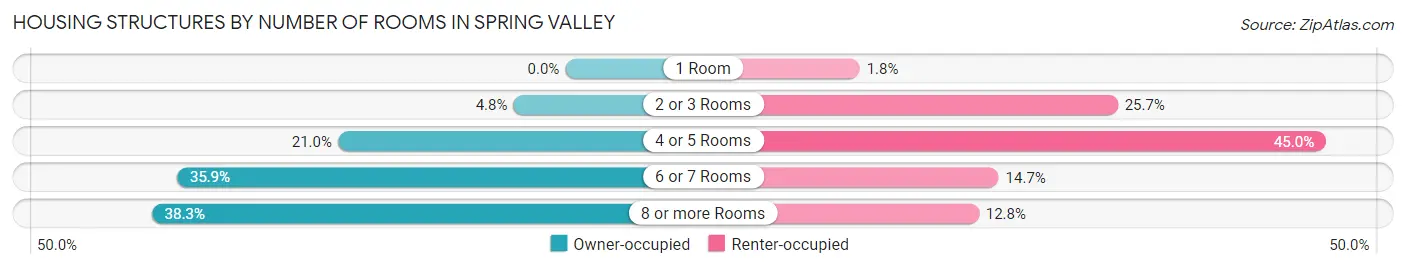
| Number of Rooms | Owner-occupied | Renter-occupied |
| 1 Room | 0 (0.0%) | 4 (1.8%) |
| 2 or 3 Rooms | 39 (4.8%) | 56 (25.7%) |
| 4 or 5 Rooms | 171 (21.0%) | 98 (45.0%) |
| 6 or 7 Rooms | 292 (35.9%) | 32 (14.7%) |
| 8 or more Rooms | 311 (38.3%) | 28 (12.8%) |
| Total | 813 (100.0%) | 218 (100.0%) |
Housing Structure by Heating Type in Spring Valley
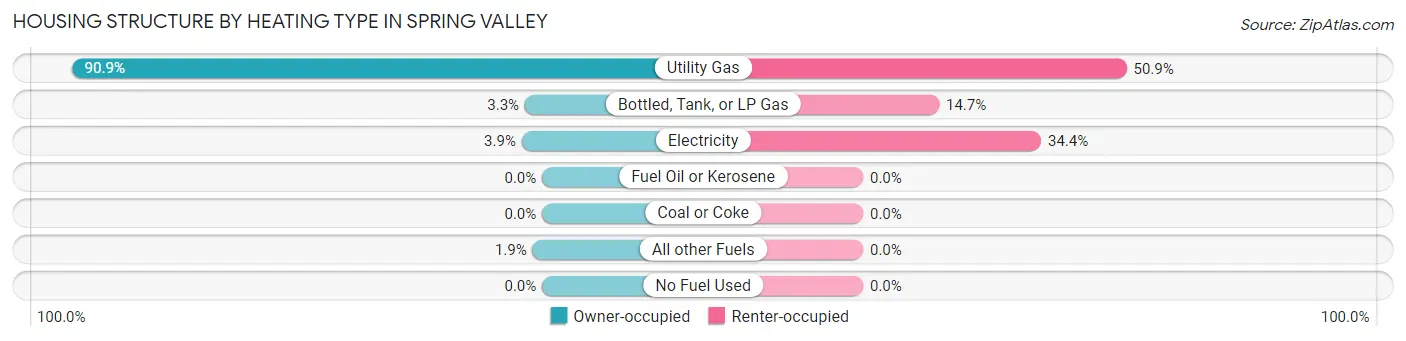
| Heating Type | Owner-occupied | Renter-occupied |
| Utility Gas | 739 (90.9%) | 111 (50.9%) |
| Bottled, Tank, or LP Gas | 27 (3.3%) | 32 (14.7%) |
| Electricity | 32 (3.9%) | 75 (34.4%) |
| Fuel Oil or Kerosene | 0 (0.0%) | 0 (0.0%) |
| Coal or Coke | 0 (0.0%) | 0 (0.0%) |
| All other Fuels | 15 (1.8%) | 0 (0.0%) |
| No Fuel Used | 0 (0.0%) | 0 (0.0%) |
| Total | 813 (100.0%) | 218 (100.0%) |
Household Vehicle Usage in Spring Valley
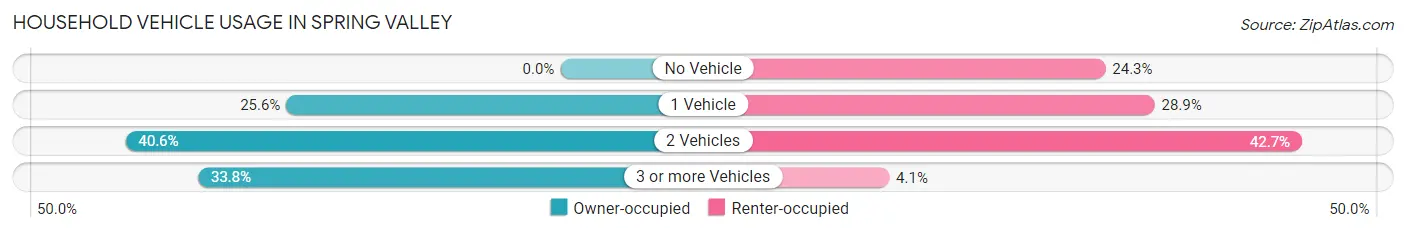
| Vehicles per Household | Owner-occupied | Renter-occupied |
| No Vehicle | 0 (0.0%) | 53 (24.3%) |
| 1 Vehicle | 208 (25.6%) | 63 (28.9%) |
| 2 Vehicles | 330 (40.6%) | 93 (42.7%) |
| 3 or more Vehicles | 275 (33.8%) | 9 (4.1%) |
| Total | 813 (100.0%) | 218 (100.0%) |
Real Estate & Mortgages in Spring Valley
Real Estate and Mortgage Overview in Spring Valley
| Characteristic | Without Mortgage | With Mortgage |
| Housing Units | 345 | 468 |
| Median Property Value | $130,200 | $146,100 |
| Median Household Income | $54,063 | $47 |
| Monthly Housing Costs | $514 | $0 |
| Real Estate Taxes | $1,635 | $11 |
Property Value by Mortgage Status in Spring Valley
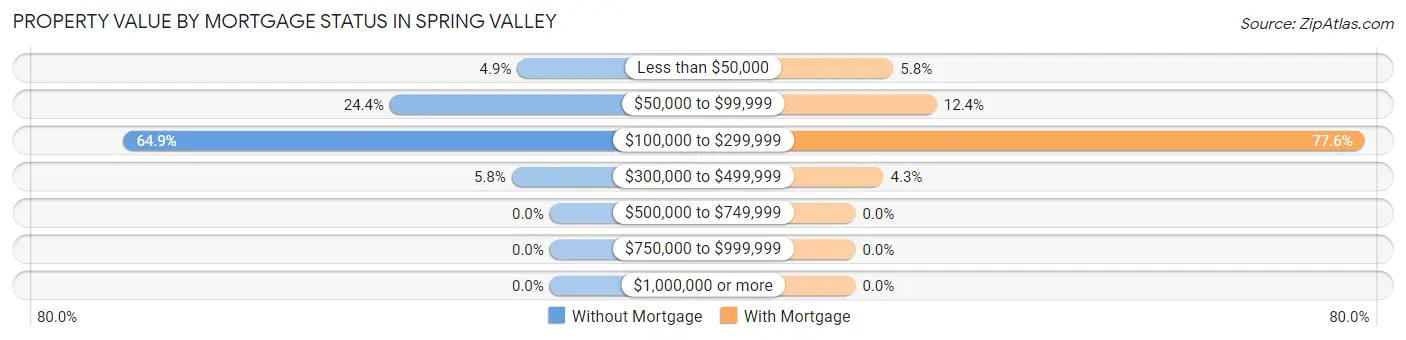
| Property Value | Without Mortgage | With Mortgage |
| Less than $50,000 | 17 (4.9%) | 27 (5.8%) |
| $50,000 to $99,999 | 84 (24.3%) | 58 (12.4%) |
| $100,000 to $299,999 | 224 (64.9%) | 363 (77.6%) |
| $300,000 to $499,999 | 20 (5.8%) | 20 (4.3%) |
| $500,000 to $749,999 | 0 (0.0%) | 0 (0.0%) |
| $750,000 to $999,999 | 0 (0.0%) | 0 (0.0%) |
| $1,000,000 or more | 0 (0.0%) | 0 (0.0%) |
| Total | 345 (100.0%) | 468 (100.0%) |
Household Income by Mortgage Status in Spring Valley
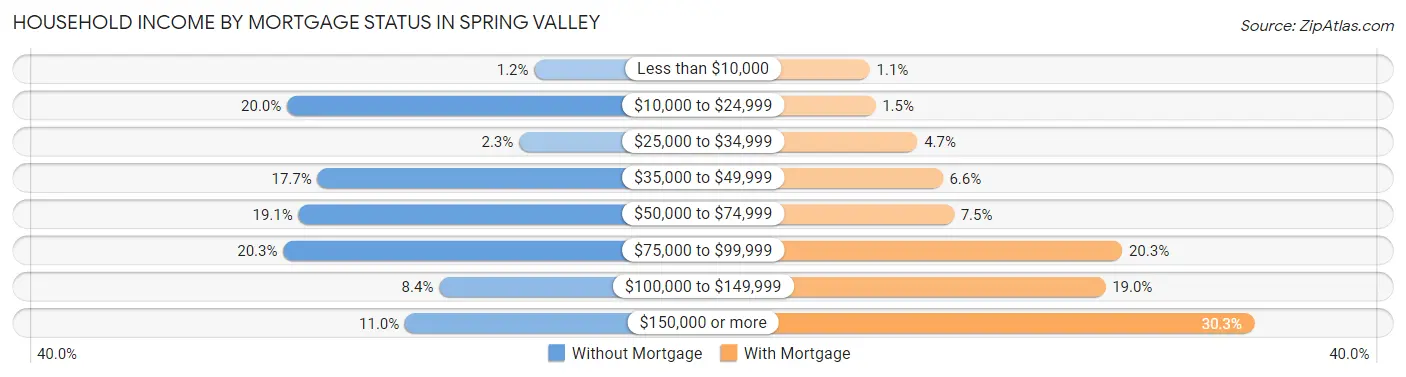
| Household Income | Without Mortgage | With Mortgage |
| Less than $10,000 | 4 (1.2%) | 5 (1.1%) |
| $10,000 to $24,999 | 69 (20.0%) | 7 (1.5%) |
| $25,000 to $34,999 | 8 (2.3%) | 22 (4.7%) |
| $35,000 to $49,999 | 61 (17.7%) | 31 (6.6%) |
| $50,000 to $74,999 | 66 (19.1%) | 35 (7.5%) |
| $75,000 to $99,999 | 70 (20.3%) | 95 (20.3%) |
| $100,000 to $149,999 | 29 (8.4%) | 89 (19.0%) |
| $150,000 or more | 38 (11.0%) | 142 (30.3%) |
| Total | 345 (100.0%) | 468 (100.0%) |
Property Value to Household Income Ratio in Spring Valley
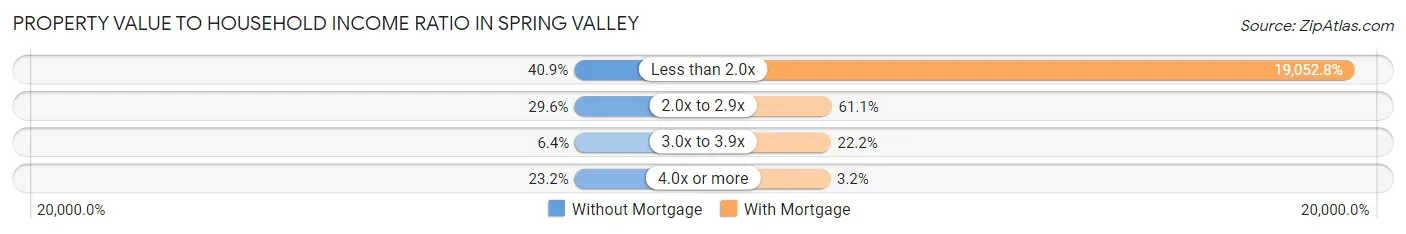
| Value-to-Income Ratio | Without Mortgage | With Mortgage |
| Less than 2.0x | 141 (40.9%) | 89,167 (19,052.8%) |
| 2.0x to 2.9x | 102 (29.6%) | 286 (61.1%) |
| 3.0x to 3.9x | 22 (6.4%) | 104 (22.2%) |
| 4.0x or more | 80 (23.2%) | 15 (3.2%) |
| Total | 345 (100.0%) | 468 (100.0%) |
Real Estate Taxes by Mortgage Status in Spring Valley
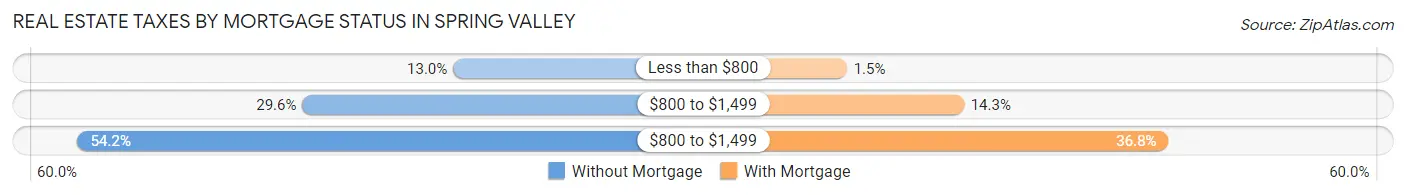
| Property Taxes | Without Mortgage | With Mortgage |
| Less than $800 | 45 (13.0%) | 7 (1.5%) |
| $800 to $1,499 | 102 (29.6%) | 67 (14.3%) |
| $800 to $1,499 | 187 (54.2%) | 172 (36.7%) |
| Total | 345 (100.0%) | 468 (100.0%) |
Health & Disability in Spring Valley
Health Insurance Coverage by Age in Spring Valley
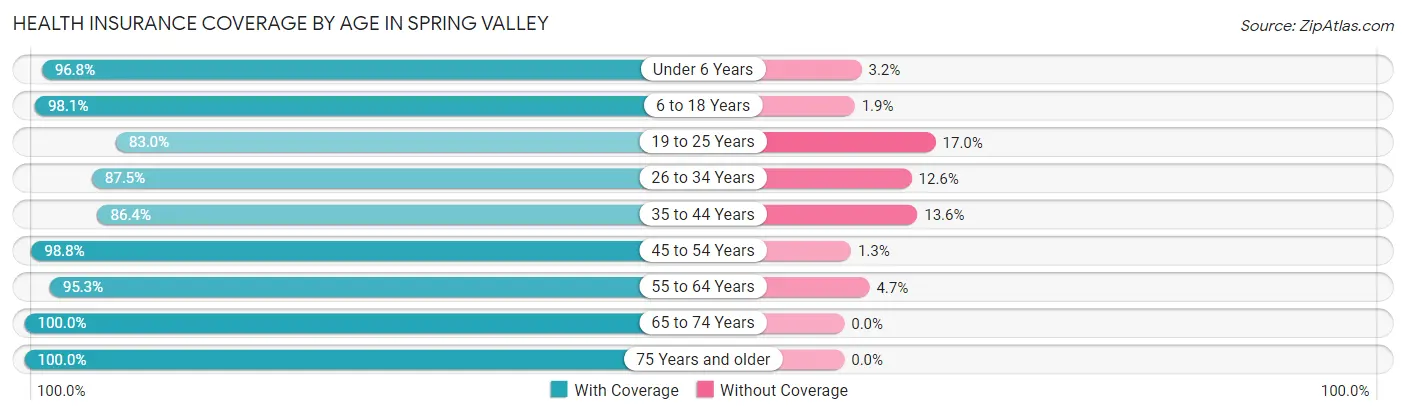
| Age Bracket | With Coverage | Without Coverage |
| Under 6 Years | 151 (96.8%) | 5 (3.2%) |
| 6 to 18 Years | 456 (98.1%) | 9 (1.9%) |
| 19 to 25 Years | 229 (83.0%) | 47 (17.0%) |
| 26 to 34 Years | 237 (87.5%) | 34 (12.6%) |
| 35 to 44 Years | 222 (86.4%) | 35 (13.6%) |
| 45 to 54 Years | 237 (98.8%) | 3 (1.3%) |
| 55 to 64 Years | 365 (95.3%) | 18 (4.7%) |
| 65 to 74 Years | 240 (100.0%) | 0 (0.0%) |
| 75 Years and older | 165 (100.0%) | 0 (0.0%) |
| Total | 2,302 (93.8%) | 151 (6.2%) |
Health Insurance Coverage by Citizenship Status in Spring Valley
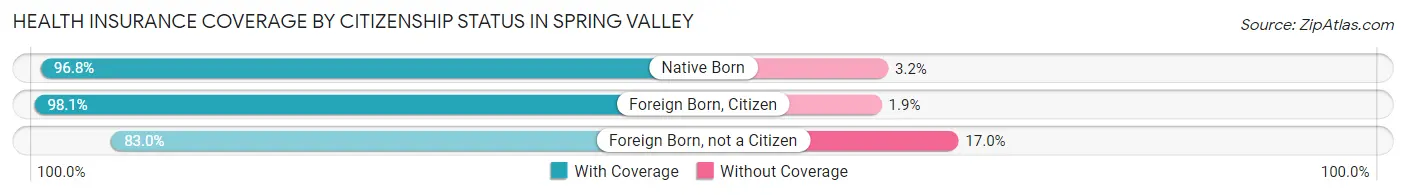
| Citizenship Status | With Coverage | Without Coverage |
| Native Born | 151 (96.8%) | 5 (3.2%) |
| Foreign Born, Citizen | 456 (98.1%) | 9 (1.9%) |
| Foreign Born, not a Citizen | 229 (83.0%) | 47 (17.0%) |
Health Insurance Coverage by Household Income in Spring Valley
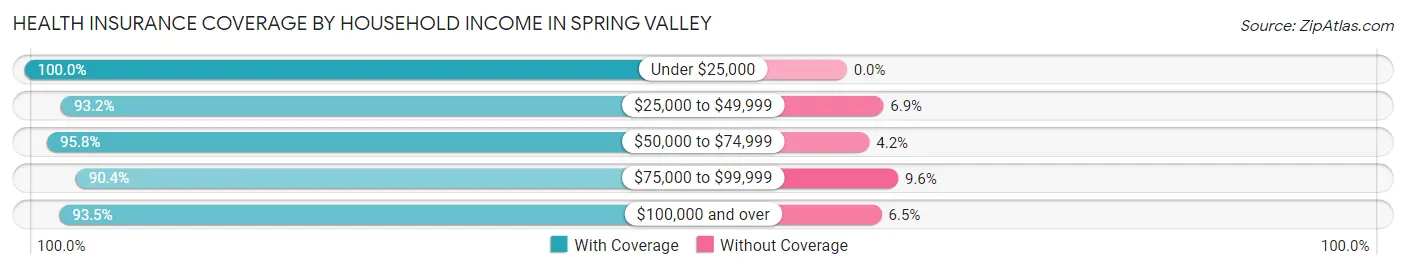
| Household Income | With Coverage | Without Coverage |
| Under $25,000 | 214 (100.0%) | 0 (0.0%) |
| $25,000 to $49,999 | 435 (93.1%) | 32 (6.9%) |
| $50,000 to $74,999 | 430 (95.8%) | 19 (4.2%) |
| $75,000 to $99,999 | 405 (90.4%) | 43 (9.6%) |
| $100,000 and over | 817 (93.5%) | 57 (6.5%) |
Public vs Private Health Insurance Coverage by Age in Spring Valley
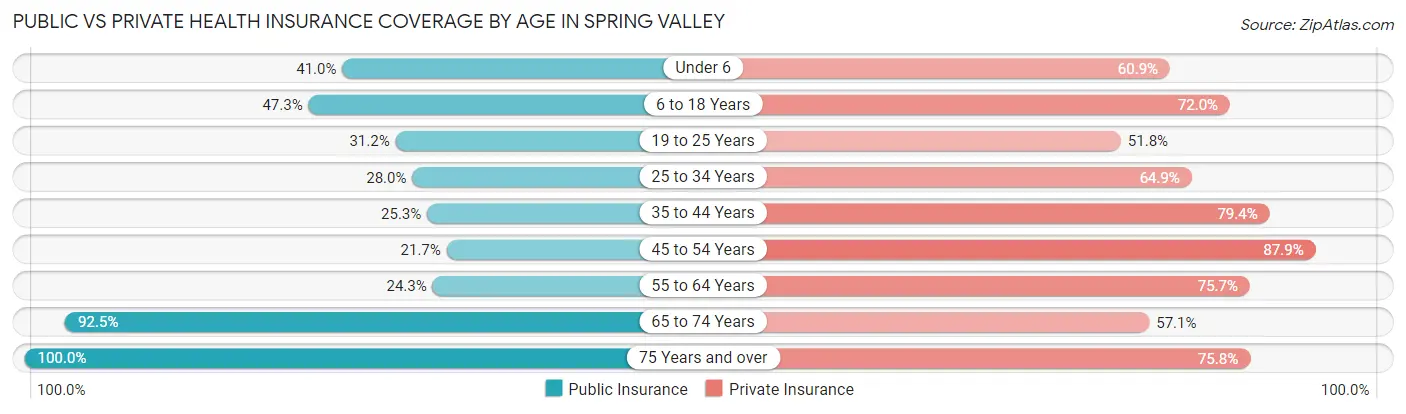
| Age Bracket | Public Insurance | Private Insurance |
| Under 6 | 64 (41.0%) | 95 (60.9%) |
| 6 to 18 Years | 220 (47.3%) | 335 (72.0%) |
| 19 to 25 Years | 86 (31.2%) | 143 (51.8%) |
| 25 to 34 Years | 76 (28.0%) | 176 (64.9%) |
| 35 to 44 Years | 65 (25.3%) | 204 (79.4%) |
| 45 to 54 Years | 52 (21.7%) | 211 (87.9%) |
| 55 to 64 Years | 93 (24.3%) | 290 (75.7%) |
| 65 to 74 Years | 222 (92.5%) | 137 (57.1%) |
| 75 Years and over | 165 (100.0%) | 125 (75.8%) |
| Total | 1,043 (42.5%) | 1,716 (70.0%) |
Disability Status by Sex by Age in Spring Valley
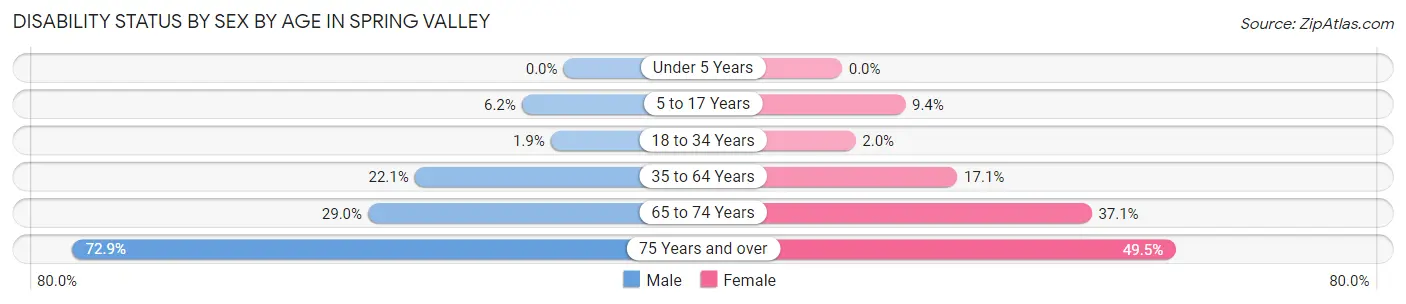
| Age Bracket | Male | Female |
| Under 5 Years | 0 (0.0%) | 0 (0.0%) |
| 5 to 17 Years | 15 (6.2%) | 23 (9.4%) |
| 18 to 34 Years | 5 (1.9%) | 6 (2.0%) |
| 35 to 64 Years | 99 (22.1%) | 74 (17.1%) |
| 65 to 74 Years | 36 (29.0%) | 43 (37.1%) |
| 75 Years and over | 51 (72.9%) | 47 (49.5%) |
Disability Class by Sex by Age in Spring Valley
Disability Class: Hearing Difficulty
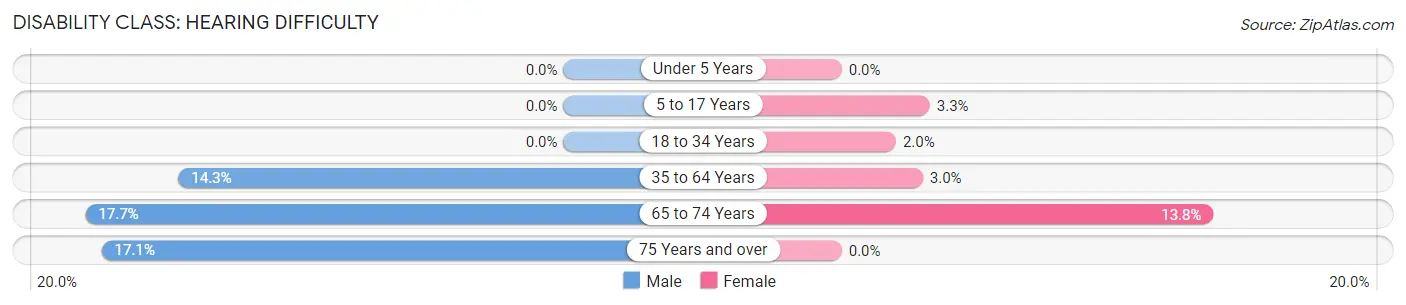
| Age Bracket | Male | Female |
| Under 5 Years | 0 (0.0%) | 0 (0.0%) |
| 5 to 17 Years | 0 (0.0%) | 8 (3.3%) |
| 18 to 34 Years | 0 (0.0%) | 6 (2.0%) |
| 35 to 64 Years | 64 (14.3%) | 13 (3.0%) |
| 65 to 74 Years | 22 (17.7%) | 16 (13.8%) |
| 75 Years and over | 12 (17.1%) | 0 (0.0%) |
Disability Class: Vision Difficulty
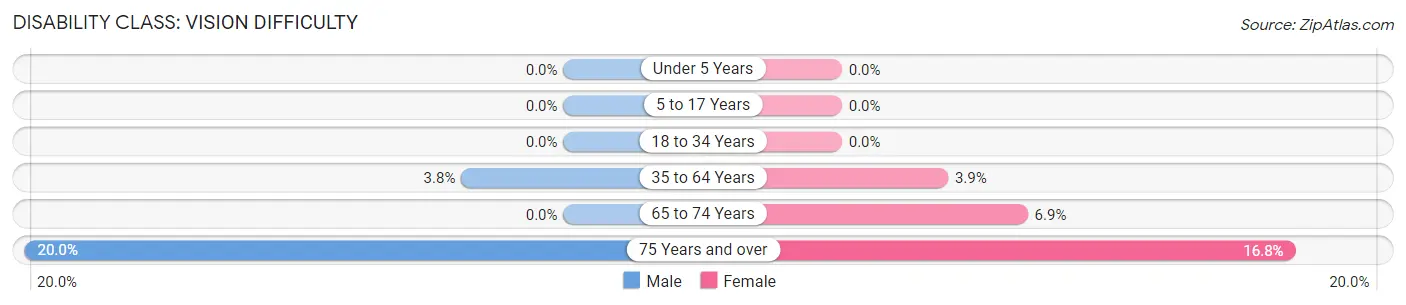
| Age Bracket | Male | Female |
| Under 5 Years | 0 (0.0%) | 0 (0.0%) |
| 5 to 17 Years | 0 (0.0%) | 0 (0.0%) |
| 18 to 34 Years | 0 (0.0%) | 0 (0.0%) |
| 35 to 64 Years | 17 (3.8%) | 17 (3.9%) |
| 65 to 74 Years | 0 (0.0%) | 8 (6.9%) |
| 75 Years and over | 14 (20.0%) | 16 (16.8%) |
Disability Class: Cognitive Difficulty
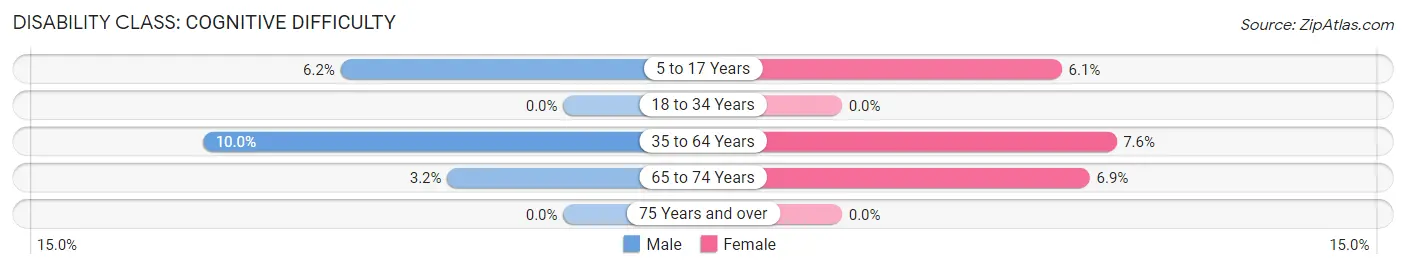
| Age Bracket | Male | Female |
| 5 to 17 Years | 15 (6.2%) | 15 (6.1%) |
| 18 to 34 Years | 0 (0.0%) | 0 (0.0%) |
| 35 to 64 Years | 45 (10.0%) | 33 (7.6%) |
| 65 to 74 Years | 4 (3.2%) | 8 (6.9%) |
| 75 Years and over | 0 (0.0%) | 0 (0.0%) |
Disability Class: Ambulatory Difficulty
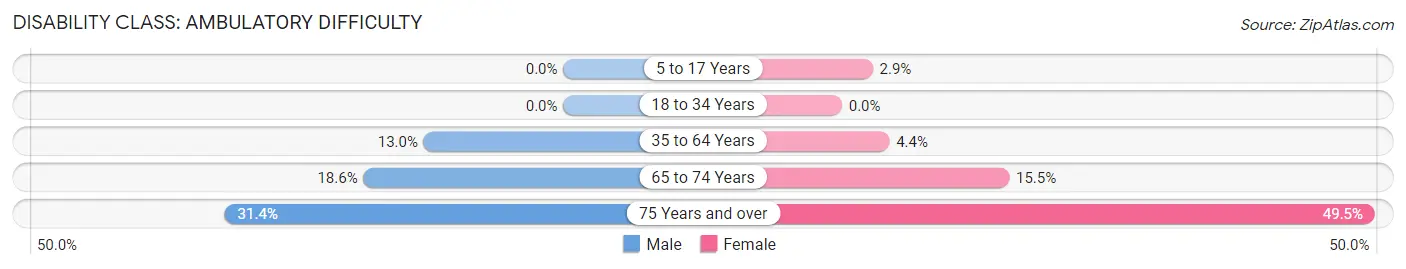
| Age Bracket | Male | Female |
| 5 to 17 Years | 0 (0.0%) | 7 (2.9%) |
| 18 to 34 Years | 0 (0.0%) | 0 (0.0%) |
| 35 to 64 Years | 58 (13.0%) | 19 (4.4%) |
| 65 to 74 Years | 23 (18.5%) | 18 (15.5%) |
| 75 Years and over | 22 (31.4%) | 47 (49.5%) |
Disability Class: Self-Care Difficulty
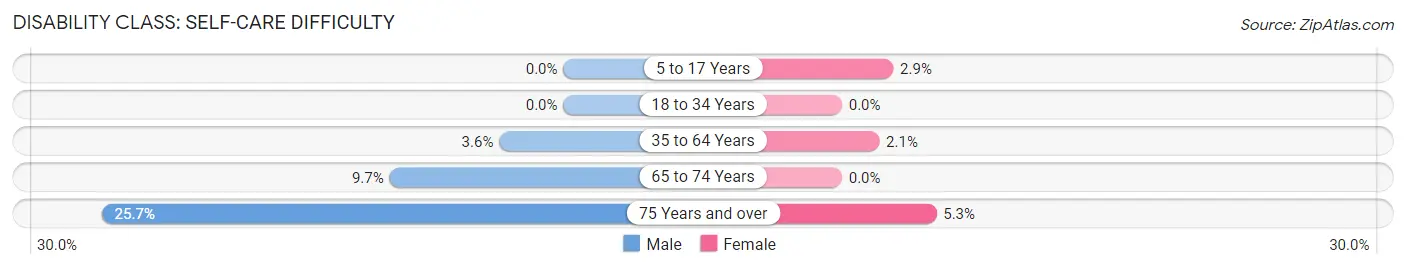
| Age Bracket | Male | Female |
| 5 to 17 Years | 0 (0.0%) | 7 (2.9%) |
| 18 to 34 Years | 0 (0.0%) | 0 (0.0%) |
| 35 to 64 Years | 16 (3.6%) | 9 (2.1%) |
| 65 to 74 Years | 12 (9.7%) | 0 (0.0%) |
| 75 Years and over | 18 (25.7%) | 5 (5.3%) |
Technology Access in Spring Valley
Computing Device Access in Spring Valley
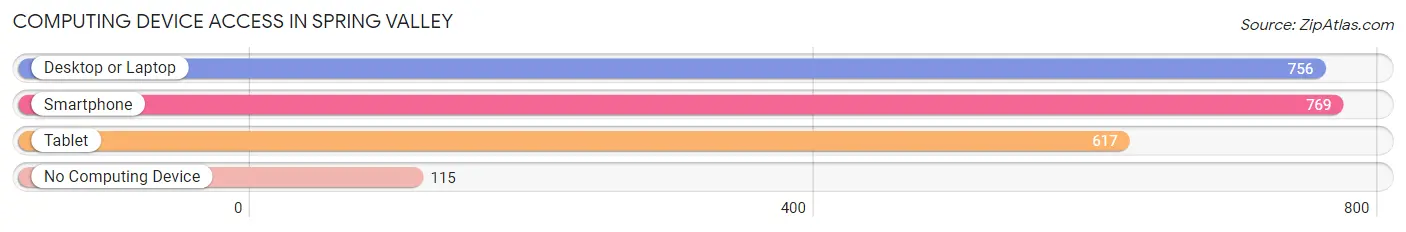
| Device Type | # Households | % Households |
| Desktop or Laptop | 756 | 73.3% |
| Smartphone | 769 | 74.6% |
| Tablet | 617 | 59.8% |
| No Computing Device | 115 | 11.2% |
| Total | 1,031 | 100.0% |
Internet Access in Spring Valley
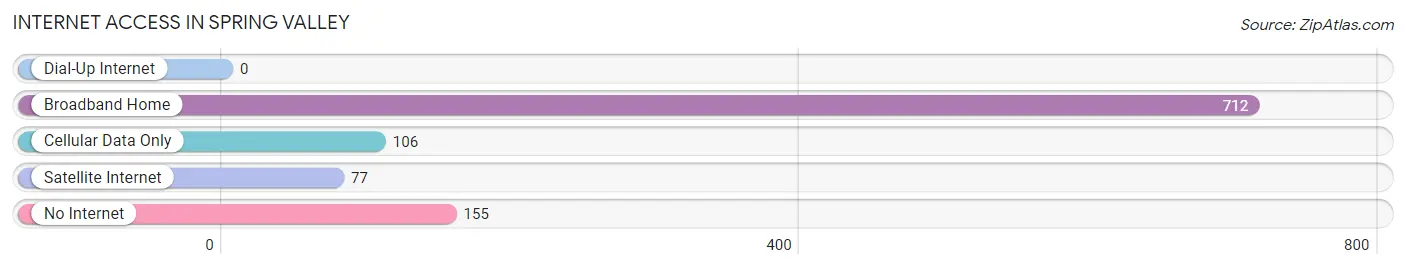
| Internet Type | # Households | % Households |
| Dial-Up Internet | 0 | 0.0% |
| Broadband Home | 712 | 69.1% |
| Cellular Data Only | 106 | 10.3% |
| Satellite Internet | 77 | 7.5% |
| No Internet | 155 | 15.0% |
| Total | 1,031 | 100.0% |
Spring Valley Summary
History
The area now known as Spring Valley, Minnesota was first settled in the late 1800s by a group of Norwegian immigrants. The first settlers were attracted to the area due to its fertile soil and abundant natural resources. The first settlers built a small log cabin and began farming the land. As the population grew, more settlers arrived and the town of Spring Valley was officially established in 1883.
The town was named after the nearby spring-fed creek, which provided the settlers with a reliable source of water. The town quickly grew and by the early 1900s, it had become a thriving agricultural community. The town was home to several businesses, including a general store, a blacksmith shop, a hotel, and a bank.
In the early 1900s, the railroad arrived in Spring Valley, connecting the town to the rest of the state. This allowed for the growth of the local economy and the population of the town began to grow rapidly. By the mid-1900s, the town had become a popular tourist destination, with many visitors coming to enjoy the natural beauty of the area.
Geography
Spring Valley is located in southeastern Minnesota, in Fillmore County. The town is situated on the banks of the Root River, which flows through the town and provides a source of recreation for the locals. The town is surrounded by rolling hills and lush farmland, making it a popular destination for outdoor activities such as fishing, hunting, and camping.
The town is located approximately 50 miles from the Twin Cities of Minneapolis and St. Paul. The nearest major airport is the Minneapolis-St. Paul International Airport, which is located about an hour away.
Economy
The economy of Spring Valley is largely based on agriculture. The town is home to several large farms, which produce a variety of crops, including corn, soybeans, and wheat. The town is also home to several small businesses, including restaurants, retail stores, and service providers.
The town is also home to a number of manufacturing companies, which produce a variety of products, including furniture, clothing, and electronics. The town is also home to a number of educational institutions, including a community college and a technical college.
Demographics
As of the 2010 census, the population of Spring Valley was 2,541. The town has a median age of 39.7 years, with the majority of the population being between the ages of 25 and 44. The town is predominantly white, with 92.3% of the population being white. The town also has a small Hispanic population, with 4.3% of the population being Hispanic.
The median household income in Spring Valley is $45,945, with the median income for a family being $54,945. The town has a poverty rate of 11.3%, with the majority of the population being employed in either agriculture or manufacturing.
Conclusion
Spring Valley, Minnesota is a small town located in southeastern Minnesota. The town has a rich history, with the first settlers arriving in the late 1800s. The town is largely based on agriculture, with many of the locals employed in either farming or manufacturing. The town is also home to a number of small businesses, educational institutions, and recreational activities. The population of the town is predominantly white, with a small Hispanic population. The median household income in Spring Valley is $45,945, with the poverty rate being 11.3%.
Common Questions
What is Per Capita Income in Spring Valley?
Per Capita income in Spring Valley is $32,163.
What is the Median Family Income in Spring Valley?
Median Family Income in Spring Valley is $83,125.
What is the Median Household income in Spring Valley?
Median Household Income in Spring Valley is $66,250.
What is Income or Wage Gap in Spring Valley?
Income or Wage Gap in Spring Valley is 12.2%.
Women in Spring Valley earn 87.8 cents for every dollar earned by a man.
What is Inequality or Gini Index in Spring Valley?
Inequality or Gini Index in Spring Valley is 0.41.
What is the Total Population of Spring Valley?
Total Population of Spring Valley is 2,512.
What is the Total Male Population of Spring Valley?
Total Male Population of Spring Valley is 1,215.
What is the Total Female Population of Spring Valley?
Total Female Population of Spring Valley is 1,297.
What is the Ratio of Males per 100 Females in Spring Valley?
There are 93.68 Males per 100 Females in Spring Valley.
What is the Ratio of Females per 100 Males in Spring Valley?
There are 106.75 Females per 100 Males in Spring Valley.
What is the Median Population Age in Spring Valley?
Median Population Age in Spring Valley is 38.4 Years.
What is the Average Family Size in Spring Valley
Average Family Size in Spring Valley is 2.9 People.
What is the Average Household Size in Spring Valley
Average Household Size in Spring Valley is 2.4 People.
How Large is the Labor Force in Spring Valley?
There are 1,355 People in the Labor Forcein in Spring Valley.
What is the Percentage of People in the Labor Force in Spring Valley?
67.9% of People are in the Labor Force in Spring Valley.
What is the Unemployment Rate in Spring Valley?
Unemployment Rate in Spring Valley is 3.9%.