South Haven, MN Map & Demographics
South Haven Map
South Haven Overview
$33,494
PER CAPITA INCOME
$81,250
AVG FAMILY INCOME
$90,625
AVG HOUSEHOLD INCOME
41.2%
WAGE / INCOME GAP [ % ]
58.8¢/ $1
WAGE / INCOME GAP [ $ ]
$13,278
FAMILY INCOME DEFICIT
0.31
INEQUALITY / GINI INDEX
179
TOTAL POPULATION
91
MALE POPULATION
88
FEMALE POPULATION
103.41
MALES / 100 FEMALES
96.70
FEMALES / 100 MALES
30.7
MEDIAN AGE
3.0
AVG FAMILY SIZE
2.8
AVG HOUSEHOLD SIZE
106
LABOR FORCE [ PEOPLE ]
73.1%
PERCENT IN LABOR FORCE
South Haven Zip Codes
South Haven Area Codes
Income in South Haven
Income Overview in South Haven
Per Capita Income in South Haven is $33,494, while median incomes of families and households are $81,250 and $90,625 respectively.
| Characteristic | Number | Measure |
| Per Capita Income | 179 | $33,494 |
| Median Family Income | 44 | $81,250 |
| Mean Family Income | 44 | $83,200 |
| Median Household Income | 65 | $90,625 |
| Mean Household Income | 65 | $85,945 |
| Income Deficit | 44 | $13,278 |
| Wage / Income Gap (%) | 179 | 41.22% |
| Wage / Income Gap ($) | 179 | 58.78¢ per $1 |
| Gini / Inequality Index | 179 | 0.31 |
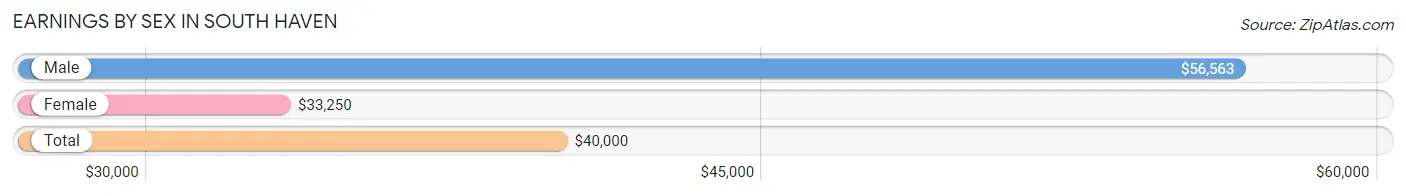
Earnings by Sex in South Haven
Average Earnings in South Haven are $40,000, $56,563 for men and $33,250 for women, a difference of 41.2%.
| Sex | Number | Average Earnings |
| Male | 57 (49.1%) | $56,563 |
| Female | 59 (50.9%) | $33,250 |
| Total | 116 (100.0%) | $40,000 |
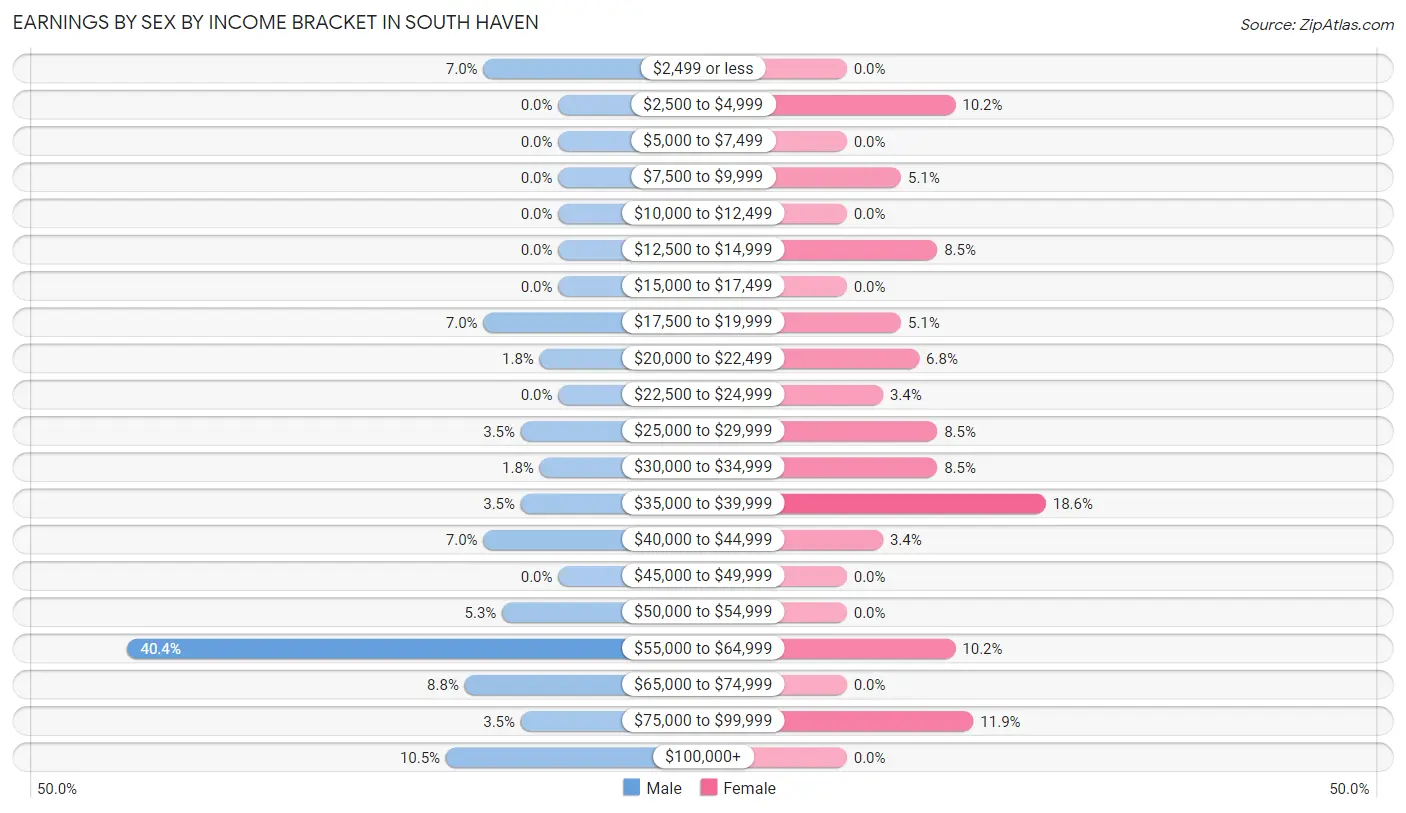
Earnings by Sex by Income Bracket in South Haven
The most common earnings brackets in South Haven are $55,000 to $64,999 for men (23 | 40.4%) and $35,000 to $39,999 for women (11 | 18.6%).
| Income | Male | Female |
| $2,499 or less | 4 (7.0%) | 0 (0.0%) |
| $2,500 to $4,999 | 0 (0.0%) | 6 (10.2%) |
| $5,000 to $7,499 | 0 (0.0%) | 0 (0.0%) |
| $7,500 to $9,999 | 0 (0.0%) | 3 (5.1%) |
| $10,000 to $12,499 | 0 (0.0%) | 0 (0.0%) |
| $12,500 to $14,999 | 0 (0.0%) | 5 (8.5%) |
| $15,000 to $17,499 | 0 (0.0%) | 0 (0.0%) |
| $17,500 to $19,999 | 4 (7.0%) | 3 (5.1%) |
| $20,000 to $22,499 | 1 (1.8%) | 4 (6.8%) |
| $22,500 to $24,999 | 0 (0.0%) | 2 (3.4%) |
| $25,000 to $29,999 | 2 (3.5%) | 5 (8.5%) |
| $30,000 to $34,999 | 1 (1.8%) | 5 (8.5%) |
| $35,000 to $39,999 | 2 (3.5%) | 11 (18.6%) |
| $40,000 to $44,999 | 4 (7.0%) | 2 (3.4%) |
| $45,000 to $49,999 | 0 (0.0%) | 0 (0.0%) |
| $50,000 to $54,999 | 3 (5.3%) | 0 (0.0%) |
| $55,000 to $64,999 | 23 (40.4%) | 6 (10.2%) |
| $65,000 to $74,999 | 5 (8.8%) | 0 (0.0%) |
| $75,000 to $99,999 | 2 (3.5%) | 7 (11.9%) |
| $100,000+ | 6 (10.5%) | 0 (0.0%) |
| Total | 57 (100.0%) | 59 (100.0%) |
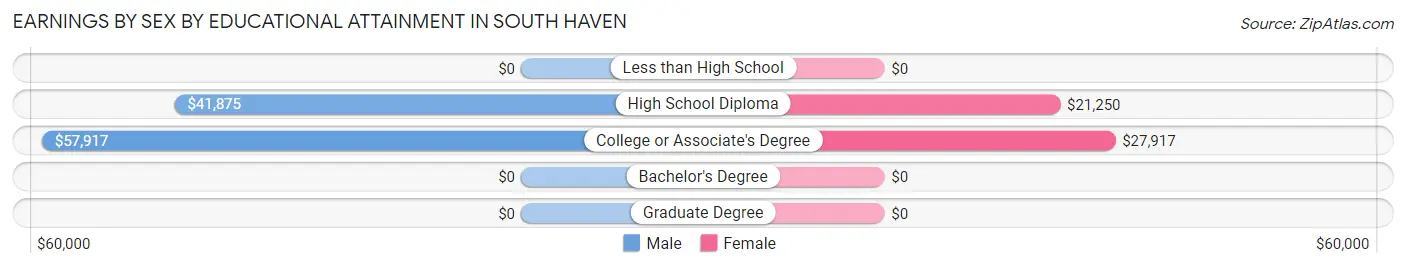
Earnings by Sex by Educational Attainment in South Haven
Average earnings in South Haven are $57,188 for men and $28,333 for women, a difference of 50.5%. Men with an educational attainment of college or associate's degree enjoy the highest average annual earnings of $57,917, while those with high school diploma education earn the least with $41,875. Women with an educational attainment of college or associate's degree earn the most with the average annual earnings of $27,917, while those with high school diploma education have the smallest earnings of $21,250.
| Educational Attainment | Male Income | Female Income |
| Less than High School | - | - |
| High School Diploma | $41,875 | $21,250 |
| College or Associate's Degree | $57,917 | $27,917 |
| Bachelor's Degree | - | - |
| Graduate Degree | - | - |
| Total | $57,188 | $28,333 |
Family Income in South Haven
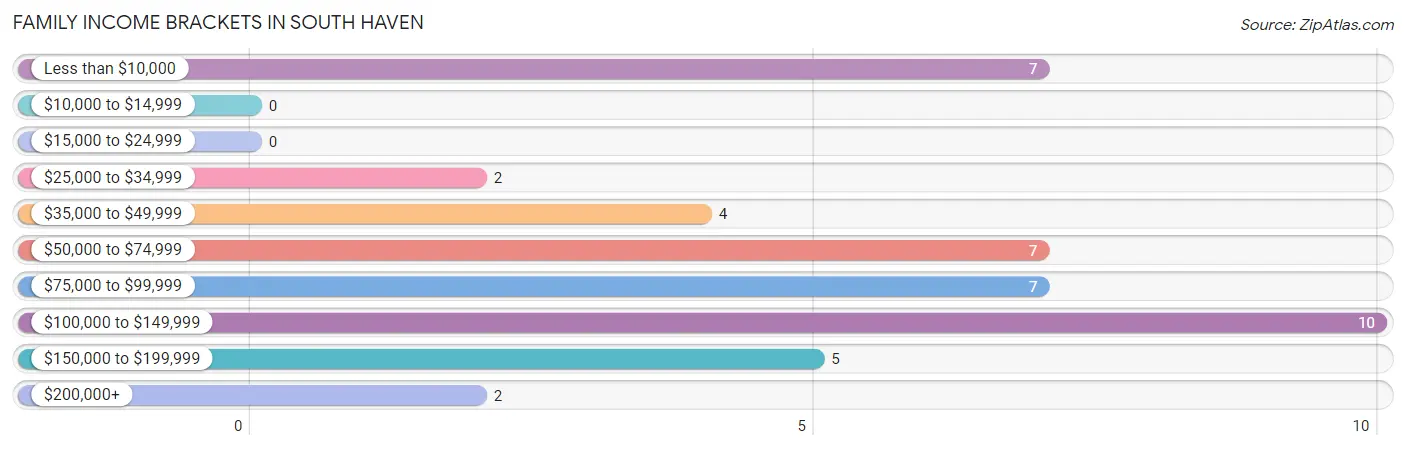
Family Income Brackets in South Haven
According to the South Haven family income data, there are 10 families falling into the $100,000 to $149,999 income range, which is the most common income bracket and makes up 22.7% of all families.
| Income Bracket | # Families | % Families |
| Less than $10,000 | 7 | 15.9% |
| $10,000 to $14,999 | 0 | 0.0% |
| $15,000 to $24,999 | 0 | 0.0% |
| $25,000 to $34,999 | 2 | 4.5% |
| $35,000 to $49,999 | 4 | 9.1% |
| $50,000 to $74,999 | 7 | 15.9% |
| $75,000 to $99,999 | 7 | 15.9% |
| $100,000 to $149,999 | 10 | 22.7% |
| $150,000 to $199,999 | 5 | 11.4% |
| $200,000+ | 2 | 4.5% |
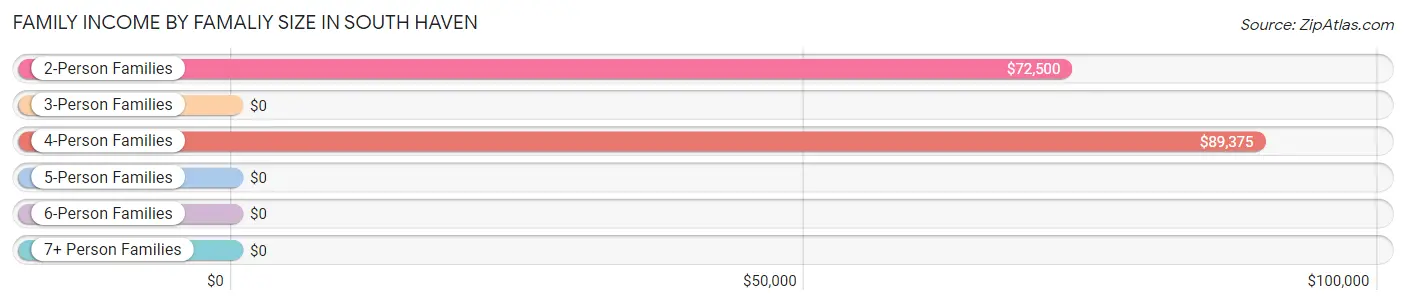
Family Income by Famaliy Size in South Haven
4-person families (7 | 15.9%) account for the highest median family income in South Haven with $89,375 per family, while 2-person families (16 | 36.4%) have the highest median income of $36,250 per family member.
| Income Bracket | # Families | Median Income |
| 2-Person Families | 16 (36.4%) | $72,500 |
| 3-Person Families | 16 (36.4%) | $0 |
| 4-Person Families | 7 (15.9%) | $89,375 |
| 5-Person Families | 3 (6.8%) | $0 |
| 6-Person Families | 2 (4.5%) | $0 |
| 7+ Person Families | 0 (0.0%) | $0 |
| Total | 44 (100.0%) | $81,250 |
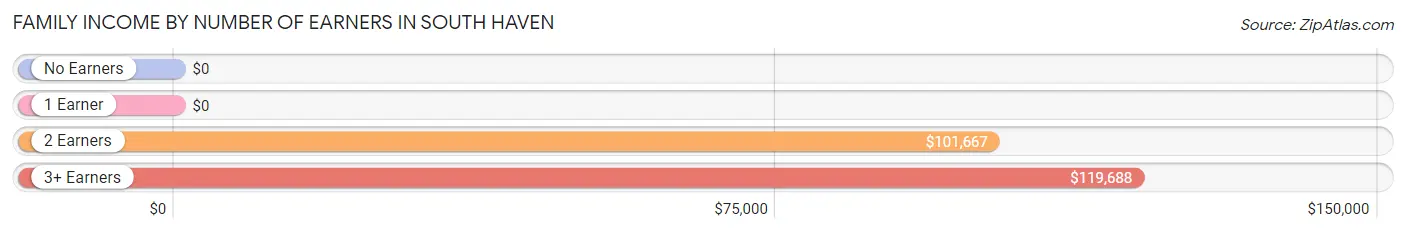
Family Income by Number of Earners in South Haven
| Number of Earners | # Families | Median Income |
| No Earners | 3 (6.8%) | $0 |
| 1 Earner | 18 (40.9%) | $0 |
| 2 Earners | 16 (36.4%) | $101,667 |
| 3+ Earners | 7 (15.9%) | $119,688 |
| Total | 44 (100.0%) | $81,250 |
Household Income in South Haven
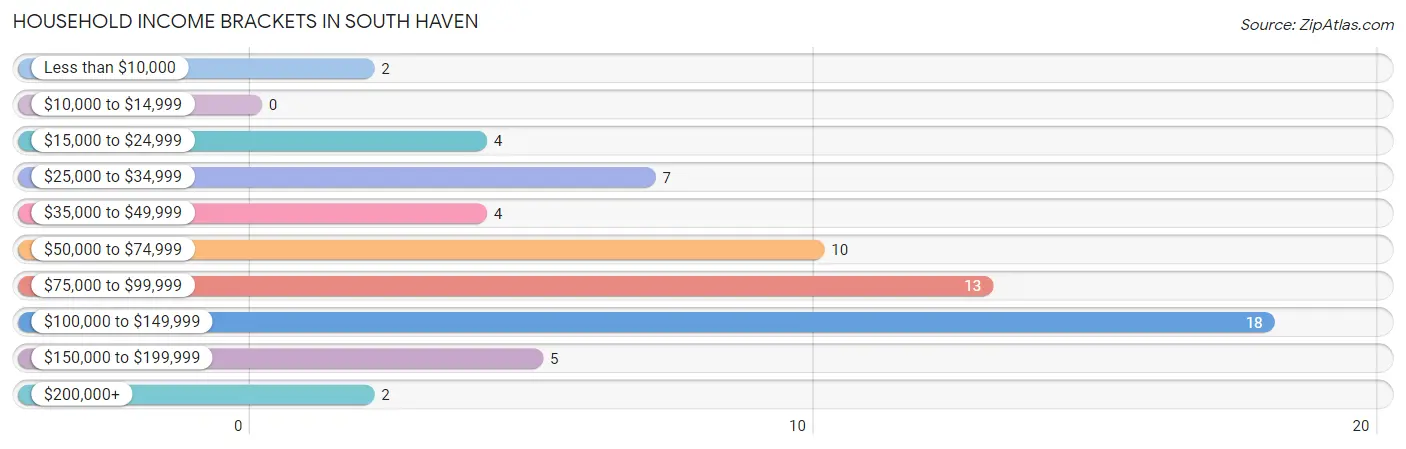
Household Income Brackets in South Haven
With 18 households falling in the category, the $100,000 to $149,999 income range is the most frequent in South Haven, accounting for 27.7% of all households.
| Income Bracket | # Households | % Households |
| Less than $10,000 | 2 | 3.1% |
| $10,000 to $14,999 | 0 | 0.0% |
| $15,000 to $24,999 | 4 | 6.2% |
| $25,000 to $34,999 | 7 | 10.8% |
| $35,000 to $49,999 | 4 | 6.2% |
| $50,000 to $74,999 | 10 | 15.4% |
| $75,000 to $99,999 | 13 | 20.0% |
| $100,000 to $149,999 | 18 | 27.7% |
| $150,000 to $199,999 | 5 | 7.7% |
| $200,000+ | 2 | 3.1% |
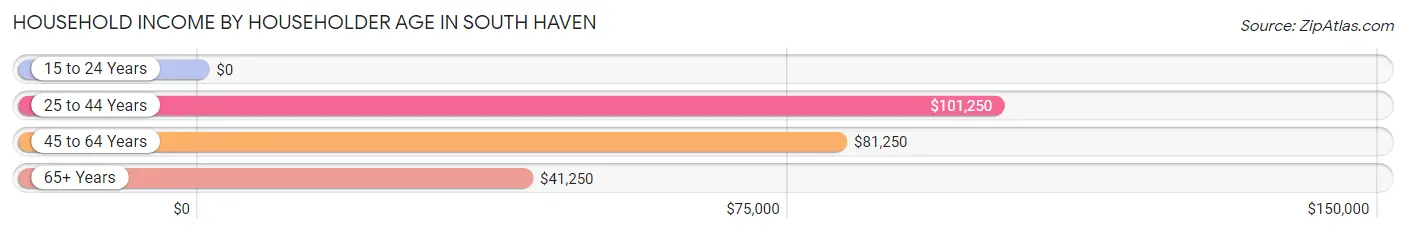
Household Income by Householder Age in South Haven
The median household income in South Haven is $90,625, with the highest median household income of $101,250 found in the 25 to 44 years age bracket for the primary householder. A total of 27 households (41.5%) fall into this category.
| Income Bracket | # Households | Median Income |
| 15 to 24 Years | 0 (0.0%) | $0 |
| 25 to 44 Years | 27 (41.5%) | $101,250 |
| 45 to 64 Years | 22 (33.9%) | $81,250 |
| 65+ Years | 16 (24.6%) | $41,250 |
| Total | 65 (100.0%) | $90,625 |
Poverty in South Haven
Income Below Poverty by Sex and Age in South Haven
With 12.1% poverty level for males and 18.2% for females among the residents of South Haven, 12 to 14 year old males and 12 to 14 year old females are the most vulnerable to poverty, with 1 males (100.0%) and 1 females (100.0%) in their respective age groups living below the poverty level.
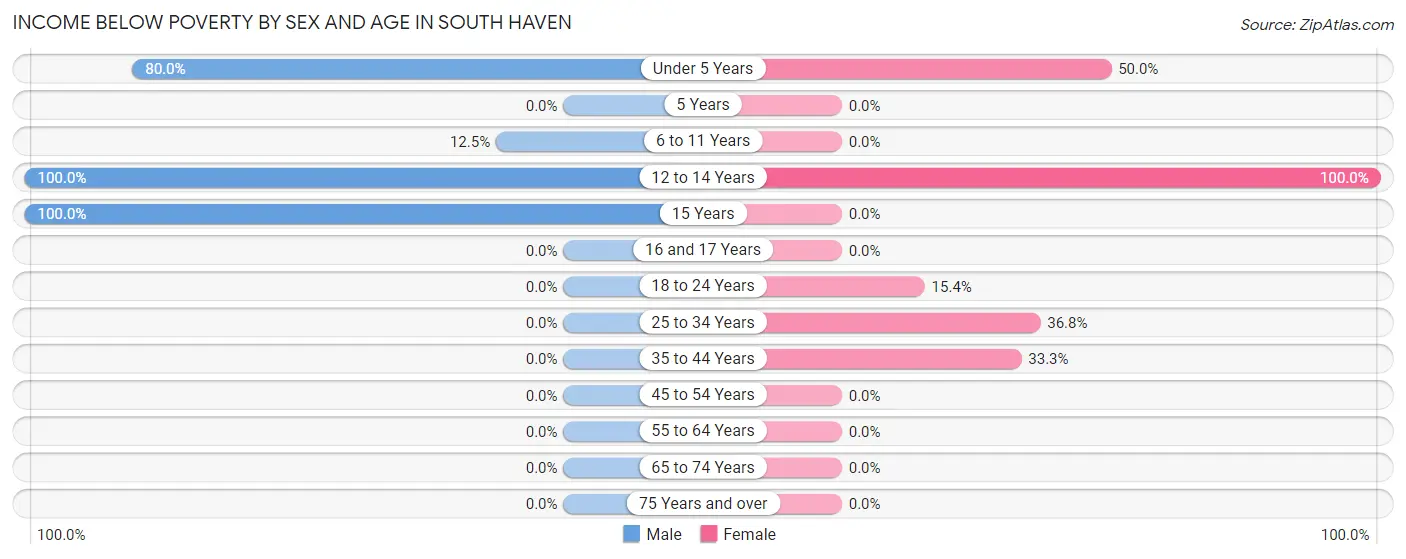
| Age Bracket | Male | Female |
| Under 5 Years | 8 (80.0%) | 4 (50.0%) |
| 5 Years | 0 (0.0%) | 0 (0.0%) |
| 6 to 11 Years | 1 (12.5%) | 0 (0.0%) |
| 12 to 14 Years | 1 (100.0%) | 1 (100.0%) |
| 15 Years | 1 (100.0%) | 0 (0.0%) |
| 16 and 17 Years | 0 (0.0%) | 0 (0.0%) |
| 18 to 24 Years | 0 (0.0%) | 2 (15.4%) |
| 25 to 34 Years | 0 (0.0%) | 7 (36.8%) |
| 35 to 44 Years | 0 (0.0%) | 2 (33.3%) |
| 45 to 54 Years | 0 (0.0%) | 0 (0.0%) |
| 55 to 64 Years | 0 (0.0%) | 0 (0.0%) |
| 65 to 74 Years | 0 (0.0%) | 0 (0.0%) |
| 75 Years and over | 0 (0.0%) | 0 (0.0%) |
| Total | 11 (12.1%) | 16 (18.2%) |
Income Above Poverty by Sex and Age in South Haven
According to the poverty statistics in South Haven, males aged 16 and 17 years and females aged 5 years are the age groups that are most secure financially, with 100.0% of males and 100.0% of females in these age groups living above the poverty line.
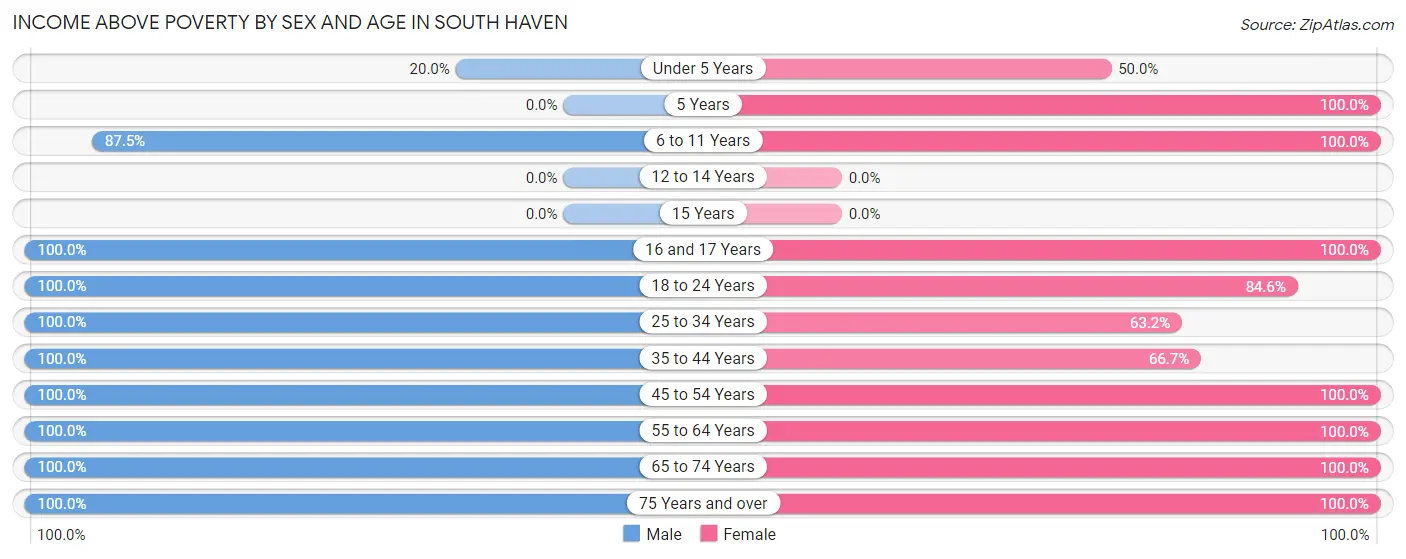
| Age Bracket | Male | Female |
| Under 5 Years | 2 (20.0%) | 4 (50.0%) |
| 5 Years | 0 (0.0%) | 1 (100.0%) |
| 6 to 11 Years | 7 (87.5%) | 4 (100.0%) |
| 12 to 14 Years | 0 (0.0%) | 0 (0.0%) |
| 15 Years | 0 (0.0%) | 0 (0.0%) |
| 16 and 17 Years | 4 (100.0%) | 2 (100.0%) |
| 18 to 24 Years | 4 (100.0%) | 11 (84.6%) |
| 25 to 34 Years | 24 (100.0%) | 12 (63.2%) |
| 35 to 44 Years | 12 (100.0%) | 4 (66.7%) |
| 45 to 54 Years | 8 (100.0%) | 10 (100.0%) |
| 55 to 64 Years | 7 (100.0%) | 11 (100.0%) |
| 65 to 74 Years | 8 (100.0%) | 6 (100.0%) |
| 75 Years and over | 4 (100.0%) | 7 (100.0%) |
| Total | 80 (87.9%) | 72 (81.8%) |
Income Below Poverty Among Married-Couple Families in South Haven
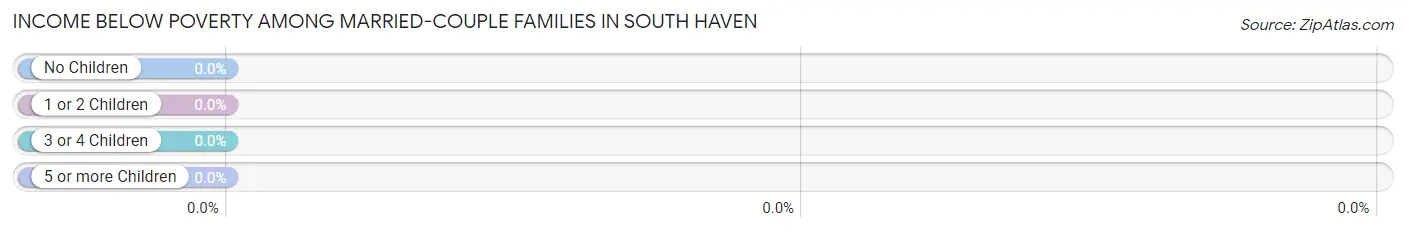
| Children | Above Poverty | Below Poverty |
| No Children | 18 (100.0%) | 0 (0.0%) |
| 1 or 2 Children | 12 (100.0%) | 0 (0.0%) |
| 3 or 4 Children | 2 (100.0%) | 0 (0.0%) |
| 5 or more Children | 0 (0.0%) | 0 (0.0%) |
| Total | 32 (100.0%) | 0 (0.0%) |
Income Below Poverty Among Single-Parent Households in South Haven
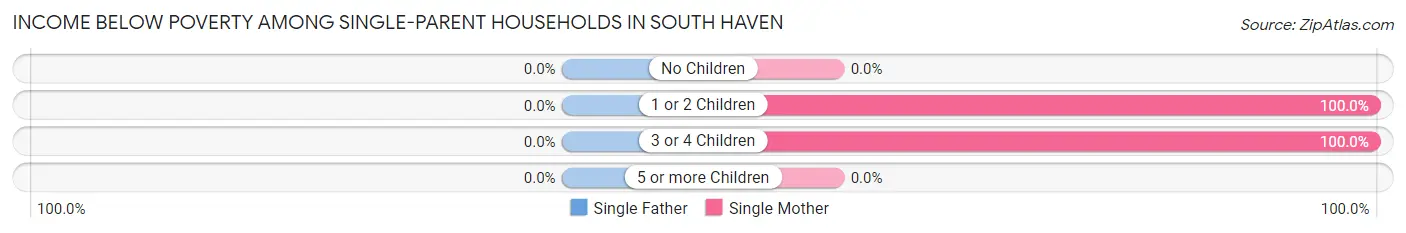
| Children | Single Father | Single Mother |
| No Children | 0 (0.0%) | 0 (0.0%) |
| 1 or 2 Children | 0 (0.0%) | 7 (100.0%) |
| 3 or 4 Children | 0 (0.0%) | 2 (100.0%) |
| 5 or more Children | 0 (0.0%) | 0 (0.0%) |
| Total | 0 (0.0%) | 9 (100.0%) |
Income Below Poverty Among Married-Couple vs Single-Parent Households in South Haven
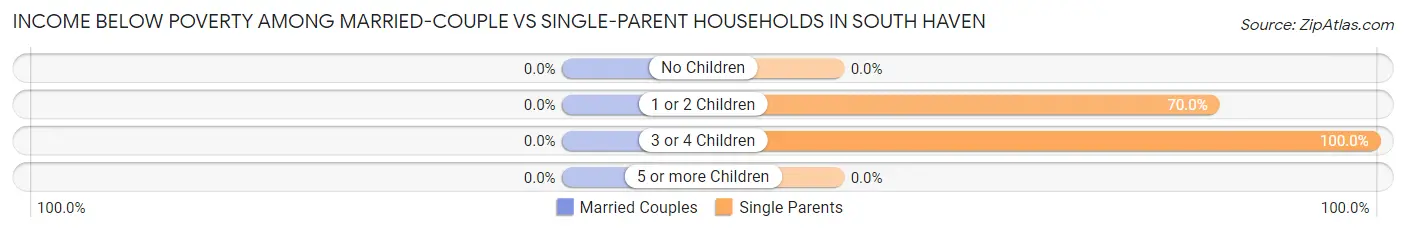
| Children | Married-Couple Families | Single-Parent Households |
| No Children | 0 (0.0%) | 0 (0.0%) |
| 1 or 2 Children | 0 (0.0%) | 7 (70.0%) |
| 3 or 4 Children | 0 (0.0%) | 2 (100.0%) |
| 5 or more Children | 0 (0.0%) | 0 (0.0%) |
| Total | 0 (0.0%) | 9 (75.0%) |
Race in South Haven
The most populous races in South Haven are White / Caucasian (172 | 96.1%), Some other Race (5 | 2.8%), and Two or more Races (2 | 1.1%).
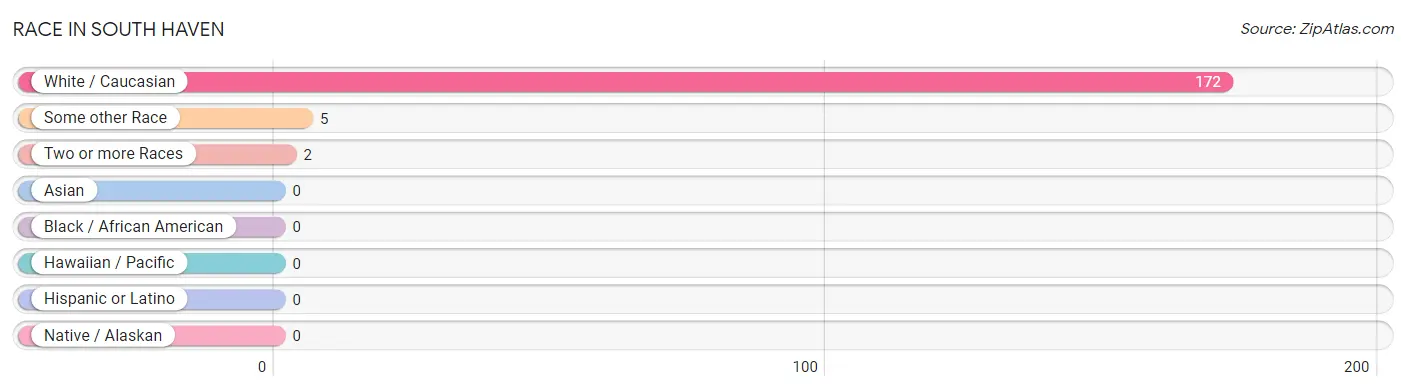
| Race | # Population | % Population |
| Asian | 0 | 0.0% |
| Black / African American | 0 | 0.0% |
| Hawaiian / Pacific | 0 | 0.0% |
| Hispanic or Latino | 0 | 0.0% |
| Native / Alaskan | 0 | 0.0% |
| White / Caucasian | 172 | 96.1% |
| Two or more Races | 2 | 1.1% |
| Some other Race | 5 | 2.8% |
| Total | 179 | 100.0% |
Ancestry in South Haven
The most populous ancestries reported in South Haven are German (34 | 19.0%), Swedish (19 | 10.6%), Irish (15 | 8.4%), Norwegian (13 | 7.3%), and Finnish (11 | 6.1%), together accounting for 51.4% of all South Haven residents.
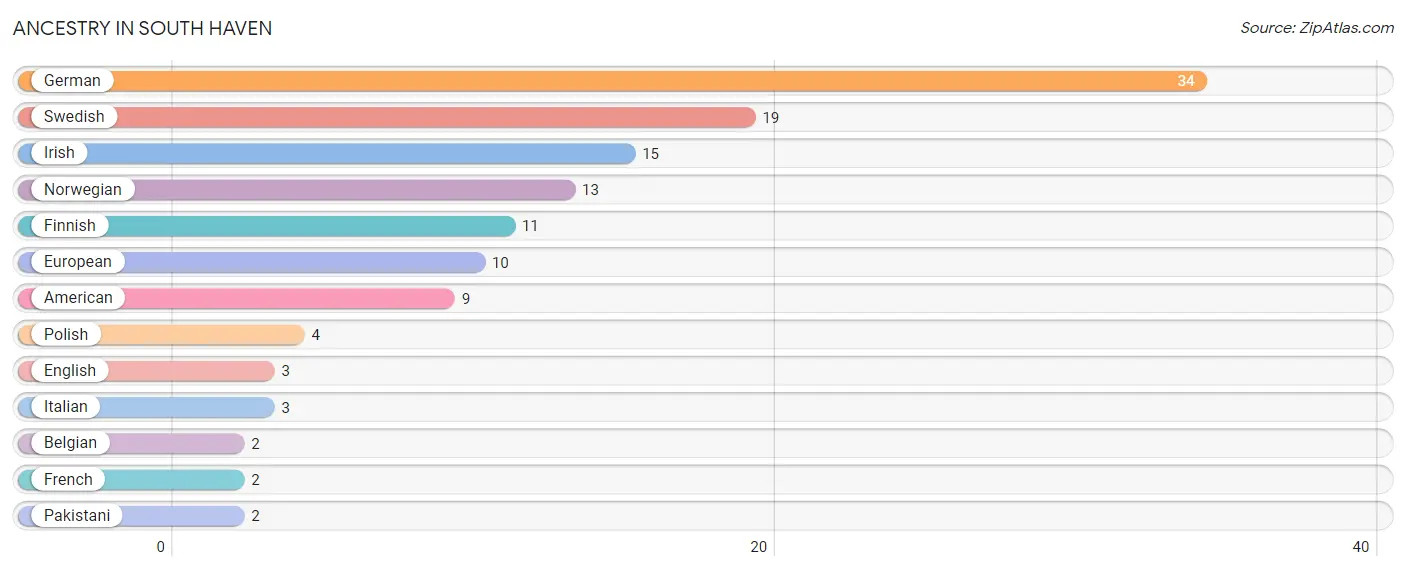
| Ancestry | # Population | % Population |
| American | 9 | 5.0% |
| Belgian | 2 | 1.1% |
| English | 3 | 1.7% |
| European | 10 | 5.6% |
| Finnish | 11 | 6.1% |
| French | 2 | 1.1% |
| German | 34 | 19.0% |
| Irish | 15 | 8.4% |
| Italian | 3 | 1.7% |
| Norwegian | 13 | 7.3% |
| Pakistani | 2 | 1.1% |
| Polish | 4 | 2.2% |
| Swedish | 19 | 10.6% | View All 13 Rows |
Immigrants in South Haven

| Immigration Origin | # Population | % Population | View All 0 Rows |
Sex and Age in South Haven
Sex and Age in South Haven
The most populous age groups in South Haven are 30 to 34 Years (13 | 14.3%) for men and 30 to 34 Years (10 | 11.4%) for women.
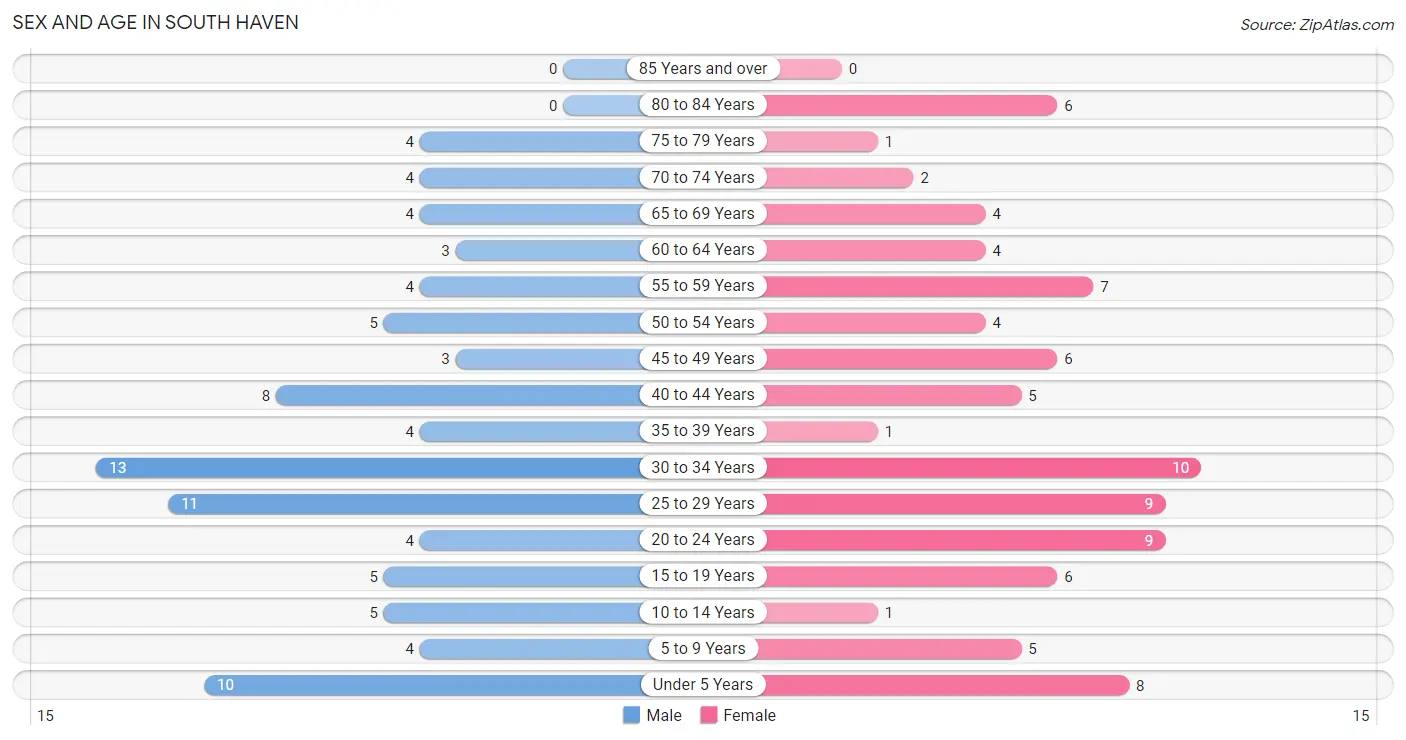
| Age Bracket | Male | Female |
| Under 5 Years | 10 (11.0%) | 8 (9.1%) |
| 5 to 9 Years | 4 (4.4%) | 5 (5.7%) |
| 10 to 14 Years | 5 (5.5%) | 1 (1.1%) |
| 15 to 19 Years | 5 (5.5%) | 6 (6.8%) |
| 20 to 24 Years | 4 (4.4%) | 9 (10.2%) |
| 25 to 29 Years | 11 (12.1%) | 9 (10.2%) |
| 30 to 34 Years | 13 (14.3%) | 10 (11.4%) |
| 35 to 39 Years | 4 (4.4%) | 1 (1.1%) |
| 40 to 44 Years | 8 (8.8%) | 5 (5.7%) |
| 45 to 49 Years | 3 (3.3%) | 6 (6.8%) |
| 50 to 54 Years | 5 (5.5%) | 4 (4.5%) |
| 55 to 59 Years | 4 (4.4%) | 7 (8.0%) |
| 60 to 64 Years | 3 (3.3%) | 4 (4.5%) |
| 65 to 69 Years | 4 (4.4%) | 4 (4.5%) |
| 70 to 74 Years | 4 (4.4%) | 2 (2.3%) |
| 75 to 79 Years | 4 (4.4%) | 1 (1.1%) |
| 80 to 84 Years | 0 (0.0%) | 6 (6.8%) |
| 85 Years and over | 0 (0.0%) | 0 (0.0%) |
| Total | 91 (100.0%) | 88 (100.0%) |
Families and Households in South Haven
Median Family Size in South Haven
The median family size in South Haven is 2.95 persons per family, with married-couple families (32 | 72.7%) accounting for the largest median family size of 3 persons per family. On the other hand, single male/father families (3 | 6.8%) represent the smallest median family size with 2.33 persons per family.
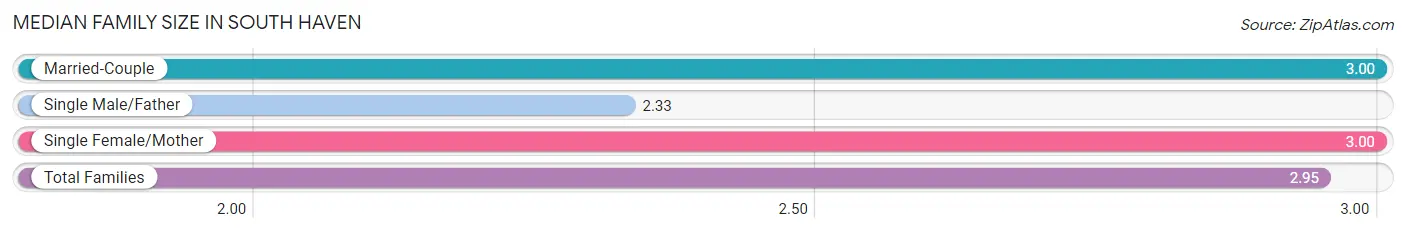
| Family Type | # Families | Family Size |
| Married-Couple | 32 (72.7%) | 3.00 |
| Single Male/Father | 3 (6.8%) | 2.33 |
| Single Female/Mother | 9 (20.4%) | 3.00 |
| Total Families | 44 (100.0%) | 2.95 |
Median Household Size in South Haven
The median household size in South Haven is 2.75 persons per household, with single female/mother households (9 | 13.9%) accounting for the largest median household size of 4.33 persons per household. non-family households (21 | 32.3%) represent the smallest median household size with 1.57 persons per household.
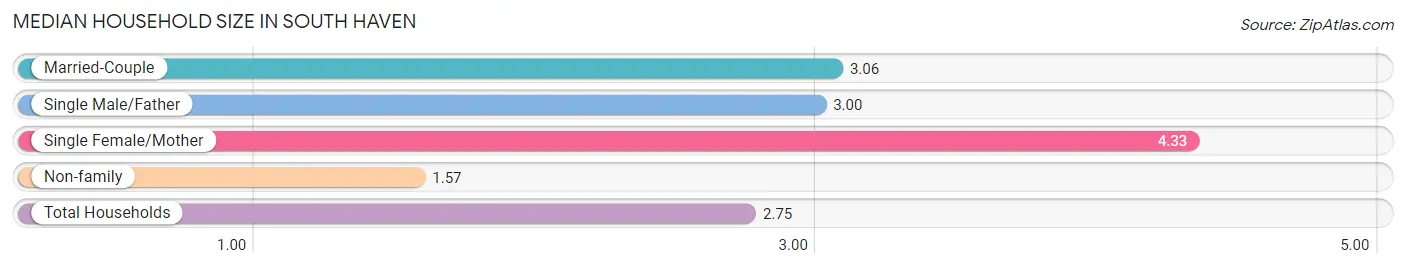
| Household Type | # Households | Household Size |
| Married-Couple | 32 (49.2%) | 3.06 |
| Single Male/Father | 3 (4.6%) | 3.00 |
| Single Female/Mother | 9 (13.9%) | 4.33 |
| Non-family | 21 (32.3%) | 1.57 |
| Total Households | 65 (100.0%) | 2.75 |
Household Size by Marriage Status in South Haven
Out of a total of 65 households in South Haven, 44 (67.7%) are family households, while 21 (32.3%) are nonfamily households. The most numerous type of family households are 2-person households, comprising 15, and the most common type of nonfamily households are 1-person households, comprising 14.
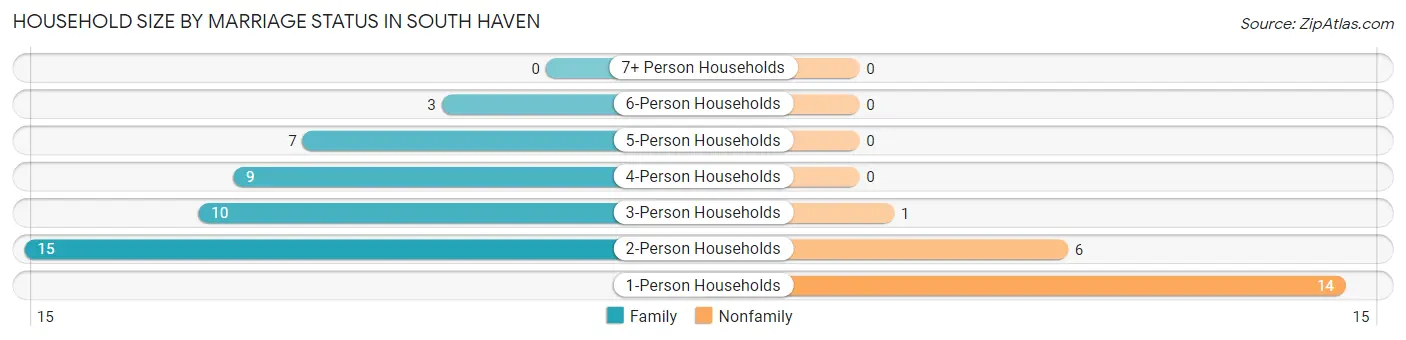
| Household Size | Family Households | Nonfamily Households |
| 1-Person Households | - | 14 (21.5%) |
| 2-Person Households | 15 (23.1%) | 6 (9.2%) |
| 3-Person Households | 10 (15.4%) | 1 (1.5%) |
| 4-Person Households | 9 (13.9%) | 0 (0.0%) |
| 5-Person Households | 7 (10.8%) | 0 (0.0%) |
| 6-Person Households | 3 (4.6%) | 0 (0.0%) |
| 7+ Person Households | 0 (0.0%) | 0 (0.0%) |
| Total | 44 (67.7%) | 21 (32.3%) |
Female Fertility in South Haven
Fertility by Age in South Haven
Average fertility rate in South Haven is 174.0 births per 1,000 women. Women in the age bracket of 20 to 34 years have the highest fertility rate with 286.0 births per 1,000 women. Women in the age bracket of 20 to 34 years acount for 100.0% of all women with births.
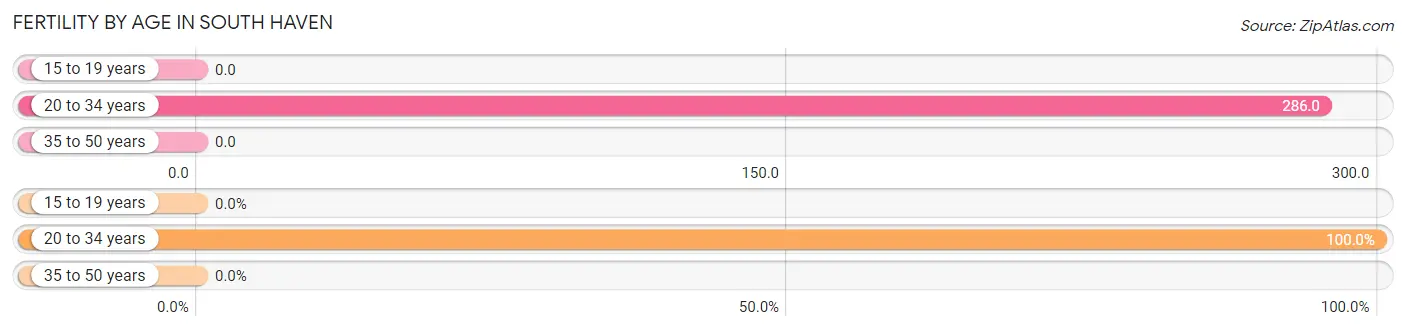
| Age Bracket | Women with Births | Births / 1,000 Women |
| 15 to 19 years | 0 (0.0%) | 0.0 |
| 20 to 34 years | 8 (100.0%) | 286.0 |
| 35 to 50 years | 0 (0.0%) | 0.0 |
| Total | 8 (100.0%) | 174.0 |
Fertility by Age by Marriage Status in South Haven
25.0% of women with births (8) in South Haven are married. The highest percentage of unmarried women with births falls into 20 to 34 years age bracket with 75.0% of them unmarried at the time of birth, while the lowest percentage of unmarried women with births belong to 20 to 34 years age bracket with 75.0% of them unmarried.
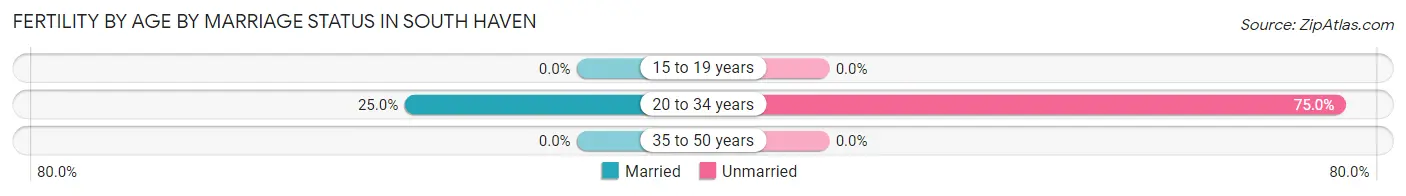
| Age Bracket | Married | Unmarried |
| 15 to 19 years | 0 (0.0%) | 0 (0.0%) |
| 20 to 34 years | 2 (25.0%) | 6 (75.0%) |
| 35 to 50 years | 0 (0.0%) | 0 (0.0%) |
| Total | 2 (25.0%) | 6 (75.0%) |
Fertility by Education in South Haven
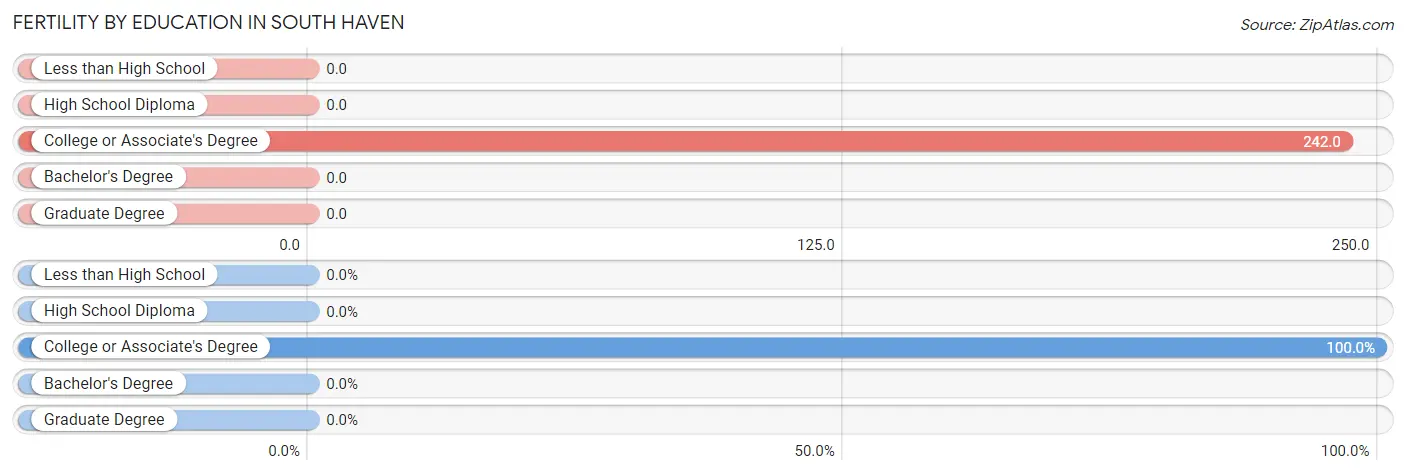
| Educational Attainment | Women with Births | Births / 1,000 Women |
| Less than High School | 0 (0.0%) | 0.0 |
| High School Diploma | 0 (0.0%) | 0.0 |
| College or Associate's Degree | 8 (100.0%) | 242.0 |
| Bachelor's Degree | 0 (0.0%) | 0.0 |
| Graduate Degree | 0 (0.0%) | 0.0 |
| Total | 8 (100.0%) | 174.0 |
Fertility by Education by Marriage Status in South Haven
75.0% of women with births in South Haven are unmarried. Women with the educational attainment of college or associate's degree are most likely to be married with 25.0% of them married at childbirth, while women with the educational attainment of college or associate's degree are least likely to be married with 75.0% of them unmarried at childbirth.
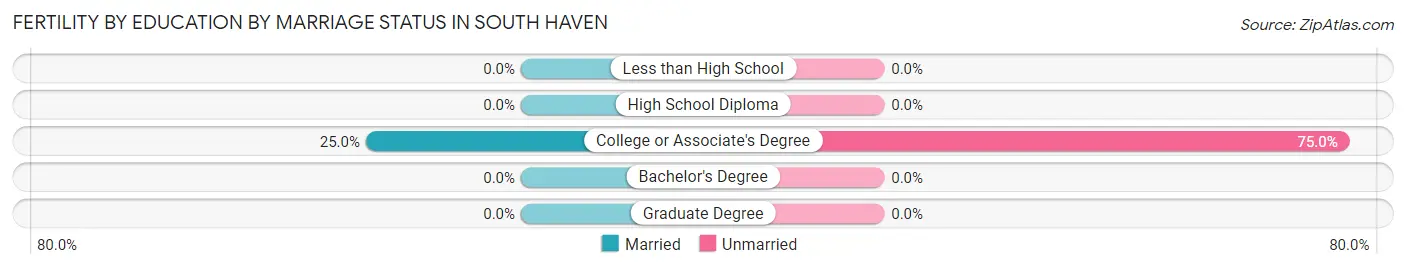
| Educational Attainment | Married | Unmarried |
| Less than High School | 0 (0.0%) | 0 (0.0%) |
| High School Diploma | 0 (0.0%) | 0 (0.0%) |
| College or Associate's Degree | 2 (25.0%) | 6 (75.0%) |
| Bachelor's Degree | 0 (0.0%) | 0 (0.0%) |
| Graduate Degree | 0 (0.0%) | 0 (0.0%) |
| Total | 2 (25.0%) | 6 (75.0%) |
Employment Characteristics in South Haven
Employment by Class of Employer in South Haven
Among the 103 employed individuals in South Haven, private company employees (73 | 70.9%), local government employees (11 | 10.7%), and self-employed (not incorporated) (10 | 9.7%) make up the most common classes of employment.
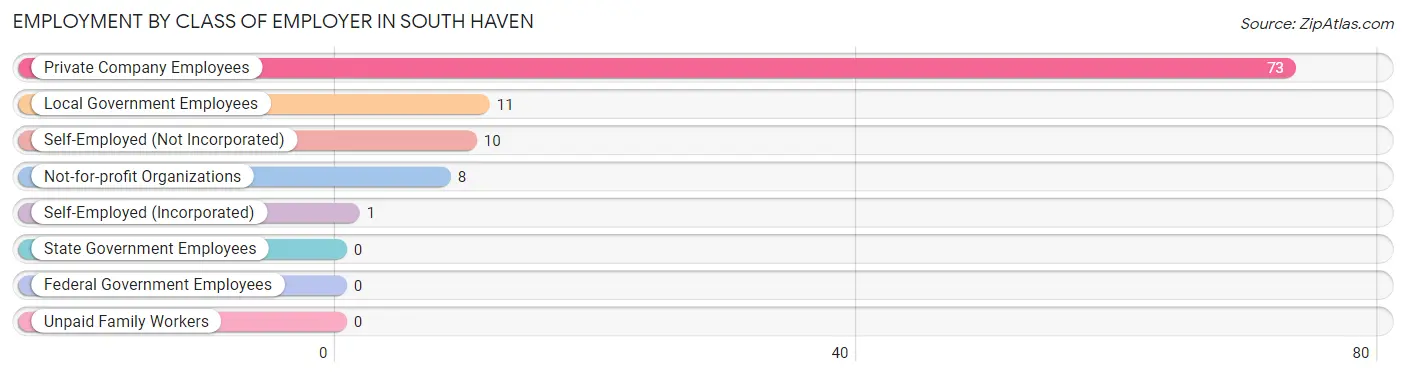
| Employer Class | # Employees | % Employees |
| Private Company Employees | 73 | 70.9% |
| Self-Employed (Incorporated) | 1 | 1.0% |
| Self-Employed (Not Incorporated) | 10 | 9.7% |
| Not-for-profit Organizations | 8 | 7.8% |
| Local Government Employees | 11 | 10.7% |
| State Government Employees | 0 | 0.0% |
| Federal Government Employees | 0 | 0.0% |
| Unpaid Family Workers | 0 | 0.0% |
| Total | 103 | 100.0% |
Employment Status by Age in South Haven
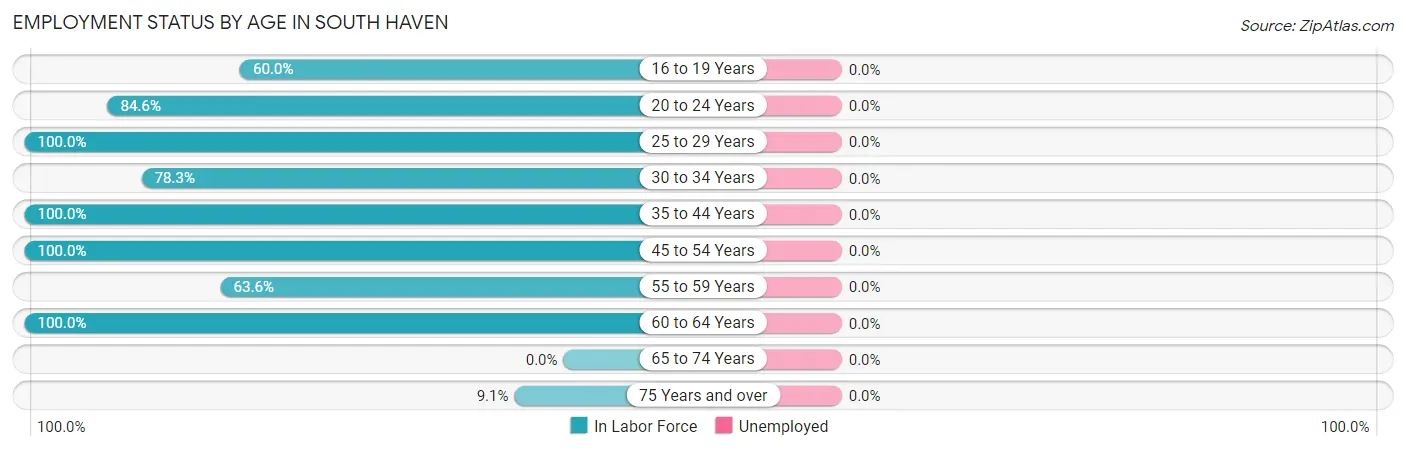
| Age Bracket | In Labor Force | Unemployed |
| 16 to 19 Years | 6 (60.0%) | 0 (0.0%) |
| 20 to 24 Years | 11 (84.6%) | 0 (0.0%) |
| 25 to 29 Years | 20 (100.0%) | 0 (0.0%) |
| 30 to 34 Years | 18 (78.3%) | 0 (0.0%) |
| 35 to 44 Years | 18 (100.0%) | 0 (0.0%) |
| 45 to 54 Years | 18 (100.0%) | 0 (0.0%) |
| 55 to 59 Years | 7 (63.6%) | 0 (0.0%) |
| 60 to 64 Years | 7 (100.0%) | 0 (0.0%) |
| 65 to 74 Years | 0 (0.0%) | 0 (0.0%) |
| 75 Years and over | 1 (9.1%) | 0 (0.0%) |
| Total | 106 (73.1%) | 0 (0.0%) |
Employment Status by Educational Attainment in South Haven
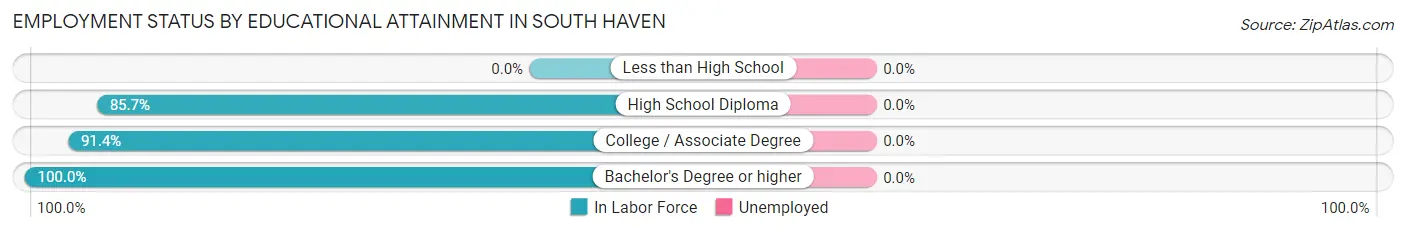
| Educational Attainment | In Labor Force | Unemployed |
| Less than High School | 0 (0.0%) | 0 (0.0%) |
| High School Diploma | 24 (85.7%) | 0 (0.0%) |
| College / Associate Degree | 53 (91.4%) | 0 (0.0%) |
| Bachelor's Degree or higher | 11 (100.0%) | 0 (0.0%) |
| Total | 88 (90.7%) | 0 (0.0%) |
Employment Occupations by Sex in South Haven
Management, Business, Science and Arts Occupations
The most common Management, Business, Science and Arts occupations in South Haven are Management (7 | 6.6%), Community & Social Service (7 | 6.6%), Education Instruction & Library (7 | 6.6%), Health Diagnosing & Treating (5 | 4.7%), and Health Technologists (3 | 2.8%).
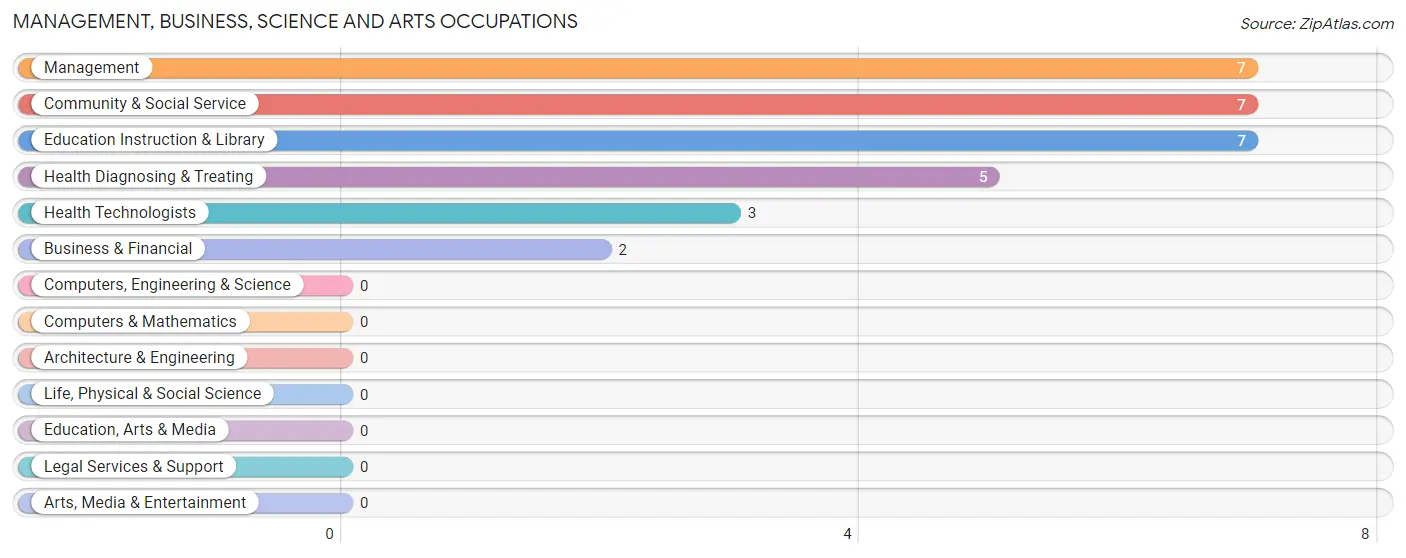
Management, Business, Science and Arts Occupations by Sex
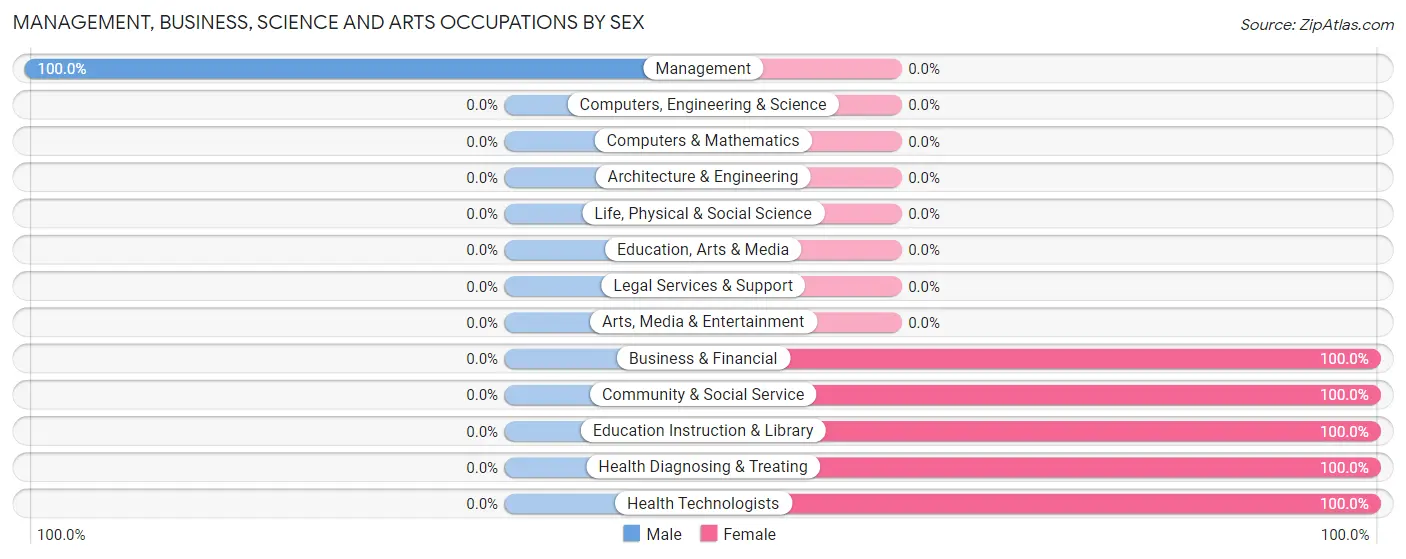
| Occupation | Male | Female |
| Management | 7 (100.0%) | 0 (0.0%) |
| Business & Financial | 0 (0.0%) | 2 (100.0%) |
| Computers, Engineering & Science | 0 (0.0%) | 0 (0.0%) |
| Computers & Mathematics | 0 (0.0%) | 0 (0.0%) |
| Architecture & Engineering | 0 (0.0%) | 0 (0.0%) |
| Life, Physical & Social Science | 0 (0.0%) | 0 (0.0%) |
| Community & Social Service | 0 (0.0%) | 7 (100.0%) |
| Education, Arts & Media | 0 (0.0%) | 0 (0.0%) |
| Legal Services & Support | 0 (0.0%) | 0 (0.0%) |
| Education Instruction & Library | 0 (0.0%) | 7 (100.0%) |
| Arts, Media & Entertainment | 0 (0.0%) | 0 (0.0%) |
| Health Diagnosing & Treating | 0 (0.0%) | 5 (100.0%) |
| Health Technologists | 0 (0.0%) | 3 (100.0%) |
| Total (Category) | 7 (33.3%) | 14 (66.7%) |
| Total (Overall) | 53 (50.0%) | 53 (50.0%) |
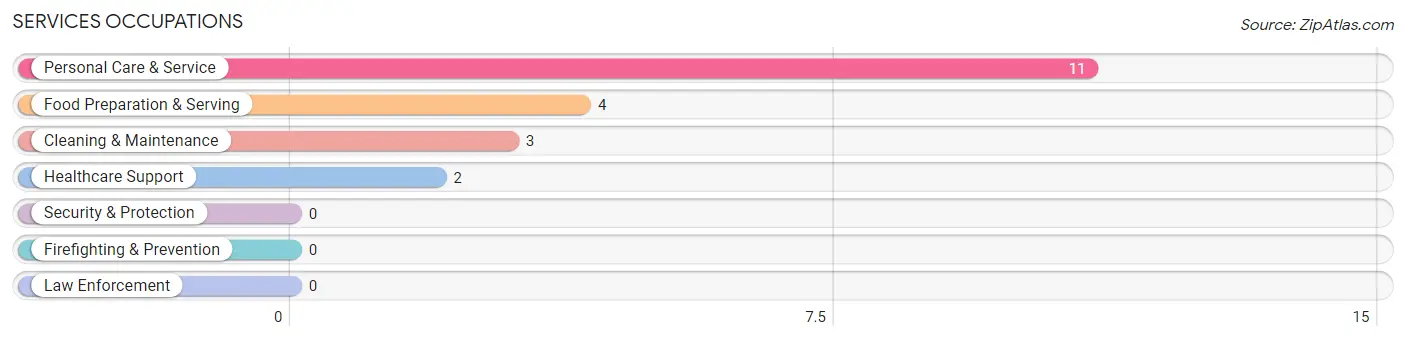
Services Occupations
The most common Services occupations in South Haven are Personal Care & Service (11 | 10.4%), Food Preparation & Serving (4 | 3.8%), Cleaning & Maintenance (3 | 2.8%), and Healthcare Support (2 | 1.9%).
Services Occupations by Sex
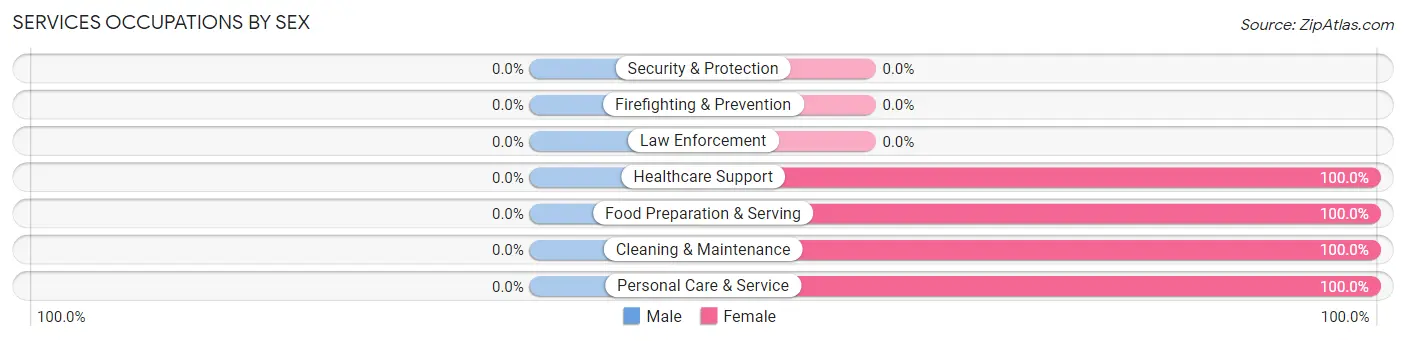
| Occupation | Male | Female |
| Healthcare Support | 0 (0.0%) | 2 (100.0%) |
| Security & Protection | 0 (0.0%) | 0 (0.0%) |
| Firefighting & Prevention | 0 (0.0%) | 0 (0.0%) |
| Law Enforcement | 0 (0.0%) | 0 (0.0%) |
| Food Preparation & Serving | 0 (0.0%) | 4 (100.0%) |
| Cleaning & Maintenance | 0 (0.0%) | 3 (100.0%) |
| Personal Care & Service | 0 (0.0%) | 11 (100.0%) |
| Total (Category) | 0 (0.0%) | 20 (100.0%) |
| Total (Overall) | 53 (50.0%) | 53 (50.0%) |
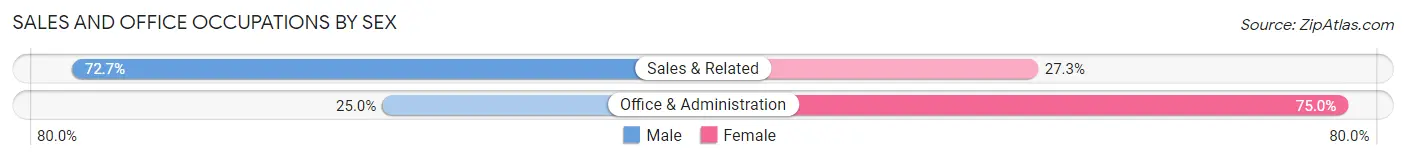
Sales and Office Occupations
The most common Sales and Office occupations in South Haven are Office & Administration (20 | 18.9%), and Sales & Related (11 | 10.4%).
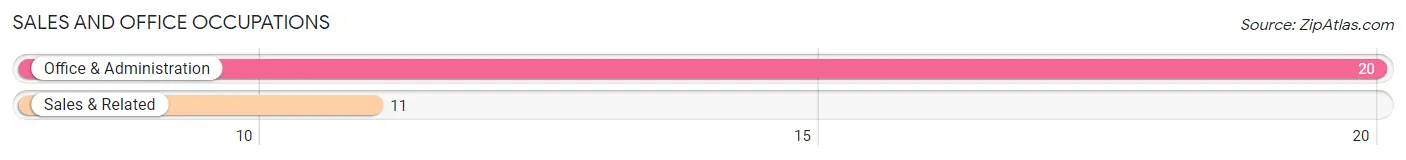
Sales and Office Occupations by Sex
| Occupation | Male | Female |
| Sales & Related | 8 (72.7%) | 3 (27.3%) |
| Office & Administration | 5 (25.0%) | 15 (75.0%) |
| Total (Category) | 13 (41.9%) | 18 (58.1%) |
| Total (Overall) | 53 (50.0%) | 53 (50.0%) |
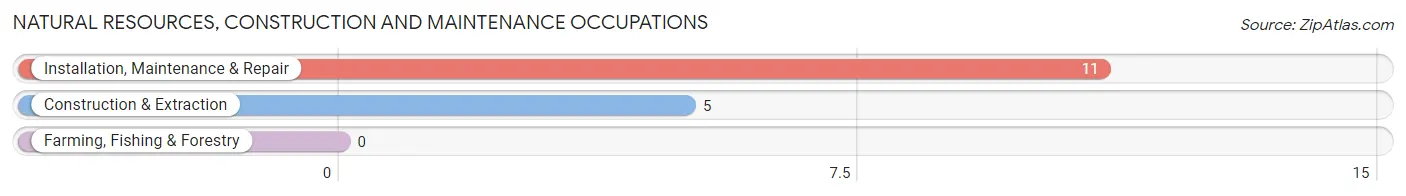
Natural Resources, Construction and Maintenance Occupations
The most common Natural Resources, Construction and Maintenance occupations in South Haven are Installation, Maintenance & Repair (11 | 10.4%), and Construction & Extraction (5 | 4.7%).
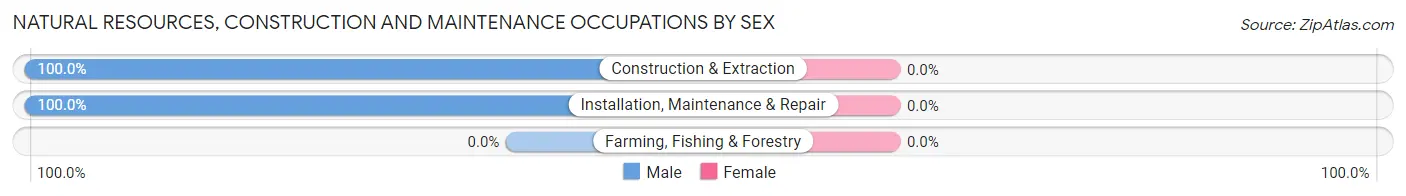
Natural Resources, Construction and Maintenance Occupations by Sex
| Occupation | Male | Female |
| Farming, Fishing & Forestry | 0 (0.0%) | 0 (0.0%) |
| Construction & Extraction | 5 (100.0%) | 0 (0.0%) |
| Installation, Maintenance & Repair | 11 (100.0%) | 0 (0.0%) |
| Total (Category) | 16 (100.0%) | 0 (0.0%) |
| Total (Overall) | 53 (50.0%) | 53 (50.0%) |
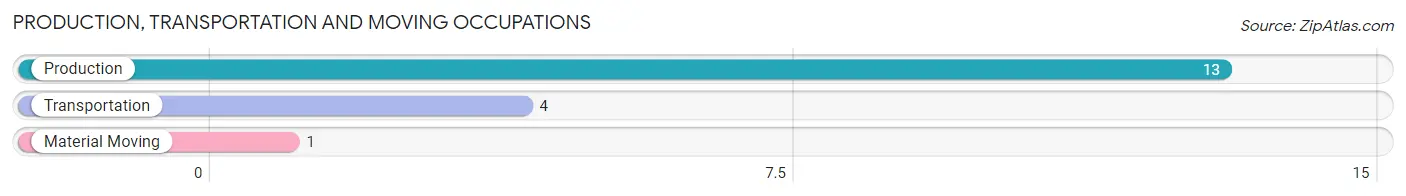
Production, Transportation and Moving Occupations
The most common Production, Transportation and Moving occupations in South Haven are Production (13 | 12.3%), Transportation (4 | 3.8%), and Material Moving (1 | 0.9%).
Production, Transportation and Moving Occupations by Sex
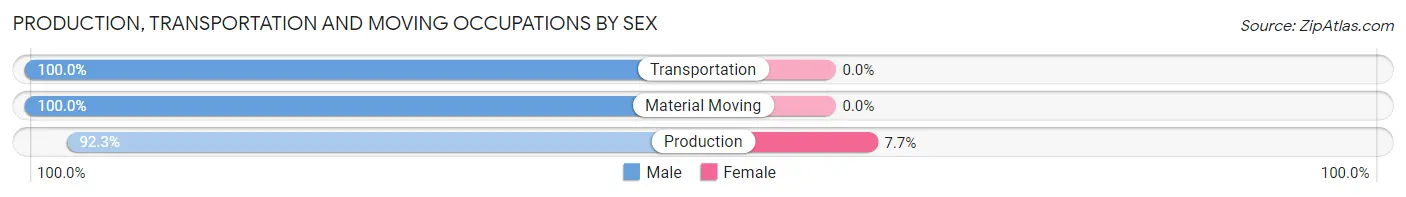
| Occupation | Male | Female |
| Production | 12 (92.3%) | 1 (7.7%) |
| Transportation | 4 (100.0%) | 0 (0.0%) |
| Material Moving | 1 (100.0%) | 0 (0.0%) |
| Total (Category) | 17 (94.4%) | 1 (5.6%) |
| Total (Overall) | 53 (50.0%) | 53 (50.0%) |
Employment Industries by Sex in South Haven
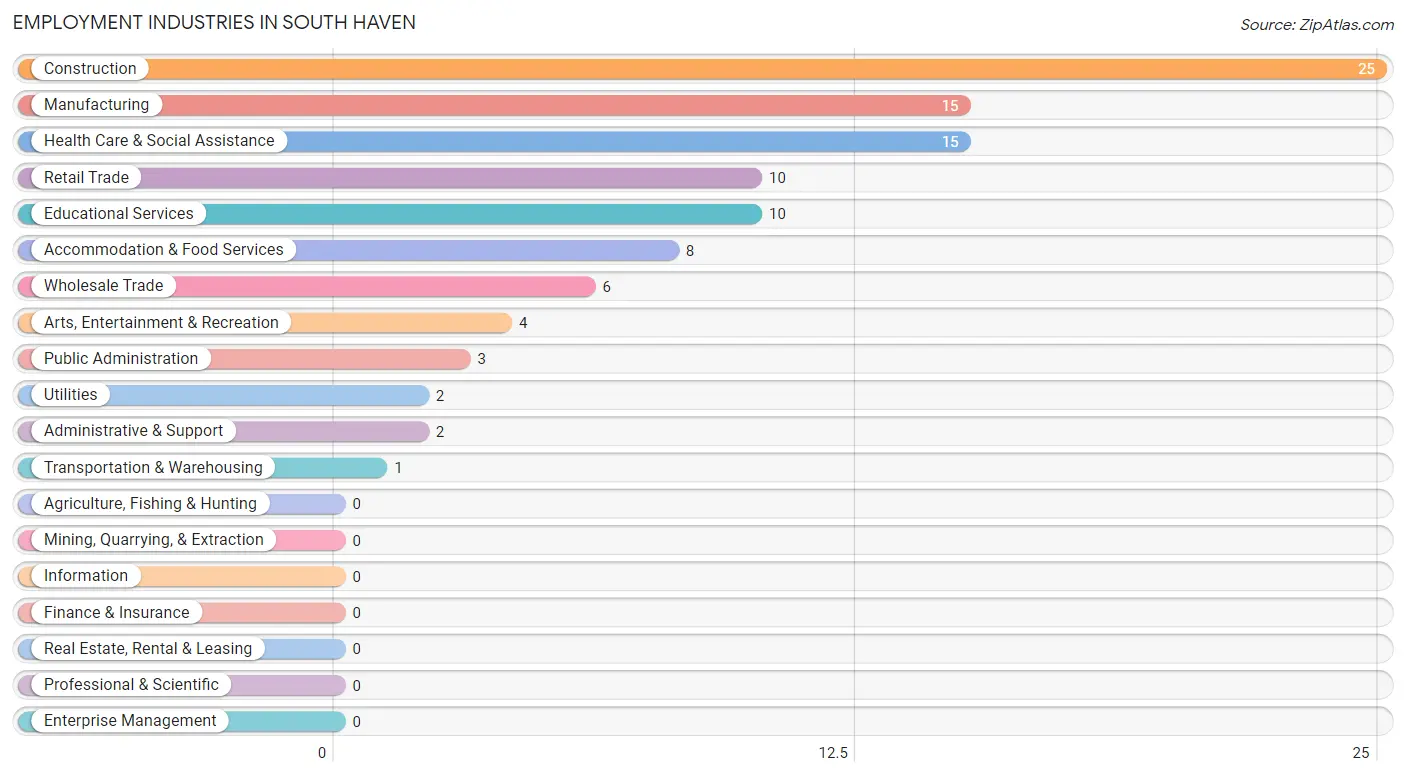
Employment Industries in South Haven
The major employment industries in South Haven include Construction (25 | 23.6%), Manufacturing (15 | 14.1%), Health Care & Social Assistance (15 | 14.1%), Retail Trade (10 | 9.4%), and Educational Services (10 | 9.4%).
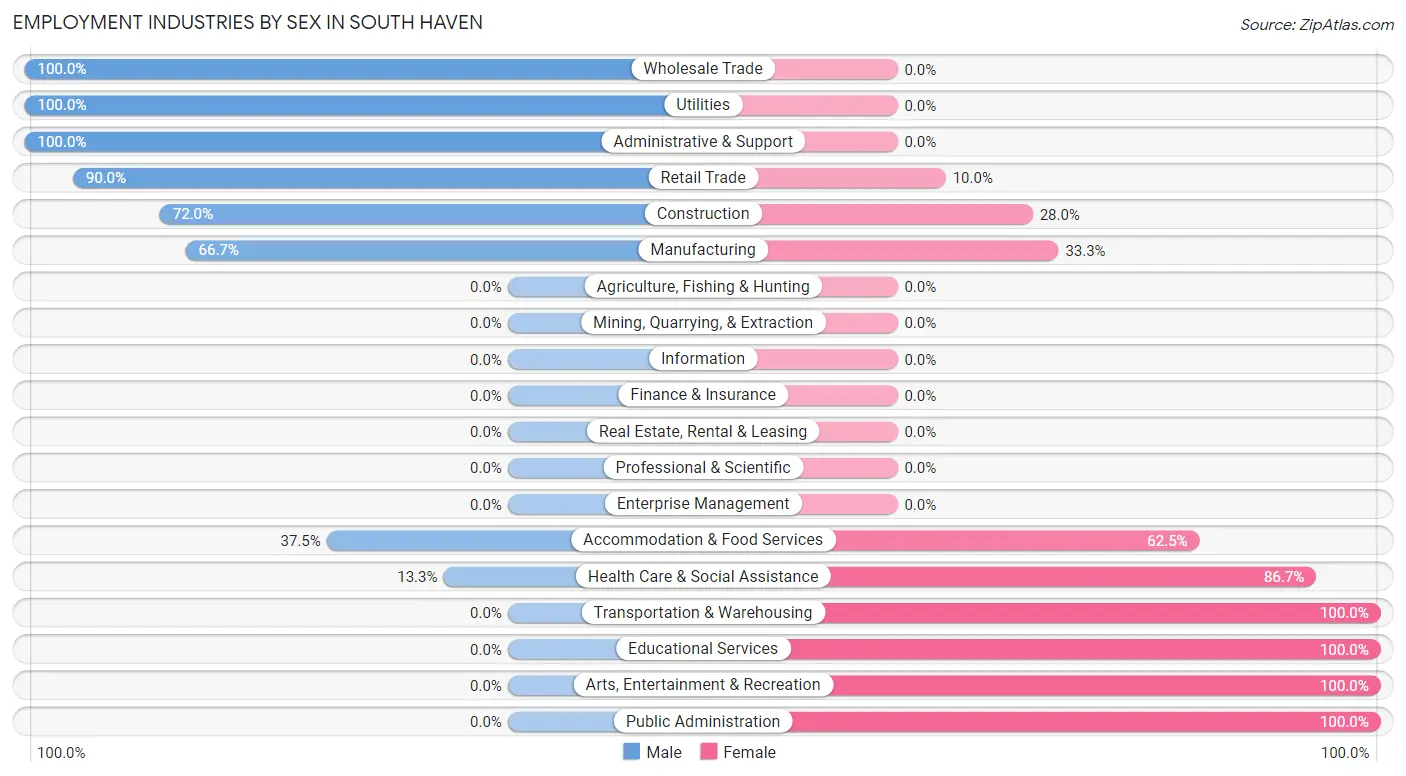
Employment Industries by Sex in South Haven
The South Haven industries that see more men than women are Wholesale Trade (100.0%), Utilities (100.0%), and Administrative & Support (100.0%), whereas the industries that tend to have a higher number of women are Transportation & Warehousing (100.0%), Educational Services (100.0%), and Arts, Entertainment & Recreation (100.0%).
| Industry | Male | Female |
| Agriculture, Fishing & Hunting | 0 (0.0%) | 0 (0.0%) |
| Mining, Quarrying, & Extraction | 0 (0.0%) | 0 (0.0%) |
| Construction | 18 (72.0%) | 7 (28.0%) |
| Manufacturing | 10 (66.7%) | 5 (33.3%) |
| Wholesale Trade | 6 (100.0%) | 0 (0.0%) |
| Retail Trade | 9 (90.0%) | 1 (10.0%) |
| Transportation & Warehousing | 0 (0.0%) | 1 (100.0%) |
| Utilities | 2 (100.0%) | 0 (0.0%) |
| Information | 0 (0.0%) | 0 (0.0%) |
| Finance & Insurance | 0 (0.0%) | 0 (0.0%) |
| Real Estate, Rental & Leasing | 0 (0.0%) | 0 (0.0%) |
| Professional & Scientific | 0 (0.0%) | 0 (0.0%) |
| Enterprise Management | 0 (0.0%) | 0 (0.0%) |
| Administrative & Support | 2 (100.0%) | 0 (0.0%) |
| Educational Services | 0 (0.0%) | 10 (100.0%) |
| Health Care & Social Assistance | 2 (13.3%) | 13 (86.7%) |
| Arts, Entertainment & Recreation | 0 (0.0%) | 4 (100.0%) |
| Accommodation & Food Services | 3 (37.5%) | 5 (62.5%) |
| Public Administration | 0 (0.0%) | 3 (100.0%) |
| Total | 53 (50.0%) | 53 (50.0%) |
Education in South Haven
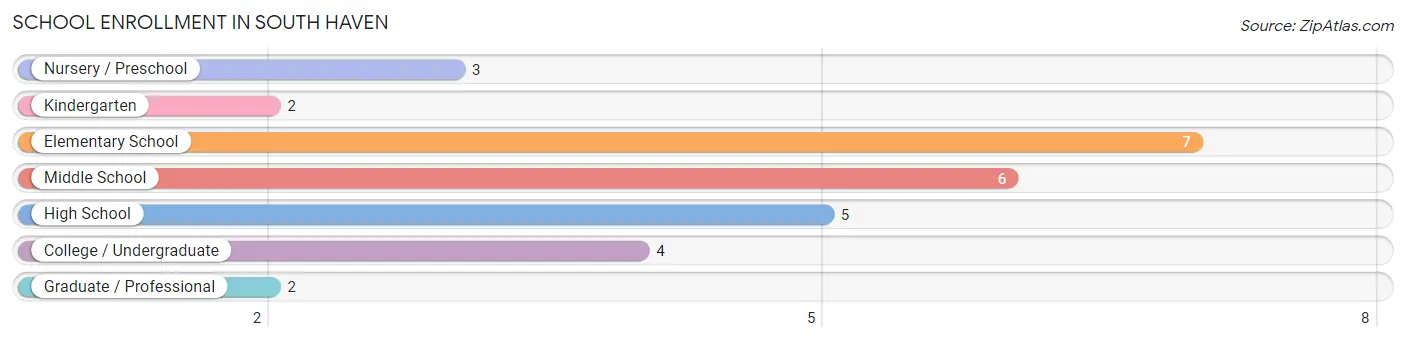
School Enrollment in South Haven
The most common levels of schooling among the 29 students in South Haven are elementary school (7 | 24.1%), middle school (6 | 20.7%), and high school (5 | 17.2%).
| School Level | # Students | % Students |
| Nursery / Preschool | 3 | 10.3% |
| Kindergarten | 2 | 6.9% |
| Elementary School | 7 | 24.1% |
| Middle School | 6 | 20.7% |
| High School | 5 | 17.2% |
| College / Undergraduate | 4 | 13.8% |
| Graduate / Professional | 2 | 6.9% |
| Total | 29 | 100.0% |
School Enrollment by Age by Funding Source in South Haven
Out of a total of 29 students who are enrolled in schools in South Haven, 6 (20.7%) attend a private institution, while the remaining 23 (79.3%) are enrolled in public schools. The age group of 35 years and over has the highest likelihood of being enrolled in private schools, with 2 (100.0% in the age bracket) enrolled. Conversely, the age group of 3 to 4 year olds has the lowest likelihood of being enrolled in a private school, with 3 (100.0% in the age bracket) attending a public institution.
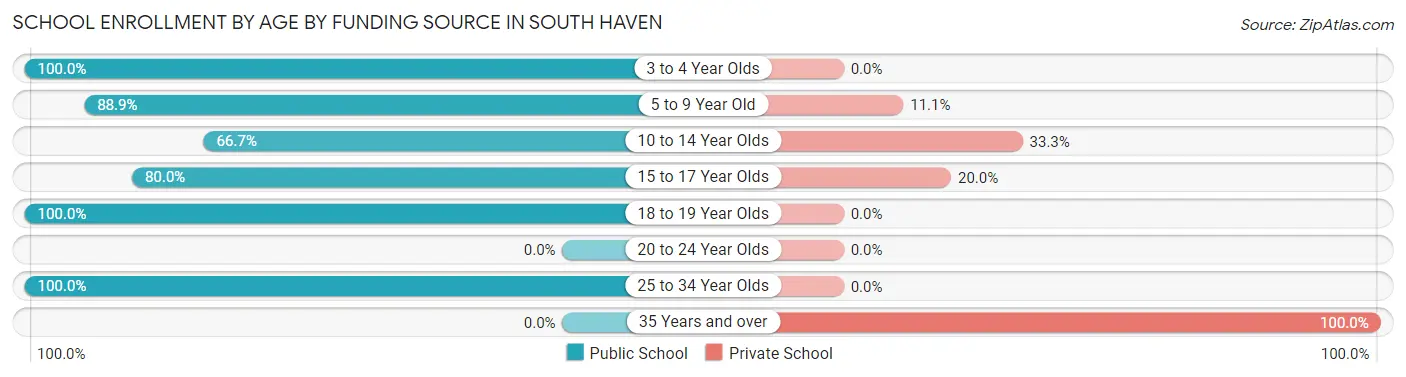
| Age Bracket | Public School | Private School |
| 3 to 4 Year Olds | 3 (100.0%) | 0 (0.0%) |
| 5 to 9 Year Old | 8 (88.9%) | 1 (11.1%) |
| 10 to 14 Year Olds | 4 (66.7%) | 2 (33.3%) |
| 15 to 17 Year Olds | 4 (80.0%) | 1 (20.0%) |
| 18 to 19 Year Olds | 2 (100.0%) | 0 (0.0%) |
| 20 to 24 Year Olds | 0 (0.0%) | 0 (0.0%) |
| 25 to 34 Year Olds | 2 (100.0%) | 0 (0.0%) |
| 35 Years and over | 0 (0.0%) | 2 (100.0%) |
| Total | 23 (79.3%) | 6 (20.7%) |
Educational Attainment by Field of Study in South Haven
Engineering (5 | 38.5%), education (5 | 38.5%), arts & humanities (2 | 15.4%), and computers & mathematics (1 | 7.7%) are the most common fields of study among 13 individuals in South Haven who have obtained a bachelor's degree or higher.
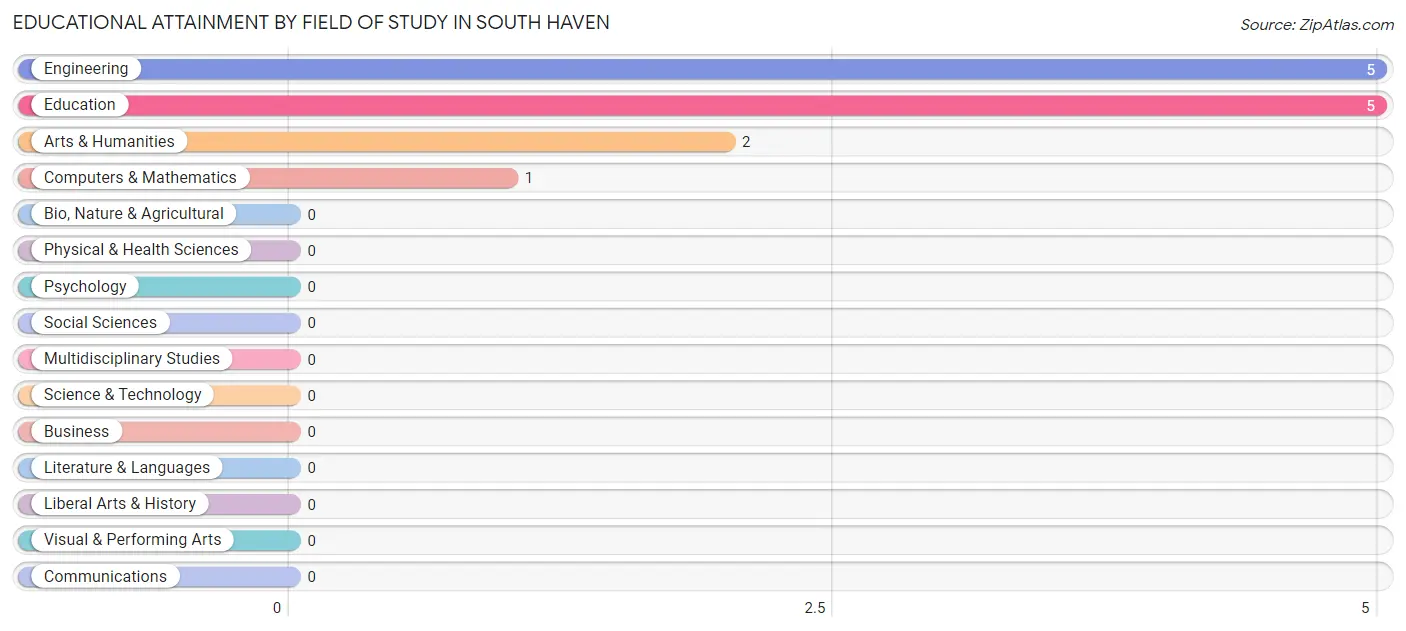
| Field of Study | # Graduates | % Graduates |
| Computers & Mathematics | 1 | 7.7% |
| Bio, Nature & Agricultural | 0 | 0.0% |
| Physical & Health Sciences | 0 | 0.0% |
| Psychology | 0 | 0.0% |
| Social Sciences | 0 | 0.0% |
| Engineering | 5 | 38.5% |
| Multidisciplinary Studies | 0 | 0.0% |
| Science & Technology | 0 | 0.0% |
| Business | 0 | 0.0% |
| Education | 5 | 38.5% |
| Literature & Languages | 0 | 0.0% |
| Liberal Arts & History | 0 | 0.0% |
| Visual & Performing Arts | 0 | 0.0% |
| Communications | 0 | 0.0% |
| Arts & Humanities | 2 | 15.4% |
| Total | 13 | 100.0% |
Transportation & Commute in South Haven
Vehicle Availability by Sex in South Haven
The most prevalent vehicle ownership categories in South Haven are males with 5 or more vehicles (21, accounting for 39.6%) and females with 5 or more vehicles (10, making up 42.0%).
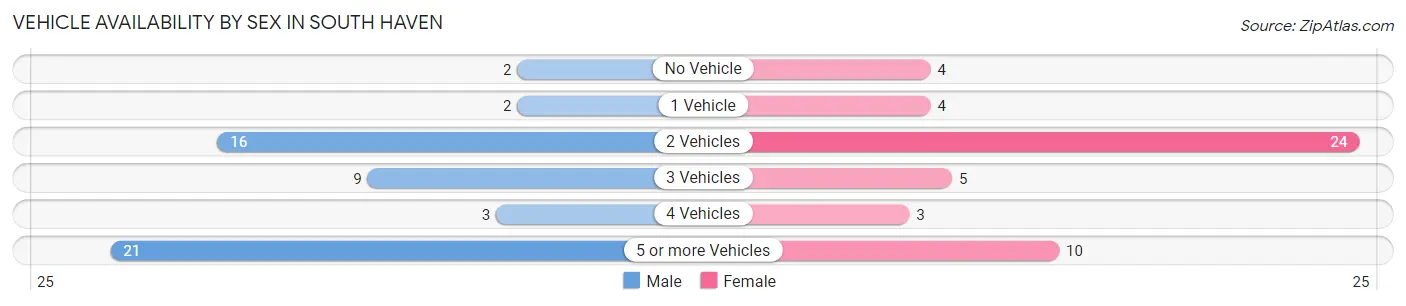
| Vehicles Available | Male | Female |
| No Vehicle | 2 (3.8%) | 4 (8.0%) |
| 1 Vehicle | 2 (3.8%) | 4 (8.0%) |
| 2 Vehicles | 16 (30.2%) | 24 (48.0%) |
| 3 Vehicles | 9 (17.0%) | 5 (10.0%) |
| 4 Vehicles | 3 (5.7%) | 3 (6.0%) |
| 5 or more Vehicles | 21 (39.6%) | 10 (20.0%) |
| Total | 53 (100.0%) | 50 (100.0%) |
Commute Time in South Haven
The most frequently occuring commute durations in South Haven are 15 to 19 minutes (17 commuters, 18.1%), 10 to 14 minutes (16 commuters, 17.0%), and 20 to 24 minutes (12 commuters, 12.8%).
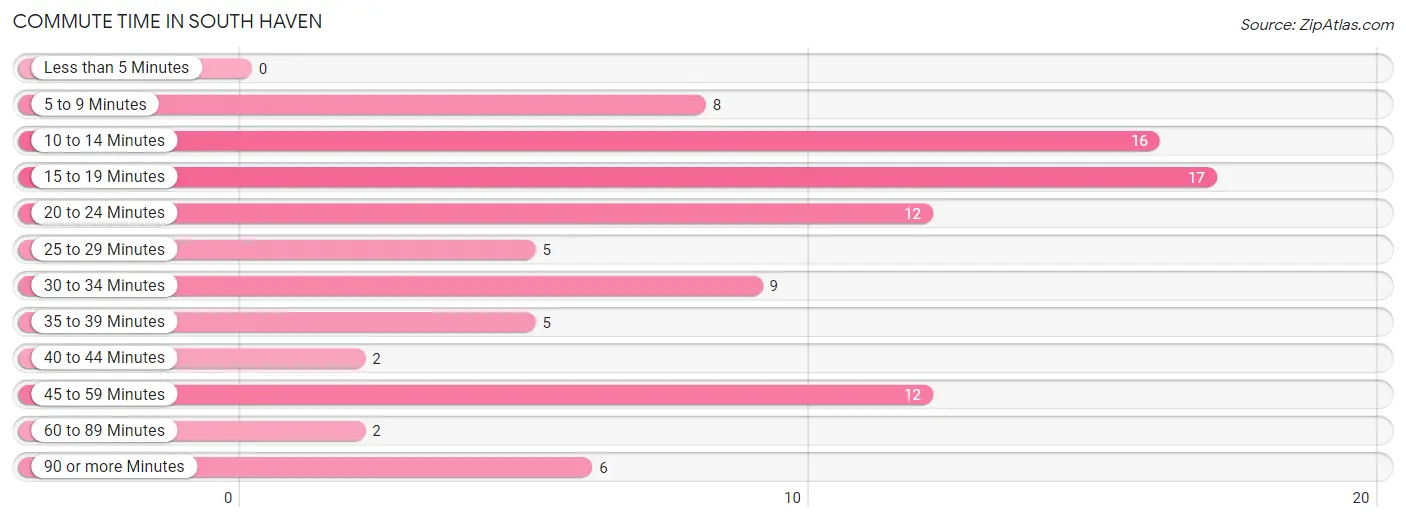
| Commute Time | # Commuters | % Commuters |
| Less than 5 Minutes | 0 | 0.0% |
| 5 to 9 Minutes | 8 | 8.5% |
| 10 to 14 Minutes | 16 | 17.0% |
| 15 to 19 Minutes | 17 | 18.1% |
| 20 to 24 Minutes | 12 | 12.8% |
| 25 to 29 Minutes | 5 | 5.3% |
| 30 to 34 Minutes | 9 | 9.6% |
| 35 to 39 Minutes | 5 | 5.3% |
| 40 to 44 Minutes | 2 | 2.1% |
| 45 to 59 Minutes | 12 | 12.8% |
| 60 to 89 Minutes | 2 | 2.1% |
| 90 or more Minutes | 6 | 6.4% |
Commute Time by Sex in South Haven
The most common commute times in South Haven are 20 to 24 minutes (12 commuters, 23.5%) for males and 15 to 19 minutes (17 commuters, 39.5%) for females.
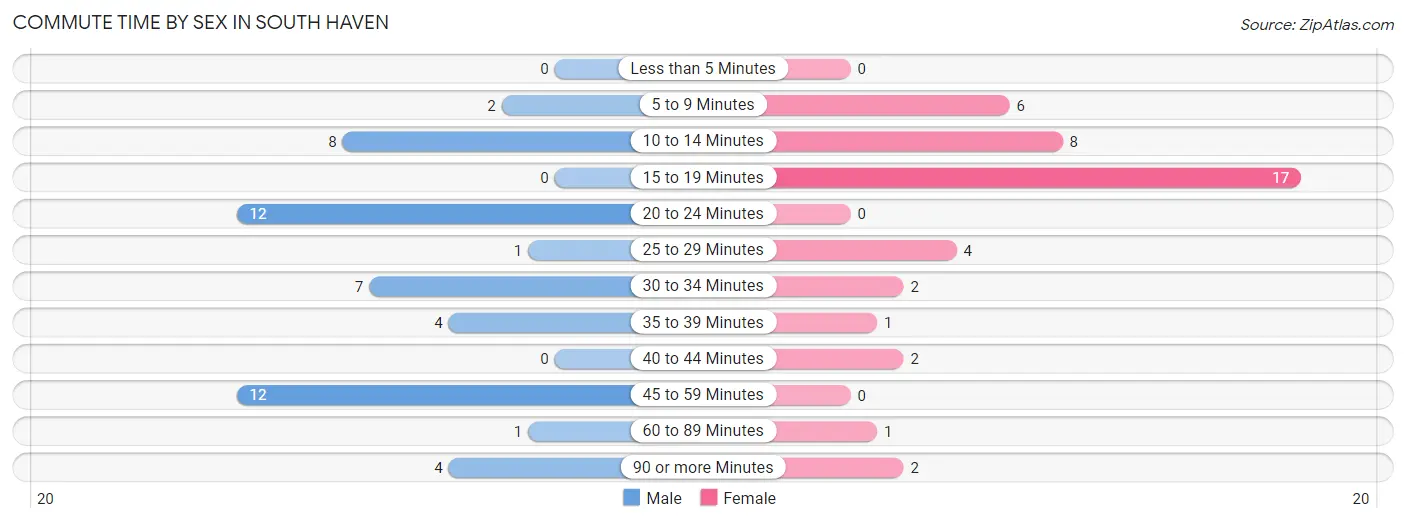
| Commute Time | Male | Female |
| Less than 5 Minutes | 0 (0.0%) | 0 (0.0%) |
| 5 to 9 Minutes | 2 (3.9%) | 6 (14.0%) |
| 10 to 14 Minutes | 8 (15.7%) | 8 (18.6%) |
| 15 to 19 Minutes | 0 (0.0%) | 17 (39.5%) |
| 20 to 24 Minutes | 12 (23.5%) | 0 (0.0%) |
| 25 to 29 Minutes | 1 (2.0%) | 4 (9.3%) |
| 30 to 34 Minutes | 7 (13.7%) | 2 (4.6%) |
| 35 to 39 Minutes | 4 (7.8%) | 1 (2.3%) |
| 40 to 44 Minutes | 0 (0.0%) | 2 (4.6%) |
| 45 to 59 Minutes | 12 (23.5%) | 0 (0.0%) |
| 60 to 89 Minutes | 1 (2.0%) | 1 (2.3%) |
| 90 or more Minutes | 4 (7.8%) | 2 (4.6%) |
Time of Departure to Work by Sex in South Haven
The most frequent times of departure to work in South Haven are 7:00 AM to 7:29 AM (13, 25.5%) for males and 7:30 AM to 7:59 AM (11, 25.6%) for females.
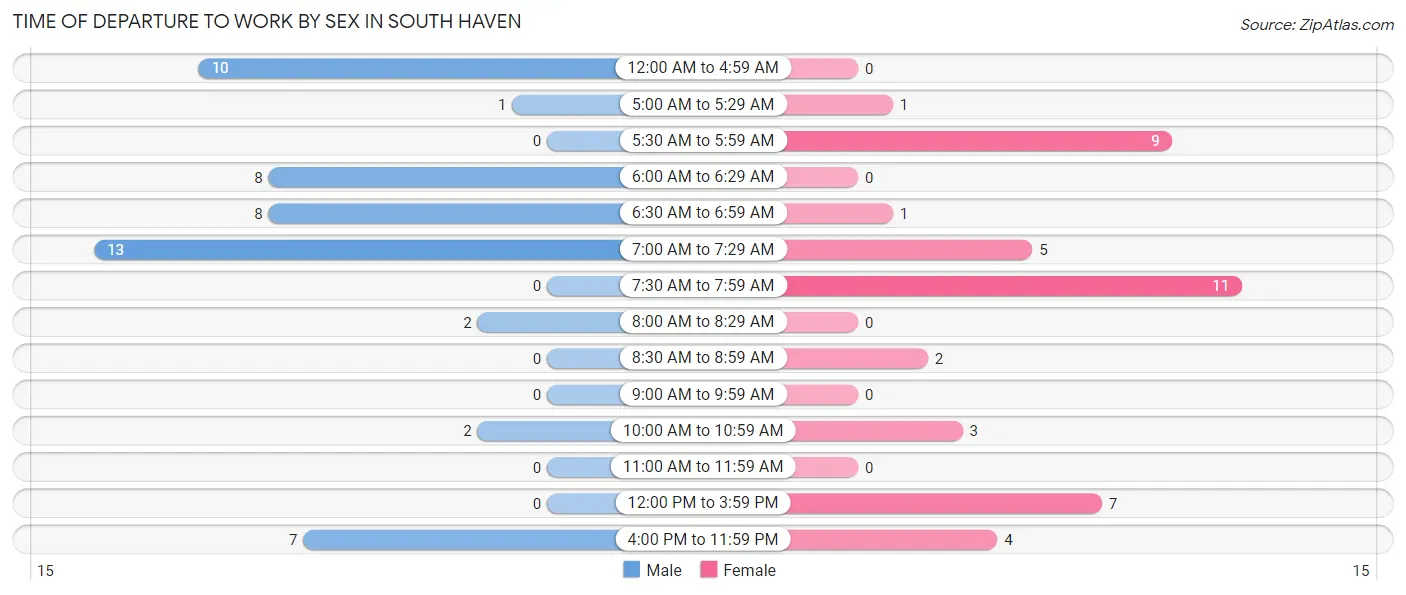
| Time of Departure | Male | Female |
| 12:00 AM to 4:59 AM | 10 (19.6%) | 0 (0.0%) |
| 5:00 AM to 5:29 AM | 1 (2.0%) | 1 (2.3%) |
| 5:30 AM to 5:59 AM | 0 (0.0%) | 9 (20.9%) |
| 6:00 AM to 6:29 AM | 8 (15.7%) | 0 (0.0%) |
| 6:30 AM to 6:59 AM | 8 (15.7%) | 1 (2.3%) |
| 7:00 AM to 7:29 AM | 13 (25.5%) | 5 (11.6%) |
| 7:30 AM to 7:59 AM | 0 (0.0%) | 11 (25.6%) |
| 8:00 AM to 8:29 AM | 2 (3.9%) | 0 (0.0%) |
| 8:30 AM to 8:59 AM | 0 (0.0%) | 2 (4.6%) |
| 9:00 AM to 9:59 AM | 0 (0.0%) | 0 (0.0%) |
| 10:00 AM to 10:59 AM | 2 (3.9%) | 3 (7.0%) |
| 11:00 AM to 11:59 AM | 0 (0.0%) | 0 (0.0%) |
| 12:00 PM to 3:59 PM | 0 (0.0%) | 7 (16.3%) |
| 4:00 PM to 11:59 PM | 7 (13.7%) | 4 (9.3%) |
| Total | 51 (100.0%) | 43 (100.0%) |
Housing Occupancy in South Haven
Occupancy by Ownership in South Haven
Of the total 65 dwellings in South Haven, owner-occupied units account for 56 (86.2%), while renter-occupied units make up 9 (13.9%).
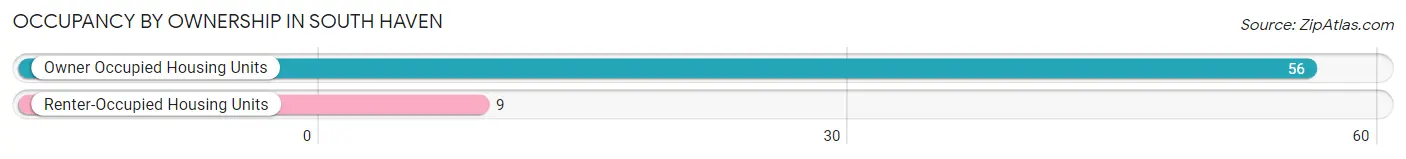
| Occupancy | # Housing Units | % Housing Units |
| Owner Occupied Housing Units | 56 | 86.2% |
| Renter-Occupied Housing Units | 9 | 13.9% |
| Total Occupied Housing Units | 65 | 100.0% |
Occupancy by Household Size in South Haven
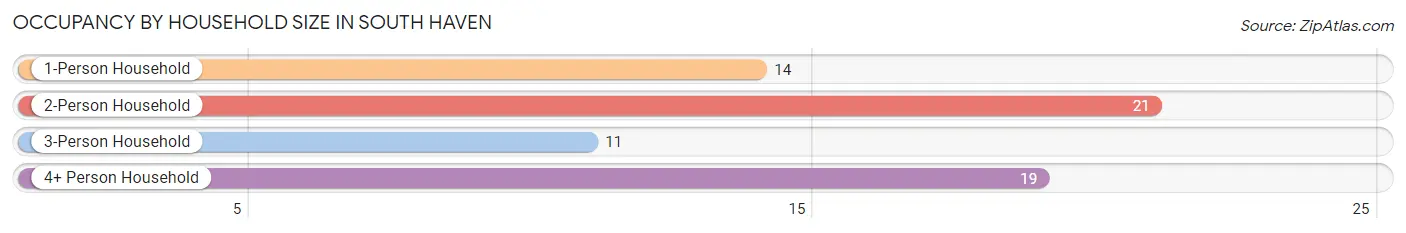
| Household Size | # Housing Units | % Housing Units |
| 1-Person Household | 14 | 21.5% |
| 2-Person Household | 21 | 32.3% |
| 3-Person Household | 11 | 16.9% |
| 4+ Person Household | 19 | 29.2% |
| Total Housing Units | 65 | 100.0% |
Occupancy by Ownership by Household Size in South Haven
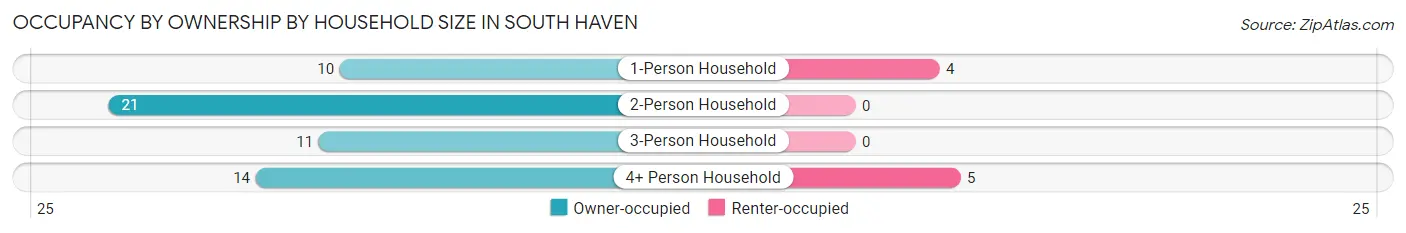
| Household Size | Owner-occupied | Renter-occupied |
| 1-Person Household | 10 (71.4%) | 4 (28.6%) |
| 2-Person Household | 21 (100.0%) | 0 (0.0%) |
| 3-Person Household | 11 (100.0%) | 0 (0.0%) |
| 4+ Person Household | 14 (73.7%) | 5 (26.3%) |
| Total Housing Units | 56 (86.2%) | 9 (13.9%) |
Occupancy by Educational Attainment in South Haven
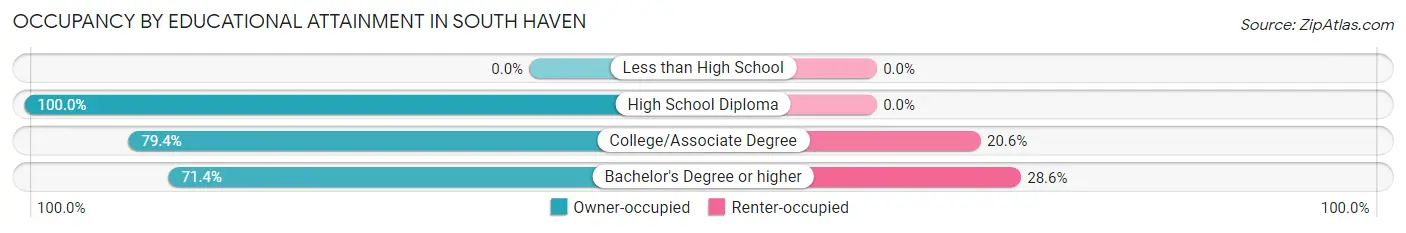
| Household Size | Owner-occupied | Renter-occupied |
| Less than High School | 0 (0.0%) | 0 (0.0%) |
| High School Diploma | 24 (100.0%) | 0 (0.0%) |
| College/Associate Degree | 27 (79.4%) | 7 (20.6%) |
| Bachelor's Degree or higher | 5 (71.4%) | 2 (28.6%) |
Occupancy by Age of Householder in South Haven
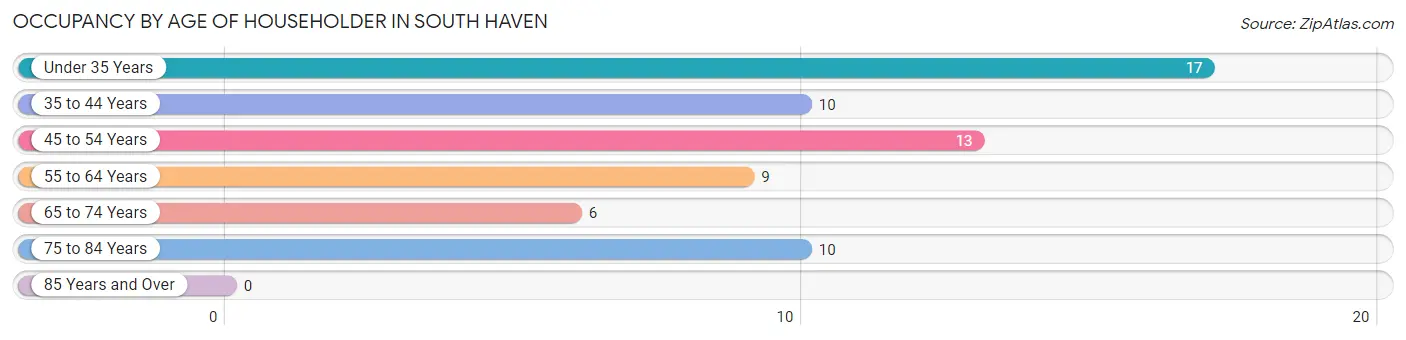
| Age Bracket | # Households | % Households |
| Under 35 Years | 17 | 26.2% |
| 35 to 44 Years | 10 | 15.4% |
| 45 to 54 Years | 13 | 20.0% |
| 55 to 64 Years | 9 | 13.9% |
| 65 to 74 Years | 6 | 9.2% |
| 75 to 84 Years | 10 | 15.4% |
| 85 Years and Over | 0 | 0.0% |
| Total | 65 | 100.0% |
Housing Finances in South Haven
Median Income by Occupancy in South Haven
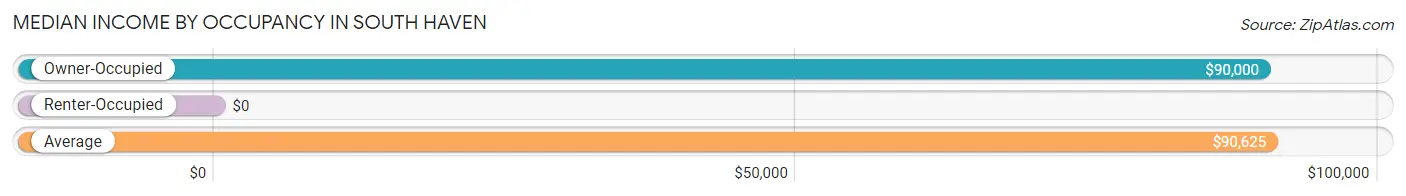
| Occupancy Type | # Households | Median Income |
| Owner-Occupied | 56 (86.2%) | $90,000 |
| Renter-Occupied | 9 (13.9%) | $0 |
| Average | 65 (100.0%) | $90,625 |
Occupancy by Householder Income Bracket in South Haven
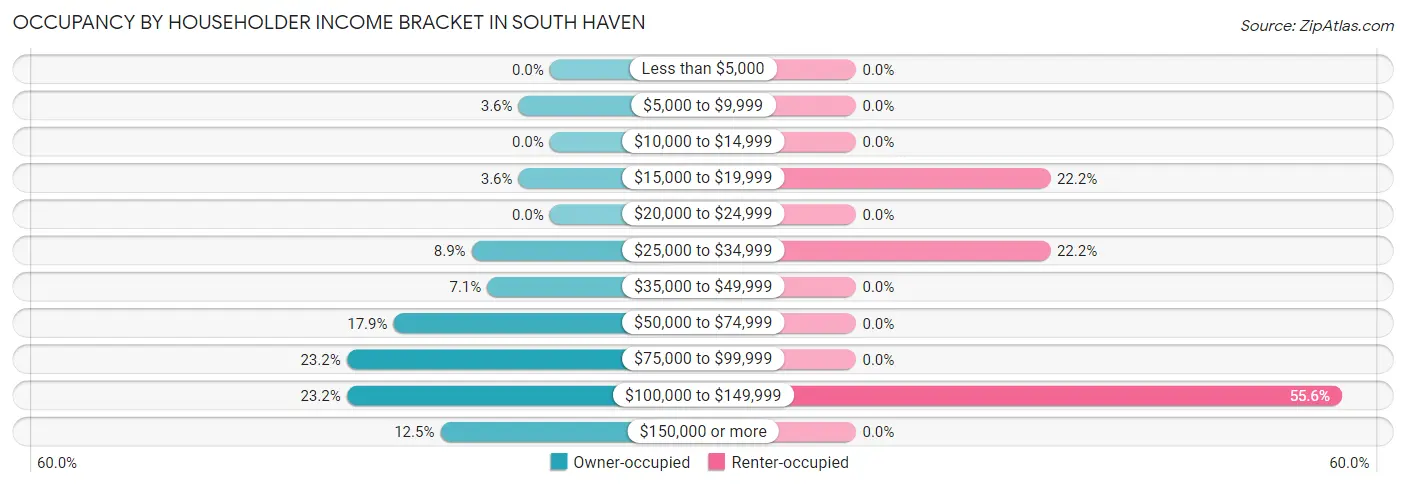
| Income Bracket | Owner-occupied | Renter-occupied |
| Less than $5,000 | 0 (0.0%) | 0 (0.0%) |
| $5,000 to $9,999 | 2 (3.6%) | 0 (0.0%) |
| $10,000 to $14,999 | 0 (0.0%) | 0 (0.0%) |
| $15,000 to $19,999 | 2 (3.6%) | 2 (22.2%) |
| $20,000 to $24,999 | 0 (0.0%) | 0 (0.0%) |
| $25,000 to $34,999 | 5 (8.9%) | 2 (22.2%) |
| $35,000 to $49,999 | 4 (7.1%) | 0 (0.0%) |
| $50,000 to $74,999 | 10 (17.9%) | 0 (0.0%) |
| $75,000 to $99,999 | 13 (23.2%) | 0 (0.0%) |
| $100,000 to $149,999 | 13 (23.2%) | 5 (55.6%) |
| $150,000 or more | 7 (12.5%) | 0 (0.0%) |
| Total | 56 (100.0%) | 9 (100.0%) |
Monthly Housing Cost Tiers in South Haven
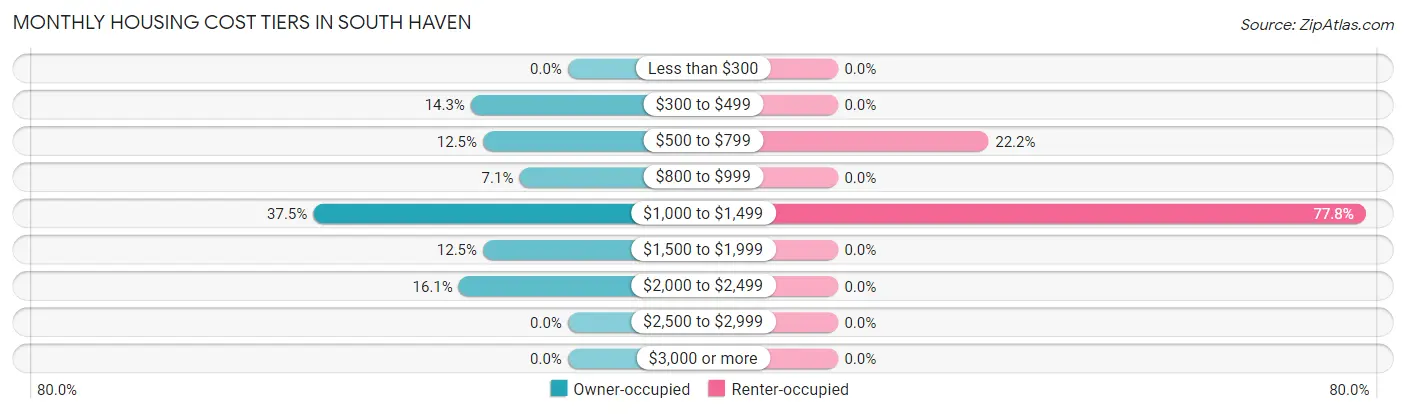
| Monthly Cost | Owner-occupied | Renter-occupied |
| Less than $300 | 0 (0.0%) | 0 (0.0%) |
| $300 to $499 | 8 (14.3%) | 0 (0.0%) |
| $500 to $799 | 7 (12.5%) | 2 (22.2%) |
| $800 to $999 | 4 (7.1%) | 0 (0.0%) |
| $1,000 to $1,499 | 21 (37.5%) | 7 (77.8%) |
| $1,500 to $1,999 | 7 (12.5%) | 0 (0.0%) |
| $2,000 to $2,499 | 9 (16.1%) | 0 (0.0%) |
| $2,500 to $2,999 | 0 (0.0%) | 0 (0.0%) |
| $3,000 or more | 0 (0.0%) | 0 (0.0%) |
| Total | 56 (100.0%) | 9 (100.0%) |
Physical Housing Characteristics in South Haven
Housing Structures in South Haven
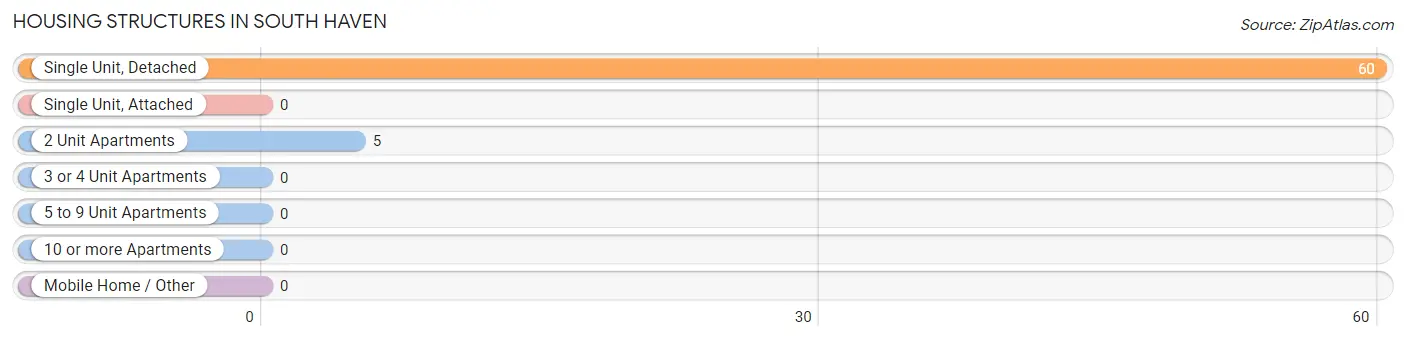
| Structure Type | # Housing Units | % Housing Units |
| Single Unit, Detached | 60 | 92.3% |
| Single Unit, Attached | 0 | 0.0% |
| 2 Unit Apartments | 5 | 7.7% |
| 3 or 4 Unit Apartments | 0 | 0.0% |
| 5 to 9 Unit Apartments | 0 | 0.0% |
| 10 or more Apartments | 0 | 0.0% |
| Mobile Home / Other | 0 | 0.0% |
| Total | 65 | 100.0% |
Housing Structures by Occupancy in South Haven
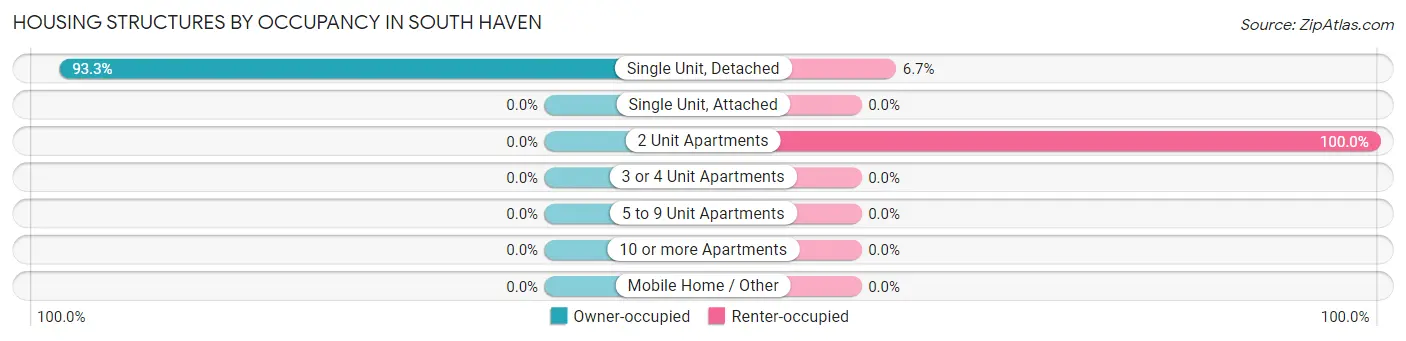
| Structure Type | Owner-occupied | Renter-occupied |
| Single Unit, Detached | 56 (93.3%) | 4 (6.7%) |
| Single Unit, Attached | 0 (0.0%) | 0 (0.0%) |
| 2 Unit Apartments | 0 (0.0%) | 5 (100.0%) |
| 3 or 4 Unit Apartments | 0 (0.0%) | 0 (0.0%) |
| 5 to 9 Unit Apartments | 0 (0.0%) | 0 (0.0%) |
| 10 or more Apartments | 0 (0.0%) | 0 (0.0%) |
| Mobile Home / Other | 0 (0.0%) | 0 (0.0%) |
| Total | 56 (86.2%) | 9 (13.9%) |
Housing Structures by Number of Rooms in South Haven
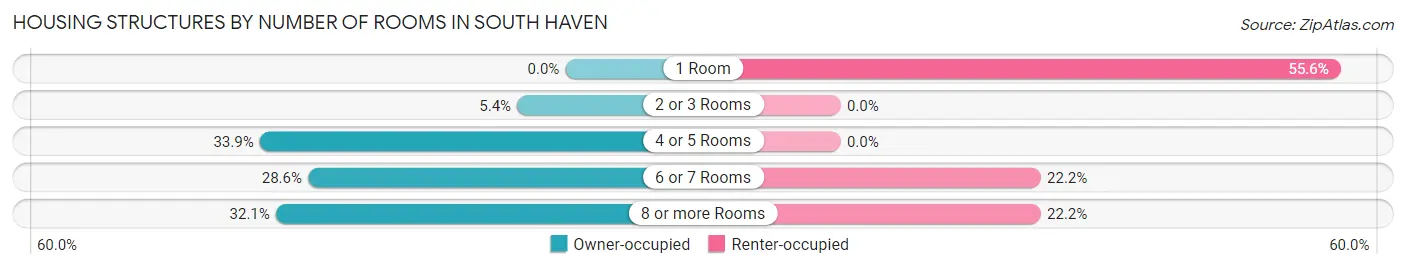
| Number of Rooms | Owner-occupied | Renter-occupied |
| 1 Room | 0 (0.0%) | 5 (55.6%) |
| 2 or 3 Rooms | 3 (5.4%) | 0 (0.0%) |
| 4 or 5 Rooms | 19 (33.9%) | 0 (0.0%) |
| 6 or 7 Rooms | 16 (28.6%) | 2 (22.2%) |
| 8 or more Rooms | 18 (32.1%) | 2 (22.2%) |
| Total | 56 (100.0%) | 9 (100.0%) |
Housing Structure by Heating Type in South Haven
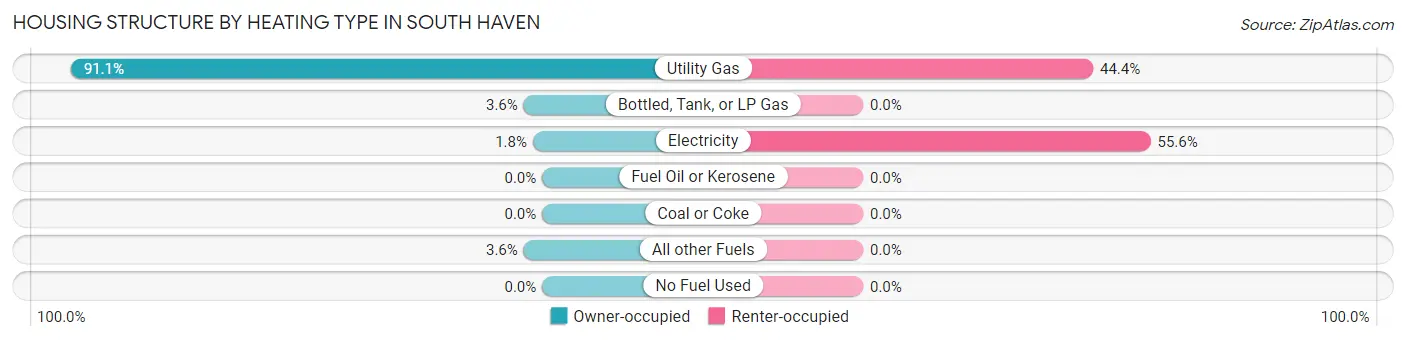
| Heating Type | Owner-occupied | Renter-occupied |
| Utility Gas | 51 (91.1%) | 4 (44.4%) |
| Bottled, Tank, or LP Gas | 2 (3.6%) | 0 (0.0%) |
| Electricity | 1 (1.8%) | 5 (55.6%) |
| Fuel Oil or Kerosene | 0 (0.0%) | 0 (0.0%) |
| Coal or Coke | 0 (0.0%) | 0 (0.0%) |
| All other Fuels | 2 (3.6%) | 0 (0.0%) |
| No Fuel Used | 0 (0.0%) | 0 (0.0%) |
| Total | 56 (100.0%) | 9 (100.0%) |
Household Vehicle Usage in South Haven
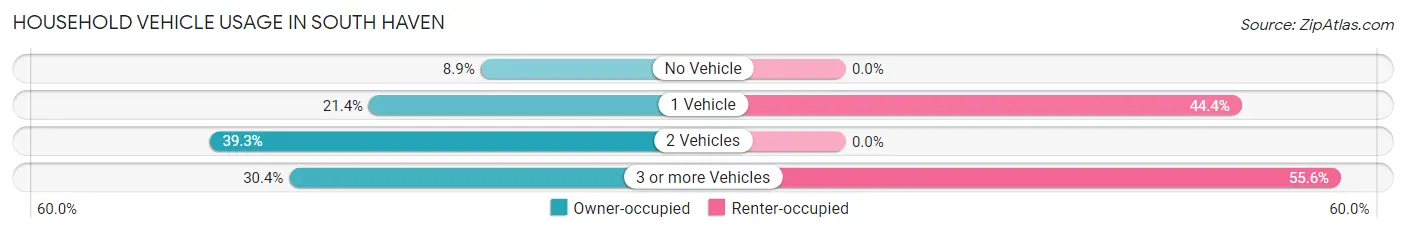
| Vehicles per Household | Owner-occupied | Renter-occupied |
| No Vehicle | 5 (8.9%) | 0 (0.0%) |
| 1 Vehicle | 12 (21.4%) | 4 (44.4%) |
| 2 Vehicles | 22 (39.3%) | 0 (0.0%) |
| 3 or more Vehicles | 17 (30.4%) | 5 (55.6%) |
| Total | 56 (100.0%) | 9 (100.0%) |
Real Estate & Mortgages in South Haven
Real Estate and Mortgage Overview in South Haven
| Characteristic | Without Mortgage | With Mortgage |
| Housing Units | 16 | 40 |
| Median Property Value | - | - |
| Median Household Income | $46,667 | $7 |
| Monthly Housing Costs | $500 | $0 |
| Real Estate Taxes | $2,222 | $1 |
Property Value by Mortgage Status in South Haven
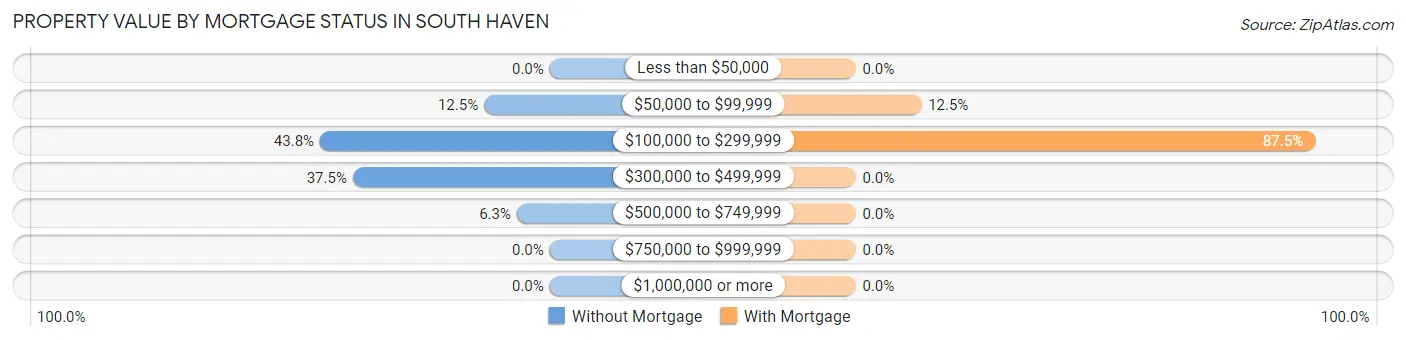
| Property Value | Without Mortgage | With Mortgage |
| Less than $50,000 | 0 (0.0%) | 0 (0.0%) |
| $50,000 to $99,999 | 2 (12.5%) | 5 (12.5%) |
| $100,000 to $299,999 | 7 (43.8%) | 35 (87.5%) |
| $300,000 to $499,999 | 6 (37.5%) | 0 (0.0%) |
| $500,000 to $749,999 | 1 (6.2%) | 0 (0.0%) |
| $750,000 to $999,999 | 0 (0.0%) | 0 (0.0%) |
| $1,000,000 or more | 0 (0.0%) | 0 (0.0%) |
| Total | 16 (100.0%) | 40 (100.0%) |
Household Income by Mortgage Status in South Haven
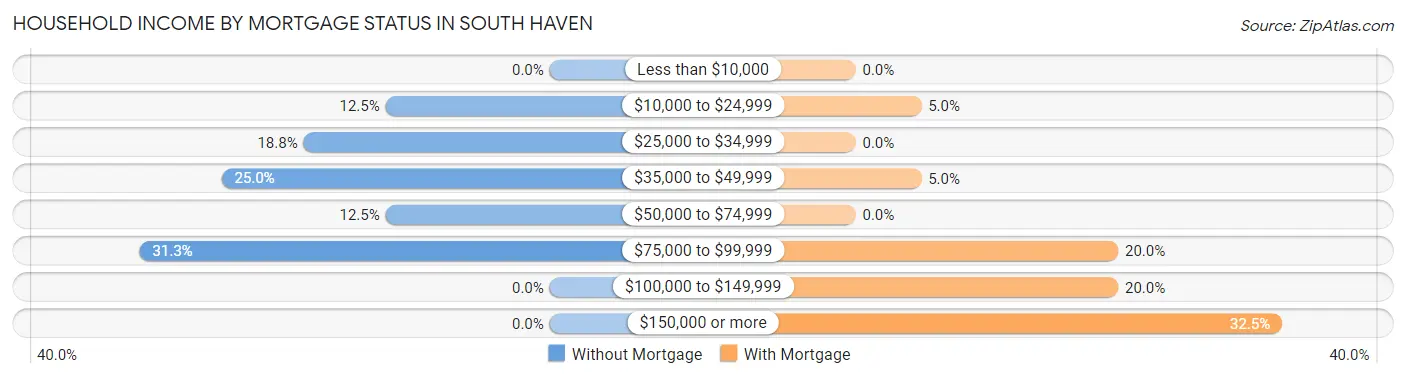
| Household Income | Without Mortgage | With Mortgage |
| Less than $10,000 | 0 (0.0%) | 0 (0.0%) |
| $10,000 to $24,999 | 2 (12.5%) | 2 (5.0%) |
| $25,000 to $34,999 | 3 (18.8%) | 0 (0.0%) |
| $35,000 to $49,999 | 4 (25.0%) | 2 (5.0%) |
| $50,000 to $74,999 | 2 (12.5%) | 0 (0.0%) |
| $75,000 to $99,999 | 5 (31.2%) | 8 (20.0%) |
| $100,000 to $149,999 | 0 (0.0%) | 8 (20.0%) |
| $150,000 or more | 0 (0.0%) | 13 (32.5%) |
| Total | 16 (100.0%) | 40 (100.0%) |
Property Value to Household Income Ratio in South Haven
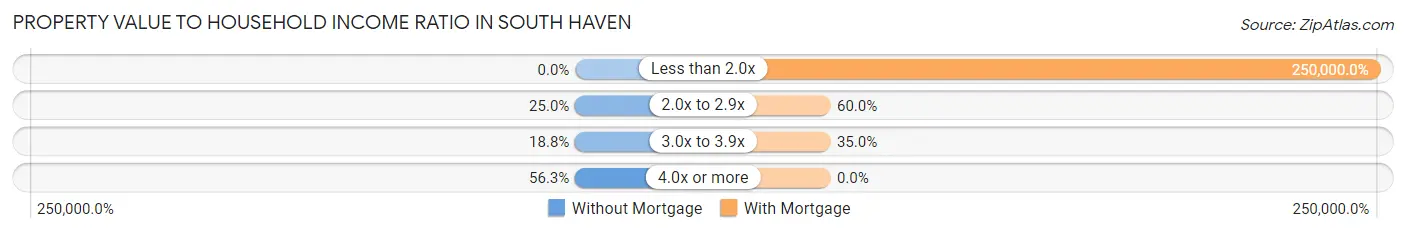
| Value-to-Income Ratio | Without Mortgage | With Mortgage |
| Less than 2.0x | 0 (0.0%) | 100,000 (250,000.0%) |
| 2.0x to 2.9x | 4 (25.0%) | 24 (60.0%) |
| 3.0x to 3.9x | 3 (18.8%) | 14 (35.0%) |
| 4.0x or more | 9 (56.2%) | 0 (0.0%) |
| Total | 16 (100.0%) | 40 (100.0%) |
Real Estate Taxes by Mortgage Status in South Haven
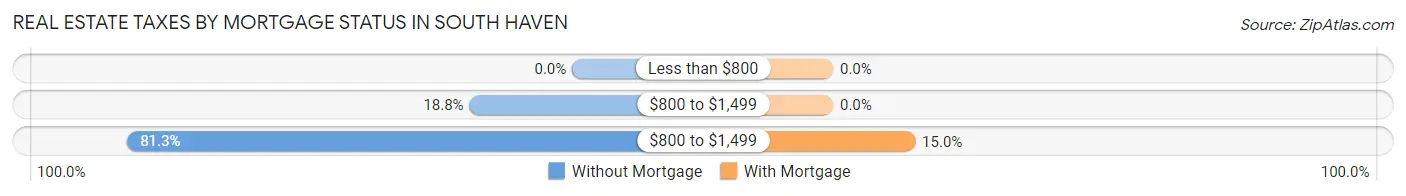
| Property Taxes | Without Mortgage | With Mortgage |
| Less than $800 | 0 (0.0%) | 0 (0.0%) |
| $800 to $1,499 | 3 (18.8%) | 0 (0.0%) |
| $800 to $1,499 | 13 (81.2%) | 6 (15.0%) |
| Total | 16 (100.0%) | 40 (100.0%) |
Health & Disability in South Haven
Health Insurance Coverage by Age in South Haven
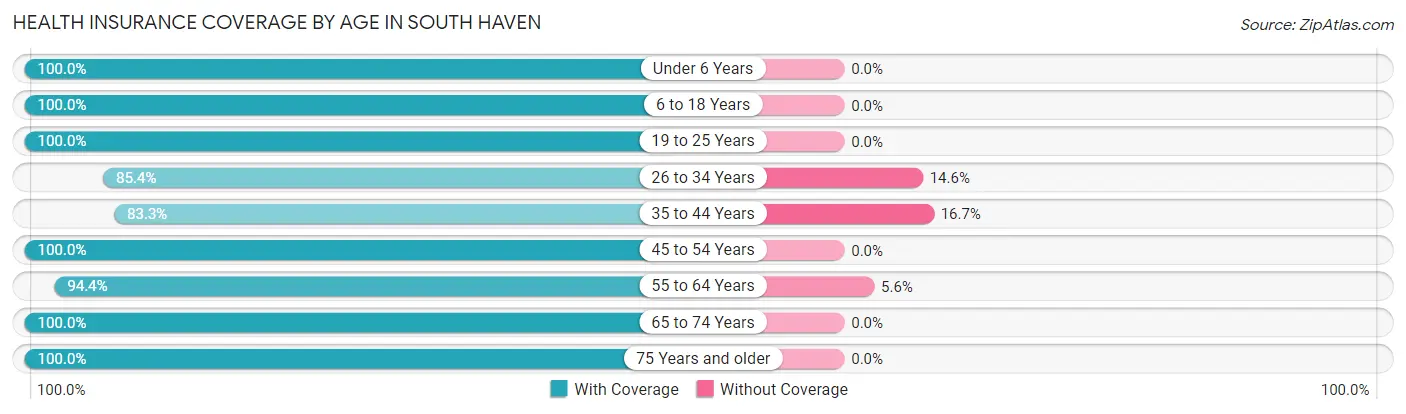
| Age Bracket | With Coverage | Without Coverage |
| Under 6 Years | 19 (100.0%) | 0 (0.0%) |
| 6 to 18 Years | 21 (100.0%) | 0 (0.0%) |
| 19 to 25 Years | 19 (100.0%) | 0 (0.0%) |
| 26 to 34 Years | 35 (85.4%) | 6 (14.6%) |
| 35 to 44 Years | 15 (83.3%) | 3 (16.7%) |
| 45 to 54 Years | 18 (100.0%) | 0 (0.0%) |
| 55 to 64 Years | 17 (94.4%) | 1 (5.6%) |
| 65 to 74 Years | 14 (100.0%) | 0 (0.0%) |
| 75 Years and older | 11 (100.0%) | 0 (0.0%) |
| Total | 169 (94.4%) | 10 (5.6%) |
Health Insurance Coverage by Citizenship Status in South Haven
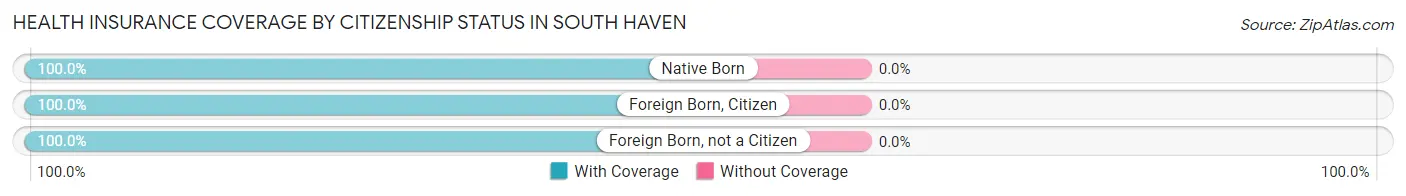
| Citizenship Status | With Coverage | Without Coverage |
| Native Born | 19 (100.0%) | 0 (0.0%) |
| Foreign Born, Citizen | 21 (100.0%) | 0 (0.0%) |
| Foreign Born, not a Citizen | 19 (100.0%) | 0 (0.0%) |
Health Insurance Coverage by Household Income in South Haven
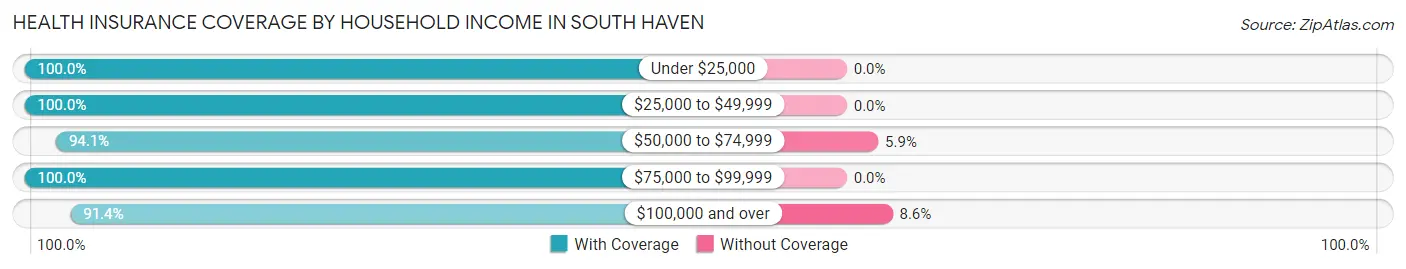
| Household Income | With Coverage | Without Coverage |
| Under $25,000 | 9 (100.0%) | 0 (0.0%) |
| $25,000 to $49,999 | 20 (100.0%) | 0 (0.0%) |
| $50,000 to $74,999 | 16 (94.1%) | 1 (5.9%) |
| $75,000 to $99,999 | 28 (100.0%) | 0 (0.0%) |
| $100,000 and over | 96 (91.4%) | 9 (8.6%) |
Public vs Private Health Insurance Coverage by Age in South Haven
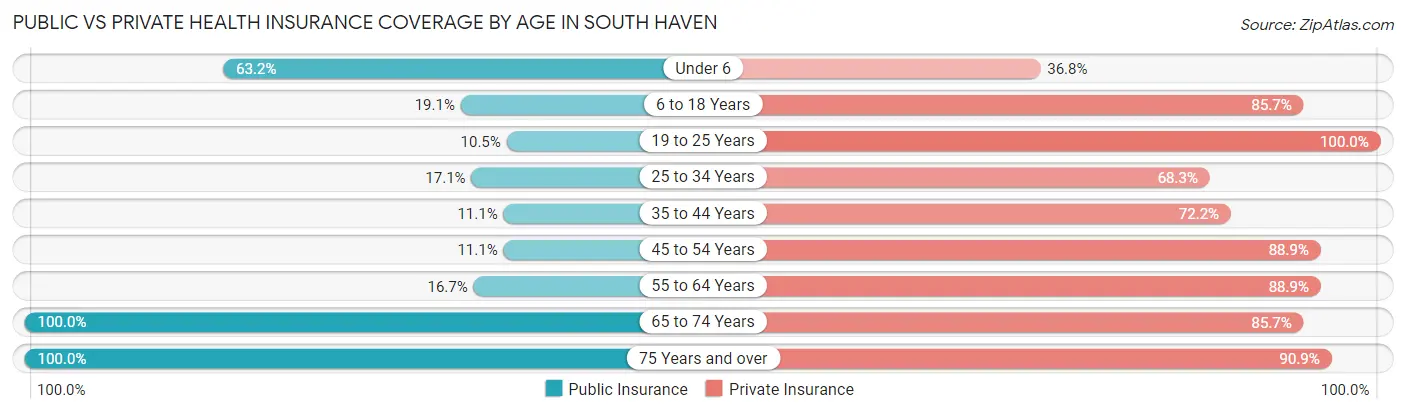
| Age Bracket | Public Insurance | Private Insurance |
| Under 6 | 12 (63.2%) | 7 (36.8%) |
| 6 to 18 Years | 4 (19.1%) | 18 (85.7%) |
| 19 to 25 Years | 2 (10.5%) | 19 (100.0%) |
| 25 to 34 Years | 7 (17.1%) | 28 (68.3%) |
| 35 to 44 Years | 2 (11.1%) | 13 (72.2%) |
| 45 to 54 Years | 2 (11.1%) | 16 (88.9%) |
| 55 to 64 Years | 3 (16.7%) | 16 (88.9%) |
| 65 to 74 Years | 14 (100.0%) | 12 (85.7%) |
| 75 Years and over | 11 (100.0%) | 10 (90.9%) |
| Total | 57 (31.8%) | 139 (77.6%) |
Disability Status by Sex by Age in South Haven
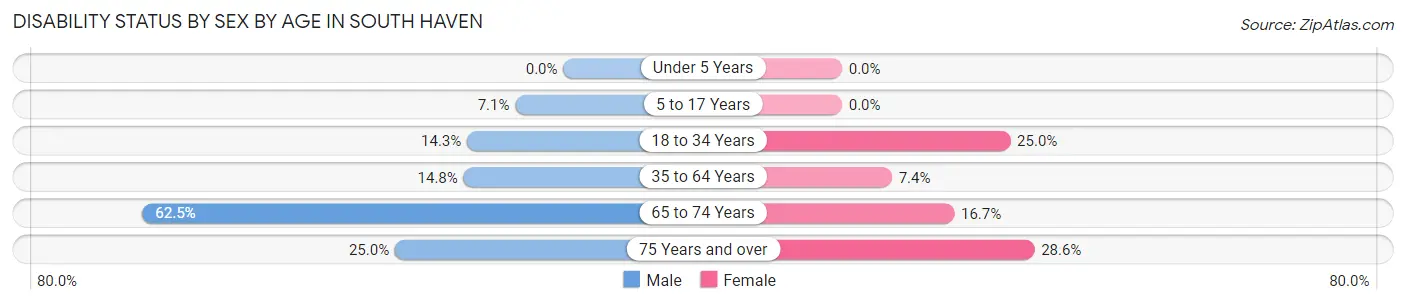
| Age Bracket | Male | Female |
| Under 5 Years | 0 (0.0%) | 0 (0.0%) |
| 5 to 17 Years | 1 (7.1%) | 0 (0.0%) |
| 18 to 34 Years | 4 (14.3%) | 8 (25.0%) |
| 35 to 64 Years | 4 (14.8%) | 2 (7.4%) |
| 65 to 74 Years | 5 (62.5%) | 1 (16.7%) |
| 75 Years and over | 1 (25.0%) | 2 (28.6%) |
Disability Class by Sex by Age in South Haven
Disability Class: Hearing Difficulty
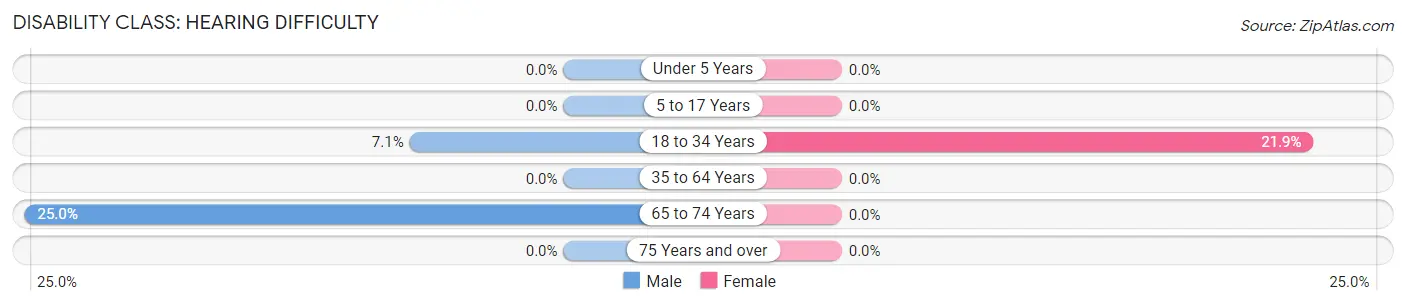
| Age Bracket | Male | Female |
| Under 5 Years | 0 (0.0%) | 0 (0.0%) |
| 5 to 17 Years | 0 (0.0%) | 0 (0.0%) |
| 18 to 34 Years | 2 (7.1%) | 7 (21.9%) |
| 35 to 64 Years | 0 (0.0%) | 0 (0.0%) |
| 65 to 74 Years | 2 (25.0%) | 0 (0.0%) |
| 75 Years and over | 0 (0.0%) | 0 (0.0%) |
Disability Class: Vision Difficulty
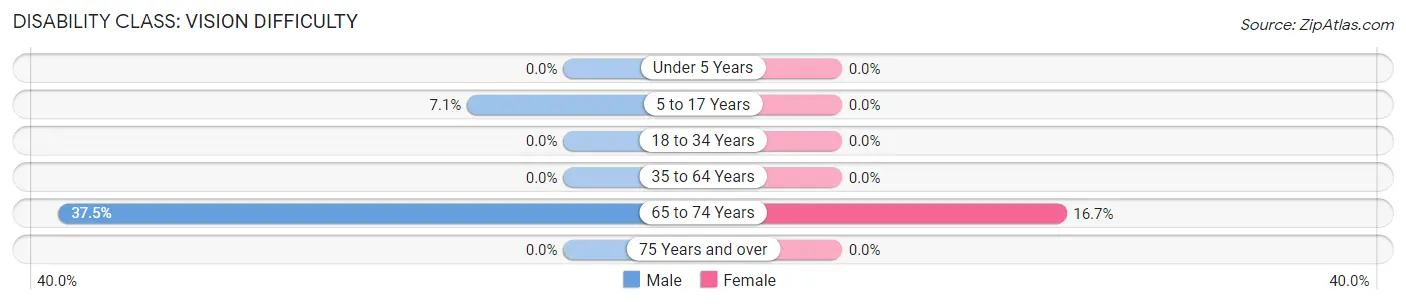
| Age Bracket | Male | Female |
| Under 5 Years | 0 (0.0%) | 0 (0.0%) |
| 5 to 17 Years | 1 (7.1%) | 0 (0.0%) |
| 18 to 34 Years | 0 (0.0%) | 0 (0.0%) |
| 35 to 64 Years | 0 (0.0%) | 0 (0.0%) |
| 65 to 74 Years | 3 (37.5%) | 1 (16.7%) |
| 75 Years and over | 0 (0.0%) | 0 (0.0%) |
Disability Class: Cognitive Difficulty
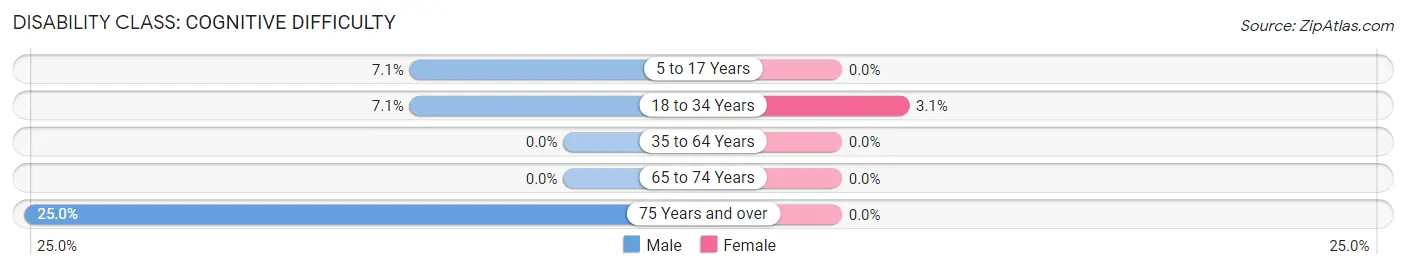
| Age Bracket | Male | Female |
| 5 to 17 Years | 1 (7.1%) | 0 (0.0%) |
| 18 to 34 Years | 2 (7.1%) | 1 (3.1%) |
| 35 to 64 Years | 0 (0.0%) | 0 (0.0%) |
| 65 to 74 Years | 0 (0.0%) | 0 (0.0%) |
| 75 Years and over | 1 (25.0%) | 0 (0.0%) |
Disability Class: Ambulatory Difficulty
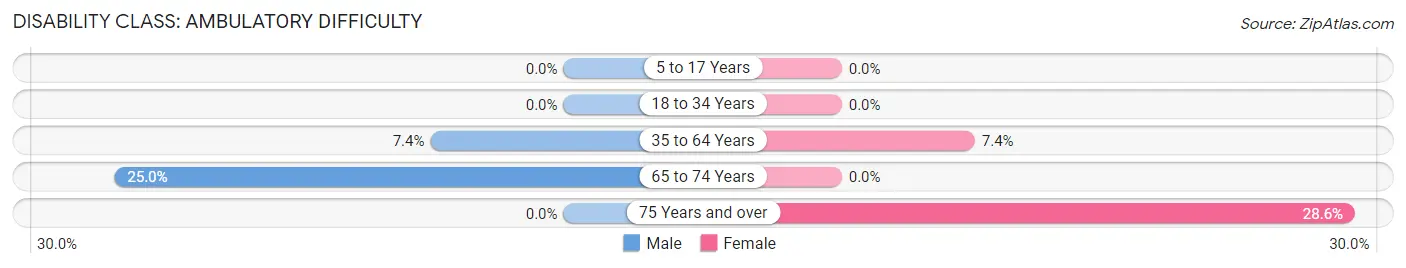
| Age Bracket | Male | Female |
| 5 to 17 Years | 0 (0.0%) | 0 (0.0%) |
| 18 to 34 Years | 0 (0.0%) | 0 (0.0%) |
| 35 to 64 Years | 2 (7.4%) | 2 (7.4%) |
| 65 to 74 Years | 2 (25.0%) | 0 (0.0%) |
| 75 Years and over | 0 (0.0%) | 2 (28.6%) |
Disability Class: Self-Care Difficulty
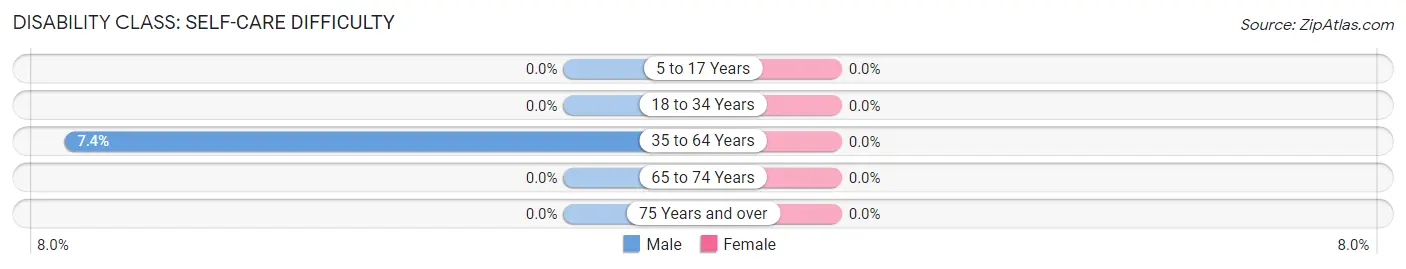
| Age Bracket | Male | Female |
| 5 to 17 Years | 0 (0.0%) | 0 (0.0%) |
| 18 to 34 Years | 0 (0.0%) | 0 (0.0%) |
| 35 to 64 Years | 2 (7.4%) | 0 (0.0%) |
| 65 to 74 Years | 0 (0.0%) | 0 (0.0%) |
| 75 Years and over | 0 (0.0%) | 0 (0.0%) |
Technology Access in South Haven
Computing Device Access in South Haven
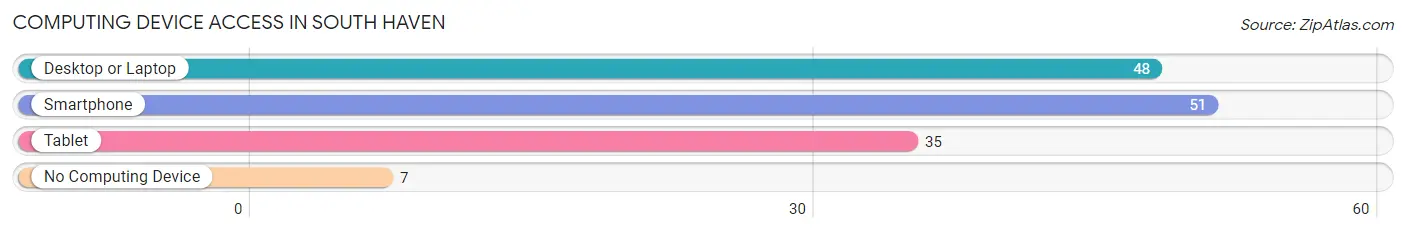
| Device Type | # Households | % Households |
| Desktop or Laptop | 48 | 73.9% |
| Smartphone | 51 | 78.5% |
| Tablet | 35 | 53.8% |
| No Computing Device | 7 | 10.8% |
| Total | 65 | 100.0% |
Internet Access in South Haven
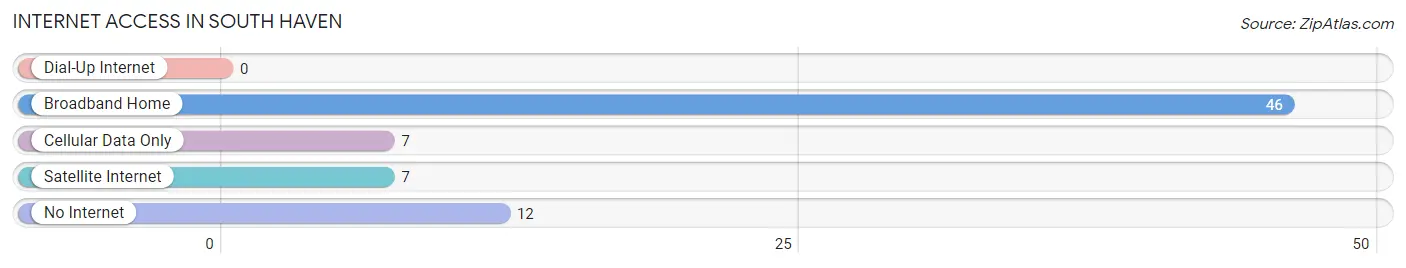
| Internet Type | # Households | % Households |
| Dial-Up Internet | 0 | 0.0% |
| Broadband Home | 46 | 70.8% |
| Cellular Data Only | 7 | 10.8% |
| Satellite Internet | 7 | 10.8% |
| No Internet | 12 | 18.5% |
| Total | 65 | 100.0% |
South Haven Summary
History
South Haven, Minnesota is a small town located in the southwestern corner of the state, just north of the Iowa border. It is part of the Mower County and is situated on the banks of the Cedar River. The town was founded in 1856 by a group of settlers from New York and Pennsylvania. The town was originally named Cedarville, but was changed to South Haven in 1858.
The town was originally a farming community, but in the late 19th century, it became a popular tourist destination. The town was known for its natural beauty, and it was a popular spot for fishing, hunting, and camping. The town also had a number of resorts and hotels, which attracted visitors from all over the Midwest.
In the early 20th century, the town began to experience a decline in population as people moved away to larger cities. However, in the 1950s, the town experienced a resurgence in popularity as a summer vacation destination. The town was also home to a number of summer camps, which attracted visitors from all over the country.
Geography
South Haven is located in the southwestern corner of Minnesota, just north of the Iowa border. It is part of Mower County and is situated on the banks of the Cedar River. The town is located in a rural area, and is surrounded by rolling hills and farmland. The town is located about 40 miles from the Twin Cities of Minneapolis and St. Paul.
The town has a total area of 1.2 square miles, all of which is land. The town has a humid continental climate, with cold winters and hot summers. The average temperature in the summer is around 75 degrees Fahrenheit, and the average temperature in the winter is around 20 degrees Fahrenheit.
Economy
The economy of South Haven is largely based on agriculture and tourism. The town is home to a number of farms, which produce a variety of crops, including corn, soybeans, and wheat. The town is also home to a number of small businesses, including restaurants, shops, and hotels.
The town is also a popular tourist destination, and it is home to a number of resorts and hotels. The town is also home to a number of summer camps, which attract visitors from all over the country.
Demographics
As of the 2010 census, the population of South Haven was 1,093. The town has a population density of 890 people per square mile. The median age of the population is 43.7 years, and the median household income is $45,000. The town is predominantly white, with 92.3% of the population identifying as white. The town also has a small Hispanic population, with 4.3% of the population identifying as Hispanic or Latino.
Common Questions
What is Per Capita Income in South Haven?
Per Capita income in South Haven is $33,494.
What is the Median Family Income in South Haven?
Median Family Income in South Haven is $81,250.
What is the Median Household income in South Haven?
Median Household Income in South Haven is $90,625.
What is Income or Wage Gap in South Haven?
Income or Wage Gap in South Haven is 41.2%.
Women in South Haven earn 58.8 cents for every dollar earned by a man.
What is Family Income Deficit in South Haven?
Family Income Deficit in South Haven is $13,278.
Families that are below poverty line in South Haven earn $13,278 less on average than the poverty threshold level.
What is Inequality or Gini Index in South Haven?
Inequality or Gini Index in South Haven is 0.31.
What is the Total Population of South Haven?
Total Population of South Haven is 179.
What is the Total Male Population of South Haven?
Total Male Population of South Haven is 91.
What is the Total Female Population of South Haven?
Total Female Population of South Haven is 88.
What is the Ratio of Males per 100 Females in South Haven?
There are 103.41 Males per 100 Females in South Haven.
What is the Ratio of Females per 100 Males in South Haven?
There are 96.70 Females per 100 Males in South Haven.
What is the Median Population Age in South Haven?
Median Population Age in South Haven is 30.7 Years.
What is the Average Family Size in South Haven
Average Family Size in South Haven is 3.0 People.
What is the Average Household Size in South Haven
Average Household Size in South Haven is 2.8 People.
How Large is the Labor Force in South Haven?
There are 106 People in the Labor Forcein in South Haven.
What is the Percentage of People in the Labor Force in South Haven?
73.1% of People are in the Labor Force in South Haven.