Soudan, MN Map & Demographics
Soudan Map
Soudan Overview
$33,305
PER CAPITA INCOME
$80,000
AVG FAMILY INCOME
$54,779
AVG HOUSEHOLD INCOME
53.1%
WAGE / INCOME GAP [ % ]
46.9¢/ $1
WAGE / INCOME GAP [ $ ]
0.32
INEQUALITY / GINI INDEX
423
TOTAL POPULATION
211
MALE POPULATION
212
FEMALE POPULATION
99.53
MALES / 100 FEMALES
100.47
FEMALES / 100 MALES
44.5
MEDIAN AGE
2.9
AVG FAMILY SIZE
2.1
AVG HOUSEHOLD SIZE
212
LABOR FORCE [ PEOPLE ]
60.4%
PERCENT IN LABOR FORCE
9.9%
UNEMPLOYMENT RATE
Soudan Zip Codes
Soudan Area Codes
Income in Soudan
Income Overview in Soudan
Per Capita Income in Soudan is $33,305, while median incomes of families and households are $80,000 and $54,779 respectively.
| Characteristic | Number | Measure |
| Per Capita Income | 423 | $33,305 |
| Median Family Income | 106 | $80,000 |
| Mean Family Income | 106 | $87,073 |
| Median Household Income | 205 | $54,779 |
| Mean Household Income | 205 | $68,524 |
| Income Deficit | 106 | $0 |
| Wage / Income Gap (%) | 423 | 53.05% |
| Wage / Income Gap ($) | 423 | 46.95¢ per $1 |
| Gini / Inequality Index | 423 | 0.32 |
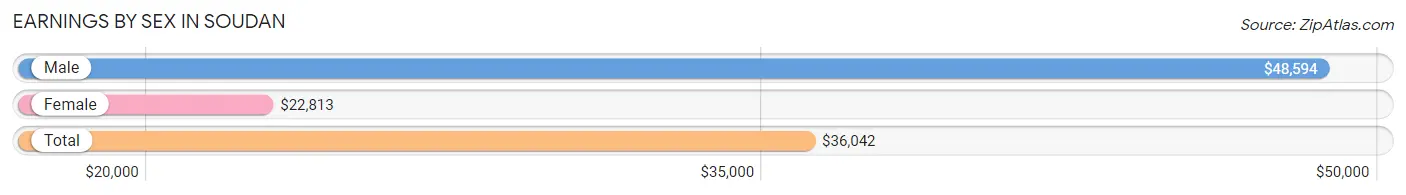
Earnings by Sex in Soudan
Average Earnings in Soudan are $36,042, $48,594 for men and $22,813 for women, a difference of 53.0%.
| Sex | Number | Average Earnings |
| Male | 105 (43.8%) | $48,594 |
| Female | 135 (56.2%) | $22,813 |
| Total | 240 (100.0%) | $36,042 |
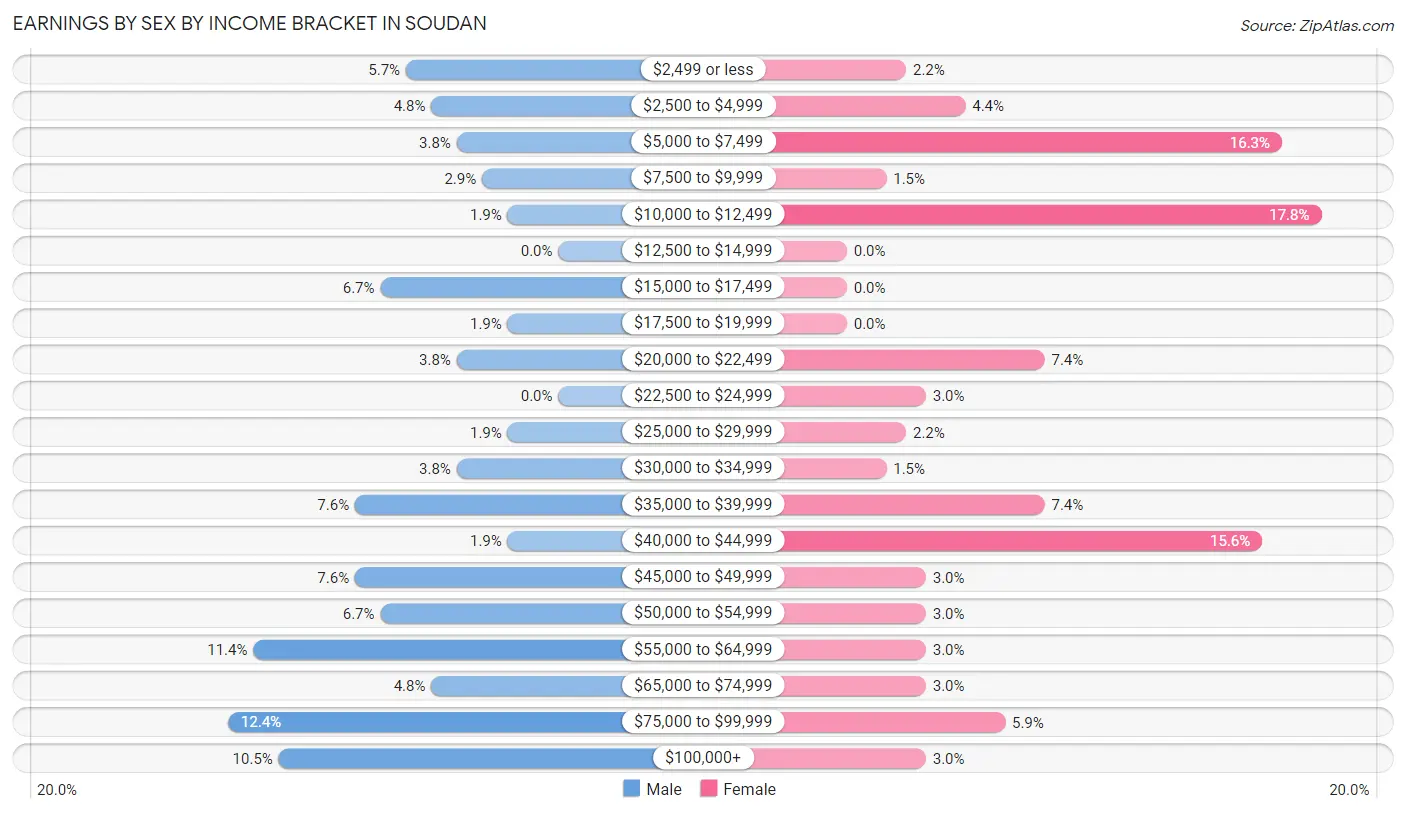
Earnings by Sex by Income Bracket in Soudan
The most common earnings brackets in Soudan are $75,000 to $99,999 for men (13 | 12.4%) and $10,000 to $12,499 for women (24 | 17.8%).
| Income | Male | Female |
| $2,499 or less | 6 (5.7%) | 3 (2.2%) |
| $2,500 to $4,999 | 5 (4.8%) | 6 (4.4%) |
| $5,000 to $7,499 | 4 (3.8%) | 22 (16.3%) |
| $7,500 to $9,999 | 3 (2.9%) | 2 (1.5%) |
| $10,000 to $12,499 | 2 (1.9%) | 24 (17.8%) |
| $12,500 to $14,999 | 0 (0.0%) | 0 (0.0%) |
| $15,000 to $17,499 | 7 (6.7%) | 0 (0.0%) |
| $17,500 to $19,999 | 2 (1.9%) | 0 (0.0%) |
| $20,000 to $22,499 | 4 (3.8%) | 10 (7.4%) |
| $22,500 to $24,999 | 0 (0.0%) | 4 (3.0%) |
| $25,000 to $29,999 | 2 (1.9%) | 3 (2.2%) |
| $30,000 to $34,999 | 4 (3.8%) | 2 (1.5%) |
| $35,000 to $39,999 | 8 (7.6%) | 10 (7.4%) |
| $40,000 to $44,999 | 2 (1.9%) | 21 (15.6%) |
| $45,000 to $49,999 | 8 (7.6%) | 4 (3.0%) |
| $50,000 to $54,999 | 7 (6.7%) | 4 (3.0%) |
| $55,000 to $64,999 | 12 (11.4%) | 4 (3.0%) |
| $65,000 to $74,999 | 5 (4.8%) | 4 (3.0%) |
| $75,000 to $99,999 | 13 (12.4%) | 8 (5.9%) |
| $100,000+ | 11 (10.5%) | 4 (3.0%) |
| Total | 105 (100.0%) | 135 (100.0%) |
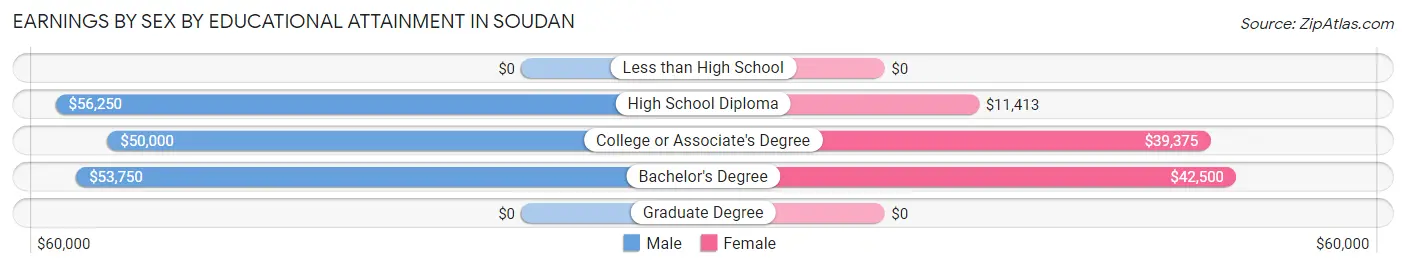
Earnings by Sex by Educational Attainment in Soudan
| Educational Attainment | Male Income | Female Income |
| Less than High School | - | - |
| High School Diploma | $56,250 | $11,413 |
| College or Associate's Degree | $50,000 | $39,375 |
| Bachelor's Degree | $53,750 | $42,500 |
| Graduate Degree | - | - |
| Total | $50,625 | $0 |
Family Income in Soudan
Family Income Brackets in Soudan
According to the Soudan family income data, there are 27 families falling into the $50,000 to $74,999 income range, which is the most common income bracket and makes up 25.5% of all families. Conversely, the $10,000 to $14,999 income bracket is the least frequent group with only 1 families (0.9%) belonging to this category.
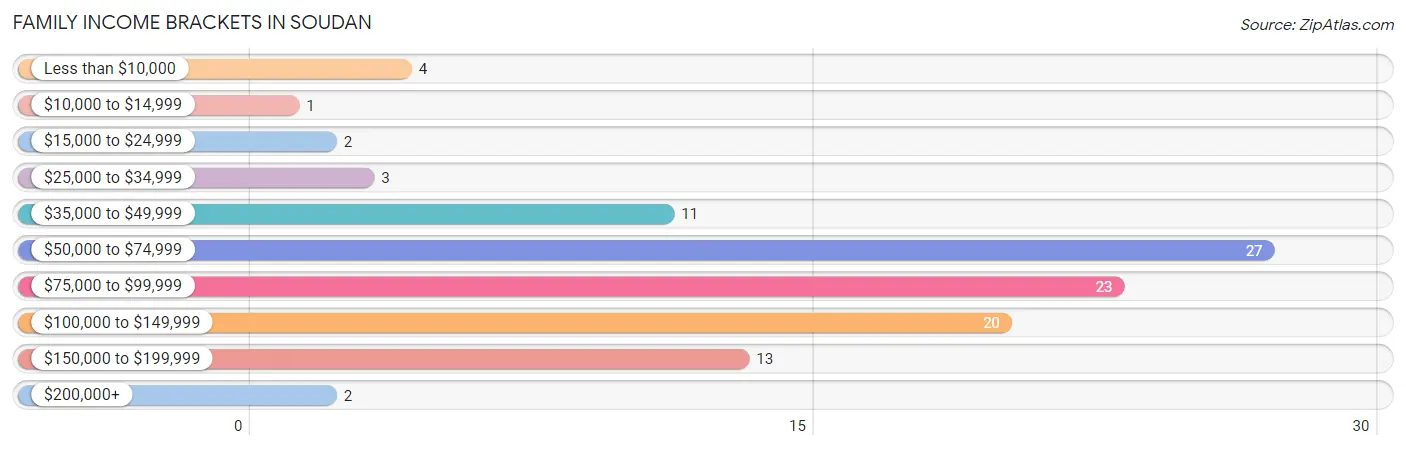
| Income Bracket | # Families | % Families |
| Less than $10,000 | 4 | 3.8% |
| $10,000 to $14,999 | 1 | 0.9% |
| $15,000 to $24,999 | 2 | 1.9% |
| $25,000 to $34,999 | 3 | 2.8% |
| $35,000 to $49,999 | 11 | 10.4% |
| $50,000 to $74,999 | 27 | 25.5% |
| $75,000 to $99,999 | 23 | 21.7% |
| $100,000 to $149,999 | 20 | 18.9% |
| $150,000 to $199,999 | 13 | 12.3% |
| $200,000+ | 2 | 1.9% |
Family Income by Famaliy Size in Soudan
3-person families (13 | 12.3%) account for the highest median family income in Soudan with $101,250 per family, while 2-person families (60 | 56.6%) have the highest median income of $39,166 per family member.
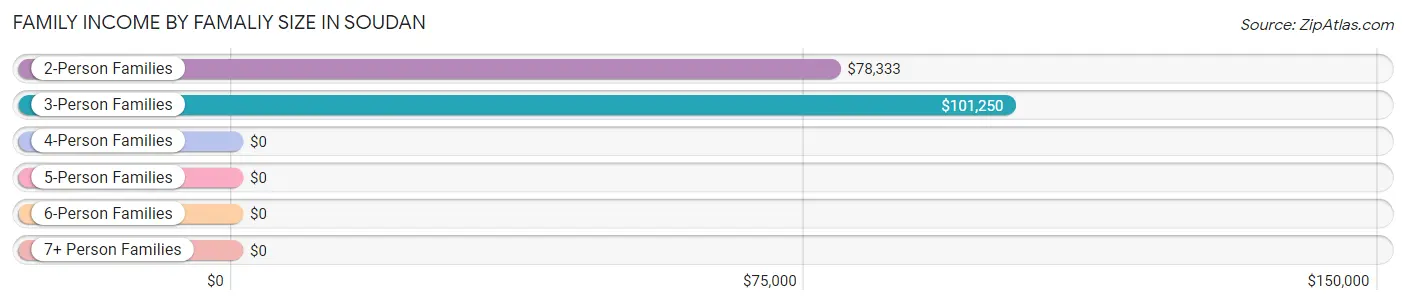
| Income Bracket | # Families | Median Income |
| 2-Person Families | 60 (56.6%) | $78,333 |
| 3-Person Families | 13 (12.3%) | $101,250 |
| 4-Person Families | 25 (23.6%) | $0 |
| 5-Person Families | 4 (3.8%) | $0 |
| 6-Person Families | 2 (1.9%) | $0 |
| 7+ Person Families | 2 (1.9%) | $0 |
| Total | 106 (100.0%) | $80,000 |
Family Income by Number of Earners in Soudan
The median family income in Soudan is $80,000, with families comprising 3+ earners (9) having the highest median family income of $166,250, while families with no earners (23) have the lowest median family income of $64,063, accounting for 8.5% and 21.7% of families, respectively.
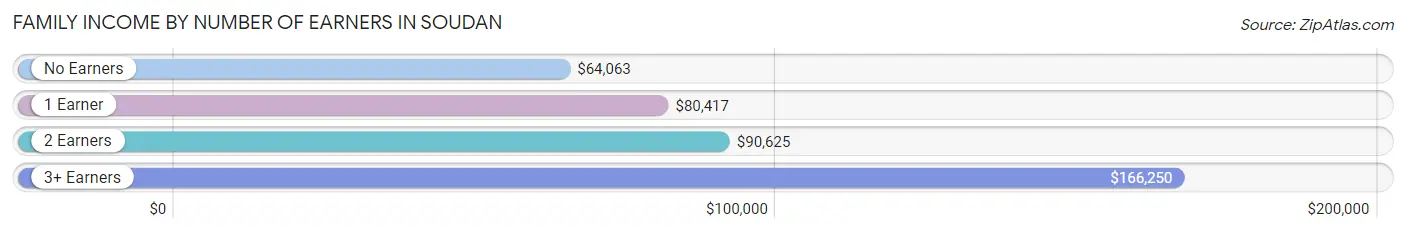
| Number of Earners | # Families | Median Income |
| No Earners | 23 (21.7%) | $64,063 |
| 1 Earner | 23 (21.7%) | $80,417 |
| 2 Earners | 51 (48.1%) | $90,625 |
| 3+ Earners | 9 (8.5%) | $166,250 |
| Total | 106 (100.0%) | $80,000 |
Household Income in Soudan
Household Income Brackets in Soudan
With 55 households falling in the category, the $50,000 to $74,999 income range is the most frequent in Soudan, accounting for 26.8% of all households. In contrast, only 1 households (0.5%) fall into the $10,000 to $14,999 income bracket, making it the least populous group.
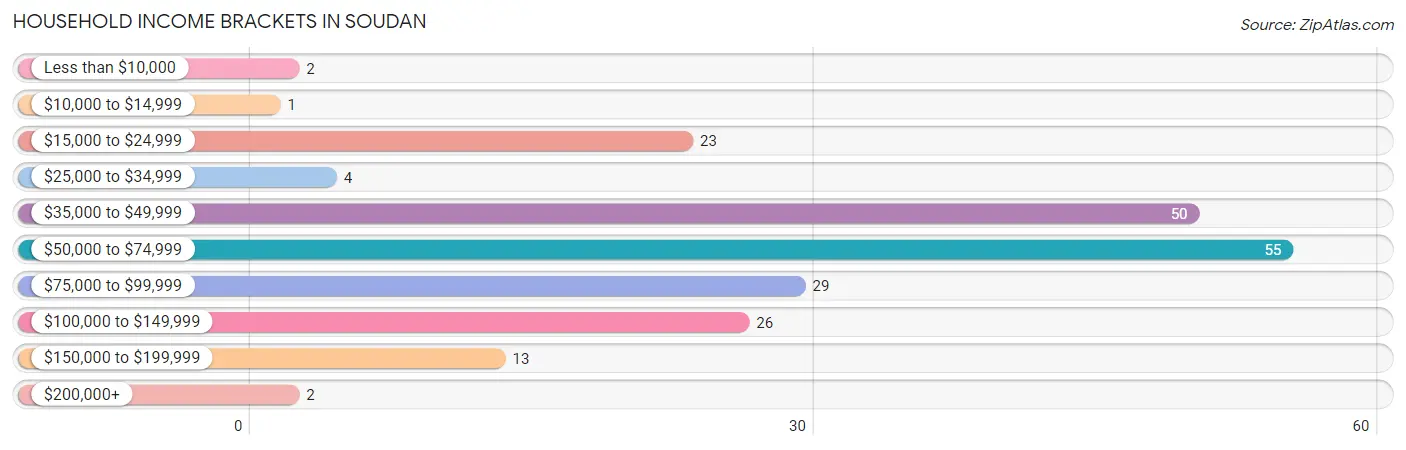
| Income Bracket | # Households | % Households |
| Less than $10,000 | 2 | 1.0% |
| $10,000 to $14,999 | 1 | 0.5% |
| $15,000 to $24,999 | 23 | 11.2% |
| $25,000 to $34,999 | 4 | 2.0% |
| $35,000 to $49,999 | 50 | 24.4% |
| $50,000 to $74,999 | 55 | 26.8% |
| $75,000 to $99,999 | 29 | 14.1% |
| $100,000 to $149,999 | 26 | 12.7% |
| $150,000 to $199,999 | 13 | 6.3% |
| $200,000+ | 2 | 1.0% |
Household Income by Householder Age in Soudan
The median household income in Soudan is $54,779, with the highest median household income of $75,000 found in the 45 to 64 years age bracket for the primary householder. A total of 66 households (32.2%) fall into this category. Meanwhile, the 15 to 24 years age bracket for the primary householder has the lowest median household income of $0, with 18 households (8.8%) in this group.
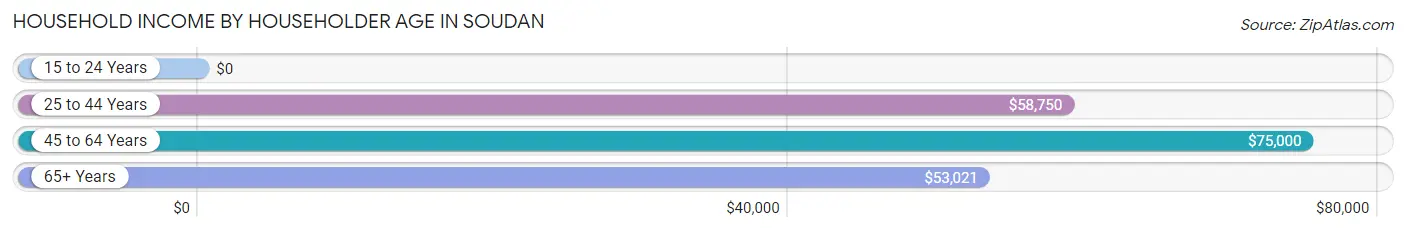
| Income Bracket | # Households | Median Income |
| 15 to 24 Years | 18 (8.8%) | $0 |
| 25 to 44 Years | 46 (22.4%) | $58,750 |
| 45 to 64 Years | 66 (32.2%) | $75,000 |
| 65+ Years | 75 (36.6%) | $53,021 |
| Total | 205 (100.0%) | $54,779 |
Poverty in Soudan
Income Below Poverty by Sex and Age in Soudan
With 7.1% poverty level for males and 8.0% for females among the residents of Soudan, under 5 year old males and 16 and 17 year old females are the most vulnerable to poverty, with 2 males (33.3%) and 2 females (100.0%) in their respective age groups living below the poverty level.
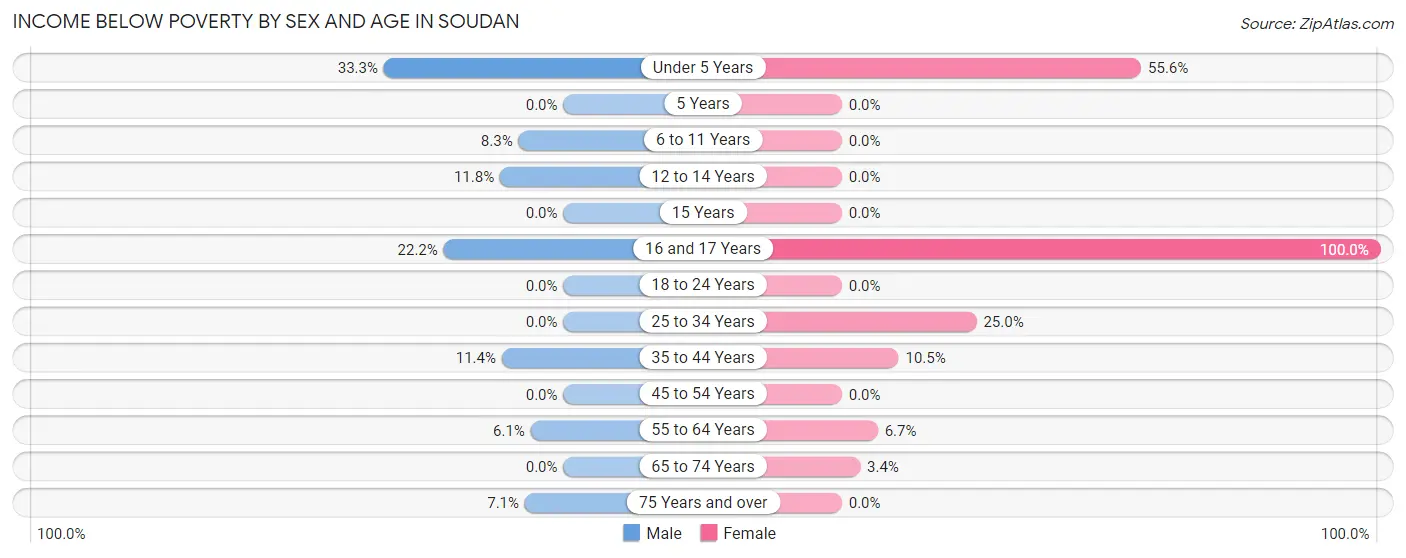
| Age Bracket | Male | Female |
| Under 5 Years | 2 (33.3%) | 5 (55.6%) |
| 5 Years | 0 (0.0%) | 0 (0.0%) |
| 6 to 11 Years | 2 (8.3%) | 0 (0.0%) |
| 12 to 14 Years | 2 (11.8%) | 0 (0.0%) |
| 15 Years | 0 (0.0%) | 0 (0.0%) |
| 16 and 17 Years | 2 (22.2%) | 2 (100.0%) |
| 18 to 24 Years | 0 (0.0%) | 0 (0.0%) |
| 25 to 34 Years | 0 (0.0%) | 4 (25.0%) |
| 35 to 44 Years | 4 (11.4%) | 2 (10.5%) |
| 45 to 54 Years | 0 (0.0%) | 0 (0.0%) |
| 55 to 64 Years | 2 (6.1%) | 2 (6.7%) |
| 65 to 74 Years | 0 (0.0%) | 2 (3.4%) |
| 75 Years and over | 1 (7.1%) | 0 (0.0%) |
| Total | 15 (7.1%) | 17 (8.0%) |
Income Above Poverty by Sex and Age in Soudan
According to the poverty statistics in Soudan, males aged 18 to 24 years and females aged 5 years are the age groups that are most secure financially, with 100.0% of males and 100.0% of females in these age groups living above the poverty line.
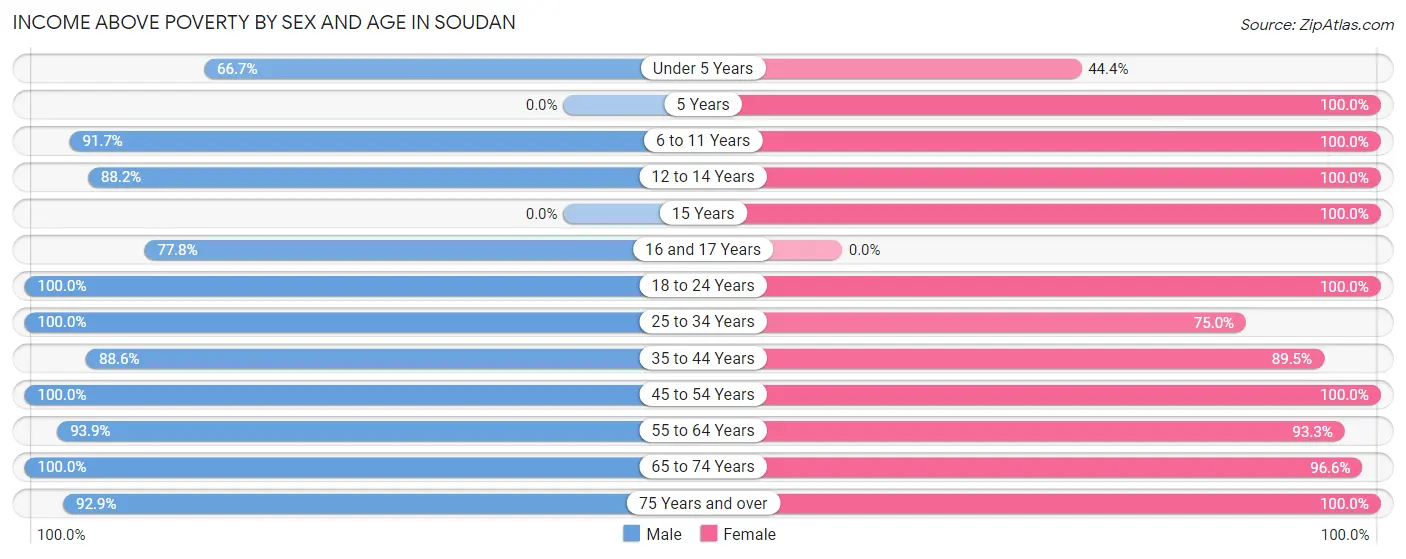
| Age Bracket | Male | Female |
| Under 5 Years | 4 (66.7%) | 4 (44.4%) |
| 5 Years | 0 (0.0%) | 3 (100.0%) |
| 6 to 11 Years | 22 (91.7%) | 5 (100.0%) |
| 12 to 14 Years | 15 (88.2%) | 5 (100.0%) |
| 15 Years | 0 (0.0%) | 3 (100.0%) |
| 16 and 17 Years | 7 (77.8%) | 0 (0.0%) |
| 18 to 24 Years | 2 (100.0%) | 41 (100.0%) |
| 25 to 34 Years | 16 (100.0%) | 12 (75.0%) |
| 35 to 44 Years | 31 (88.6%) | 17 (89.5%) |
| 45 to 54 Years | 19 (100.0%) | 15 (100.0%) |
| 55 to 64 Years | 31 (93.9%) | 28 (93.3%) |
| 65 to 74 Years | 36 (100.0%) | 57 (96.6%) |
| 75 Years and over | 13 (92.9%) | 5 (100.0%) |
| Total | 196 (92.9%) | 195 (92.0%) |
Income Below Poverty Among Married-Couple Families in Soudan
The poverty statistics for married-couple families in Soudan show that 3.6% or 3 of the total 84 families live below the poverty line. Families with 5 or more children have the highest poverty rate of 100.0%, comprising of 2 families. On the other hand, families with 1 or 2 children have the lowest poverty rate of 0.0%, which includes 0 families.
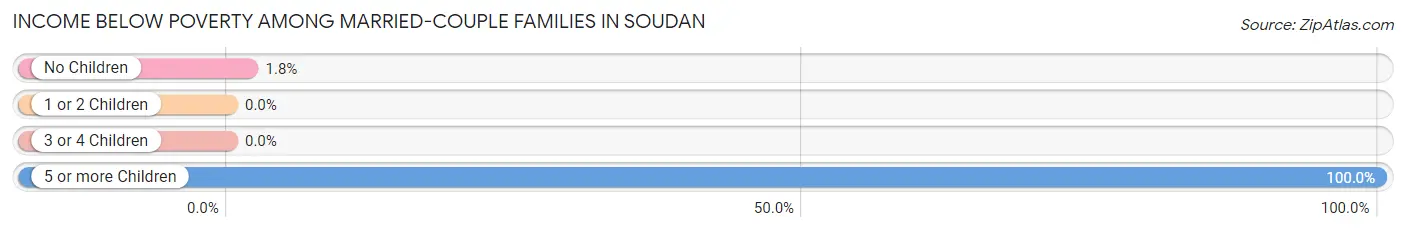
| Children | Above Poverty | Below Poverty |
| No Children | 55 (98.2%) | 1 (1.8%) |
| 1 or 2 Children | 22 (100.0%) | 0 (0.0%) |
| 3 or 4 Children | 4 (100.0%) | 0 (0.0%) |
| 5 or more Children | 0 (0.0%) | 2 (100.0%) |
| Total | 81 (96.4%) | 3 (3.6%) |
Income Below Poverty Among Single-Parent Households in Soudan
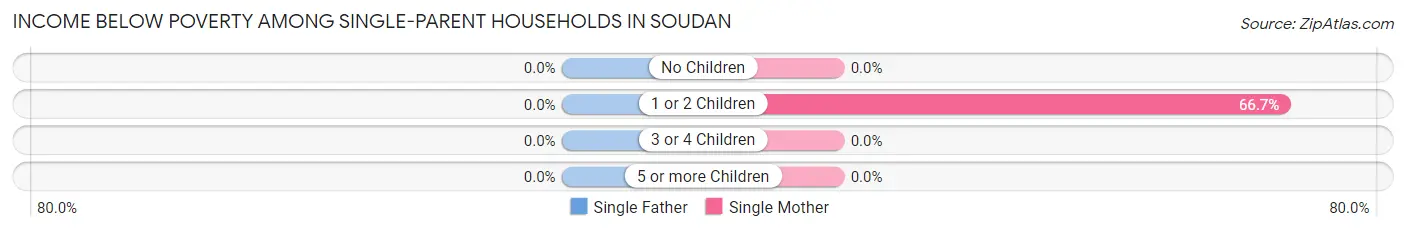
| Children | Single Father | Single Mother |
| No Children | 0 (0.0%) | 0 (0.0%) |
| 1 or 2 Children | 0 (0.0%) | 4 (66.7%) |
| 3 or 4 Children | 0 (0.0%) | 0 (0.0%) |
| 5 or more Children | 0 (0.0%) | 0 (0.0%) |
| Total | 0 (0.0%) | 4 (44.4%) |
Income Below Poverty Among Married-Couple vs Single-Parent Households in Soudan
The poverty data for Soudan shows that 3 of the married-couple family households (3.6%) and 4 of the single-parent households (18.2%) are living below the poverty level. Within the married-couple family households, those with 5 or more children have the highest poverty rate, with 2 households (100.0%) falling below the poverty line. Among the single-parent households, those with 1 or 2 children have the highest poverty rate, with 4 household (23.5%) living below poverty.
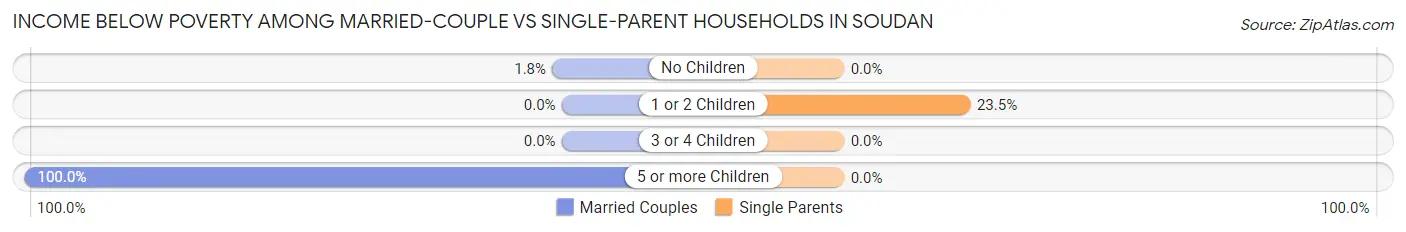
| Children | Married-Couple Families | Single-Parent Households |
| No Children | 1 (1.8%) | 0 (0.0%) |
| 1 or 2 Children | 0 (0.0%) | 4 (23.5%) |
| 3 or 4 Children | 0 (0.0%) | 0 (0.0%) |
| 5 or more Children | 2 (100.0%) | 0 (0.0%) |
| Total | 3 (3.6%) | 4 (18.2%) |
Race in Soudan
The most populous races in Soudan are White / Caucasian (395 | 93.4%), Hispanic or Latino (19 | 4.5%), and Two or more Races (17 | 4.0%).
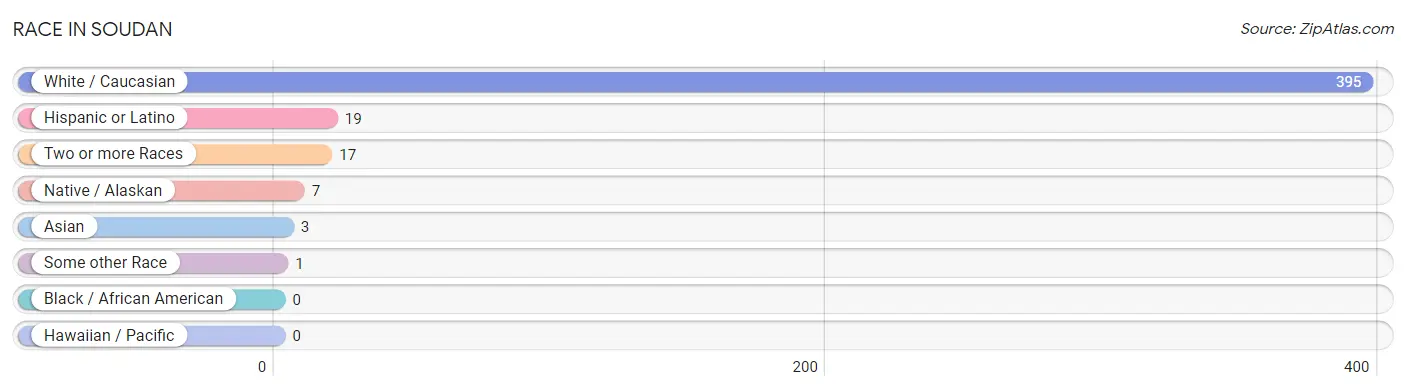
| Race | # Population | % Population |
| Asian | 3 | 0.7% |
| Black / African American | 0 | 0.0% |
| Hawaiian / Pacific | 0 | 0.0% |
| Hispanic or Latino | 19 | 4.5% |
| Native / Alaskan | 7 | 1.7% |
| White / Caucasian | 395 | 93.4% |
| Two or more Races | 17 | 4.0% |
| Some other Race | 1 | 0.2% |
| Total | 423 | 100.0% |
Ancestry in Soudan
The most populous ancestries reported in Soudan are German (102 | 24.1%), Finnish (98 | 23.2%), Norwegian (58 | 13.7%), Swedish (52 | 12.3%), and Irish (45 | 10.6%), together accounting for 83.9% of all Soudan residents.
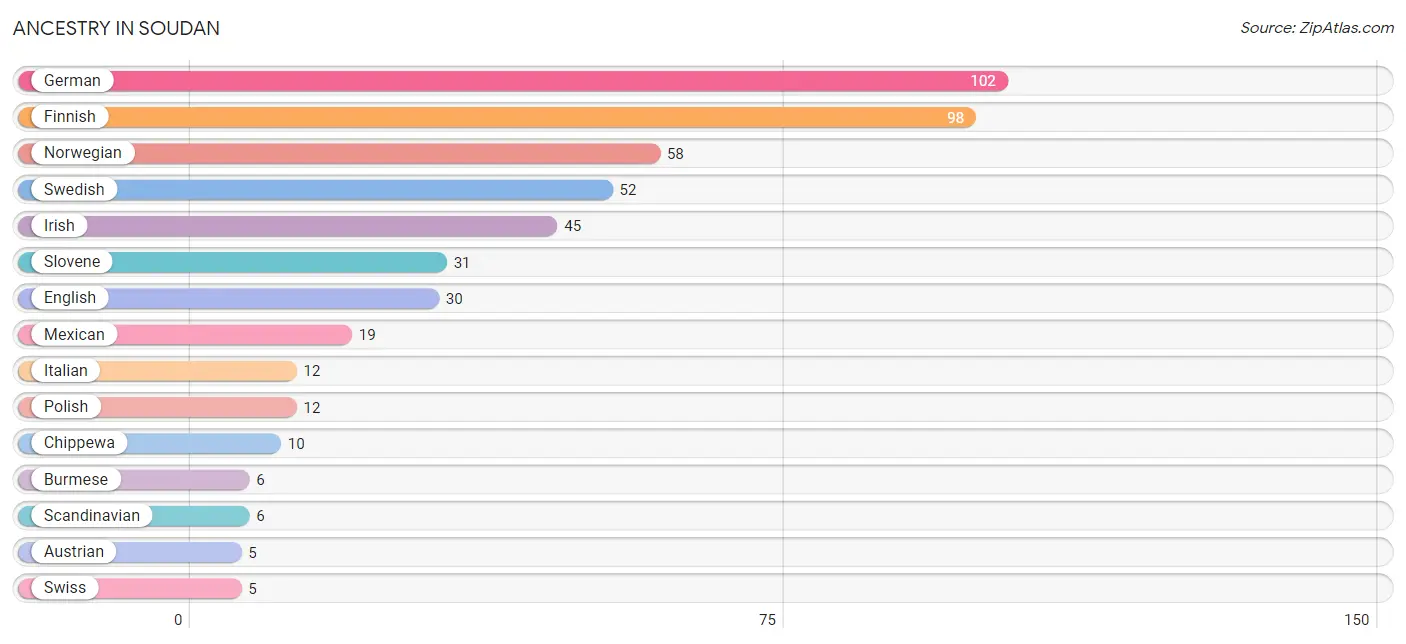
| Ancestry | # Population | % Population |
| American | 4 | 0.9% |
| Austrian | 5 | 1.2% |
| Burmese | 6 | 1.4% |
| Chippewa | 10 | 2.4% |
| Czech | 4 | 0.9% |
| Czechoslovakian | 2 | 0.5% |
| Danish | 1 | 0.2% |
| English | 30 | 7.1% |
| Finnish | 98 | 23.2% |
| French | 2 | 0.5% |
| French Canadian | 2 | 0.5% |
| German | 102 | 24.1% |
| Irish | 45 | 10.6% |
| Italian | 12 | 2.8% |
| Laotian | 2 | 0.5% |
| Luxembourger | 2 | 0.5% |
| Mexican | 19 | 4.5% |
| Norwegian | 58 | 13.7% |
| Polish | 12 | 2.8% |
| Russian | 1 | 0.2% |
| Scandinavian | 6 | 1.4% |
| Scotch-Irish | 4 | 0.9% |
| Scottish | 1 | 0.2% |
| Serbian | 2 | 0.5% |
| Slovene | 31 | 7.3% |
| Swedish | 52 | 12.3% |
| Swiss | 5 | 1.2% | View All 27 Rows |
Immigrants in Soudan
The most numerous immigrant groups reported in Soudan came from Asia (2 | 0.5%), Indonesia (2 | 0.5%), and South Eastern Asia (2 | 0.5%), together accounting for 1.4% of all Soudan residents.
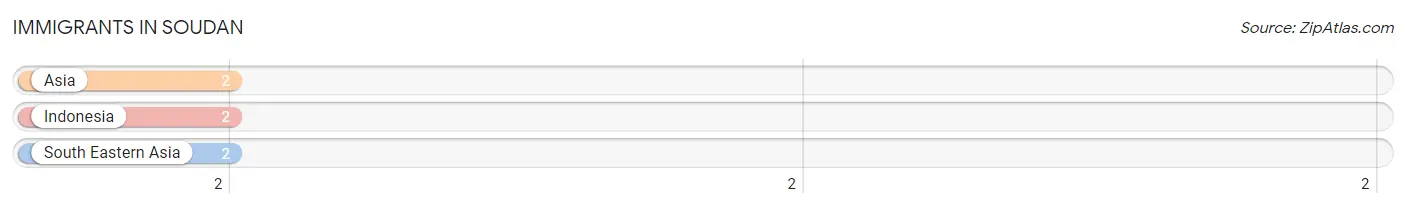
| Immigration Origin | # Population | % Population |
| Asia | 2 | 0.5% |
| Indonesia | 2 | 0.5% |
| South Eastern Asia | 2 | 0.5% | View All 3 Rows |
Sex and Age in Soudan
Sex and Age in Soudan
The most populous age groups in Soudan are 65 to 69 Years (31 | 14.7%) for men and 65 to 69 Years (38 | 17.9%) for women.
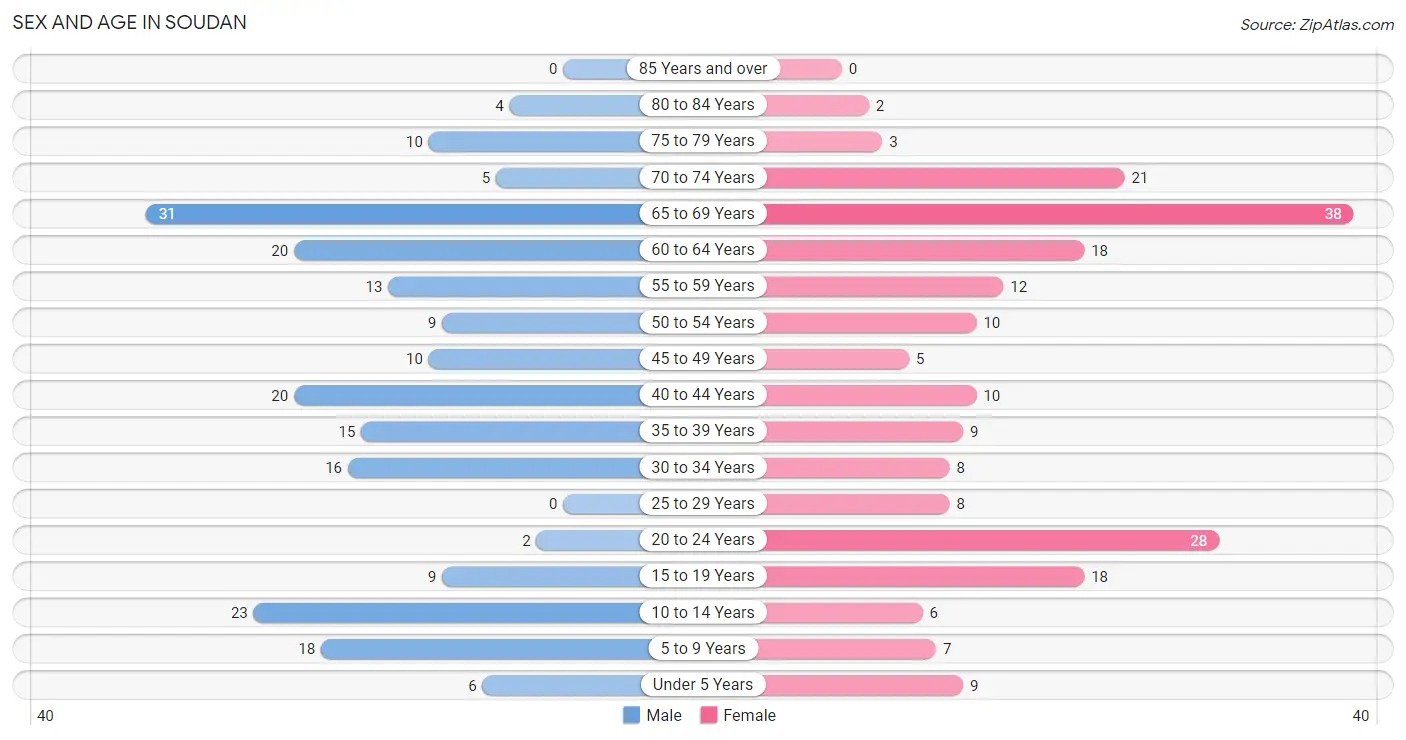
| Age Bracket | Male | Female |
| Under 5 Years | 6 (2.8%) | 9 (4.3%) |
| 5 to 9 Years | 18 (8.5%) | 7 (3.3%) |
| 10 to 14 Years | 23 (10.9%) | 6 (2.8%) |
| 15 to 19 Years | 9 (4.3%) | 18 (8.5%) |
| 20 to 24 Years | 2 (0.9%) | 28 (13.2%) |
| 25 to 29 Years | 0 (0.0%) | 8 (3.8%) |
| 30 to 34 Years | 16 (7.6%) | 8 (3.8%) |
| 35 to 39 Years | 15 (7.1%) | 9 (4.3%) |
| 40 to 44 Years | 20 (9.5%) | 10 (4.7%) |
| 45 to 49 Years | 10 (4.7%) | 5 (2.4%) |
| 50 to 54 Years | 9 (4.3%) | 10 (4.7%) |
| 55 to 59 Years | 13 (6.2%) | 12 (5.7%) |
| 60 to 64 Years | 20 (9.5%) | 18 (8.5%) |
| 65 to 69 Years | 31 (14.7%) | 38 (17.9%) |
| 70 to 74 Years | 5 (2.4%) | 21 (9.9%) |
| 75 to 79 Years | 10 (4.7%) | 3 (1.4%) |
| 80 to 84 Years | 4 (1.9%) | 2 (0.9%) |
| 85 Years and over | 0 (0.0%) | 0 (0.0%) |
| Total | 211 (100.0%) | 212 (100.0%) |
Families and Households in Soudan
Median Family Size in Soudan
The median family size in Soudan is 2.89 persons per family, with single male/father families (13 | 12.3%) accounting for the largest median family size of 3.54 persons per family. On the other hand, single female/mother families (9 | 8.5%) represent the smallest median family size with 2.44 persons per family.
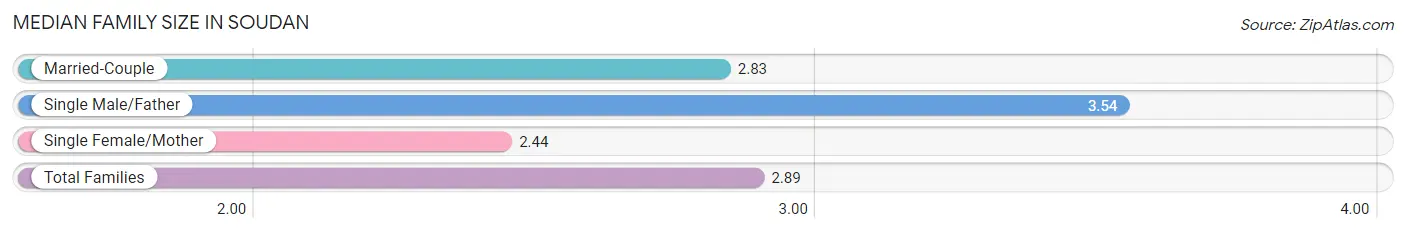
| Family Type | # Families | Family Size |
| Married-Couple | 84 (79.2%) | 2.83 |
| Single Male/Father | 13 (12.3%) | 3.54 |
| Single Female/Mother | 9 (8.5%) | 2.44 |
| Total Families | 106 (100.0%) | 2.89 |
Median Household Size in Soudan
The median household size in Soudan is 2.06 persons per household, with single male/father households (13 | 6.3%) accounting for the largest median household size of 3.54 persons per household. non-family households (99 | 48.3%) represent the smallest median household size with 1.14 persons per household.
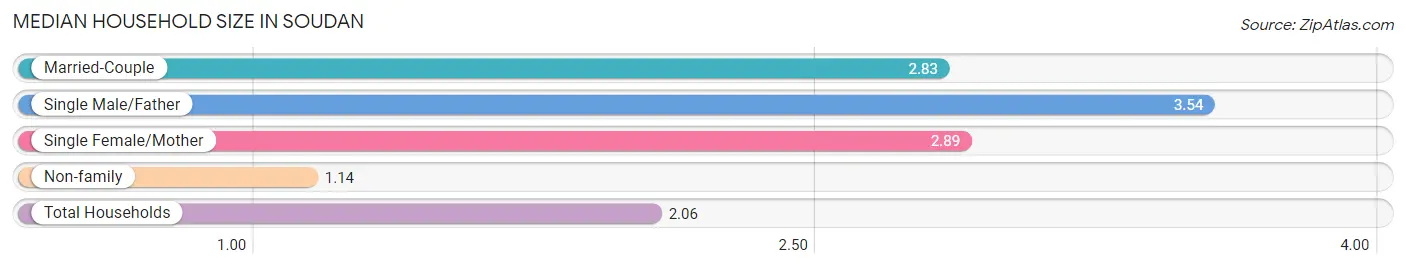
| Household Type | # Households | Household Size |
| Married-Couple | 84 (41.0%) | 2.83 |
| Single Male/Father | 13 (6.3%) | 3.54 |
| Single Female/Mother | 9 (4.4%) | 2.89 |
| Non-family | 99 (48.3%) | 1.14 |
| Total Households | 205 (100.0%) | 2.06 |
Household Size by Marriage Status in Soudan
Out of a total of 205 households in Soudan, 106 (51.7%) are family households, while 99 (48.3%) are nonfamily households. The most numerous type of family households are 2-person households, comprising 58, and the most common type of nonfamily households are 1-person households, comprising 87.
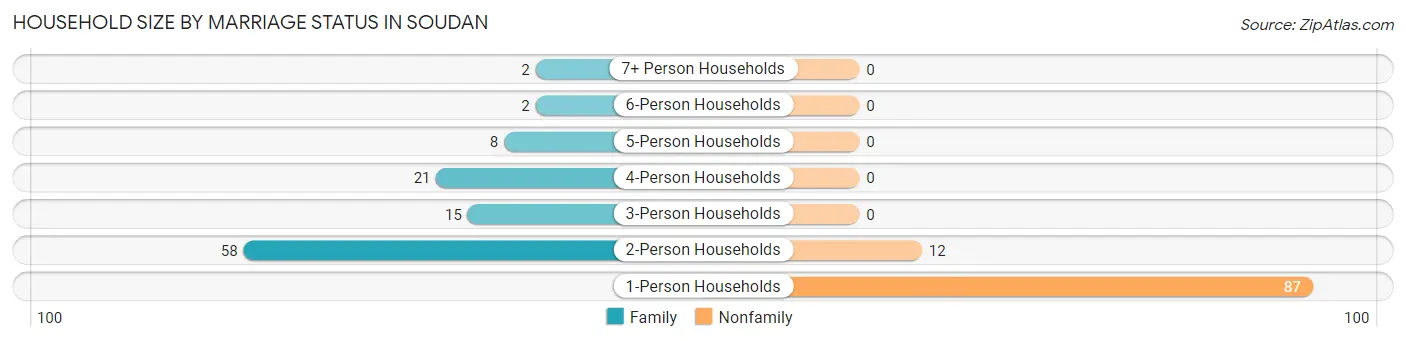
| Household Size | Family Households | Nonfamily Households |
| 1-Person Households | - | 87 (42.4%) |
| 2-Person Households | 58 (28.3%) | 12 (5.9%) |
| 3-Person Households | 15 (7.3%) | 0 (0.0%) |
| 4-Person Households | 21 (10.2%) | 0 (0.0%) |
| 5-Person Households | 8 (3.9%) | 0 (0.0%) |
| 6-Person Households | 2 (1.0%) | 0 (0.0%) |
| 7+ Person Households | 2 (1.0%) | 0 (0.0%) |
| Total | 106 (51.7%) | 99 (48.3%) |
Female Fertility in Soudan
Fertility by Age in Soudan
Average fertility rate in Soudan is 70.0 births per 1,000 women. Women in the age bracket of 20 to 34 years have the highest fertility rate with 136.0 births per 1,000 women. Women in the age bracket of 20 to 34 years acount for 100.0% of all women with births.
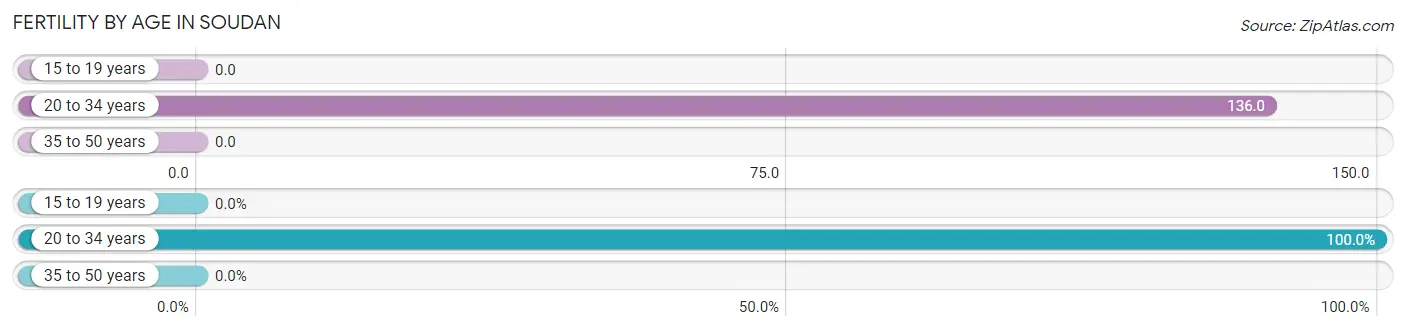
| Age Bracket | Women with Births | Births / 1,000 Women |
| 15 to 19 years | 0 (0.0%) | 0.0 |
| 20 to 34 years | 6 (100.0%) | 136.0 |
| 35 to 50 years | 0 (0.0%) | 0.0 |
| Total | 6 (100.0%) | 70.0 |
Fertility by Age by Marriage Status in Soudan
33.3% of women with births (6) in Soudan are married. The highest percentage of unmarried women with births falls into 20 to 34 years age bracket with 66.7% of them unmarried at the time of birth, while the lowest percentage of unmarried women with births belong to 20 to 34 years age bracket with 66.7% of them unmarried.
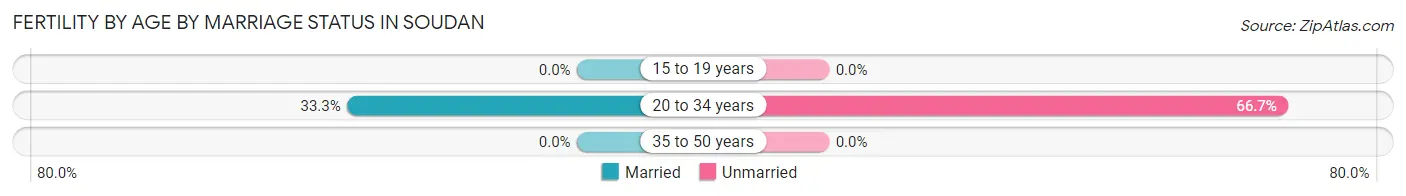
| Age Bracket | Married | Unmarried |
| 15 to 19 years | 0 (0.0%) | 0 (0.0%) |
| 20 to 34 years | 2 (33.3%) | 4 (66.7%) |
| 35 to 50 years | 0 (0.0%) | 0 (0.0%) |
| Total | 2 (33.3%) | 4 (66.7%) |
Fertility by Education in Soudan
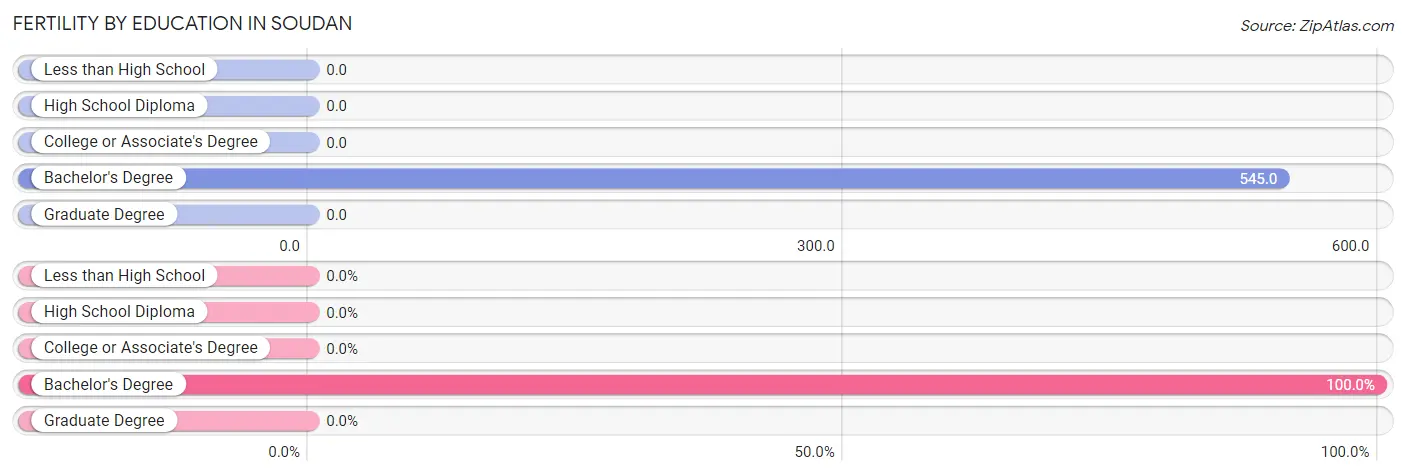
| Educational Attainment | Women with Births | Births / 1,000 Women |
| Less than High School | 0 (0.0%) | 0.0 |
| High School Diploma | 0 (0.0%) | 0.0 |
| College or Associate's Degree | 0 (0.0%) | 0.0 |
| Bachelor's Degree | 6 (100.0%) | 545.0 |
| Graduate Degree | 0 (0.0%) | 0.0 |
| Total | 6 (100.0%) | 70.0 |
Fertility by Education by Marriage Status in Soudan
66.7% of women with births in Soudan are unmarried. Women with the educational attainment of bachelor's degree are most likely to be married with 33.3% of them married at childbirth, while women with the educational attainment of bachelor's degree are least likely to be married with 66.7% of them unmarried at childbirth.
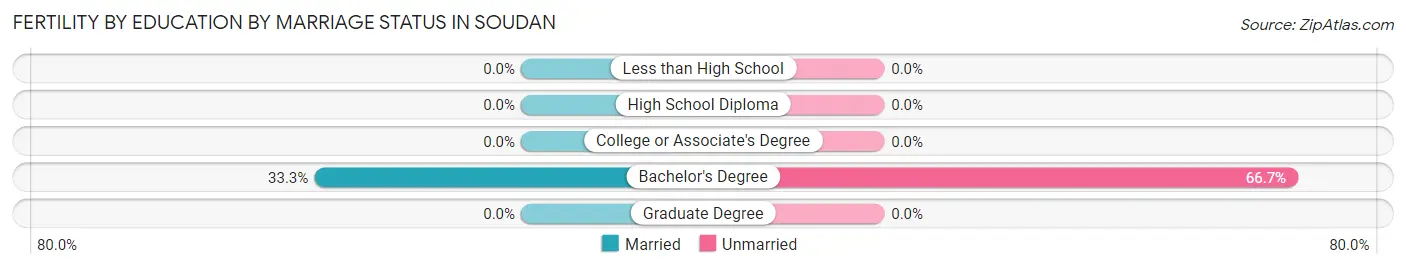
| Educational Attainment | Married | Unmarried |
| Less than High School | 0 (0.0%) | 0 (0.0%) |
| High School Diploma | 0 (0.0%) | 0 (0.0%) |
| College or Associate's Degree | 0 (0.0%) | 0 (0.0%) |
| Bachelor's Degree | 2 (33.3%) | 4 (66.7%) |
| Graduate Degree | 0 (0.0%) | 0 (0.0%) |
| Total | 2 (33.3%) | 4 (66.7%) |
Employment Characteristics in Soudan
Employment by Class of Employer in Soudan
Among the 191 employed individuals in Soudan, private company employees (92 | 48.2%), federal government employees (29 | 15.2%), and not-for-profit organizations (20 | 10.5%) make up the most common classes of employment.
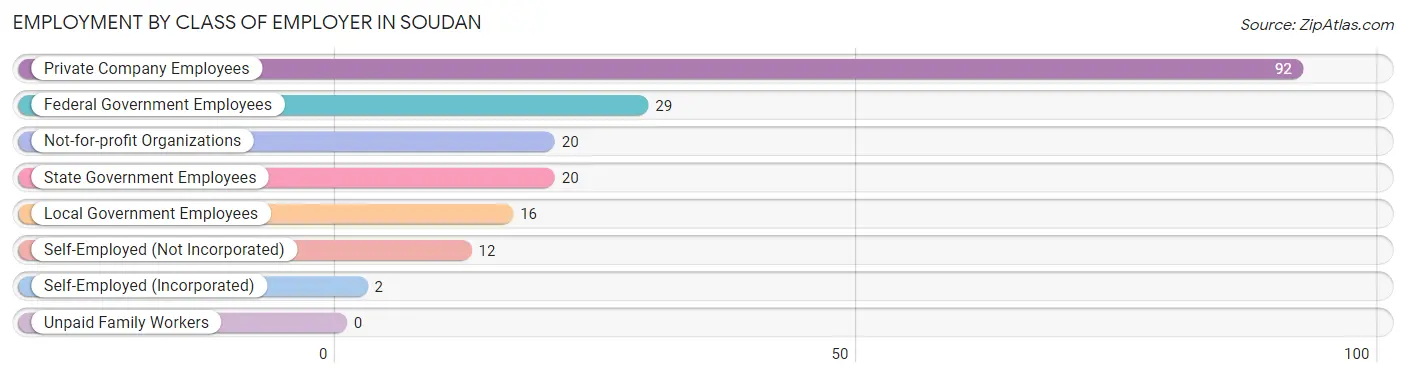
| Employer Class | # Employees | % Employees |
| Private Company Employees | 92 | 48.2% |
| Self-Employed (Incorporated) | 2 | 1.1% |
| Self-Employed (Not Incorporated) | 12 | 6.3% |
| Not-for-profit Organizations | 20 | 10.5% |
| Local Government Employees | 16 | 8.4% |
| State Government Employees | 20 | 10.5% |
| Federal Government Employees | 29 | 15.2% |
| Unpaid Family Workers | 0 | 0.0% |
| Total | 191 | 100.0% |
Employment Status by Age in Soudan
According to the labor force statistics for Soudan, out of the total population over 16 years of age (351), 60.4% or 212 individuals are in the labor force, with 9.9% or 21 of them unemployed. The age group with the highest labor force participation rate is 20 to 24 years, with 100.0% or 30 individuals in the labor force. Within the labor force, the 30 to 34 years age range has the highest percentage of unemployed individuals, with 28.6% or 6 of them being unemployed.
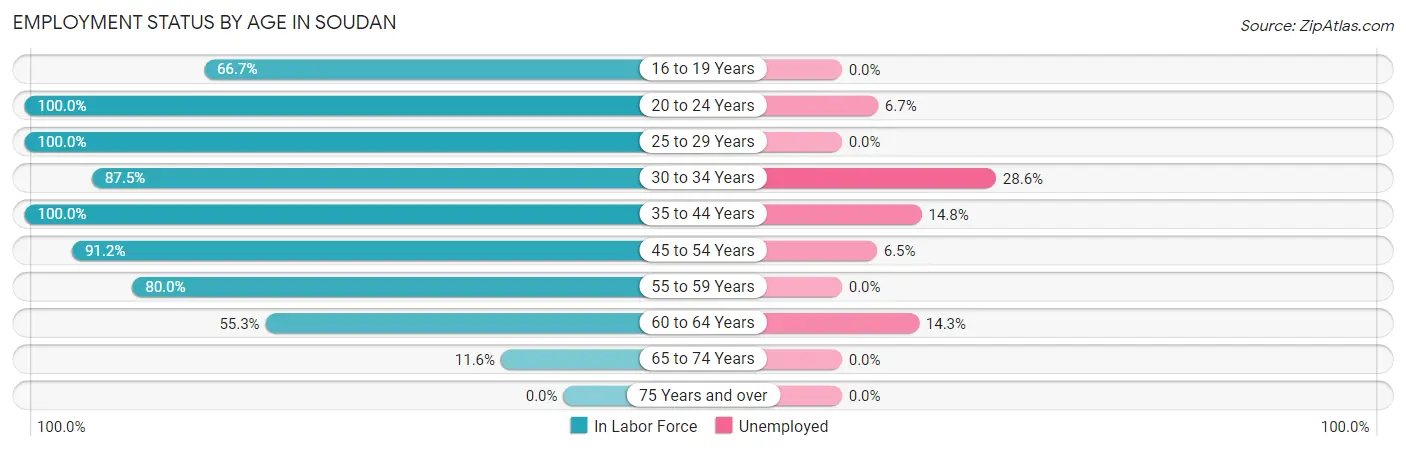
| Age Bracket | In Labor Force | Unemployed |
| 16 to 19 Years | 16 (66.7%) | 0 (0.0%) |
| 20 to 24 Years | 30 (100.0%) | 2 (6.7%) |
| 25 to 29 Years | 8 (100.0%) | 0 (0.0%) |
| 30 to 34 Years | 21 (87.5%) | 6 (28.6%) |
| 35 to 44 Years | 54 (100.0%) | 8 (14.8%) |
| 45 to 54 Years | 31 (91.2%) | 2 (6.5%) |
| 55 to 59 Years | 20 (80.0%) | 0 (0.0%) |
| 60 to 64 Years | 21 (55.3%) | 3 (14.3%) |
| 65 to 74 Years | 11 (11.6%) | 0 (0.0%) |
| 75 Years and over | 0 (0.0%) | 0 (0.0%) |
| Total | 212 (60.4%) | 21 (9.9%) |
Employment Status by Educational Attainment in Soudan
According to labor force statistics for Soudan, 84.7% of individuals (155) out of the total population between 25 and 64 years of age (183) are in the labor force, with 12.3% or 19 of them being unemployed. The group with the highest labor force participation rate are those with the educational attainment of less than high school, with 100.0% or 9 individuals in the labor force. Within the labor force, individuals with high school diploma education have the highest percentage of unemployment, with 23.7% or 9 of them being unemployed.
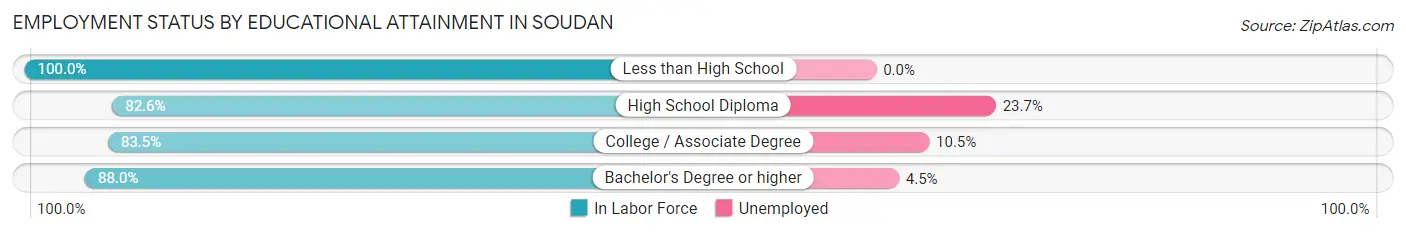
| Educational Attainment | In Labor Force | Unemployed |
| Less than High School | 9 (100.0%) | 0 (0.0%) |
| High School Diploma | 38 (82.6%) | 11 (23.7%) |
| College / Associate Degree | 86 (83.5%) | 11 (10.5%) |
| Bachelor's Degree or higher | 22 (88.0%) | 1 (4.5%) |
| Total | 155 (84.7%) | 23 (12.3%) |
Employment Occupations by Sex in Soudan
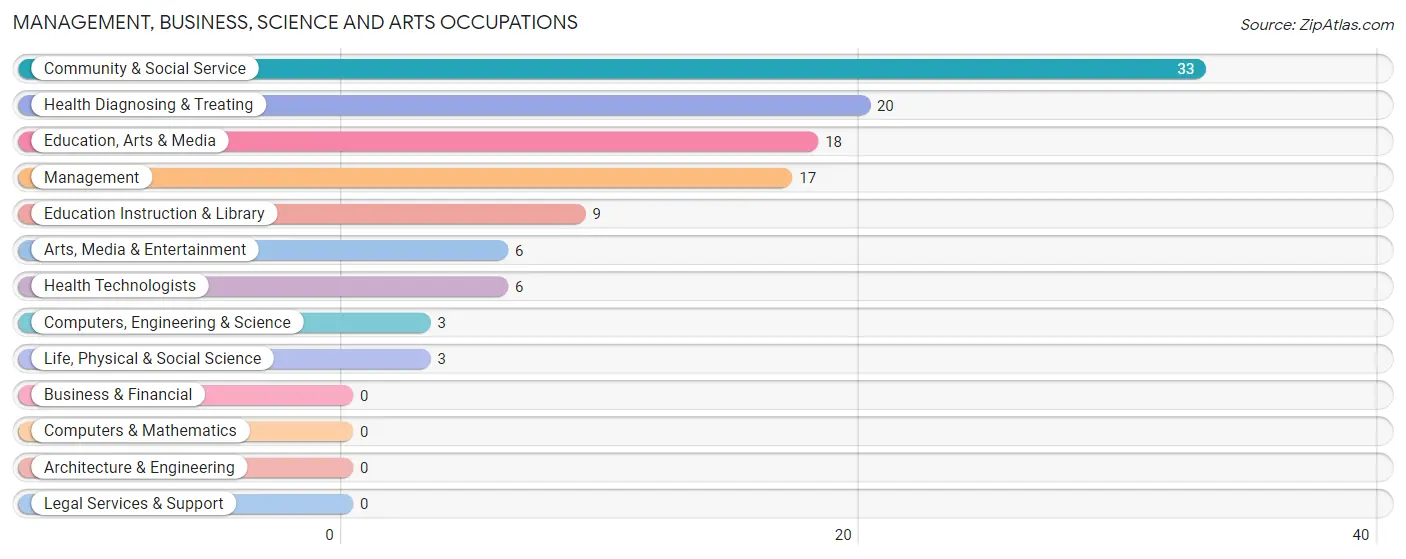
Management, Business, Science and Arts Occupations
The most common Management, Business, Science and Arts occupations in Soudan are Community & Social Service (33 | 17.3%), Health Diagnosing & Treating (20 | 10.5%), Education, Arts & Media (18 | 9.4%), Management (17 | 8.9%), and Education Instruction & Library (9 | 4.7%).
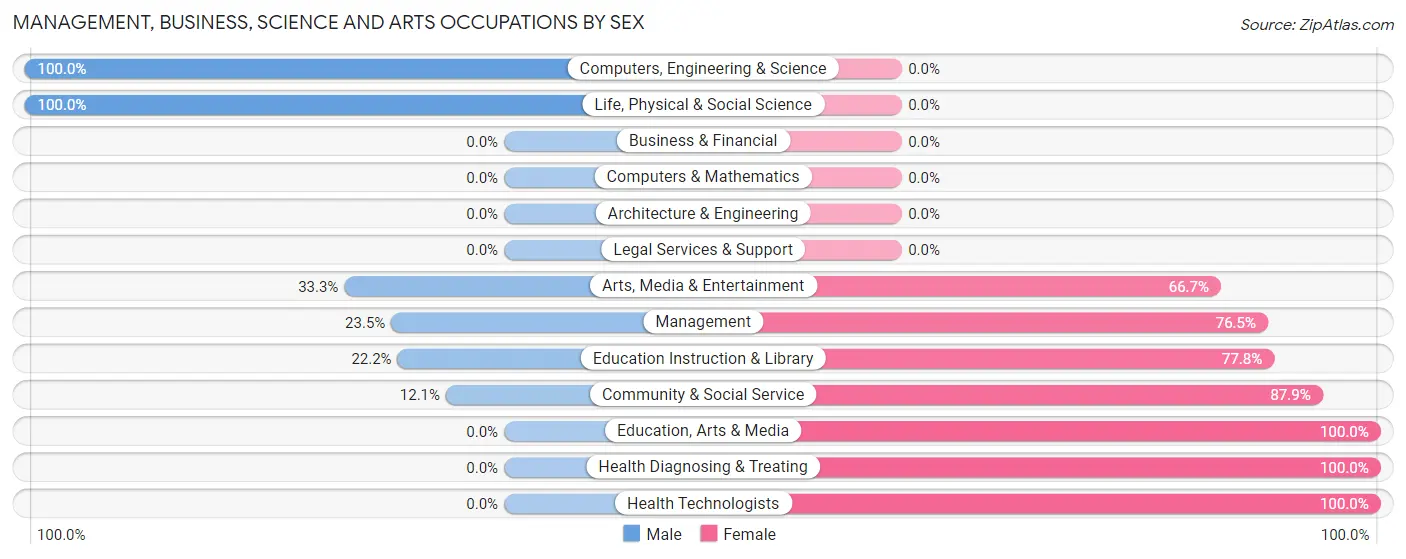
Management, Business, Science and Arts Occupations by Sex
Within the Management, Business, Science and Arts occupations in Soudan, the most male-oriented occupations are Computers, Engineering & Science (100.0%), Life, Physical & Social Science (100.0%), and Arts, Media & Entertainment (33.3%), while the most female-oriented occupations are Education, Arts & Media (100.0%), Health Diagnosing & Treating (100.0%), and Health Technologists (100.0%).
| Occupation | Male | Female |
| Management | 4 (23.5%) | 13 (76.5%) |
| Business & Financial | 0 (0.0%) | 0 (0.0%) |
| Computers, Engineering & Science | 3 (100.0%) | 0 (0.0%) |
| Computers & Mathematics | 0 (0.0%) | 0 (0.0%) |
| Architecture & Engineering | 0 (0.0%) | 0 (0.0%) |
| Life, Physical & Social Science | 3 (100.0%) | 0 (0.0%) |
| Community & Social Service | 4 (12.1%) | 29 (87.9%) |
| Education, Arts & Media | 0 (0.0%) | 18 (100.0%) |
| Legal Services & Support | 0 (0.0%) | 0 (0.0%) |
| Education Instruction & Library | 2 (22.2%) | 7 (77.8%) |
| Arts, Media & Entertainment | 2 (33.3%) | 4 (66.7%) |
| Health Diagnosing & Treating | 0 (0.0%) | 20 (100.0%) |
| Health Technologists | 0 (0.0%) | 6 (100.0%) |
| Total (Category) | 11 (15.1%) | 62 (84.9%) |
| Total (Overall) | 86 (45.0%) | 105 (55.0%) |
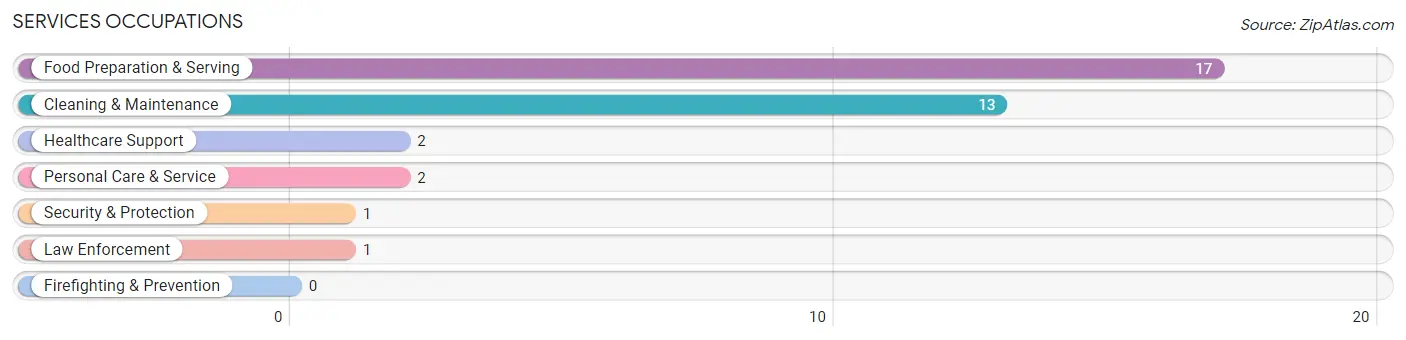
Services Occupations
The most common Services occupations in Soudan are Food Preparation & Serving (17 | 8.9%), Cleaning & Maintenance (13 | 6.8%), Healthcare Support (2 | 1.1%), Personal Care & Service (2 | 1.1%), and Security & Protection (1 | 0.5%).
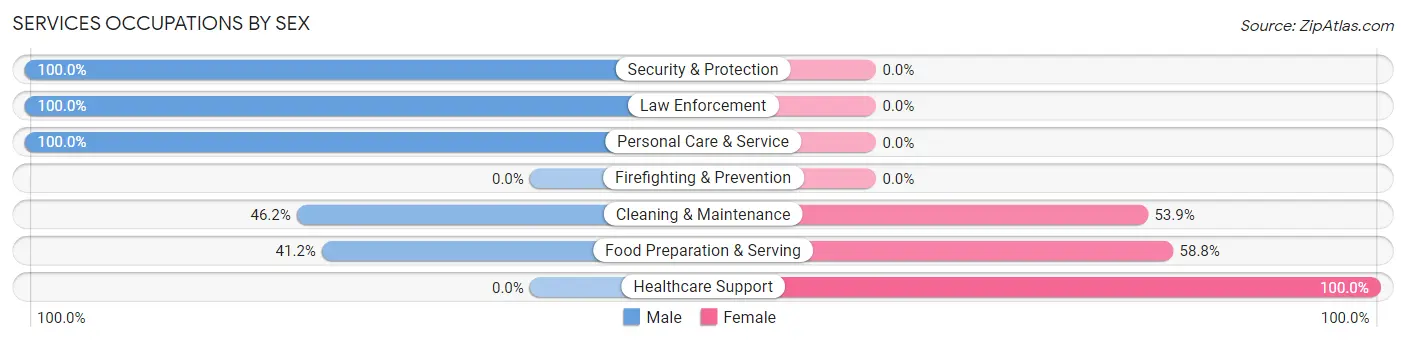
Services Occupations by Sex
Within the Services occupations in Soudan, the most male-oriented occupations are Security & Protection (100.0%), Law Enforcement (100.0%), and Personal Care & Service (100.0%), while the most female-oriented occupations are Healthcare Support (100.0%), Food Preparation & Serving (58.8%), and Cleaning & Maintenance (53.8%).
| Occupation | Male | Female |
| Healthcare Support | 0 (0.0%) | 2 (100.0%) |
| Security & Protection | 1 (100.0%) | 0 (0.0%) |
| Firefighting & Prevention | 0 (0.0%) | 0 (0.0%) |
| Law Enforcement | 1 (100.0%) | 0 (0.0%) |
| Food Preparation & Serving | 7 (41.2%) | 10 (58.8%) |
| Cleaning & Maintenance | 6 (46.2%) | 7 (53.8%) |
| Personal Care & Service | 2 (100.0%) | 0 (0.0%) |
| Total (Category) | 16 (45.7%) | 19 (54.3%) |
| Total (Overall) | 86 (45.0%) | 105 (55.0%) |
Sales and Office Occupations
The most common Sales and Office occupations in Soudan are Sales & Related (19 | 10.0%), and Office & Administration (15 | 7.9%).
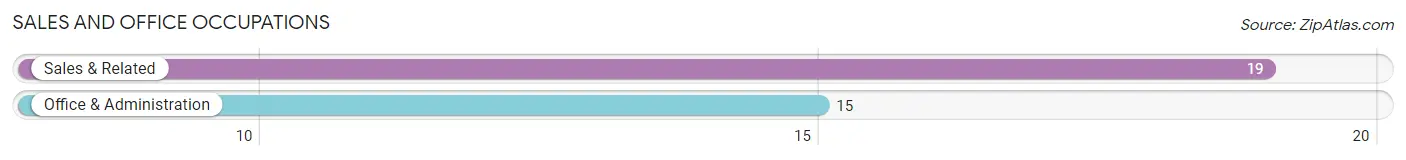
Sales and Office Occupations by Sex
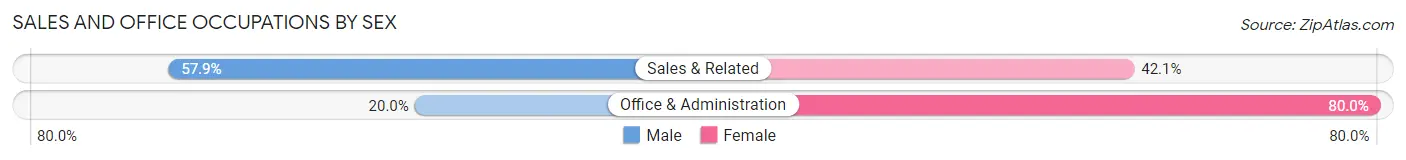
| Occupation | Male | Female |
| Sales & Related | 11 (57.9%) | 8 (42.1%) |
| Office & Administration | 3 (20.0%) | 12 (80.0%) |
| Total (Category) | 14 (41.2%) | 20 (58.8%) |
| Total (Overall) | 86 (45.0%) | 105 (55.0%) |
Natural Resources, Construction and Maintenance Occupations
The most common Natural Resources, Construction and Maintenance occupations in Soudan are Construction & Extraction (30 | 15.7%), and Installation, Maintenance & Repair (4 | 2.1%).
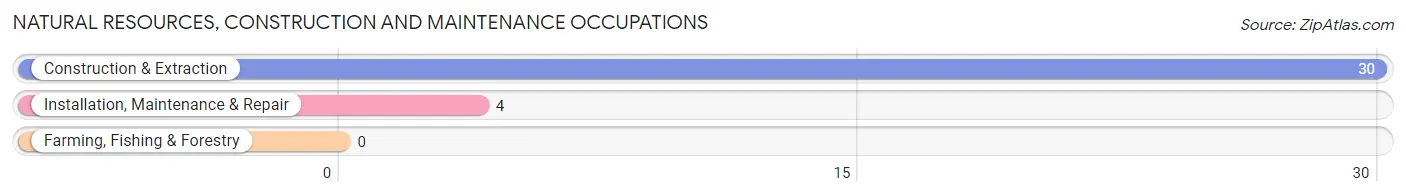
Natural Resources, Construction and Maintenance Occupations by Sex
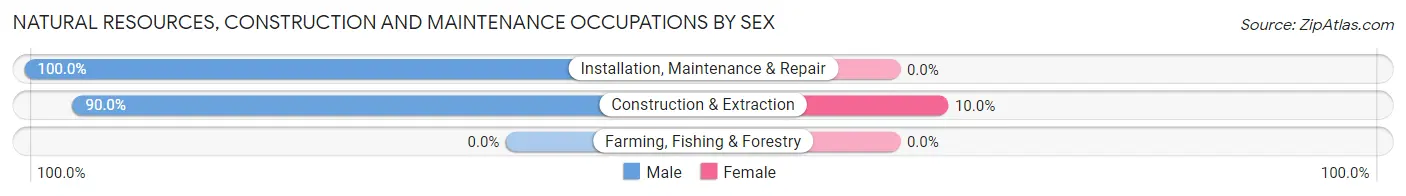
| Occupation | Male | Female |
| Farming, Fishing & Forestry | 0 (0.0%) | 0 (0.0%) |
| Construction & Extraction | 27 (90.0%) | 3 (10.0%) |
| Installation, Maintenance & Repair | 4 (100.0%) | 0 (0.0%) |
| Total (Category) | 31 (91.2%) | 3 (8.8%) |
| Total (Overall) | 86 (45.0%) | 105 (55.0%) |
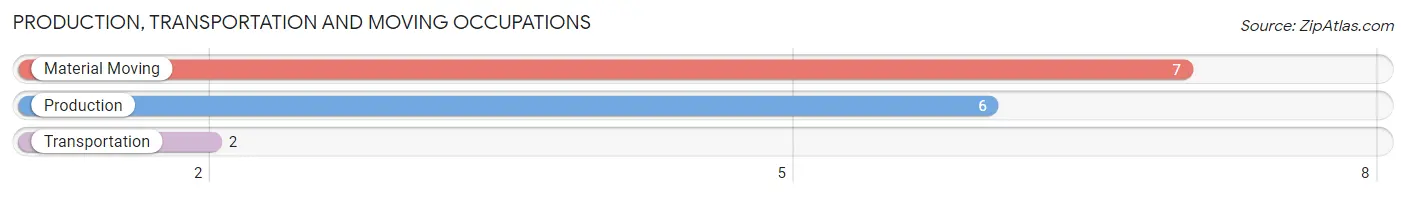
Production, Transportation and Moving Occupations
The most common Production, Transportation and Moving occupations in Soudan are Material Moving (7 | 3.7%), Production (6 | 3.1%), and Transportation (2 | 1.1%).
Production, Transportation and Moving Occupations by Sex
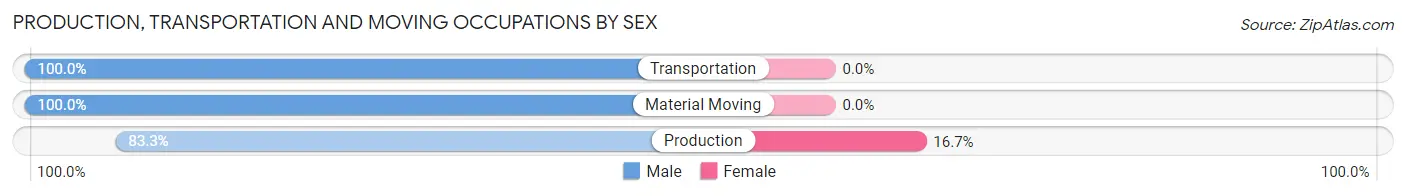
| Occupation | Male | Female |
| Production | 5 (83.3%) | 1 (16.7%) |
| Transportation | 2 (100.0%) | 0 (0.0%) |
| Material Moving | 7 (100.0%) | 0 (0.0%) |
| Total (Category) | 14 (93.3%) | 1 (6.7%) |
| Total (Overall) | 86 (45.0%) | 105 (55.0%) |
Employment Industries by Sex in Soudan
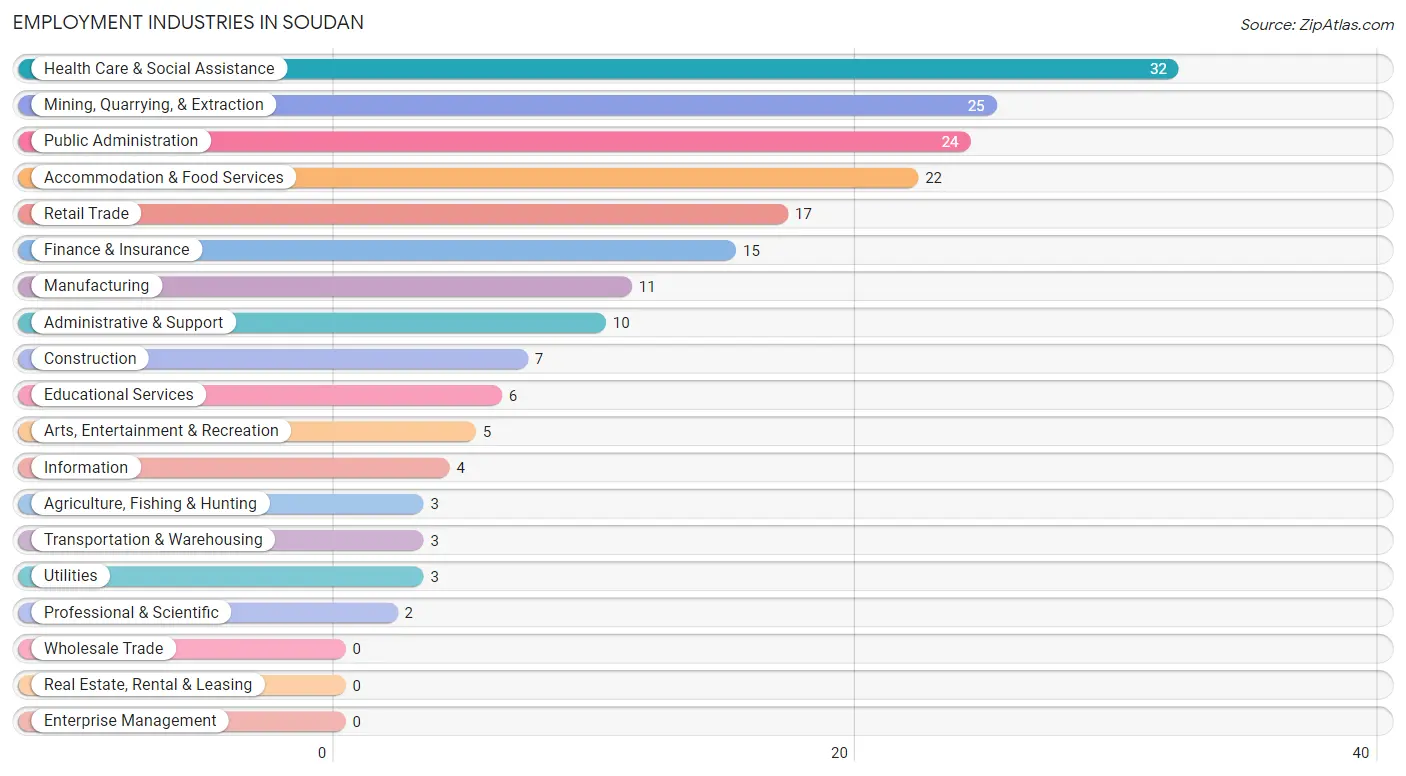
Employment Industries in Soudan
The major employment industries in Soudan include Health Care & Social Assistance (32 | 16.8%), Mining, Quarrying, & Extraction (25 | 13.1%), Public Administration (24 | 12.6%), Accommodation & Food Services (22 | 11.5%), and Retail Trade (17 | 8.9%).
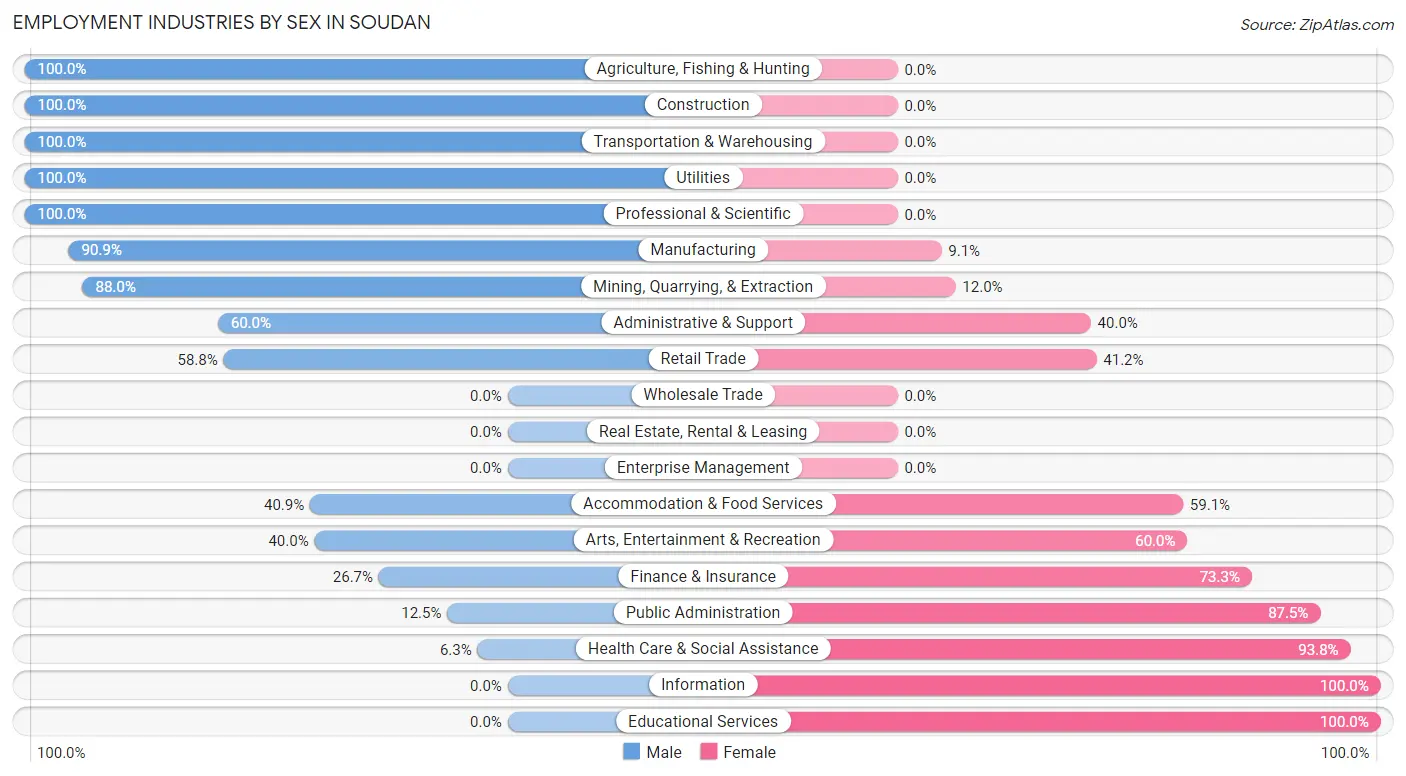
Employment Industries by Sex in Soudan
The Soudan industries that see more men than women are Agriculture, Fishing & Hunting (100.0%), Construction (100.0%), and Transportation & Warehousing (100.0%), whereas the industries that tend to have a higher number of women are Information (100.0%), Educational Services (100.0%), and Health Care & Social Assistance (93.8%).
| Industry | Male | Female |
| Agriculture, Fishing & Hunting | 3 (100.0%) | 0 (0.0%) |
| Mining, Quarrying, & Extraction | 22 (88.0%) | 3 (12.0%) |
| Construction | 7 (100.0%) | 0 (0.0%) |
| Manufacturing | 10 (90.9%) | 1 (9.1%) |
| Wholesale Trade | 0 (0.0%) | 0 (0.0%) |
| Retail Trade | 10 (58.8%) | 7 (41.2%) |
| Transportation & Warehousing | 3 (100.0%) | 0 (0.0%) |
| Utilities | 3 (100.0%) | 0 (0.0%) |
| Information | 0 (0.0%) | 4 (100.0%) |
| Finance & Insurance | 4 (26.7%) | 11 (73.3%) |
| Real Estate, Rental & Leasing | 0 (0.0%) | 0 (0.0%) |
| Professional & Scientific | 2 (100.0%) | 0 (0.0%) |
| Enterprise Management | 0 (0.0%) | 0 (0.0%) |
| Administrative & Support | 6 (60.0%) | 4 (40.0%) |
| Educational Services | 0 (0.0%) | 6 (100.0%) |
| Health Care & Social Assistance | 2 (6.2%) | 30 (93.8%) |
| Arts, Entertainment & Recreation | 2 (40.0%) | 3 (60.0%) |
| Accommodation & Food Services | 9 (40.9%) | 13 (59.1%) |
| Public Administration | 3 (12.5%) | 21 (87.5%) |
| Total | 86 (45.0%) | 105 (55.0%) |
Education in Soudan
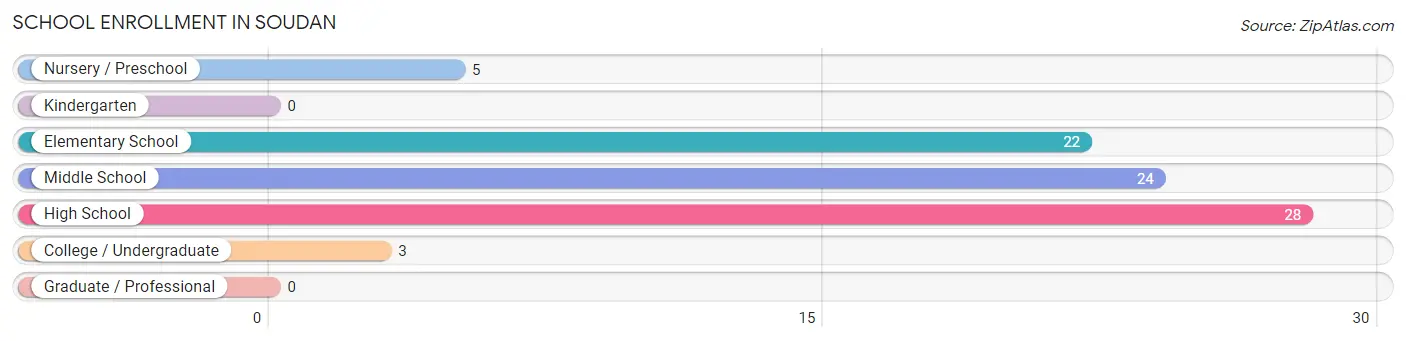
School Enrollment in Soudan
The most common levels of schooling among the 82 students in Soudan are high school (28 | 34.2%), middle school (24 | 29.3%), and elementary school (22 | 26.8%).
| School Level | # Students | % Students |
| Nursery / Preschool | 5 | 6.1% |
| Kindergarten | 0 | 0.0% |
| Elementary School | 22 | 26.8% |
| Middle School | 24 | 29.3% |
| High School | 28 | 34.2% |
| College / Undergraduate | 3 | 3.7% |
| Graduate / Professional | 0 | 0.0% |
| Total | 82 | 100.0% |
School Enrollment by Age by Funding Source in Soudan
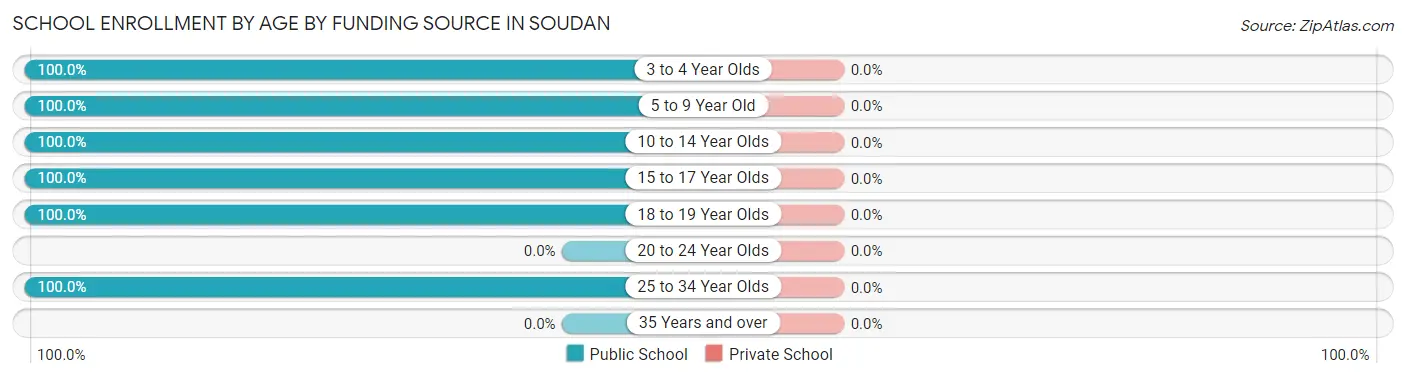
| Age Bracket | Public School | Private School |
| 3 to 4 Year Olds | 2 (100.0%) | 0 (0.0%) |
| 5 to 9 Year Old | 23 (100.0%) | 0 (0.0%) |
| 10 to 14 Year Olds | 27 (100.0%) | 0 (0.0%) |
| 15 to 17 Year Olds | 14 (100.0%) | 0 (0.0%) |
| 18 to 19 Year Olds | 13 (100.0%) | 0 (0.0%) |
| 20 to 24 Year Olds | 0 (0.0%) | 0 (0.0%) |
| 25 to 34 Year Olds | 3 (100.0%) | 0 (0.0%) |
| 35 Years and over | 0 (0.0%) | 0 (0.0%) |
| Total | 82 (100.0%) | 0 (0.0%) |
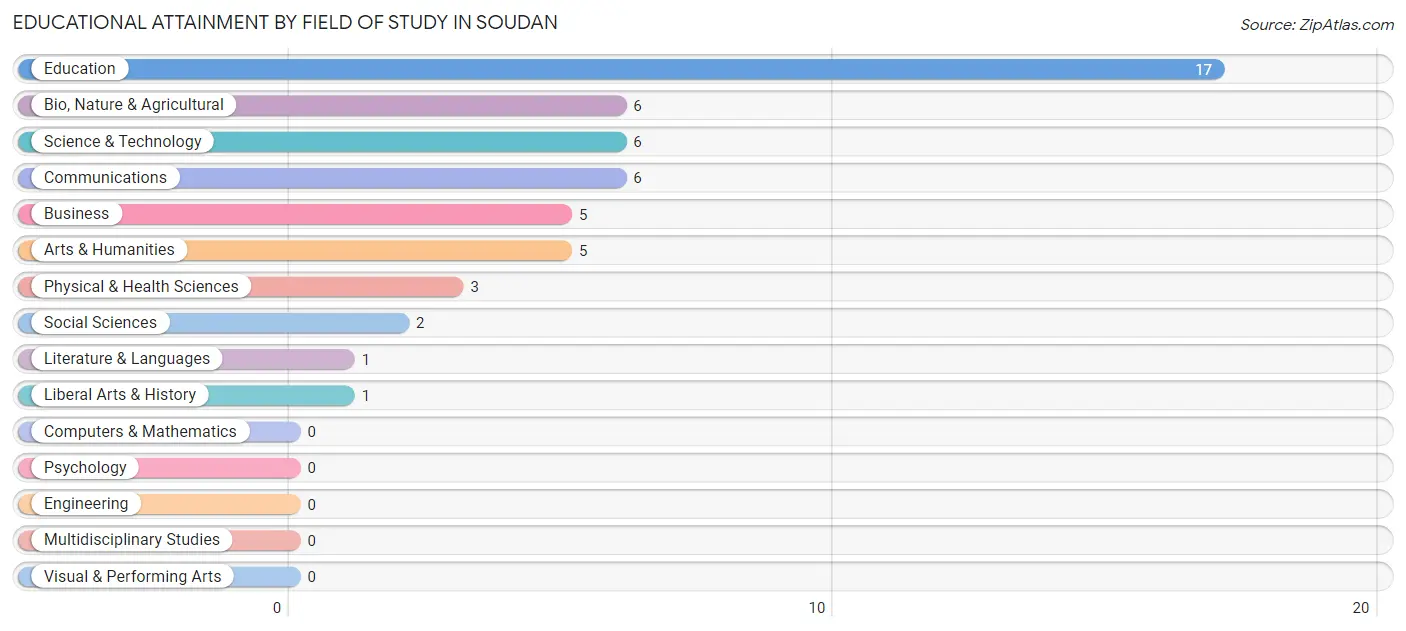
Educational Attainment by Field of Study in Soudan
Education (17 | 32.7%), bio, nature & agricultural (6 | 11.5%), science & technology (6 | 11.5%), communications (6 | 11.5%), and business (5 | 9.6%) are the most common fields of study among 52 individuals in Soudan who have obtained a bachelor's degree or higher.
| Field of Study | # Graduates | % Graduates |
| Computers & Mathematics | 0 | 0.0% |
| Bio, Nature & Agricultural | 6 | 11.5% |
| Physical & Health Sciences | 3 | 5.8% |
| Psychology | 0 | 0.0% |
| Social Sciences | 2 | 3.8% |
| Engineering | 0 | 0.0% |
| Multidisciplinary Studies | 0 | 0.0% |
| Science & Technology | 6 | 11.5% |
| Business | 5 | 9.6% |
| Education | 17 | 32.7% |
| Literature & Languages | 1 | 1.9% |
| Liberal Arts & History | 1 | 1.9% |
| Visual & Performing Arts | 0 | 0.0% |
| Communications | 6 | 11.5% |
| Arts & Humanities | 5 | 9.6% |
| Total | 52 | 100.0% |
Transportation & Commute in Soudan
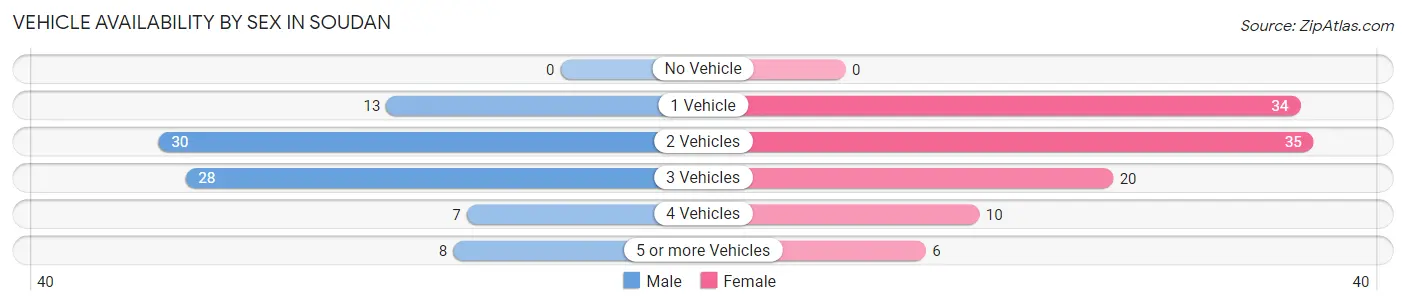
Vehicle Availability by Sex in Soudan
The most prevalent vehicle ownership categories in Soudan are males with 2 vehicles (30, accounting for 34.9%) and females with 2 vehicles (35, making up 28.6%).
| Vehicles Available | Male | Female |
| No Vehicle | 0 (0.0%) | 0 (0.0%) |
| 1 Vehicle | 13 (15.1%) | 34 (32.4%) |
| 2 Vehicles | 30 (34.9%) | 35 (33.3%) |
| 3 Vehicles | 28 (32.6%) | 20 (19.1%) |
| 4 Vehicles | 7 (8.1%) | 10 (9.5%) |
| 5 or more Vehicles | 8 (9.3%) | 6 (5.7%) |
| Total | 86 (100.0%) | 105 (100.0%) |
Commute Time in Soudan
The most frequently occuring commute durations in Soudan are 20 to 24 minutes (46 commuters, 24.3%), 30 to 34 minutes (27 commuters, 14.3%), and 40 to 44 minutes (27 commuters, 14.3%).
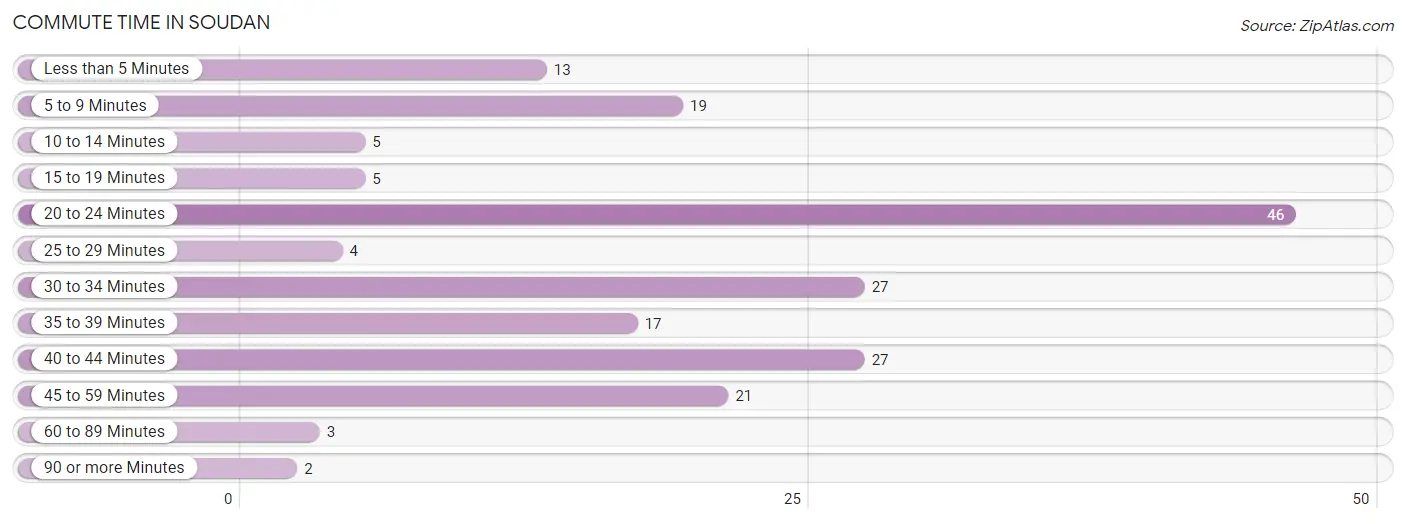
| Commute Time | # Commuters | % Commuters |
| Less than 5 Minutes | 13 | 6.9% |
| 5 to 9 Minutes | 19 | 10.1% |
| 10 to 14 Minutes | 5 | 2.6% |
| 15 to 19 Minutes | 5 | 2.6% |
| 20 to 24 Minutes | 46 | 24.3% |
| 25 to 29 Minutes | 4 | 2.1% |
| 30 to 34 Minutes | 27 | 14.3% |
| 35 to 39 Minutes | 17 | 9.0% |
| 40 to 44 Minutes | 27 | 14.3% |
| 45 to 59 Minutes | 21 | 11.1% |
| 60 to 89 Minutes | 3 | 1.6% |
| 90 or more Minutes | 2 | 1.1% |
Commute Time by Sex in Soudan
The most common commute times in Soudan are 40 to 44 minutes (23 commuters, 27.4%) for males and 20 to 24 minutes (32 commuters, 30.5%) for females.

| Commute Time | Male | Female |
| Less than 5 Minutes | 5 (5.9%) | 8 (7.6%) |
| 5 to 9 Minutes | 5 (5.9%) | 14 (13.3%) |
| 10 to 14 Minutes | 3 (3.6%) | 2 (1.9%) |
| 15 to 19 Minutes | 0 (0.0%) | 5 (4.8%) |
| 20 to 24 Minutes | 14 (16.7%) | 32 (30.5%) |
| 25 to 29 Minutes | 0 (0.0%) | 4 (3.8%) |
| 30 to 34 Minutes | 11 (13.1%) | 16 (15.2%) |
| 35 to 39 Minutes | 7 (8.3%) | 10 (9.5%) |
| 40 to 44 Minutes | 23 (27.4%) | 4 (3.8%) |
| 45 to 59 Minutes | 16 (19.1%) | 5 (4.8%) |
| 60 to 89 Minutes | 0 (0.0%) | 3 (2.9%) |
| 90 or more Minutes | 0 (0.0%) | 2 (1.9%) |
Time of Departure to Work by Sex in Soudan
The most frequent times of departure to work in Soudan are 12:00 AM to 4:59 AM (24, 28.6%) for males and 7:00 AM to 7:29 AM (27, 25.7%) for females.
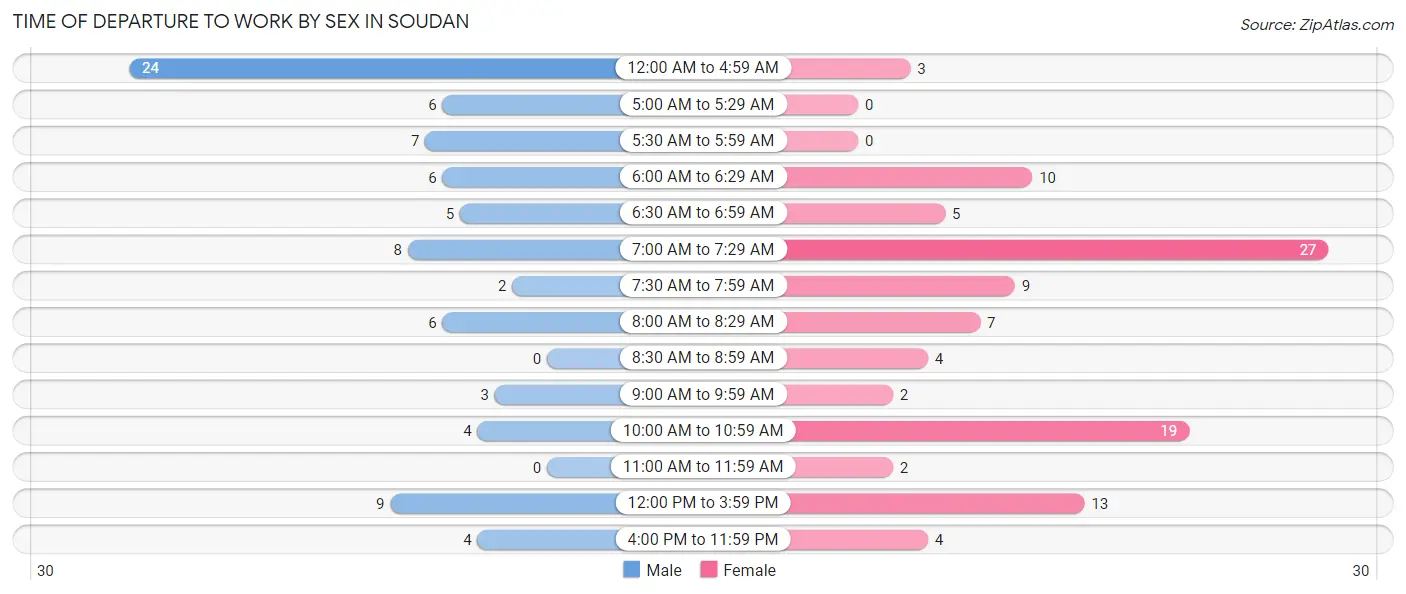
| Time of Departure | Male | Female |
| 12:00 AM to 4:59 AM | 24 (28.6%) | 3 (2.9%) |
| 5:00 AM to 5:29 AM | 6 (7.1%) | 0 (0.0%) |
| 5:30 AM to 5:59 AM | 7 (8.3%) | 0 (0.0%) |
| 6:00 AM to 6:29 AM | 6 (7.1%) | 10 (9.5%) |
| 6:30 AM to 6:59 AM | 5 (5.9%) | 5 (4.8%) |
| 7:00 AM to 7:29 AM | 8 (9.5%) | 27 (25.7%) |
| 7:30 AM to 7:59 AM | 2 (2.4%) | 9 (8.6%) |
| 8:00 AM to 8:29 AM | 6 (7.1%) | 7 (6.7%) |
| 8:30 AM to 8:59 AM | 0 (0.0%) | 4 (3.8%) |
| 9:00 AM to 9:59 AM | 3 (3.6%) | 2 (1.9%) |
| 10:00 AM to 10:59 AM | 4 (4.8%) | 19 (18.1%) |
| 11:00 AM to 11:59 AM | 0 (0.0%) | 2 (1.9%) |
| 12:00 PM to 3:59 PM | 9 (10.7%) | 13 (12.4%) |
| 4:00 PM to 11:59 PM | 4 (4.8%) | 4 (3.8%) |
| Total | 84 (100.0%) | 105 (100.0%) |
Housing Occupancy in Soudan
Occupancy by Ownership in Soudan
Of the total 205 dwellings in Soudan, owner-occupied units account for 173 (84.4%), while renter-occupied units make up 32 (15.6%).
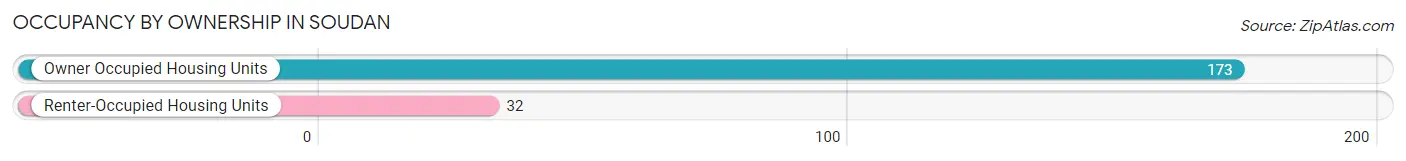
| Occupancy | # Housing Units | % Housing Units |
| Owner Occupied Housing Units | 173 | 84.4% |
| Renter-Occupied Housing Units | 32 | 15.6% |
| Total Occupied Housing Units | 205 | 100.0% |
Occupancy by Household Size in Soudan
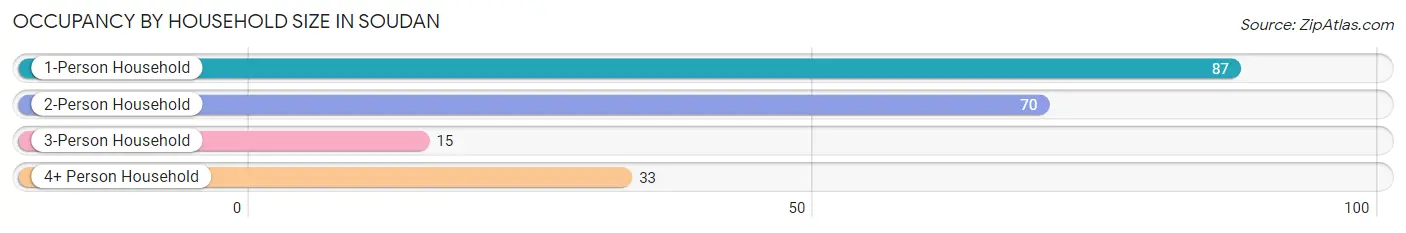
| Household Size | # Housing Units | % Housing Units |
| 1-Person Household | 87 | 42.4% |
| 2-Person Household | 70 | 34.2% |
| 3-Person Household | 15 | 7.3% |
| 4+ Person Household | 33 | 16.1% |
| Total Housing Units | 205 | 100.0% |
Occupancy by Ownership by Household Size in Soudan
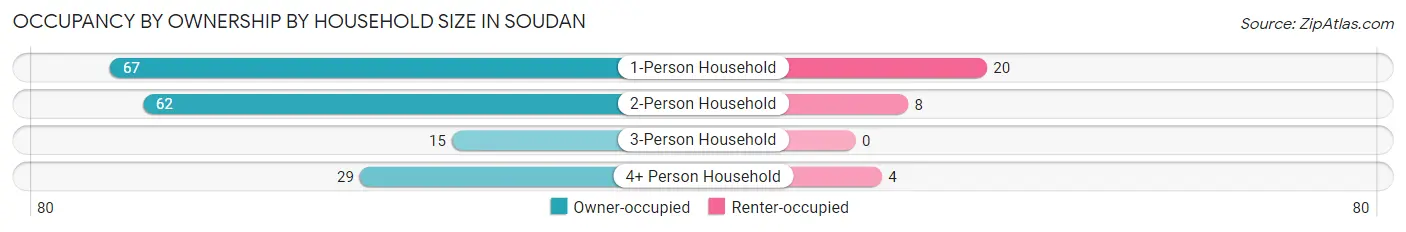
| Household Size | Owner-occupied | Renter-occupied |
| 1-Person Household | 67 (77.0%) | 20 (23.0%) |
| 2-Person Household | 62 (88.6%) | 8 (11.4%) |
| 3-Person Household | 15 (100.0%) | 0 (0.0%) |
| 4+ Person Household | 29 (87.9%) | 4 (12.1%) |
| Total Housing Units | 173 (84.4%) | 32 (15.6%) |
Occupancy by Educational Attainment in Soudan
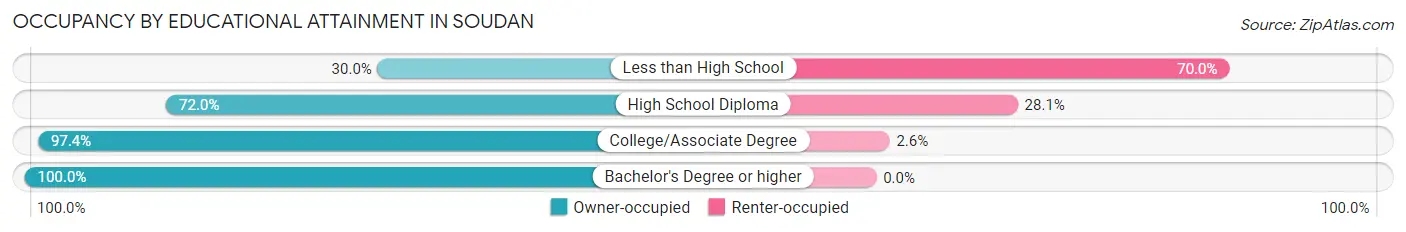
| Household Size | Owner-occupied | Renter-occupied |
| Less than High School | 3 (30.0%) | 7 (70.0%) |
| High School Diploma | 59 (72.0%) | 23 (28.1%) |
| College/Associate Degree | 74 (97.4%) | 2 (2.6%) |
| Bachelor's Degree or higher | 37 (100.0%) | 0 (0.0%) |
Occupancy by Age of Householder in Soudan
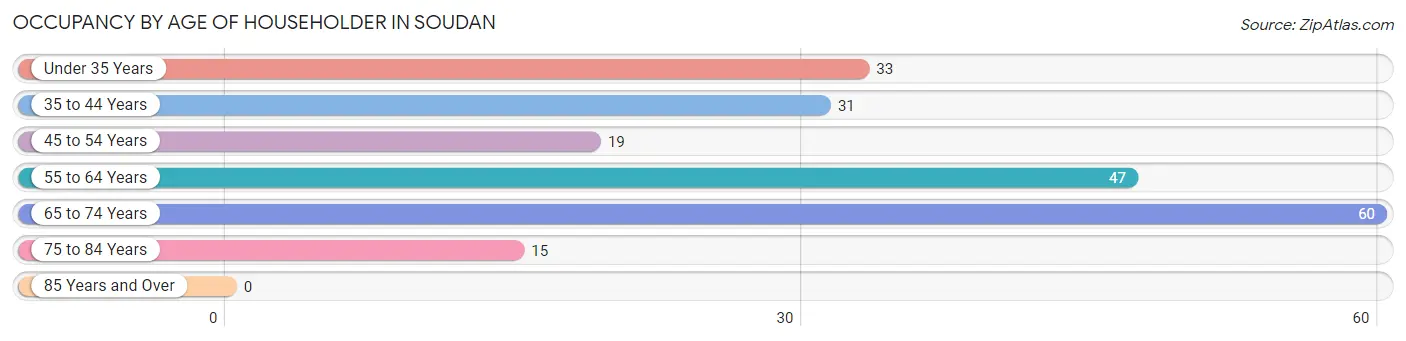
| Age Bracket | # Households | % Households |
| Under 35 Years | 33 | 16.1% |
| 35 to 44 Years | 31 | 15.1% |
| 45 to 54 Years | 19 | 9.3% |
| 55 to 64 Years | 47 | 22.9% |
| 65 to 74 Years | 60 | 29.3% |
| 75 to 84 Years | 15 | 7.3% |
| 85 Years and Over | 0 | 0.0% |
| Total | 205 | 100.0% |
Housing Finances in Soudan
Median Income by Occupancy in Soudan
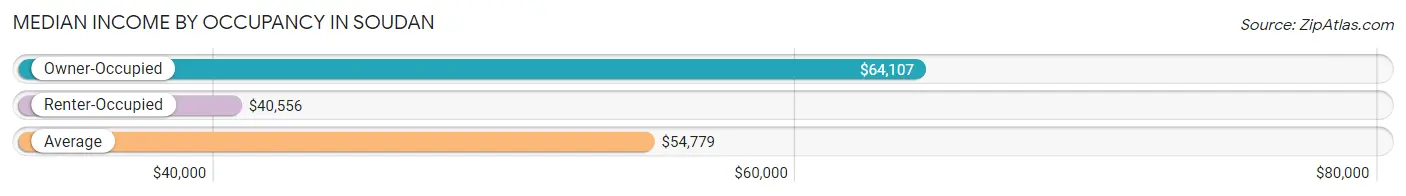
| Occupancy Type | # Households | Median Income |
| Owner-Occupied | 173 (84.4%) | $64,107 |
| Renter-Occupied | 32 (15.6%) | $40,556 |
| Average | 205 (100.0%) | $54,779 |
Occupancy by Householder Income Bracket in Soudan
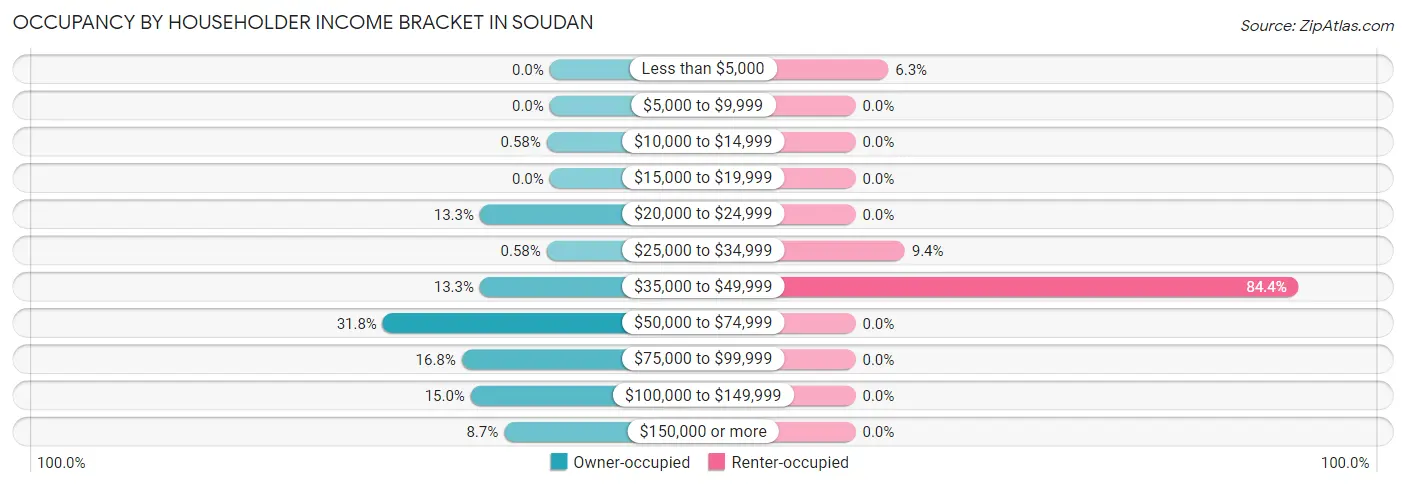
| Income Bracket | Owner-occupied | Renter-occupied |
| Less than $5,000 | 0 (0.0%) | 2 (6.2%) |
| $5,000 to $9,999 | 0 (0.0%) | 0 (0.0%) |
| $10,000 to $14,999 | 1 (0.6%) | 0 (0.0%) |
| $15,000 to $19,999 | 0 (0.0%) | 0 (0.0%) |
| $20,000 to $24,999 | 23 (13.3%) | 0 (0.0%) |
| $25,000 to $34,999 | 1 (0.6%) | 3 (9.4%) |
| $35,000 to $49,999 | 23 (13.3%) | 27 (84.4%) |
| $50,000 to $74,999 | 55 (31.8%) | 0 (0.0%) |
| $75,000 to $99,999 | 29 (16.8%) | 0 (0.0%) |
| $100,000 to $149,999 | 26 (15.0%) | 0 (0.0%) |
| $150,000 or more | 15 (8.7%) | 0 (0.0%) |
| Total | 173 (100.0%) | 32 (100.0%) |
Monthly Housing Cost Tiers in Soudan
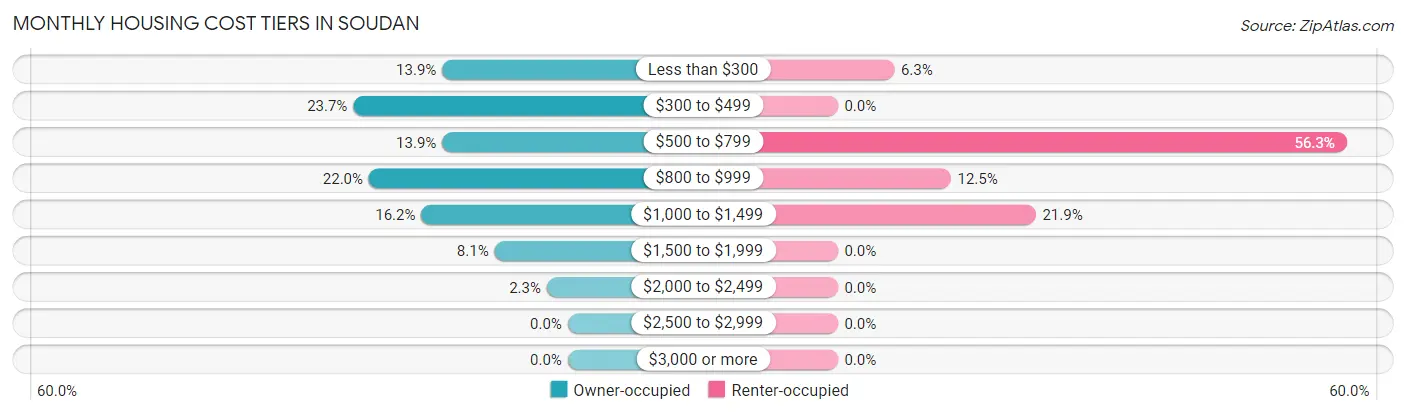
| Monthly Cost | Owner-occupied | Renter-occupied |
| Less than $300 | 24 (13.9%) | 2 (6.2%) |
| $300 to $499 | 41 (23.7%) | 0 (0.0%) |
| $500 to $799 | 24 (13.9%) | 18 (56.2%) |
| $800 to $999 | 38 (22.0%) | 4 (12.5%) |
| $1,000 to $1,499 | 28 (16.2%) | 7 (21.9%) |
| $1,500 to $1,999 | 14 (8.1%) | 0 (0.0%) |
| $2,000 to $2,499 | 4 (2.3%) | 0 (0.0%) |
| $2,500 to $2,999 | 0 (0.0%) | 0 (0.0%) |
| $3,000 or more | 0 (0.0%) | 0 (0.0%) |
| Total | 173 (100.0%) | 32 (100.0%) |
Physical Housing Characteristics in Soudan
Housing Structures in Soudan
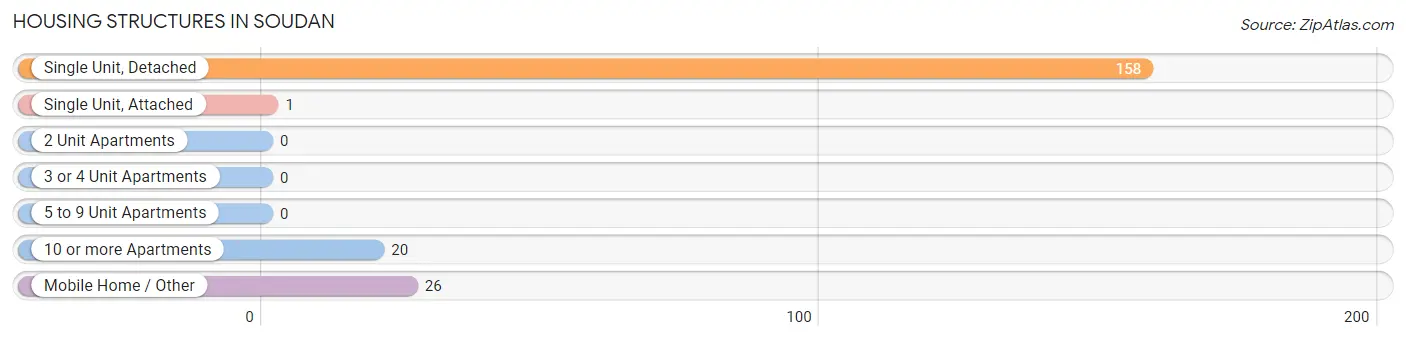
| Structure Type | # Housing Units | % Housing Units |
| Single Unit, Detached | 158 | 77.1% |
| Single Unit, Attached | 1 | 0.5% |
| 2 Unit Apartments | 0 | 0.0% |
| 3 or 4 Unit Apartments | 0 | 0.0% |
| 5 to 9 Unit Apartments | 0 | 0.0% |
| 10 or more Apartments | 20 | 9.8% |
| Mobile Home / Other | 26 | 12.7% |
| Total | 205 | 100.0% |
Housing Structures by Occupancy in Soudan
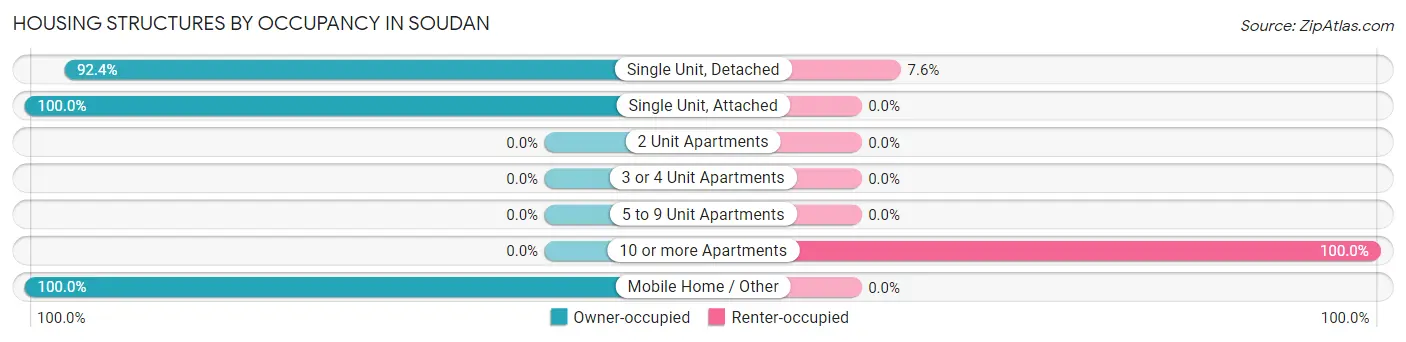
| Structure Type | Owner-occupied | Renter-occupied |
| Single Unit, Detached | 146 (92.4%) | 12 (7.6%) |
| Single Unit, Attached | 1 (100.0%) | 0 (0.0%) |
| 2 Unit Apartments | 0 (0.0%) | 0 (0.0%) |
| 3 or 4 Unit Apartments | 0 (0.0%) | 0 (0.0%) |
| 5 to 9 Unit Apartments | 0 (0.0%) | 0 (0.0%) |
| 10 or more Apartments | 0 (0.0%) | 20 (100.0%) |
| Mobile Home / Other | 26 (100.0%) | 0 (0.0%) |
| Total | 173 (84.4%) | 32 (15.6%) |
Housing Structures by Number of Rooms in Soudan
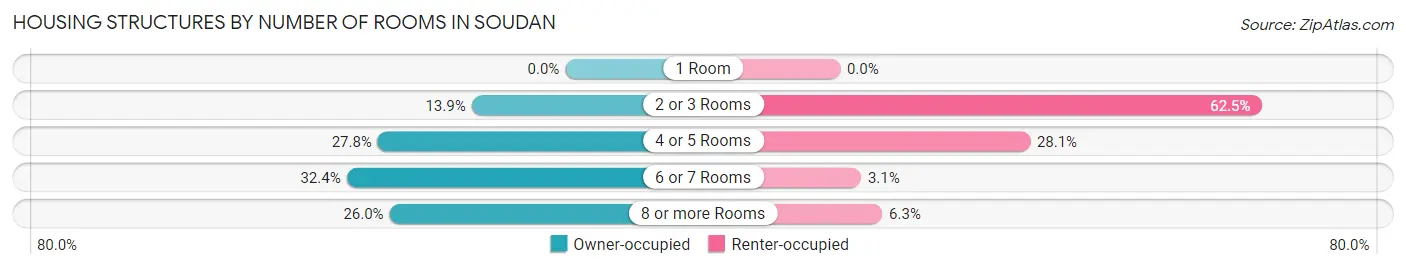
| Number of Rooms | Owner-occupied | Renter-occupied |
| 1 Room | 0 (0.0%) | 0 (0.0%) |
| 2 or 3 Rooms | 24 (13.9%) | 20 (62.5%) |
| 4 or 5 Rooms | 48 (27.8%) | 9 (28.1%) |
| 6 or 7 Rooms | 56 (32.4%) | 1 (3.1%) |
| 8 or more Rooms | 45 (26.0%) | 2 (6.2%) |
| Total | 173 (100.0%) | 32 (100.0%) |
Housing Structure by Heating Type in Soudan
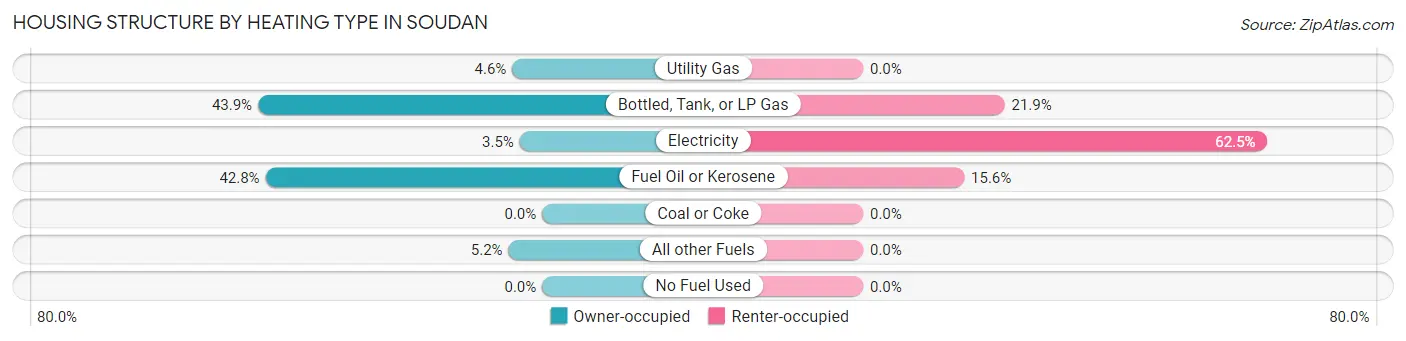
| Heating Type | Owner-occupied | Renter-occupied |
| Utility Gas | 8 (4.6%) | 0 (0.0%) |
| Bottled, Tank, or LP Gas | 76 (43.9%) | 7 (21.9%) |
| Electricity | 6 (3.5%) | 20 (62.5%) |
| Fuel Oil or Kerosene | 74 (42.8%) | 5 (15.6%) |
| Coal or Coke | 0 (0.0%) | 0 (0.0%) |
| All other Fuels | 9 (5.2%) | 0 (0.0%) |
| No Fuel Used | 0 (0.0%) | 0 (0.0%) |
| Total | 173 (100.0%) | 32 (100.0%) |
Household Vehicle Usage in Soudan
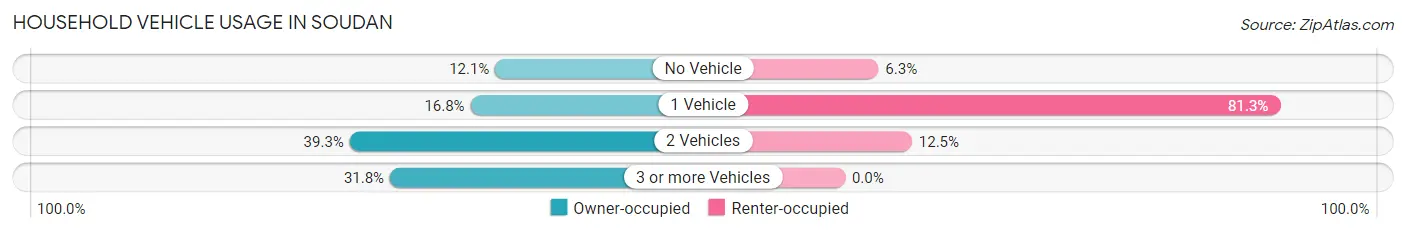
| Vehicles per Household | Owner-occupied | Renter-occupied |
| No Vehicle | 21 (12.1%) | 2 (6.2%) |
| 1 Vehicle | 29 (16.8%) | 26 (81.2%) |
| 2 Vehicles | 68 (39.3%) | 4 (12.5%) |
| 3 or more Vehicles | 55 (31.8%) | 0 (0.0%) |
| Total | 173 (100.0%) | 32 (100.0%) |
Real Estate & Mortgages in Soudan
Real Estate and Mortgage Overview in Soudan
| Characteristic | Without Mortgage | With Mortgage |
| Housing Units | 80 | 93 |
| Median Property Value | $89,500 | $92,500 |
| Median Household Income | $61,250 | $11 |
| Monthly Housing Costs | $405 | $0 |
| Real Estate Taxes | $783 | $0 |
Property Value by Mortgage Status in Soudan
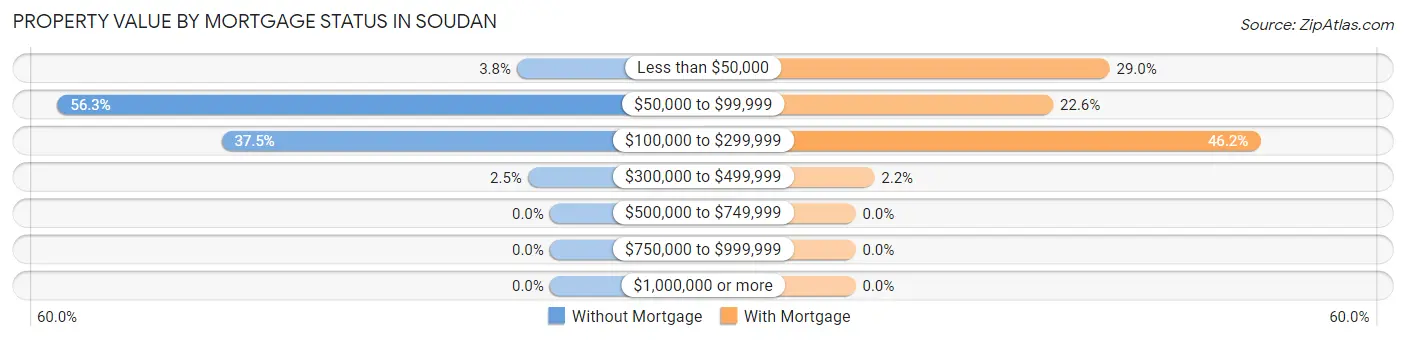
| Property Value | Without Mortgage | With Mortgage |
| Less than $50,000 | 3 (3.7%) | 27 (29.0%) |
| $50,000 to $99,999 | 45 (56.2%) | 21 (22.6%) |
| $100,000 to $299,999 | 30 (37.5%) | 43 (46.2%) |
| $300,000 to $499,999 | 2 (2.5%) | 2 (2.1%) |
| $500,000 to $749,999 | 0 (0.0%) | 0 (0.0%) |
| $750,000 to $999,999 | 0 (0.0%) | 0 (0.0%) |
| $1,000,000 or more | 0 (0.0%) | 0 (0.0%) |
| Total | 80 (100.0%) | 93 (100.0%) |
Household Income by Mortgage Status in Soudan
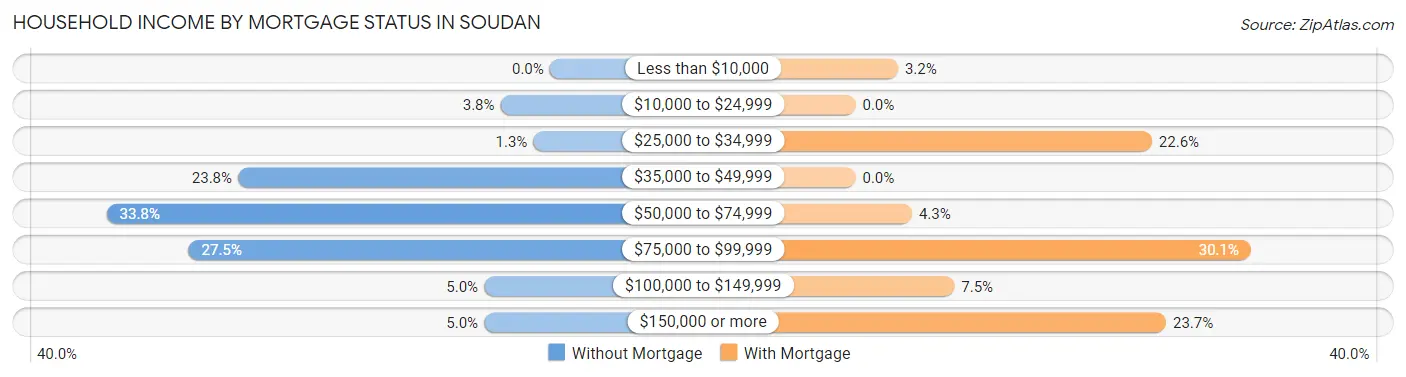
| Household Income | Without Mortgage | With Mortgage |
| Less than $10,000 | 0 (0.0%) | 3 (3.2%) |
| $10,000 to $24,999 | 3 (3.7%) | 0 (0.0%) |
| $25,000 to $34,999 | 1 (1.3%) | 21 (22.6%) |
| $35,000 to $49,999 | 19 (23.7%) | 0 (0.0%) |
| $50,000 to $74,999 | 27 (33.8%) | 4 (4.3%) |
| $75,000 to $99,999 | 22 (27.5%) | 28 (30.1%) |
| $100,000 to $149,999 | 4 (5.0%) | 7 (7.5%) |
| $150,000 or more | 4 (5.0%) | 22 (23.7%) |
| Total | 80 (100.0%) | 93 (100.0%) |
Property Value to Household Income Ratio in Soudan
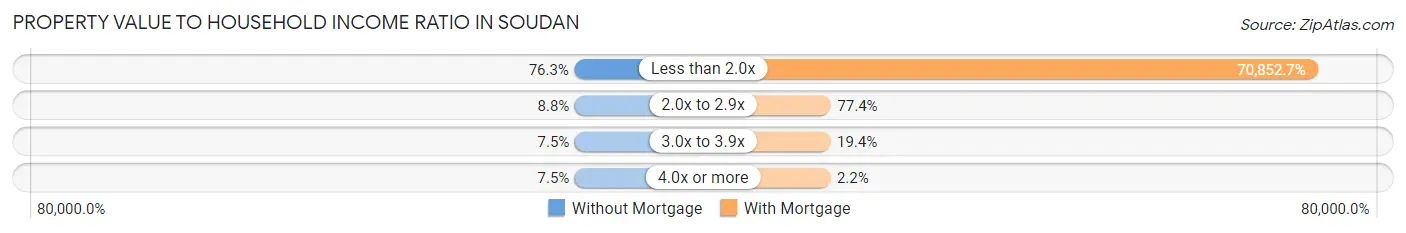
| Value-to-Income Ratio | Without Mortgage | With Mortgage |
| Less than 2.0x | 61 (76.2%) | 65,893 (70,852.7%) |
| 2.0x to 2.9x | 7 (8.7%) | 72 (77.4%) |
| 3.0x to 3.9x | 6 (7.5%) | 18 (19.4%) |
| 4.0x or more | 6 (7.5%) | 2 (2.1%) |
| Total | 80 (100.0%) | 93 (100.0%) |
Real Estate Taxes by Mortgage Status in Soudan
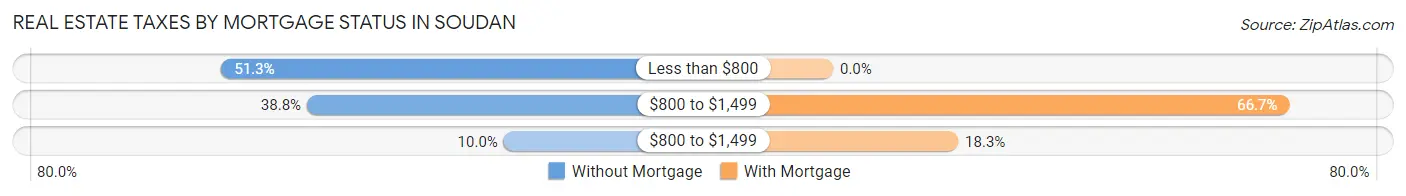
| Property Taxes | Without Mortgage | With Mortgage |
| Less than $800 | 41 (51.2%) | 0 (0.0%) |
| $800 to $1,499 | 31 (38.8%) | 62 (66.7%) |
| $800 to $1,499 | 8 (10.0%) | 17 (18.3%) |
| Total | 80 (100.0%) | 93 (100.0%) |
Health & Disability in Soudan
Health Insurance Coverage by Age in Soudan
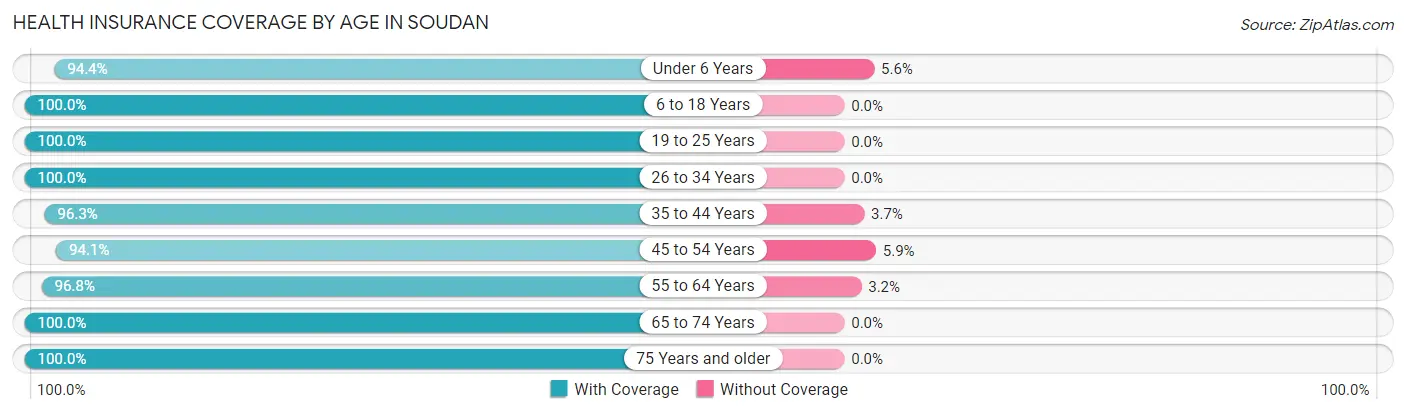
| Age Bracket | With Coverage | Without Coverage |
| Under 6 Years | 17 (94.4%) | 1 (5.6%) |
| 6 to 18 Years | 78 (100.0%) | 0 (0.0%) |
| 19 to 25 Years | 32 (100.0%) | 0 (0.0%) |
| 26 to 34 Years | 30 (100.0%) | 0 (0.0%) |
| 35 to 44 Years | 52 (96.3%) | 2 (3.7%) |
| 45 to 54 Years | 32 (94.1%) | 2 (5.9%) |
| 55 to 64 Years | 61 (96.8%) | 2 (3.2%) |
| 65 to 74 Years | 95 (100.0%) | 0 (0.0%) |
| 75 Years and older | 19 (100.0%) | 0 (0.0%) |
| Total | 416 (98.4%) | 7 (1.7%) |
Health Insurance Coverage by Citizenship Status in Soudan
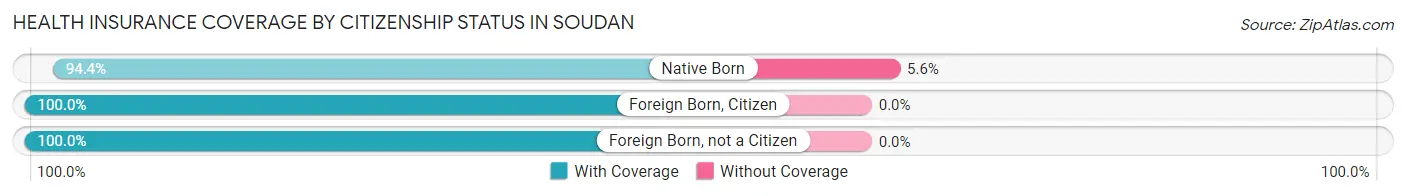
| Citizenship Status | With Coverage | Without Coverage |
| Native Born | 17 (94.4%) | 1 (5.6%) |
| Foreign Born, Citizen | 78 (100.0%) | 0 (0.0%) |
| Foreign Born, not a Citizen | 32 (100.0%) | 0 (0.0%) |
Health Insurance Coverage by Household Income in Soudan
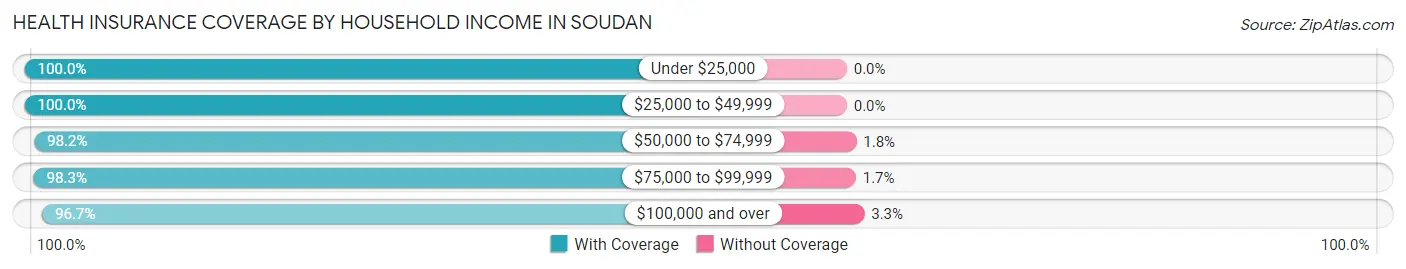
| Household Income | With Coverage | Without Coverage |
| Under $25,000 | 30 (100.0%) | 0 (0.0%) |
| $25,000 to $49,999 | 100 (100.0%) | 0 (0.0%) |
| $50,000 to $74,999 | 110 (98.2%) | 2 (1.8%) |
| $75,000 to $99,999 | 58 (98.3%) | 1 (1.7%) |
| $100,000 and over | 118 (96.7%) | 4 (3.3%) |
Public vs Private Health Insurance Coverage by Age in Soudan
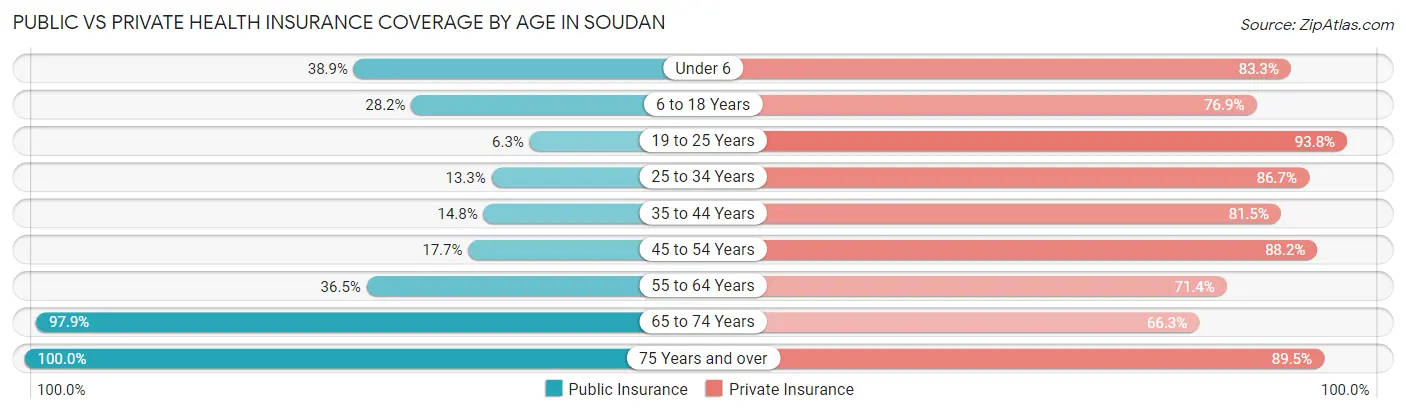
| Age Bracket | Public Insurance | Private Insurance |
| Under 6 | 7 (38.9%) | 15 (83.3%) |
| 6 to 18 Years | 22 (28.2%) | 60 (76.9%) |
| 19 to 25 Years | 2 (6.2%) | 30 (93.8%) |
| 25 to 34 Years | 4 (13.3%) | 26 (86.7%) |
| 35 to 44 Years | 8 (14.8%) | 44 (81.5%) |
| 45 to 54 Years | 6 (17.6%) | 30 (88.2%) |
| 55 to 64 Years | 23 (36.5%) | 45 (71.4%) |
| 65 to 74 Years | 93 (97.9%) | 63 (66.3%) |
| 75 Years and over | 19 (100.0%) | 17 (89.5%) |
| Total | 184 (43.5%) | 330 (78.0%) |
Disability Status by Sex by Age in Soudan
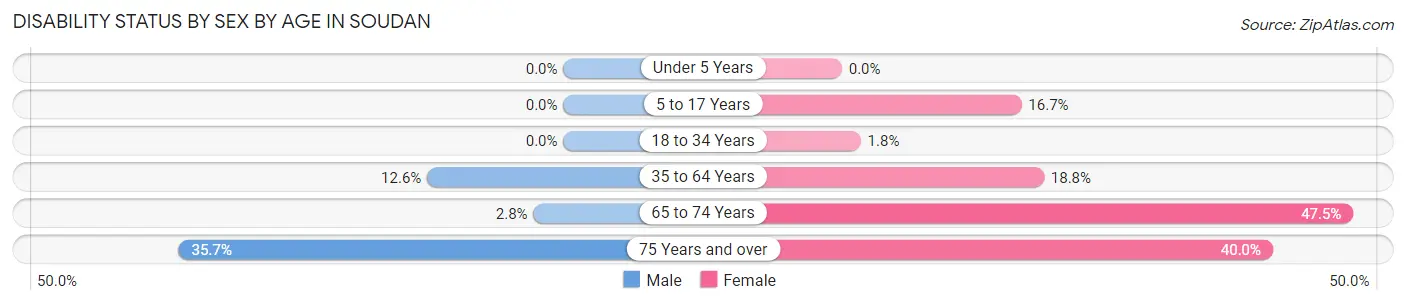
| Age Bracket | Male | Female |
| Under 5 Years | 0 (0.0%) | 0 (0.0%) |
| 5 to 17 Years | 0 (0.0%) | 3 (16.7%) |
| 18 to 34 Years | 0 (0.0%) | 1 (1.8%) |
| 35 to 64 Years | 11 (12.6%) | 12 (18.8%) |
| 65 to 74 Years | 1 (2.8%) | 28 (47.5%) |
| 75 Years and over | 5 (35.7%) | 2 (40.0%) |
Disability Class by Sex by Age in Soudan
Disability Class: Hearing Difficulty
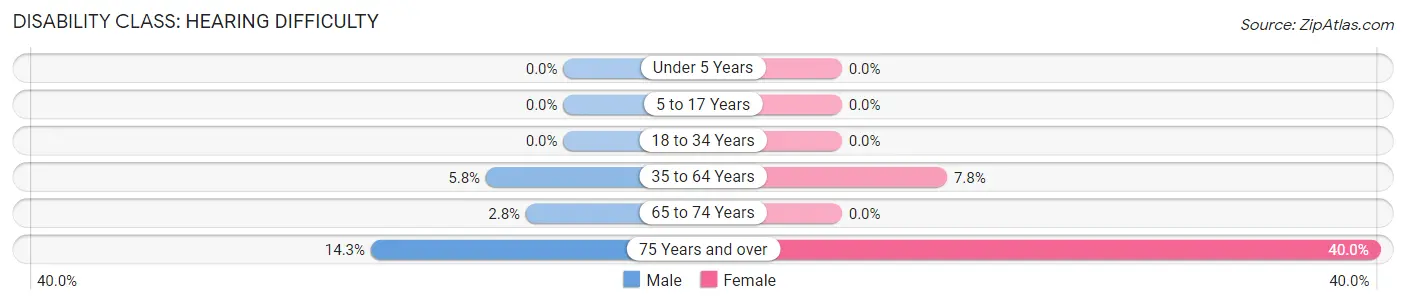
| Age Bracket | Male | Female |
| Under 5 Years | 0 (0.0%) | 0 (0.0%) |
| 5 to 17 Years | 0 (0.0%) | 0 (0.0%) |
| 18 to 34 Years | 0 (0.0%) | 0 (0.0%) |
| 35 to 64 Years | 5 (5.8%) | 5 (7.8%) |
| 65 to 74 Years | 1 (2.8%) | 0 (0.0%) |
| 75 Years and over | 2 (14.3%) | 2 (40.0%) |
Disability Class: Vision Difficulty
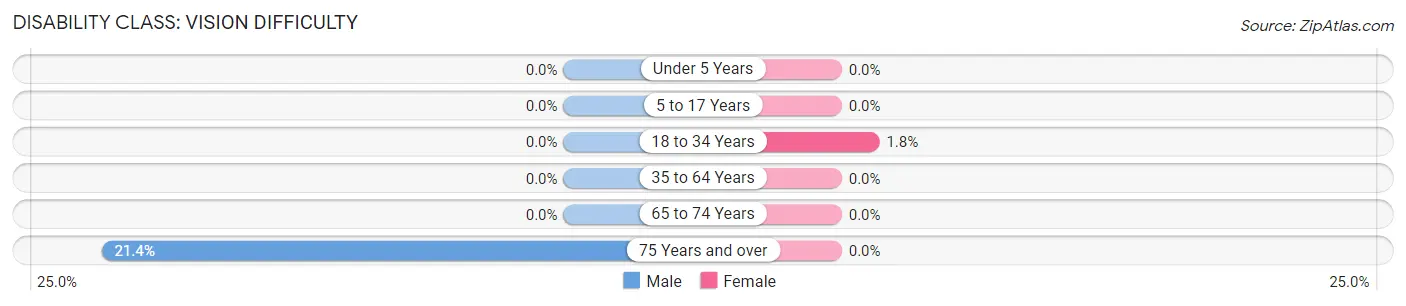
| Age Bracket | Male | Female |
| Under 5 Years | 0 (0.0%) | 0 (0.0%) |
| 5 to 17 Years | 0 (0.0%) | 0 (0.0%) |
| 18 to 34 Years | 0 (0.0%) | 1 (1.8%) |
| 35 to 64 Years | 0 (0.0%) | 0 (0.0%) |
| 65 to 74 Years | 0 (0.0%) | 0 (0.0%) |
| 75 Years and over | 3 (21.4%) | 0 (0.0%) |
Disability Class: Cognitive Difficulty
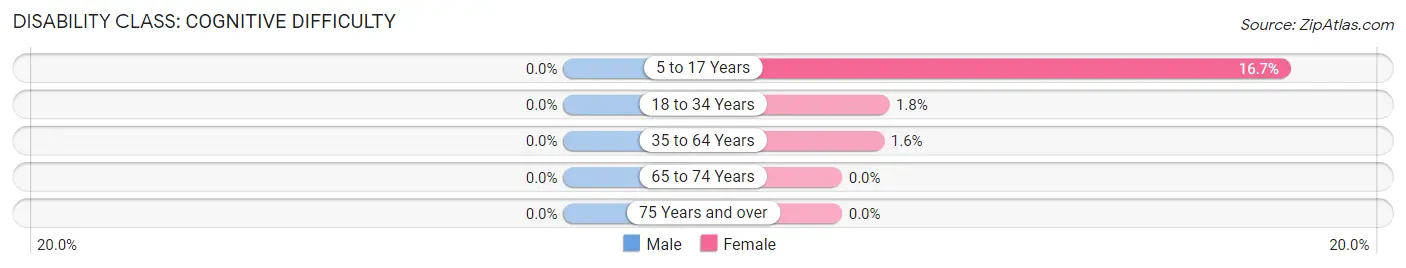
| Age Bracket | Male | Female |
| 5 to 17 Years | 0 (0.0%) | 3 (16.7%) |
| 18 to 34 Years | 0 (0.0%) | 1 (1.8%) |
| 35 to 64 Years | 0 (0.0%) | 1 (1.6%) |
| 65 to 74 Years | 0 (0.0%) | 0 (0.0%) |
| 75 Years and over | 0 (0.0%) | 0 (0.0%) |
Disability Class: Ambulatory Difficulty
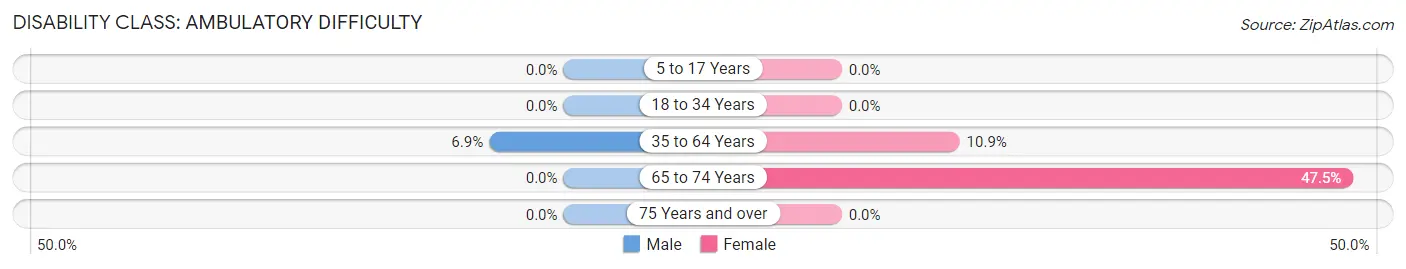
| Age Bracket | Male | Female |
| 5 to 17 Years | 0 (0.0%) | 0 (0.0%) |
| 18 to 34 Years | 0 (0.0%) | 0 (0.0%) |
| 35 to 64 Years | 6 (6.9%) | 7 (10.9%) |
| 65 to 74 Years | 0 (0.0%) | 28 (47.5%) |
| 75 Years and over | 0 (0.0%) | 0 (0.0%) |
Disability Class: Self-Care Difficulty
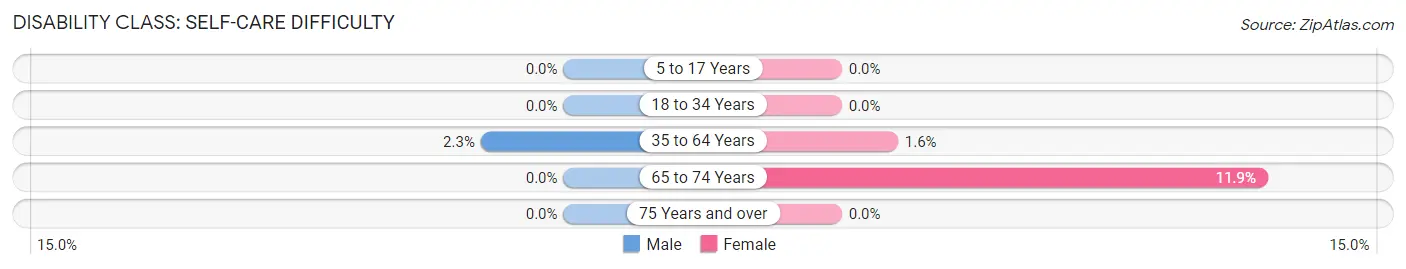
| Age Bracket | Male | Female |
| 5 to 17 Years | 0 (0.0%) | 0 (0.0%) |
| 18 to 34 Years | 0 (0.0%) | 0 (0.0%) |
| 35 to 64 Years | 2 (2.3%) | 1 (1.6%) |
| 65 to 74 Years | 0 (0.0%) | 7 (11.9%) |
| 75 Years and over | 0 (0.0%) | 0 (0.0%) |
Technology Access in Soudan
Computing Device Access in Soudan
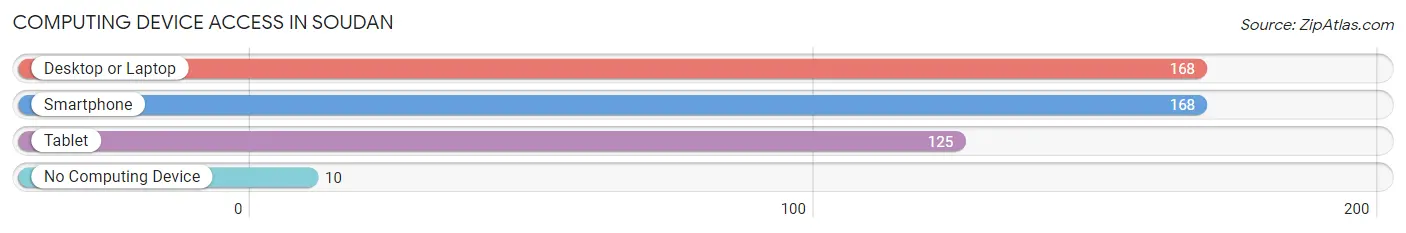
| Device Type | # Households | % Households |
| Desktop or Laptop | 168 | 82.0% |
| Smartphone | 168 | 82.0% |
| Tablet | 125 | 61.0% |
| No Computing Device | 10 | 4.9% |
| Total | 205 | 100.0% |
Internet Access in Soudan
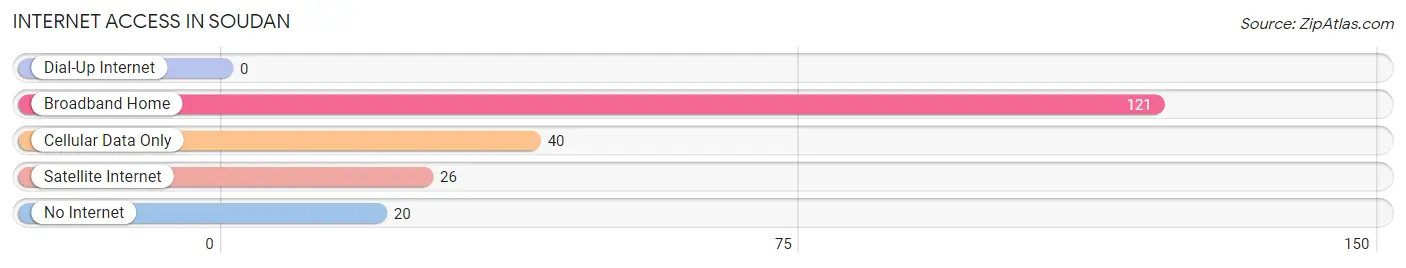
| Internet Type | # Households | % Households |
| Dial-Up Internet | 0 | 0.0% |
| Broadband Home | 121 | 59.0% |
| Cellular Data Only | 40 | 19.5% |
| Satellite Internet | 26 | 12.7% |
| No Internet | 20 | 9.8% |
| Total | 205 | 100.0% |
Soudan Summary
Soudan, Minnesota is a small unincorporated community located in St. Louis County, Minnesota. It is situated on the eastern edge of the Mesabi Iron Range, approximately 25 miles northwest of Duluth. The population of Soudan was estimated to be around 200 people in 2020.
History
Soudan was first settled in the late 1800s by Finnish immigrants who were drawn to the area by the promise of work in the iron ore mines. The town was named after the Soudan Mine, which was the first iron ore mine in the area. The mine was opened in 1884 and operated until 1962. During its peak, the mine employed over 1,000 people and was the largest underground iron ore mine in the world.
The town of Soudan was officially incorporated in 1901. The town was home to a variety of businesses, including a hotel, a general store, a post office, a bank, and a lumberyard. The town also had a school, a library, and a movie theater.
Geography
Soudan is located in the northern part of St. Louis County, Minnesota. It is situated on the eastern edge of the Mesabi Iron Range, approximately 25 miles northwest of Duluth. The town is located on the shores of Lake Vermilion, a large lake that is part of the Vermilion River system. The town is surrounded by forests and is home to a variety of wildlife, including deer, bear, and moose.
The climate in Soudan is classified as humid continental, with cold winters and warm summers. The average annual temperature is around 40 degrees Fahrenheit, with an average high of around 70 degrees in the summer and an average low of around 20 degrees in the winter.
Economy
The economy of Soudan is largely based on tourism and outdoor recreation. The town is home to a variety of outdoor activities, including fishing, hunting, camping, and hiking. The town is also home to a variety of restaurants, bars, and shops.
The town is also home to the Soudan Underground Mine State Park, which is a popular tourist attraction. The park is home to the Soudan Underground Mine, which was the first iron ore mine in the area. The park offers tours of the mine, as well as a variety of other activities, such as camping, fishing, and hiking.
Demographics
The population of Soudan was estimated to be around 200 people in 2020. The town is predominantly white, with a small percentage of African American and Native American residents. The median household income in Soudan is around $50,000, and the median home value is around $150,000. The town has a low unemployment rate and a high rate of homeownership.
Common Questions
What is Per Capita Income in Soudan?
Per Capita income in Soudan is $33,305.
What is the Median Family Income in Soudan?
Median Family Income in Soudan is $80,000.
What is the Median Household income in Soudan?
Median Household Income in Soudan is $54,779.
What is Income or Wage Gap in Soudan?
Income or Wage Gap in Soudan is 53.1%.
Women in Soudan earn 46.9 cents for every dollar earned by a man.
What is Inequality or Gini Index in Soudan?
Inequality or Gini Index in Soudan is 0.32.
What is the Total Population of Soudan?
Total Population of Soudan is 423.
What is the Total Male Population of Soudan?
Total Male Population of Soudan is 211.
What is the Total Female Population of Soudan?
Total Female Population of Soudan is 212.
What is the Ratio of Males per 100 Females in Soudan?
There are 99.53 Males per 100 Females in Soudan.
What is the Ratio of Females per 100 Males in Soudan?
There are 100.47 Females per 100 Males in Soudan.
What is the Median Population Age in Soudan?
Median Population Age in Soudan is 44.5 Years.
What is the Average Family Size in Soudan
Average Family Size in Soudan is 2.9 People.
What is the Average Household Size in Soudan
Average Household Size in Soudan is 2.1 People.
How Large is the Labor Force in Soudan?
There are 212 People in the Labor Forcein in Soudan.
What is the Percentage of People in the Labor Force in Soudan?
60.4% of People are in the Labor Force in Soudan.
What is the Unemployment Rate in Soudan?
Unemployment Rate in Soudan is 9.9%.