Sleepy Eye, MN Map & Demographics
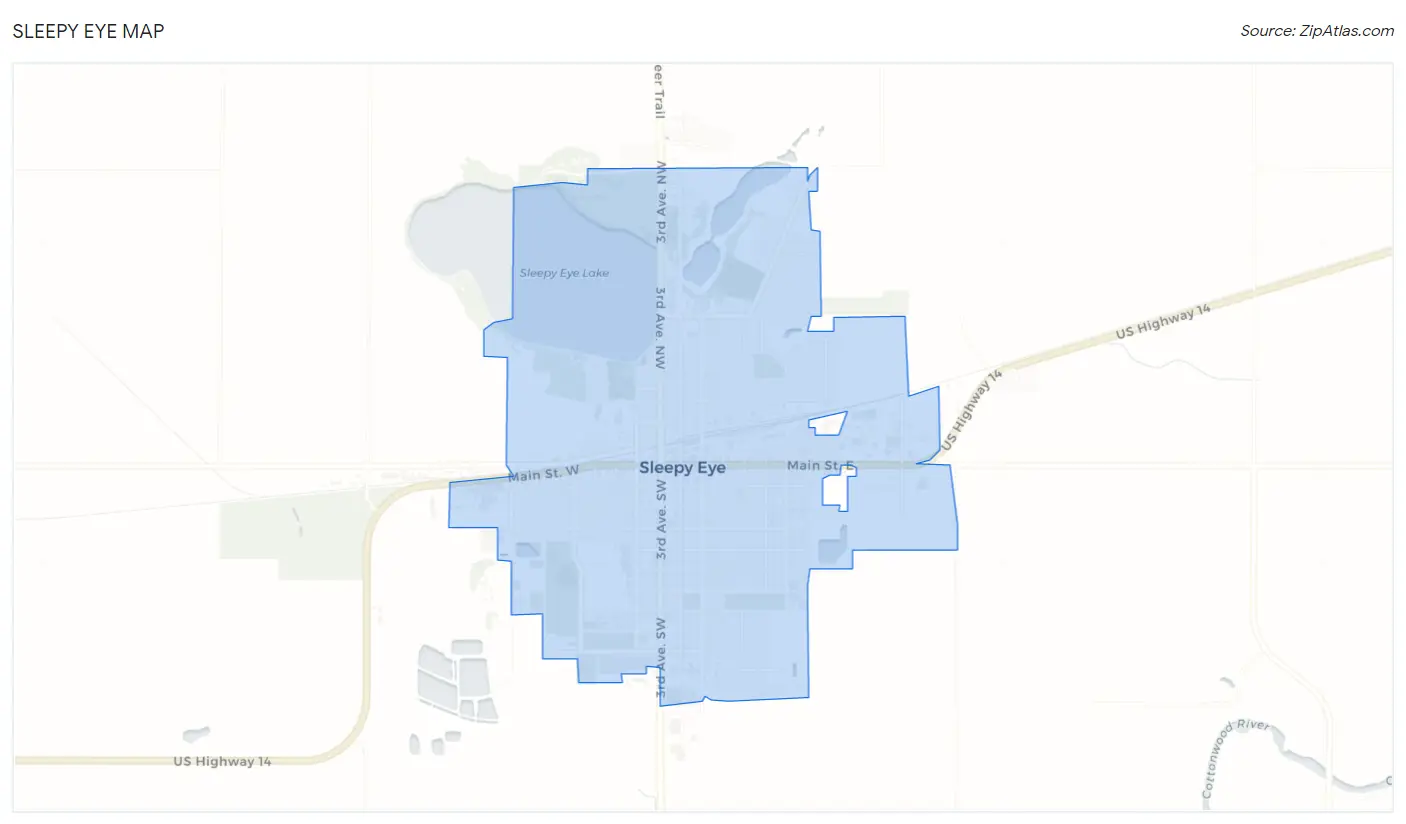
Sleepy Eye Map
Sleepy Eye Overview
$35,170
PER CAPITA INCOME
$90,556
AVG FAMILY INCOME
$63,163
AVG HOUSEHOLD INCOME
40.5%
WAGE / INCOME GAP [ % ]
59.5¢/ $1
WAGE / INCOME GAP [ $ ]
0.43
INEQUALITY / GINI INDEX
3,452
TOTAL POPULATION
1,788
MALE POPULATION
1,664
FEMALE POPULATION
107.45
MALES / 100 FEMALES
93.06
FEMALES / 100 MALES
41.9
MEDIAN AGE
2.8
AVG FAMILY SIZE
2.2
AVG HOUSEHOLD SIZE
1,902
LABOR FORCE [ PEOPLE ]
67.7%
PERCENT IN LABOR FORCE
4.2%
UNEMPLOYMENT RATE
Sleepy Eye Zip Codes
Sleepy Eye Area Codes
Income in Sleepy Eye
Income Overview in Sleepy Eye
Per Capita Income in Sleepy Eye is $35,170, while median incomes of families and households are $90,556 and $63,163 respectively.
| Characteristic | Number | Measure |
| Per Capita Income | 3,452 | $35,170 |
| Median Family Income | 956 | $90,556 |
| Mean Family Income | 956 | $100,589 |
| Median Household Income | 1,490 | $63,163 |
| Mean Household Income | 1,490 | $80,822 |
| Income Deficit | 956 | $0 |
| Wage / Income Gap (%) | 3,452 | 40.52% |
| Wage / Income Gap ($) | 3,452 | 59.48¢ per $1 |
| Gini / Inequality Index | 3,452 | 0.43 |
Earnings by Sex in Sleepy Eye
Average Earnings in Sleepy Eye are $39,415, $50,714 for men and $30,163 for women, a difference of 40.5%.
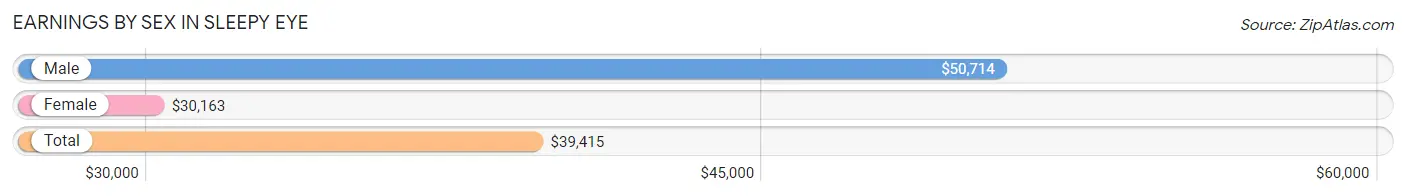
| Sex | Number | Average Earnings |
| Male | 1,108 (55.8%) | $50,714 |
| Female | 879 (44.2%) | $30,163 |
| Total | 1,987 (100.0%) | $39,415 |
Earnings by Sex by Income Bracket in Sleepy Eye
The most common earnings brackets in Sleepy Eye are $55,000 to $64,999 for men (155 | 14.0%) and $35,000 to $39,999 for women (129 | 14.7%).
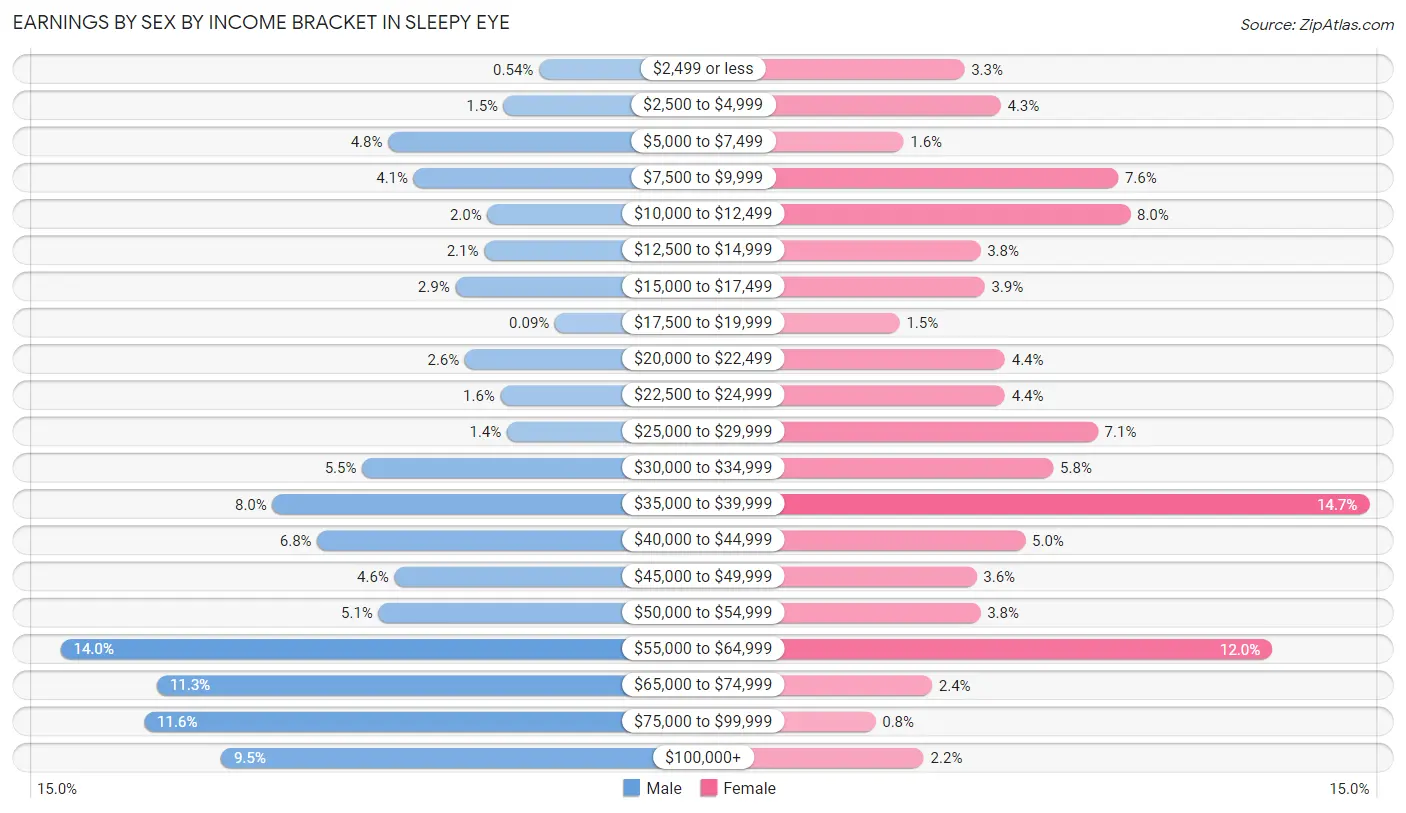
| Income | Male | Female |
| $2,499 or less | 6 (0.5%) | 29 (3.3%) |
| $2,500 to $4,999 | 17 (1.5%) | 38 (4.3%) |
| $5,000 to $7,499 | 53 (4.8%) | 14 (1.6%) |
| $7,500 to $9,999 | 45 (4.1%) | 67 (7.6%) |
| $10,000 to $12,499 | 22 (2.0%) | 70 (8.0%) |
| $12,500 to $14,999 | 23 (2.1%) | 33 (3.7%) |
| $15,000 to $17,499 | 32 (2.9%) | 34 (3.9%) |
| $17,500 to $19,999 | 1 (0.1%) | 13 (1.5%) |
| $20,000 to $22,499 | 29 (2.6%) | 39 (4.4%) |
| $22,500 to $24,999 | 18 (1.6%) | 39 (4.4%) |
| $25,000 to $29,999 | 16 (1.4%) | 62 (7.0%) |
| $30,000 to $34,999 | 61 (5.5%) | 51 (5.8%) |
| $35,000 to $39,999 | 89 (8.0%) | 129 (14.7%) |
| $40,000 to $44,999 | 75 (6.8%) | 44 (5.0%) |
| $45,000 to $49,999 | 51 (4.6%) | 32 (3.6%) |
| $50,000 to $54,999 | 56 (5.1%) | 33 (3.7%) |
| $55,000 to $64,999 | 155 (14.0%) | 105 (11.9%) |
| $65,000 to $74,999 | 125 (11.3%) | 21 (2.4%) |
| $75,000 to $99,999 | 129 (11.6%) | 7 (0.8%) |
| $100,000+ | 105 (9.5%) | 19 (2.2%) |
| Total | 1,108 (100.0%) | 879 (100.0%) |
Earnings by Sex by Educational Attainment in Sleepy Eye
Average earnings in Sleepy Eye are $56,875 for men and $29,389 for women, a difference of 48.3%. Men with an educational attainment of college or associate's degree enjoy the highest average annual earnings of $63,200, while those with less than high school education earn the least with $43,578. Women with an educational attainment of bachelor's degree earn the most with the average annual earnings of $42,500, while those with high school diploma education have the smallest earnings of $24,872.
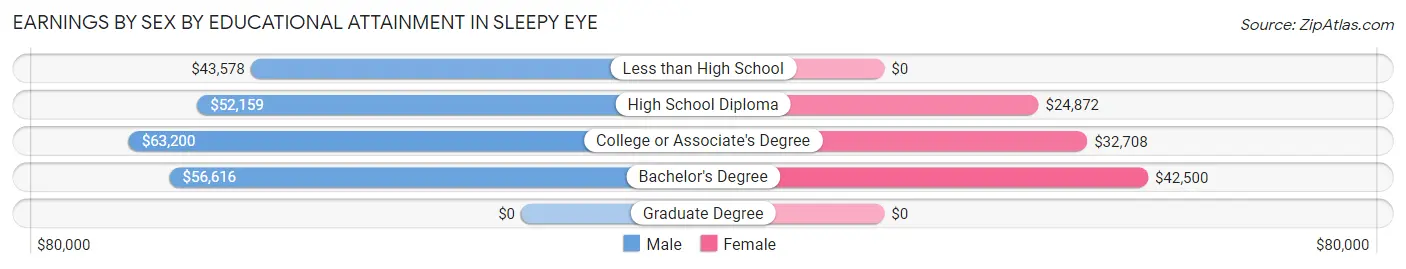
| Educational Attainment | Male Income | Female Income |
| Less than High School | $43,578 | $0 |
| High School Diploma | $52,159 | $24,872 |
| College or Associate's Degree | $63,200 | $32,708 |
| Bachelor's Degree | $56,616 | $42,500 |
| Graduate Degree | - | - |
| Total | $56,875 | $29,389 |
Family Income in Sleepy Eye
Family Income Brackets in Sleepy Eye
According to the Sleepy Eye family income data, there are 262 families falling into the $100,000 to $149,999 income range, which is the most common income bracket and makes up 27.4% of all families.
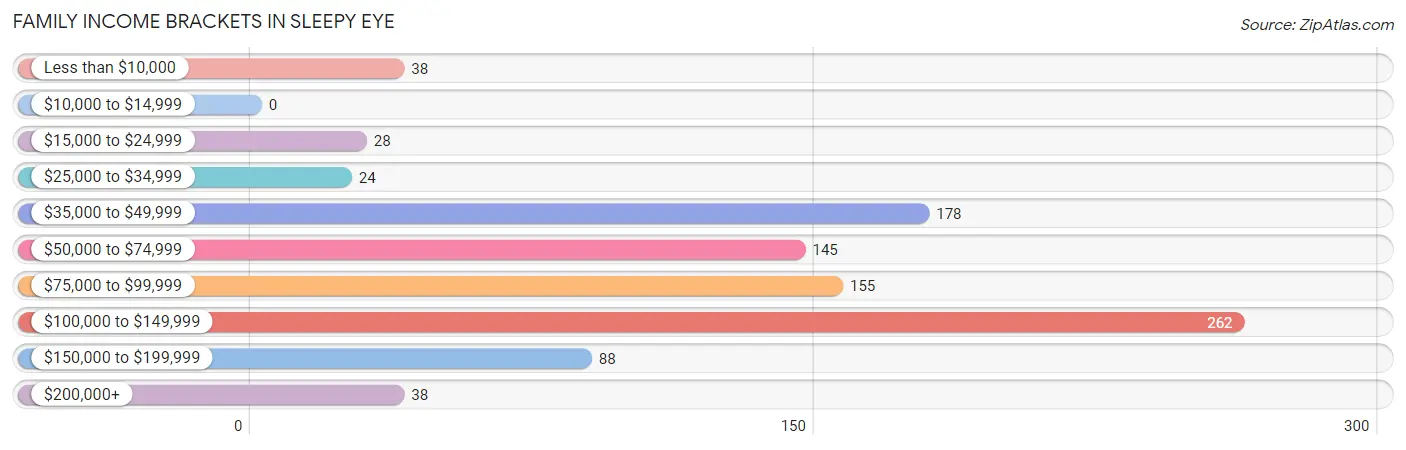
| Income Bracket | # Families | % Families |
| Less than $10,000 | 38 | 4.0% |
| $10,000 to $14,999 | 0 | 0.0% |
| $15,000 to $24,999 | 28 | 2.9% |
| $25,000 to $34,999 | 24 | 2.5% |
| $35,000 to $49,999 | 178 | 18.6% |
| $50,000 to $74,999 | 145 | 15.2% |
| $75,000 to $99,999 | 155 | 16.2% |
| $100,000 to $149,999 | 262 | 27.4% |
| $150,000 to $199,999 | 88 | 9.2% |
| $200,000+ | 38 | 4.0% |
Family Income by Famaliy Size in Sleepy Eye
3-person families (169 | 17.7%) account for the highest median family income in Sleepy Eye with $110,208 per family, while 3-person families (169 | 17.7%) have the highest median income of $36,736 per family member.
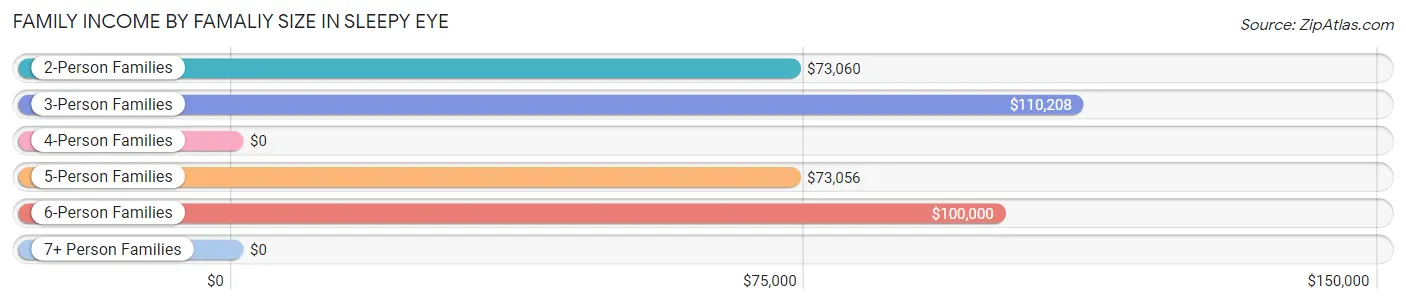
| Income Bracket | # Families | Median Income |
| 2-Person Families | 551 (57.6%) | $73,060 |
| 3-Person Families | 169 (17.7%) | $110,208 |
| 4-Person Families | 88 (9.2%) | $0 |
| 5-Person Families | 74 (7.7%) | $73,056 |
| 6-Person Families | 38 (4.0%) | $100,000 |
| 7+ Person Families | 36 (3.8%) | $0 |
| Total | 956 (100.0%) | $90,556 |
Family Income by Number of Earners in Sleepy Eye
The median family income in Sleepy Eye is $90,556, with families comprising 3+ earners (162) having the highest median family income of $142,344, while families with no earners (97) have the lowest median family income of $47,650, accounting for 17.0% and 10.2% of families, respectively.
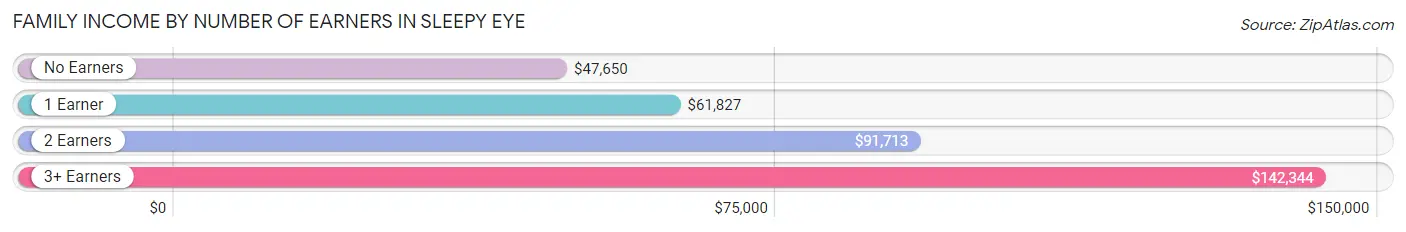
| Number of Earners | # Families | Median Income |
| No Earners | 97 (10.2%) | $47,650 |
| 1 Earner | 226 (23.6%) | $61,827 |
| 2 Earners | 471 (49.3%) | $91,713 |
| 3+ Earners | 162 (17.0%) | $142,344 |
| Total | 956 (100.0%) | $90,556 |
Household Income in Sleepy Eye
Household Income Brackets in Sleepy Eye
With 280 households falling in the category, the $50,000 to $74,999 income range is the most frequent in Sleepy Eye, accounting for 18.8% of all households. In contrast, only 37 households (2.5%) fall into the $10,000 to $14,999 income bracket, making it the least populous group.
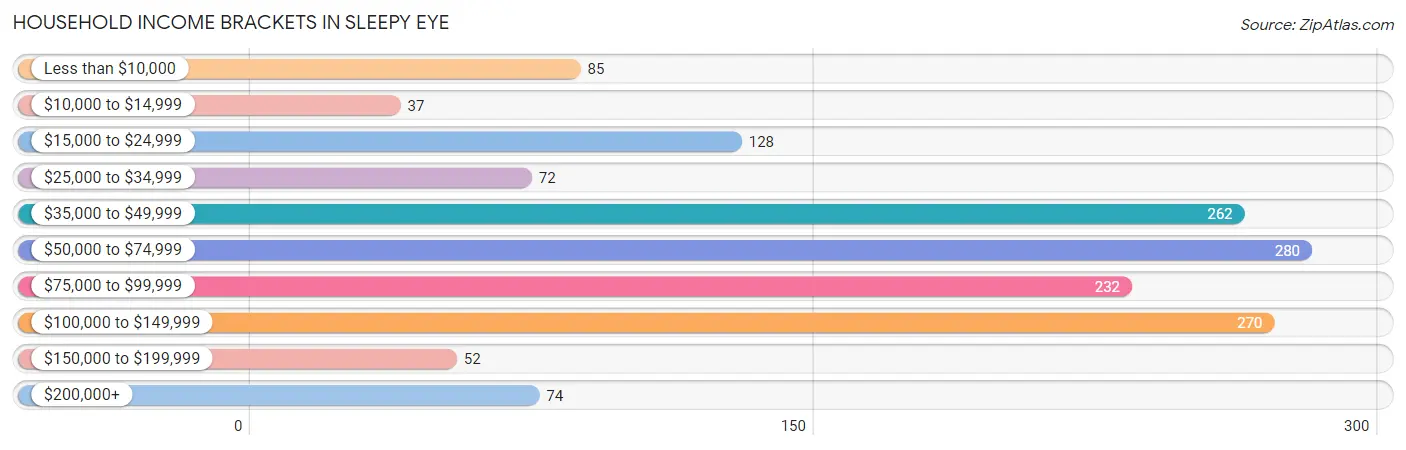
| Income Bracket | # Households | % Households |
| Less than $10,000 | 85 | 5.7% |
| $10,000 to $14,999 | 37 | 2.5% |
| $15,000 to $24,999 | 128 | 8.6% |
| $25,000 to $34,999 | 72 | 4.8% |
| $35,000 to $49,999 | 262 | 17.6% |
| $50,000 to $74,999 | 280 | 18.8% |
| $75,000 to $99,999 | 232 | 15.6% |
| $100,000 to $149,999 | 270 | 18.1% |
| $150,000 to $199,999 | 52 | 3.5% |
| $200,000+ | 74 | 5.0% |
Household Income by Householder Age in Sleepy Eye
The median household income in Sleepy Eye is $63,163, with the highest median household income of $74,444 found in the 25 to 44 years age bracket for the primary householder. A total of 468 households (31.4%) fall into this category. Meanwhile, the 15 to 24 years age bracket for the primary householder has the lowest median household income of $0, with 39 households (2.6%) in this group.
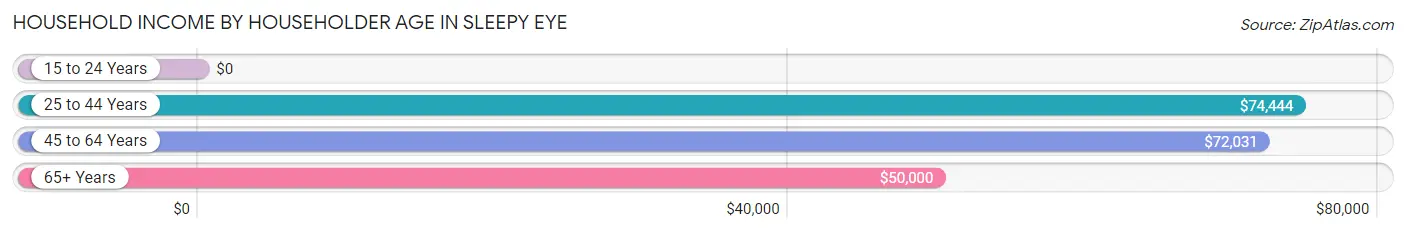
| Income Bracket | # Households | Median Income |
| 15 to 24 Years | 39 (2.6%) | $0 |
| 25 to 44 Years | 468 (31.4%) | $74,444 |
| 45 to 64 Years | 551 (37.0%) | $72,031 |
| 65+ Years | 432 (29.0%) | $50,000 |
| Total | 1,490 (100.0%) | $63,163 |
Poverty in Sleepy Eye
Income Below Poverty by Sex and Age in Sleepy Eye
With 6.6% poverty level for males and 9.3% for females among the residents of Sleepy Eye, 6 to 11 year old males and 5 year old females are the most vulnerable to poverty, with 13 males (18.1%) and 11 females (55.0%) in their respective age groups living below the poverty level.
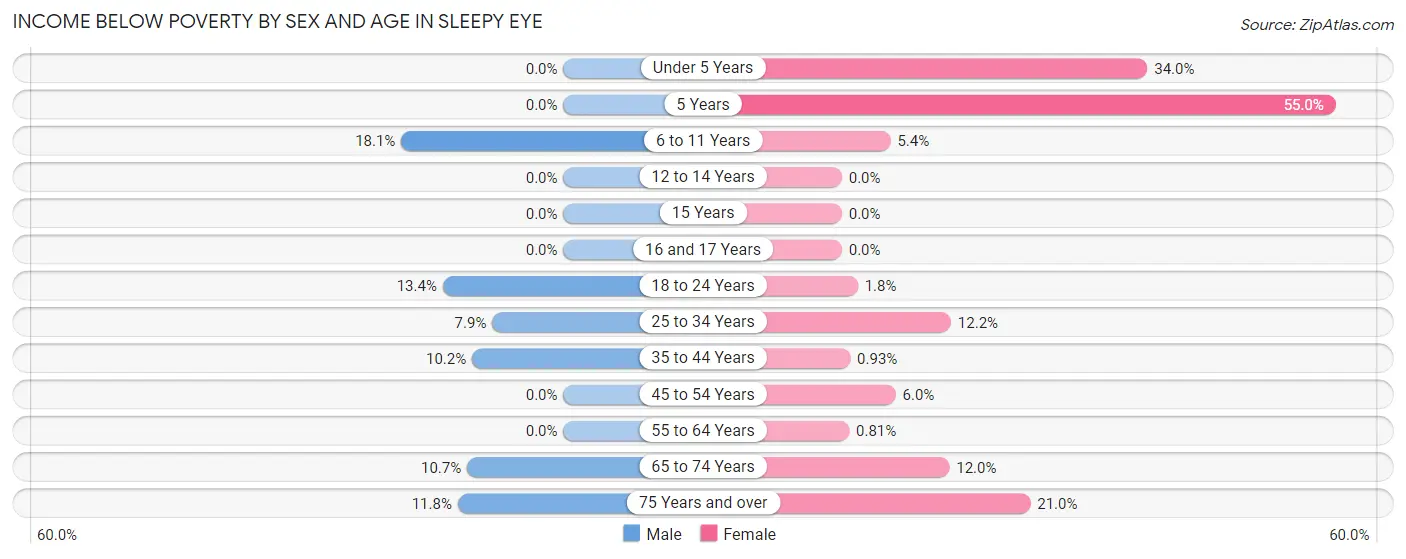
| Age Bracket | Male | Female |
| Under 5 Years | 0 (0.0%) | 33 (34.0%) |
| 5 Years | 0 (0.0%) | 11 (55.0%) |
| 6 to 11 Years | 13 (18.1%) | 9 (5.4%) |
| 12 to 14 Years | 0 (0.0%) | 0 (0.0%) |
| 15 Years | 0 (0.0%) | 0 (0.0%) |
| 16 and 17 Years | 0 (0.0%) | 0 (0.0%) |
| 18 to 24 Years | 29 (13.4%) | 2 (1.8%) |
| 25 to 34 Years | 16 (7.9%) | 26 (12.1%) |
| 35 to 44 Years | 30 (10.2%) | 1 (0.9%) |
| 45 to 54 Years | 0 (0.0%) | 10 (6.0%) |
| 55 to 64 Years | 0 (0.0%) | 2 (0.8%) |
| 65 to 74 Years | 22 (10.7%) | 34 (12.0%) |
| 75 Years and over | 8 (11.8%) | 17 (21.0%) |
| Total | 118 (6.6%) | 145 (9.3%) |
Income Above Poverty by Sex and Age in Sleepy Eye
According to the poverty statistics in Sleepy Eye, males aged under 5 years and females aged 12 to 14 years are the age groups that are most secure financially, with 100.0% of males and 100.0% of females in these age groups living above the poverty line.
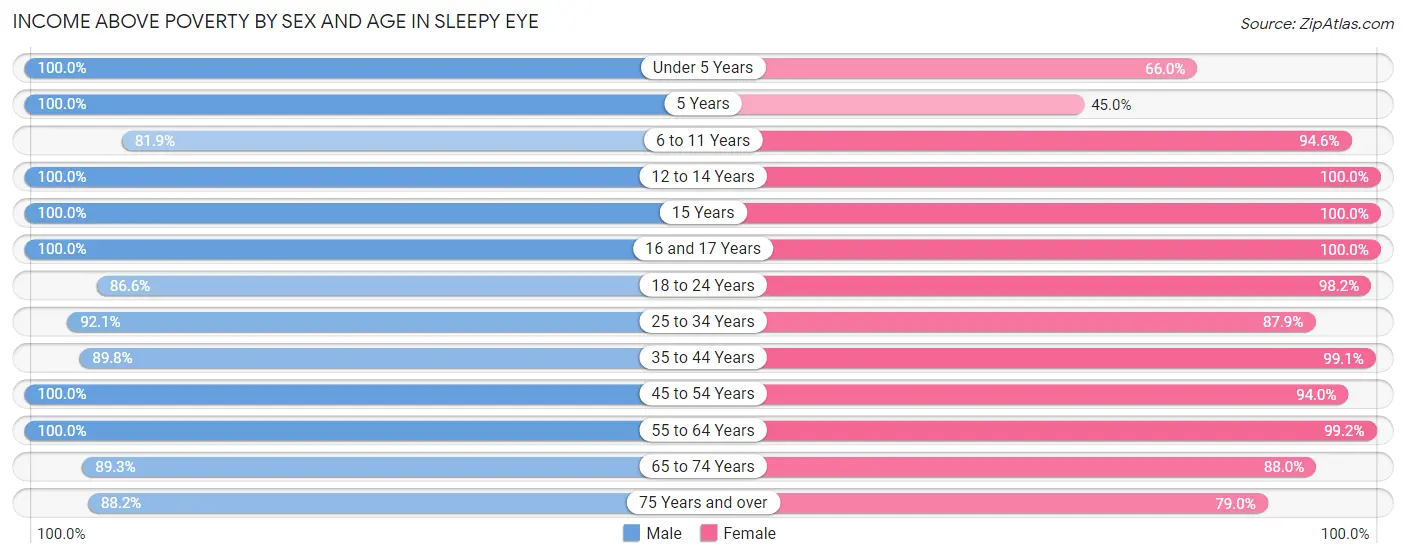
| Age Bracket | Male | Female |
| Under 5 Years | 146 (100.0%) | 64 (66.0%) |
| 5 Years | 7 (100.0%) | 9 (45.0%) |
| 6 to 11 Years | 59 (81.9%) | 157 (94.6%) |
| 12 to 14 Years | 85 (100.0%) | 27 (100.0%) |
| 15 Years | 13 (100.0%) | 9 (100.0%) |
| 16 and 17 Years | 13 (100.0%) | 24 (100.0%) |
| 18 to 24 Years | 187 (86.6%) | 111 (98.2%) |
| 25 to 34 Years | 186 (92.1%) | 188 (87.8%) |
| 35 to 44 Years | 265 (89.8%) | 107 (99.1%) |
| 45 to 54 Years | 205 (100.0%) | 157 (94.0%) |
| 55 to 64 Years | 252 (100.0%) | 246 (99.2%) |
| 65 to 74 Years | 183 (89.3%) | 250 (88.0%) |
| 75 Years and over | 60 (88.2%) | 64 (79.0%) |
| Total | 1,661 (93.4%) | 1,413 (90.7%) |
Income Below Poverty Among Married-Couple Families in Sleepy Eye
The poverty statistics for married-couple families in Sleepy Eye show that 1.5% or 11 of the total 730 families live below the poverty line. Families with no children have the highest poverty rate of 2.2%, comprising of 11 families. On the other hand, families with 1 or 2 children have the lowest poverty rate of 0.0%, which includes 0 families.
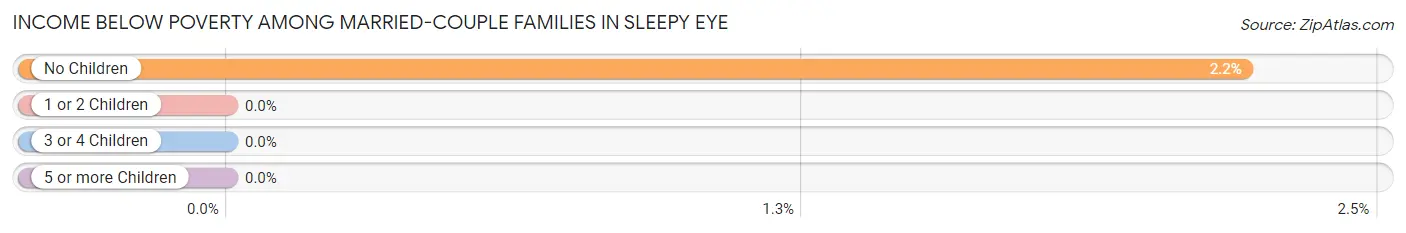
| Children | Above Poverty | Below Poverty |
| No Children | 486 (97.8%) | 11 (2.2%) |
| 1 or 2 Children | 134 (100.0%) | 0 (0.0%) |
| 3 or 4 Children | 99 (100.0%) | 0 (0.0%) |
| 5 or more Children | 0 (0.0%) | 0 (0.0%) |
| Total | 719 (98.5%) | 11 (1.5%) |
Income Below Poverty Among Single-Parent Households in Sleepy Eye
According to the poverty data in Sleepy Eye, 26.9% or 29 single-father households and 22.0% or 26 single-mother households are living below the poverty line. Among single-father households, those with 1 or 2 children have the highest poverty rate, with 17 households (46.0%) experiencing poverty. Likewise, among single-mother households, those with 1 or 2 children have the highest poverty rate, with 10 households (62.5%) falling below the poverty line.
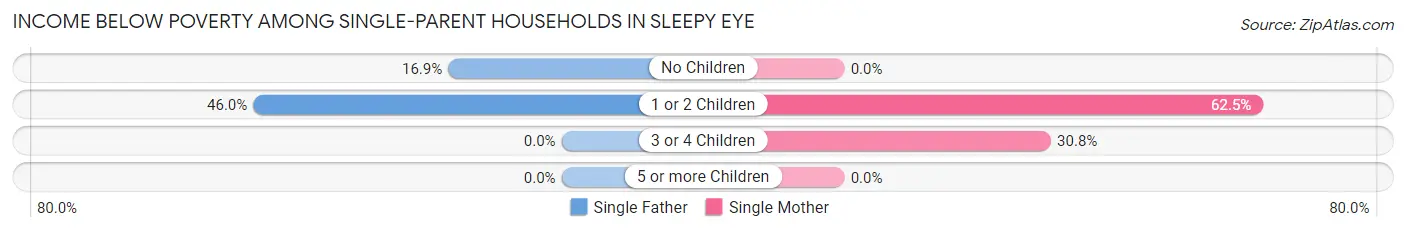
| Children | Single Father | Single Mother |
| No Children | 12 (16.9%) | 0 (0.0%) |
| 1 or 2 Children | 17 (46.0%) | 10 (62.5%) |
| 3 or 4 Children | 0 (0.0%) | 16 (30.8%) |
| 5 or more Children | 0 (0.0%) | 0 (0.0%) |
| Total | 29 (26.9%) | 26 (22.0%) |
Income Below Poverty Among Married-Couple vs Single-Parent Households in Sleepy Eye
The poverty data for Sleepy Eye shows that 11 of the married-couple family households (1.5%) and 55 of the single-parent households (24.3%) are living below the poverty level. Within the married-couple family households, those with no children have the highest poverty rate, with 11 households (2.2%) falling below the poverty line. Among the single-parent households, those with 1 or 2 children have the highest poverty rate, with 27 household (50.9%) living below poverty.
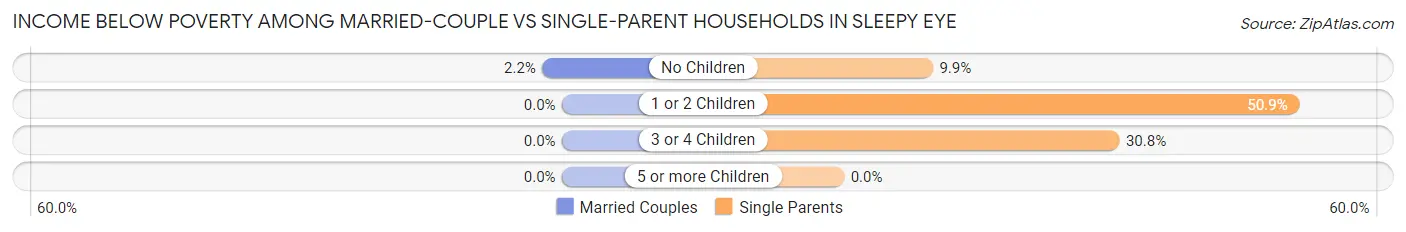
| Children | Married-Couple Families | Single-Parent Households |
| No Children | 11 (2.2%) | 12 (9.9%) |
| 1 or 2 Children | 0 (0.0%) | 27 (50.9%) |
| 3 or 4 Children | 0 (0.0%) | 16 (30.8%) |
| 5 or more Children | 0 (0.0%) | 0 (0.0%) |
| Total | 11 (1.5%) | 55 (24.3%) |
Race in Sleepy Eye
The most populous races in Sleepy Eye are White / Caucasian (2,999 | 86.9%), Hispanic or Latino (611 | 17.7%), and Two or more Races (369 | 10.7%).
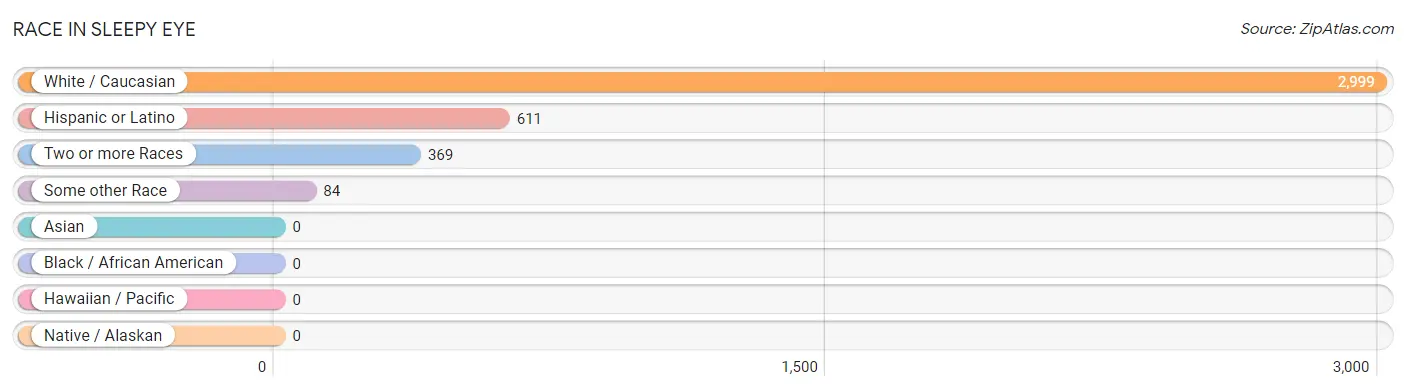
| Race | # Population | % Population |
| Asian | 0 | 0.0% |
| Black / African American | 0 | 0.0% |
| Hawaiian / Pacific | 0 | 0.0% |
| Hispanic or Latino | 611 | 17.7% |
| Native / Alaskan | 0 | 0.0% |
| White / Caucasian | 2,999 | 86.9% |
| Two or more Races | 369 | 10.7% |
| Some other Race | 84 | 2.4% |
| Total | 3,452 | 100.0% |
Ancestry in Sleepy Eye
The most populous ancestries reported in Sleepy Eye are German (1,784 | 51.7%), Mexican (584 | 16.9%), Norwegian (432 | 12.5%), Irish (212 | 6.1%), and Czech (207 | 6.0%), together accounting for 93.3% of all Sleepy Eye residents.
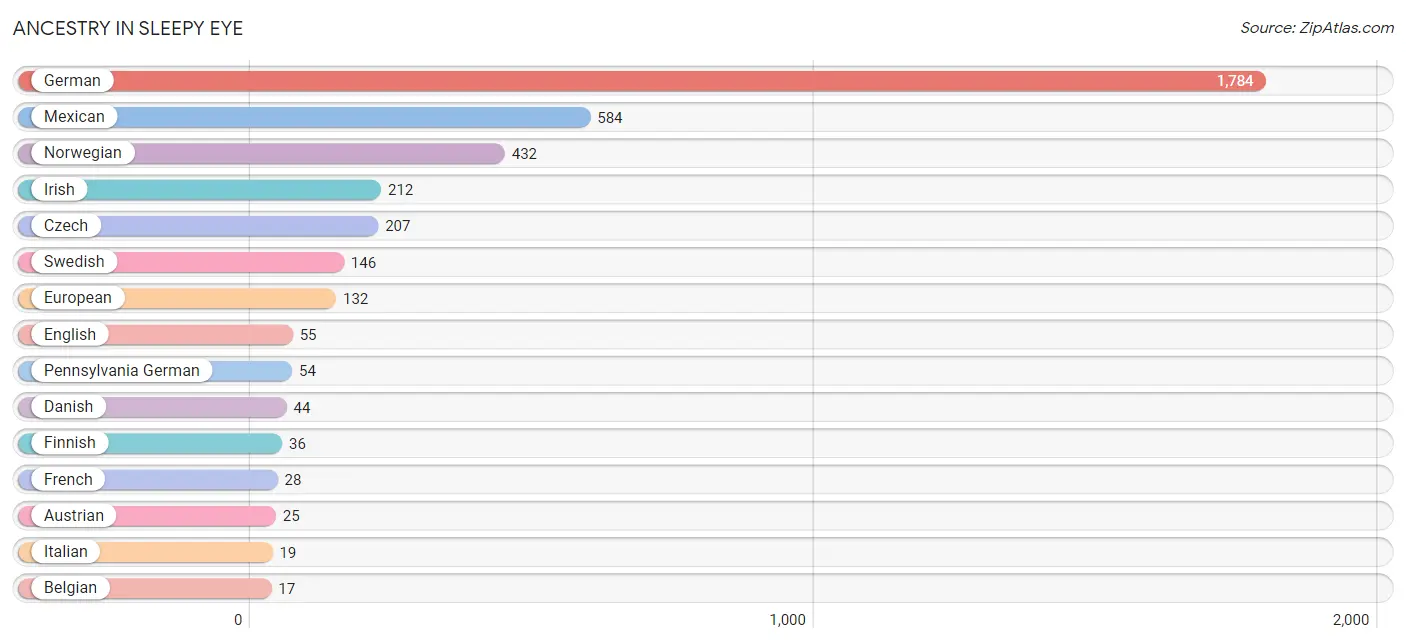
| Ancestry | # Population | % Population |
| American | 15 | 0.4% |
| Austrian | 25 | 0.7% |
| Belgian | 17 | 0.5% |
| Bhutanese | 6 | 0.2% |
| British | 10 | 0.3% |
| Czech | 207 | 6.0% |
| Danish | 44 | 1.3% |
| Dutch | 8 | 0.2% |
| English | 55 | 1.6% |
| European | 132 | 3.8% |
| Finnish | 36 | 1.0% |
| French | 28 | 0.8% |
| German | 1,784 | 51.7% |
| Irish | 212 | 6.1% |
| Italian | 19 | 0.5% |
| Mexican | 584 | 16.9% |
| Norwegian | 432 | 12.5% |
| Pennsylvania German | 54 | 1.6% |
| Puerto Rican | 1 | 0.0% |
| Scottish | 14 | 0.4% |
| Swedish | 146 | 4.2% |
| Swiss | 9 | 0.3% | View All 22 Rows |
Immigrants in Sleepy Eye
The most numerous immigrant groups reported in Sleepy Eye came from Central America (190 | 5.5%), Latin America (190 | 5.5%), Mexico (190 | 5.5%), Europe (30 | 0.9%), and Western Europe (17 | 0.5%), together accounting for 17.9% of all Sleepy Eye residents.
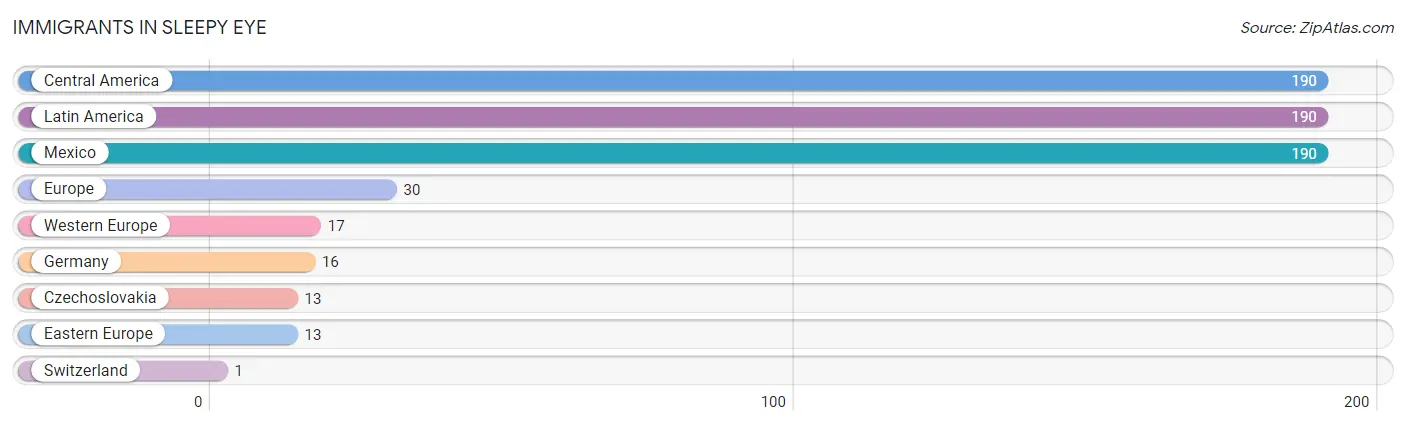
| Immigration Origin | # Population | % Population |
| Central America | 190 | 5.5% |
| Czechoslovakia | 13 | 0.4% |
| Eastern Europe | 13 | 0.4% |
| Europe | 30 | 0.9% |
| Germany | 16 | 0.5% |
| Latin America | 190 | 5.5% |
| Mexico | 190 | 5.5% |
| Switzerland | 1 | 0.0% |
| Western Europe | 17 | 0.5% | View All 9 Rows |
Sex and Age in Sleepy Eye
Sex and Age in Sleepy Eye
The most populous age groups in Sleepy Eye are 35 to 39 Years (186 | 10.4%) for men and 65 to 69 Years (186 | 11.2%) for women.
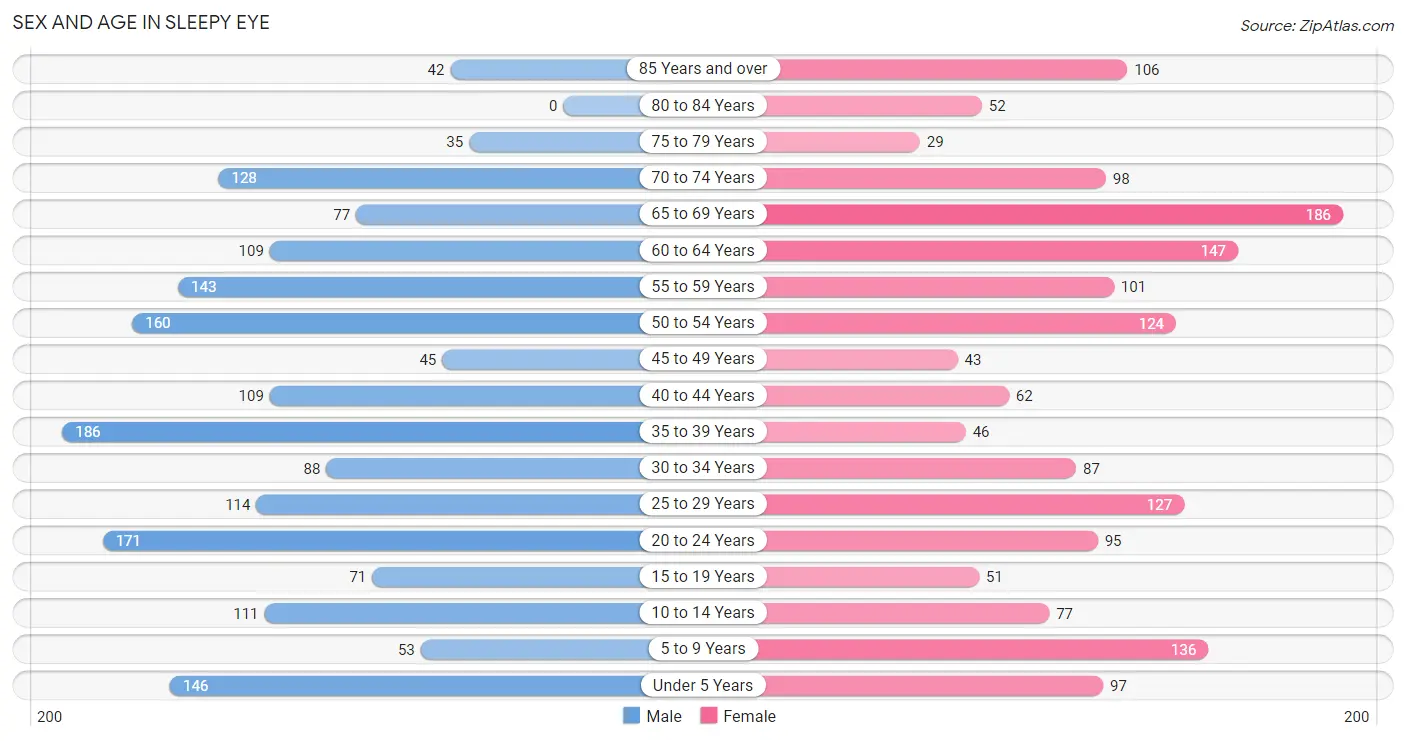
| Age Bracket | Male | Female |
| Under 5 Years | 146 (8.2%) | 97 (5.8%) |
| 5 to 9 Years | 53 (3.0%) | 136 (8.2%) |
| 10 to 14 Years | 111 (6.2%) | 77 (4.6%) |
| 15 to 19 Years | 71 (4.0%) | 51 (3.1%) |
| 20 to 24 Years | 171 (9.6%) | 95 (5.7%) |
| 25 to 29 Years | 114 (6.4%) | 127 (7.6%) |
| 30 to 34 Years | 88 (4.9%) | 87 (5.2%) |
| 35 to 39 Years | 186 (10.4%) | 46 (2.8%) |
| 40 to 44 Years | 109 (6.1%) | 62 (3.7%) |
| 45 to 49 Years | 45 (2.5%) | 43 (2.6%) |
| 50 to 54 Years | 160 (8.9%) | 124 (7.4%) |
| 55 to 59 Years | 143 (8.0%) | 101 (6.1%) |
| 60 to 64 Years | 109 (6.1%) | 147 (8.8%) |
| 65 to 69 Years | 77 (4.3%) | 186 (11.2%) |
| 70 to 74 Years | 128 (7.2%) | 98 (5.9%) |
| 75 to 79 Years | 35 (2.0%) | 29 (1.7%) |
| 80 to 84 Years | 0 (0.0%) | 52 (3.1%) |
| 85 Years and over | 42 (2.4%) | 106 (6.4%) |
| Total | 1,788 (100.0%) | 1,664 (100.0%) |
Families and Households in Sleepy Eye
Median Family Size in Sleepy Eye
The median family size in Sleepy Eye is 2.83 persons per family, with single female/mother families (118 | 12.3%) accounting for the largest median family size of 3.4 persons per family. On the other hand, single male/father families (108 | 11.3%) represent the smallest median family size with 2.08 persons per family.
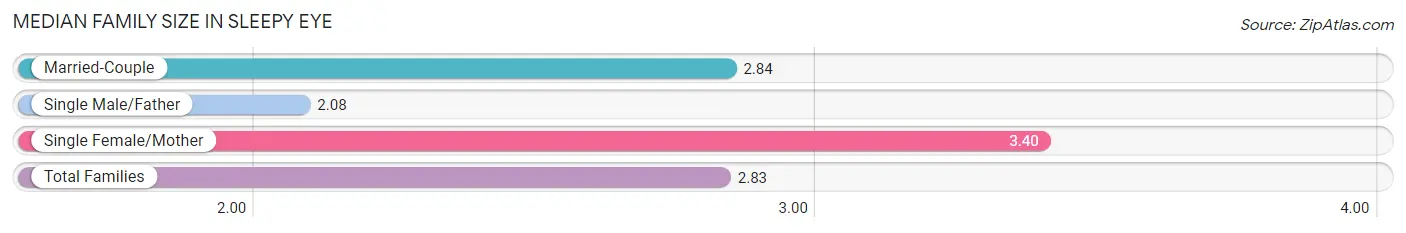
| Family Type | # Families | Family Size |
| Married-Couple | 730 (76.4%) | 2.84 |
| Single Male/Father | 108 (11.3%) | 2.08 |
| Single Female/Mother | 118 (12.3%) | 3.40 |
| Total Families | 956 (100.0%) | 2.83 |
Median Household Size in Sleepy Eye
The median household size in Sleepy Eye is 2.23 persons per household, with single female/mother households (118 | 7.9%) accounting for the largest median household size of 3.73 persons per household. non-family households (534 | 35.8%) represent the smallest median household size with 1.05 persons per household.
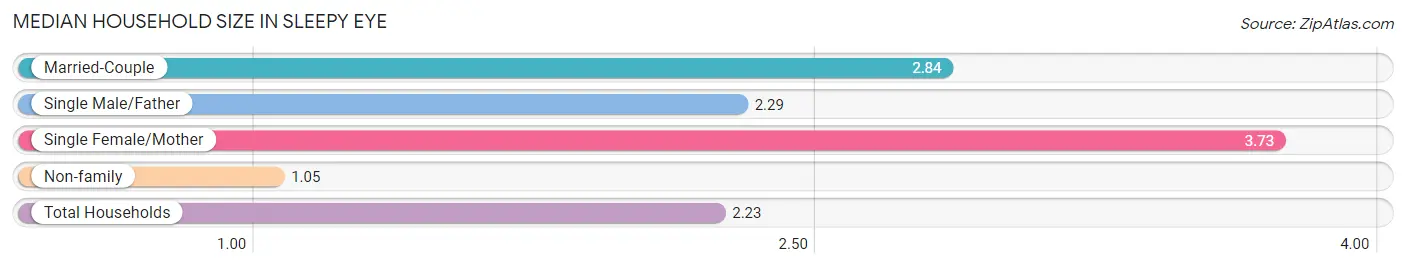
| Household Type | # Households | Household Size |
| Married-Couple | 730 (49.0%) | 2.84 |
| Single Male/Father | 108 (7.2%) | 2.29 |
| Single Female/Mother | 118 (7.9%) | 3.73 |
| Non-family | 534 (35.8%) | 1.05 |
| Total Households | 1,490 (100.0%) | 2.23 |
Household Size by Marriage Status in Sleepy Eye
Out of a total of 1,490 households in Sleepy Eye, 956 (64.2%) are family households, while 534 (35.8%) are nonfamily households. The most numerous type of family households are 2-person households, comprising 527, and the most common type of nonfamily households are 1-person households, comprising 501.
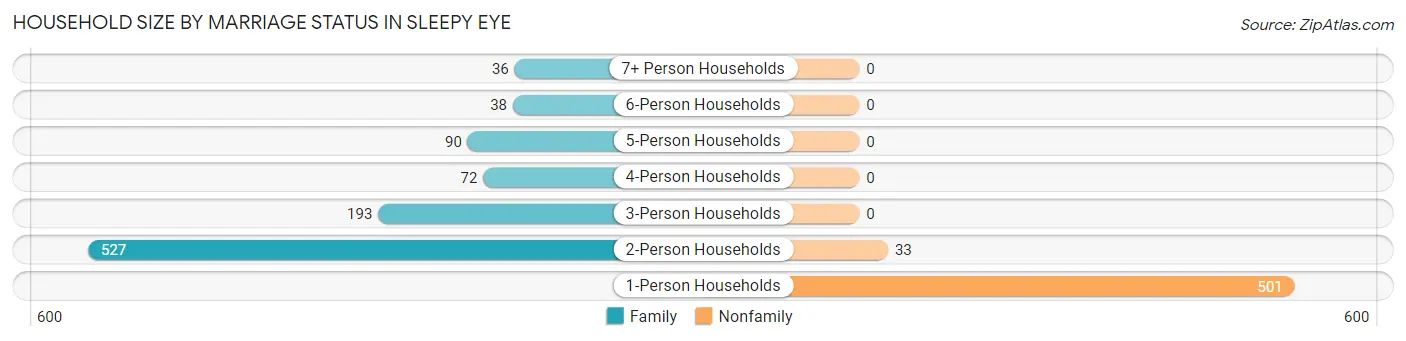
| Household Size | Family Households | Nonfamily Households |
| 1-Person Households | - | 501 (33.6%) |
| 2-Person Households | 527 (35.4%) | 33 (2.2%) |
| 3-Person Households | 193 (13.0%) | 0 (0.0%) |
| 4-Person Households | 72 (4.8%) | 0 (0.0%) |
| 5-Person Households | 90 (6.0%) | 0 (0.0%) |
| 6-Person Households | 38 (2.5%) | 0 (0.0%) |
| 7+ Person Households | 36 (2.4%) | 0 (0.0%) |
| Total | 956 (64.2%) | 534 (35.8%) |
Female Fertility in Sleepy Eye
Fertility by Age in Sleepy Eye
Average fertility rate in Sleepy Eye is 47.0 births per 1,000 women. Women in the age bracket of 35 to 50 years have the highest fertility rate with 60.0 births per 1,000 women. Women in the age bracket of 20 to 34 years acount for 62.5% of all women with births.
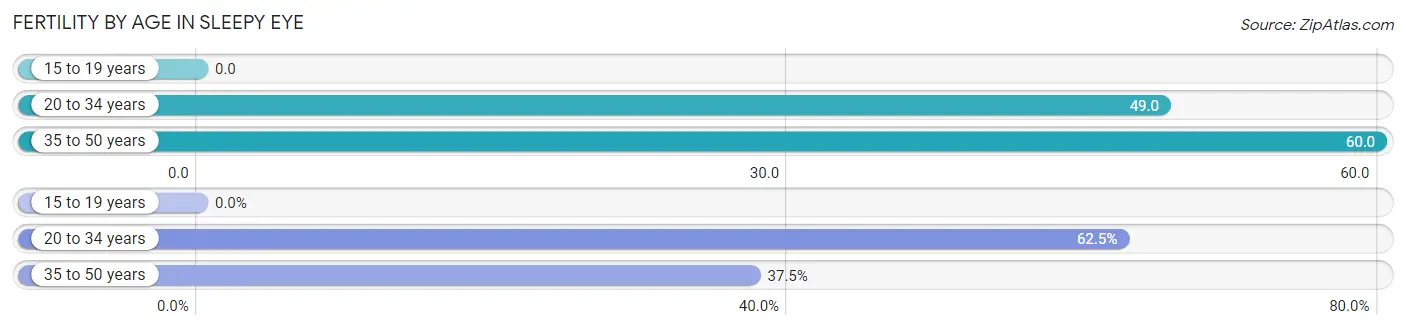
| Age Bracket | Women with Births | Births / 1,000 Women |
| 15 to 19 years | 0 (0.0%) | 0.0 |
| 20 to 34 years | 15 (62.5%) | 49.0 |
| 35 to 50 years | 9 (37.5%) | 60.0 |
| Total | 24 (100.0%) | 47.0 |
Fertility by Age by Marriage Status in Sleepy Eye
75.0% of women with births (24) in Sleepy Eye are married. The highest percentage of unmarried women with births falls into 20 to 34 years age bracket with 40.0% of them unmarried at the time of birth, while the lowest percentage of unmarried women with births belong to 35 to 50 years age bracket with 0.0% of them unmarried.
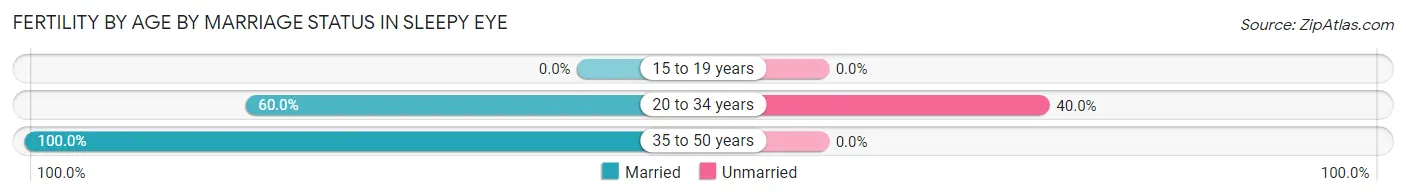
| Age Bracket | Married | Unmarried |
| 15 to 19 years | 0 (0.0%) | 0 (0.0%) |
| 20 to 34 years | 9 (60.0%) | 6 (40.0%) |
| 35 to 50 years | 9 (100.0%) | 0 (0.0%) |
| Total | 18 (75.0%) | 6 (25.0%) |
Fertility by Education in Sleepy Eye
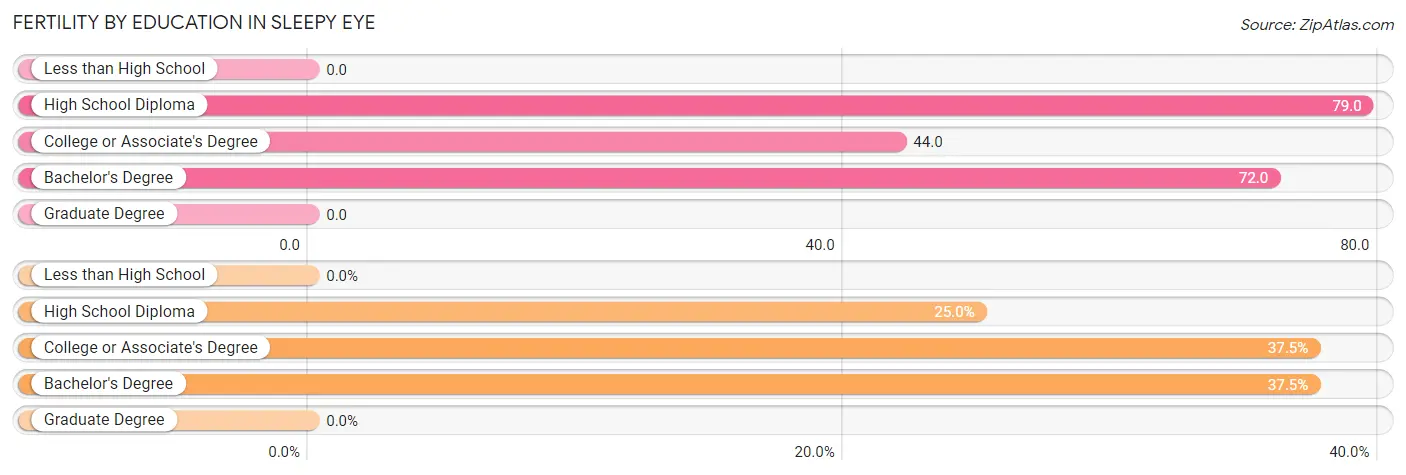
| Educational Attainment | Women with Births | Births / 1,000 Women |
| Less than High School | 0 (0.0%) | 0.0 |
| High School Diploma | 6 (25.0%) | 79.0 |
| College or Associate's Degree | 9 (37.5%) | 44.0 |
| Bachelor's Degree | 9 (37.5%) | 72.0 |
| Graduate Degree | 0 (0.0%) | 0.0 |
| Total | 24 (100.0%) | 47.0 |
Fertility by Education by Marriage Status in Sleepy Eye
25.0% of women with births in Sleepy Eye are unmarried. Women with the educational attainment of college or associate's degree are most likely to be married with 100.0% of them married at childbirth, while women with the educational attainment of high school diploma are least likely to be married with 100.0% of them unmarried at childbirth.
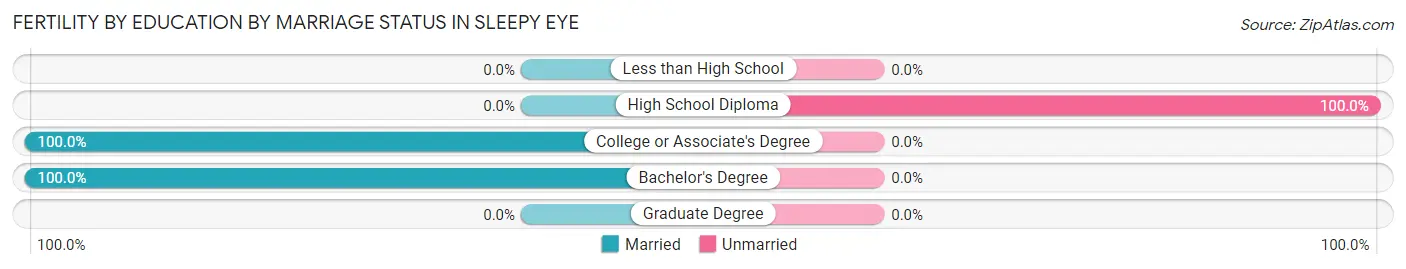
| Educational Attainment | Married | Unmarried |
| Less than High School | 0 (0.0%) | 0 (0.0%) |
| High School Diploma | 0 (0.0%) | 6 (100.0%) |
| College or Associate's Degree | 9 (100.0%) | 0 (0.0%) |
| Bachelor's Degree | 9 (100.0%) | 0 (0.0%) |
| Graduate Degree | 0 (0.0%) | 0 (0.0%) |
| Total | 18 (75.0%) | 6 (25.0%) |
Employment Characteristics in Sleepy Eye
Employment by Class of Employer in Sleepy Eye
Among the 1,816 employed individuals in Sleepy Eye, private company employees (1,331 | 73.3%), self-employed (not incorporated) (149 | 8.2%), and not-for-profit organizations (110 | 6.1%) make up the most common classes of employment.
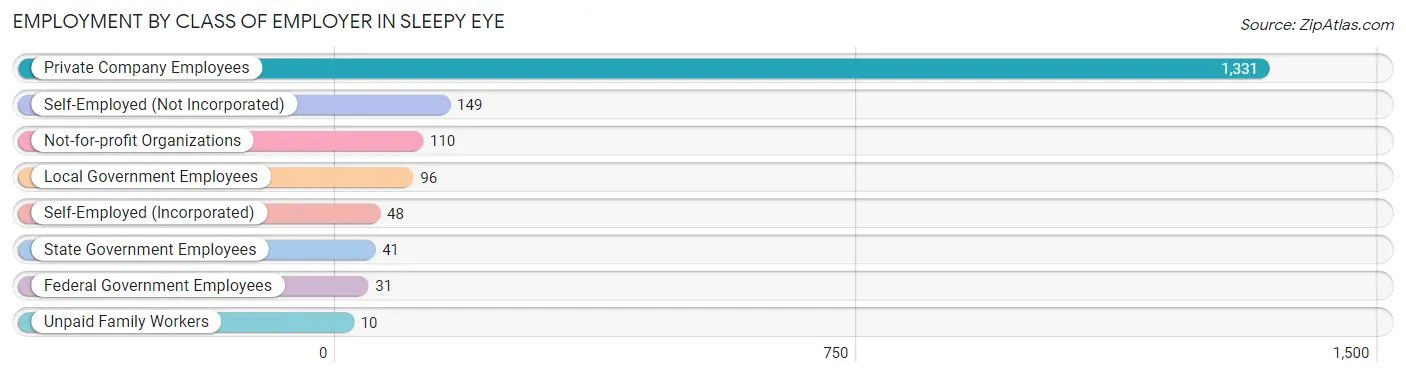
| Employer Class | # Employees | % Employees |
| Private Company Employees | 1,331 | 73.3% |
| Self-Employed (Incorporated) | 48 | 2.6% |
| Self-Employed (Not Incorporated) | 149 | 8.2% |
| Not-for-profit Organizations | 110 | 6.1% |
| Local Government Employees | 96 | 5.3% |
| State Government Employees | 41 | 2.3% |
| Federal Government Employees | 31 | 1.7% |
| Unpaid Family Workers | 10 | 0.5% |
| Total | 1,816 | 100.0% |
Employment Status by Age in Sleepy Eye
According to the labor force statistics for Sleepy Eye, out of the total population over 16 years of age (2,810), 67.7% or 1,902 individuals are in the labor force, with 4.2% or 80 of them unemployed. The age group with the highest labor force participation rate is 55 to 59 years, with 95.9% or 234 individuals in the labor force. Within the labor force, the 16 to 19 years age range has the highest percentage of unemployed individuals, with 71.4% or 45 of them being unemployed.
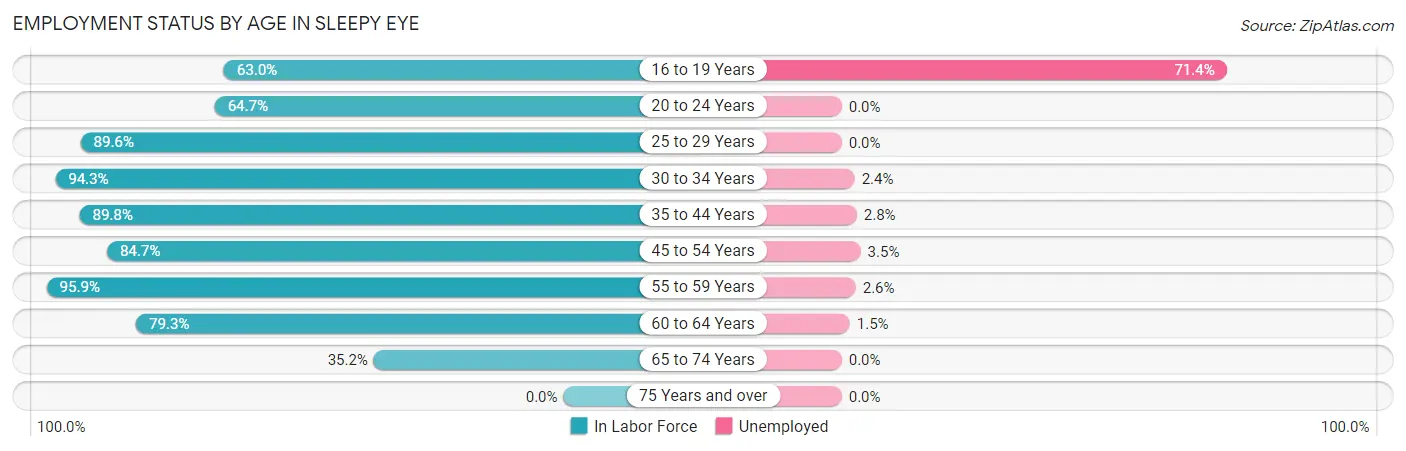
| Age Bracket | In Labor Force | Unemployed |
| 16 to 19 Years | 63 (63.0%) | 45 (71.4%) |
| 20 to 24 Years | 172 (64.7%) | 0 (0.0%) |
| 25 to 29 Years | 216 (89.6%) | 0 (0.0%) |
| 30 to 34 Years | 165 (94.3%) | 4 (2.4%) |
| 35 to 44 Years | 362 (89.8%) | 10 (2.8%) |
| 45 to 54 Years | 315 (84.7%) | 11 (3.5%) |
| 55 to 59 Years | 234 (95.9%) | 6 (2.6%) |
| 60 to 64 Years | 203 (79.3%) | 3 (1.5%) |
| 65 to 74 Years | 172 (35.2%) | 0 (0.0%) |
| 75 Years and over | 0 (0.0%) | 0 (0.0%) |
| Total | 1,902 (67.7%) | 80 (4.2%) |
Employment Status by Educational Attainment in Sleepy Eye
According to labor force statistics for Sleepy Eye, 88.4% of individuals (1,495) out of the total population between 25 and 64 years of age (1,691) are in the labor force, with 2.3% or 34 of them being unemployed. The group with the highest labor force participation rate are those with the educational attainment of college / associate degree, with 92.6% or 638 individuals in the labor force. Within the labor force, individuals with bachelor's degree or higher education have the highest percentage of unemployment, with 5.5% or 17 of them being unemployed.
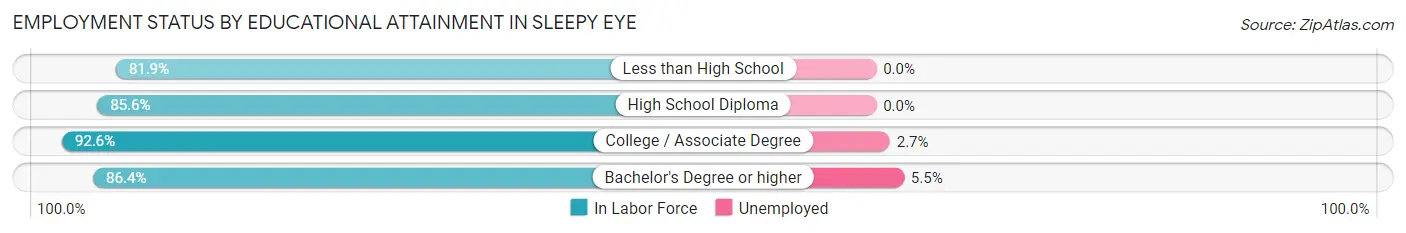
| Educational Attainment | In Labor Force | Unemployed |
| Less than High School | 77 (81.9%) | 0 (0.0%) |
| High School Diploma | 470 (85.6%) | 0 (0.0%) |
| College / Associate Degree | 638 (92.6%) | 19 (2.7%) |
| Bachelor's Degree or higher | 310 (86.4%) | 20 (5.5%) |
| Total | 1,495 (88.4%) | 39 (2.3%) |
Employment Occupations by Sex in Sleepy Eye
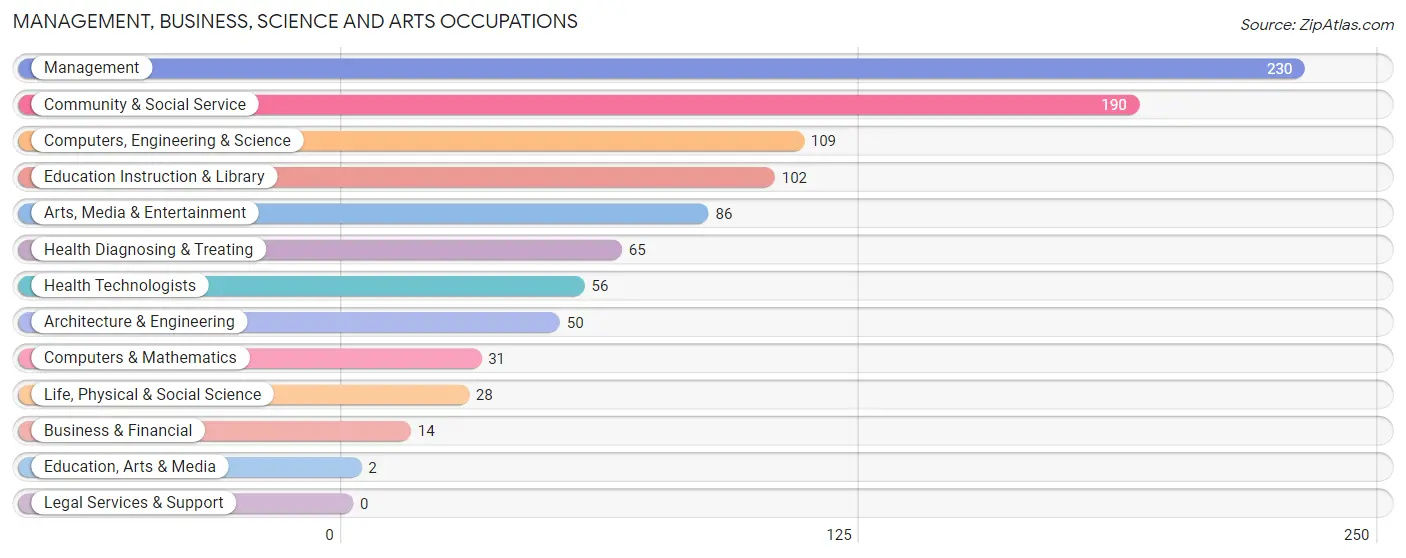
Management, Business, Science and Arts Occupations
The most common Management, Business, Science and Arts occupations in Sleepy Eye are Management (230 | 12.6%), Community & Social Service (190 | 10.4%), Computers, Engineering & Science (109 | 6.0%), Education Instruction & Library (102 | 5.6%), and Arts, Media & Entertainment (86 | 4.7%).
Management, Business, Science and Arts Occupations by Sex
Within the Management, Business, Science and Arts occupations in Sleepy Eye, the most male-oriented occupations are Architecture & Engineering (100.0%), Life, Physical & Social Science (100.0%), and Computers, Engineering & Science (88.1%), while the most female-oriented occupations are Business & Financial (100.0%), Education, Arts & Media (100.0%), and Health Diagnosing & Treating (84.6%).
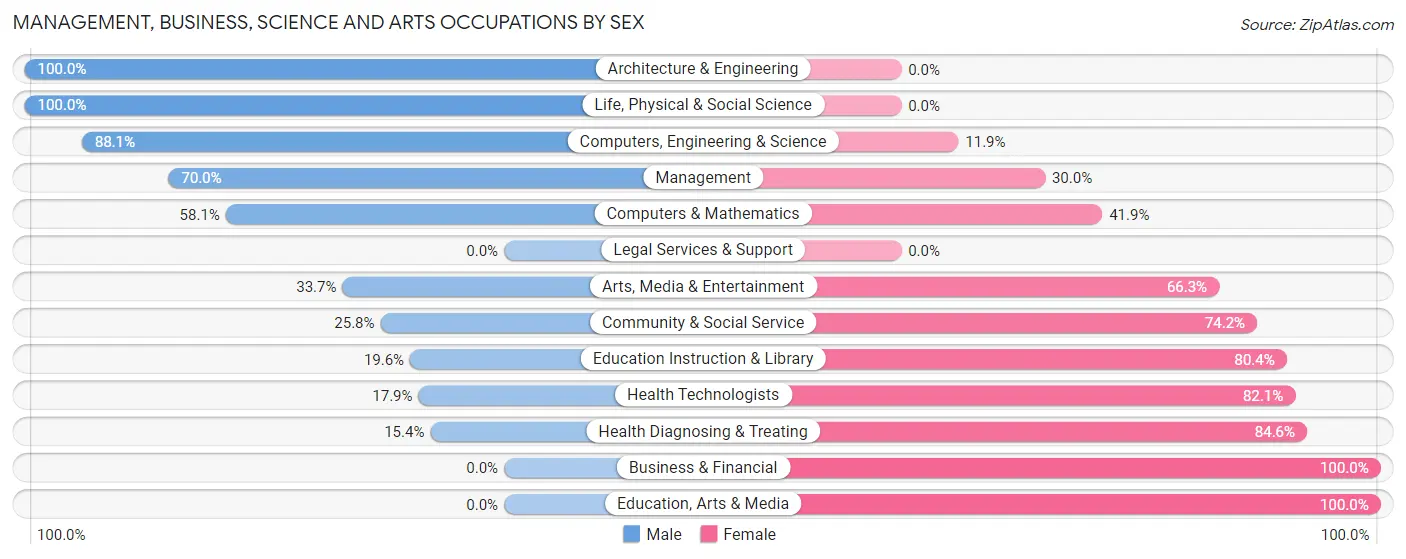
| Occupation | Male | Female |
| Management | 161 (70.0%) | 69 (30.0%) |
| Business & Financial | 0 (0.0%) | 14 (100.0%) |
| Computers, Engineering & Science | 96 (88.1%) | 13 (11.9%) |
| Computers & Mathematics | 18 (58.1%) | 13 (41.9%) |
| Architecture & Engineering | 50 (100.0%) | 0 (0.0%) |
| Life, Physical & Social Science | 28 (100.0%) | 0 (0.0%) |
| Community & Social Service | 49 (25.8%) | 141 (74.2%) |
| Education, Arts & Media | 0 (0.0%) | 2 (100.0%) |
| Legal Services & Support | 0 (0.0%) | 0 (0.0%) |
| Education Instruction & Library | 20 (19.6%) | 82 (80.4%) |
| Arts, Media & Entertainment | 29 (33.7%) | 57 (66.3%) |
| Health Diagnosing & Treating | 10 (15.4%) | 55 (84.6%) |
| Health Technologists | 10 (17.9%) | 46 (82.1%) |
| Total (Category) | 316 (52.0%) | 292 (48.0%) |
| Total (Overall) | 1,003 (55.0%) | 820 (45.0%) |
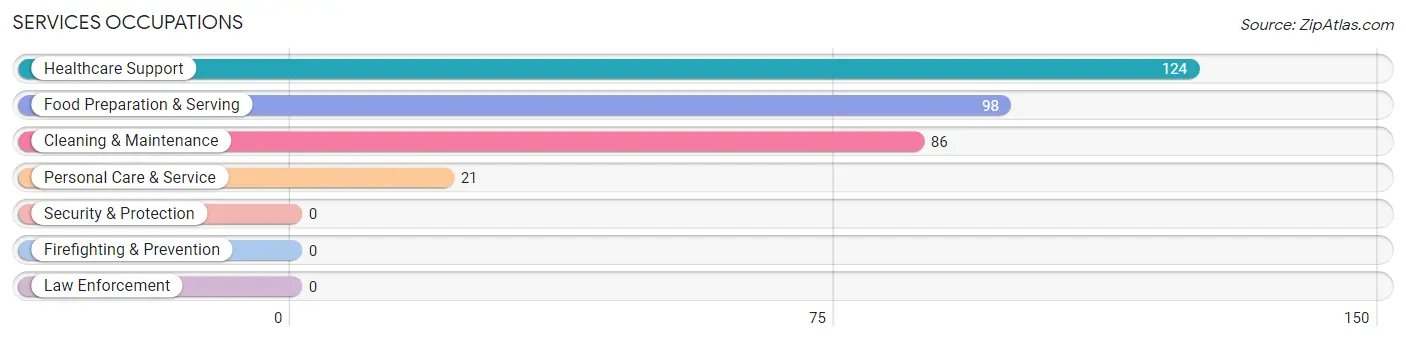
Services Occupations
The most common Services occupations in Sleepy Eye are Healthcare Support (124 | 6.8%), Food Preparation & Serving (98 | 5.4%), Cleaning & Maintenance (86 | 4.7%), and Personal Care & Service (21 | 1.1%).
Services Occupations by Sex
Within the Services occupations in Sleepy Eye, the most male-oriented occupations are Cleaning & Maintenance (100.0%), and Food Preparation & Serving (30.6%), while the most female-oriented occupations are Healthcare Support (100.0%), Personal Care & Service (100.0%), and Food Preparation & Serving (69.4%).
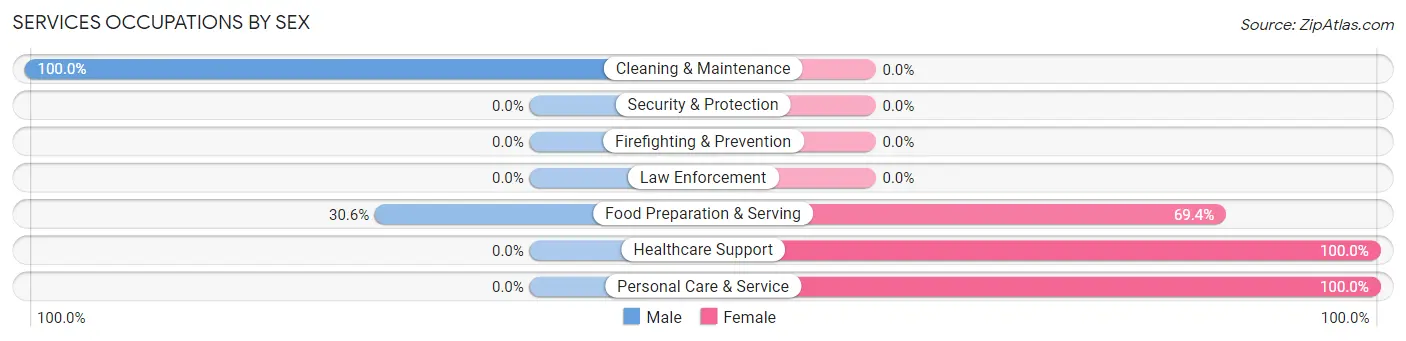
| Occupation | Male | Female |
| Healthcare Support | 0 (0.0%) | 124 (100.0%) |
| Security & Protection | 0 (0.0%) | 0 (0.0%) |
| Firefighting & Prevention | 0 (0.0%) | 0 (0.0%) |
| Law Enforcement | 0 (0.0%) | 0 (0.0%) |
| Food Preparation & Serving | 30 (30.6%) | 68 (69.4%) |
| Cleaning & Maintenance | 86 (100.0%) | 0 (0.0%) |
| Personal Care & Service | 0 (0.0%) | 21 (100.0%) |
| Total (Category) | 116 (35.3%) | 213 (64.7%) |
| Total (Overall) | 1,003 (55.0%) | 820 (45.0%) |
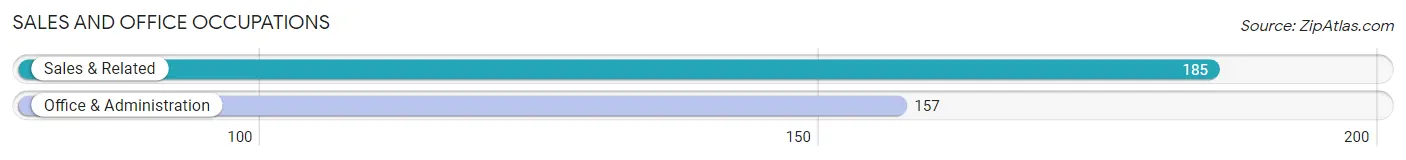
Sales and Office Occupations
The most common Sales and Office occupations in Sleepy Eye are Sales & Related (185 | 10.2%), and Office & Administration (157 | 8.6%).
Sales and Office Occupations by Sex
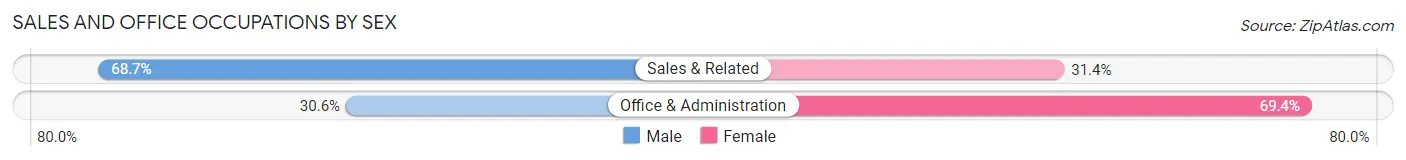
| Occupation | Male | Female |
| Sales & Related | 127 (68.6%) | 58 (31.4%) |
| Office & Administration | 48 (30.6%) | 109 (69.4%) |
| Total (Category) | 175 (51.2%) | 167 (48.8%) |
| Total (Overall) | 1,003 (55.0%) | 820 (45.0%) |
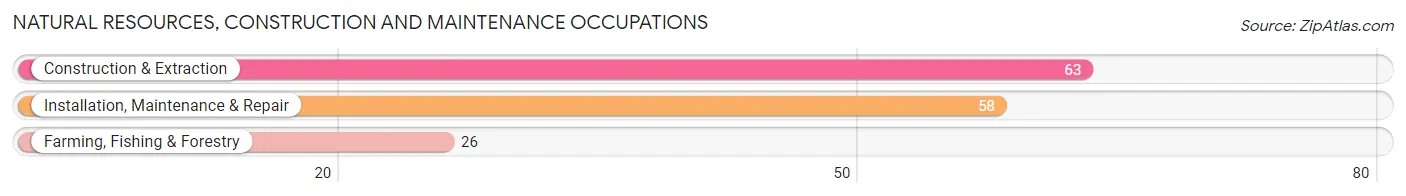
Natural Resources, Construction and Maintenance Occupations
The most common Natural Resources, Construction and Maintenance occupations in Sleepy Eye are Construction & Extraction (63 | 3.5%), Installation, Maintenance & Repair (58 | 3.2%), and Farming, Fishing & Forestry (26 | 1.4%).
Natural Resources, Construction and Maintenance Occupations by Sex
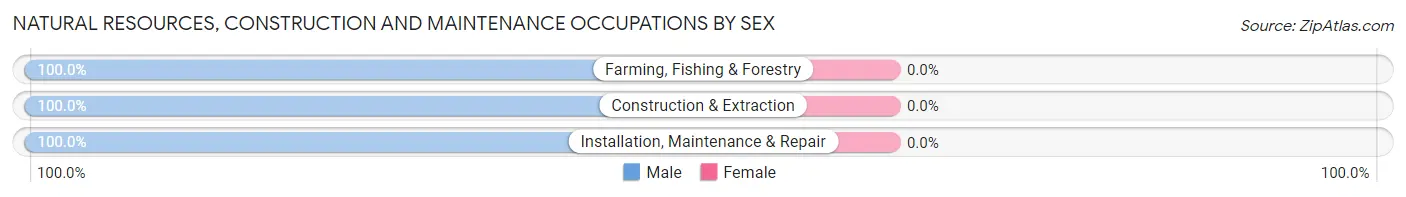
| Occupation | Male | Female |
| Farming, Fishing & Forestry | 26 (100.0%) | 0 (0.0%) |
| Construction & Extraction | 63 (100.0%) | 0 (0.0%) |
| Installation, Maintenance & Repair | 58 (100.0%) | 0 (0.0%) |
| Total (Category) | 147 (100.0%) | 0 (0.0%) |
| Total (Overall) | 1,003 (55.0%) | 820 (45.0%) |
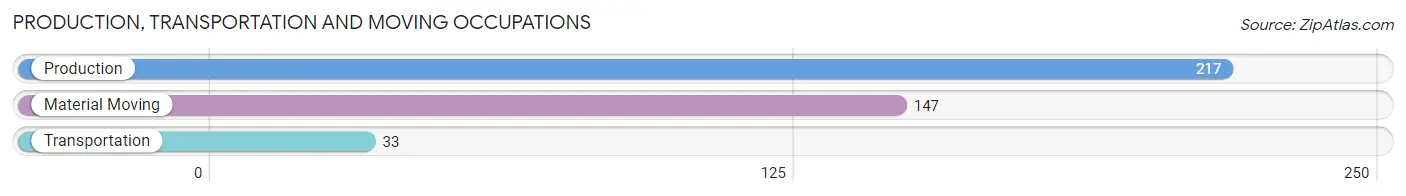
Production, Transportation and Moving Occupations
The most common Production, Transportation and Moving occupations in Sleepy Eye are Production (217 | 11.9%), Material Moving (147 | 8.1%), and Transportation (33 | 1.8%).
Production, Transportation and Moving Occupations by Sex
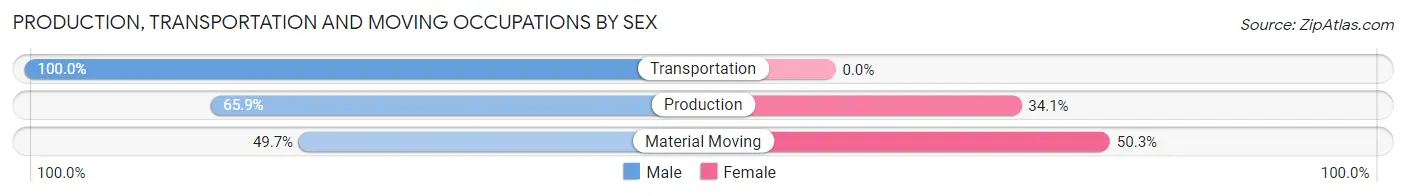
| Occupation | Male | Female |
| Production | 143 (65.9%) | 74 (34.1%) |
| Transportation | 33 (100.0%) | 0 (0.0%) |
| Material Moving | 73 (49.7%) | 74 (50.3%) |
| Total (Category) | 249 (62.7%) | 148 (37.3%) |
| Total (Overall) | 1,003 (55.0%) | 820 (45.0%) |
Employment Industries by Sex in Sleepy Eye
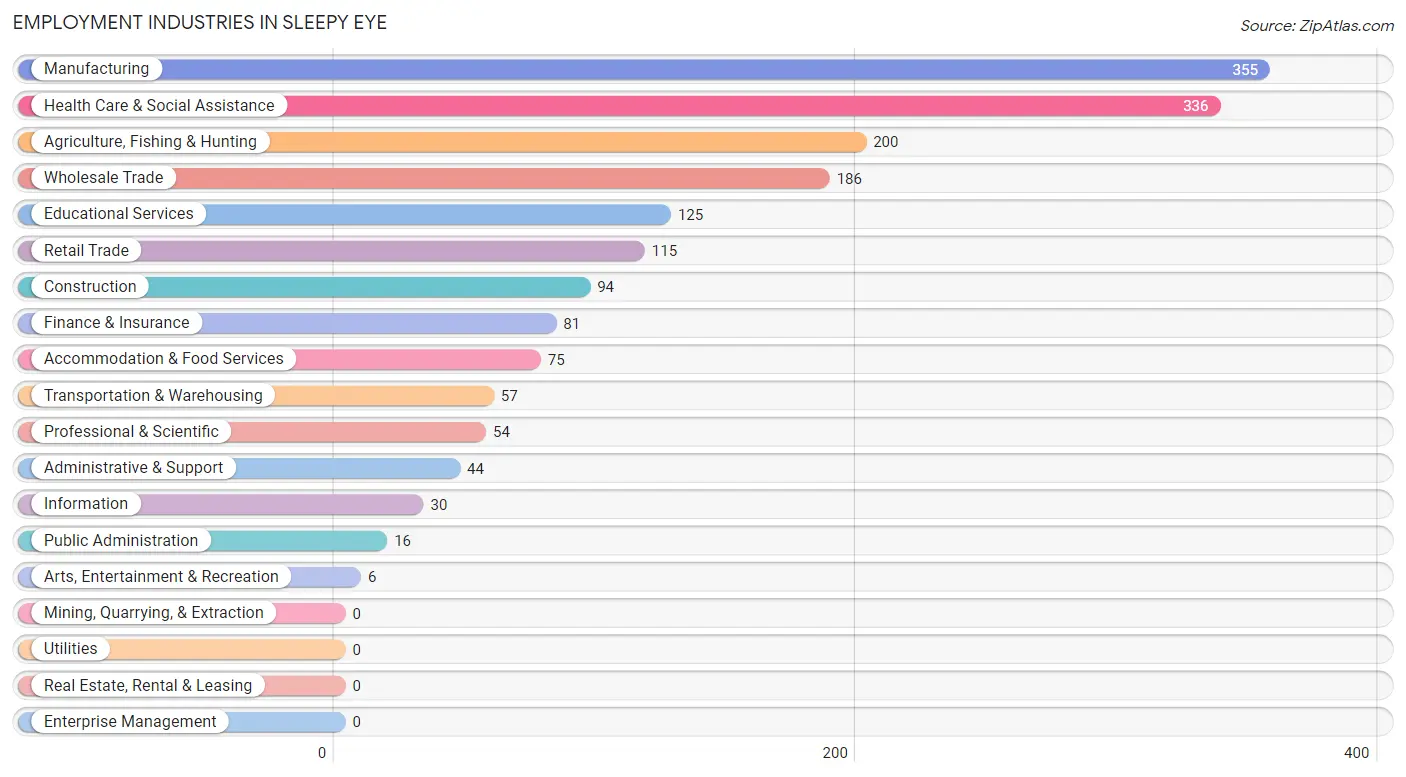
Employment Industries in Sleepy Eye
The major employment industries in Sleepy Eye include Manufacturing (355 | 19.5%), Health Care & Social Assistance (336 | 18.4%), Agriculture, Fishing & Hunting (200 | 11.0%), Wholesale Trade (186 | 10.2%), and Educational Services (125 | 6.9%).
Employment Industries by Sex in Sleepy Eye
The Sleepy Eye industries that see more men than women are Administrative & Support (100.0%), Arts, Entertainment & Recreation (100.0%), and Construction (93.6%), whereas the industries that tend to have a higher number of women are Health Care & Social Assistance (89.3%), Educational Services (86.4%), and Information (63.3%).
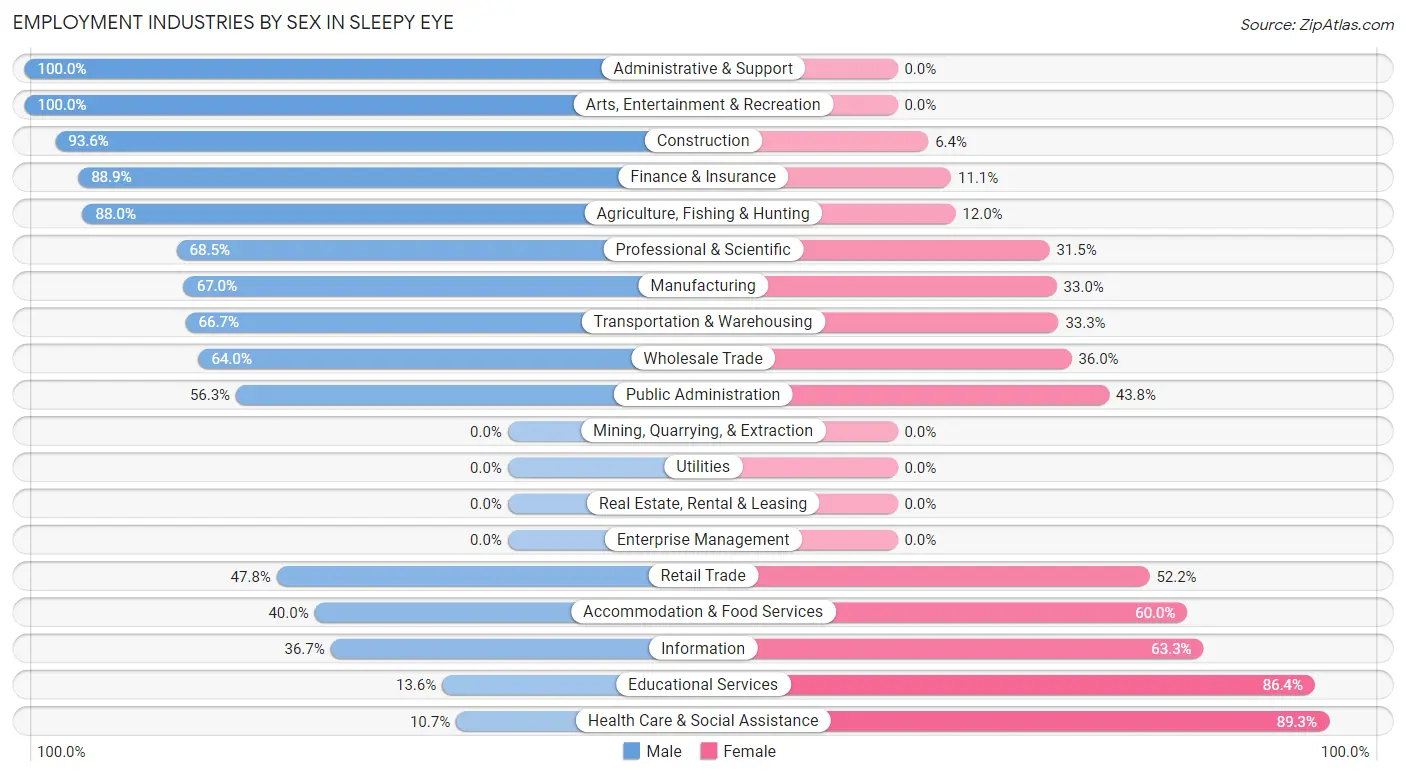
| Industry | Male | Female |
| Agriculture, Fishing & Hunting | 176 (88.0%) | 24 (12.0%) |
| Mining, Quarrying, & Extraction | 0 (0.0%) | 0 (0.0%) |
| Construction | 88 (93.6%) | 6 (6.4%) |
| Manufacturing | 238 (67.0%) | 117 (33.0%) |
| Wholesale Trade | 119 (64.0%) | 67 (36.0%) |
| Retail Trade | 55 (47.8%) | 60 (52.2%) |
| Transportation & Warehousing | 38 (66.7%) | 19 (33.3%) |
| Utilities | 0 (0.0%) | 0 (0.0%) |
| Information | 11 (36.7%) | 19 (63.3%) |
| Finance & Insurance | 72 (88.9%) | 9 (11.1%) |
| Real Estate, Rental & Leasing | 0 (0.0%) | 0 (0.0%) |
| Professional & Scientific | 37 (68.5%) | 17 (31.5%) |
| Enterprise Management | 0 (0.0%) | 0 (0.0%) |
| Administrative & Support | 44 (100.0%) | 0 (0.0%) |
| Educational Services | 17 (13.6%) | 108 (86.4%) |
| Health Care & Social Assistance | 36 (10.7%) | 300 (89.3%) |
| Arts, Entertainment & Recreation | 6 (100.0%) | 0 (0.0%) |
| Accommodation & Food Services | 30 (40.0%) | 45 (60.0%) |
| Public Administration | 9 (56.2%) | 7 (43.8%) |
| Total | 1,003 (55.0%) | 820 (45.0%) |
Education in Sleepy Eye
School Enrollment in Sleepy Eye
The most common levels of schooling among the 598 students in Sleepy Eye are middle school (170 | 28.4%), elementary school (159 | 26.6%), and college / undergraduate (102 | 17.1%).
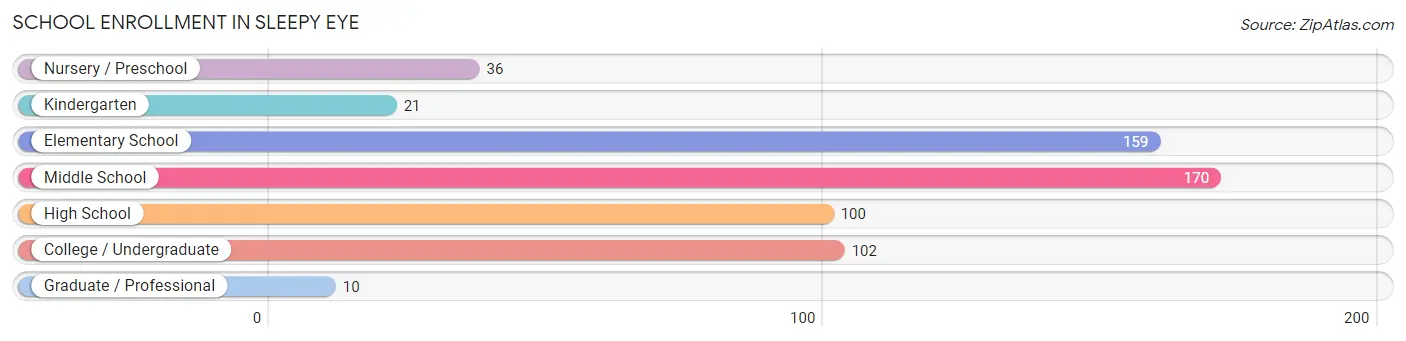
| School Level | # Students | % Students |
| Nursery / Preschool | 36 | 6.0% |
| Kindergarten | 21 | 3.5% |
| Elementary School | 159 | 26.6% |
| Middle School | 170 | 28.4% |
| High School | 100 | 16.7% |
| College / Undergraduate | 102 | 17.1% |
| Graduate / Professional | 10 | 1.7% |
| Total | 598 | 100.0% |
School Enrollment by Age by Funding Source in Sleepy Eye
Out of a total of 598 students who are enrolled in schools in Sleepy Eye, 136 (22.7%) attend a private institution, while the remaining 462 (77.3%) are enrolled in public schools. The age group of 20 to 24 year olds has the highest likelihood of being enrolled in private schools, with 12 (57.1% in the age bracket) enrolled. Conversely, the age group of 3 to 4 year olds has the lowest likelihood of being enrolled in a private school, with 18 (100.0% in the age bracket) attending a public institution.
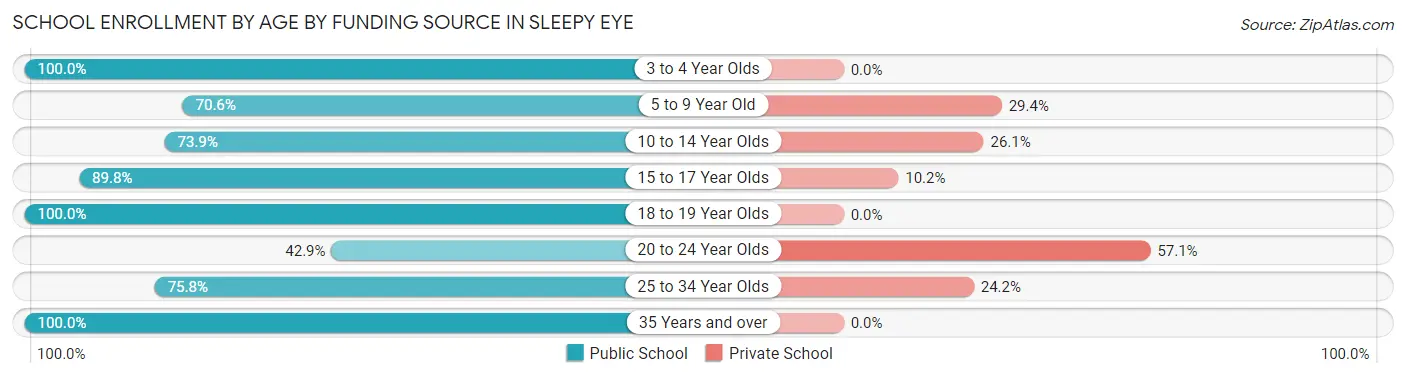
| Age Bracket | Public School | Private School |
| 3 to 4 Year Olds | 18 (100.0%) | 0 (0.0%) |
| 5 to 9 Year Old | 127 (70.6%) | 53 (29.4%) |
| 10 to 14 Year Olds | 139 (73.9%) | 49 (26.1%) |
| 15 to 17 Year Olds | 53 (89.8%) | 6 (10.2%) |
| 18 to 19 Year Olds | 54 (100.0%) | 0 (0.0%) |
| 20 to 24 Year Olds | 9 (42.9%) | 12 (57.1%) |
| 25 to 34 Year Olds | 50 (75.8%) | 16 (24.2%) |
| 35 Years and over | 12 (100.0%) | 0 (0.0%) |
| Total | 462 (77.3%) | 136 (22.7%) |
Educational Attainment by Field of Study in Sleepy Eye
Bio, nature & agricultural (87 | 17.1%), education (74 | 14.5%), literature & languages (65 | 12.8%), business (44 | 8.6%), and visual & performing arts (43 | 8.4%) are the most common fields of study among 510 individuals in Sleepy Eye who have obtained a bachelor's degree or higher.
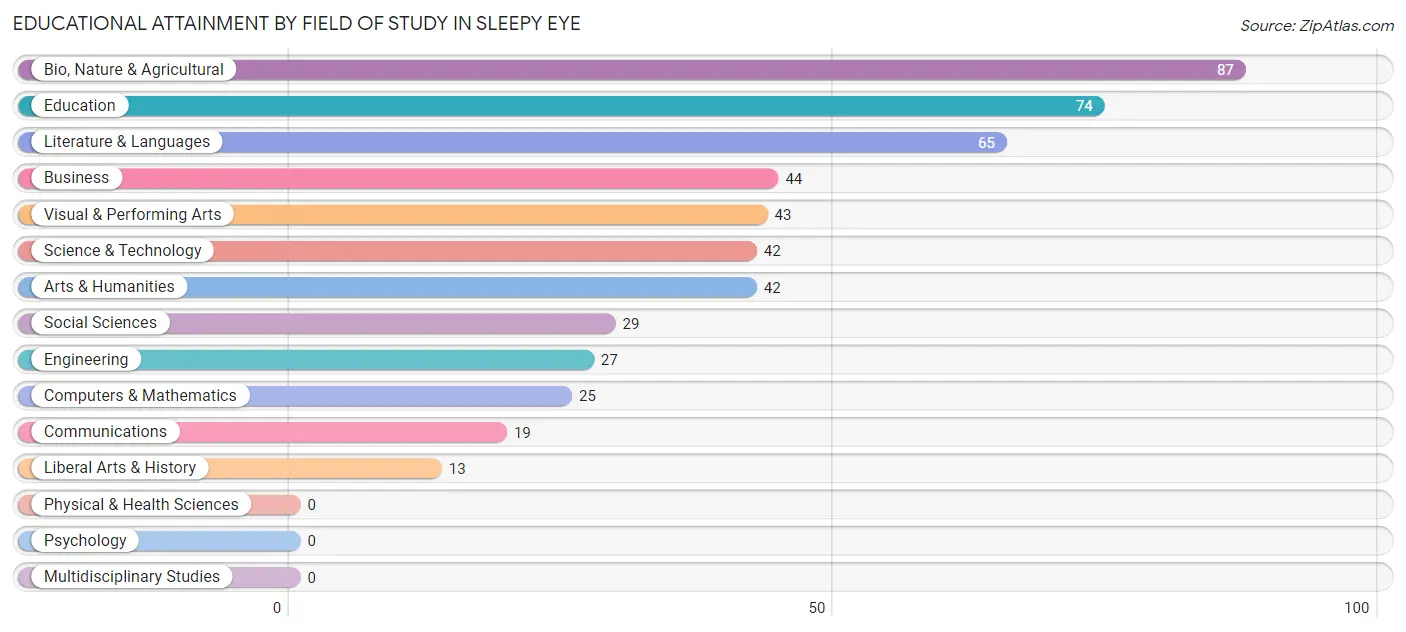
| Field of Study | # Graduates | % Graduates |
| Computers & Mathematics | 25 | 4.9% |
| Bio, Nature & Agricultural | 87 | 17.1% |
| Physical & Health Sciences | 0 | 0.0% |
| Psychology | 0 | 0.0% |
| Social Sciences | 29 | 5.7% |
| Engineering | 27 | 5.3% |
| Multidisciplinary Studies | 0 | 0.0% |
| Science & Technology | 42 | 8.2% |
| Business | 44 | 8.6% |
| Education | 74 | 14.5% |
| Literature & Languages | 65 | 12.8% |
| Liberal Arts & History | 13 | 2.5% |
| Visual & Performing Arts | 43 | 8.4% |
| Communications | 19 | 3.7% |
| Arts & Humanities | 42 | 8.2% |
| Total | 510 | 100.0% |
Transportation & Commute in Sleepy Eye
Vehicle Availability by Sex in Sleepy Eye
The most prevalent vehicle ownership categories in Sleepy Eye are males with 2 vehicles (510, accounting for 51.2%) and females with 2 vehicles (402, making up 62.4%).
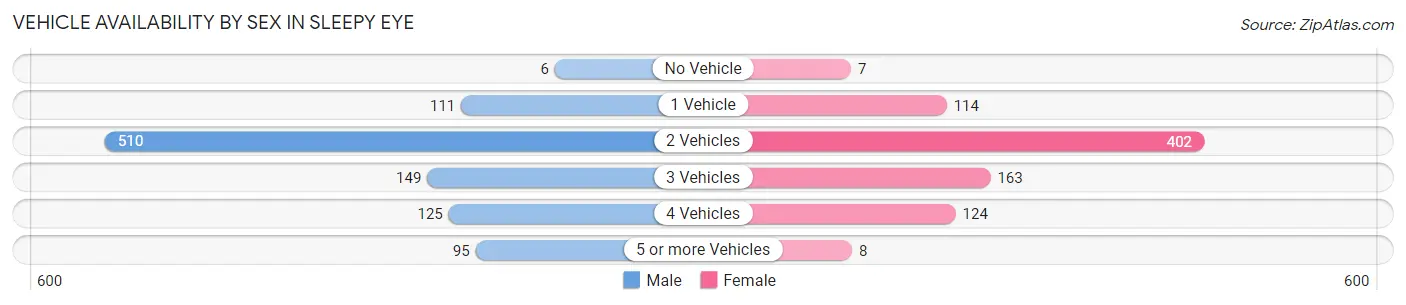
| Vehicles Available | Male | Female |
| No Vehicle | 6 (0.6%) | 7 (0.9%) |
| 1 Vehicle | 111 (11.1%) | 114 (13.9%) |
| 2 Vehicles | 510 (51.2%) | 402 (49.1%) |
| 3 Vehicles | 149 (15.0%) | 163 (19.9%) |
| 4 Vehicles | 125 (12.6%) | 124 (15.2%) |
| 5 or more Vehicles | 95 (9.5%) | 8 (1.0%) |
| Total | 996 (100.0%) | 818 (100.0%) |
Commute Time in Sleepy Eye
The most frequently occuring commute durations in Sleepy Eye are 5 to 9 minutes (492 commuters, 28.5%), 15 to 19 minutes (286 commuters, 16.6%), and less than 5 minutes (285 commuters, 16.5%).
| Commute Time | # Commuters | % Commuters |
| Less than 5 Minutes | 285 | 16.5% |
| 5 to 9 Minutes | 492 | 28.5% |
| 10 to 14 Minutes | 203 | 11.8% |
| 15 to 19 Minutes | 286 | 16.6% |
| 20 to 24 Minutes | 173 | 10.0% |
| 25 to 29 Minutes | 7 | 0.4% |
| 30 to 34 Minutes | 76 | 4.4% |
| 35 to 39 Minutes | 44 | 2.5% |
| 40 to 44 Minutes | 34 | 2.0% |
| 45 to 59 Minutes | 53 | 3.1% |
| 60 to 89 Minutes | 72 | 4.2% |
| 90 or more Minutes | 0 | 0.0% |
Commute Time by Sex in Sleepy Eye
The most common commute times in Sleepy Eye are 5 to 9 minutes (250 commuters, 25.5%) for males and 5 to 9 minutes (242 commuters, 32.5%) for females.
| Commute Time | Male | Female |
| Less than 5 Minutes | 144 (14.7%) | 141 (19.0%) |
| 5 to 9 Minutes | 250 (25.5%) | 242 (32.5%) |
| 10 to 14 Minutes | 154 (15.7%) | 49 (6.6%) |
| 15 to 19 Minutes | 171 (17.4%) | 115 (15.5%) |
| 20 to 24 Minutes | 42 (4.3%) | 131 (17.6%) |
| 25 to 29 Minutes | 0 (0.0%) | 7 (0.9%) |
| 30 to 34 Minutes | 62 (6.3%) | 14 (1.9%) |
| 35 to 39 Minutes | 44 (4.5%) | 0 (0.0%) |
| 40 to 44 Minutes | 34 (3.5%) | 0 (0.0%) |
| 45 to 59 Minutes | 26 (2.6%) | 27 (3.6%) |
| 60 to 89 Minutes | 54 (5.5%) | 18 (2.4%) |
| 90 or more Minutes | 0 (0.0%) | 0 (0.0%) |
Time of Departure to Work by Sex in Sleepy Eye
The most frequent times of departure to work in Sleepy Eye are 7:30 AM to 7:59 AM (254, 25.9%) for males and 7:30 AM to 7:59 AM (210, 28.2%) for females.
| Time of Departure | Male | Female |
| 12:00 AM to 4:59 AM | 20 (2.0%) | 38 (5.1%) |
| 5:00 AM to 5:29 AM | 4 (0.4%) | 0 (0.0%) |
| 5:30 AM to 5:59 AM | 132 (13.5%) | 50 (6.7%) |
| 6:00 AM to 6:29 AM | 127 (13.0%) | 66 (8.9%) |
| 6:30 AM to 6:59 AM | 212 (21.6%) | 91 (12.2%) |
| 7:00 AM to 7:29 AM | 124 (12.6%) | 124 (16.7%) |
| 7:30 AM to 7:59 AM | 254 (25.9%) | 210 (28.2%) |
| 8:00 AM to 8:29 AM | 35 (3.6%) | 42 (5.7%) |
| 8:30 AM to 8:59 AM | 11 (1.1%) | 56 (7.5%) |
| 9:00 AM to 9:59 AM | 0 (0.0%) | 8 (1.1%) |
| 10:00 AM to 10:59 AM | 12 (1.2%) | 0 (0.0%) |
| 11:00 AM to 11:59 AM | 0 (0.0%) | 9 (1.2%) |
| 12:00 PM to 3:59 PM | 25 (2.5%) | 43 (5.8%) |
| 4:00 PM to 11:59 PM | 25 (2.5%) | 7 (0.9%) |
| Total | 981 (100.0%) | 744 (100.0%) |
Housing Occupancy in Sleepy Eye
Occupancy by Ownership in Sleepy Eye
Of the total 1,490 dwellings in Sleepy Eye, owner-occupied units account for 1,261 (84.6%), while renter-occupied units make up 229 (15.4%).

| Occupancy | # Housing Units | % Housing Units |
| Owner Occupied Housing Units | 1,261 | 84.6% |
| Renter-Occupied Housing Units | 229 | 15.4% |
| Total Occupied Housing Units | 1,490 | 100.0% |
Occupancy by Household Size in Sleepy Eye
| Household Size | # Housing Units | % Housing Units |
| 1-Person Household | 501 | 33.6% |
| 2-Person Household | 560 | 37.6% |
| 3-Person Household | 193 | 13.0% |
| 4+ Person Household | 236 | 15.8% |
| Total Housing Units | 1,490 | 100.0% |
Occupancy by Ownership by Household Size in Sleepy Eye
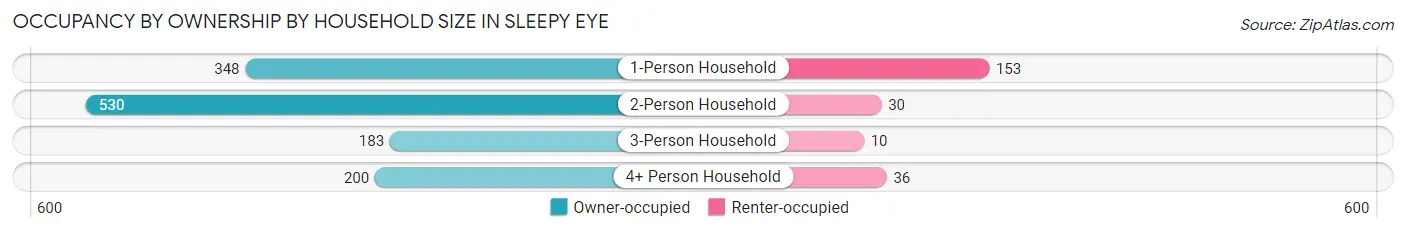
| Household Size | Owner-occupied | Renter-occupied |
| 1-Person Household | 348 (69.5%) | 153 (30.5%) |
| 2-Person Household | 530 (94.6%) | 30 (5.4%) |
| 3-Person Household | 183 (94.8%) | 10 (5.2%) |
| 4+ Person Household | 200 (84.8%) | 36 (15.2%) |
| Total Housing Units | 1,261 (84.6%) | 229 (15.4%) |
Occupancy by Educational Attainment in Sleepy Eye
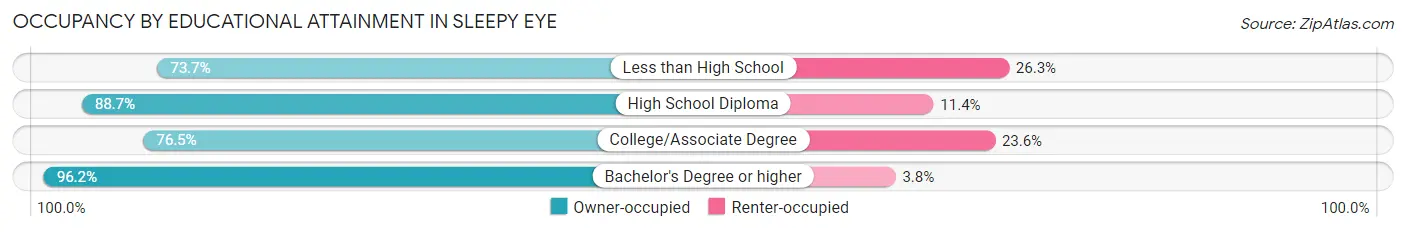
| Household Size | Owner-occupied | Renter-occupied |
| Less than High School | 70 (73.7%) | 25 (26.3%) |
| High School Diploma | 492 (88.6%) | 63 (11.4%) |
| College/Associate Degree | 422 (76.4%) | 130 (23.5%) |
| Bachelor's Degree or higher | 277 (96.2%) | 11 (3.8%) |
Occupancy by Age of Householder in Sleepy Eye
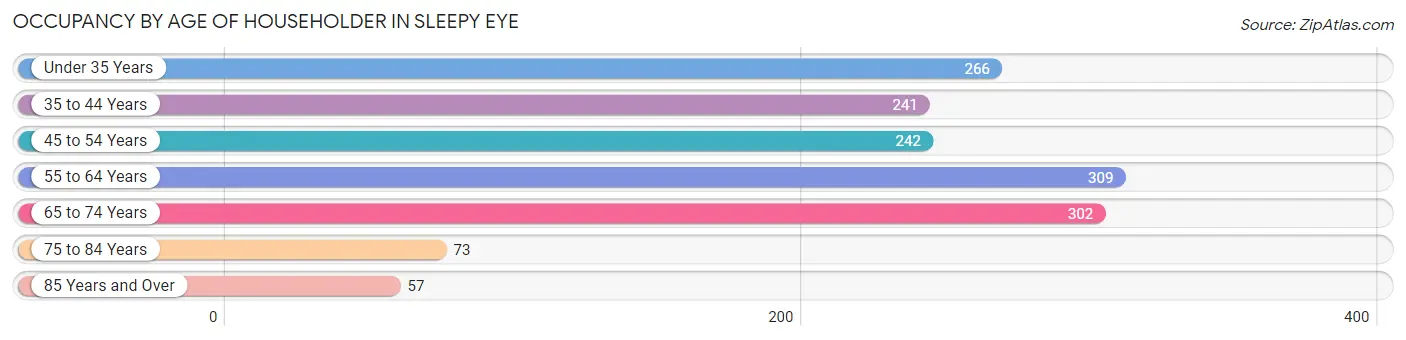
| Age Bracket | # Households | % Households |
| Under 35 Years | 266 | 17.8% |
| 35 to 44 Years | 241 | 16.2% |
| 45 to 54 Years | 242 | 16.2% |
| 55 to 64 Years | 309 | 20.7% |
| 65 to 74 Years | 302 | 20.3% |
| 75 to 84 Years | 73 | 4.9% |
| 85 Years and Over | 57 | 3.8% |
| Total | 1,490 | 100.0% |
Housing Finances in Sleepy Eye
Median Income by Occupancy in Sleepy Eye
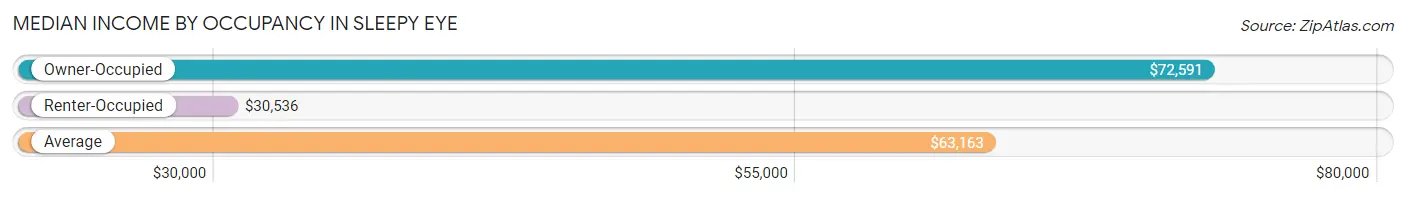
| Occupancy Type | # Households | Median Income |
| Owner-Occupied | 1,261 (84.6%) | $72,591 |
| Renter-Occupied | 229 (15.4%) | $30,536 |
| Average | 1,490 (100.0%) | $63,163 |
Occupancy by Householder Income Bracket in Sleepy Eye
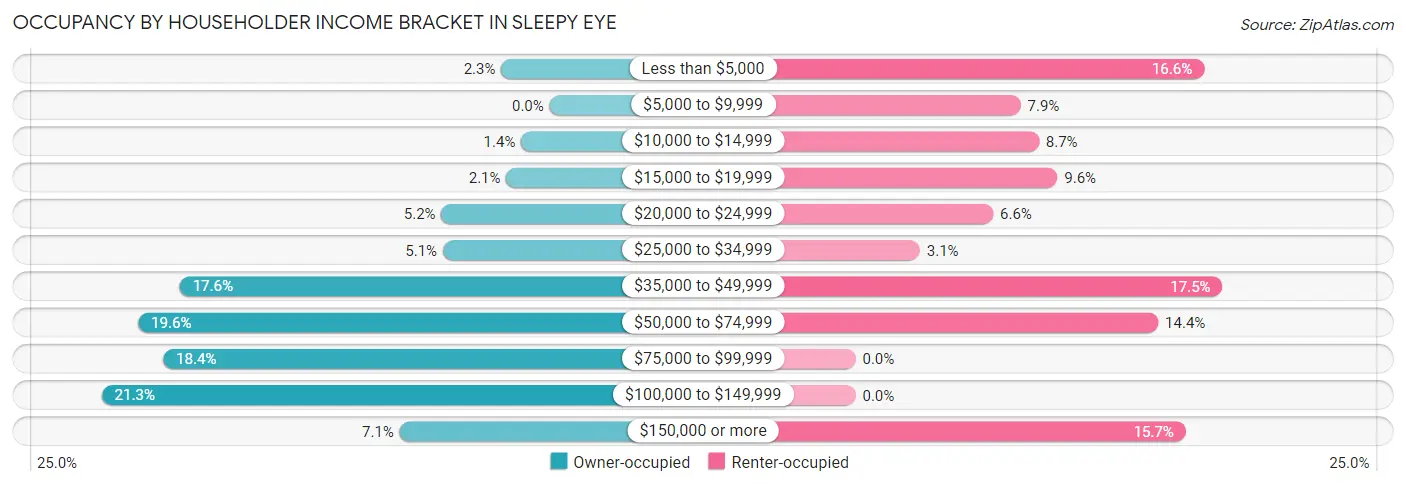
| Income Bracket | Owner-occupied | Renter-occupied |
| Less than $5,000 | 29 (2.3%) | 38 (16.6%) |
| $5,000 to $9,999 | 0 (0.0%) | 18 (7.9%) |
| $10,000 to $14,999 | 17 (1.3%) | 20 (8.7%) |
| $15,000 to $19,999 | 26 (2.1%) | 22 (9.6%) |
| $20,000 to $24,999 | 65 (5.1%) | 15 (6.6%) |
| $25,000 to $34,999 | 64 (5.1%) | 7 (3.1%) |
| $35,000 to $49,999 | 222 (17.6%) | 40 (17.5%) |
| $50,000 to $74,999 | 247 (19.6%) | 33 (14.4%) |
| $75,000 to $99,999 | 232 (18.4%) | 0 (0.0%) |
| $100,000 to $149,999 | 269 (21.3%) | 0 (0.0%) |
| $150,000 or more | 90 (7.1%) | 36 (15.7%) |
| Total | 1,261 (100.0%) | 229 (100.0%) |
Monthly Housing Cost Tiers in Sleepy Eye
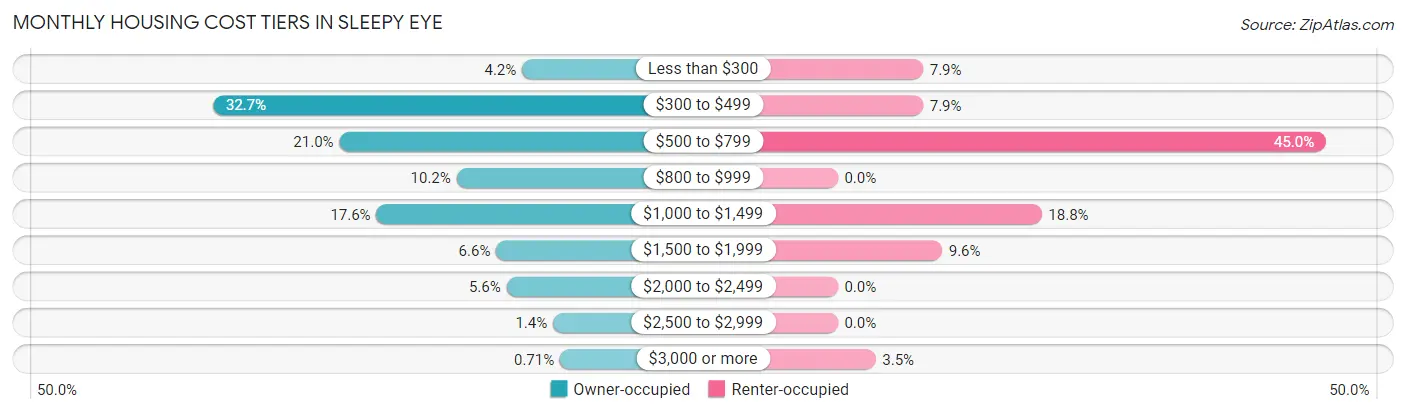
| Monthly Cost | Owner-occupied | Renter-occupied |
| Less than $300 | 53 (4.2%) | 18 (7.9%) |
| $300 to $499 | 412 (32.7%) | 18 (7.9%) |
| $500 to $799 | 265 (21.0%) | 103 (45.0%) |
| $800 to $999 | 129 (10.2%) | 0 (0.0%) |
| $1,000 to $1,499 | 222 (17.6%) | 43 (18.8%) |
| $1,500 to $1,999 | 83 (6.6%) | 22 (9.6%) |
| $2,000 to $2,499 | 71 (5.6%) | 0 (0.0%) |
| $2,500 to $2,999 | 17 (1.3%) | 0 (0.0%) |
| $3,000 or more | 9 (0.7%) | 8 (3.5%) |
| Total | 1,261 (100.0%) | 229 (100.0%) |
Physical Housing Characteristics in Sleepy Eye
Housing Structures in Sleepy Eye
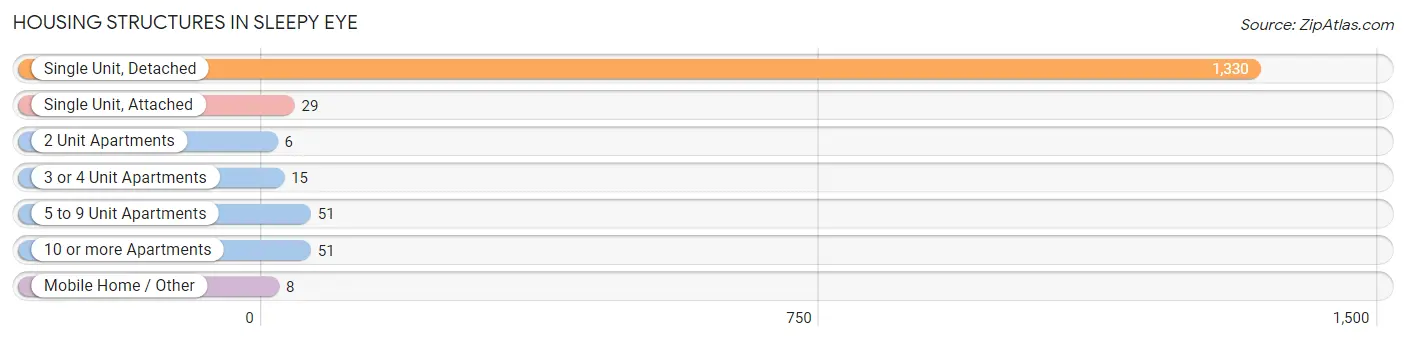
| Structure Type | # Housing Units | % Housing Units |
| Single Unit, Detached | 1,330 | 89.3% |
| Single Unit, Attached | 29 | 1.9% |
| 2 Unit Apartments | 6 | 0.4% |
| 3 or 4 Unit Apartments | 15 | 1.0% |
| 5 to 9 Unit Apartments | 51 | 3.4% |
| 10 or more Apartments | 51 | 3.4% |
| Mobile Home / Other | 8 | 0.5% |
| Total | 1,490 | 100.0% |
Housing Structures by Occupancy in Sleepy Eye
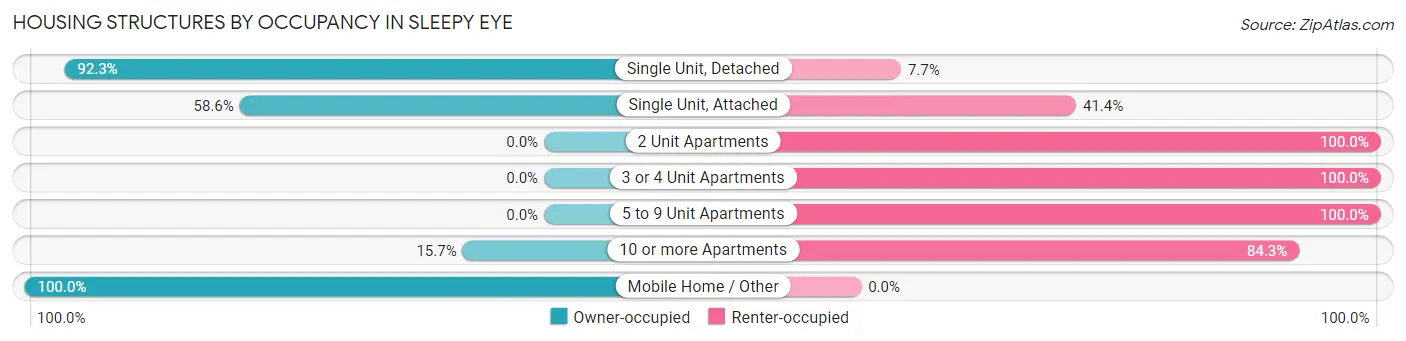
| Structure Type | Owner-occupied | Renter-occupied |
| Single Unit, Detached | 1,228 (92.3%) | 102 (7.7%) |
| Single Unit, Attached | 17 (58.6%) | 12 (41.4%) |
| 2 Unit Apartments | 0 (0.0%) | 6 (100.0%) |
| 3 or 4 Unit Apartments | 0 (0.0%) | 15 (100.0%) |
| 5 to 9 Unit Apartments | 0 (0.0%) | 51 (100.0%) |
| 10 or more Apartments | 8 (15.7%) | 43 (84.3%) |
| Mobile Home / Other | 8 (100.0%) | 0 (0.0%) |
| Total | 1,261 (84.6%) | 229 (15.4%) |
Housing Structures by Number of Rooms in Sleepy Eye
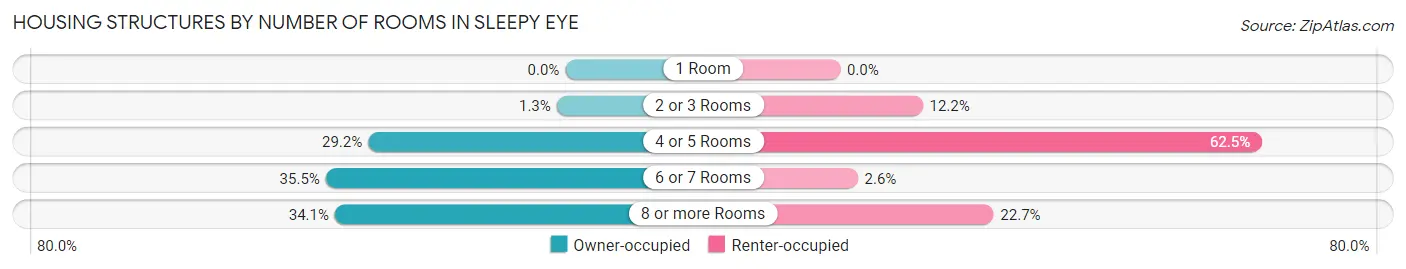
| Number of Rooms | Owner-occupied | Renter-occupied |
| 1 Room | 0 (0.0%) | 0 (0.0%) |
| 2 or 3 Rooms | 16 (1.3%) | 28 (12.2%) |
| 4 or 5 Rooms | 368 (29.2%) | 143 (62.5%) |
| 6 or 7 Rooms | 447 (35.4%) | 6 (2.6%) |
| 8 or more Rooms | 430 (34.1%) | 52 (22.7%) |
| Total | 1,261 (100.0%) | 229 (100.0%) |
Housing Structure by Heating Type in Sleepy Eye
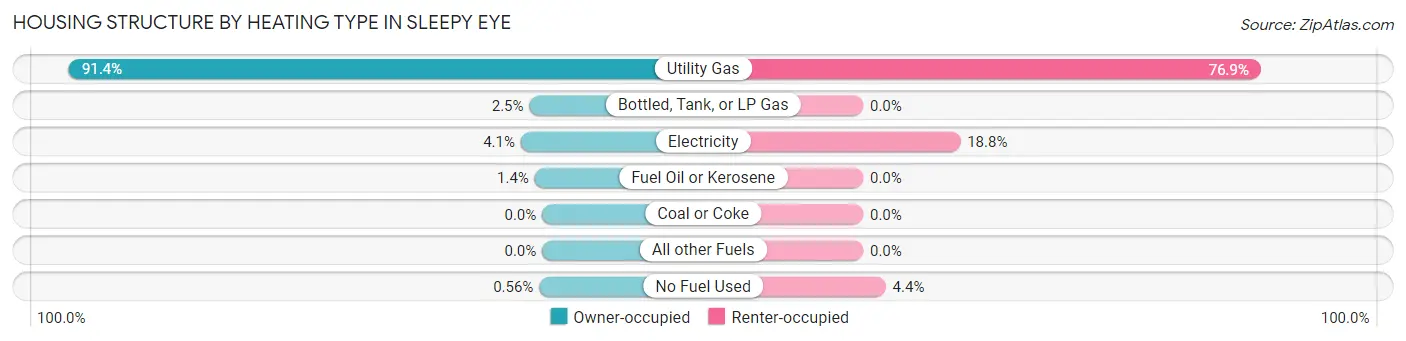
| Heating Type | Owner-occupied | Renter-occupied |
| Utility Gas | 1,153 (91.4%) | 176 (76.9%) |
| Bottled, Tank, or LP Gas | 31 (2.5%) | 0 (0.0%) |
| Electricity | 52 (4.1%) | 43 (18.8%) |
| Fuel Oil or Kerosene | 18 (1.4%) | 0 (0.0%) |
| Coal or Coke | 0 (0.0%) | 0 (0.0%) |
| All other Fuels | 0 (0.0%) | 0 (0.0%) |
| No Fuel Used | 7 (0.6%) | 10 (4.4%) |
| Total | 1,261 (100.0%) | 229 (100.0%) |
Household Vehicle Usage in Sleepy Eye
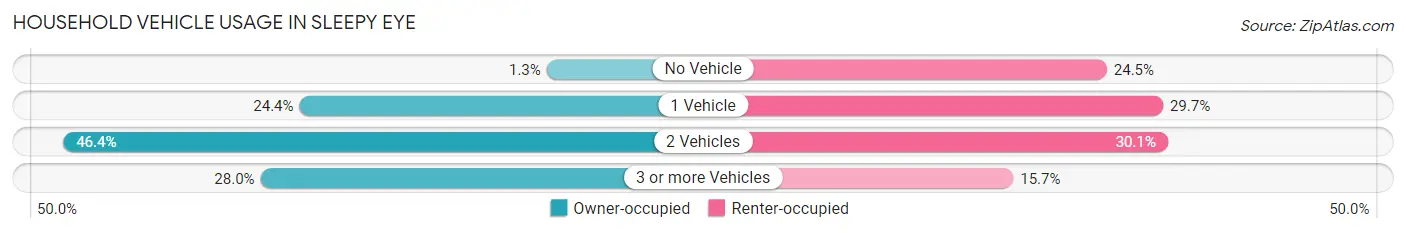
| Vehicles per Household | Owner-occupied | Renter-occupied |
| No Vehicle | 16 (1.3%) | 56 (24.4%) |
| 1 Vehicle | 307 (24.3%) | 68 (29.7%) |
| 2 Vehicles | 585 (46.4%) | 69 (30.1%) |
| 3 or more Vehicles | 353 (28.0%) | 36 (15.7%) |
| Total | 1,261 (100.0%) | 229 (100.0%) |
Real Estate & Mortgages in Sleepy Eye
Real Estate and Mortgage Overview in Sleepy Eye
| Characteristic | Without Mortgage | With Mortgage |
| Housing Units | 614 | 647 |
| Median Property Value | $127,400 | $132,600 |
| Median Household Income | $75,417 | $62 |
| Monthly Housing Costs | $409 | $9 |
| Real Estate Taxes | $1,259 | $0 |
Property Value by Mortgage Status in Sleepy Eye
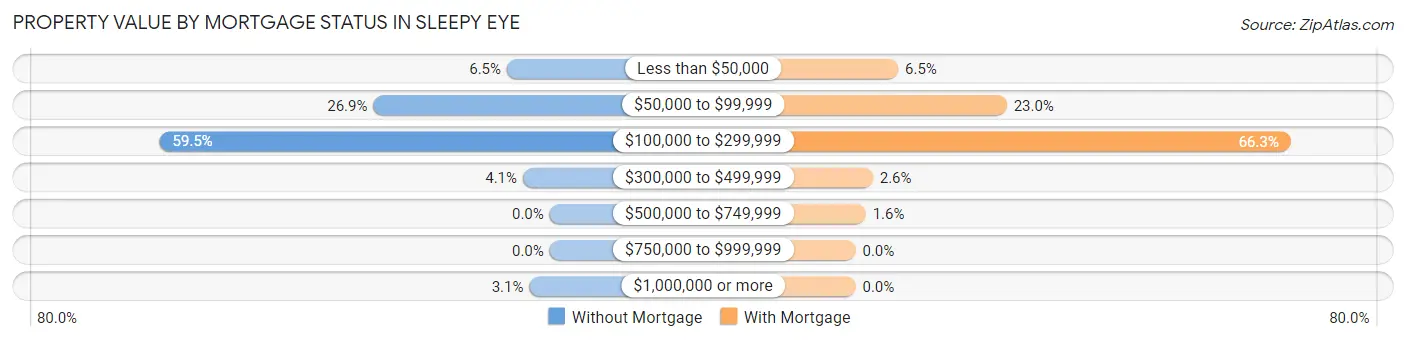
| Property Value | Without Mortgage | With Mortgage |
| Less than $50,000 | 40 (6.5%) | 42 (6.5%) |
| $50,000 to $99,999 | 165 (26.9%) | 149 (23.0%) |
| $100,000 to $299,999 | 365 (59.5%) | 429 (66.3%) |
| $300,000 to $499,999 | 25 (4.1%) | 17 (2.6%) |
| $500,000 to $749,999 | 0 (0.0%) | 10 (1.5%) |
| $750,000 to $999,999 | 0 (0.0%) | 0 (0.0%) |
| $1,000,000 or more | 19 (3.1%) | 0 (0.0%) |
| Total | 614 (100.0%) | 647 (100.0%) |
Household Income by Mortgage Status in Sleepy Eye
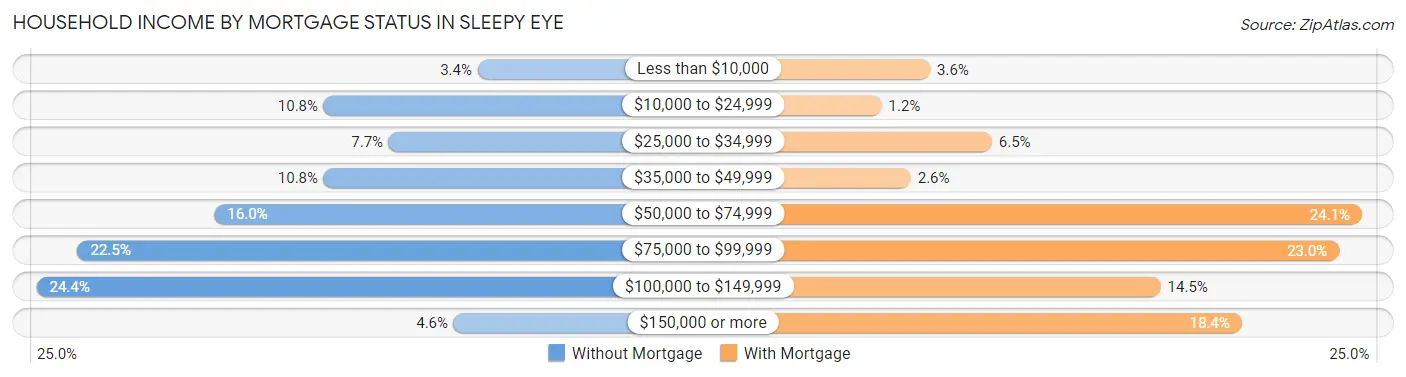
| Household Income | Without Mortgage | With Mortgage |
| Less than $10,000 | 21 (3.4%) | 23 (3.5%) |
| $10,000 to $24,999 | 66 (10.7%) | 8 (1.2%) |
| $25,000 to $34,999 | 47 (7.6%) | 42 (6.5%) |
| $35,000 to $49,999 | 66 (10.7%) | 17 (2.6%) |
| $50,000 to $74,999 | 98 (16.0%) | 156 (24.1%) |
| $75,000 to $99,999 | 138 (22.5%) | 149 (23.0%) |
| $100,000 to $149,999 | 150 (24.4%) | 94 (14.5%) |
| $150,000 or more | 28 (4.6%) | 119 (18.4%) |
| Total | 614 (100.0%) | 647 (100.0%) |
Property Value to Household Income Ratio in Sleepy Eye
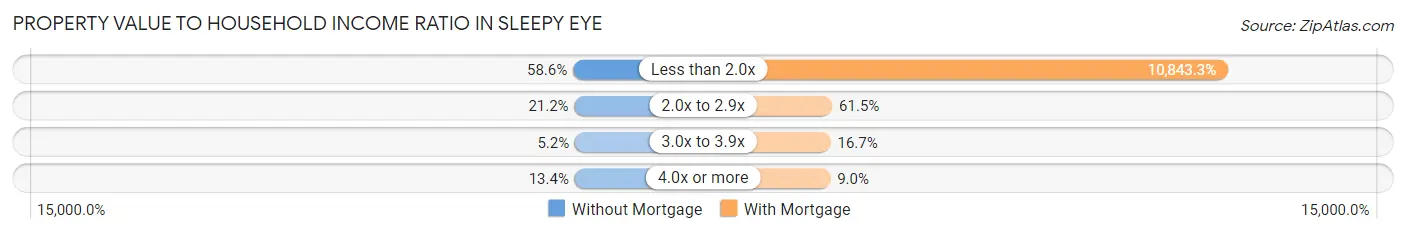
| Value-to-Income Ratio | Without Mortgage | With Mortgage |
| Less than 2.0x | 360 (58.6%) | 70,156 (10,843.3%) |
| 2.0x to 2.9x | 130 (21.2%) | 398 (61.5%) |
| 3.0x to 3.9x | 32 (5.2%) | 108 (16.7%) |
| 4.0x or more | 82 (13.4%) | 58 (9.0%) |
| Total | 614 (100.0%) | 647 (100.0%) |
Real Estate Taxes by Mortgage Status in Sleepy Eye
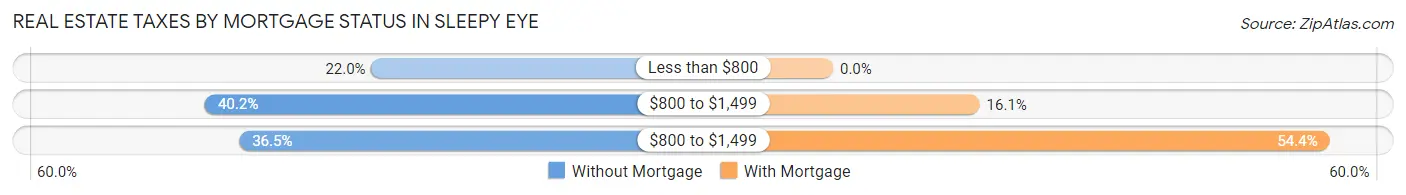
| Property Taxes | Without Mortgage | With Mortgage |
| Less than $800 | 135 (22.0%) | 0 (0.0%) |
| $800 to $1,499 | 247 (40.2%) | 104 (16.1%) |
| $800 to $1,499 | 224 (36.5%) | 352 (54.4%) |
| Total | 614 (100.0%) | 647 (100.0%) |
Health & Disability in Sleepy Eye
Health Insurance Coverage by Age in Sleepy Eye
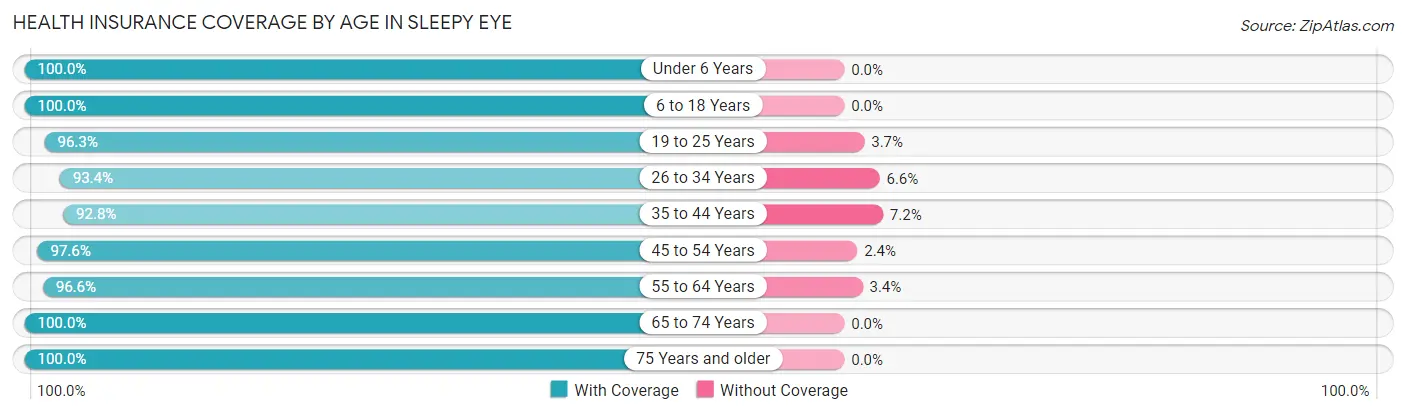
| Age Bracket | With Coverage | Without Coverage |
| Under 6 Years | 270 (100.0%) | 0 (0.0%) |
| 6 to 18 Years | 463 (100.0%) | 0 (0.0%) |
| 19 to 25 Years | 284 (96.3%) | 11 (3.7%) |
| 26 to 34 Years | 370 (93.4%) | 26 (6.6%) |
| 35 to 44 Years | 374 (92.8%) | 29 (7.2%) |
| 45 to 54 Years | 363 (97.6%) | 9 (2.4%) |
| 55 to 64 Years | 483 (96.6%) | 17 (3.4%) |
| 65 to 74 Years | 489 (100.0%) | 0 (0.0%) |
| 75 Years and older | 149 (100.0%) | 0 (0.0%) |
| Total | 3,245 (97.2%) | 92 (2.8%) |
Health Insurance Coverage by Citizenship Status in Sleepy Eye
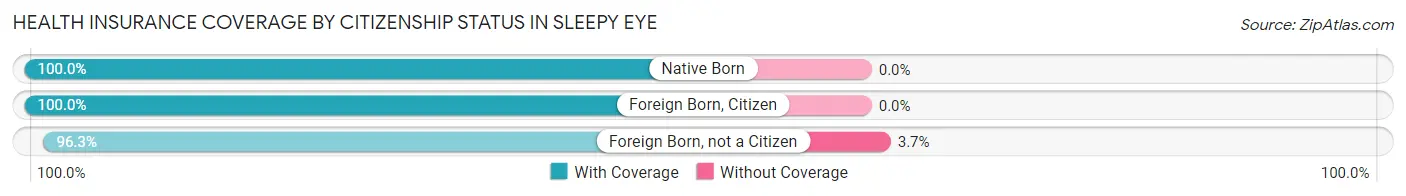
| Citizenship Status | With Coverage | Without Coverage |
| Native Born | 270 (100.0%) | 0 (0.0%) |
| Foreign Born, Citizen | 463 (100.0%) | 0 (0.0%) |
| Foreign Born, not a Citizen | 284 (96.3%) | 11 (3.7%) |
Health Insurance Coverage by Household Income in Sleepy Eye
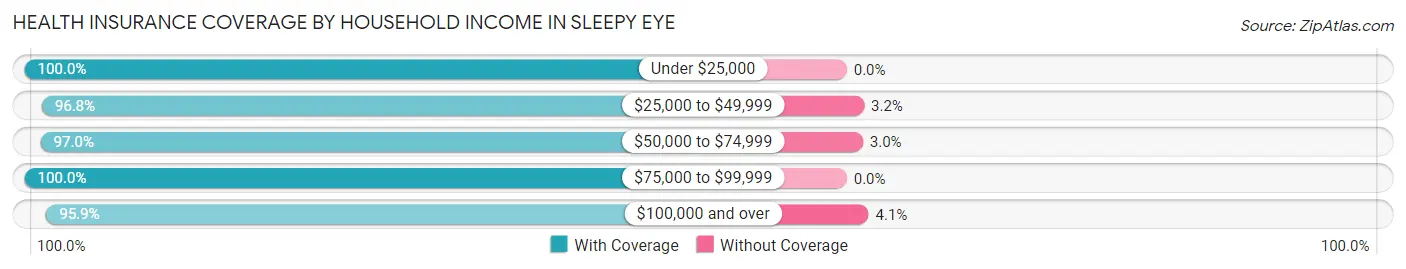
| Household Income | With Coverage | Without Coverage |
| Under $25,000 | 297 (100.0%) | 0 (0.0%) |
| $25,000 to $49,999 | 657 (96.8%) | 22 (3.2%) |
| $50,000 to $74,999 | 547 (97.0%) | 17 (3.0%) |
| $75,000 to $99,999 | 535 (100.0%) | 0 (0.0%) |
| $100,000 and over | 1,199 (95.9%) | 51 (4.1%) |
Public vs Private Health Insurance Coverage by Age in Sleepy Eye
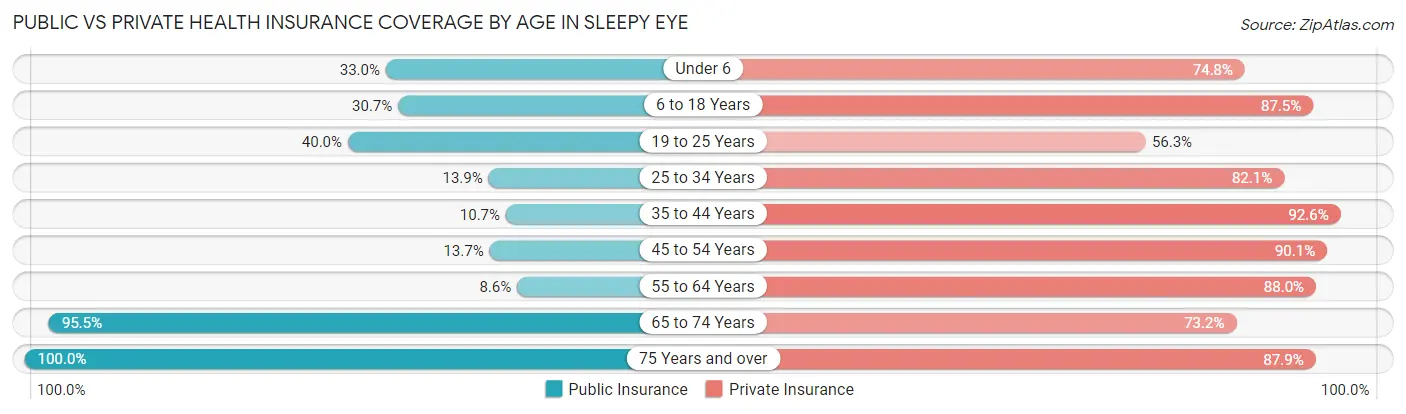
| Age Bracket | Public Insurance | Private Insurance |
| Under 6 | 89 (33.0%) | 202 (74.8%) |
| 6 to 18 Years | 142 (30.7%) | 405 (87.5%) |
| 19 to 25 Years | 118 (40.0%) | 166 (56.3%) |
| 25 to 34 Years | 55 (13.9%) | 325 (82.1%) |
| 35 to 44 Years | 43 (10.7%) | 373 (92.6%) |
| 45 to 54 Years | 51 (13.7%) | 335 (90.0%) |
| 55 to 64 Years | 43 (8.6%) | 440 (88.0%) |
| 65 to 74 Years | 467 (95.5%) | 358 (73.2%) |
| 75 Years and over | 149 (100.0%) | 131 (87.9%) |
| Total | 1,157 (34.7%) | 2,735 (82.0%) |
Disability Status by Sex by Age in Sleepy Eye
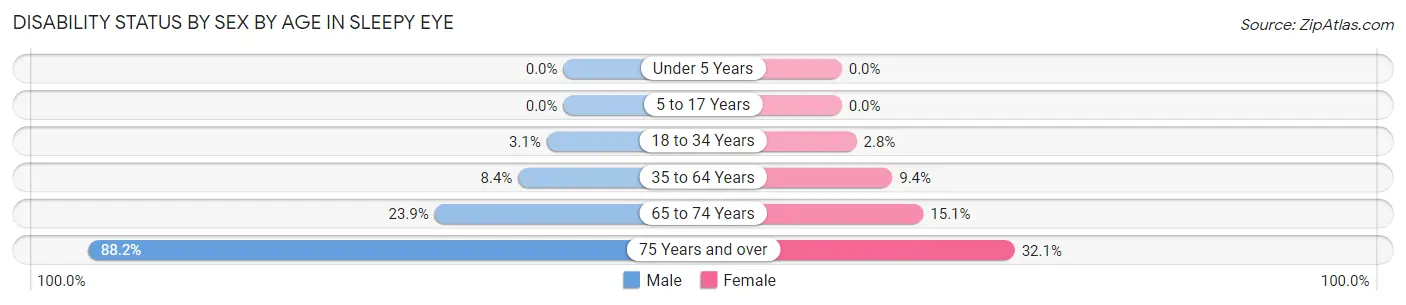
| Age Bracket | Male | Female |
| Under 5 Years | 0 (0.0%) | 0 (0.0%) |
| 5 to 17 Years | 0 (0.0%) | 0 (0.0%) |
| 18 to 34 Years | 13 (3.1%) | 9 (2.8%) |
| 35 to 64 Years | 63 (8.4%) | 49 (9.4%) |
| 65 to 74 Years | 49 (23.9%) | 43 (15.1%) |
| 75 Years and over | 60 (88.2%) | 26 (32.1%) |
Disability Class by Sex by Age in Sleepy Eye
Disability Class: Hearing Difficulty
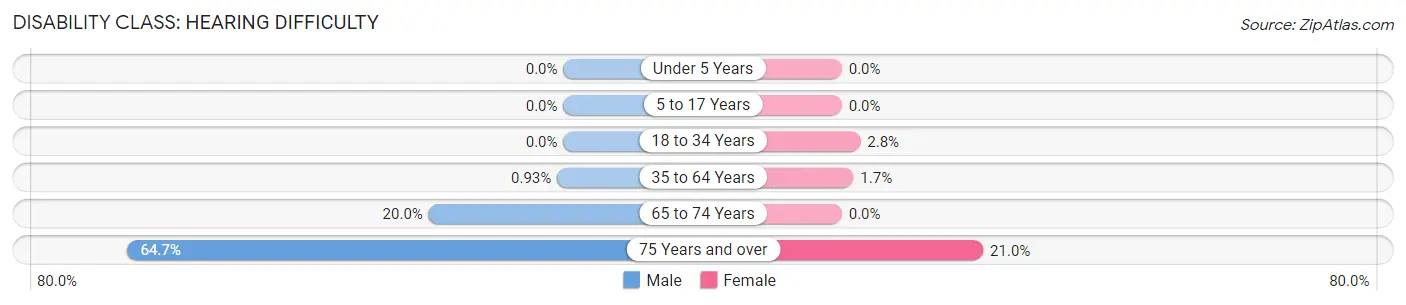
| Age Bracket | Male | Female |
| Under 5 Years | 0 (0.0%) | 0 (0.0%) |
| 5 to 17 Years | 0 (0.0%) | 0 (0.0%) |
| 18 to 34 Years | 0 (0.0%) | 9 (2.8%) |
| 35 to 64 Years | 7 (0.9%) | 9 (1.7%) |
| 65 to 74 Years | 41 (20.0%) | 0 (0.0%) |
| 75 Years and over | 44 (64.7%) | 17 (21.0%) |
Disability Class: Vision Difficulty
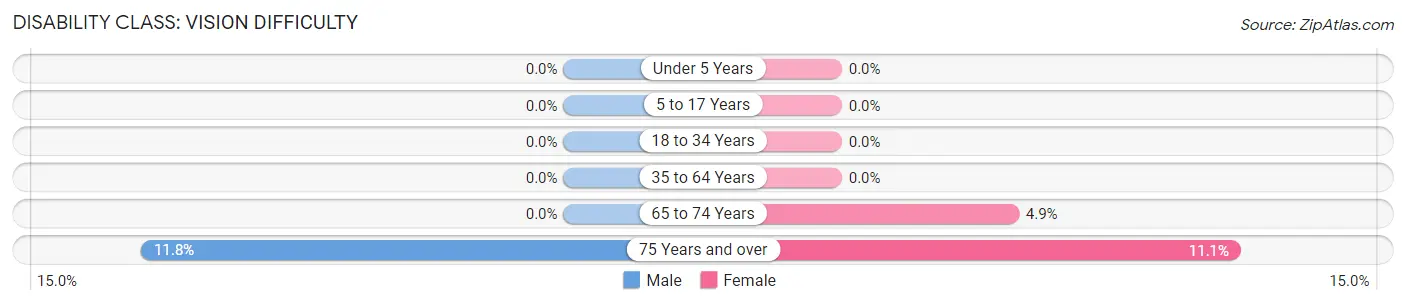
| Age Bracket | Male | Female |
| Under 5 Years | 0 (0.0%) | 0 (0.0%) |
| 5 to 17 Years | 0 (0.0%) | 0 (0.0%) |
| 18 to 34 Years | 0 (0.0%) | 0 (0.0%) |
| 35 to 64 Years | 0 (0.0%) | 0 (0.0%) |
| 65 to 74 Years | 0 (0.0%) | 14 (4.9%) |
| 75 Years and over | 8 (11.8%) | 9 (11.1%) |
Disability Class: Cognitive Difficulty
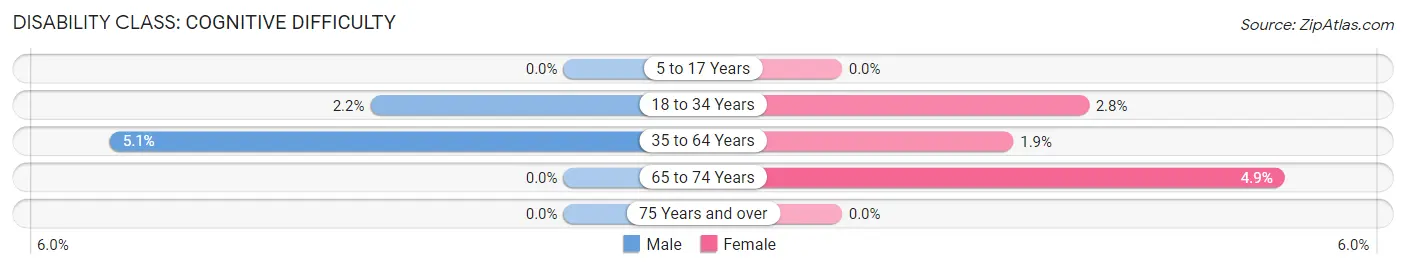
| Age Bracket | Male | Female |
| 5 to 17 Years | 0 (0.0%) | 0 (0.0%) |
| 18 to 34 Years | 9 (2.1%) | 9 (2.8%) |
| 35 to 64 Years | 38 (5.1%) | 10 (1.9%) |
| 65 to 74 Years | 0 (0.0%) | 14 (4.9%) |
| 75 Years and over | 0 (0.0%) | 0 (0.0%) |
Disability Class: Ambulatory Difficulty
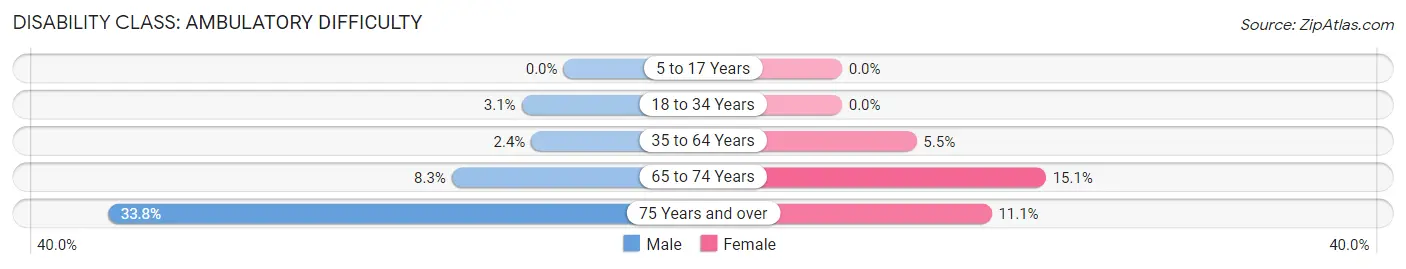
| Age Bracket | Male | Female |
| 5 to 17 Years | 0 (0.0%) | 0 (0.0%) |
| 18 to 34 Years | 13 (3.1%) | 0 (0.0%) |
| 35 to 64 Years | 18 (2.4%) | 29 (5.5%) |
| 65 to 74 Years | 17 (8.3%) | 43 (15.1%) |
| 75 Years and over | 23 (33.8%) | 9 (11.1%) |
Disability Class: Self-Care Difficulty
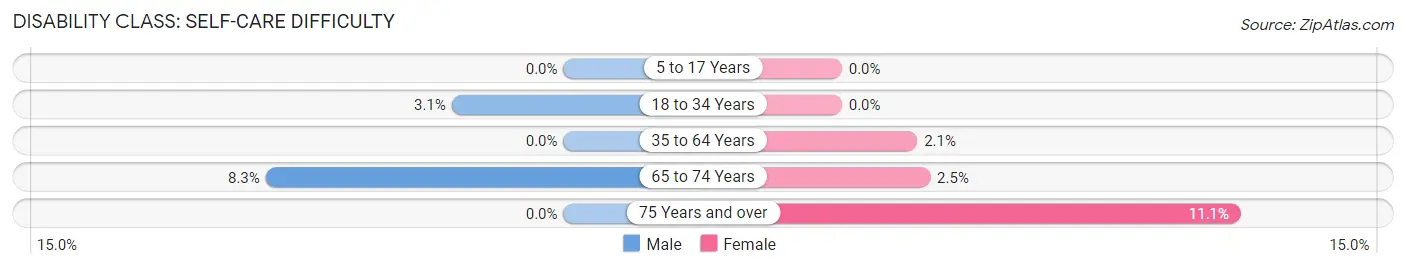
| Age Bracket | Male | Female |
| 5 to 17 Years | 0 (0.0%) | 0 (0.0%) |
| 18 to 34 Years | 13 (3.1%) | 0 (0.0%) |
| 35 to 64 Years | 0 (0.0%) | 11 (2.1%) |
| 65 to 74 Years | 17 (8.3%) | 7 (2.5%) |
| 75 Years and over | 0 (0.0%) | 9 (11.1%) |
Technology Access in Sleepy Eye
Computing Device Access in Sleepy Eye
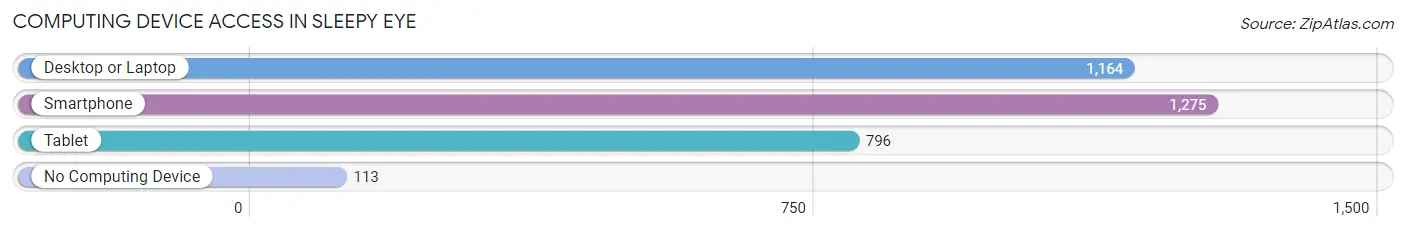
| Device Type | # Households | % Households |
| Desktop or Laptop | 1,164 | 78.1% |
| Smartphone | 1,275 | 85.6% |
| Tablet | 796 | 53.4% |
| No Computing Device | 113 | 7.6% |
| Total | 1,490 | 100.0% |
Internet Access in Sleepy Eye
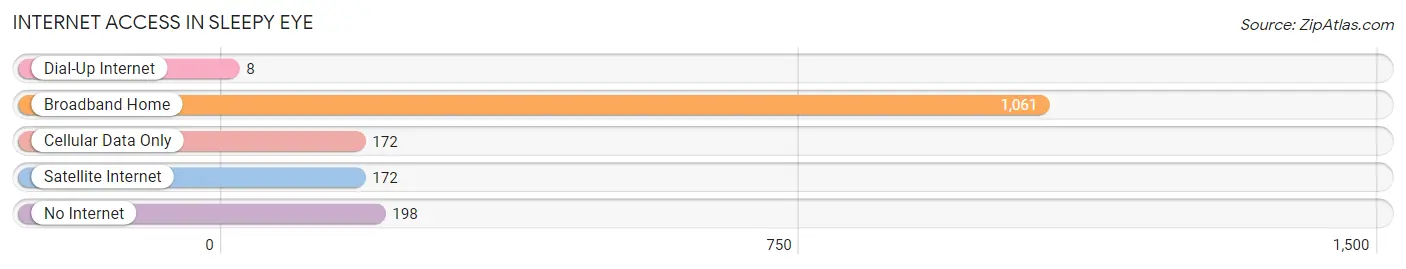
| Internet Type | # Households | % Households |
| Dial-Up Internet | 8 | 0.5% |
| Broadband Home | 1,061 | 71.2% |
| Cellular Data Only | 172 | 11.5% |
| Satellite Internet | 172 | 11.5% |
| No Internet | 198 | 13.3% |
| Total | 1,490 | 100.0% |
Sleepy Eye Summary
Sleepy Eye, Minnesota is a small city located in Brown County in the southwestern part of the state. It is situated on the banks of the Cottonwood River, about 30 miles southwest of Mankato. The city was founded in 1873 and has a population of approximately 3,500 people.
History
The area that is now Sleepy Eye was originally inhabited by the Dakota Sioux. The first white settlers arrived in the area in the late 1860s and the town was officially founded in 1873. The town was named after Chief Sleepy Eye, a Dakota Sioux leader who was known for his peaceful nature.
The town grew quickly in the late 19th century, becoming an important center for trade and commerce. The railroad arrived in 1879, connecting Sleepy Eye to the rest of the state and the nation. The town was incorporated in 1883 and by the turn of the century, it had become a thriving agricultural center.
Geography
Sleepy Eye is located in Brown County in the southwestern part of Minnesota. It is situated on the banks of the Cottonwood River, about 30 miles southwest of Mankato. The city covers an area of 2.3 square miles and has an elevation of 1,072 feet.
The city is surrounded by rolling hills and farmland. The climate is humid continental, with hot summers and cold winters. The average annual temperature is 45 degrees Fahrenheit and the average annual precipitation is 28 inches.
Economy
Sleepy Eye’s economy is largely based on agriculture. The city is home to several large farms, as well as a number of smaller family-owned operations. The city is also home to several manufacturing companies, including a furniture factory and a food processing plant.
The city is also home to a number of small businesses, including restaurants, retail stores, and service providers. The city is also home to a number of tourist attractions, including the Sleepy Eye Historical Museum and the Sleepy Eye Golf Course.
Demographics
As of the 2010 census, Sleepy Eye had a population of 3,521 people. The racial makeup of the city was 97.2% White, 0.3% African American, 0.2% Native American, 0.3% Asian, 0.1% Pacific Islander, 0.7% from other races, and 1.2% from two or more races. Hispanic or Latino of any race were 1.7% of the population.
The median household income in Sleepy Eye was $45,938 and the median family income was $54,844. The per capita income was $20,945. About 8.2% of families and 10.3% of the population were below the poverty line, including 14.2% of those under age 18 and 8.2% of those age 65 or over.
Sleepy Eye is a small city with a rich history and a strong agricultural economy. The city is home to a diverse population and a number of small businesses. The city is also home to a number of tourist attractions, making it a popular destination for visitors from around the state.
Common Questions
What is Per Capita Income in Sleepy Eye?
Per Capita income in Sleepy Eye is $35,170.
What is the Median Family Income in Sleepy Eye?
Median Family Income in Sleepy Eye is $90,556.
What is the Median Household income in Sleepy Eye?
Median Household Income in Sleepy Eye is $63,163.
What is Income or Wage Gap in Sleepy Eye?
Income or Wage Gap in Sleepy Eye is 40.5%.
Women in Sleepy Eye earn 59.5 cents for every dollar earned by a man.
What is Inequality or Gini Index in Sleepy Eye?
Inequality or Gini Index in Sleepy Eye is 0.43.
What is the Total Population of Sleepy Eye?
Total Population of Sleepy Eye is 3,452.
What is the Total Male Population of Sleepy Eye?
Total Male Population of Sleepy Eye is 1,788.
What is the Total Female Population of Sleepy Eye?
Total Female Population of Sleepy Eye is 1,664.
What is the Ratio of Males per 100 Females in Sleepy Eye?
There are 107.45 Males per 100 Females in Sleepy Eye.
What is the Ratio of Females per 100 Males in Sleepy Eye?
There are 93.06 Females per 100 Males in Sleepy Eye.
What is the Median Population Age in Sleepy Eye?
Median Population Age in Sleepy Eye is 41.9 Years.
What is the Average Family Size in Sleepy Eye
Average Family Size in Sleepy Eye is 2.8 People.
What is the Average Household Size in Sleepy Eye
Average Household Size in Sleepy Eye is 2.2 People.
How Large is the Labor Force in Sleepy Eye?
There are 1,902 People in the Labor Forcein in Sleepy Eye.
What is the Percentage of People in the Labor Force in Sleepy Eye?
67.7% of People are in the Labor Force in Sleepy Eye.
What is the Unemployment Rate in Sleepy Eye?
Unemployment Rate in Sleepy Eye is 4.2%.