Silver Lake, MN Map & Demographics
Silver Lake Map
Silver Lake Overview
$36,828
PER CAPITA INCOME
$80,500
AVG FAMILY INCOME
$70,547
AVG HOUSEHOLD INCOME
26.3%
WAGE / INCOME GAP [ % ]
73.7¢/ $1
WAGE / INCOME GAP [ $ ]
0.30
INEQUALITY / GINI INDEX
822
TOTAL POPULATION
435
MALE POPULATION
387
FEMALE POPULATION
112.40
MALES / 100 FEMALES
88.97
FEMALES / 100 MALES
42.1
MEDIAN AGE
3.3
AVG FAMILY SIZE
2.3
AVG HOUSEHOLD SIZE
468
LABOR FORCE [ PEOPLE ]
66.9%
PERCENT IN LABOR FORCE
7.5%
UNEMPLOYMENT RATE
Silver Lake Zip Codes
Silver Lake Area Codes
Income in Silver Lake
Income Overview in Silver Lake
Per Capita Income in Silver Lake is $36,828, while median incomes of families and households are $80,500 and $70,547 respectively.
| Characteristic | Number | Measure |
| Per Capita Income | 822 | $36,828 |
| Median Family Income | 182 | $80,500 |
| Mean Family Income | 182 | $92,489 |
| Median Household Income | 351 | $70,547 |
| Mean Household Income | 351 | $81,843 |
| Income Deficit | 182 | $0 |
| Wage / Income Gap (%) | 822 | 26.31% |
| Wage / Income Gap ($) | 822 | 73.69¢ per $1 |
| Gini / Inequality Index | 822 | 0.30 |
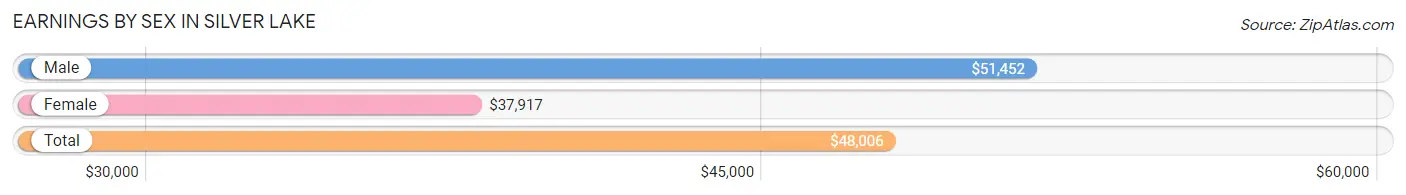
Earnings by Sex in Silver Lake
Average Earnings in Silver Lake are $48,006, $51,452 for men and $37,917 for women, a difference of 26.3%.
| Sex | Number | Average Earnings |
| Male | 282 (60.9%) | $51,452 |
| Female | 181 (39.1%) | $37,917 |
| Total | 463 (100.0%) | $48,006 |
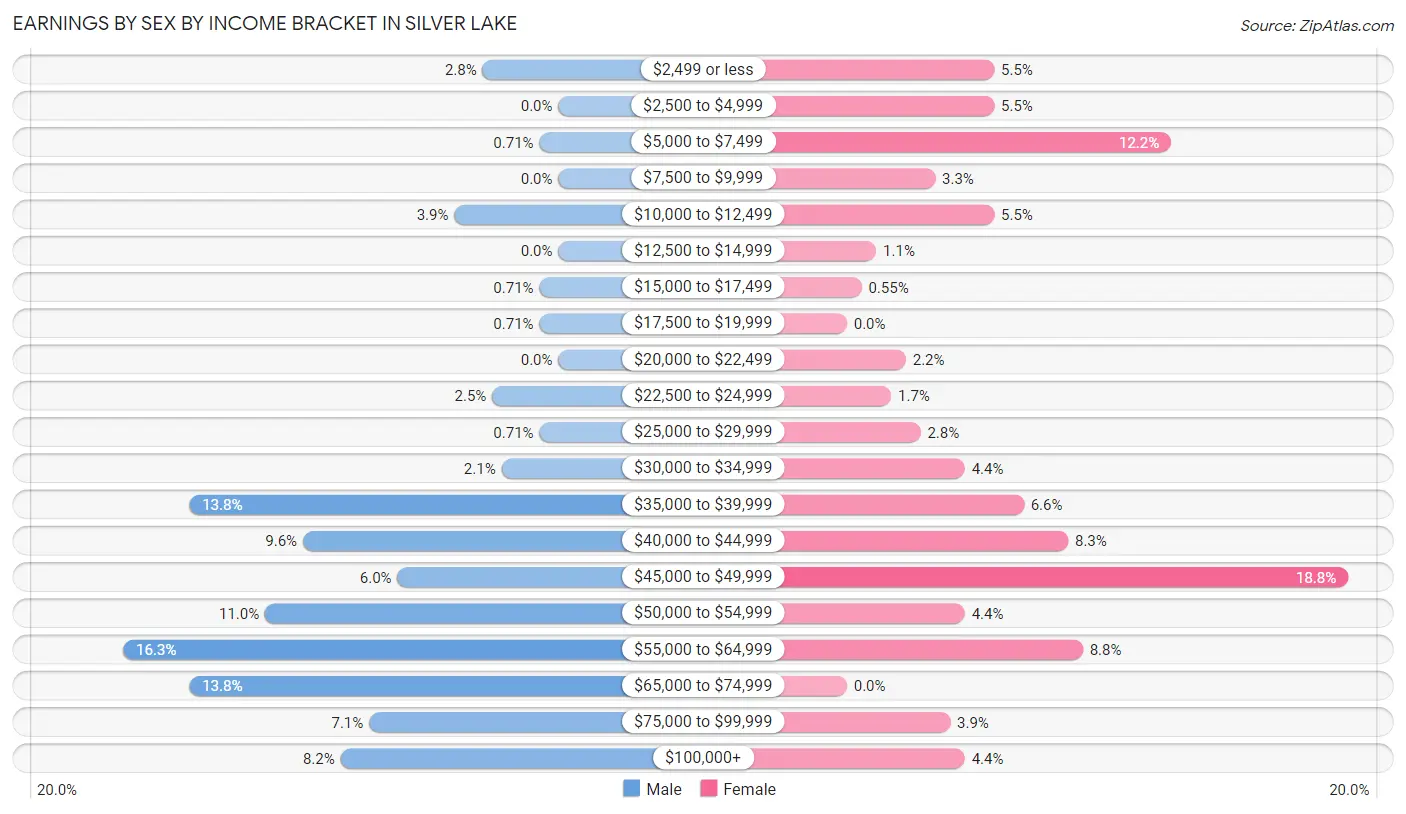
Earnings by Sex by Income Bracket in Silver Lake
The most common earnings brackets in Silver Lake are $55,000 to $64,999 for men (46 | 16.3%) and $45,000 to $49,999 for women (34 | 18.8%).
| Income | Male | Female |
| $2,499 or less | 8 (2.8%) | 10 (5.5%) |
| $2,500 to $4,999 | 0 (0.0%) | 10 (5.5%) |
| $5,000 to $7,499 | 2 (0.7%) | 22 (12.1%) |
| $7,500 to $9,999 | 0 (0.0%) | 6 (3.3%) |
| $10,000 to $12,499 | 11 (3.9%) | 10 (5.5%) |
| $12,500 to $14,999 | 0 (0.0%) | 2 (1.1%) |
| $15,000 to $17,499 | 2 (0.7%) | 1 (0.5%) |
| $17,500 to $19,999 | 2 (0.7%) | 0 (0.0%) |
| $20,000 to $22,499 | 0 (0.0%) | 4 (2.2%) |
| $22,500 to $24,999 | 7 (2.5%) | 3 (1.7%) |
| $25,000 to $29,999 | 2 (0.7%) | 5 (2.8%) |
| $30,000 to $34,999 | 6 (2.1%) | 8 (4.4%) |
| $35,000 to $39,999 | 39 (13.8%) | 12 (6.6%) |
| $40,000 to $44,999 | 27 (9.6%) | 15 (8.3%) |
| $45,000 to $49,999 | 17 (6.0%) | 34 (18.8%) |
| $50,000 to $54,999 | 31 (11.0%) | 8 (4.4%) |
| $55,000 to $64,999 | 46 (16.3%) | 16 (8.8%) |
| $65,000 to $74,999 | 39 (13.8%) | 0 (0.0%) |
| $75,000 to $99,999 | 20 (7.1%) | 7 (3.9%) |
| $100,000+ | 23 (8.2%) | 8 (4.4%) |
| Total | 282 (100.0%) | 181 (100.0%) |
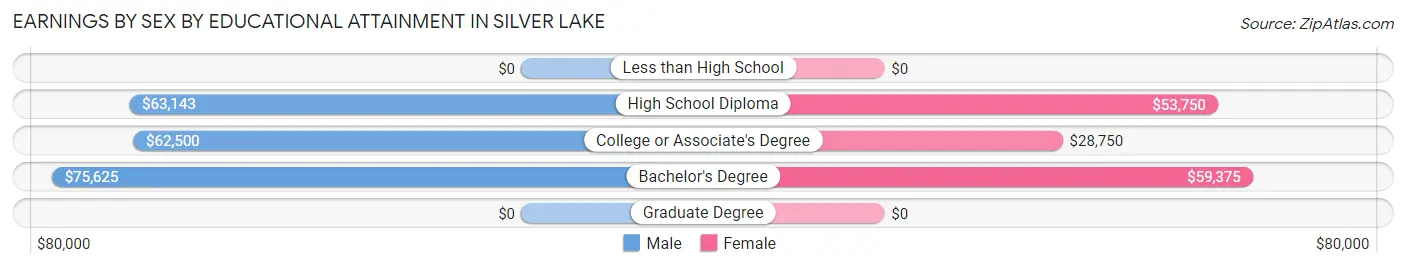
Earnings by Sex by Educational Attainment in Silver Lake
Average earnings in Silver Lake are $51,452 for men and $37,917 for women, a difference of 26.3%. Men with an educational attainment of bachelor's degree enjoy the highest average annual earnings of $75,625, while those with college or associate's degree education earn the least with $62,500. Women with an educational attainment of bachelor's degree earn the most with the average annual earnings of $59,375, while those with college or associate's degree education have the smallest earnings of $28,750.
| Educational Attainment | Male Income | Female Income |
| Less than High School | - | - |
| High School Diploma | $63,143 | $53,750 |
| College or Associate's Degree | $62,500 | $28,750 |
| Bachelor's Degree | $75,625 | $59,375 |
| Graduate Degree | - | - |
| Total | $51,452 | $37,917 |
Family Income in Silver Lake
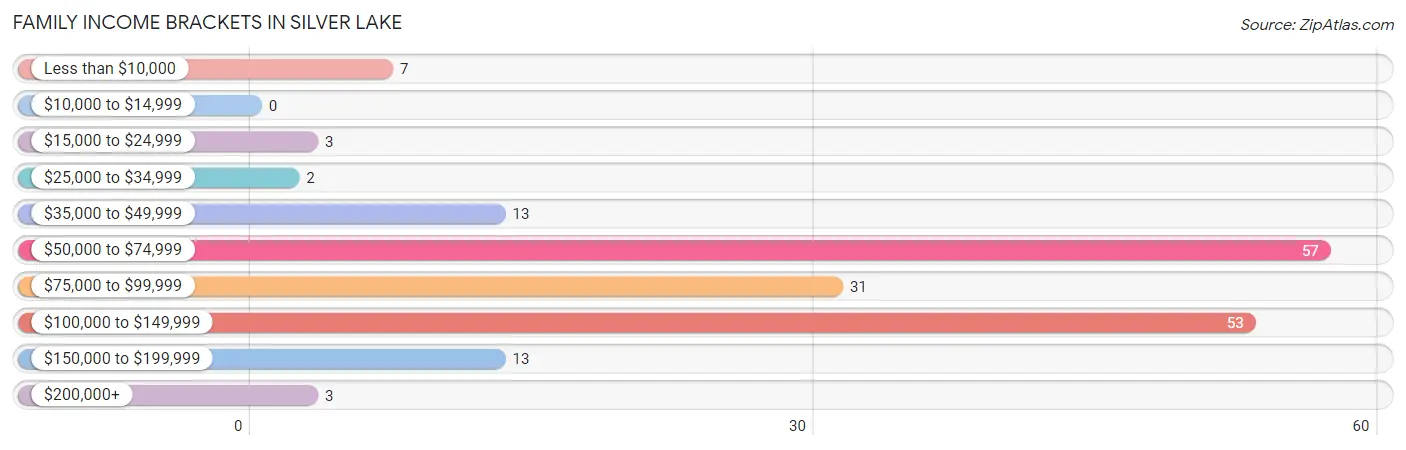
Family Income Brackets in Silver Lake
According to the Silver Lake family income data, there are 57 families falling into the $50,000 to $74,999 income range, which is the most common income bracket and makes up 31.3% of all families.
| Income Bracket | # Families | % Families |
| Less than $10,000 | 7 | 3.8% |
| $10,000 to $14,999 | 0 | 0.0% |
| $15,000 to $24,999 | 3 | 1.6% |
| $25,000 to $34,999 | 2 | 1.1% |
| $35,000 to $49,999 | 13 | 7.1% |
| $50,000 to $74,999 | 57 | 31.3% |
| $75,000 to $99,999 | 31 | 17.0% |
| $100,000 to $149,999 | 53 | 29.1% |
| $150,000 to $199,999 | 13 | 7.1% |
| $200,000+ | 3 | 1.6% |
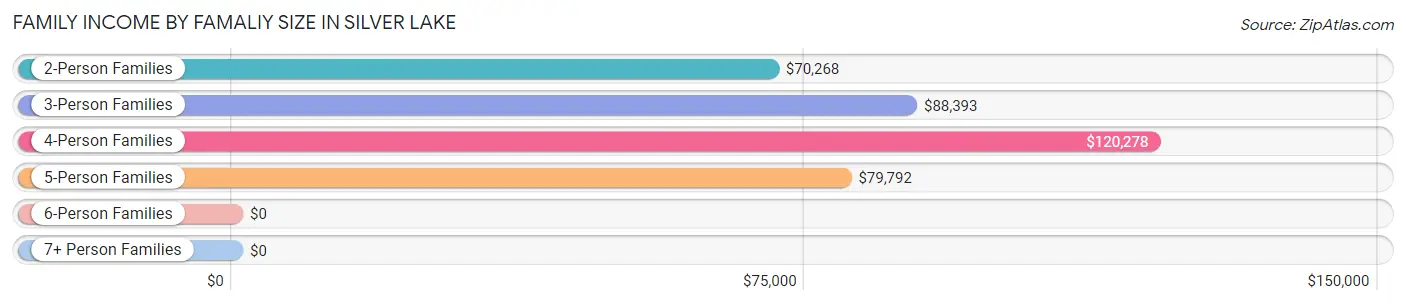
Family Income by Famaliy Size in Silver Lake
4-person families (42 | 23.1%) account for the highest median family income in Silver Lake with $120,278 per family, while 2-person families (97 | 53.3%) have the highest median income of $35,134 per family member.
| Income Bracket | # Families | Median Income |
| 2-Person Families | 97 (53.3%) | $70,268 |
| 3-Person Families | 25 (13.7%) | $88,393 |
| 4-Person Families | 42 (23.1%) | $120,278 |
| 5-Person Families | 11 (6.0%) | $79,792 |
| 6-Person Families | 7 (3.8%) | $0 |
| 7+ Person Families | 0 (0.0%) | $0 |
| Total | 182 (100.0%) | $80,500 |
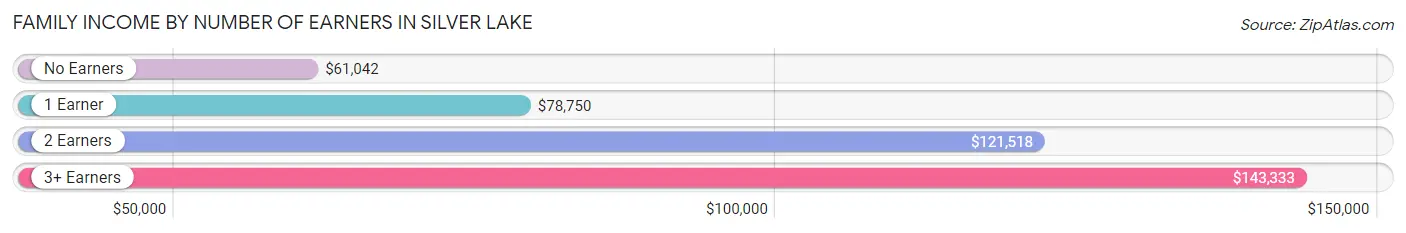
Family Income by Number of Earners in Silver Lake
The median family income in Silver Lake is $80,500, with families comprising 3+ earners (16) having the highest median family income of $143,333, while families with no earners (45) have the lowest median family income of $61,042, accounting for 8.8% and 24.7% of families, respectively.
| Number of Earners | # Families | Median Income |
| No Earners | 45 (24.7%) | $61,042 |
| 1 Earner | 54 (29.7%) | $78,750 |
| 2 Earners | 67 (36.8%) | $121,518 |
| 3+ Earners | 16 (8.8%) | $143,333 |
| Total | 182 (100.0%) | $80,500 |
Household Income in Silver Lake
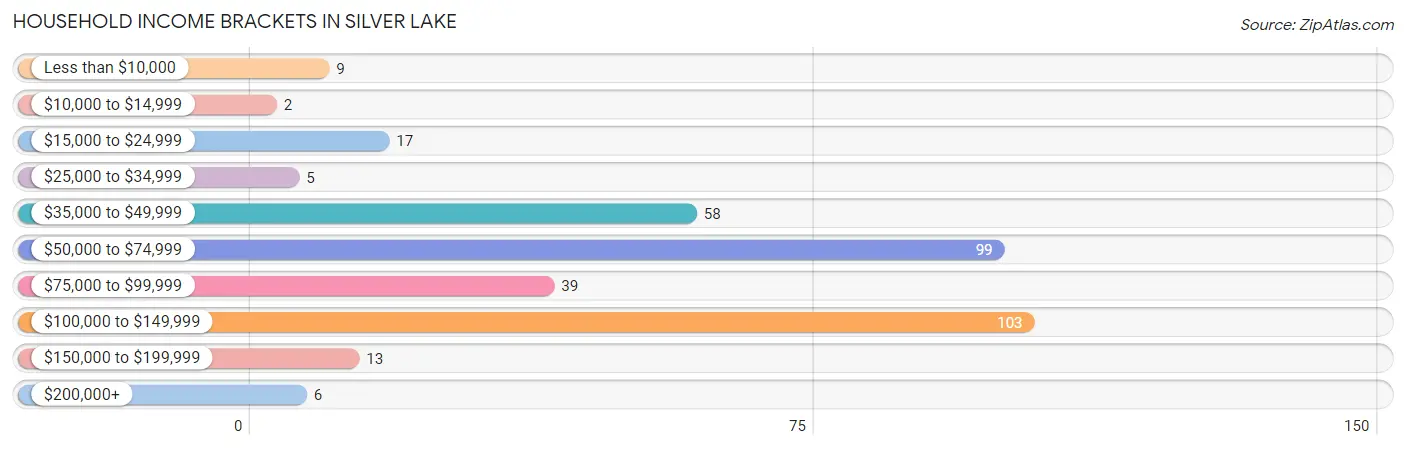
Household Income Brackets in Silver Lake
With 103 households falling in the category, the $100,000 to $149,999 income range is the most frequent in Silver Lake, accounting for 29.3% of all households. In contrast, only 2 households (0.6%) fall into the $10,000 to $14,999 income bracket, making it the least populous group.
| Income Bracket | # Households | % Households |
| Less than $10,000 | 9 | 2.6% |
| $10,000 to $14,999 | 2 | 0.6% |
| $15,000 to $24,999 | 17 | 4.8% |
| $25,000 to $34,999 | 5 | 1.4% |
| $35,000 to $49,999 | 58 | 16.5% |
| $50,000 to $74,999 | 99 | 28.2% |
| $75,000 to $99,999 | 39 | 11.1% |
| $100,000 to $149,999 | 103 | 29.3% |
| $150,000 to $199,999 | 13 | 3.7% |
| $200,000+ | 6 | 1.7% |
Household Income by Householder Age in Silver Lake
The median household income in Silver Lake is $70,547, with the highest median household income of $116,133 found in the 15 to 24 years age bracket for the primary householder. A total of 35 households (10.0%) fall into this category. Meanwhile, the 65+ years age bracket for the primary householder has the lowest median household income of $57,679, with 113 households (32.2%) in this group.
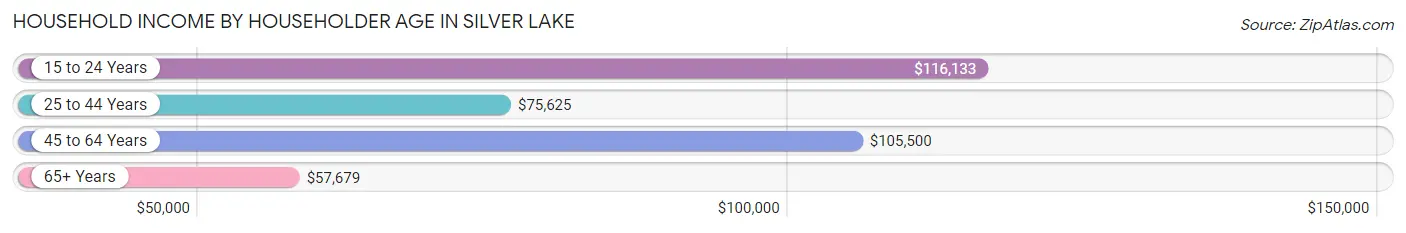
| Income Bracket | # Households | Median Income |
| 15 to 24 Years | 35 (10.0%) | $116,133 |
| 25 to 44 Years | 131 (37.3%) | $75,625 |
| 45 to 64 Years | 72 (20.5%) | $105,500 |
| 65+ Years | 113 (32.2%) | $57,679 |
| Total | 351 (100.0%) | $70,547 |
Poverty in Silver Lake
Income Below Poverty by Sex and Age in Silver Lake
With 4.6% poverty level for males and 5.9% for females among the residents of Silver Lake, 6 to 11 year old males and 16 and 17 year old females are the most vulnerable to poverty, with 6 males (31.6%) and 7 females (29.2%) in their respective age groups living below the poverty level.
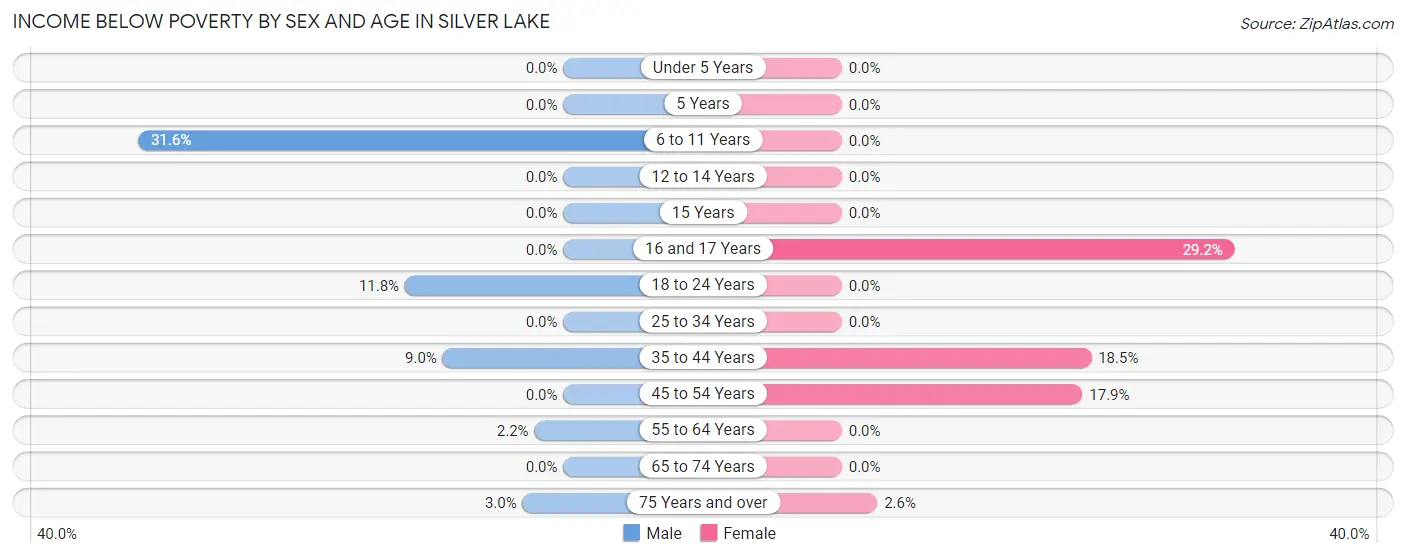
| Age Bracket | Male | Female |
| Under 5 Years | 0 (0.0%) | 0 (0.0%) |
| 5 Years | 0 (0.0%) | 0 (0.0%) |
| 6 to 11 Years | 6 (31.6%) | 0 (0.0%) |
| 12 to 14 Years | 0 (0.0%) | 0 (0.0%) |
| 15 Years | 0 (0.0%) | 0 (0.0%) |
| 16 and 17 Years | 0 (0.0%) | 7 (29.2%) |
| 18 to 24 Years | 4 (11.8%) | 0 (0.0%) |
| 25 to 34 Years | 0 (0.0%) | 0 (0.0%) |
| 35 to 44 Years | 6 (9.0%) | 10 (18.5%) |
| 45 to 54 Years | 0 (0.0%) | 5 (17.9%) |
| 55 to 64 Years | 2 (2.1%) | 0 (0.0%) |
| 65 to 74 Years | 0 (0.0%) | 0 (0.0%) |
| 75 Years and over | 1 (3.0%) | 1 (2.6%) |
| Total | 19 (4.6%) | 23 (5.9%) |
Income Above Poverty by Sex and Age in Silver Lake
According to the poverty statistics in Silver Lake, males aged under 5 years and females aged under 5 years are the age groups that are most secure financially, with 100.0% of males and 100.0% of females in these age groups living above the poverty line.
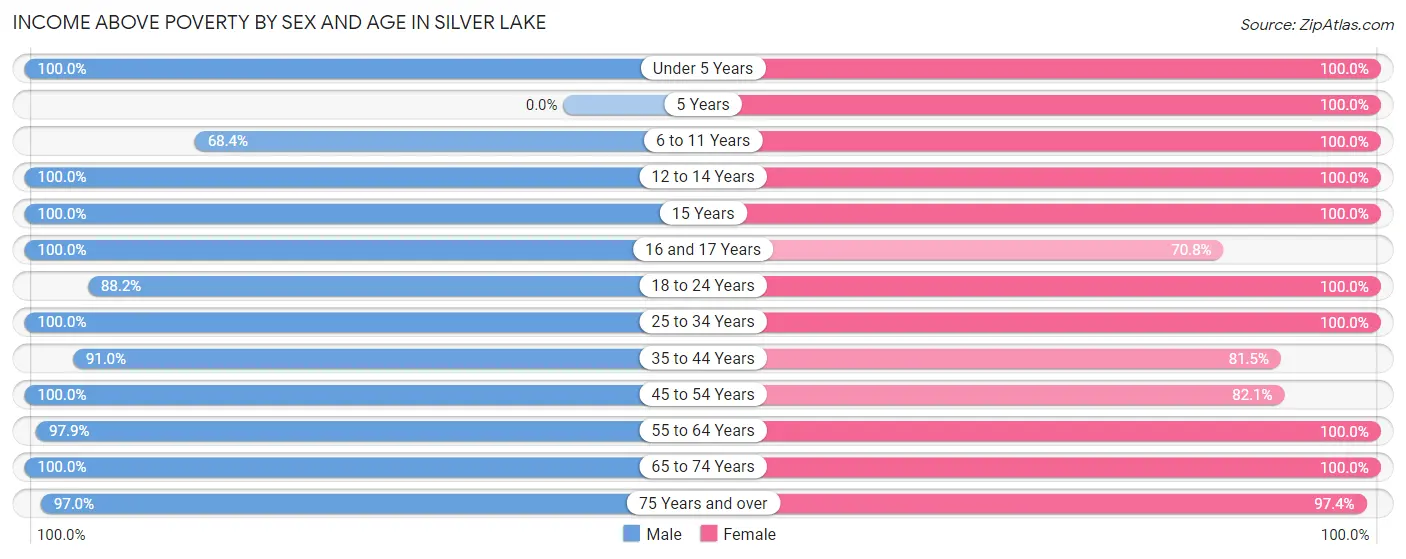
| Age Bracket | Male | Female |
| Under 5 Years | 2 (100.0%) | 21 (100.0%) |
| 5 Years | 0 (0.0%) | 18 (100.0%) |
| 6 to 11 Years | 13 (68.4%) | 26 (100.0%) |
| 12 to 14 Years | 9 (100.0%) | 21 (100.0%) |
| 15 Years | 3 (100.0%) | 3 (100.0%) |
| 16 and 17 Years | 17 (100.0%) | 17 (70.8%) |
| 18 to 24 Years | 30 (88.2%) | 57 (100.0%) |
| 25 to 34 Years | 52 (100.0%) | 26 (100.0%) |
| 35 to 44 Years | 61 (91.0%) | 44 (81.5%) |
| 45 to 54 Years | 30 (100.0%) | 23 (82.1%) |
| 55 to 64 Years | 91 (97.9%) | 36 (100.0%) |
| 65 to 74 Years | 53 (100.0%) | 35 (100.0%) |
| 75 Years and over | 32 (97.0%) | 37 (97.4%) |
| Total | 393 (95.4%) | 364 (94.1%) |
Income Below Poverty Among Married-Couple Families in Silver Lake
The poverty statistics for married-couple families in Silver Lake show that 4.6% or 7 of the total 151 families live below the poverty line. Families with 1 or 2 children have the highest poverty rate of 11.8%, comprising of 6 families. On the other hand, families with 3 or 4 children have the lowest poverty rate of 0.0%, which includes 0 families.
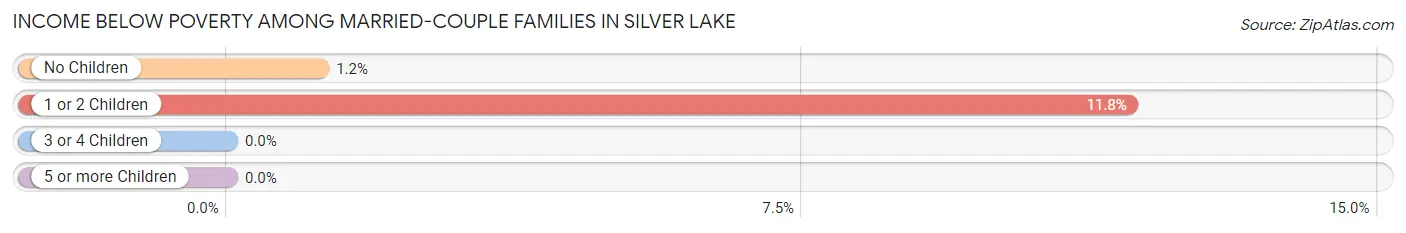
| Children | Above Poverty | Below Poverty |
| No Children | 83 (98.8%) | 1 (1.2%) |
| 1 or 2 Children | 45 (88.2%) | 6 (11.8%) |
| 3 or 4 Children | 16 (100.0%) | 0 (0.0%) |
| 5 or more Children | 0 (0.0%) | 0 (0.0%) |
| Total | 144 (95.4%) | 7 (4.6%) |
Income Below Poverty Among Single-Parent Households in Silver Lake
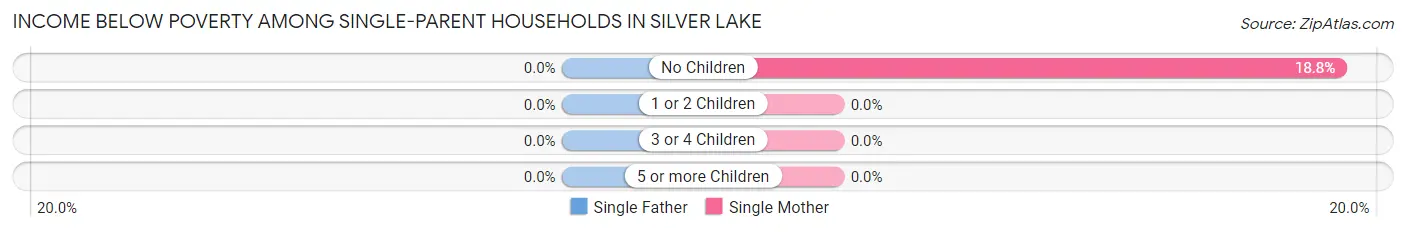
| Children | Single Father | Single Mother |
| No Children | 0 (0.0%) | 3 (18.8%) |
| 1 or 2 Children | 0 (0.0%) | 0 (0.0%) |
| 3 or 4 Children | 0 (0.0%) | 0 (0.0%) |
| 5 or more Children | 0 (0.0%) | 0 (0.0%) |
| Total | 0 (0.0%) | 3 (15.8%) |
Income Below Poverty Among Married-Couple vs Single-Parent Households in Silver Lake
The poverty data for Silver Lake shows that 7 of the married-couple family households (4.6%) and 3 of the single-parent households (9.7%) are living below the poverty level. Within the married-couple family households, those with 1 or 2 children have the highest poverty rate, with 6 households (11.8%) falling below the poverty line. Among the single-parent households, those with no children have the highest poverty rate, with 3 household (16.7%) living below poverty.
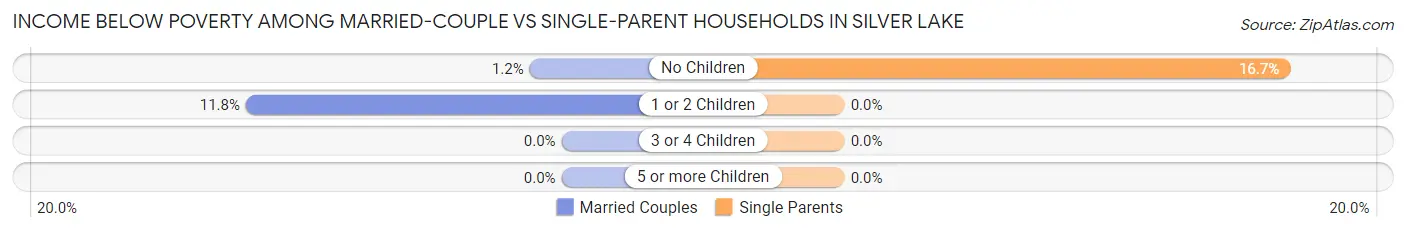
| Children | Married-Couple Families | Single-Parent Households |
| No Children | 1 (1.2%) | 3 (16.7%) |
| 1 or 2 Children | 6 (11.8%) | 0 (0.0%) |
| 3 or 4 Children | 0 (0.0%) | 0 (0.0%) |
| 5 or more Children | 0 (0.0%) | 0 (0.0%) |
| Total | 7 (4.6%) | 3 (9.7%) |
Race in Silver Lake
The most populous races in Silver Lake are White / Caucasian (733 | 89.2%), Two or more Races (71 | 8.6%), and Hispanic or Latino (48 | 5.8%).
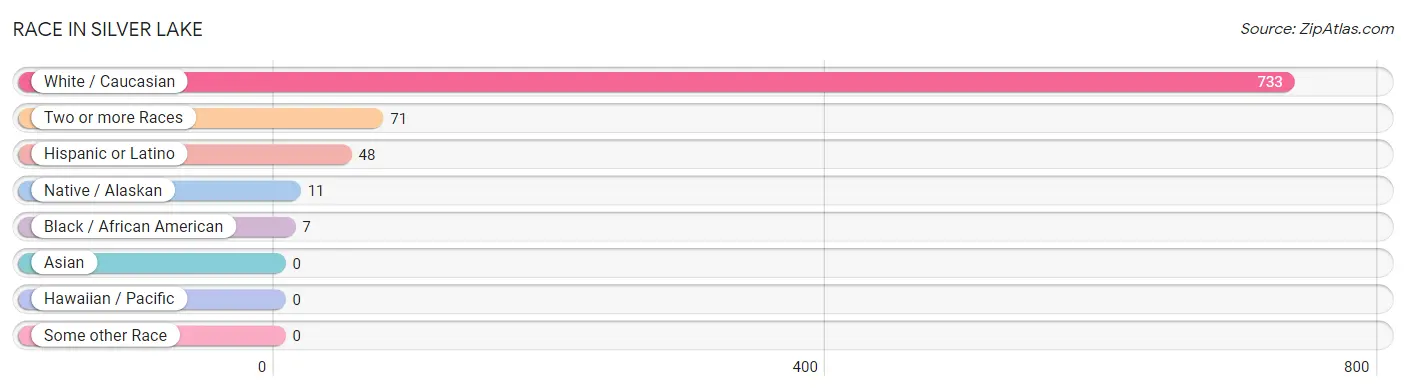
| Race | # Population | % Population |
| Asian | 0 | 0.0% |
| Black / African American | 7 | 0.9% |
| Hawaiian / Pacific | 0 | 0.0% |
| Hispanic or Latino | 48 | 5.8% |
| Native / Alaskan | 11 | 1.3% |
| White / Caucasian | 733 | 89.2% |
| Two or more Races | 71 | 8.6% |
| Some other Race | 0 | 0.0% |
| Total | 822 | 100.0% |
Ancestry in Silver Lake
The most populous ancestries reported in Silver Lake are German (361 | 43.9%), Czech (131 | 15.9%), English (123 | 15.0%), Norwegian (111 | 13.5%), and Polish (76 | 9.2%), together accounting for 97.6% of all Silver Lake residents.
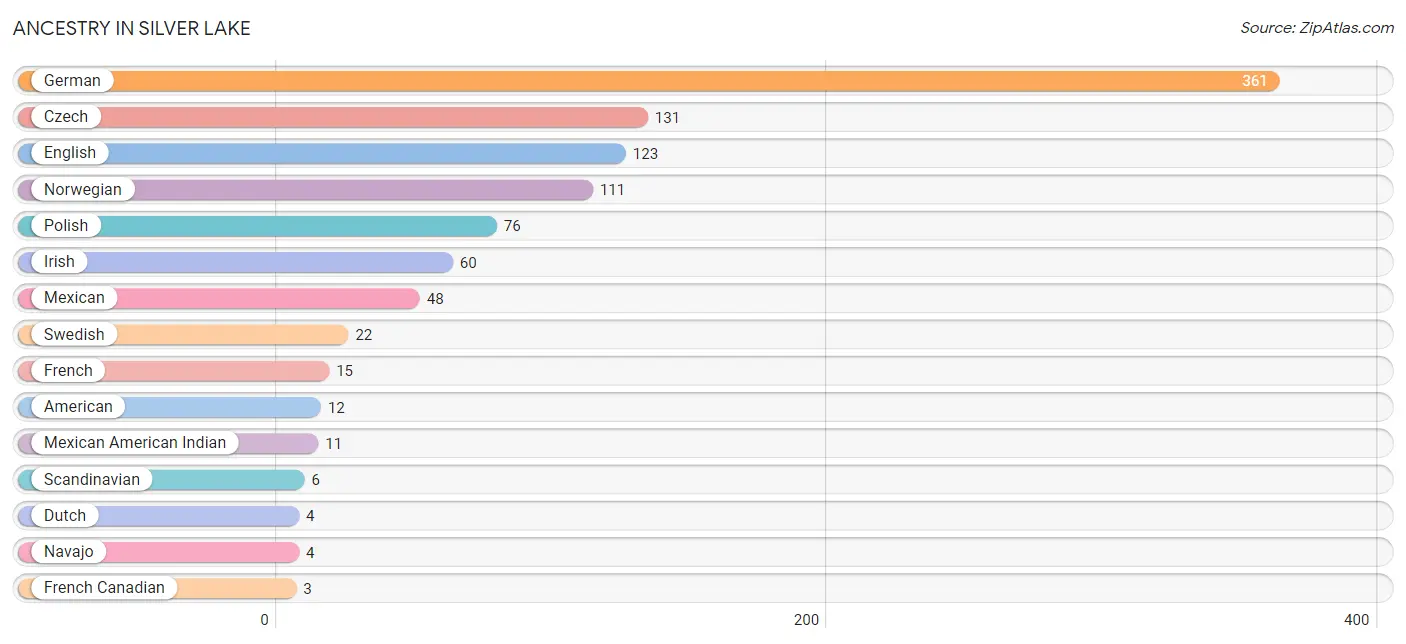
| Ancestry | # Population | % Population |
| American | 12 | 1.5% |
| Czech | 131 | 15.9% |
| Dutch | 4 | 0.5% |
| Eastern European | 2 | 0.2% |
| English | 123 | 15.0% |
| Finnish | 2 | 0.2% |
| French | 15 | 1.8% |
| French Canadian | 3 | 0.4% |
| German | 361 | 43.9% |
| Irish | 60 | 7.3% |
| Italian | 3 | 0.4% |
| Mexican | 48 | 5.8% |
| Mexican American Indian | 11 | 1.3% |
| Navajo | 4 | 0.5% |
| Norwegian | 111 | 13.5% |
| Polish | 76 | 9.2% |
| Scandinavian | 6 | 0.7% |
| Scottish | 3 | 0.4% |
| Sioux | 2 | 0.2% |
| Swedish | 22 | 2.7% |
| Swiss | 2 | 0.2% |
| Welsh | 2 | 0.2% |
| Yugoslavian | 3 | 0.4% | View All 23 Rows |
Immigrants in Silver Lake
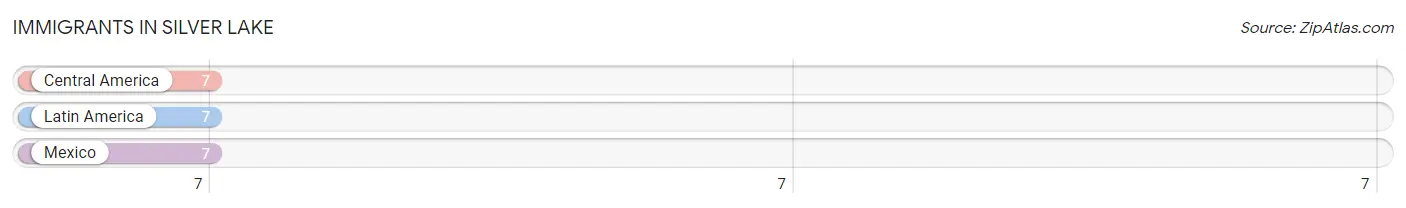
The most numerous immigrant groups reported in Silver Lake came from Central America (7 | 0.9%), Latin America (7 | 0.9%), and Mexico (7 | 0.9%), together accounting for 2.6% of all Silver Lake residents.
| Immigration Origin | # Population | % Population |
| Central America | 7 | 0.9% |
| Latin America | 7 | 0.9% |
| Mexico | 7 | 0.9% | View All 3 Rows |
Sex and Age in Silver Lake
Sex and Age in Silver Lake
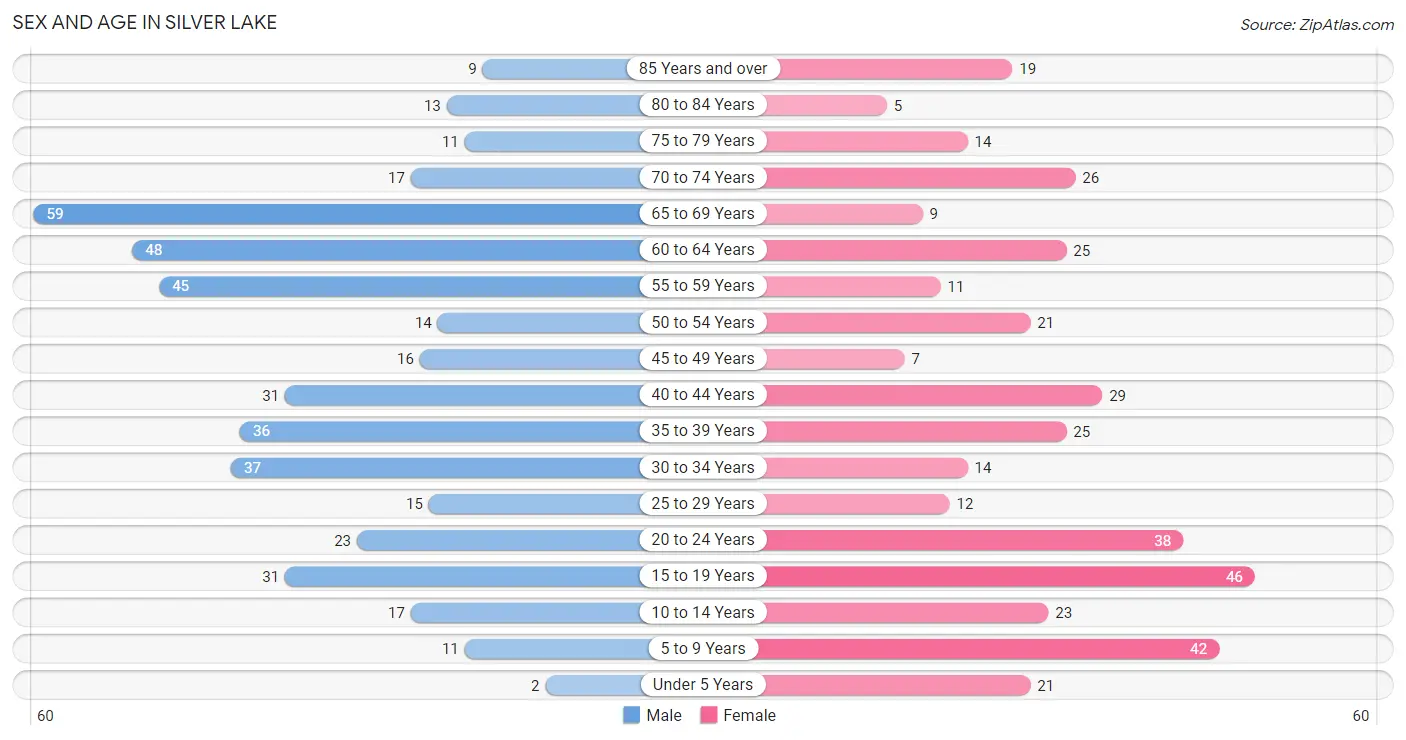
The most populous age groups in Silver Lake are 65 to 69 Years (59 | 13.6%) for men and 15 to 19 Years (46 | 11.9%) for women.
| Age Bracket | Male | Female |
| Under 5 Years | 2 (0.5%) | 21 (5.4%) |
| 5 to 9 Years | 11 (2.5%) | 42 (10.8%) |
| 10 to 14 Years | 17 (3.9%) | 23 (5.9%) |
| 15 to 19 Years | 31 (7.1%) | 46 (11.9%) |
| 20 to 24 Years | 23 (5.3%) | 38 (9.8%) |
| 25 to 29 Years | 15 (3.5%) | 12 (3.1%) |
| 30 to 34 Years | 37 (8.5%) | 14 (3.6%) |
| 35 to 39 Years | 36 (8.3%) | 25 (6.5%) |
| 40 to 44 Years | 31 (7.1%) | 29 (7.5%) |
| 45 to 49 Years | 16 (3.7%) | 7 (1.8%) |
| 50 to 54 Years | 14 (3.2%) | 21 (5.4%) |
| 55 to 59 Years | 45 (10.3%) | 11 (2.8%) |
| 60 to 64 Years | 48 (11.0%) | 25 (6.5%) |
| 65 to 69 Years | 59 (13.6%) | 9 (2.3%) |
| 70 to 74 Years | 17 (3.9%) | 26 (6.7%) |
| 75 to 79 Years | 11 (2.5%) | 14 (3.6%) |
| 80 to 84 Years | 13 (3.0%) | 5 (1.3%) |
| 85 Years and over | 9 (2.1%) | 19 (4.9%) |
| Total | 435 (100.0%) | 387 (100.0%) |
Families and Households in Silver Lake
Median Family Size in Silver Lake
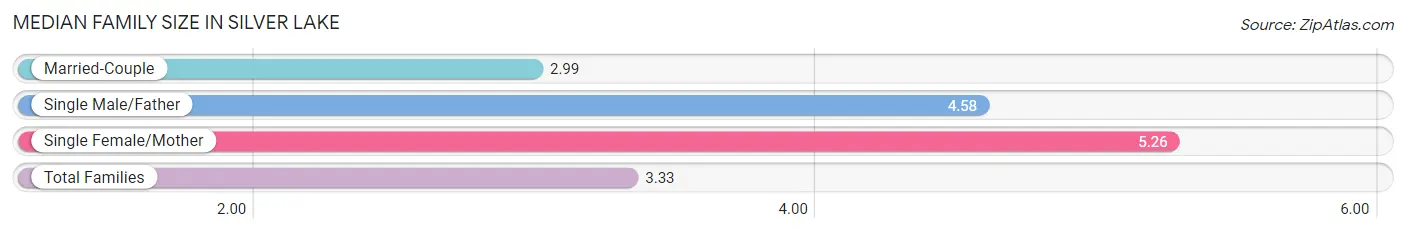
The median family size in Silver Lake is 3.33 persons per family, with single female/mother families (19 | 10.4%) accounting for the largest median family size of 5.26 persons per family. On the other hand, married-couple families (151 | 83.0%) represent the smallest median family size with 2.99 persons per family.
| Family Type | # Families | Family Size |
| Married-Couple | 151 (83.0%) | 2.99 |
| Single Male/Father | 12 (6.6%) | 4.58 |
| Single Female/Mother | 19 (10.4%) | 5.26 |
| Total Families | 182 (100.0%) | 3.33 |
Median Household Size in Silver Lake
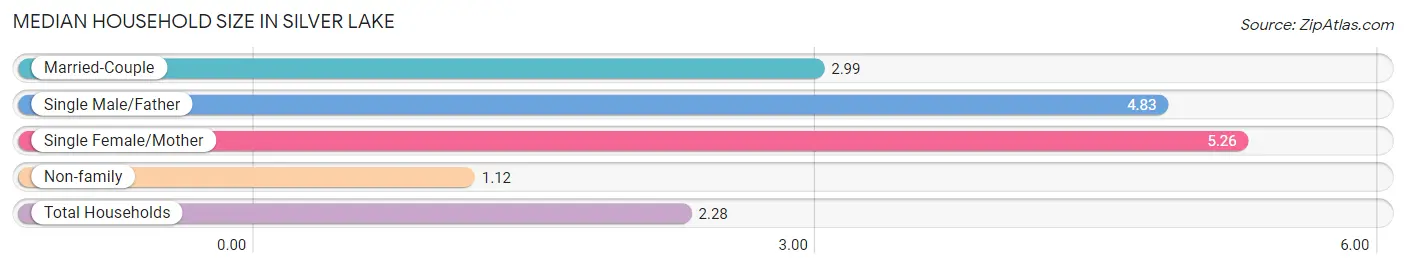
The median household size in Silver Lake is 2.28 persons per household, with single female/mother households (19 | 5.4%) accounting for the largest median household size of 5.26 persons per household. non-family households (169 | 48.1%) represent the smallest median household size with 1.12 persons per household.
| Household Type | # Households | Household Size |
| Married-Couple | 151 (43.0%) | 2.99 |
| Single Male/Father | 12 (3.4%) | 4.83 |
| Single Female/Mother | 19 (5.4%) | 5.26 |
| Non-family | 169 (48.1%) | 1.12 |
| Total Households | 351 (100.0%) | 2.28 |
Household Size by Marriage Status in Silver Lake
Out of a total of 351 households in Silver Lake, 182 (51.8%) are family households, while 169 (48.1%) are nonfamily households. The most numerous type of family households are 2-person households, comprising 97, and the most common type of nonfamily households are 1-person households, comprising 132.
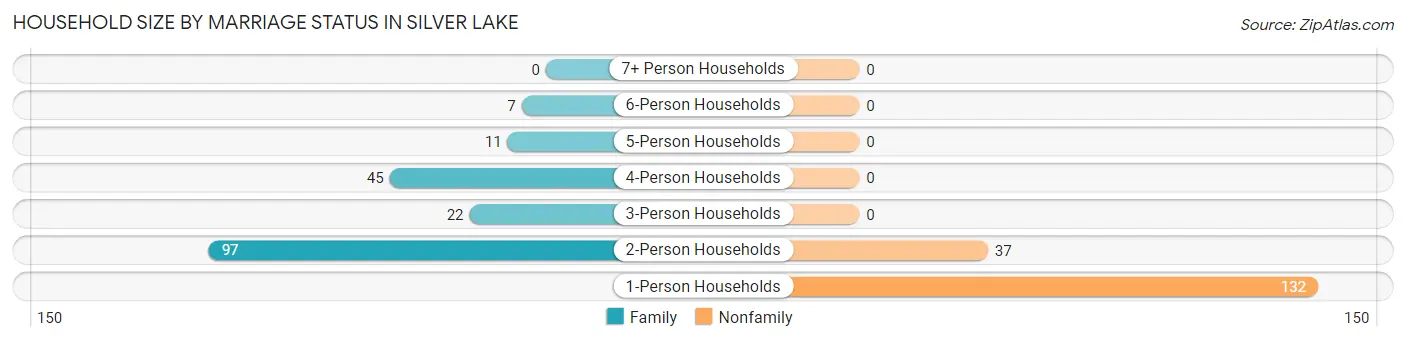
| Household Size | Family Households | Nonfamily Households |
| 1-Person Households | - | 132 (37.6%) |
| 2-Person Households | 97 (27.6%) | 37 (10.5%) |
| 3-Person Households | 22 (6.3%) | 0 (0.0%) |
| 4-Person Households | 45 (12.8%) | 0 (0.0%) |
| 5-Person Households | 11 (3.1%) | 0 (0.0%) |
| 6-Person Households | 7 (2.0%) | 0 (0.0%) |
| 7+ Person Households | 0 (0.0%) | 0 (0.0%) |
| Total | 182 (51.8%) | 169 (48.1%) |
Female Fertility in Silver Lake
Fertility by Age in Silver Lake
Average fertility rate in Silver Lake is 34.0 births per 1,000 women. Women in the age bracket of 20 to 34 years have the highest fertility rate with 94.0 births per 1,000 women. Women in the age bracket of 20 to 34 years acount for 100.0% of all women with births.
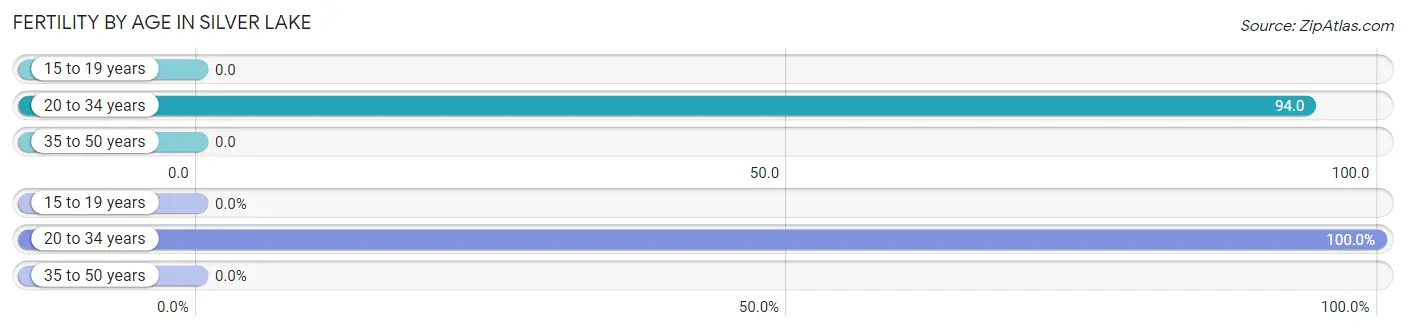
| Age Bracket | Women with Births | Births / 1,000 Women |
| 15 to 19 years | 0 (0.0%) | 0.0 |
| 20 to 34 years | 6 (100.0%) | 94.0 |
| 35 to 50 years | 0 (0.0%) | 0.0 |
| Total | 6 (100.0%) | 34.0 |
Fertility by Age by Marriage Status in Silver Lake
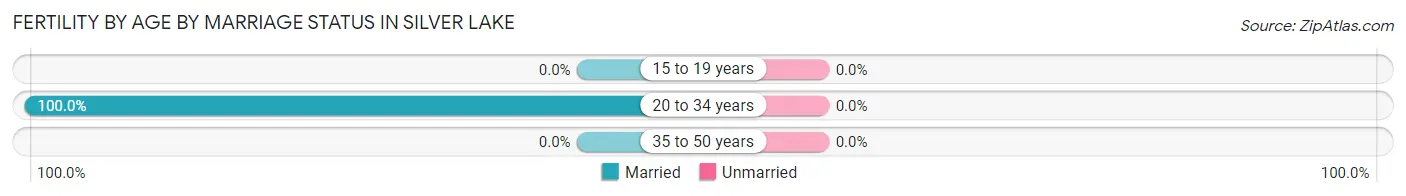
| Age Bracket | Married | Unmarried |
| 15 to 19 years | 0 (0.0%) | 0 (0.0%) |
| 20 to 34 years | 6 (100.0%) | 0 (0.0%) |
| 35 to 50 years | 0 (0.0%) | 0 (0.0%) |
| Total | 6 (100.0%) | 0 (0.0%) |
Fertility by Education in Silver Lake
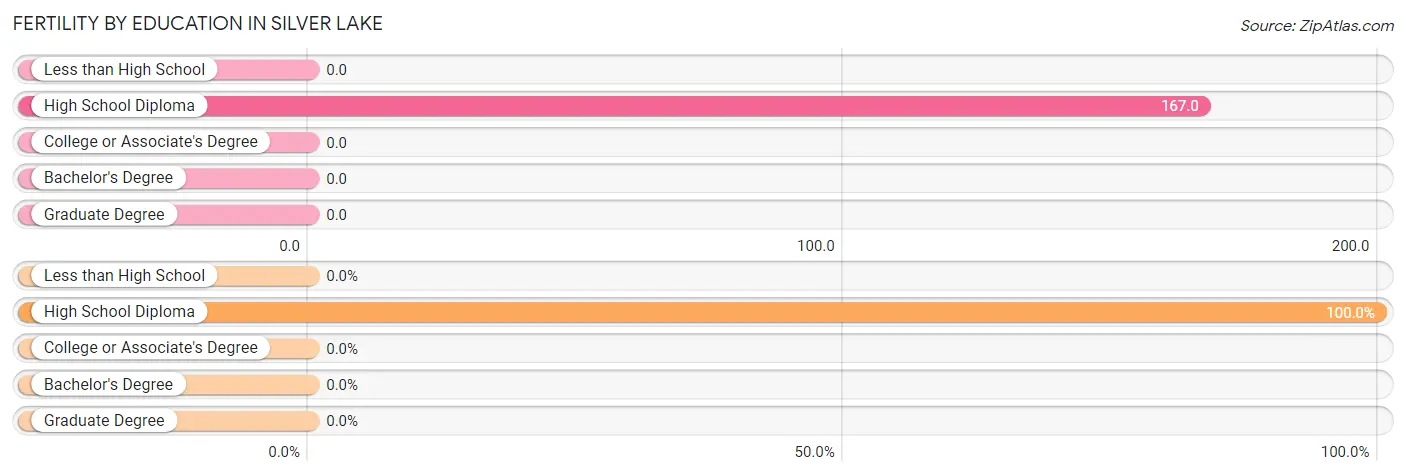
| Educational Attainment | Women with Births | Births / 1,000 Women |
| Less than High School | 0 (0.0%) | 0.0 |
| High School Diploma | 6 (100.0%) | 167.0 |
| College or Associate's Degree | 0 (0.0%) | 0.0 |
| Bachelor's Degree | 0 (0.0%) | 0.0 |
| Graduate Degree | 0 (0.0%) | 0.0 |
| Total | 6 (100.0%) | 34.0 |
Fertility by Education by Marriage Status in Silver Lake
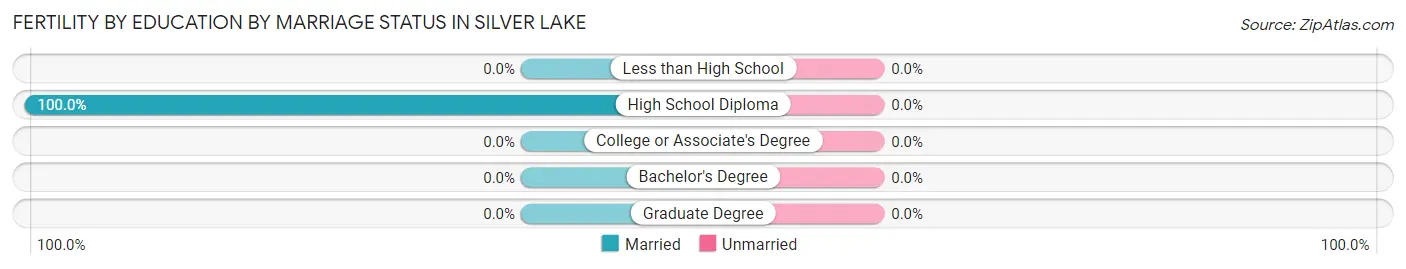
| Educational Attainment | Married | Unmarried |
| Less than High School | 0 (0.0%) | 0 (0.0%) |
| High School Diploma | 6 (100.0%) | 0 (0.0%) |
| College or Associate's Degree | 0 (0.0%) | 0 (0.0%) |
| Bachelor's Degree | 0 (0.0%) | 0 (0.0%) |
| Graduate Degree | 0 (0.0%) | 0 (0.0%) |
| Total | 6 (100.0%) | 0 (0.0%) |
Employment Characteristics in Silver Lake
Employment by Class of Employer in Silver Lake
Among the 431 employed individuals in Silver Lake, private company employees (354 | 82.1%), self-employed (not incorporated) (25 | 5.8%), and not-for-profit organizations (19 | 4.4%) make up the most common classes of employment.
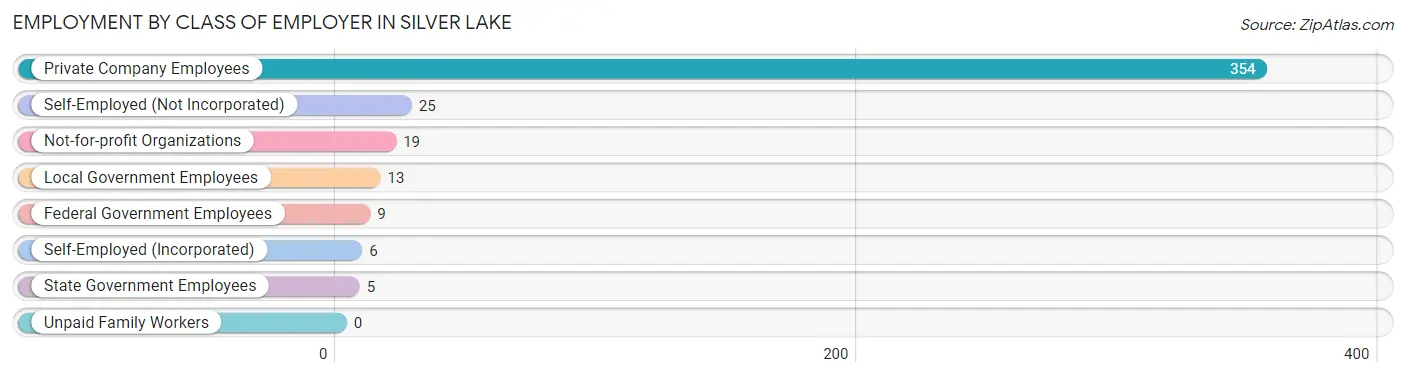
| Employer Class | # Employees | % Employees |
| Private Company Employees | 354 | 82.1% |
| Self-Employed (Incorporated) | 6 | 1.4% |
| Self-Employed (Not Incorporated) | 25 | 5.8% |
| Not-for-profit Organizations | 19 | 4.4% |
| Local Government Employees | 13 | 3.0% |
| State Government Employees | 5 | 1.2% |
| Federal Government Employees | 9 | 2.1% |
| Unpaid Family Workers | 0 | 0.0% |
| Total | 431 | 100.0% |
Employment Status by Age in Silver Lake
According to the labor force statistics for Silver Lake, out of the total population over 16 years of age (700), 66.9% or 468 individuals are in the labor force, with 7.5% or 35 of them unemployed. The age group with the highest labor force participation rate is 20 to 24 years, with 100.0% or 61 individuals in the labor force. Within the labor force, the 65 to 74 years age range has the highest percentage of unemployed individuals, with 35.5% or 11 of them being unemployed.
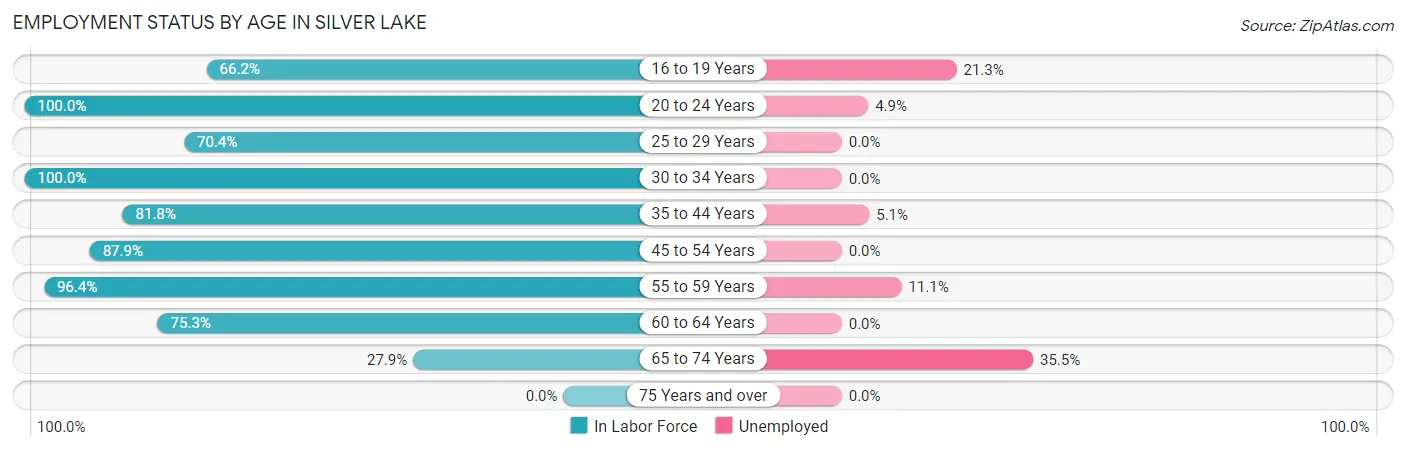
| Age Bracket | In Labor Force | Unemployed |
| 16 to 19 Years | 47 (66.2%) | 10 (21.3%) |
| 20 to 24 Years | 61 (100.0%) | 3 (4.9%) |
| 25 to 29 Years | 19 (70.4%) | 0 (0.0%) |
| 30 to 34 Years | 51 (100.0%) | 0 (0.0%) |
| 35 to 44 Years | 99 (81.8%) | 5 (5.1%) |
| 45 to 54 Years | 51 (87.9%) | 0 (0.0%) |
| 55 to 59 Years | 54 (96.4%) | 6 (11.1%) |
| 60 to 64 Years | 55 (75.3%) | 0 (0.0%) |
| 65 to 74 Years | 31 (27.9%) | 11 (35.5%) |
| 75 Years and over | 0 (0.0%) | 0 (0.0%) |
| Total | 468 (66.9%) | 35 (7.5%) |
Employment Status by Educational Attainment in Silver Lake
According to labor force statistics for Silver Lake, 85.2% of individuals (329) out of the total population between 25 and 64 years of age (386) are in the labor force, with 3.4% or 11 of them being unemployed. The group with the highest labor force participation rate are those with the educational attainment of less than high school, with 97.2% or 69 individuals in the labor force. Within the labor force, individuals with less than high school education have the highest percentage of unemployment, with 8.7% or 6 of them being unemployed.
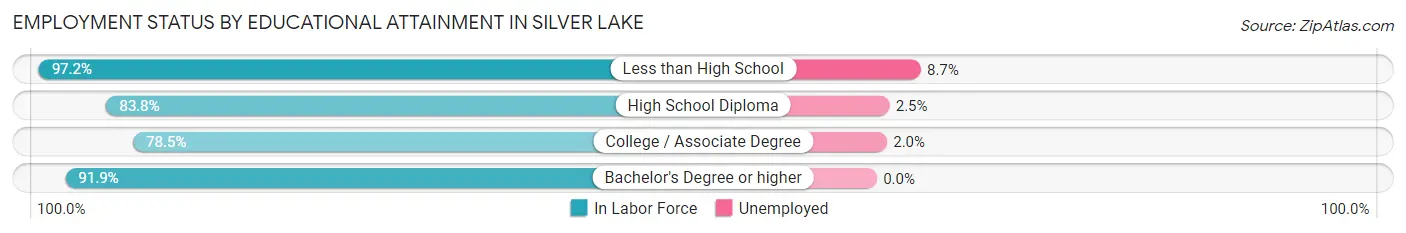
| Educational Attainment | In Labor Force | Unemployed |
| Less than High School | 69 (97.2%) | 6 (8.7%) |
| High School Diploma | 124 (83.8%) | 4 (2.5%) |
| College / Associate Degree | 102 (78.5%) | 3 (2.0%) |
| Bachelor's Degree or higher | 34 (91.9%) | 0 (0.0%) |
| Total | 329 (85.2%) | 13 (3.4%) |
Employment Occupations by Sex in Silver Lake
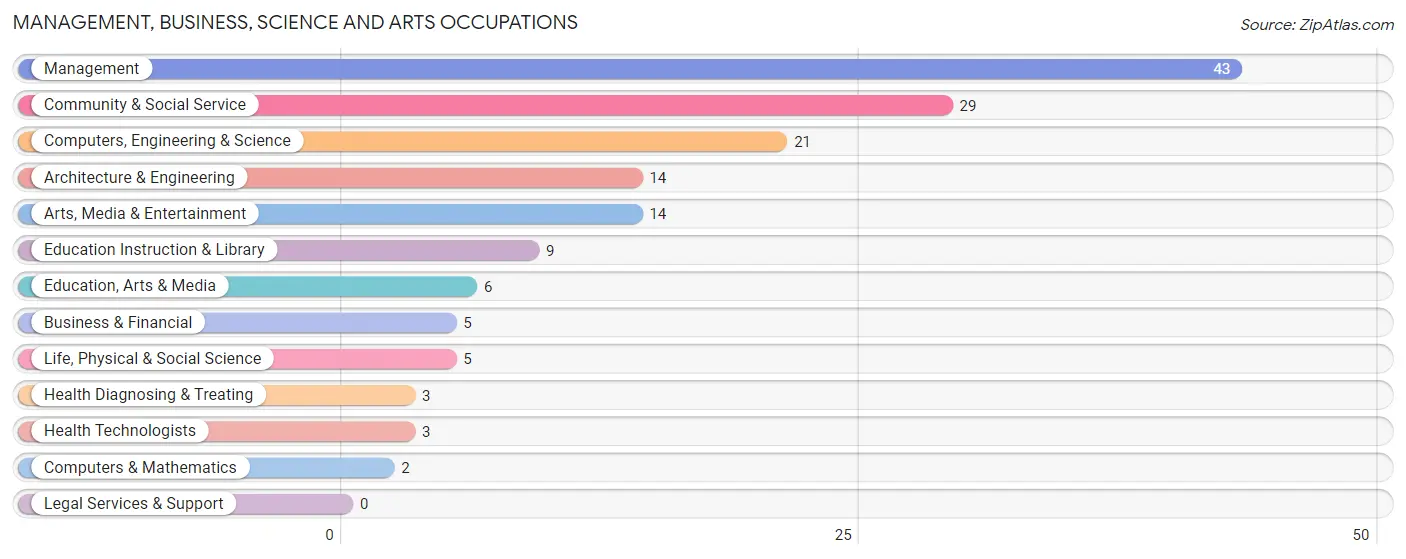
Management, Business, Science and Arts Occupations
The most common Management, Business, Science and Arts occupations in Silver Lake are Management (43 | 10.0%), Community & Social Service (29 | 6.8%), Computers, Engineering & Science (21 | 4.9%), Architecture & Engineering (14 | 3.3%), and Arts, Media & Entertainment (14 | 3.3%).
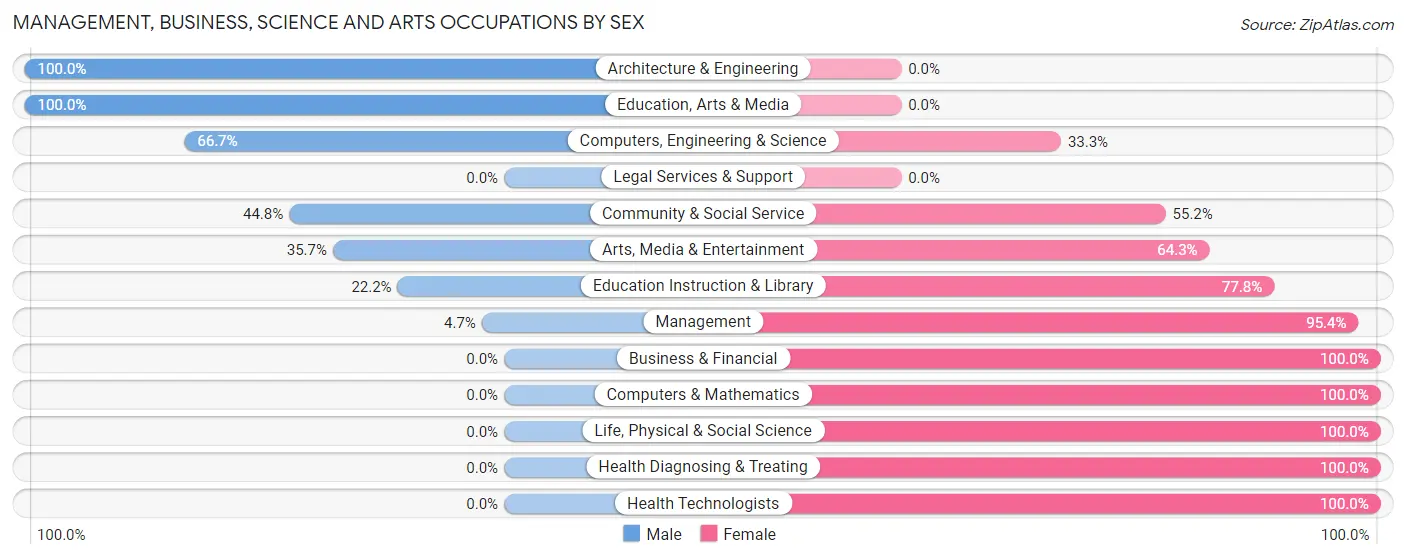
Management, Business, Science and Arts Occupations by Sex
Within the Management, Business, Science and Arts occupations in Silver Lake, the most male-oriented occupations are Architecture & Engineering (100.0%), Education, Arts & Media (100.0%), and Computers, Engineering & Science (66.7%), while the most female-oriented occupations are Business & Financial (100.0%), Computers & Mathematics (100.0%), and Life, Physical & Social Science (100.0%).
| Occupation | Male | Female |
| Management | 2 (4.6%) | 41 (95.4%) |
| Business & Financial | 0 (0.0%) | 5 (100.0%) |
| Computers, Engineering & Science | 14 (66.7%) | 7 (33.3%) |
| Computers & Mathematics | 0 (0.0%) | 2 (100.0%) |
| Architecture & Engineering | 14 (100.0%) | 0 (0.0%) |
| Life, Physical & Social Science | 0 (0.0%) | 5 (100.0%) |
| Community & Social Service | 13 (44.8%) | 16 (55.2%) |
| Education, Arts & Media | 6 (100.0%) | 0 (0.0%) |
| Legal Services & Support | 0 (0.0%) | 0 (0.0%) |
| Education Instruction & Library | 2 (22.2%) | 7 (77.8%) |
| Arts, Media & Entertainment | 5 (35.7%) | 9 (64.3%) |
| Health Diagnosing & Treating | 0 (0.0%) | 3 (100.0%) |
| Health Technologists | 0 (0.0%) | 3 (100.0%) |
| Total (Category) | 29 (28.7%) | 72 (71.3%) |
| Total (Overall) | 267 (62.2%) | 162 (37.8%) |
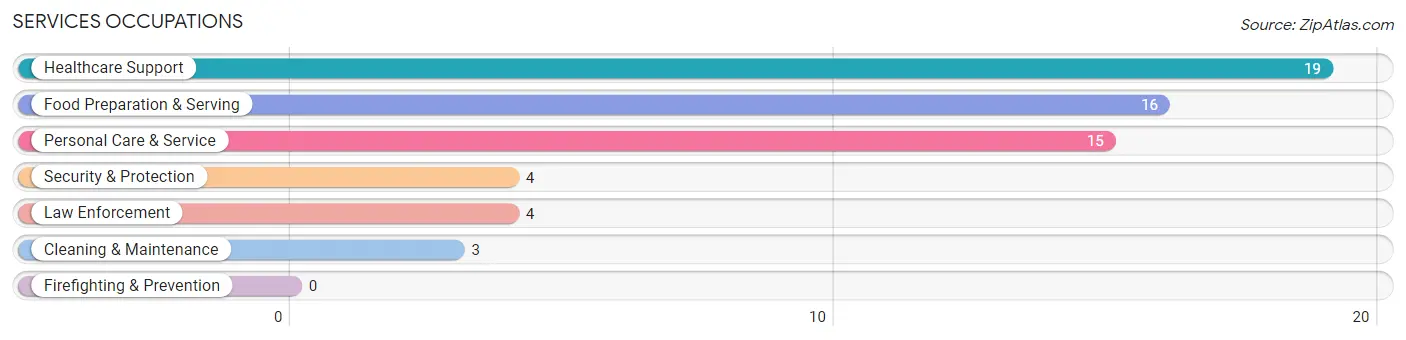
Services Occupations
The most common Services occupations in Silver Lake are Healthcare Support (19 | 4.4%), Food Preparation & Serving (16 | 3.7%), Personal Care & Service (15 | 3.5%), Security & Protection (4 | 0.9%), and Law Enforcement (4 | 0.9%).
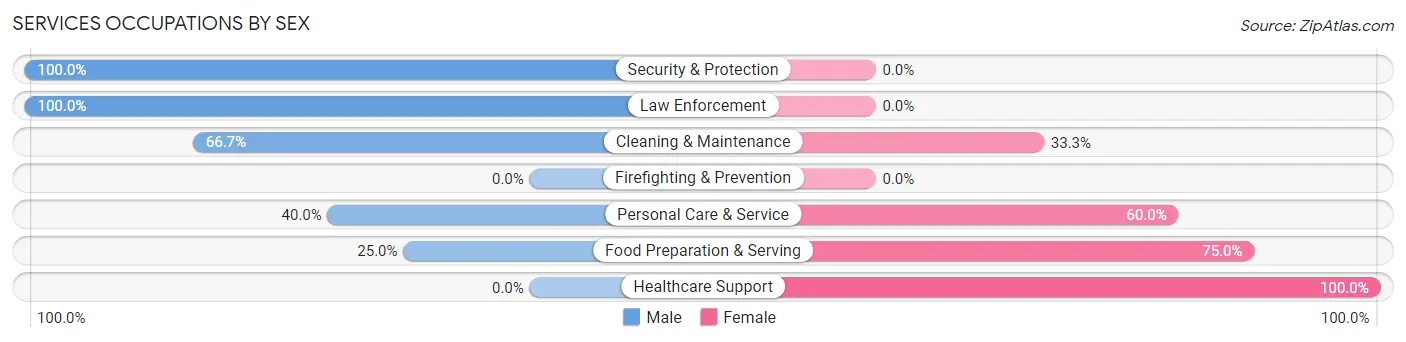
Services Occupations by Sex
Within the Services occupations in Silver Lake, the most male-oriented occupations are Security & Protection (100.0%), Law Enforcement (100.0%), and Cleaning & Maintenance (66.7%), while the most female-oriented occupations are Healthcare Support (100.0%), Food Preparation & Serving (75.0%), and Personal Care & Service (60.0%).
| Occupation | Male | Female |
| Healthcare Support | 0 (0.0%) | 19 (100.0%) |
| Security & Protection | 4 (100.0%) | 0 (0.0%) |
| Firefighting & Prevention | 0 (0.0%) | 0 (0.0%) |
| Law Enforcement | 4 (100.0%) | 0 (0.0%) |
| Food Preparation & Serving | 4 (25.0%) | 12 (75.0%) |
| Cleaning & Maintenance | 2 (66.7%) | 1 (33.3%) |
| Personal Care & Service | 6 (40.0%) | 9 (60.0%) |
| Total (Category) | 16 (28.1%) | 41 (71.9%) |
| Total (Overall) | 267 (62.2%) | 162 (37.8%) |
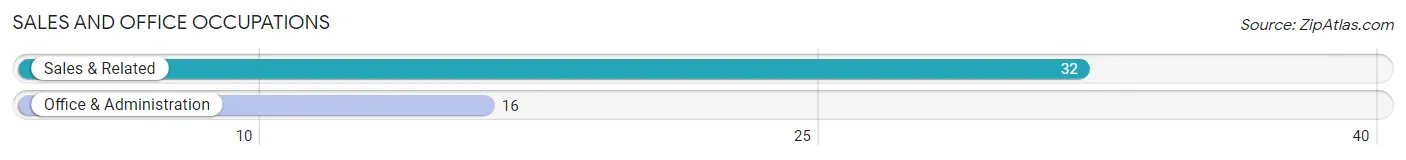
Sales and Office Occupations
The most common Sales and Office occupations in Silver Lake are Sales & Related (32 | 7.5%), and Office & Administration (16 | 3.7%).
Sales and Office Occupations by Sex
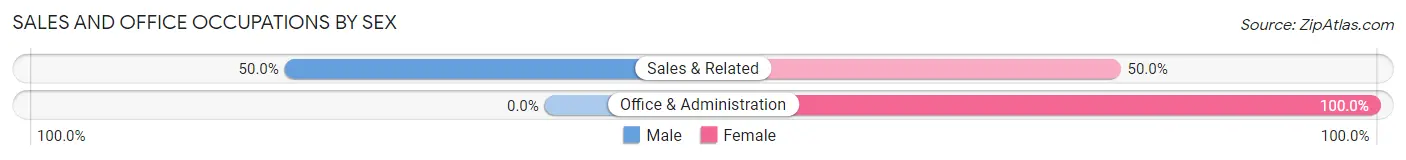
| Occupation | Male | Female |
| Sales & Related | 16 (50.0%) | 16 (50.0%) |
| Office & Administration | 0 (0.0%) | 16 (100.0%) |
| Total (Category) | 16 (33.3%) | 32 (66.7%) |
| Total (Overall) | 267 (62.2%) | 162 (37.8%) |
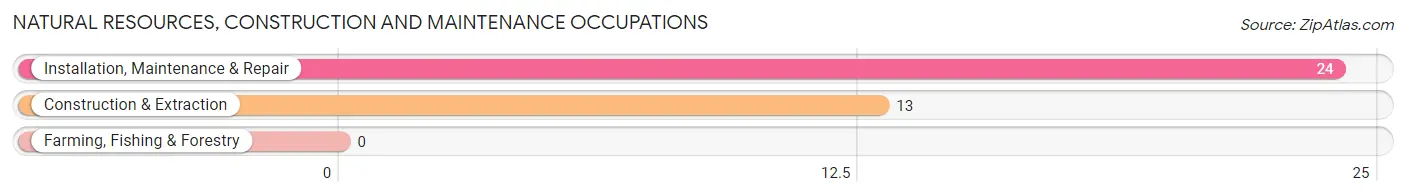
Natural Resources, Construction and Maintenance Occupations
The most common Natural Resources, Construction and Maintenance occupations in Silver Lake are Installation, Maintenance & Repair (24 | 5.6%), and Construction & Extraction (13 | 3.0%).
Natural Resources, Construction and Maintenance Occupations by Sex
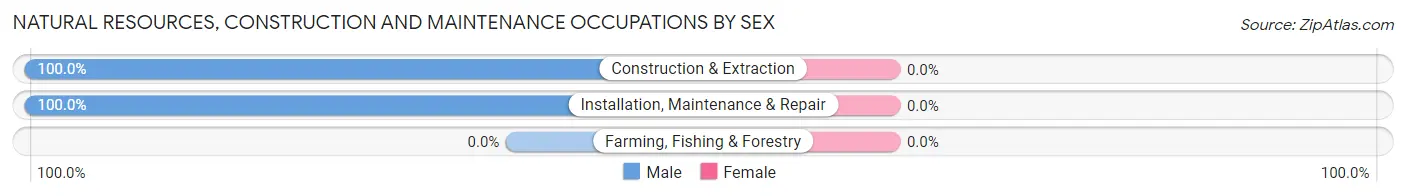
| Occupation | Male | Female |
| Farming, Fishing & Forestry | 0 (0.0%) | 0 (0.0%) |
| Construction & Extraction | 13 (100.0%) | 0 (0.0%) |
| Installation, Maintenance & Repair | 24 (100.0%) | 0 (0.0%) |
| Total (Category) | 37 (100.0%) | 0 (0.0%) |
| Total (Overall) | 267 (62.2%) | 162 (37.8%) |
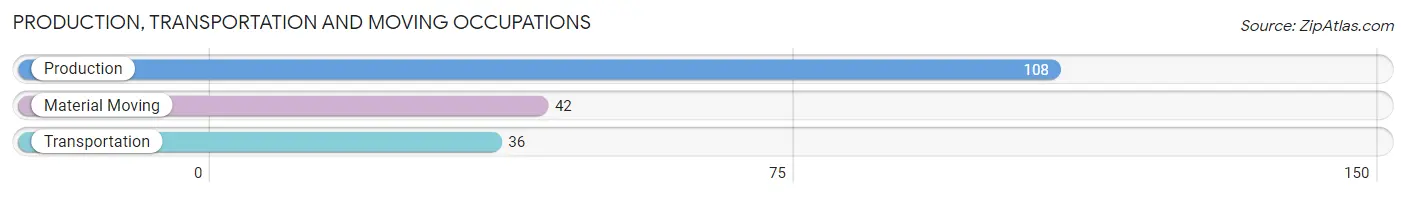
Production, Transportation and Moving Occupations
The most common Production, Transportation and Moving occupations in Silver Lake are Production (108 | 25.2%), Material Moving (42 | 9.8%), and Transportation (36 | 8.4%).
Production, Transportation and Moving Occupations by Sex
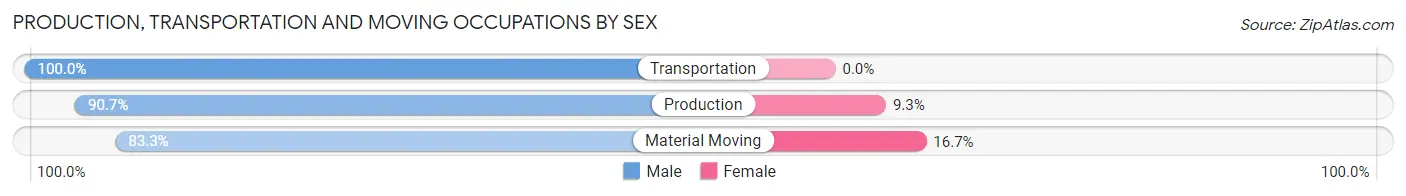
| Occupation | Male | Female |
| Production | 98 (90.7%) | 10 (9.3%) |
| Transportation | 36 (100.0%) | 0 (0.0%) |
| Material Moving | 35 (83.3%) | 7 (16.7%) |
| Total (Category) | 169 (90.9%) | 17 (9.1%) |
| Total (Overall) | 267 (62.2%) | 162 (37.8%) |
Employment Industries by Sex in Silver Lake
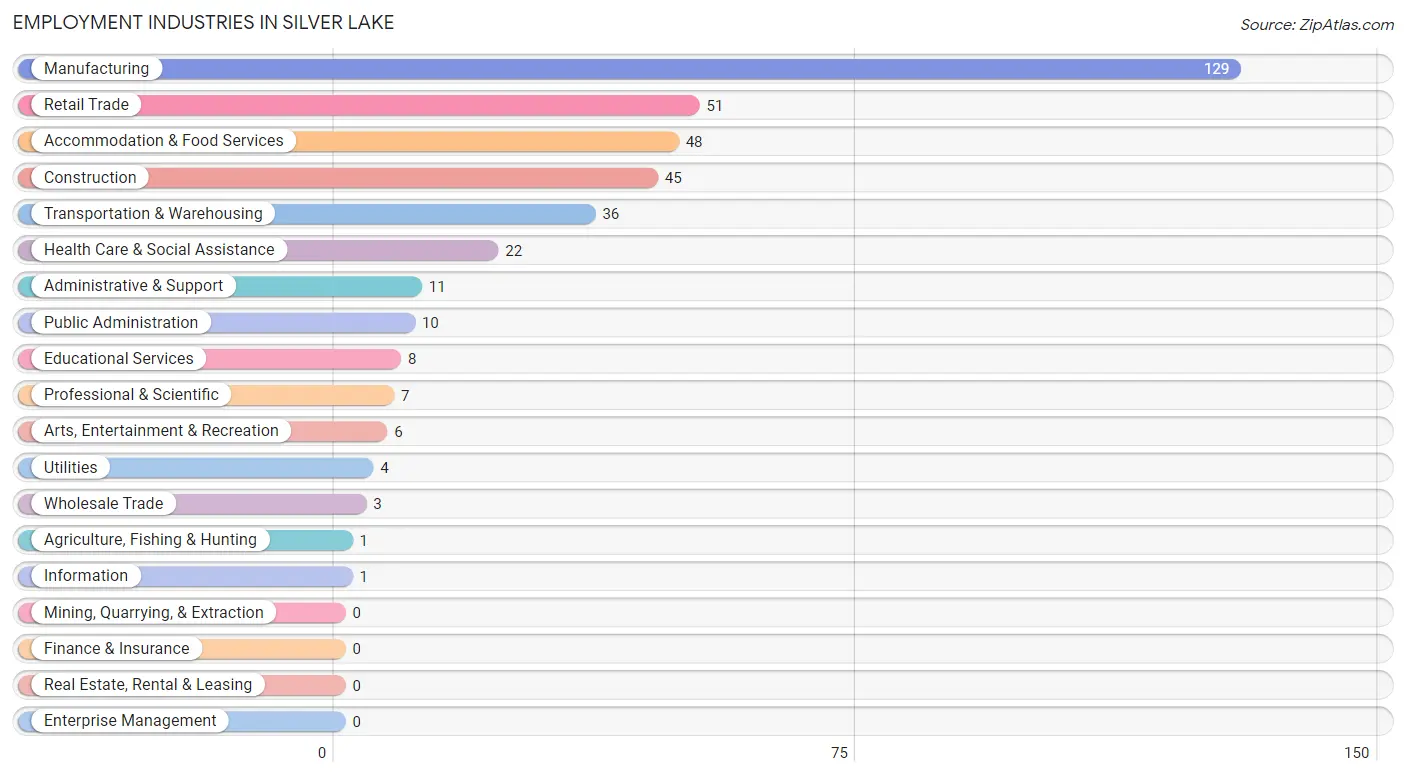
Employment Industries in Silver Lake
The major employment industries in Silver Lake include Manufacturing (129 | 30.1%), Retail Trade (51 | 11.9%), Accommodation & Food Services (48 | 11.2%), Construction (45 | 10.5%), and Transportation & Warehousing (36 | 8.4%).
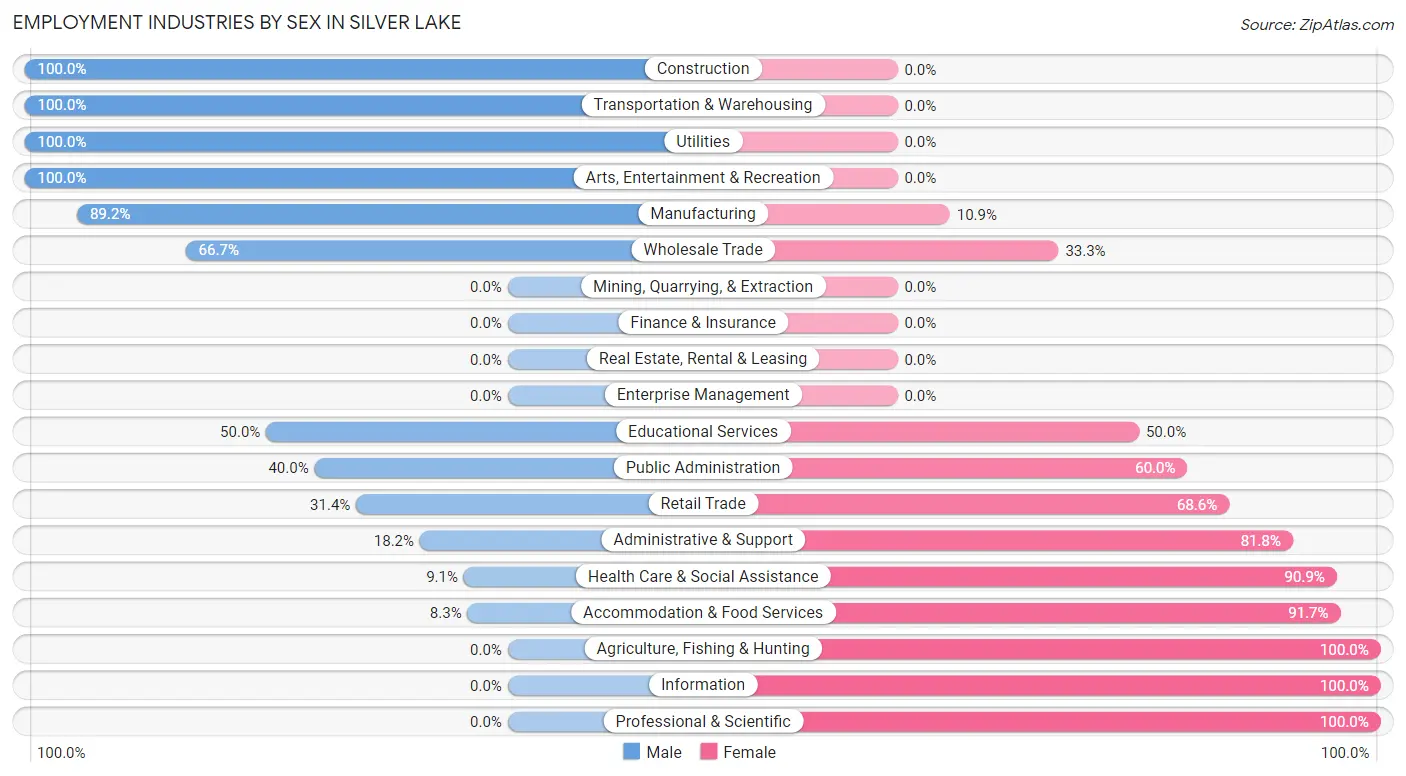
Employment Industries by Sex in Silver Lake
The Silver Lake industries that see more men than women are Construction (100.0%), Transportation & Warehousing (100.0%), and Utilities (100.0%), whereas the industries that tend to have a higher number of women are Agriculture, Fishing & Hunting (100.0%), Information (100.0%), and Professional & Scientific (100.0%).
| Industry | Male | Female |
| Agriculture, Fishing & Hunting | 0 (0.0%) | 1 (100.0%) |
| Mining, Quarrying, & Extraction | 0 (0.0%) | 0 (0.0%) |
| Construction | 45 (100.0%) | 0 (0.0%) |
| Manufacturing | 115 (89.1%) | 14 (10.8%) |
| Wholesale Trade | 2 (66.7%) | 1 (33.3%) |
| Retail Trade | 16 (31.4%) | 35 (68.6%) |
| Transportation & Warehousing | 36 (100.0%) | 0 (0.0%) |
| Utilities | 4 (100.0%) | 0 (0.0%) |
| Information | 0 (0.0%) | 1 (100.0%) |
| Finance & Insurance | 0 (0.0%) | 0 (0.0%) |
| Real Estate, Rental & Leasing | 0 (0.0%) | 0 (0.0%) |
| Professional & Scientific | 0 (0.0%) | 7 (100.0%) |
| Enterprise Management | 0 (0.0%) | 0 (0.0%) |
| Administrative & Support | 2 (18.2%) | 9 (81.8%) |
| Educational Services | 4 (50.0%) | 4 (50.0%) |
| Health Care & Social Assistance | 2 (9.1%) | 20 (90.9%) |
| Arts, Entertainment & Recreation | 6 (100.0%) | 0 (0.0%) |
| Accommodation & Food Services | 4 (8.3%) | 44 (91.7%) |
| Public Administration | 4 (40.0%) | 6 (60.0%) |
| Total | 267 (62.2%) | 162 (37.8%) |
Education in Silver Lake
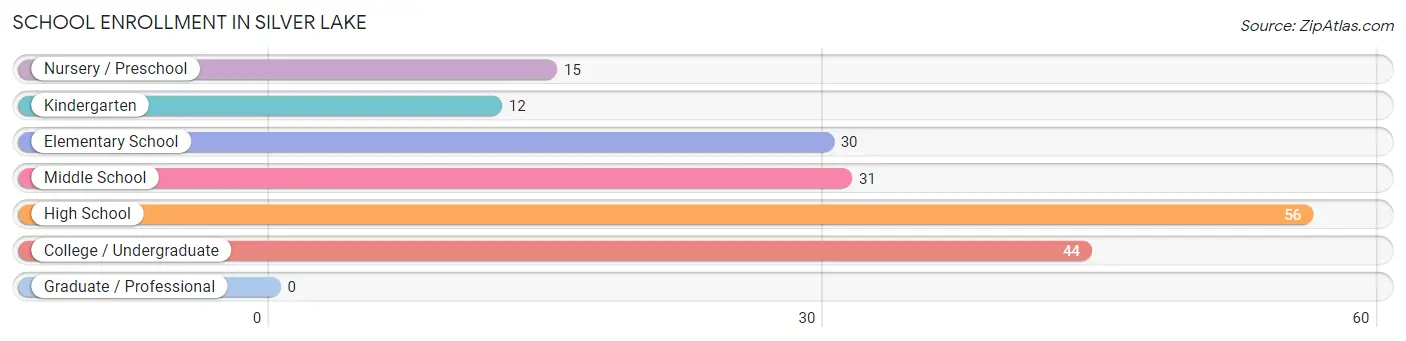
School Enrollment in Silver Lake
The most common levels of schooling among the 188 students in Silver Lake are high school (56 | 29.8%), college / undergraduate (44 | 23.4%), and middle school (31 | 16.5%).
| School Level | # Students | % Students |
| Nursery / Preschool | 15 | 8.0% |
| Kindergarten | 12 | 6.4% |
| Elementary School | 30 | 16.0% |
| Middle School | 31 | 16.5% |
| High School | 56 | 29.8% |
| College / Undergraduate | 44 | 23.4% |
| Graduate / Professional | 0 | 0.0% |
| Total | 188 | 100.0% |
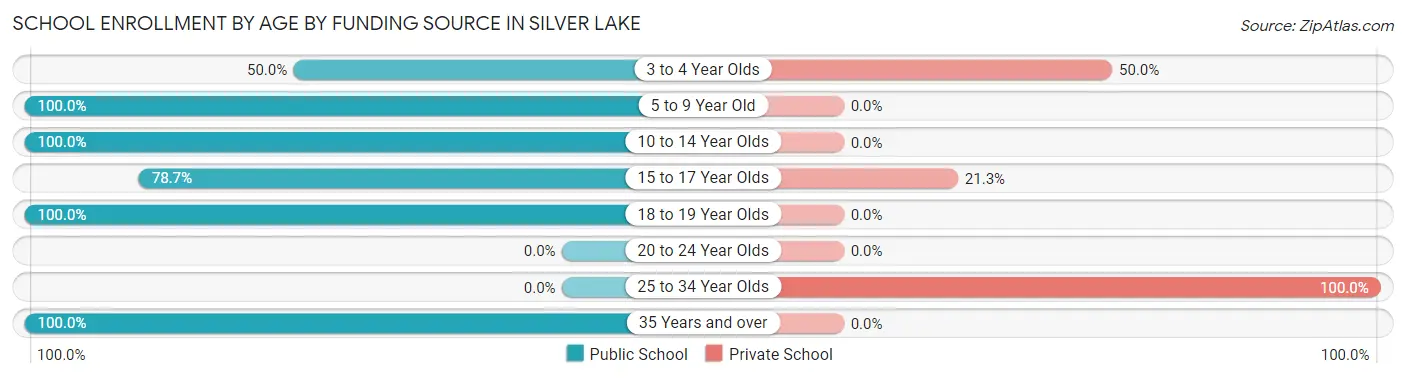
School Enrollment by Age by Funding Source in Silver Lake
Out of a total of 188 students who are enrolled in schools in Silver Lake, 17 (9.0%) attend a private institution, while the remaining 171 (91.0%) are enrolled in public schools. The age group of 25 to 34 year olds has the highest likelihood of being enrolled in private schools, with 5 (100.0% in the age bracket) enrolled. Conversely, the age group of 5 to 9 year old has the lowest likelihood of being enrolled in a private school, with 53 (100.0% in the age bracket) attending a public institution.
| Age Bracket | Public School | Private School |
| 3 to 4 Year Olds | 2 (50.0%) | 2 (50.0%) |
| 5 to 9 Year Old | 53 (100.0%) | 0 (0.0%) |
| 10 to 14 Year Olds | 40 (100.0%) | 0 (0.0%) |
| 15 to 17 Year Olds | 37 (78.7%) | 10 (21.3%) |
| 18 to 19 Year Olds | 26 (100.0%) | 0 (0.0%) |
| 20 to 24 Year Olds | 0 (0.0%) | 0 (0.0%) |
| 25 to 34 Year Olds | 0 (0.0%) | 5 (100.0%) |
| 35 Years and over | 13 (100.0%) | 0 (0.0%) |
| Total | 171 (91.0%) | 17 (9.0%) |
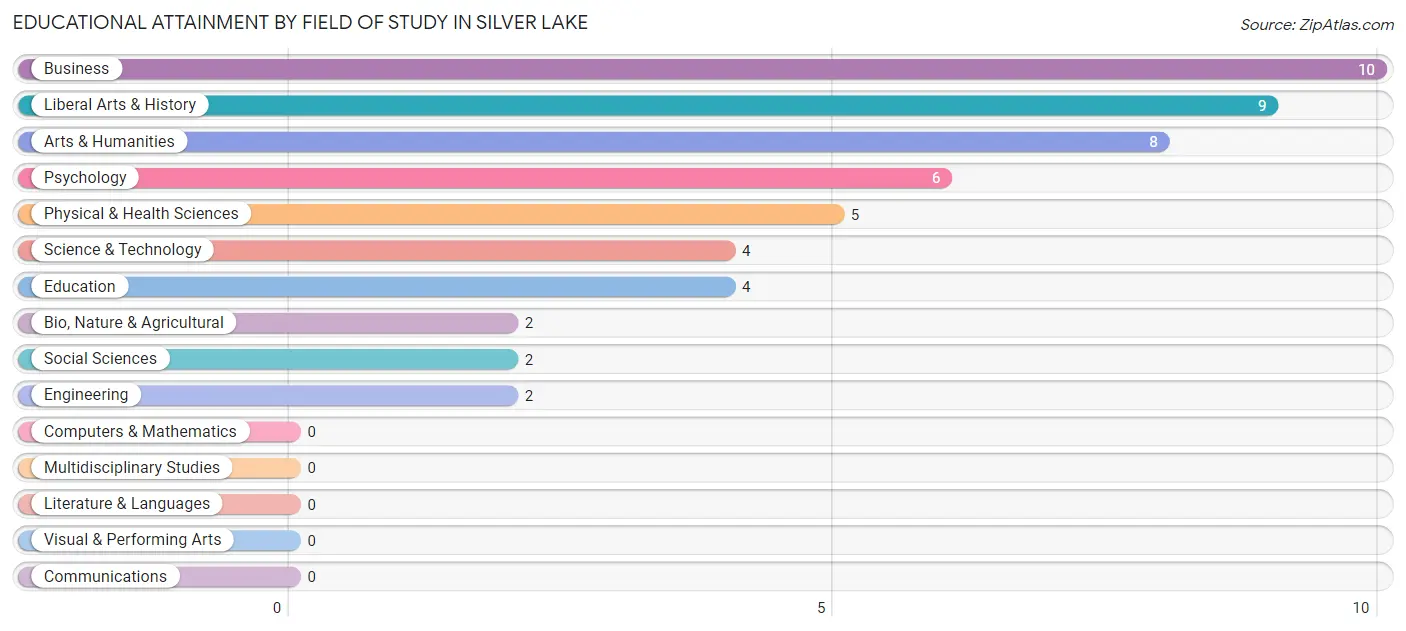
Educational Attainment by Field of Study in Silver Lake
Business (10 | 19.2%), liberal arts & history (9 | 17.3%), arts & humanities (8 | 15.4%), psychology (6 | 11.5%), and physical & health sciences (5 | 9.6%) are the most common fields of study among 52 individuals in Silver Lake who have obtained a bachelor's degree or higher.
| Field of Study | # Graduates | % Graduates |
| Computers & Mathematics | 0 | 0.0% |
| Bio, Nature & Agricultural | 2 | 3.8% |
| Physical & Health Sciences | 5 | 9.6% |
| Psychology | 6 | 11.5% |
| Social Sciences | 2 | 3.8% |
| Engineering | 2 | 3.8% |
| Multidisciplinary Studies | 0 | 0.0% |
| Science & Technology | 4 | 7.7% |
| Business | 10 | 19.2% |
| Education | 4 | 7.7% |
| Literature & Languages | 0 | 0.0% |
| Liberal Arts & History | 9 | 17.3% |
| Visual & Performing Arts | 0 | 0.0% |
| Communications | 0 | 0.0% |
| Arts & Humanities | 8 | 15.4% |
| Total | 52 | 100.0% |
Transportation & Commute in Silver Lake
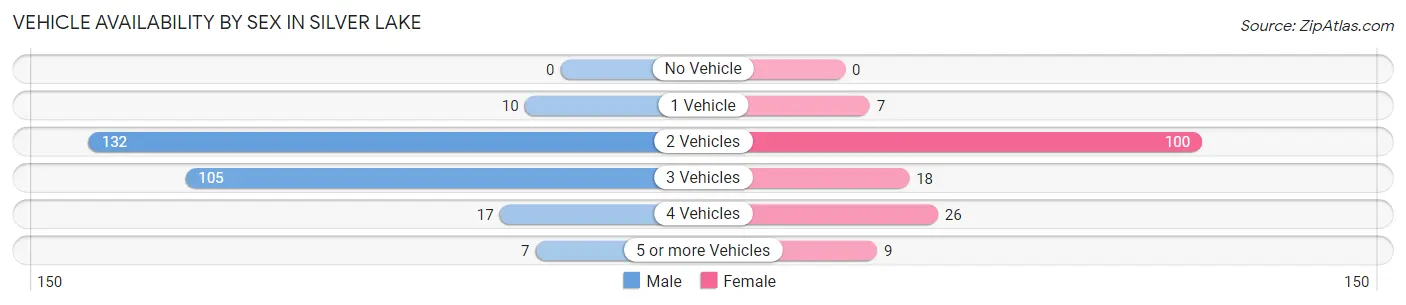
Vehicle Availability by Sex in Silver Lake
The most prevalent vehicle ownership categories in Silver Lake are males with 2 vehicles (132, accounting for 48.7%) and females with 2 vehicles (100, making up 82.5%).
| Vehicles Available | Male | Female |
| No Vehicle | 0 (0.0%) | 0 (0.0%) |
| 1 Vehicle | 10 (3.7%) | 7 (4.4%) |
| 2 Vehicles | 132 (48.7%) | 100 (62.5%) |
| 3 Vehicles | 105 (38.8%) | 18 (11.3%) |
| 4 Vehicles | 17 (6.3%) | 26 (16.3%) |
| 5 or more Vehicles | 7 (2.6%) | 9 (5.6%) |
| Total | 271 (100.0%) | 160 (100.0%) |
Commute Time in Silver Lake
The most frequently occuring commute durations in Silver Lake are 15 to 19 minutes (201 commuters, 50.5%), 10 to 14 minutes (54 commuters, 13.6%), and 45 to 59 minutes (29 commuters, 7.3%).
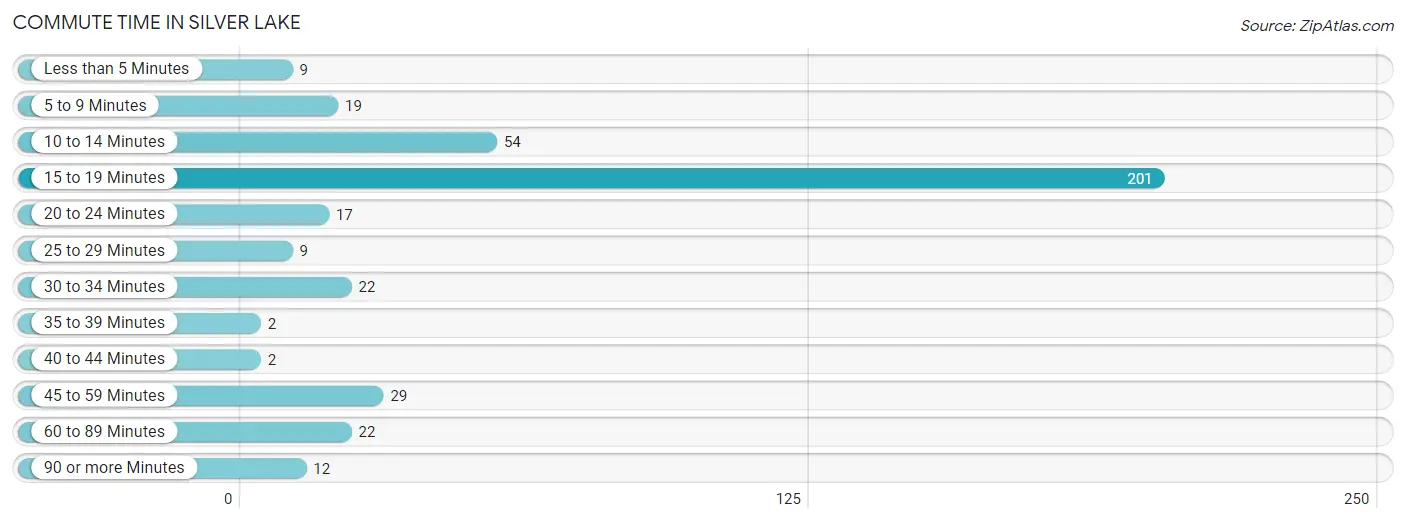
| Commute Time | # Commuters | % Commuters |
| Less than 5 Minutes | 9 | 2.3% |
| 5 to 9 Minutes | 19 | 4.8% |
| 10 to 14 Minutes | 54 | 13.6% |
| 15 to 19 Minutes | 201 | 50.5% |
| 20 to 24 Minutes | 17 | 4.3% |
| 25 to 29 Minutes | 9 | 2.3% |
| 30 to 34 Minutes | 22 | 5.5% |
| 35 to 39 Minutes | 2 | 0.5% |
| 40 to 44 Minutes | 2 | 0.5% |
| 45 to 59 Minutes | 29 | 7.3% |
| 60 to 89 Minutes | 22 | 5.5% |
| 90 or more Minutes | 12 | 3.0% |
Commute Time by Sex in Silver Lake
The most common commute times in Silver Lake are 15 to 19 minutes (124 commuters, 48.4%) for males and 15 to 19 minutes (77 commuters, 54.2%) for females.
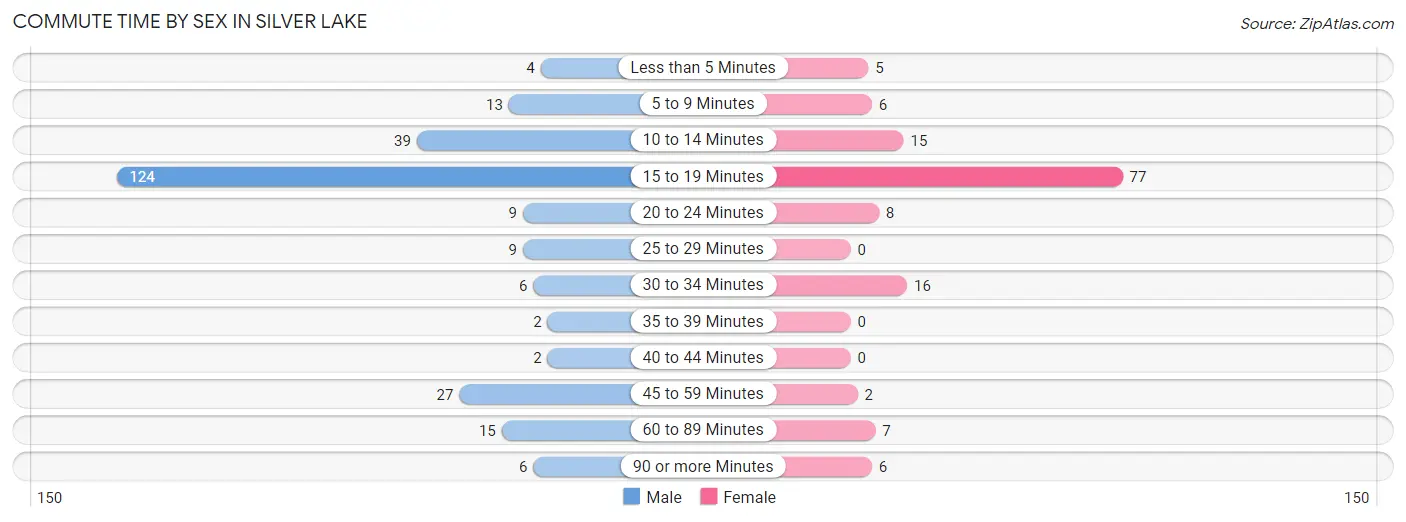
| Commute Time | Male | Female |
| Less than 5 Minutes | 4 (1.6%) | 5 (3.5%) |
| 5 to 9 Minutes | 13 (5.1%) | 6 (4.2%) |
| 10 to 14 Minutes | 39 (15.2%) | 15 (10.6%) |
| 15 to 19 Minutes | 124 (48.4%) | 77 (54.2%) |
| 20 to 24 Minutes | 9 (3.5%) | 8 (5.6%) |
| 25 to 29 Minutes | 9 (3.5%) | 0 (0.0%) |
| 30 to 34 Minutes | 6 (2.3%) | 16 (11.3%) |
| 35 to 39 Minutes | 2 (0.8%) | 0 (0.0%) |
| 40 to 44 Minutes | 2 (0.8%) | 0 (0.0%) |
| 45 to 59 Minutes | 27 (10.5%) | 2 (1.4%) |
| 60 to 89 Minutes | 15 (5.9%) | 7 (4.9%) |
| 90 or more Minutes | 6 (2.3%) | 6 (4.2%) |
Time of Departure to Work by Sex in Silver Lake
The most frequent times of departure to work in Silver Lake are 7:00 AM to 7:29 AM (69, 27.0%) for males and 12:00 AM to 4:59 AM (39, 27.5%) for females.
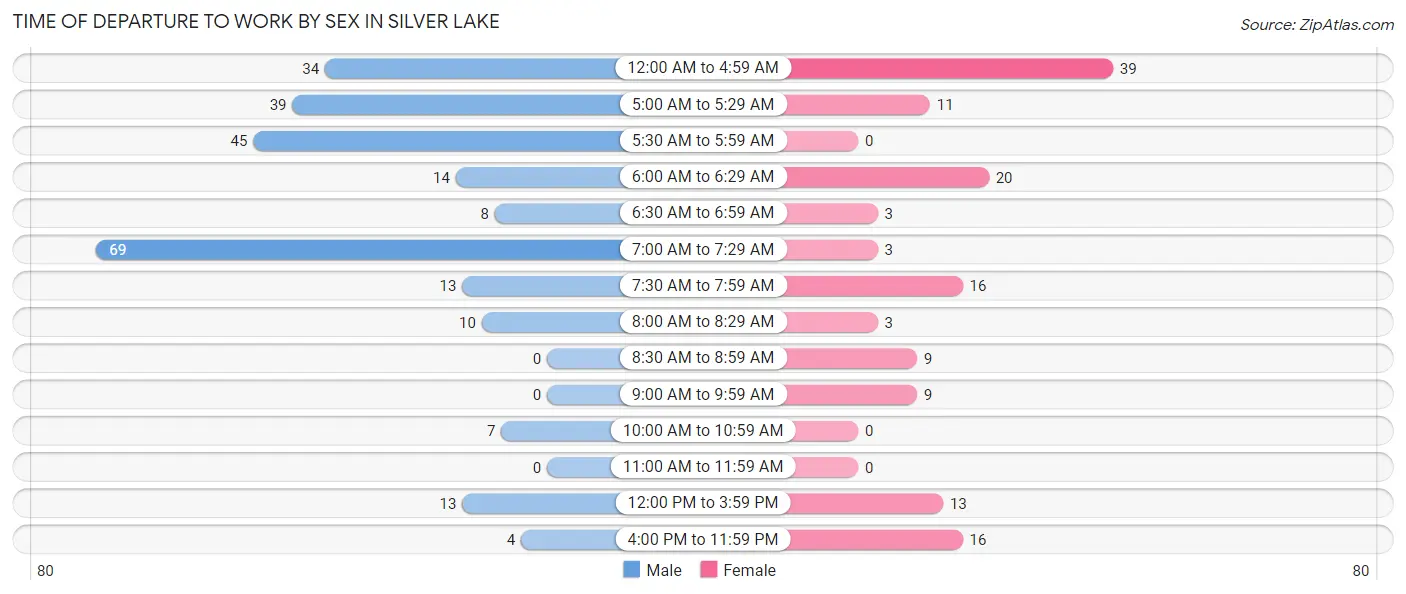
| Time of Departure | Male | Female |
| 12:00 AM to 4:59 AM | 34 (13.3%) | 39 (27.5%) |
| 5:00 AM to 5:29 AM | 39 (15.2%) | 11 (7.7%) |
| 5:30 AM to 5:59 AM | 45 (17.6%) | 0 (0.0%) |
| 6:00 AM to 6:29 AM | 14 (5.5%) | 20 (14.1%) |
| 6:30 AM to 6:59 AM | 8 (3.1%) | 3 (2.1%) |
| 7:00 AM to 7:29 AM | 69 (27.0%) | 3 (2.1%) |
| 7:30 AM to 7:59 AM | 13 (5.1%) | 16 (11.3%) |
| 8:00 AM to 8:29 AM | 10 (3.9%) | 3 (2.1%) |
| 8:30 AM to 8:59 AM | 0 (0.0%) | 9 (6.3%) |
| 9:00 AM to 9:59 AM | 0 (0.0%) | 9 (6.3%) |
| 10:00 AM to 10:59 AM | 7 (2.7%) | 0 (0.0%) |
| 11:00 AM to 11:59 AM | 0 (0.0%) | 0 (0.0%) |
| 12:00 PM to 3:59 PM | 13 (5.1%) | 13 (9.1%) |
| 4:00 PM to 11:59 PM | 4 (1.6%) | 16 (11.3%) |
| Total | 256 (100.0%) | 142 (100.0%) |
Housing Occupancy in Silver Lake
Occupancy by Ownership in Silver Lake
Of the total 351 dwellings in Silver Lake, owner-occupied units account for 278 (79.2%), while renter-occupied units make up 73 (20.8%).
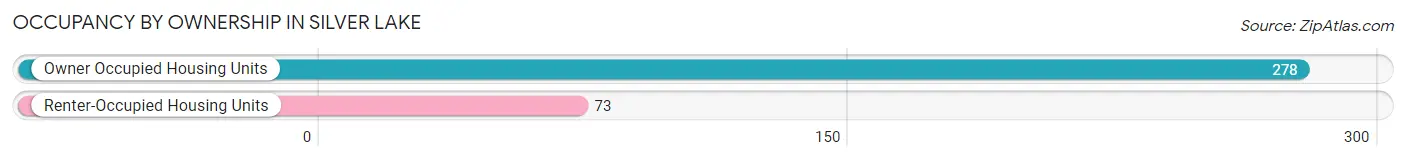
| Occupancy | # Housing Units | % Housing Units |
| Owner Occupied Housing Units | 278 | 79.2% |
| Renter-Occupied Housing Units | 73 | 20.8% |
| Total Occupied Housing Units | 351 | 100.0% |
Occupancy by Household Size in Silver Lake
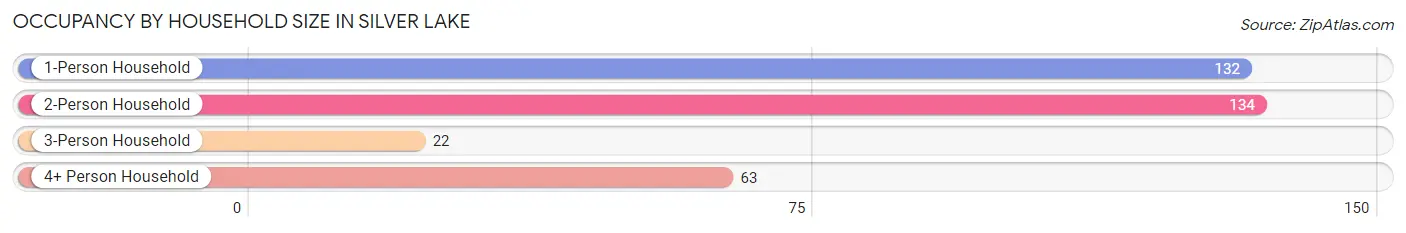
| Household Size | # Housing Units | % Housing Units |
| 1-Person Household | 132 | 37.6% |
| 2-Person Household | 134 | 38.2% |
| 3-Person Household | 22 | 6.3% |
| 4+ Person Household | 63 | 17.9% |
| Total Housing Units | 351 | 100.0% |
Occupancy by Ownership by Household Size in Silver Lake
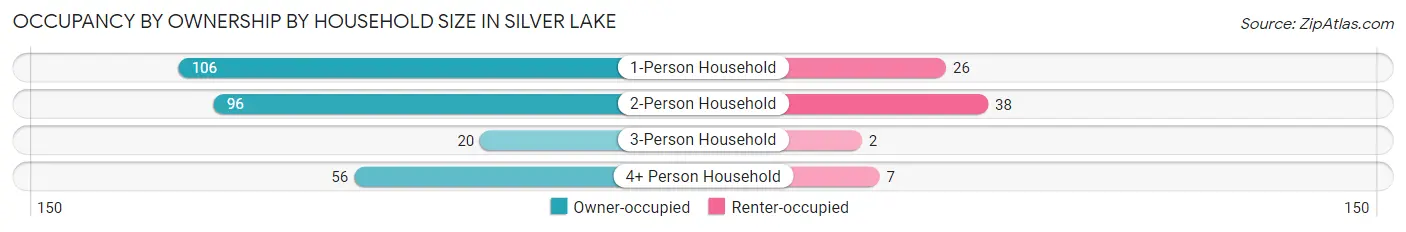
| Household Size | Owner-occupied | Renter-occupied |
| 1-Person Household | 106 (80.3%) | 26 (19.7%) |
| 2-Person Household | 96 (71.6%) | 38 (28.4%) |
| 3-Person Household | 20 (90.9%) | 2 (9.1%) |
| 4+ Person Household | 56 (88.9%) | 7 (11.1%) |
| Total Housing Units | 278 (79.2%) | 73 (20.8%) |
Occupancy by Educational Attainment in Silver Lake
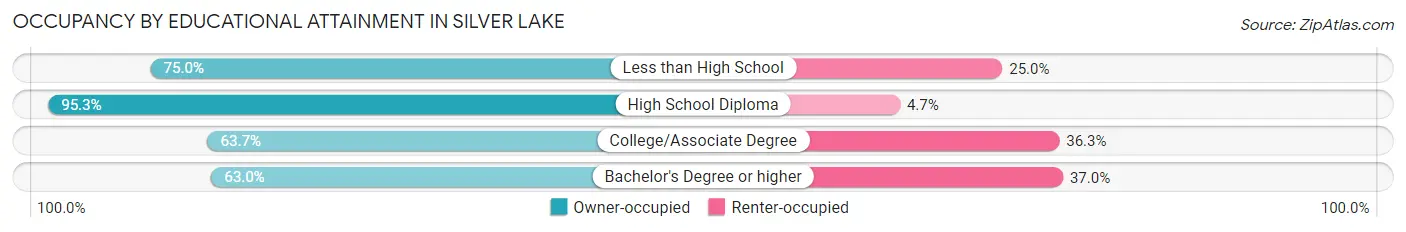
| Household Size | Owner-occupied | Renter-occupied |
| Less than High School | 6 (75.0%) | 2 (25.0%) |
| High School Diploma | 162 (95.3%) | 8 (4.7%) |
| College/Associate Degree | 93 (63.7%) | 53 (36.3%) |
| Bachelor's Degree or higher | 17 (63.0%) | 10 (37.0%) |
Occupancy by Age of Householder in Silver Lake
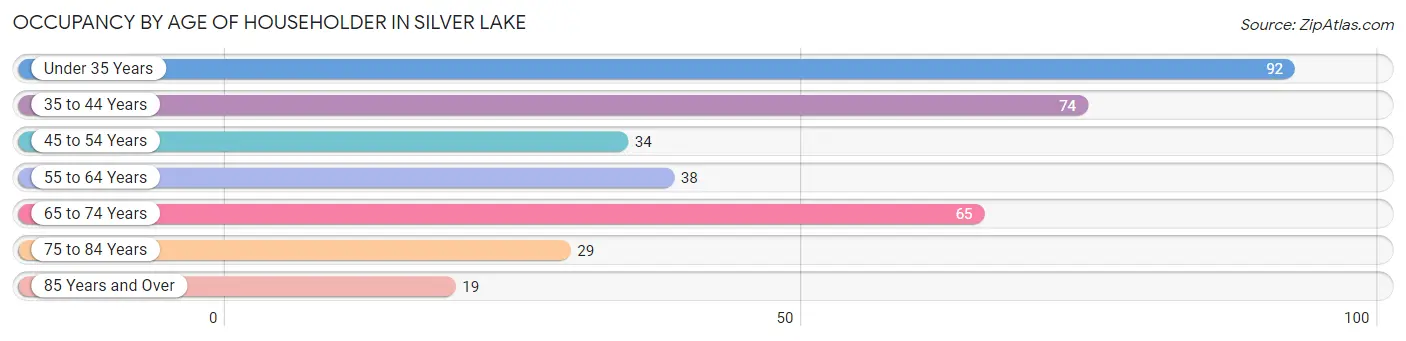
| Age Bracket | # Households | % Households |
| Under 35 Years | 92 | 26.2% |
| 35 to 44 Years | 74 | 21.1% |
| 45 to 54 Years | 34 | 9.7% |
| 55 to 64 Years | 38 | 10.8% |
| 65 to 74 Years | 65 | 18.5% |
| 75 to 84 Years | 29 | 8.3% |
| 85 Years and Over | 19 | 5.4% |
| Total | 351 | 100.0% |
Housing Finances in Silver Lake
Median Income by Occupancy in Silver Lake
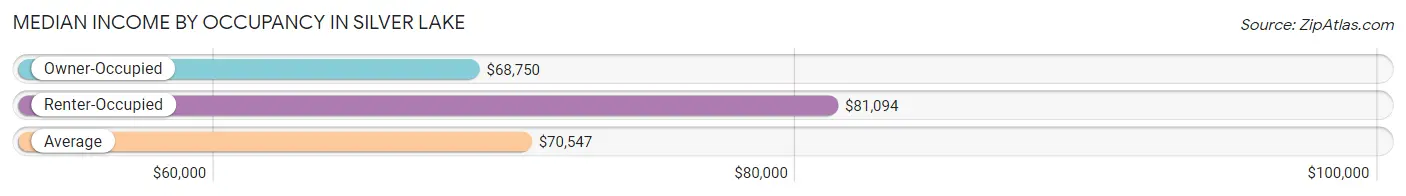
| Occupancy Type | # Households | Median Income |
| Owner-Occupied | 278 (79.2%) | $68,750 |
| Renter-Occupied | 73 (20.8%) | $81,094 |
| Average | 351 (100.0%) | $70,547 |
Occupancy by Householder Income Bracket in Silver Lake
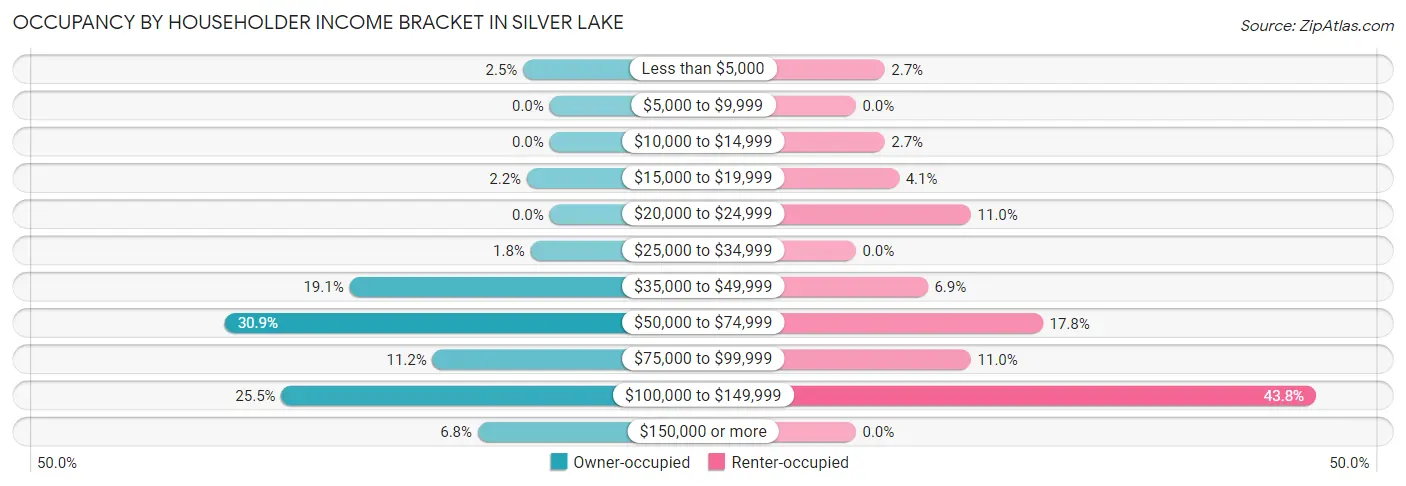
| Income Bracket | Owner-occupied | Renter-occupied |
| Less than $5,000 | 7 (2.5%) | 2 (2.7%) |
| $5,000 to $9,999 | 0 (0.0%) | 0 (0.0%) |
| $10,000 to $14,999 | 0 (0.0%) | 2 (2.7%) |
| $15,000 to $19,999 | 6 (2.2%) | 3 (4.1%) |
| $20,000 to $24,999 | 0 (0.0%) | 8 (11.0%) |
| $25,000 to $34,999 | 5 (1.8%) | 0 (0.0%) |
| $35,000 to $49,999 | 53 (19.1%) | 5 (6.9%) |
| $50,000 to $74,999 | 86 (30.9%) | 13 (17.8%) |
| $75,000 to $99,999 | 31 (11.2%) | 8 (11.0%) |
| $100,000 to $149,999 | 71 (25.5%) | 32 (43.8%) |
| $150,000 or more | 19 (6.8%) | 0 (0.0%) |
| Total | 278 (100.0%) | 73 (100.0%) |
Monthly Housing Cost Tiers in Silver Lake
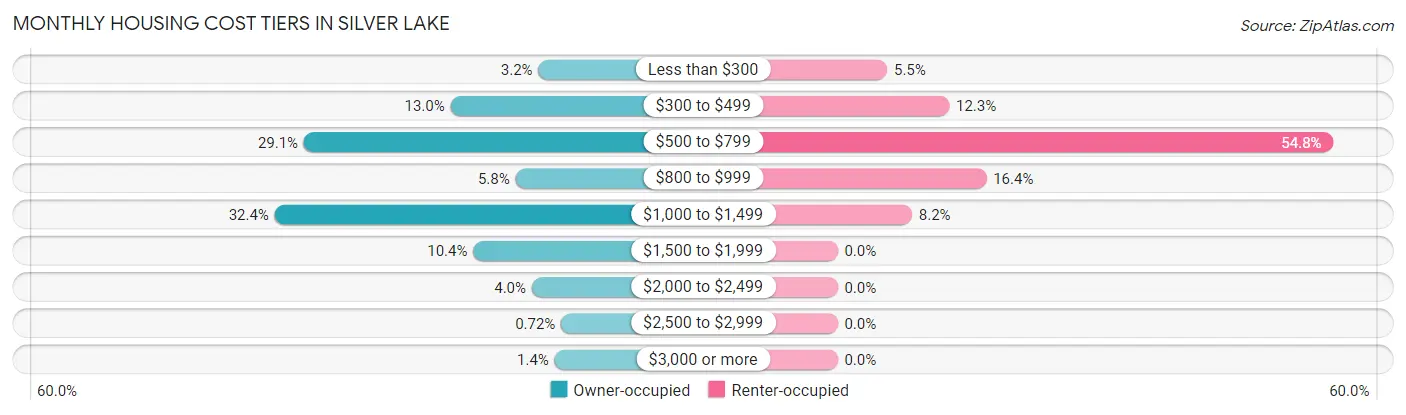
| Monthly Cost | Owner-occupied | Renter-occupied |
| Less than $300 | 9 (3.2%) | 4 (5.5%) |
| $300 to $499 | 36 (13.0%) | 9 (12.3%) |
| $500 to $799 | 81 (29.1%) | 40 (54.8%) |
| $800 to $999 | 16 (5.8%) | 12 (16.4%) |
| $1,000 to $1,499 | 90 (32.4%) | 6 (8.2%) |
| $1,500 to $1,999 | 29 (10.4%) | 0 (0.0%) |
| $2,000 to $2,499 | 11 (4.0%) | 0 (0.0%) |
| $2,500 to $2,999 | 2 (0.7%) | 0 (0.0%) |
| $3,000 or more | 4 (1.4%) | 0 (0.0%) |
| Total | 278 (100.0%) | 73 (100.0%) |
Physical Housing Characteristics in Silver Lake
Housing Structures in Silver Lake
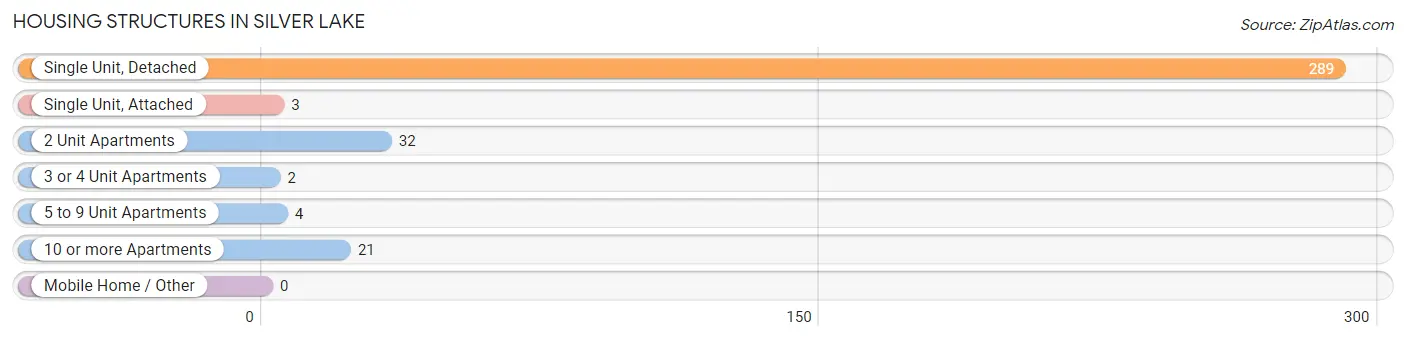
| Structure Type | # Housing Units | % Housing Units |
| Single Unit, Detached | 289 | 82.3% |
| Single Unit, Attached | 3 | 0.9% |
| 2 Unit Apartments | 32 | 9.1% |
| 3 or 4 Unit Apartments | 2 | 0.6% |
| 5 to 9 Unit Apartments | 4 | 1.1% |
| 10 or more Apartments | 21 | 6.0% |
| Mobile Home / Other | 0 | 0.0% |
| Total | 351 | 100.0% |
Housing Structures by Occupancy in Silver Lake
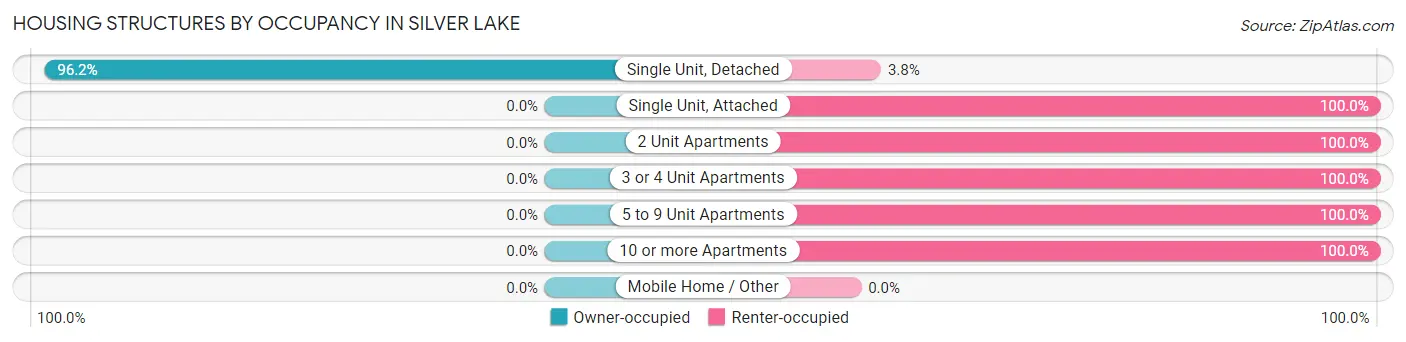
| Structure Type | Owner-occupied | Renter-occupied |
| Single Unit, Detached | 278 (96.2%) | 11 (3.8%) |
| Single Unit, Attached | 0 (0.0%) | 3 (100.0%) |
| 2 Unit Apartments | 0 (0.0%) | 32 (100.0%) |
| 3 or 4 Unit Apartments | 0 (0.0%) | 2 (100.0%) |
| 5 to 9 Unit Apartments | 0 (0.0%) | 4 (100.0%) |
| 10 or more Apartments | 0 (0.0%) | 21 (100.0%) |
| Mobile Home / Other | 0 (0.0%) | 0 (0.0%) |
| Total | 278 (79.2%) | 73 (20.8%) |
Housing Structures by Number of Rooms in Silver Lake
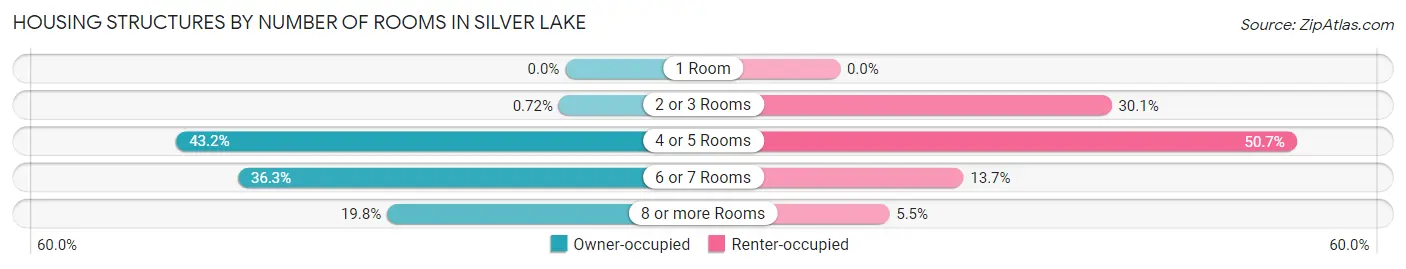
| Number of Rooms | Owner-occupied | Renter-occupied |
| 1 Room | 0 (0.0%) | 0 (0.0%) |
| 2 or 3 Rooms | 2 (0.7%) | 22 (30.1%) |
| 4 or 5 Rooms | 120 (43.2%) | 37 (50.7%) |
| 6 or 7 Rooms | 101 (36.3%) | 10 (13.7%) |
| 8 or more Rooms | 55 (19.8%) | 4 (5.5%) |
| Total | 278 (100.0%) | 73 (100.0%) |
Housing Structure by Heating Type in Silver Lake
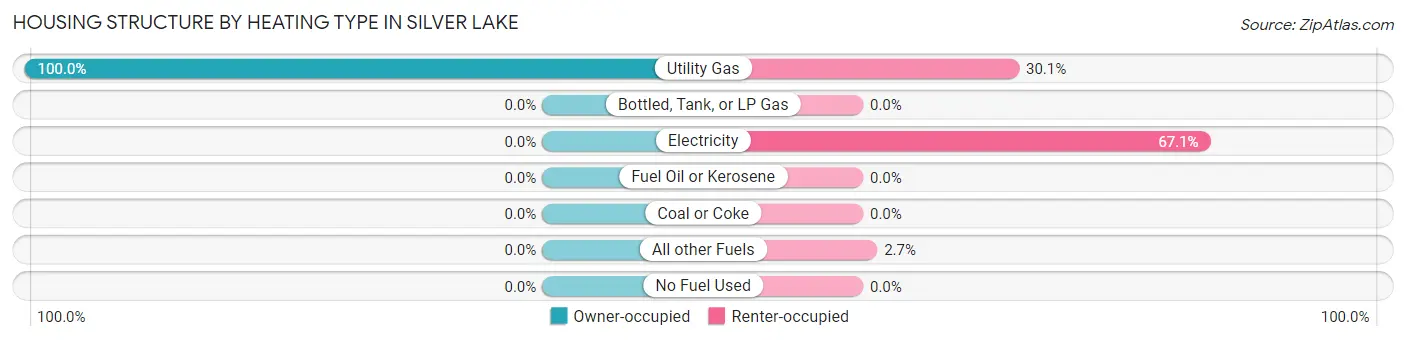
| Heating Type | Owner-occupied | Renter-occupied |
| Utility Gas | 278 (100.0%) | 22 (30.1%) |
| Bottled, Tank, or LP Gas | 0 (0.0%) | 0 (0.0%) |
| Electricity | 0 (0.0%) | 49 (67.1%) |
| Fuel Oil or Kerosene | 0 (0.0%) | 0 (0.0%) |
| Coal or Coke | 0 (0.0%) | 0 (0.0%) |
| All other Fuels | 0 (0.0%) | 2 (2.7%) |
| No Fuel Used | 0 (0.0%) | 0 (0.0%) |
| Total | 278 (100.0%) | 73 (100.0%) |
Household Vehicle Usage in Silver Lake
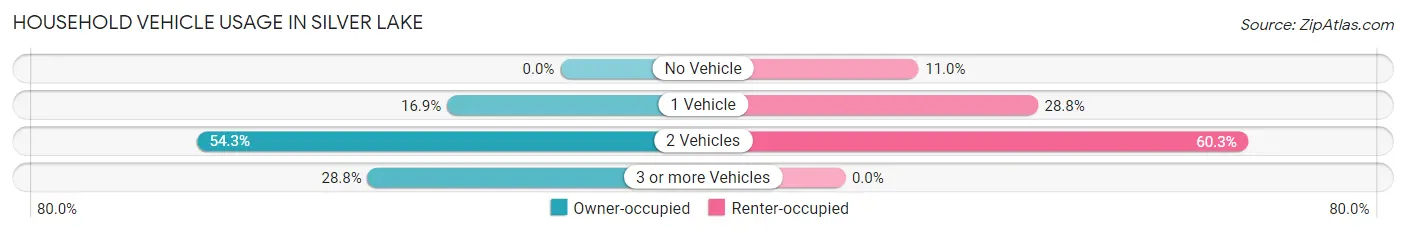
| Vehicles per Household | Owner-occupied | Renter-occupied |
| No Vehicle | 0 (0.0%) | 8 (11.0%) |
| 1 Vehicle | 47 (16.9%) | 21 (28.8%) |
| 2 Vehicles | 151 (54.3%) | 44 (60.3%) |
| 3 or more Vehicles | 80 (28.8%) | 0 (0.0%) |
| Total | 278 (100.0%) | 73 (100.0%) |
Real Estate & Mortgages in Silver Lake
Real Estate and Mortgage Overview in Silver Lake
| Characteristic | Without Mortgage | With Mortgage |
| Housing Units | 127 | 151 |
| Median Property Value | $155,100 | $170,600 |
| Median Household Income | $61,042 | $11 |
| Monthly Housing Costs | $551 | $4 |
| Real Estate Taxes | $2,594 | $0 |
Property Value by Mortgage Status in Silver Lake
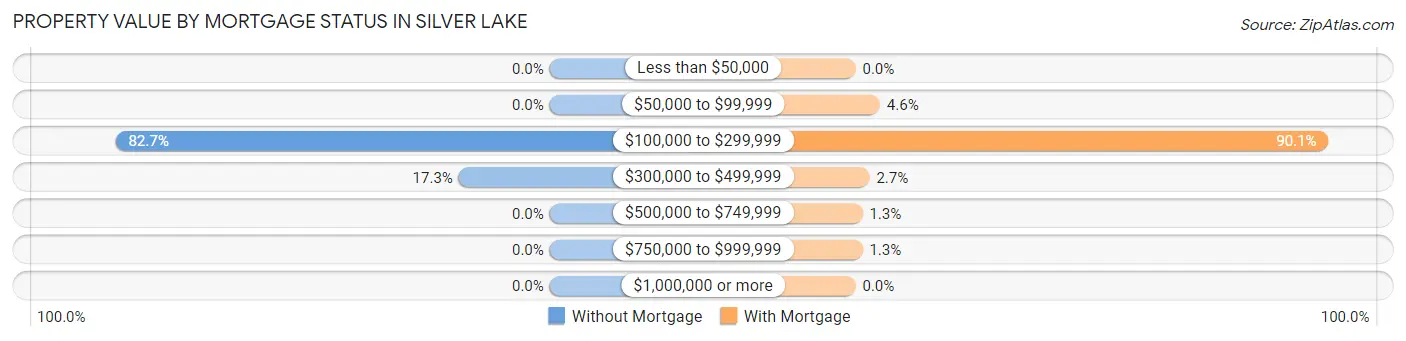
| Property Value | Without Mortgage | With Mortgage |
| Less than $50,000 | 0 (0.0%) | 0 (0.0%) |
| $50,000 to $99,999 | 0 (0.0%) | 7 (4.6%) |
| $100,000 to $299,999 | 105 (82.7%) | 136 (90.1%) |
| $300,000 to $499,999 | 22 (17.3%) | 4 (2.6%) |
| $500,000 to $749,999 | 0 (0.0%) | 2 (1.3%) |
| $750,000 to $999,999 | 0 (0.0%) | 2 (1.3%) |
| $1,000,000 or more | 0 (0.0%) | 0 (0.0%) |
| Total | 127 (100.0%) | 151 (100.0%) |
Household Income by Mortgage Status in Silver Lake
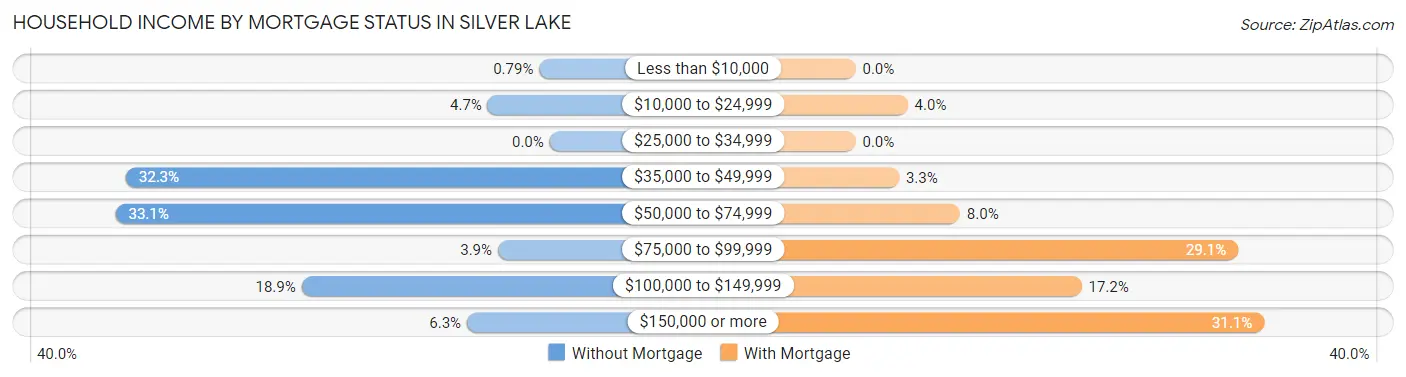
| Household Income | Without Mortgage | With Mortgage |
| Less than $10,000 | 1 (0.8%) | 0 (0.0%) |
| $10,000 to $24,999 | 6 (4.7%) | 6 (4.0%) |
| $25,000 to $34,999 | 0 (0.0%) | 0 (0.0%) |
| $35,000 to $49,999 | 41 (32.3%) | 5 (3.3%) |
| $50,000 to $74,999 | 42 (33.1%) | 12 (8.0%) |
| $75,000 to $99,999 | 5 (3.9%) | 44 (29.1%) |
| $100,000 to $149,999 | 24 (18.9%) | 26 (17.2%) |
| $150,000 or more | 8 (6.3%) | 47 (31.1%) |
| Total | 127 (100.0%) | 151 (100.0%) |
Property Value to Household Income Ratio in Silver Lake
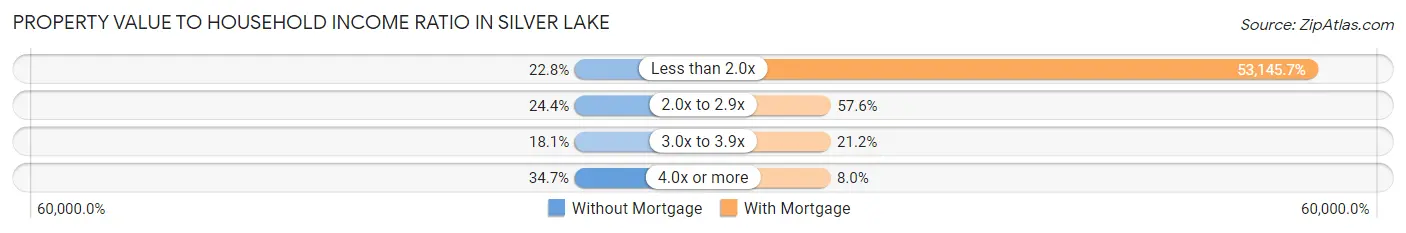
| Value-to-Income Ratio | Without Mortgage | With Mortgage |
| Less than 2.0x | 29 (22.8%) | 80,250 (53,145.7%) |
| 2.0x to 2.9x | 31 (24.4%) | 87 (57.6%) |
| 3.0x to 3.9x | 23 (18.1%) | 32 (21.2%) |
| 4.0x or more | 44 (34.6%) | 12 (8.0%) |
| Total | 127 (100.0%) | 151 (100.0%) |
Real Estate Taxes by Mortgage Status in Silver Lake
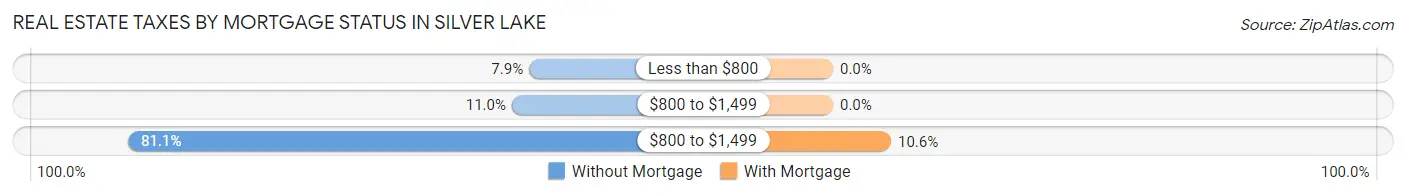
| Property Taxes | Without Mortgage | With Mortgage |
| Less than $800 | 10 (7.9%) | 0 (0.0%) |
| $800 to $1,499 | 14 (11.0%) | 0 (0.0%) |
| $800 to $1,499 | 103 (81.1%) | 16 (10.6%) |
| Total | 127 (100.0%) | 151 (100.0%) |
Health & Disability in Silver Lake
Health Insurance Coverage by Age in Silver Lake
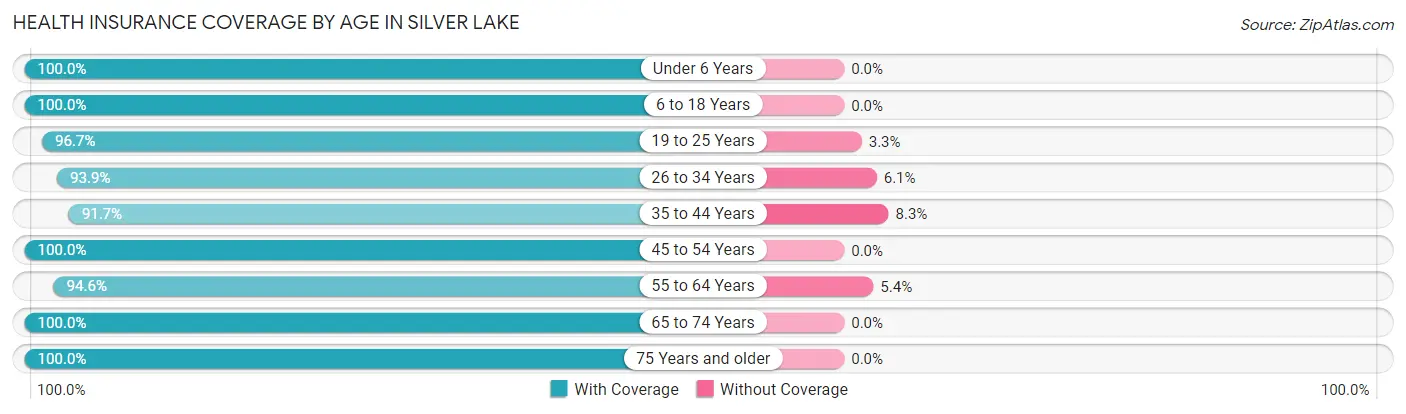
| Age Bracket | With Coverage | Without Coverage |
| Under 6 Years | 41 (100.0%) | 0 (0.0%) |
| 6 to 18 Years | 129 (100.0%) | 0 (0.0%) |
| 19 to 25 Years | 89 (96.7%) | 3 (3.3%) |
| 26 to 34 Years | 62 (93.9%) | 4 (6.1%) |
| 35 to 44 Years | 111 (91.7%) | 10 (8.3%) |
| 45 to 54 Years | 58 (100.0%) | 0 (0.0%) |
| 55 to 64 Years | 122 (94.6%) | 7 (5.4%) |
| 65 to 74 Years | 88 (100.0%) | 0 (0.0%) |
| 75 Years and older | 71 (100.0%) | 0 (0.0%) |
| Total | 771 (97.0%) | 24 (3.0%) |
Health Insurance Coverage by Citizenship Status in Silver Lake
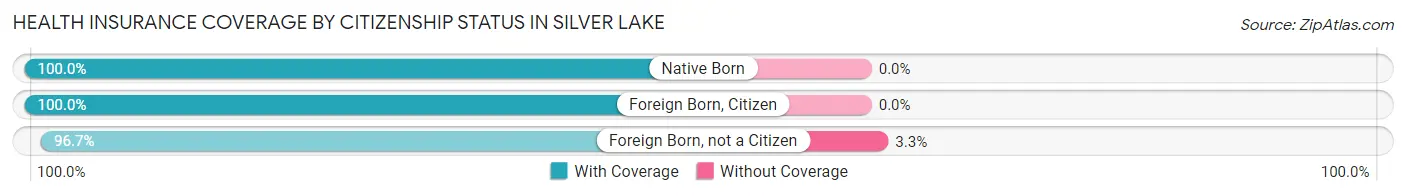
| Citizenship Status | With Coverage | Without Coverage |
| Native Born | 41 (100.0%) | 0 (0.0%) |
| Foreign Born, Citizen | 129 (100.0%) | 0 (0.0%) |
| Foreign Born, not a Citizen | 89 (96.7%) | 3 (3.3%) |
Health Insurance Coverage by Household Income in Silver Lake
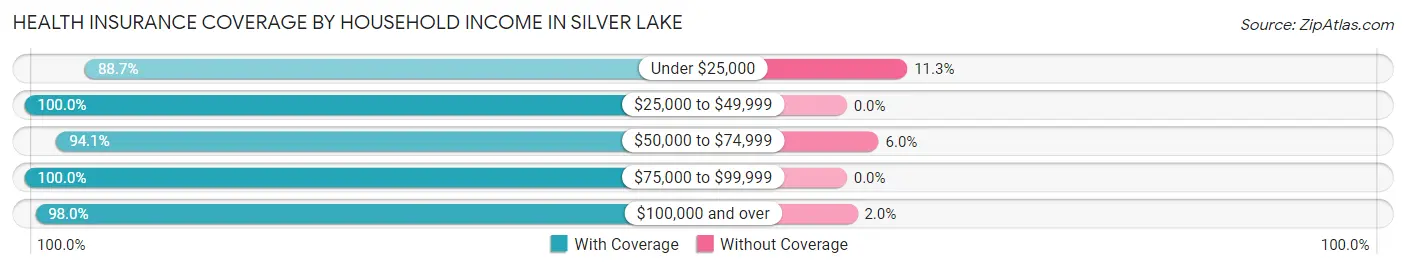
| Household Income | With Coverage | Without Coverage |
| Under $25,000 | 47 (88.7%) | 6 (11.3%) |
| $25,000 to $49,999 | 90 (100.0%) | 0 (0.0%) |
| $50,000 to $74,999 | 174 (94.1%) | 11 (5.9%) |
| $75,000 to $99,999 | 117 (100.0%) | 0 (0.0%) |
| $100,000 and over | 343 (98.0%) | 7 (2.0%) |
Public vs Private Health Insurance Coverage by Age in Silver Lake
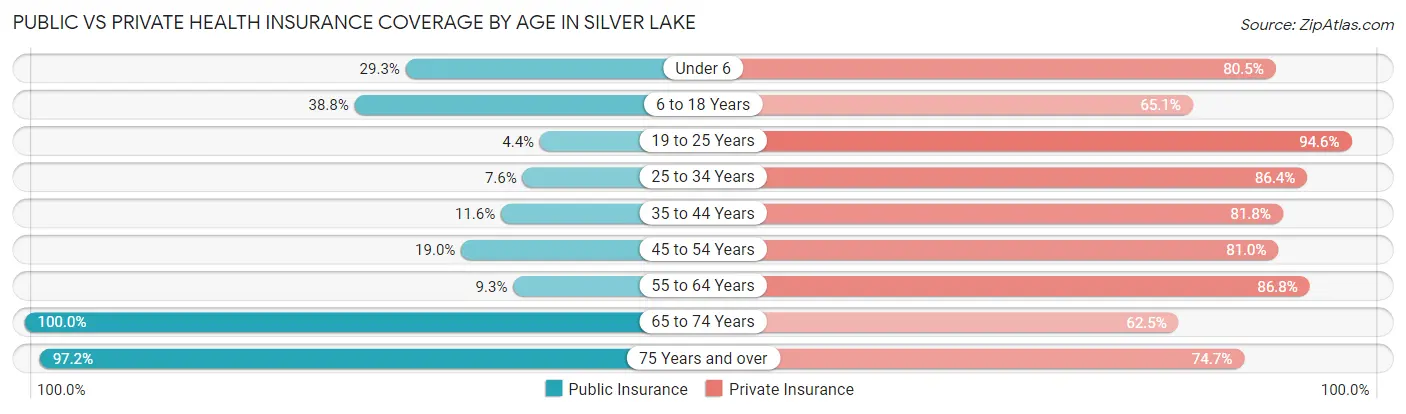
| Age Bracket | Public Insurance | Private Insurance |
| Under 6 | 12 (29.3%) | 33 (80.5%) |
| 6 to 18 Years | 50 (38.8%) | 84 (65.1%) |
| 19 to 25 Years | 4 (4.3%) | 87 (94.6%) |
| 25 to 34 Years | 5 (7.6%) | 57 (86.4%) |
| 35 to 44 Years | 14 (11.6%) | 99 (81.8%) |
| 45 to 54 Years | 11 (19.0%) | 47 (81.0%) |
| 55 to 64 Years | 12 (9.3%) | 112 (86.8%) |
| 65 to 74 Years | 88 (100.0%) | 55 (62.5%) |
| 75 Years and over | 69 (97.2%) | 53 (74.7%) |
| Total | 265 (33.3%) | 627 (78.9%) |
Disability Status by Sex by Age in Silver Lake
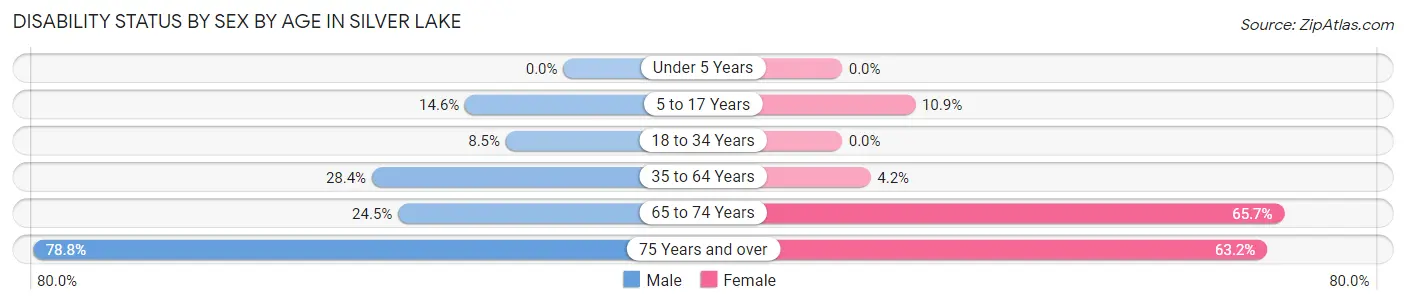
| Age Bracket | Male | Female |
| Under 5 Years | 0 (0.0%) | 0 (0.0%) |
| 5 to 17 Years | 7 (14.6%) | 10 (10.9%) |
| 18 to 34 Years | 7 (8.5%) | 0 (0.0%) |
| 35 to 64 Years | 54 (28.4%) | 5 (4.2%) |
| 65 to 74 Years | 13 (24.5%) | 23 (65.7%) |
| 75 Years and over | 26 (78.8%) | 24 (63.2%) |
Disability Class by Sex by Age in Silver Lake
Disability Class: Hearing Difficulty
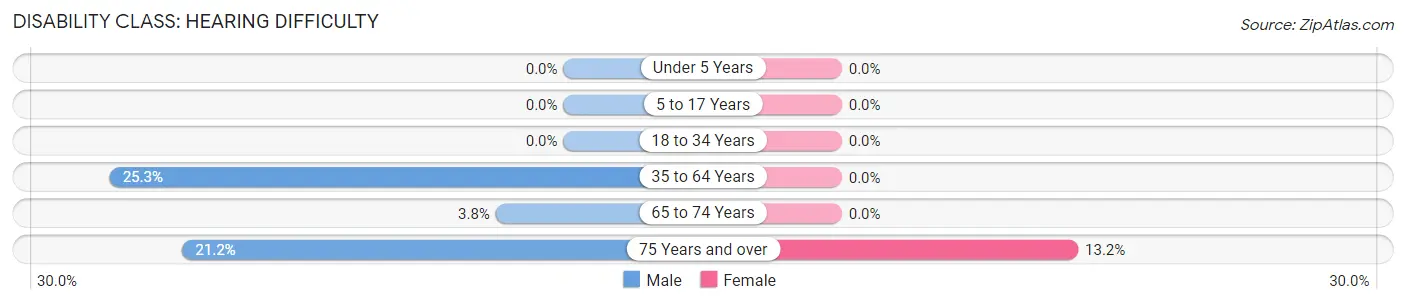
| Age Bracket | Male | Female |
| Under 5 Years | 0 (0.0%) | 0 (0.0%) |
| 5 to 17 Years | 0 (0.0%) | 0 (0.0%) |
| 18 to 34 Years | 0 (0.0%) | 0 (0.0%) |
| 35 to 64 Years | 48 (25.3%) | 0 (0.0%) |
| 65 to 74 Years | 2 (3.8%) | 0 (0.0%) |
| 75 Years and over | 7 (21.2%) | 5 (13.2%) |
Disability Class: Vision Difficulty
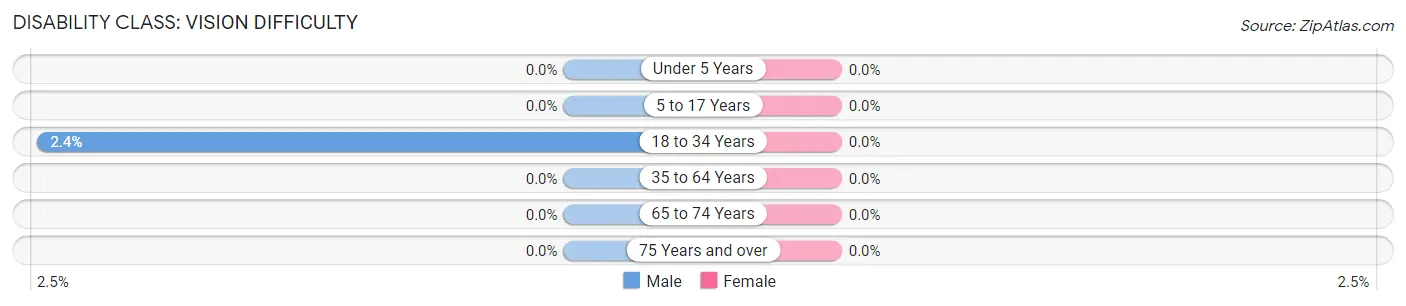
| Age Bracket | Male | Female |
| Under 5 Years | 0 (0.0%) | 0 (0.0%) |
| 5 to 17 Years | 0 (0.0%) | 0 (0.0%) |
| 18 to 34 Years | 2 (2.4%) | 0 (0.0%) |
| 35 to 64 Years | 0 (0.0%) | 0 (0.0%) |
| 65 to 74 Years | 0 (0.0%) | 0 (0.0%) |
| 75 Years and over | 0 (0.0%) | 0 (0.0%) |
Disability Class: Cognitive Difficulty
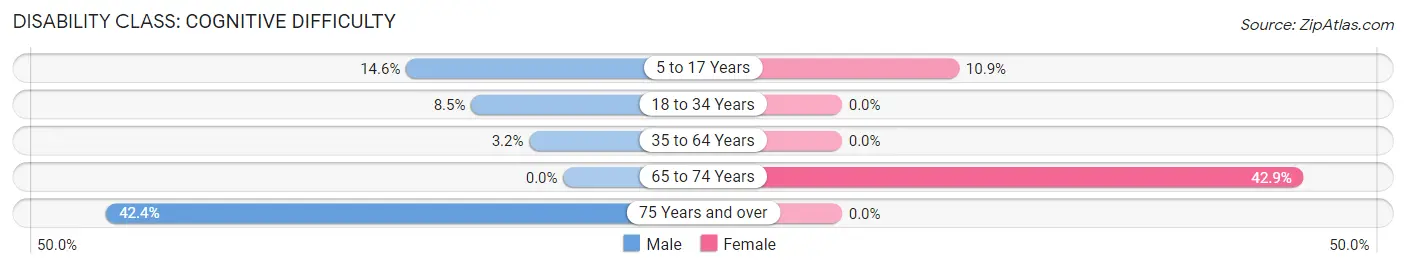
| Age Bracket | Male | Female |
| 5 to 17 Years | 7 (14.6%) | 10 (10.9%) |
| 18 to 34 Years | 7 (8.5%) | 0 (0.0%) |
| 35 to 64 Years | 6 (3.2%) | 0 (0.0%) |
| 65 to 74 Years | 0 (0.0%) | 15 (42.9%) |
| 75 Years and over | 14 (42.4%) | 0 (0.0%) |
Disability Class: Ambulatory Difficulty
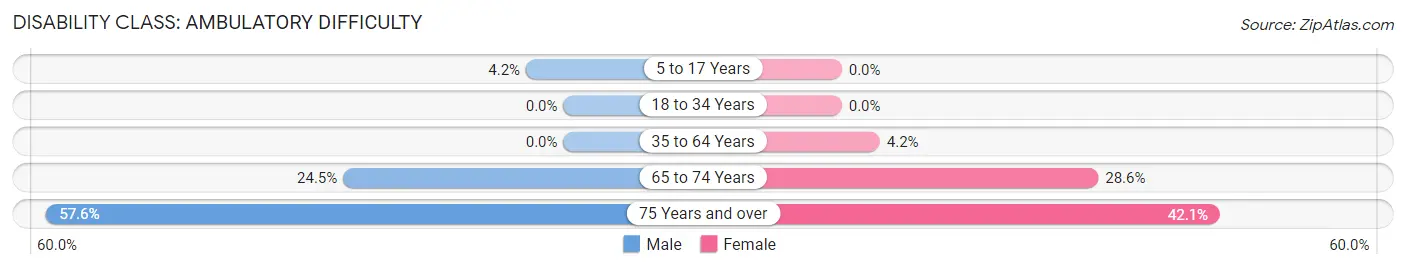
| Age Bracket | Male | Female |
| 5 to 17 Years | 2 (4.2%) | 0 (0.0%) |
| 18 to 34 Years | 0 (0.0%) | 0 (0.0%) |
| 35 to 64 Years | 0 (0.0%) | 5 (4.2%) |
| 65 to 74 Years | 13 (24.5%) | 10 (28.6%) |
| 75 Years and over | 19 (57.6%) | 16 (42.1%) |
Disability Class: Self-Care Difficulty
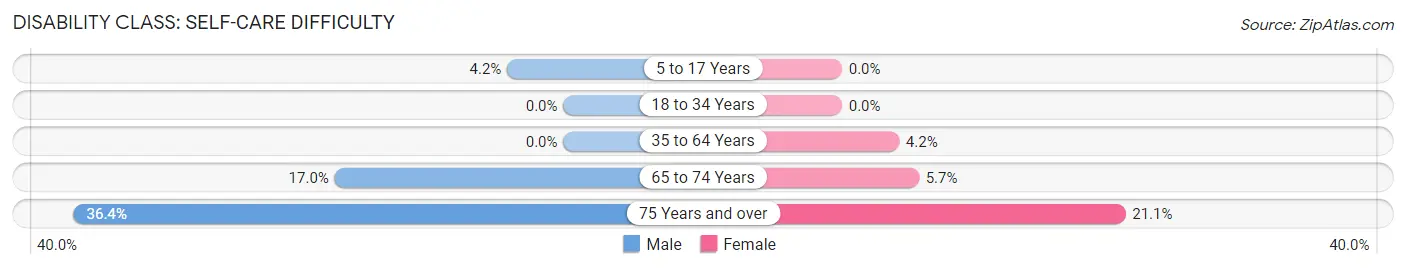
| Age Bracket | Male | Female |
| 5 to 17 Years | 2 (4.2%) | 0 (0.0%) |
| 18 to 34 Years | 0 (0.0%) | 0 (0.0%) |
| 35 to 64 Years | 0 (0.0%) | 5 (4.2%) |
| 65 to 74 Years | 9 (17.0%) | 2 (5.7%) |
| 75 Years and over | 12 (36.4%) | 8 (21.0%) |
Technology Access in Silver Lake
Computing Device Access in Silver Lake
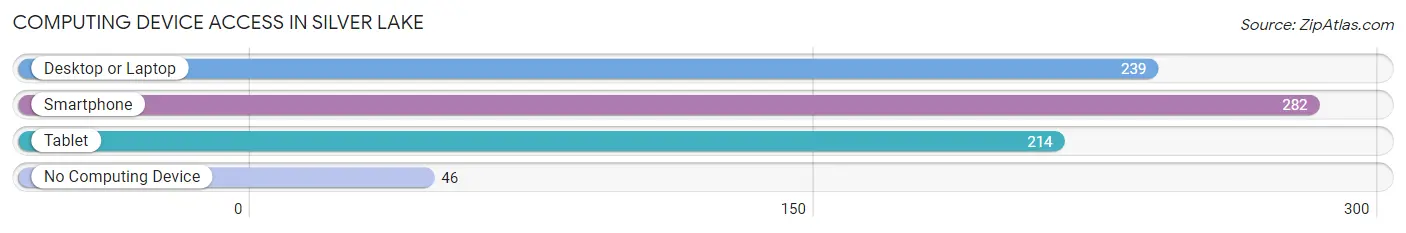
| Device Type | # Households | % Households |
| Desktop or Laptop | 239 | 68.1% |
| Smartphone | 282 | 80.3% |
| Tablet | 214 | 61.0% |
| No Computing Device | 46 | 13.1% |
| Total | 351 | 100.0% |
Internet Access in Silver Lake
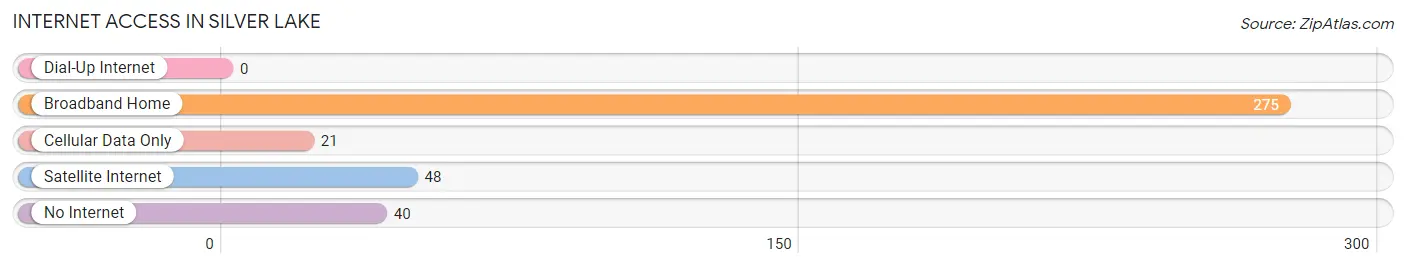
| Internet Type | # Households | % Households |
| Dial-Up Internet | 0 | 0.0% |
| Broadband Home | 275 | 78.3% |
| Cellular Data Only | 21 | 6.0% |
| Satellite Internet | 48 | 13.7% |
| No Internet | 40 | 11.4% |
| Total | 351 | 100.0% |
Silver Lake Summary
Lake Silver is a small town located in the southeastern corner of Minnesota, in the United States. It is situated in the heart of the state’s agricultural region, and is surrounded by rolling hills and lush farmland. The town is home to a population of just over 1,000 people, and is known for its small-town charm and friendly atmosphere.
History
The area around Lake Silver was first settled in the late 1800s by a group of German immigrants. The town was originally known as Silver Lake, and was named after the nearby lake of the same name. The lake was named after the silver-colored sand that was found along its shoreline.
The town was officially incorporated in 1891, and the first post office was established in 1892. The town grew slowly over the years, and by the early 1900s, it had become a popular destination for tourists and vacationers.
Geography
Lake Silver is located in the southeastern corner of Minnesota, in the United States. It is situated in the heart of the state’s agricultural region, and is surrounded by rolling hills and lush farmland. The town is located on the shores of Silver Lake, a small lake that is fed by the nearby Root River.
The town is located approximately 30 miles south of the city of Rochester, and is about an hour’s drive from the Twin Cities. The town is also located close to the Mississippi River, which is just a few miles to the east.
Economy
The economy of Lake Silver is largely based on agriculture. The town is surrounded by fertile farmland, and many of the town’s residents are involved in farming and related activities. The town is also home to a number of small businesses, including a grocery store, a hardware store, and a few restaurants.
The town is also home to a number of small manufacturing companies, which produce a variety of products, including furniture, clothing, and electronics.
Demographics
As of the 2010 census, the population of Lake Silver was 1,072. The town is predominantly white, with 92.3% of the population identifying as such. The town also has a small Hispanic population, with 4.2% of the population identifying as Hispanic or Latino.
The median household income in Lake Silver is $45,000, and the median home value is $125,000. The town has a low unemployment rate, with only 3.2% of the population being unemployed.
Conclusion
Lake Silver is a small town located in the southeastern corner of Minnesota, in the United States. It is situated in the heart of the state’s agricultural region, and is surrounded by rolling hills and lush farmland. The town is home to a population of just over 1,000 people, and is known for its small-town charm and friendly atmosphere. The economy of Lake Silver is largely based on agriculture, and the town is also home to a number of small businesses and manufacturing companies. The town is predominantly white, with 92.3% of the population identifying as such. The median household income in Lake Silver is $45,000, and the median home value is $125,000.
Common Questions
What is Per Capita Income in Silver Lake?
Per Capita income in Silver Lake is $36,828.
What is the Median Family Income in Silver Lake?
Median Family Income in Silver Lake is $80,500.
What is the Median Household income in Silver Lake?
Median Household Income in Silver Lake is $70,547.
What is Income or Wage Gap in Silver Lake?
Income or Wage Gap in Silver Lake is 26.3%.
Women in Silver Lake earn 73.7 cents for every dollar earned by a man.
What is Inequality or Gini Index in Silver Lake?
Inequality or Gini Index in Silver Lake is 0.30.
What is the Total Population of Silver Lake?
Total Population of Silver Lake is 822.
What is the Total Male Population of Silver Lake?
Total Male Population of Silver Lake is 435.
What is the Total Female Population of Silver Lake?
Total Female Population of Silver Lake is 387.
What is the Ratio of Males per 100 Females in Silver Lake?
There are 112.40 Males per 100 Females in Silver Lake.
What is the Ratio of Females per 100 Males in Silver Lake?
There are 88.97 Females per 100 Males in Silver Lake.
What is the Median Population Age in Silver Lake?
Median Population Age in Silver Lake is 42.1 Years.
What is the Average Family Size in Silver Lake
Average Family Size in Silver Lake is 3.3 People.
What is the Average Household Size in Silver Lake
Average Household Size in Silver Lake is 2.3 People.
How Large is the Labor Force in Silver Lake?
There are 468 People in the Labor Forcein in Silver Lake.
What is the Percentage of People in the Labor Force in Silver Lake?
66.9% of People are in the Labor Force in Silver Lake.
What is the Unemployment Rate in Silver Lake?
Unemployment Rate in Silver Lake is 7.5%.