Zip Codes with the Highest Percentage of Population Employed in Accommodation & Food Services in Hopkins, MN
RELATED REPORTS & OPTIONS
Accommodation & Food Services
Hopkins
Compare Zip Codes
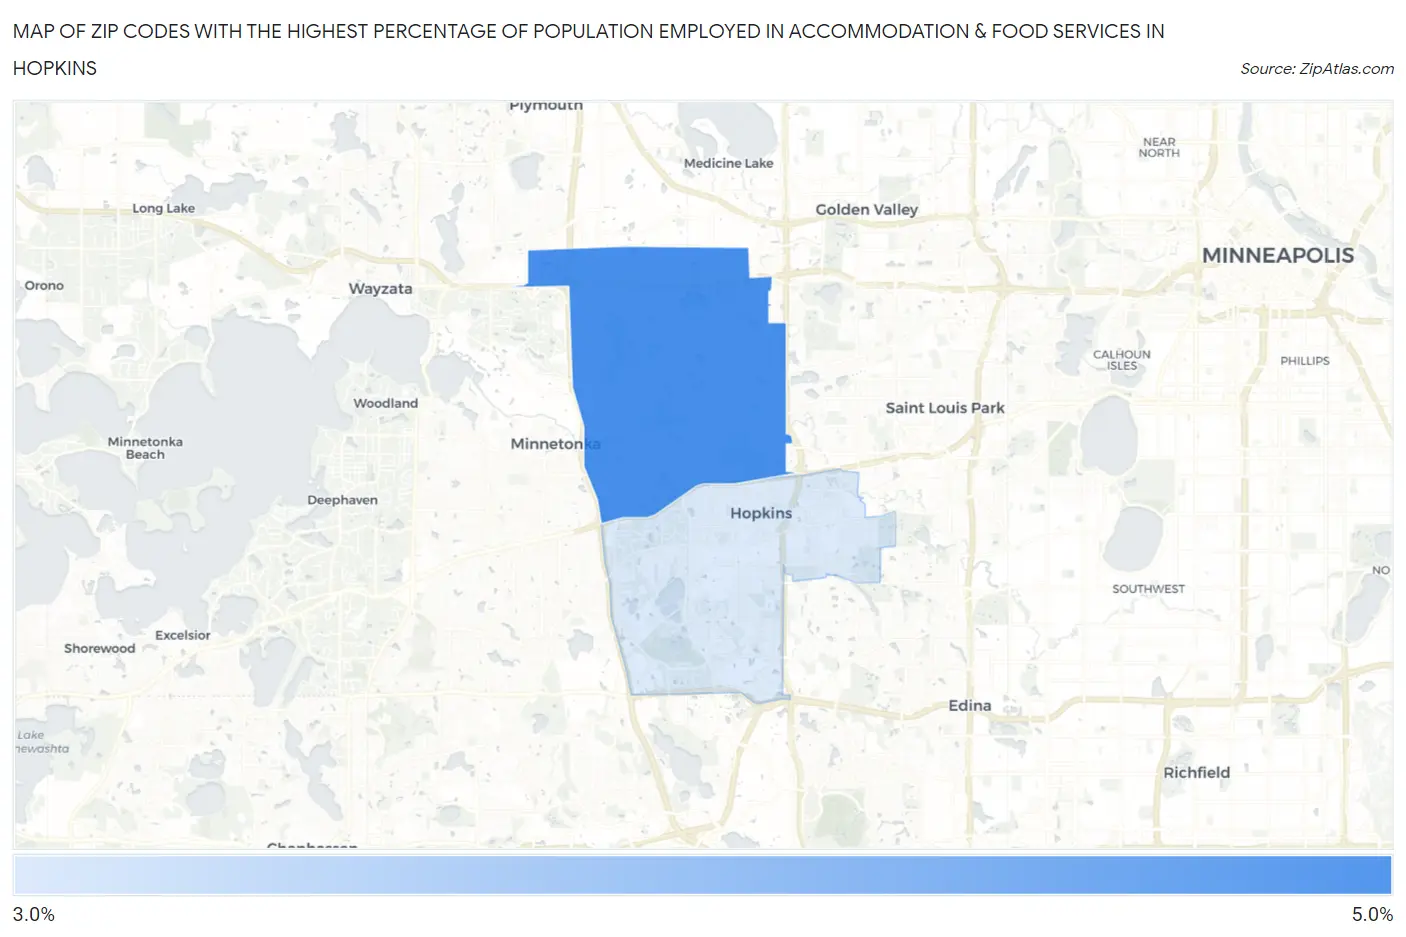
Map of Zip Codes with the Highest Percentage of Population Employed in Accommodation & Food Services in Hopkins
3.4%
4.5%
Zip Codes with the Highest Percentage of Population Employed in Accommodation & Food Services in Hopkins, MN
| Zip Code | % Employed | vs State | vs National | |
| 1. | 55305 | 4.5% | 5.5%(-0.992)#399 | 6.9%(-2.36)#18,415 |
| 2. | 55343 | 3.4% | 5.5%(-2.14)#567 | 6.9%(-3.51)#22,158 |
1
Common Questions
What are the Top Zip Codes with the Highest Percentage of Population Employed in Accommodation & Food Services in Hopkins, MN?
Top Zip Codes with the Highest Percentage of Population Employed in Accommodation & Food Services in Hopkins, MN are:
What zip code has the Highest Percentage of Population Employed in Accommodation & Food Services in Hopkins, MN?
55305 has the Highest Percentage of Population Employed in Accommodation & Food Services in Hopkins, MN with 4.5%.
What is the Percentage of Population Employed in Accommodation & Food Services in Hopkins, MN?
Percentage of Population Employed in Accommodation & Food Services in Hopkins is 3.0%.
What is the Percentage of Population Employed in Accommodation & Food Services in Minnesota?
Percentage of Population Employed in Accommodation & Food Services in Minnesota is 5.5%.
What is the Percentage of Population Employed in Accommodation & Food Services in the United States?
Percentage of Population Employed in Accommodation & Food Services in the United States is 6.9%.