Royalton, MN Map & Demographics
Royalton Map
Royalton Overview
$28,082
PER CAPITA INCOME
$75,625
AVG FAMILY INCOME
$54,167
AVG HOUSEHOLD INCOME
21.2%
WAGE / INCOME GAP [ % ]
78.8¢/ $1
WAGE / INCOME GAP [ $ ]
$6,755
FAMILY INCOME DEFICIT
0.38
INEQUALITY / GINI INDEX
1,179
TOTAL POPULATION
630
MALE POPULATION
549
FEMALE POPULATION
114.75
MALES / 100 FEMALES
87.14
FEMALES / 100 MALES
33.8
MEDIAN AGE
3.2
AVG FAMILY SIZE
2.4
AVG HOUSEHOLD SIZE
640
LABOR FORCE [ PEOPLE ]
72.9%
PERCENT IN LABOR FORCE
7.7%
UNEMPLOYMENT RATE
Royalton Zip Codes
Royalton Area Codes
Income in Royalton
Income Overview in Royalton
Per Capita Income in Royalton is $28,082, while median incomes of families and households are $75,625 and $54,167 respectively.
| Characteristic | Number | Measure |
| Per Capita Income | 1,179 | $28,082 |
| Median Family Income | 267 | $75,625 |
| Mean Family Income | 267 | $81,964 |
| Median Household Income | 488 | $54,167 |
| Mean Household Income | 488 | $67,817 |
| Income Deficit | 267 | $6,755 |
| Wage / Income Gap (%) | 1,179 | 21.24% |
| Wage / Income Gap ($) | 1,179 | 78.76¢ per $1 |
| Gini / Inequality Index | 1,179 | 0.38 |
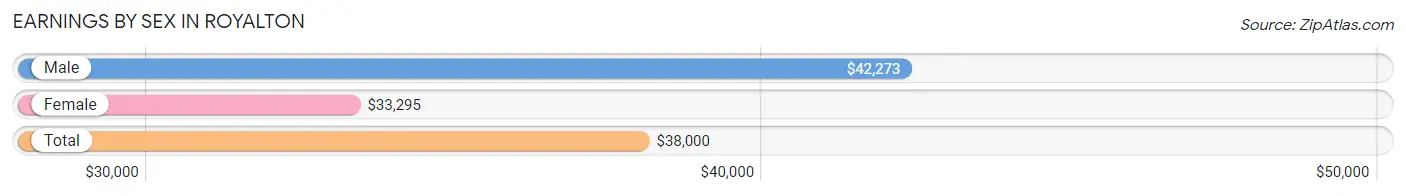
Earnings by Sex in Royalton
Average Earnings in Royalton are $38,000, $42,273 for men and $33,295 for women, a difference of 21.2%.
| Sex | Number | Average Earnings |
| Male | 346 (52.7%) | $42,273 |
| Female | 310 (47.3%) | $33,295 |
| Total | 656 (100.0%) | $38,000 |
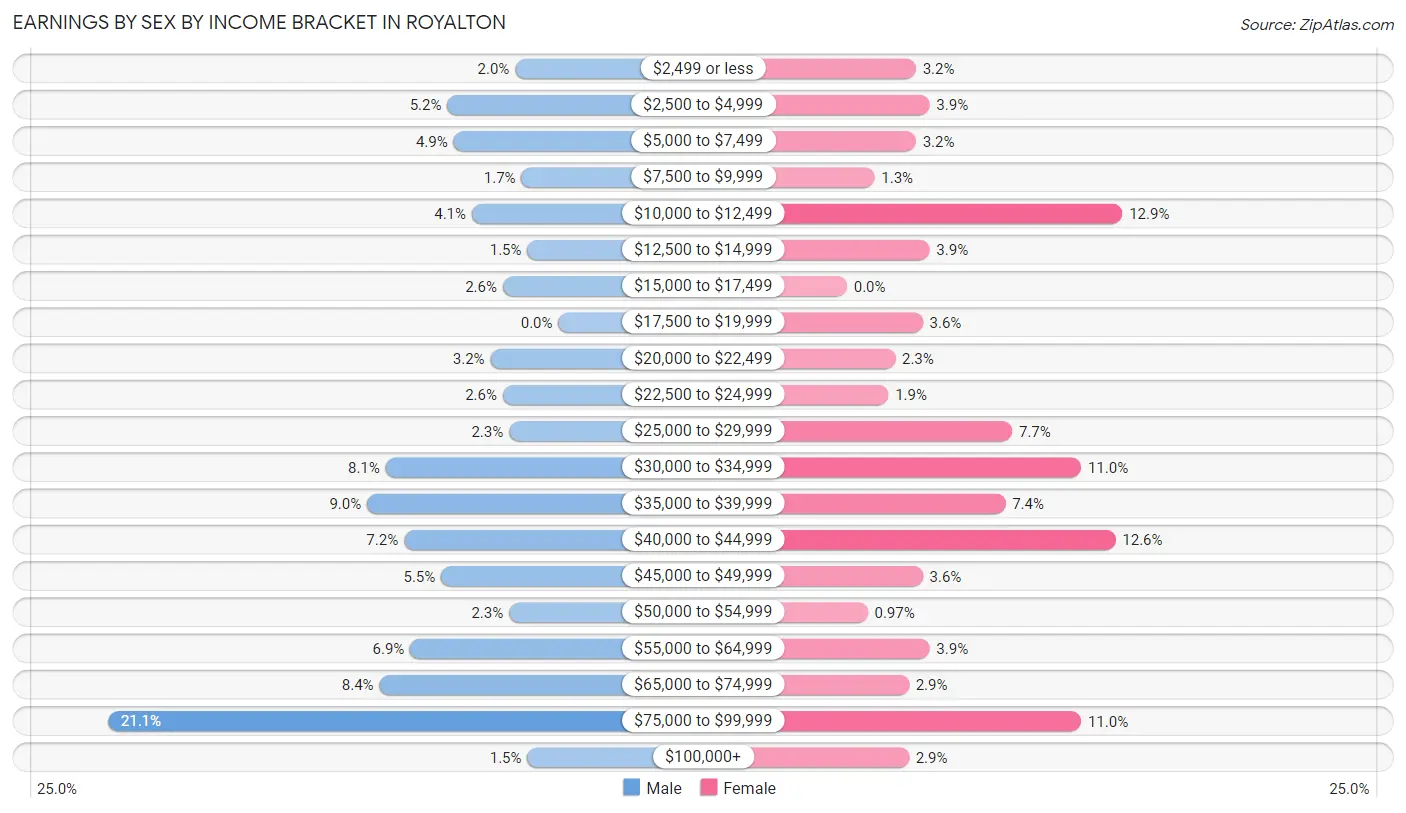
Earnings by Sex by Income Bracket in Royalton
The most common earnings brackets in Royalton are $75,000 to $99,999 for men (73 | 21.1%) and $10,000 to $12,499 for women (40 | 12.9%).
| Income | Male | Female |
| $2,499 or less | 7 (2.0%) | 10 (3.2%) |
| $2,500 to $4,999 | 18 (5.2%) | 12 (3.9%) |
| $5,000 to $7,499 | 17 (4.9%) | 10 (3.2%) |
| $7,500 to $9,999 | 6 (1.7%) | 4 (1.3%) |
| $10,000 to $12,499 | 14 (4.1%) | 40 (12.9%) |
| $12,500 to $14,999 | 5 (1.5%) | 12 (3.9%) |
| $15,000 to $17,499 | 9 (2.6%) | 0 (0.0%) |
| $17,500 to $19,999 | 0 (0.0%) | 11 (3.5%) |
| $20,000 to $22,499 | 11 (3.2%) | 7 (2.3%) |
| $22,500 to $24,999 | 9 (2.6%) | 6 (1.9%) |
| $25,000 to $29,999 | 8 (2.3%) | 24 (7.7%) |
| $30,000 to $34,999 | 28 (8.1%) | 34 (11.0%) |
| $35,000 to $39,999 | 31 (9.0%) | 23 (7.4%) |
| $40,000 to $44,999 | 25 (7.2%) | 39 (12.6%) |
| $45,000 to $49,999 | 19 (5.5%) | 11 (3.5%) |
| $50,000 to $54,999 | 8 (2.3%) | 3 (1.0%) |
| $55,000 to $64,999 | 24 (6.9%) | 12 (3.9%) |
| $65,000 to $74,999 | 29 (8.4%) | 9 (2.9%) |
| $75,000 to $99,999 | 73 (21.1%) | 34 (11.0%) |
| $100,000+ | 5 (1.5%) | 9 (2.9%) |
| Total | 346 (100.0%) | 310 (100.0%) |
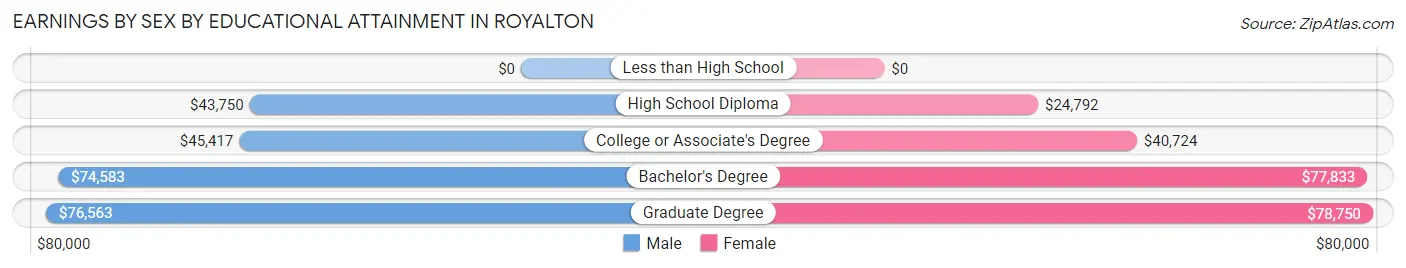
Earnings by Sex by Educational Attainment in Royalton
Average earnings in Royalton are $45,625 for men and $39,722 for women, a difference of 12.9%. Men with an educational attainment of graduate degree enjoy the highest average annual earnings of $76,563, while those with high school diploma education earn the least with $43,750. Women with an educational attainment of graduate degree earn the most with the average annual earnings of $78,750, while those with high school diploma education have the smallest earnings of $24,792.
| Educational Attainment | Male Income | Female Income |
| Less than High School | - | - |
| High School Diploma | $43,750 | $24,792 |
| College or Associate's Degree | $45,417 | $40,724 |
| Bachelor's Degree | $74,583 | $77,833 |
| Graduate Degree | $76,563 | $78,750 |
| Total | $45,625 | $39,722 |
Family Income in Royalton
Family Income Brackets in Royalton
According to the Royalton family income data, there are 51 families falling into the $50,000 to $74,999 income range, which is the most common income bracket and makes up 19.1% of all families. Conversely, the $200,000+ income bracket is the least frequent group with only 4 families (1.5%) belonging to this category.
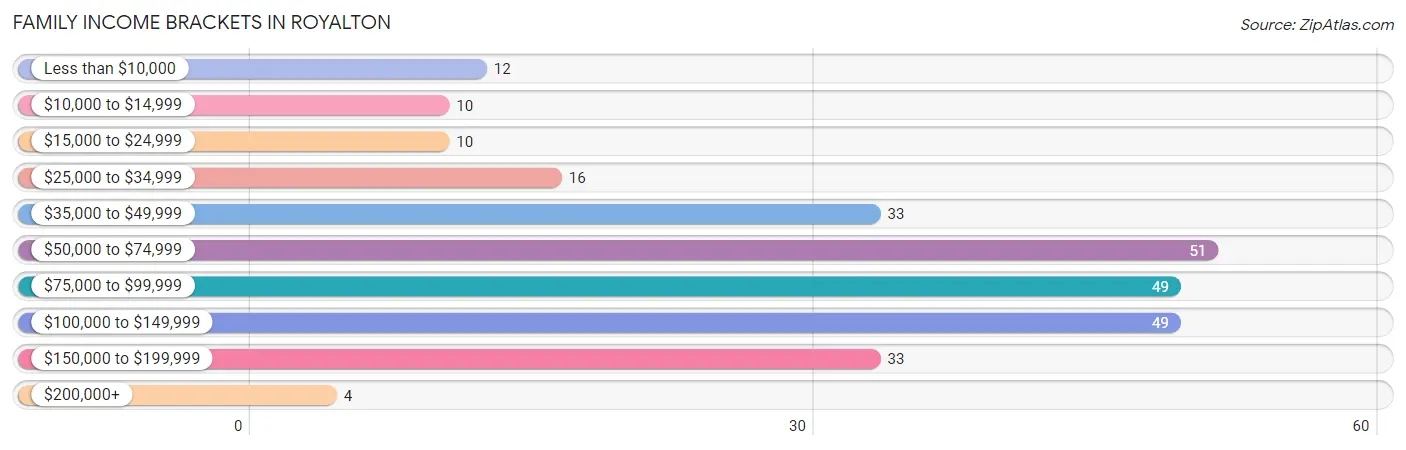
| Income Bracket | # Families | % Families |
| Less than $10,000 | 12 | 4.5% |
| $10,000 to $14,999 | 10 | 3.7% |
| $15,000 to $24,999 | 10 | 3.7% |
| $25,000 to $34,999 | 16 | 6.0% |
| $35,000 to $49,999 | 33 | 12.4% |
| $50,000 to $74,999 | 51 | 19.1% |
| $75,000 to $99,999 | 49 | 18.4% |
| $100,000 to $149,999 | 49 | 18.4% |
| $150,000 to $199,999 | 33 | 12.4% |
| $200,000+ | 4 | 1.5% |
Family Income by Famaliy Size in Royalton
5-person families (25 | 9.4%) account for the highest median family income in Royalton with $165,417 per family, while 5-person families (25 | 9.4%) have the highest median income of $33,083 per family member.
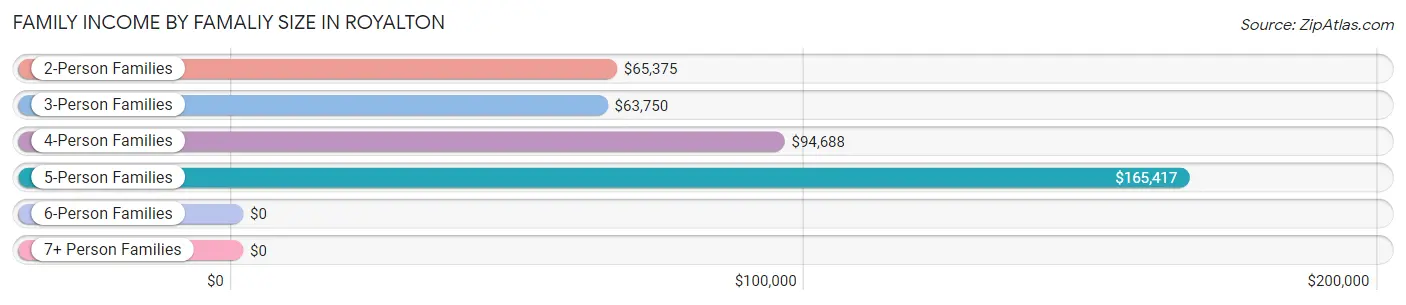
| Income Bracket | # Families | Median Income |
| 2-Person Families | 121 (45.3%) | $65,375 |
| 3-Person Families | 35 (13.1%) | $63,750 |
| 4-Person Families | 78 (29.2%) | $94,688 |
| 5-Person Families | 25 (9.4%) | $165,417 |
| 6-Person Families | 5 (1.9%) | $0 |
| 7+ Person Families | 3 (1.1%) | $0 |
| Total | 267 (100.0%) | $75,625 |
Family Income by Number of Earners in Royalton
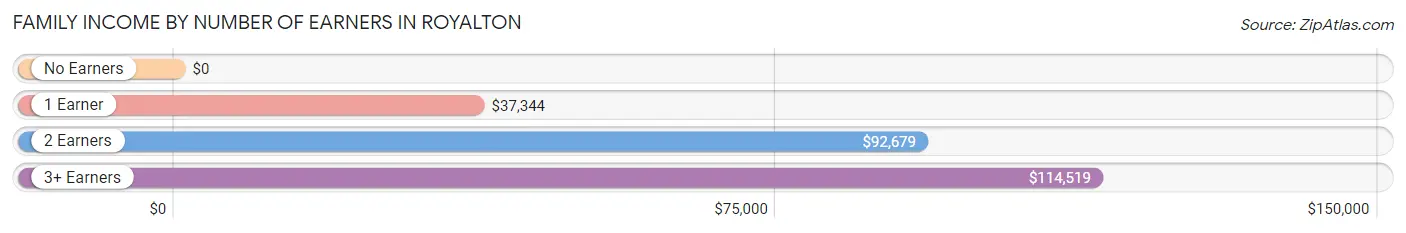
| Number of Earners | # Families | Median Income |
| No Earners | 28 (10.5%) | $0 |
| 1 Earner | 73 (27.3%) | $37,344 |
| 2 Earners | 131 (49.1%) | $92,679 |
| 3+ Earners | 35 (13.1%) | $114,519 |
| Total | 267 (100.0%) | $75,625 |
Household Income in Royalton
Household Income Brackets in Royalton
With 85 households falling in the category, the $50,000 to $74,999 income range is the most frequent in Royalton, accounting for 17.4% of all households. In contrast, only 4 households (0.8%) fall into the $200,000+ income bracket, making it the least populous group.
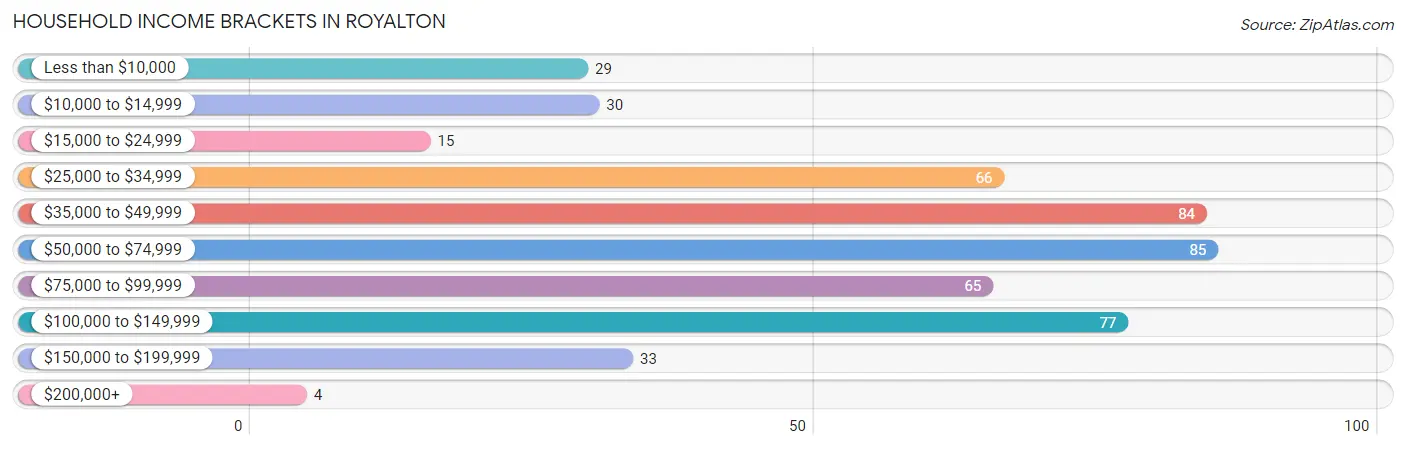
| Income Bracket | # Households | % Households |
| Less than $10,000 | 29 | 5.9% |
| $10,000 to $14,999 | 30 | 6.1% |
| $15,000 to $24,999 | 15 | 3.1% |
| $25,000 to $34,999 | 66 | 13.5% |
| $35,000 to $49,999 | 84 | 17.2% |
| $50,000 to $74,999 | 85 | 17.4% |
| $75,000 to $99,999 | 65 | 13.3% |
| $100,000 to $149,999 | 77 | 15.8% |
| $150,000 to $199,999 | 33 | 6.8% |
| $200,000+ | 4 | 0.8% |
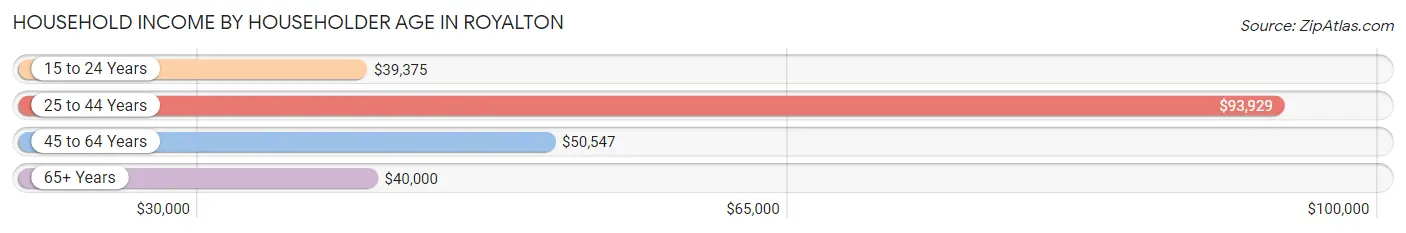
Household Income by Householder Age in Royalton
The median household income in Royalton is $54,167, with the highest median household income of $93,929 found in the 25 to 44 years age bracket for the primary householder. A total of 158 households (32.4%) fall into this category. Meanwhile, the 15 to 24 years age bracket for the primary householder has the lowest median household income of $39,375, with 79 households (16.2%) in this group.
| Income Bracket | # Households | Median Income |
| 15 to 24 Years | 79 (16.2%) | $39,375 |
| 25 to 44 Years | 158 (32.4%) | $93,929 |
| 45 to 64 Years | 141 (28.9%) | $50,547 |
| 65+ Years | 110 (22.5%) | $40,000 |
| Total | 488 (100.0%) | $54,167 |
Poverty in Royalton
Income Below Poverty by Sex and Age in Royalton
With 21.7% poverty level for males and 25.9% for females among the residents of Royalton, 5 year old males and 18 to 24 year old females are the most vulnerable to poverty, with 5 males (100.0%) and 39 females (54.9%) in their respective age groups living below the poverty level.
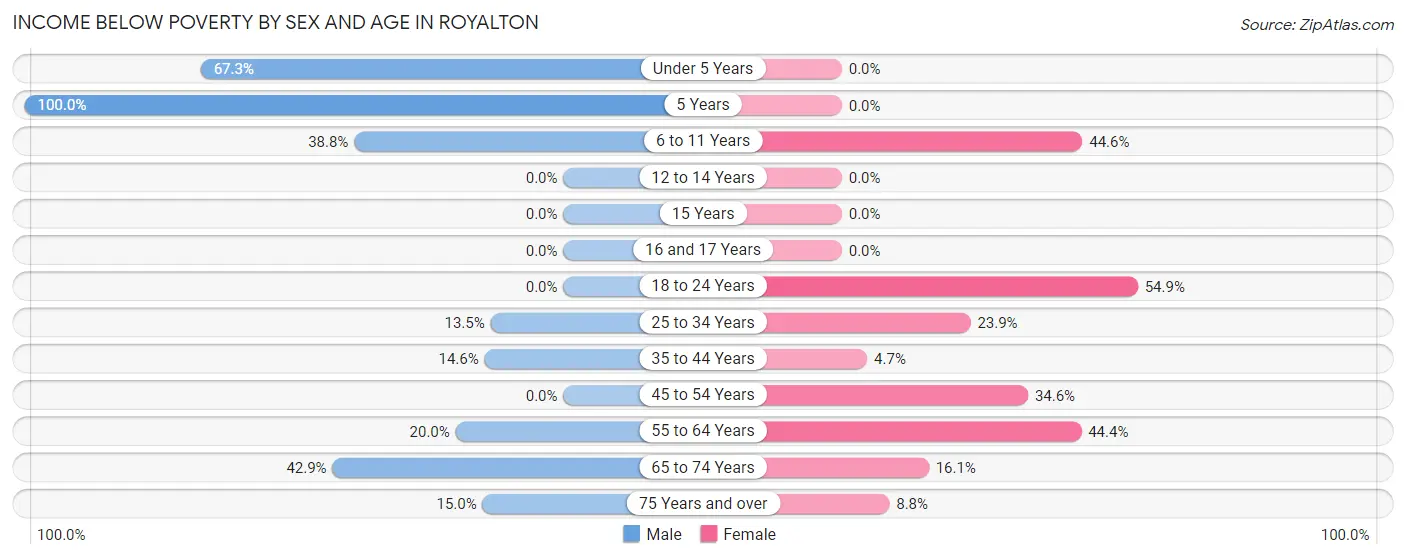
| Age Bracket | Male | Female |
| Under 5 Years | 35 (67.3%) | 0 (0.0%) |
| 5 Years | 5 (100.0%) | 0 (0.0%) |
| 6 to 11 Years | 33 (38.8%) | 25 (44.6%) |
| 12 to 14 Years | 0 (0.0%) | 0 (0.0%) |
| 15 Years | 0 (0.0%) | 0 (0.0%) |
| 16 and 17 Years | 0 (0.0%) | 0 (0.0%) |
| 18 to 24 Years | 0 (0.0%) | 39 (54.9%) |
| 25 to 34 Years | 10 (13.5%) | 16 (23.9%) |
| 35 to 44 Years | 12 (14.6%) | 4 (4.7%) |
| 45 to 54 Years | 0 (0.0%) | 19 (34.5%) |
| 55 to 64 Years | 9 (20.0%) | 24 (44.4%) |
| 65 to 74 Years | 30 (42.9%) | 5 (16.1%) |
| 75 Years and over | 3 (15.0%) | 3 (8.8%) |
| Total | 137 (21.7%) | 135 (25.9%) |
Income Above Poverty by Sex and Age in Royalton
According to the poverty statistics in Royalton, males aged 12 to 14 years and females aged under 5 years are the age groups that are most secure financially, with 100.0% of males and 100.0% of females in these age groups living above the poverty line.
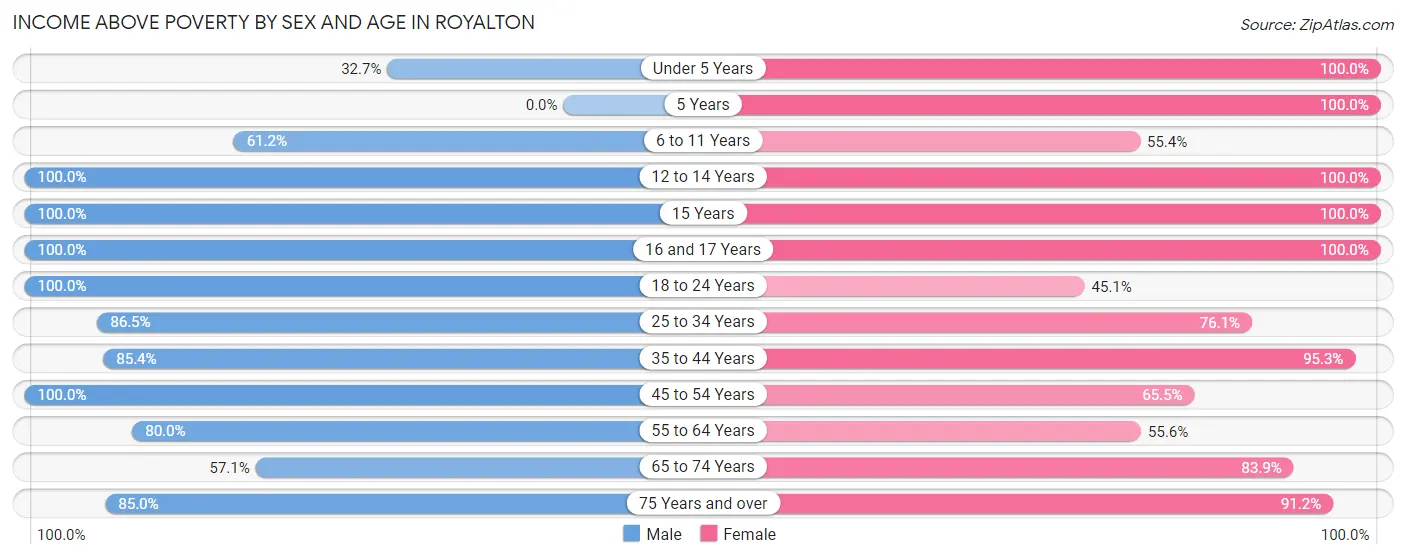
| Age Bracket | Male | Female |
| Under 5 Years | 17 (32.7%) | 31 (100.0%) |
| 5 Years | 0 (0.0%) | 3 (100.0%) |
| 6 to 11 Years | 52 (61.2%) | 31 (55.4%) |
| 12 to 14 Years | 35 (100.0%) | 23 (100.0%) |
| 15 Years | 7 (100.0%) | 4 (100.0%) |
| 16 and 17 Years | 4 (100.0%) | 7 (100.0%) |
| 18 to 24 Years | 91 (100.0%) | 32 (45.1%) |
| 25 to 34 Years | 64 (86.5%) | 51 (76.1%) |
| 35 to 44 Years | 70 (85.4%) | 81 (95.3%) |
| 45 to 54 Years | 60 (100.0%) | 36 (65.4%) |
| 55 to 64 Years | 36 (80.0%) | 30 (55.6%) |
| 65 to 74 Years | 40 (57.1%) | 26 (83.9%) |
| 75 Years and over | 17 (85.0%) | 31 (91.2%) |
| Total | 493 (78.2%) | 386 (74.1%) |
Income Below Poverty Among Married-Couple Families in Royalton
The poverty statistics for married-couple families in Royalton show that 15.1% or 25 of the total 166 families live below the poverty line. Families with no children have the highest poverty rate of 27.2%, comprising of 22 families. On the other hand, families with 3 or 4 children have the lowest poverty rate of 0.0%, which includes 0 families.
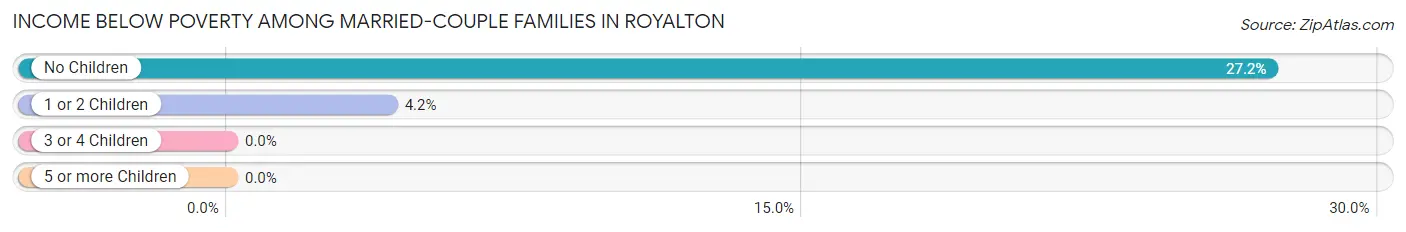
| Children | Above Poverty | Below Poverty |
| No Children | 59 (72.8%) | 22 (27.2%) |
| 1 or 2 Children | 69 (95.8%) | 3 (4.2%) |
| 3 or 4 Children | 13 (100.0%) | 0 (0.0%) |
| 5 or more Children | 0 (0.0%) | 0 (0.0%) |
| Total | 141 (84.9%) | 25 (15.1%) |
Income Below Poverty Among Single-Parent Households in Royalton
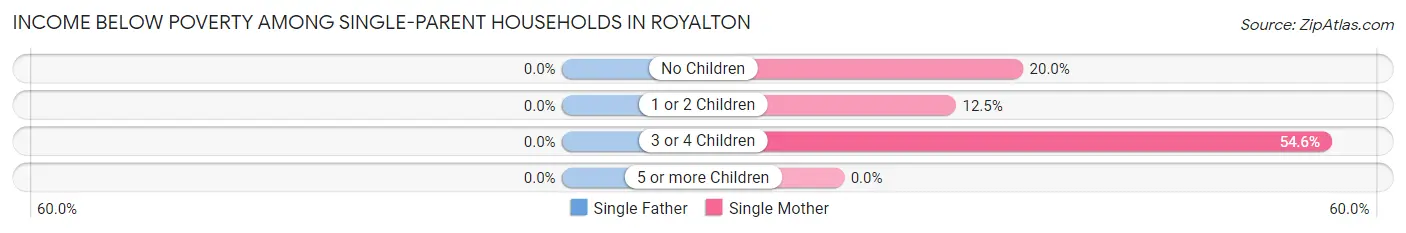
| Children | Single Father | Single Mother |
| No Children | 0 (0.0%) | 3 (20.0%) |
| 1 or 2 Children | 0 (0.0%) | 4 (12.5%) |
| 3 or 4 Children | 0 (0.0%) | 12 (54.5%) |
| 5 or more Children | 0 (0.0%) | 0 (0.0%) |
| Total | 0 (0.0%) | 19 (26.4%) |
Income Below Poverty Among Married-Couple vs Single-Parent Households in Royalton
The poverty data for Royalton shows that 25 of the married-couple family households (15.1%) and 19 of the single-parent households (18.8%) are living below the poverty level. Within the married-couple family households, those with no children have the highest poverty rate, with 22 households (27.2%) falling below the poverty line. Among the single-parent households, those with 3 or 4 children have the highest poverty rate, with 12 household (54.5%) living below poverty.
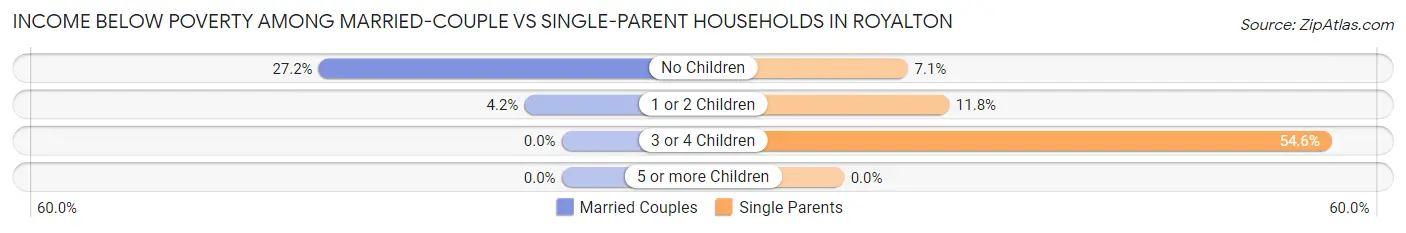
| Children | Married-Couple Families | Single-Parent Households |
| No Children | 22 (27.2%) | 3 (7.1%) |
| 1 or 2 Children | 3 (4.2%) | 4 (11.8%) |
| 3 or 4 Children | 0 (0.0%) | 12 (54.5%) |
| 5 or more Children | 0 (0.0%) | 0 (0.0%) |
| Total | 25 (15.1%) | 19 (18.8%) |
Race in Royalton
The most populous races in Royalton are White / Caucasian (1,107 | 93.9%), Two or more Races (39 | 3.3%), and Black / African American (32 | 2.7%).
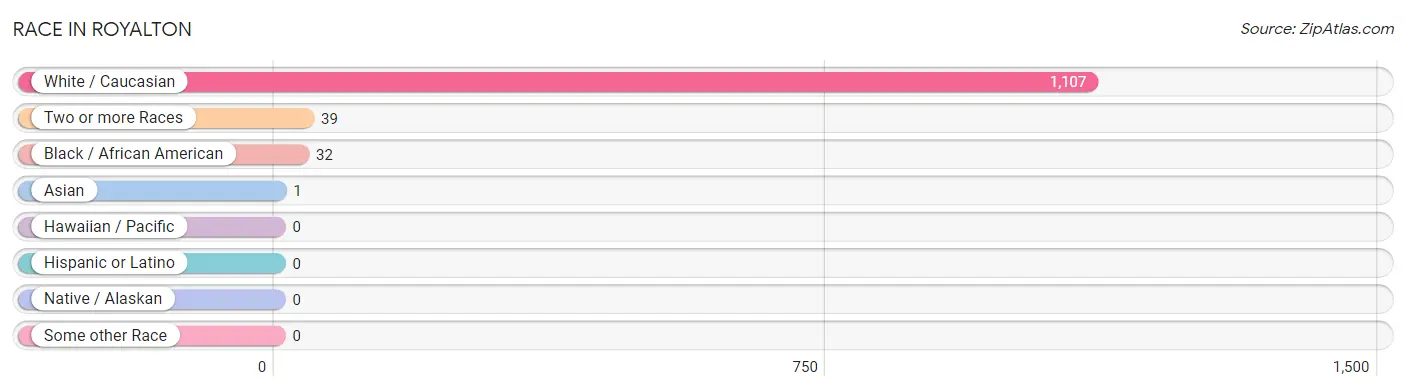
| Race | # Population | % Population |
| Asian | 1 | 0.1% |
| Black / African American | 32 | 2.7% |
| Hawaiian / Pacific | 0 | 0.0% |
| Hispanic or Latino | 0 | 0.0% |
| Native / Alaskan | 0 | 0.0% |
| White / Caucasian | 1,107 | 93.9% |
| Two or more Races | 39 | 3.3% |
| Some other Race | 0 | 0.0% |
| Total | 1,179 | 100.0% |
Ancestry in Royalton
The most populous ancestries reported in Royalton are German (495 | 42.0%), Polish (220 | 18.7%), French (137 | 11.6%), Irish (109 | 9.2%), and Norwegian (101 | 8.6%), together accounting for 90.1% of all Royalton residents.
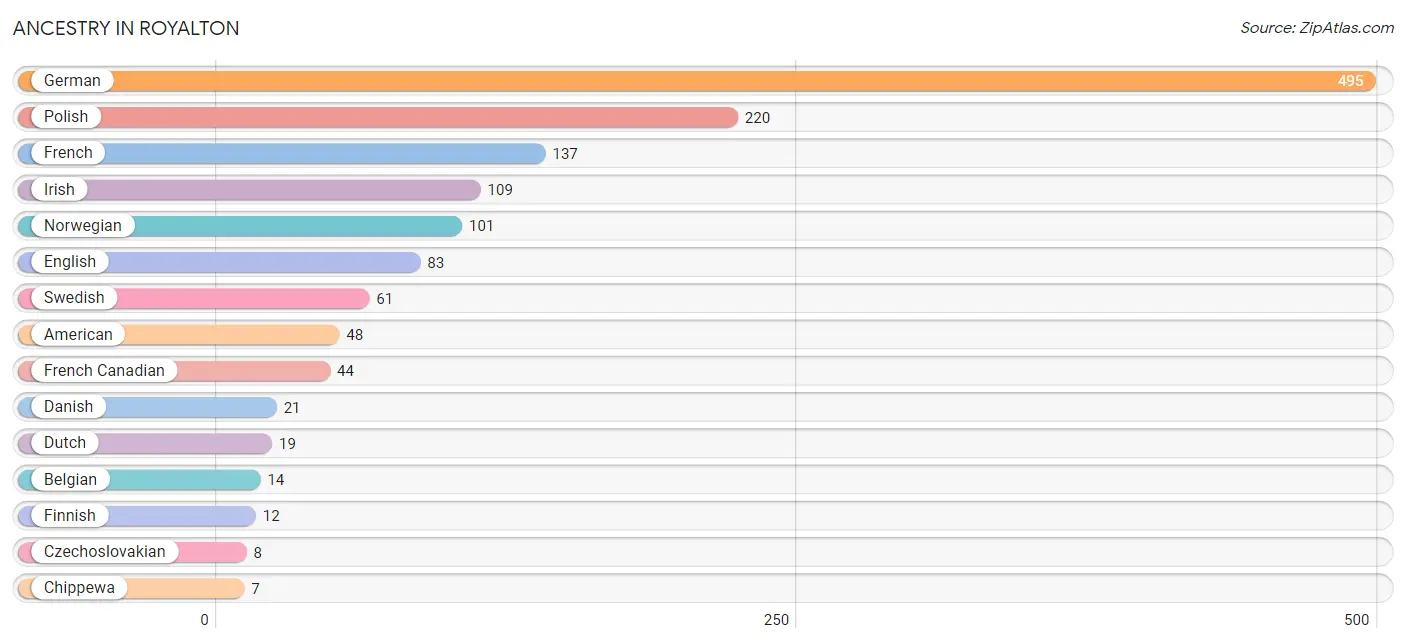
| Ancestry | # Population | % Population |
| American | 48 | 4.1% |
| Belgian | 14 | 1.2% |
| Chippewa | 7 | 0.6% |
| Czech | 7 | 0.6% |
| Czechoslovakian | 8 | 0.7% |
| Danish | 21 | 1.8% |
| Dutch | 19 | 1.6% |
| English | 83 | 7.0% |
| European | 4 | 0.3% |
| Finnish | 12 | 1.0% |
| French | 137 | 11.6% |
| French Canadian | 44 | 3.7% |
| German | 495 | 42.0% |
| Hungarian | 5 | 0.4% |
| Irish | 109 | 9.2% |
| Iroquois | 5 | 0.4% |
| Italian | 5 | 0.4% |
| Norwegian | 101 | 8.6% |
| Polish | 220 | 18.7% |
| Russian | 3 | 0.3% |
| Scandinavian | 6 | 0.5% |
| Slovak | 4 | 0.3% |
| Sri Lankan | 1 | 0.1% |
| Swedish | 61 | 5.2% |
| Welsh | 4 | 0.3% | View All 25 Rows |
Immigrants in Royalton
The most numerous immigrant groups reported in Royalton came from Europe (9 | 0.8%), Western Europe (9 | 0.8%), Netherlands (7 | 0.6%), Germany (2 | 0.2%), and Asia (1 | 0.1%), together accounting for 2.4% of all Royalton residents.
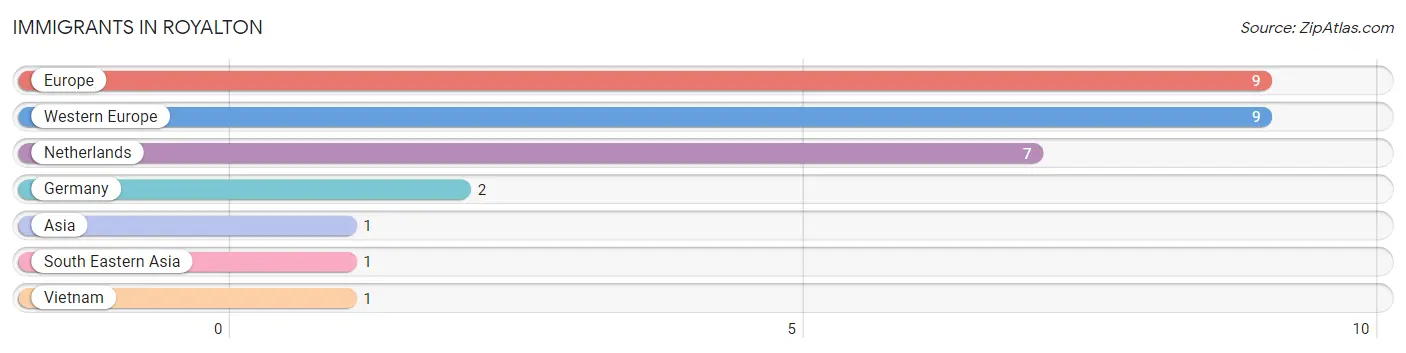
| Immigration Origin | # Population | % Population |
| Asia | 1 | 0.1% |
| Europe | 9 | 0.8% |
| Germany | 2 | 0.2% |
| Netherlands | 7 | 0.6% |
| South Eastern Asia | 1 | 0.1% |
| Vietnam | 1 | 0.1% |
| Western Europe | 9 | 0.8% | View All 7 Rows |
Sex and Age in Royalton
Sex and Age in Royalton
The most populous age groups in Royalton are 5 to 9 Years (64 | 10.2%) for men and 20 to 24 Years (55 | 10.0%) for women.
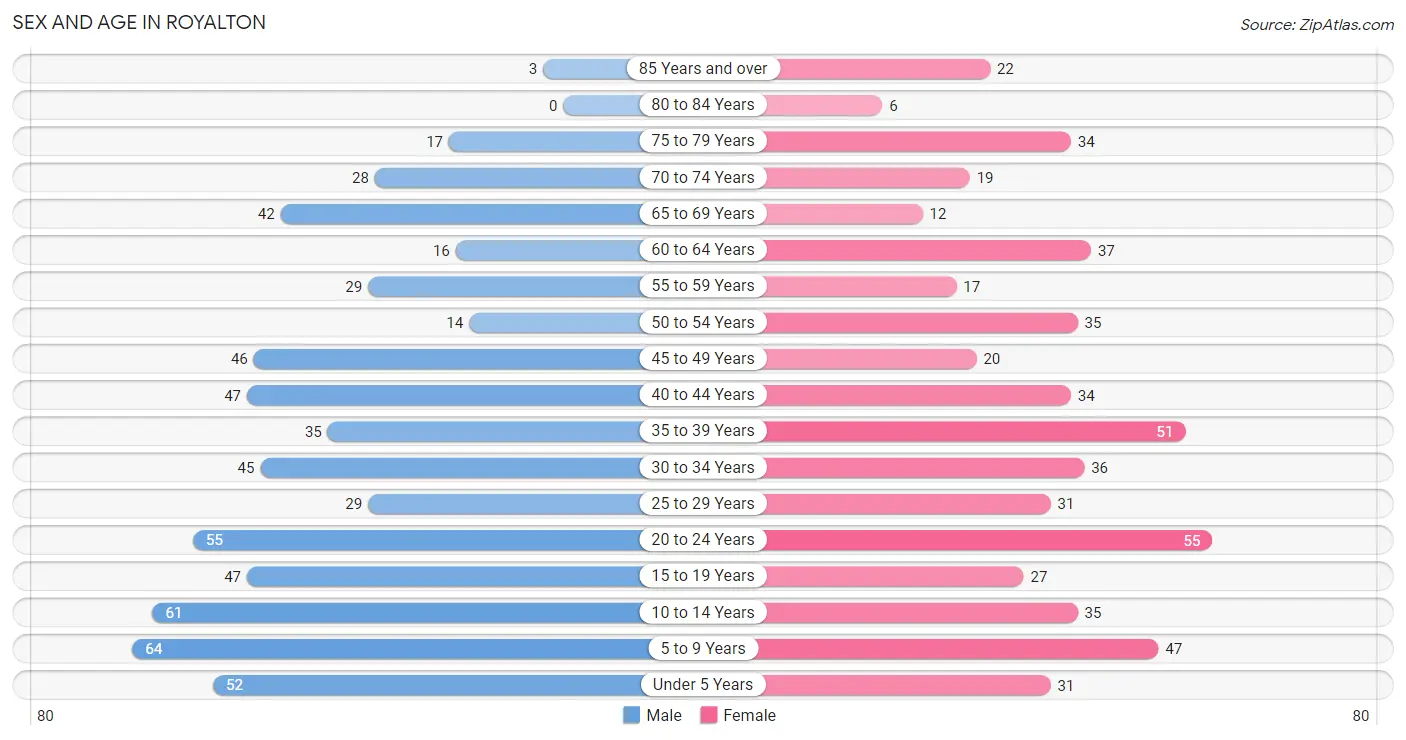
| Age Bracket | Male | Female |
| Under 5 Years | 52 (8.3%) | 31 (5.7%) |
| 5 to 9 Years | 64 (10.2%) | 47 (8.6%) |
| 10 to 14 Years | 61 (9.7%) | 35 (6.4%) |
| 15 to 19 Years | 47 (7.5%) | 27 (4.9%) |
| 20 to 24 Years | 55 (8.7%) | 55 (10.0%) |
| 25 to 29 Years | 29 (4.6%) | 31 (5.7%) |
| 30 to 34 Years | 45 (7.1%) | 36 (6.6%) |
| 35 to 39 Years | 35 (5.6%) | 51 (9.3%) |
| 40 to 44 Years | 47 (7.5%) | 34 (6.2%) |
| 45 to 49 Years | 46 (7.3%) | 20 (3.6%) |
| 50 to 54 Years | 14 (2.2%) | 35 (6.4%) |
| 55 to 59 Years | 29 (4.6%) | 17 (3.1%) |
| 60 to 64 Years | 16 (2.5%) | 37 (6.7%) |
| 65 to 69 Years | 42 (6.7%) | 12 (2.2%) |
| 70 to 74 Years | 28 (4.4%) | 19 (3.5%) |
| 75 to 79 Years | 17 (2.7%) | 34 (6.2%) |
| 80 to 84 Years | 0 (0.0%) | 6 (1.1%) |
| 85 Years and over | 3 (0.5%) | 22 (4.0%) |
| Total | 630 (100.0%) | 549 (100.0%) |
Families and Households in Royalton
Median Family Size in Royalton
The median family size in Royalton is 3.20 persons per family, with single female/mother families (72 | 27.0%) accounting for the largest median family size of 4.08 persons per family. On the other hand, single male/father families (29 | 10.9%) represent the smallest median family size with 1.97 persons per family.
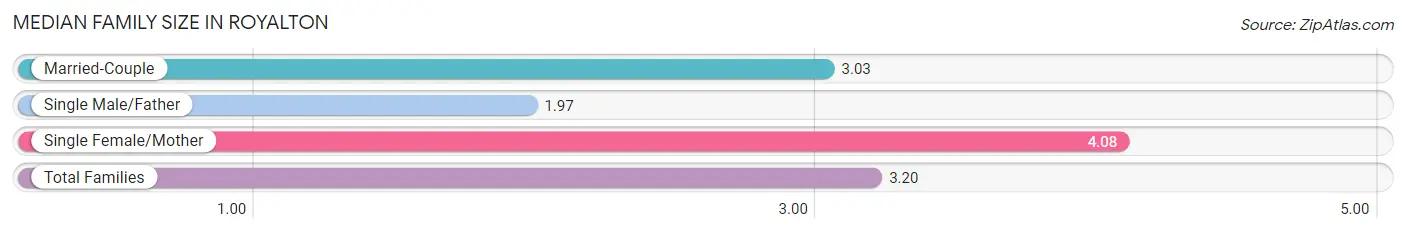
| Family Type | # Families | Family Size |
| Married-Couple | 166 (62.2%) | 3.03 |
| Single Male/Father | 29 (10.9%) | 1.97 |
| Single Female/Mother | 72 (27.0%) | 4.08 |
| Total Families | 267 (100.0%) | 3.20 |
Median Household Size in Royalton
The median household size in Royalton is 2.36 persons per household, with single female/mother households (72 | 14.7%) accounting for the largest median household size of 4.39 persons per household. non-family households (221 | 45.3%) represent the smallest median household size with 1.24 persons per household.
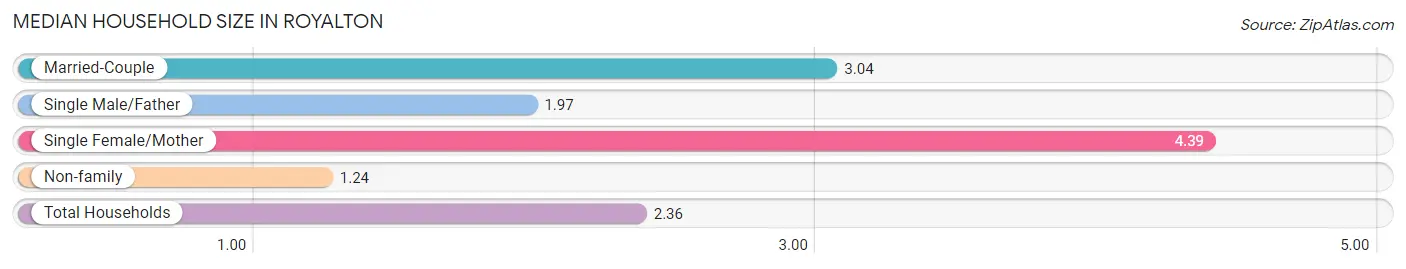
| Household Type | # Households | Household Size |
| Married-Couple | 166 (34.0%) | 3.04 |
| Single Male/Father | 29 (5.9%) | 1.97 |
| Single Female/Mother | 72 (14.7%) | 4.39 |
| Non-family | 221 (45.3%) | 1.24 |
| Total Households | 488 (100.0%) | 2.36 |
Household Size by Marriage Status in Royalton
Out of a total of 488 households in Royalton, 267 (54.7%) are family households, while 221 (45.3%) are nonfamily households. The most numerous type of family households are 2-person households, comprising 109, and the most common type of nonfamily households are 1-person households, comprising 143.
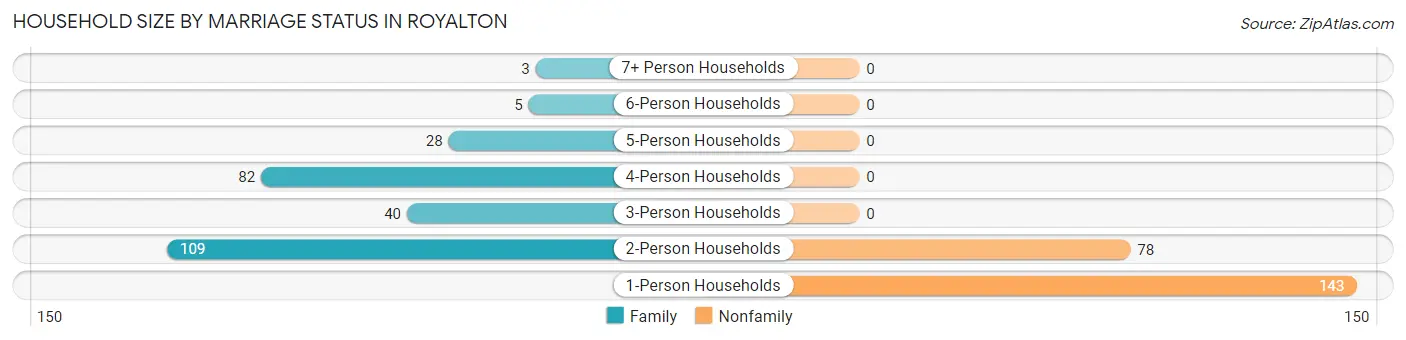
| Household Size | Family Households | Nonfamily Households |
| 1-Person Households | - | 143 (29.3%) |
| 2-Person Households | 109 (22.3%) | 78 (16.0%) |
| 3-Person Households | 40 (8.2%) | 0 (0.0%) |
| 4-Person Households | 82 (16.8%) | 0 (0.0%) |
| 5-Person Households | 28 (5.7%) | 0 (0.0%) |
| 6-Person Households | 5 (1.0%) | 0 (0.0%) |
| 7+ Person Households | 3 (0.6%) | 0 (0.0%) |
| Total | 267 (54.7%) | 221 (45.3%) |
Female Fertility in Royalton
Fertility by Age in Royalton
Average fertility rate in Royalton is 74.0 births per 1,000 women. Women in the age bracket of 20 to 34 years have the highest fertility rate with 164.0 births per 1,000 women. Women in the age bracket of 20 to 34 years acount for 100.0% of all women with births.
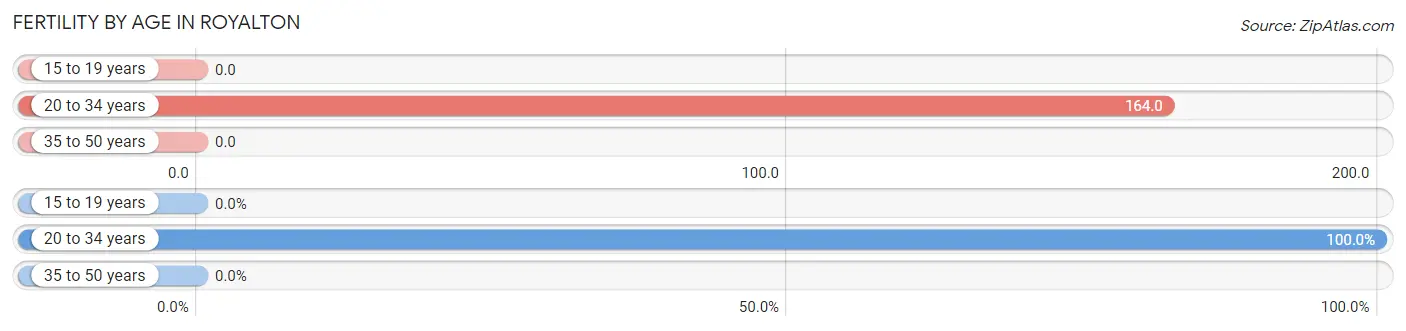
| Age Bracket | Women with Births | Births / 1,000 Women |
| 15 to 19 years | 0 (0.0%) | 0.0 |
| 20 to 34 years | 20 (100.0%) | 164.0 |
| 35 to 50 years | 0 (0.0%) | 0.0 |
| Total | 20 (100.0%) | 74.0 |
Fertility by Age by Marriage Status in Royalton
75.0% of women with births (20) in Royalton are married. The highest percentage of unmarried women with births falls into 20 to 34 years age bracket with 25.0% of them unmarried at the time of birth, while the lowest percentage of unmarried women with births belong to 20 to 34 years age bracket with 25.0% of them unmarried.
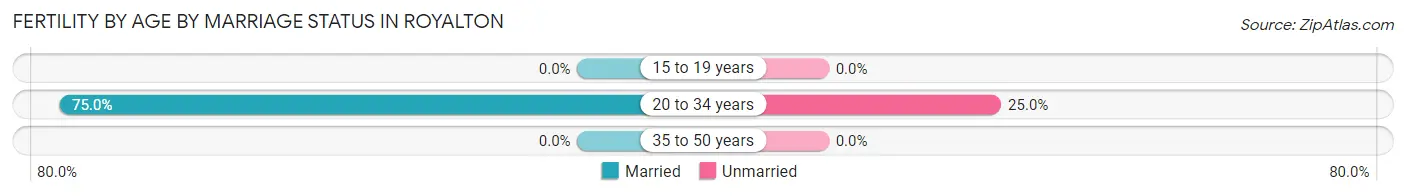
| Age Bracket | Married | Unmarried |
| 15 to 19 years | 0 (0.0%) | 0 (0.0%) |
| 20 to 34 years | 15 (75.0%) | 5 (25.0%) |
| 35 to 50 years | 0 (0.0%) | 0 (0.0%) |
| Total | 15 (75.0%) | 5 (25.0%) |
Fertility by Education in Royalton
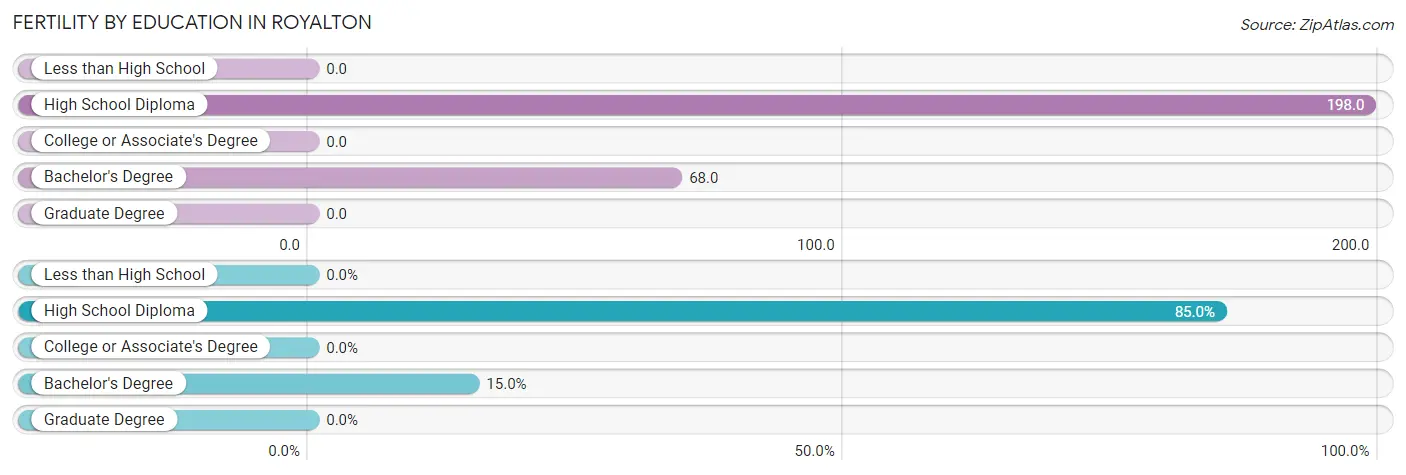
| Educational Attainment | Women with Births | Births / 1,000 Women |
| Less than High School | 0 (0.0%) | 0.0 |
| High School Diploma | 17 (85.0%) | 198.0 |
| College or Associate's Degree | 0 (0.0%) | 0.0 |
| Bachelor's Degree | 3 (15.0%) | 68.0 |
| Graduate Degree | 0 (0.0%) | 0.0 |
| Total | 20 (100.0%) | 74.0 |
Fertility by Education by Marriage Status in Royalton
25.0% of women with births in Royalton are unmarried. Women with the educational attainment of bachelor's degree are most likely to be married with 100.0% of them married at childbirth, while women with the educational attainment of high school diploma are least likely to be married with 29.4% of them unmarried at childbirth.
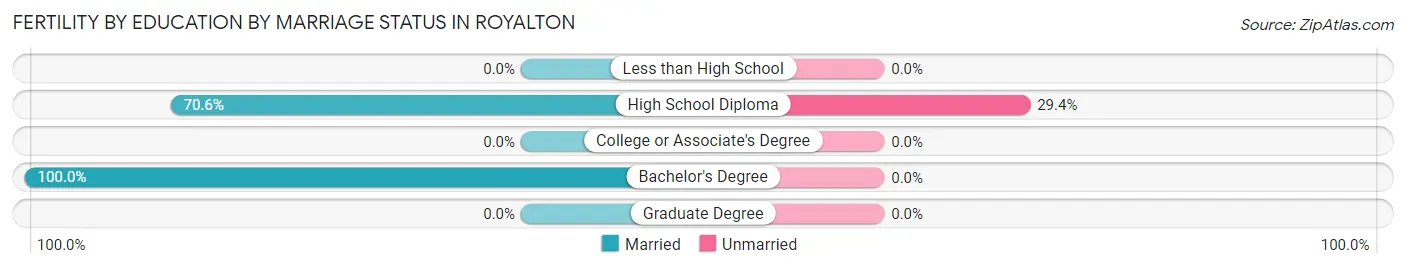
| Educational Attainment | Married | Unmarried |
| Less than High School | 0 (0.0%) | 0 (0.0%) |
| High School Diploma | 12 (70.6%) | 5 (29.4%) |
| College or Associate's Degree | 0 (0.0%) | 0 (0.0%) |
| Bachelor's Degree | 3 (100.0%) | 0 (0.0%) |
| Graduate Degree | 0 (0.0%) | 0 (0.0%) |
| Total | 15 (75.0%) | 5 (25.0%) |
Employment Characteristics in Royalton
Employment by Class of Employer in Royalton
Among the 572 employed individuals in Royalton, private company employees (354 | 61.9%), not-for-profit organizations (75 | 13.1%), and federal government employees (51 | 8.9%) make up the most common classes of employment.
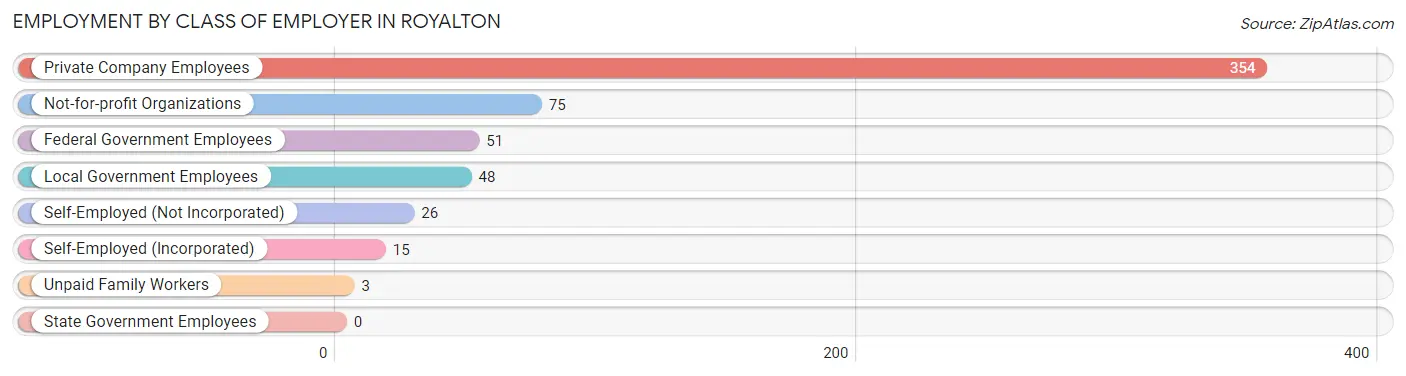
| Employer Class | # Employees | % Employees |
| Private Company Employees | 354 | 61.9% |
| Self-Employed (Incorporated) | 15 | 2.6% |
| Self-Employed (Not Incorporated) | 26 | 4.5% |
| Not-for-profit Organizations | 75 | 13.1% |
| Local Government Employees | 48 | 8.4% |
| State Government Employees | 0 | 0.0% |
| Federal Government Employees | 51 | 8.9% |
| Unpaid Family Workers | 3 | 0.5% |
| Total | 572 | 100.0% |
Employment Status by Age in Royalton
According to the labor force statistics for Royalton, out of the total population over 16 years of age (878), 72.9% or 640 individuals are in the labor force, with 7.7% or 49 of them unemployed. The age group with the highest labor force participation rate is 20 to 24 years, with 100.0% or 110 individuals in the labor force. Within the labor force, the 20 to 24 years age range has the highest percentage of unemployed individuals, with 31.8% or 35 of them being unemployed.
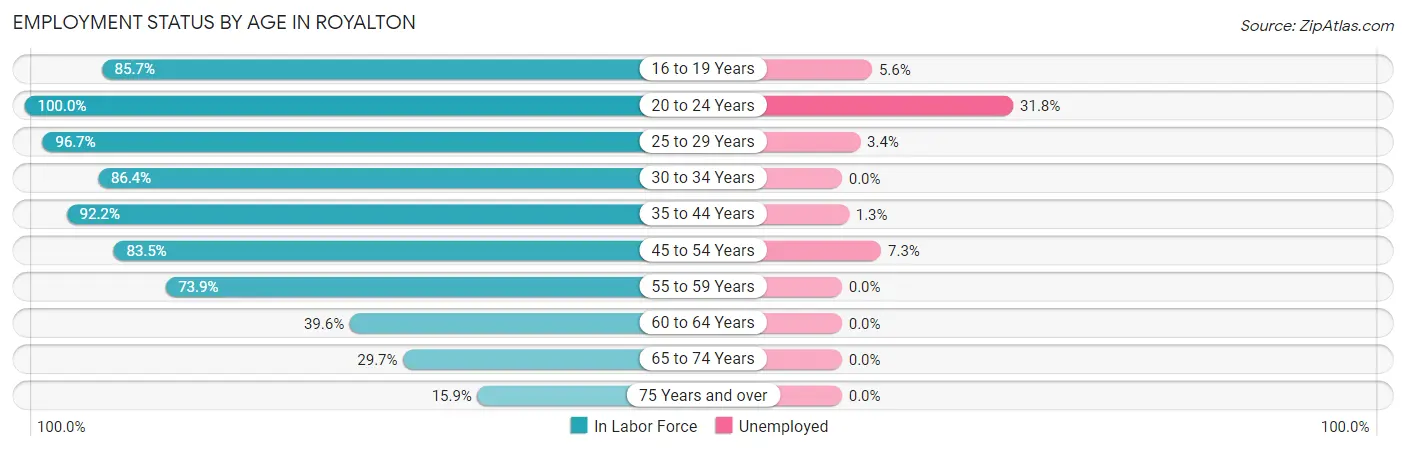
| Age Bracket | In Labor Force | Unemployed |
| 16 to 19 Years | 54 (85.7%) | 3 (5.6%) |
| 20 to 24 Years | 110 (100.0%) | 35 (31.8%) |
| 25 to 29 Years | 58 (96.7%) | 2 (3.4%) |
| 30 to 34 Years | 70 (86.4%) | 0 (0.0%) |
| 35 to 44 Years | 154 (92.2%) | 2 (1.3%) |
| 45 to 54 Years | 96 (83.5%) | 7 (7.3%) |
| 55 to 59 Years | 34 (73.9%) | 0 (0.0%) |
| 60 to 64 Years | 21 (39.6%) | 0 (0.0%) |
| 65 to 74 Years | 30 (29.7%) | 0 (0.0%) |
| 75 Years and over | 13 (15.9%) | 0 (0.0%) |
| Total | 640 (72.9%) | 49 (7.7%) |
Employment Status by Educational Attainment in Royalton
According to labor force statistics for Royalton, 83.0% of individuals (433) out of the total population between 25 and 64 years of age (522) are in the labor force, with 2.5% or 11 of them being unemployed. The group with the highest labor force participation rate are those with the educational attainment of bachelor's degree or higher, with 96.1% or 98 individuals in the labor force. Within the labor force, individuals with less than high school education have the highest percentage of unemployment, with 13.3% or 2 of them being unemployed.
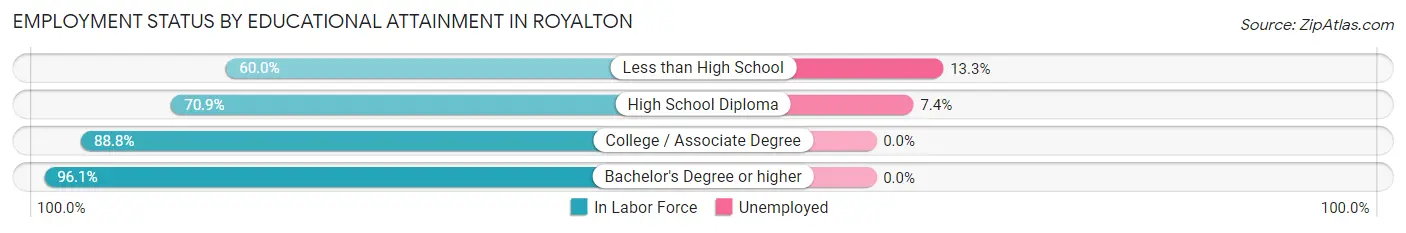
| Educational Attainment | In Labor Force | Unemployed |
| Less than High School | 15 (60.0%) | 3 (13.3%) |
| High School Diploma | 122 (70.9%) | 13 (7.4%) |
| College / Associate Degree | 198 (88.8%) | 0 (0.0%) |
| Bachelor's Degree or higher | 98 (96.1%) | 0 (0.0%) |
| Total | 433 (83.0%) | 13 (2.5%) |
Employment Occupations by Sex in Royalton
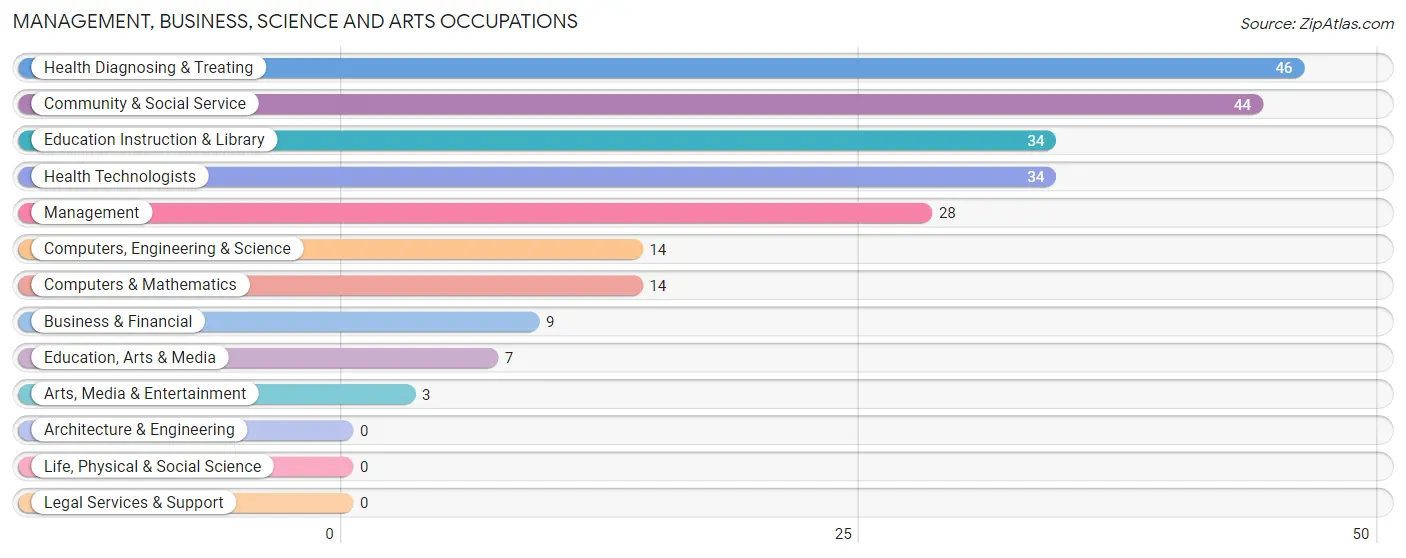
Management, Business, Science and Arts Occupations
The most common Management, Business, Science and Arts occupations in Royalton are Health Diagnosing & Treating (46 | 7.8%), Community & Social Service (44 | 7.4%), Education Instruction & Library (34 | 5.8%), Health Technologists (34 | 5.8%), and Management (28 | 4.7%).
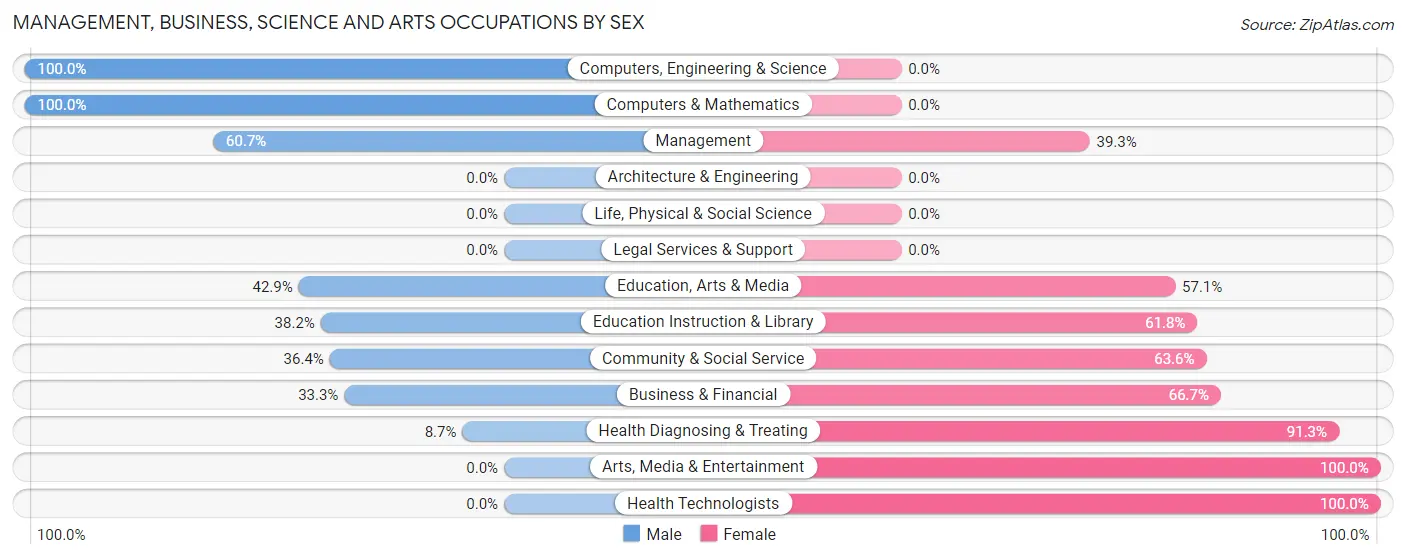
Management, Business, Science and Arts Occupations by Sex
Within the Management, Business, Science and Arts occupations in Royalton, the most male-oriented occupations are Computers, Engineering & Science (100.0%), Computers & Mathematics (100.0%), and Management (60.7%), while the most female-oriented occupations are Arts, Media & Entertainment (100.0%), Health Technologists (100.0%), and Health Diagnosing & Treating (91.3%).
| Occupation | Male | Female |
| Management | 17 (60.7%) | 11 (39.3%) |
| Business & Financial | 3 (33.3%) | 6 (66.7%) |
| Computers, Engineering & Science | 14 (100.0%) | 0 (0.0%) |
| Computers & Mathematics | 14 (100.0%) | 0 (0.0%) |
| Architecture & Engineering | 0 (0.0%) | 0 (0.0%) |
| Life, Physical & Social Science | 0 (0.0%) | 0 (0.0%) |
| Community & Social Service | 16 (36.4%) | 28 (63.6%) |
| Education, Arts & Media | 3 (42.9%) | 4 (57.1%) |
| Legal Services & Support | 0 (0.0%) | 0 (0.0%) |
| Education Instruction & Library | 13 (38.2%) | 21 (61.8%) |
| Arts, Media & Entertainment | 0 (0.0%) | 3 (100.0%) |
| Health Diagnosing & Treating | 4 (8.7%) | 42 (91.3%) |
| Health Technologists | 0 (0.0%) | 34 (100.0%) |
| Total (Category) | 54 (38.3%) | 87 (61.7%) |
| Total (Overall) | 324 (54.8%) | 267 (45.2%) |
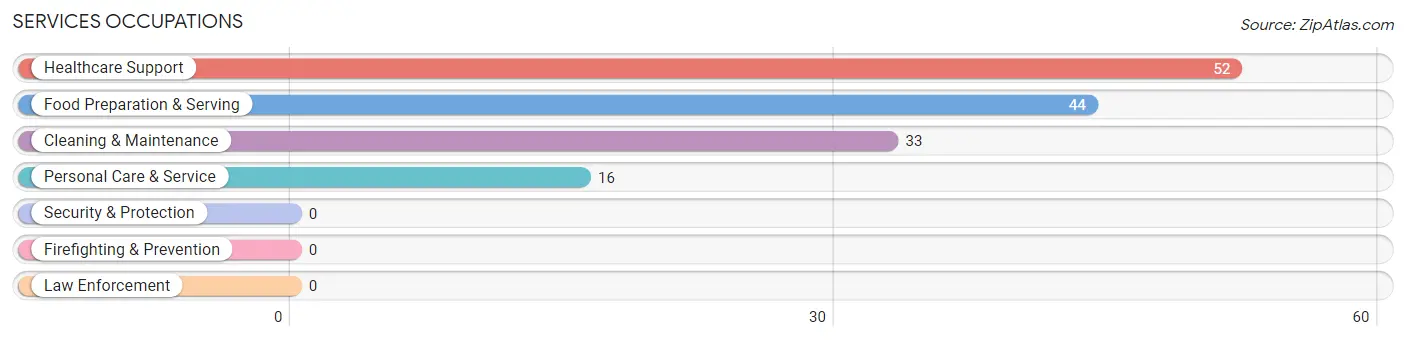
Services Occupations
The most common Services occupations in Royalton are Healthcare Support (52 | 8.8%), Food Preparation & Serving (44 | 7.4%), Cleaning & Maintenance (33 | 5.6%), and Personal Care & Service (16 | 2.7%).
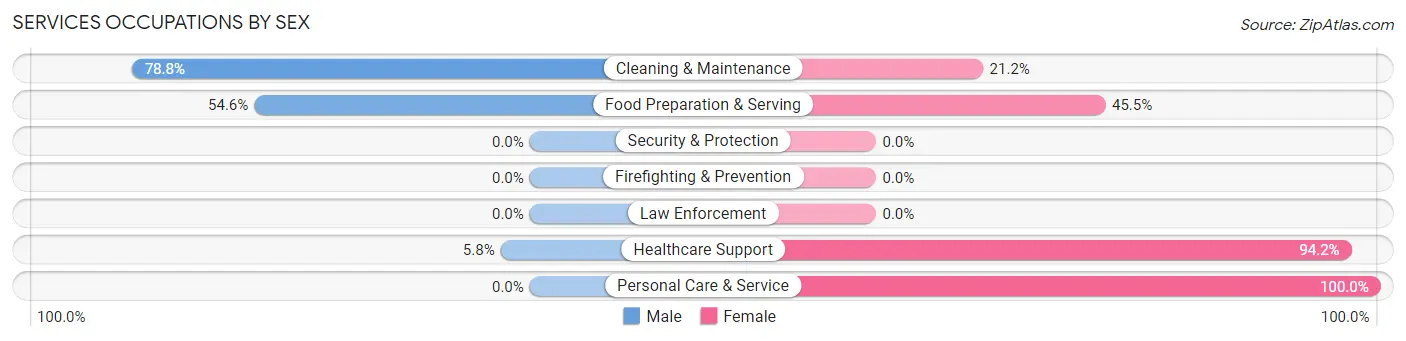
Services Occupations by Sex
Within the Services occupations in Royalton, the most male-oriented occupations are Cleaning & Maintenance (78.8%), Food Preparation & Serving (54.5%), and Healthcare Support (5.8%), while the most female-oriented occupations are Personal Care & Service (100.0%), Healthcare Support (94.2%), and Food Preparation & Serving (45.5%).
| Occupation | Male | Female |
| Healthcare Support | 3 (5.8%) | 49 (94.2%) |
| Security & Protection | 0 (0.0%) | 0 (0.0%) |
| Firefighting & Prevention | 0 (0.0%) | 0 (0.0%) |
| Law Enforcement | 0 (0.0%) | 0 (0.0%) |
| Food Preparation & Serving | 24 (54.5%) | 20 (45.5%) |
| Cleaning & Maintenance | 26 (78.8%) | 7 (21.2%) |
| Personal Care & Service | 0 (0.0%) | 16 (100.0%) |
| Total (Category) | 53 (36.5%) | 92 (63.4%) |
| Total (Overall) | 324 (54.8%) | 267 (45.2%) |
Sales and Office Occupations
The most common Sales and Office occupations in Royalton are Office & Administration (46 | 7.8%), and Sales & Related (28 | 4.7%).
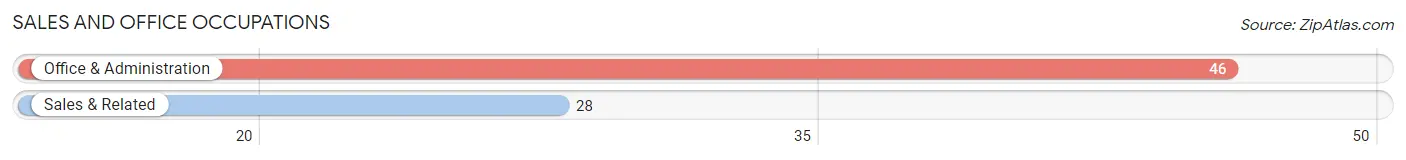
Sales and Office Occupations by Sex
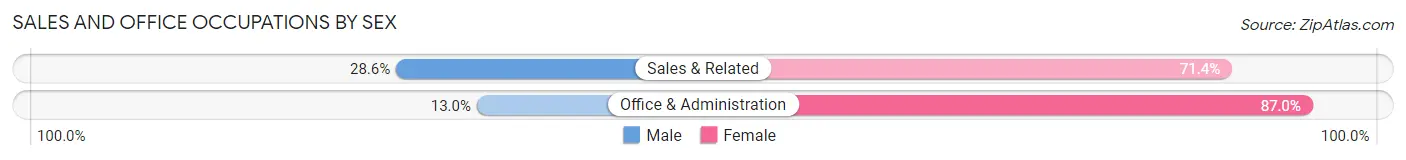
| Occupation | Male | Female |
| Sales & Related | 8 (28.6%) | 20 (71.4%) |
| Office & Administration | 6 (13.0%) | 40 (87.0%) |
| Total (Category) | 14 (18.9%) | 60 (81.1%) |
| Total (Overall) | 324 (54.8%) | 267 (45.2%) |
Natural Resources, Construction and Maintenance Occupations
The most common Natural Resources, Construction and Maintenance occupations in Royalton are Construction & Extraction (48 | 8.1%), Installation, Maintenance & Repair (33 | 5.6%), and Farming, Fishing & Forestry (10 | 1.7%).
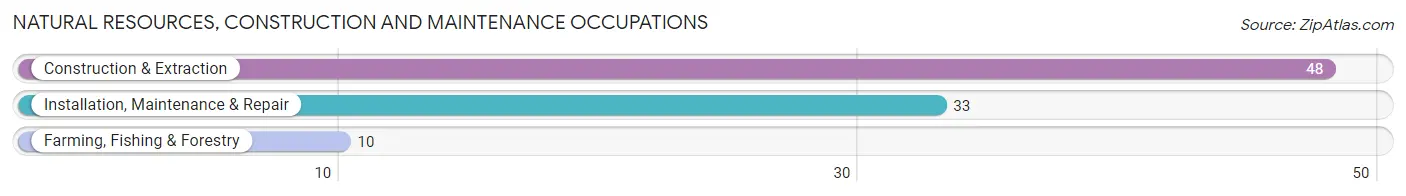
Natural Resources, Construction and Maintenance Occupations by Sex
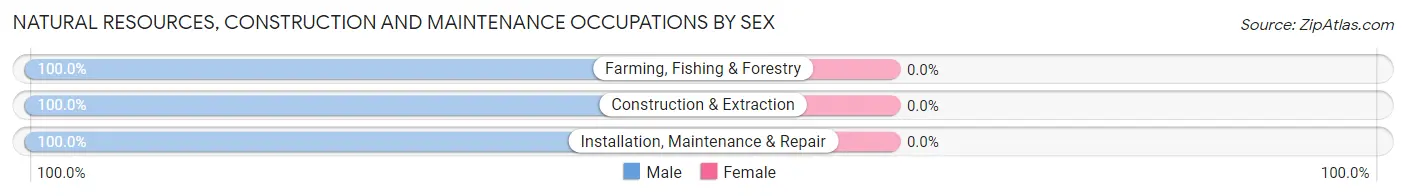
| Occupation | Male | Female |
| Farming, Fishing & Forestry | 10 (100.0%) | 0 (0.0%) |
| Construction & Extraction | 48 (100.0%) | 0 (0.0%) |
| Installation, Maintenance & Repair | 33 (100.0%) | 0 (0.0%) |
| Total (Category) | 91 (100.0%) | 0 (0.0%) |
| Total (Overall) | 324 (54.8%) | 267 (45.2%) |
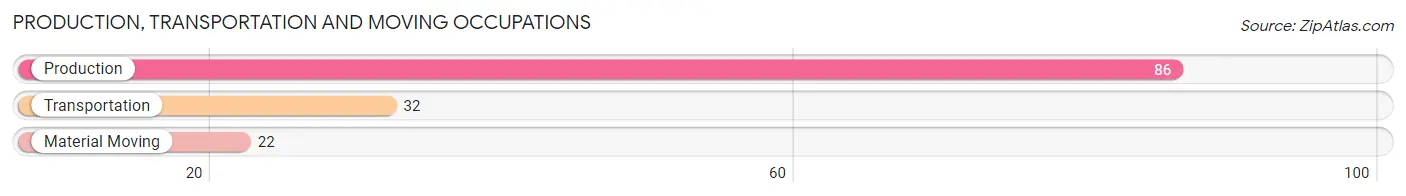
Production, Transportation and Moving Occupations
The most common Production, Transportation and Moving occupations in Royalton are Production (86 | 14.5%), Transportation (32 | 5.4%), and Material Moving (22 | 3.7%).
Production, Transportation and Moving Occupations by Sex
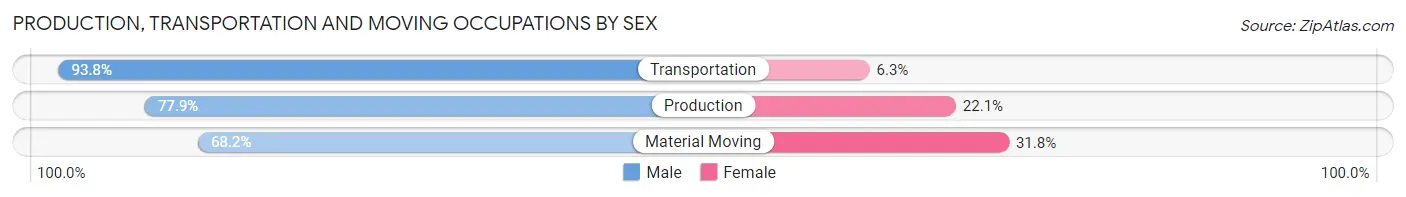
| Occupation | Male | Female |
| Production | 67 (77.9%) | 19 (22.1%) |
| Transportation | 30 (93.8%) | 2 (6.2%) |
| Material Moving | 15 (68.2%) | 7 (31.8%) |
| Total (Category) | 112 (80.0%) | 28 (20.0%) |
| Total (Overall) | 324 (54.8%) | 267 (45.2%) |
Employment Industries by Sex in Royalton
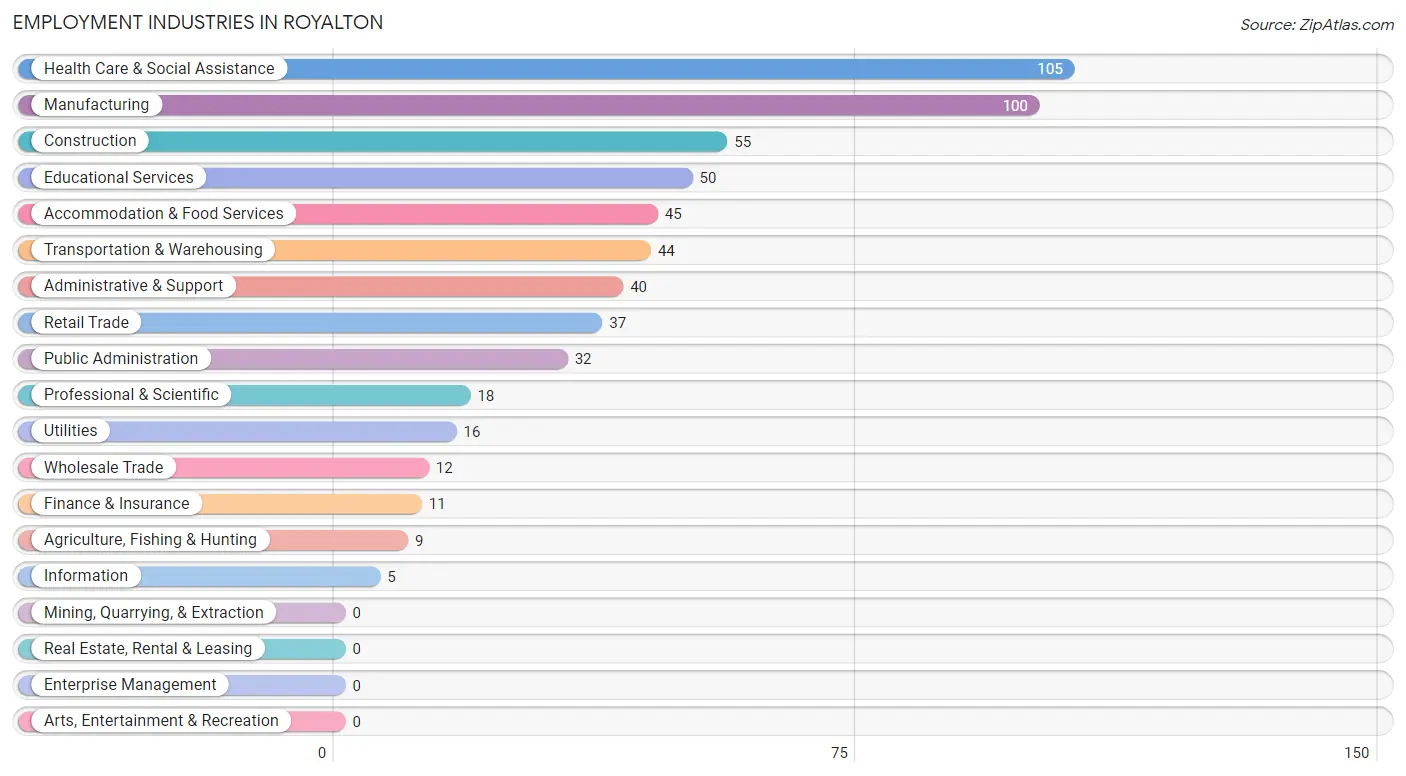
Employment Industries in Royalton
The major employment industries in Royalton include Health Care & Social Assistance (105 | 17.8%), Manufacturing (100 | 16.9%), Construction (55 | 9.3%), Educational Services (50 | 8.5%), and Accommodation & Food Services (45 | 7.6%).
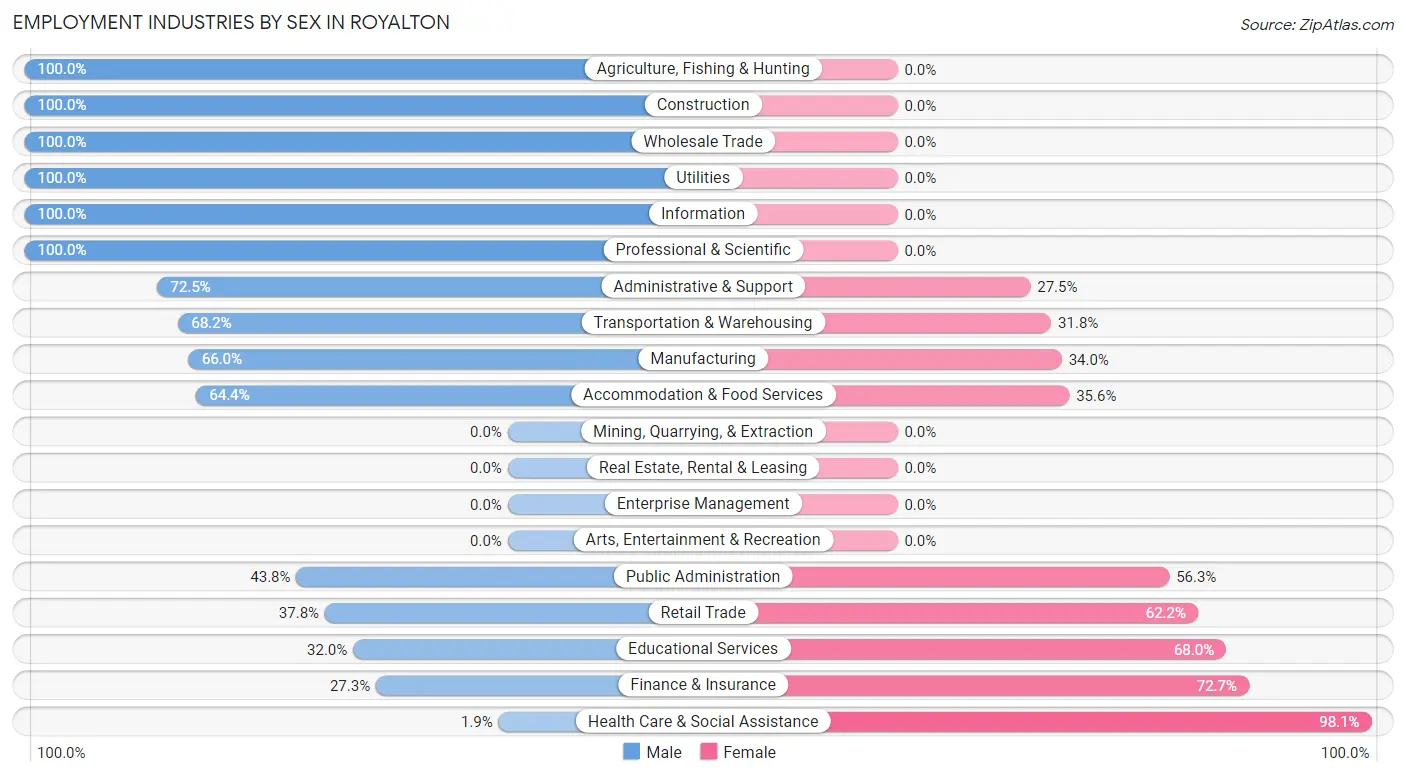
Employment Industries by Sex in Royalton
The Royalton industries that see more men than women are Agriculture, Fishing & Hunting (100.0%), Construction (100.0%), and Wholesale Trade (100.0%), whereas the industries that tend to have a higher number of women are Health Care & Social Assistance (98.1%), Finance & Insurance (72.7%), and Educational Services (68.0%).
| Industry | Male | Female |
| Agriculture, Fishing & Hunting | 9 (100.0%) | 0 (0.0%) |
| Mining, Quarrying, & Extraction | 0 (0.0%) | 0 (0.0%) |
| Construction | 55 (100.0%) | 0 (0.0%) |
| Manufacturing | 66 (66.0%) | 34 (34.0%) |
| Wholesale Trade | 12 (100.0%) | 0 (0.0%) |
| Retail Trade | 14 (37.8%) | 23 (62.2%) |
| Transportation & Warehousing | 30 (68.2%) | 14 (31.8%) |
| Utilities | 16 (100.0%) | 0 (0.0%) |
| Information | 5 (100.0%) | 0 (0.0%) |
| Finance & Insurance | 3 (27.3%) | 8 (72.7%) |
| Real Estate, Rental & Leasing | 0 (0.0%) | 0 (0.0%) |
| Professional & Scientific | 18 (100.0%) | 0 (0.0%) |
| Enterprise Management | 0 (0.0%) | 0 (0.0%) |
| Administrative & Support | 29 (72.5%) | 11 (27.5%) |
| Educational Services | 16 (32.0%) | 34 (68.0%) |
| Health Care & Social Assistance | 2 (1.9%) | 103 (98.1%) |
| Arts, Entertainment & Recreation | 0 (0.0%) | 0 (0.0%) |
| Accommodation & Food Services | 29 (64.4%) | 16 (35.6%) |
| Public Administration | 14 (43.8%) | 18 (56.2%) |
| Total | 324 (54.8%) | 267 (45.2%) |
Education in Royalton
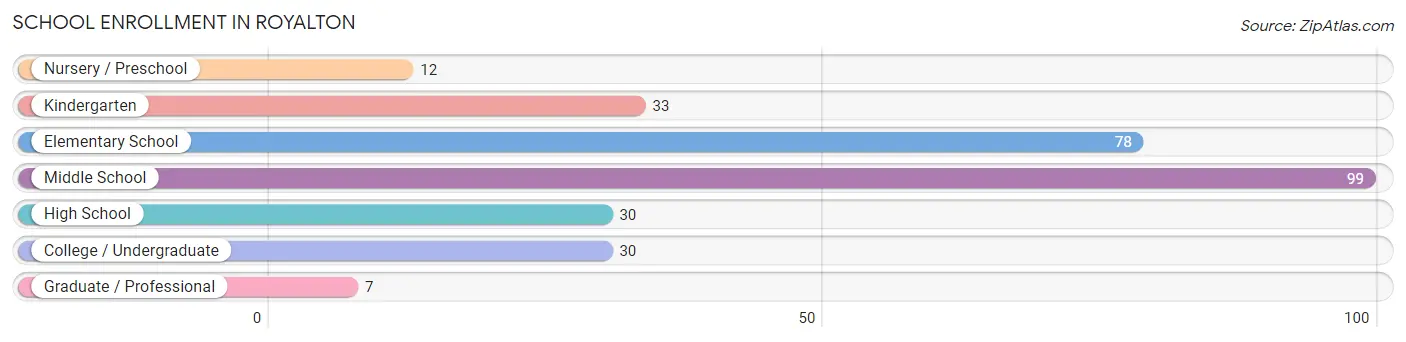
School Enrollment in Royalton
The most common levels of schooling among the 289 students in Royalton are middle school (99 | 34.3%), elementary school (78 | 27.0%), and kindergarten (33 | 11.4%).
| School Level | # Students | % Students |
| Nursery / Preschool | 12 | 4.2% |
| Kindergarten | 33 | 11.4% |
| Elementary School | 78 | 27.0% |
| Middle School | 99 | 34.3% |
| High School | 30 | 10.4% |
| College / Undergraduate | 30 | 10.4% |
| Graduate / Professional | 7 | 2.4% |
| Total | 289 | 100.0% |
School Enrollment by Age by Funding Source in Royalton
Out of a total of 289 students who are enrolled in schools in Royalton, 1 (0.3%) attend a private institution, while the remaining 288 (99.7%) are enrolled in public schools. The age group of 10 to 14 year olds has the highest likelihood of being enrolled in private schools, with 1 (1.1% in the age bracket) enrolled. Conversely, the age group of 3 to 4 year olds has the lowest likelihood of being enrolled in a private school, with 9 (100.0% in the age bracket) attending a public institution.

| Age Bracket | Public School | Private School |
| 3 to 4 Year Olds | 9 (100.0%) | 0 (0.0%) |
| 5 to 9 Year Old | 111 (100.0%) | 0 (0.0%) |
| 10 to 14 Year Olds | 94 (99.0%) | 1 (1.1%) |
| 15 to 17 Year Olds | 20 (100.0%) | 0 (0.0%) |
| 18 to 19 Year Olds | 24 (100.0%) | 0 (0.0%) |
| 20 to 24 Year Olds | 21 (100.0%) | 0 (0.0%) |
| 25 to 34 Year Olds | 2 (100.0%) | 0 (0.0%) |
| 35 Years and over | 7 (100.0%) | 0 (0.0%) |
| Total | 288 (99.7%) | 1 (0.3%) |
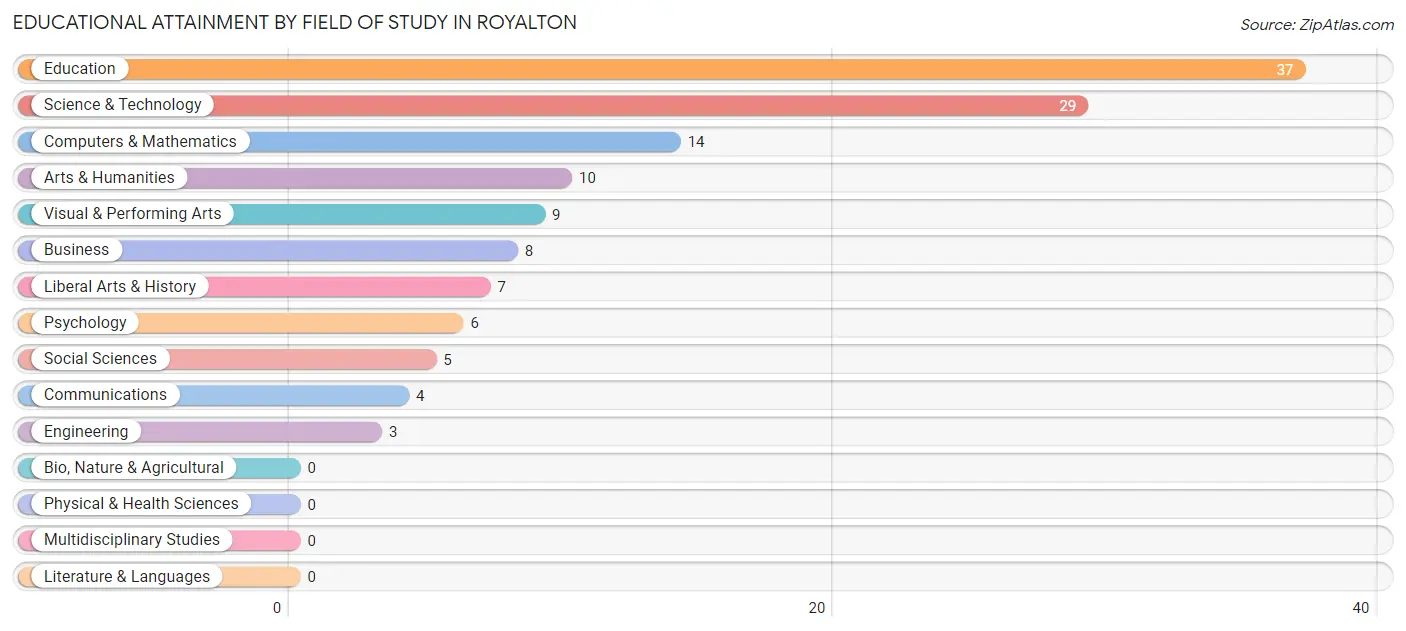
Educational Attainment by Field of Study in Royalton
Education (37 | 28.0%), science & technology (29 | 22.0%), computers & mathematics (14 | 10.6%), arts & humanities (10 | 7.6%), and visual & performing arts (9 | 6.8%) are the most common fields of study among 132 individuals in Royalton who have obtained a bachelor's degree or higher.
| Field of Study | # Graduates | % Graduates |
| Computers & Mathematics | 14 | 10.6% |
| Bio, Nature & Agricultural | 0 | 0.0% |
| Physical & Health Sciences | 0 | 0.0% |
| Psychology | 6 | 4.5% |
| Social Sciences | 5 | 3.8% |
| Engineering | 3 | 2.3% |
| Multidisciplinary Studies | 0 | 0.0% |
| Science & Technology | 29 | 22.0% |
| Business | 8 | 6.1% |
| Education | 37 | 28.0% |
| Literature & Languages | 0 | 0.0% |
| Liberal Arts & History | 7 | 5.3% |
| Visual & Performing Arts | 9 | 6.8% |
| Communications | 4 | 3.0% |
| Arts & Humanities | 10 | 7.6% |
| Total | 132 | 100.0% |
Transportation & Commute in Royalton
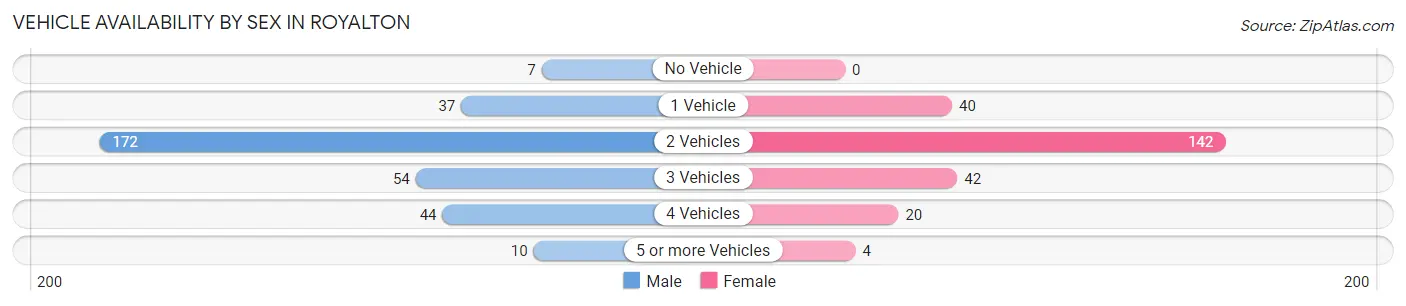
Vehicle Availability by Sex in Royalton
The most prevalent vehicle ownership categories in Royalton are males with 2 vehicles (172, accounting for 53.1%) and females with 2 vehicles (142, making up 69.4%).
| Vehicles Available | Male | Female |
| No Vehicle | 7 (2.2%) | 0 (0.0%) |
| 1 Vehicle | 37 (11.4%) | 40 (16.1%) |
| 2 Vehicles | 172 (53.1%) | 142 (57.3%) |
| 3 Vehicles | 54 (16.7%) | 42 (16.9%) |
| 4 Vehicles | 44 (13.6%) | 20 (8.1%) |
| 5 or more Vehicles | 10 (3.1%) | 4 (1.6%) |
| Total | 324 (100.0%) | 248 (100.0%) |
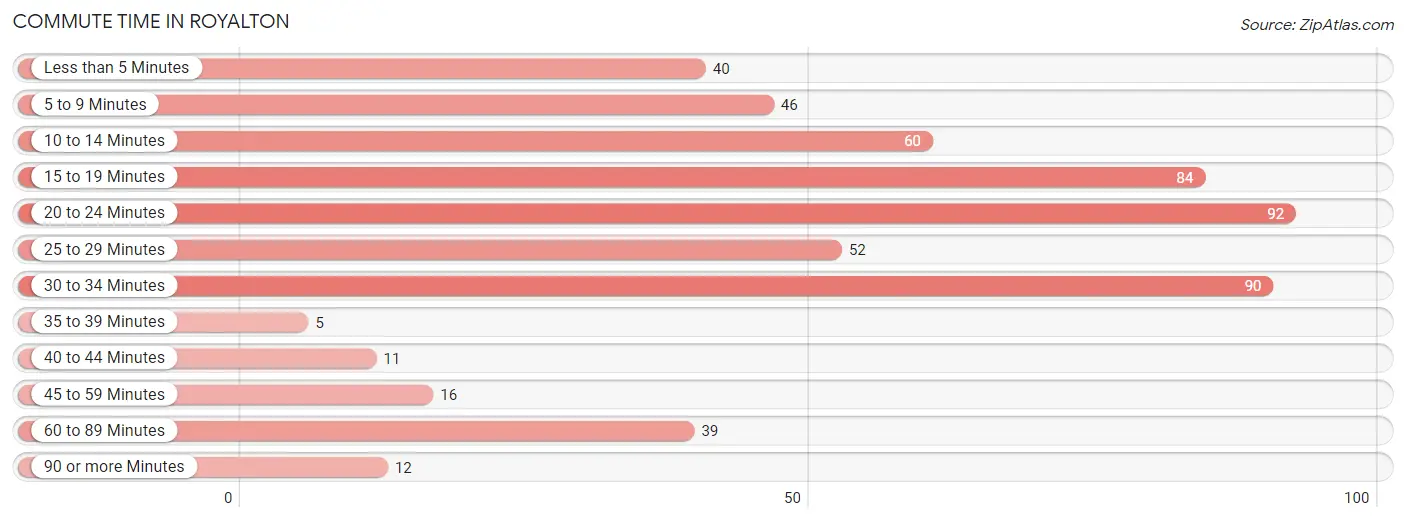
Commute Time in Royalton
The most frequently occuring commute durations in Royalton are 20 to 24 minutes (92 commuters, 16.8%), 30 to 34 minutes (90 commuters, 16.5%), and 15 to 19 minutes (84 commuters, 15.4%).
| Commute Time | # Commuters | % Commuters |
| Less than 5 Minutes | 40 | 7.3% |
| 5 to 9 Minutes | 46 | 8.4% |
| 10 to 14 Minutes | 60 | 11.0% |
| 15 to 19 Minutes | 84 | 15.4% |
| 20 to 24 Minutes | 92 | 16.8% |
| 25 to 29 Minutes | 52 | 9.5% |
| 30 to 34 Minutes | 90 | 16.5% |
| 35 to 39 Minutes | 5 | 0.9% |
| 40 to 44 Minutes | 11 | 2.0% |
| 45 to 59 Minutes | 16 | 2.9% |
| 60 to 89 Minutes | 39 | 7.1% |
| 90 or more Minutes | 12 | 2.2% |
Commute Time by Sex in Royalton
The most common commute times in Royalton are 15 to 19 minutes (58 commuters, 18.4%) for males and 20 to 24 minutes (54 commuters, 23.3%) for females.
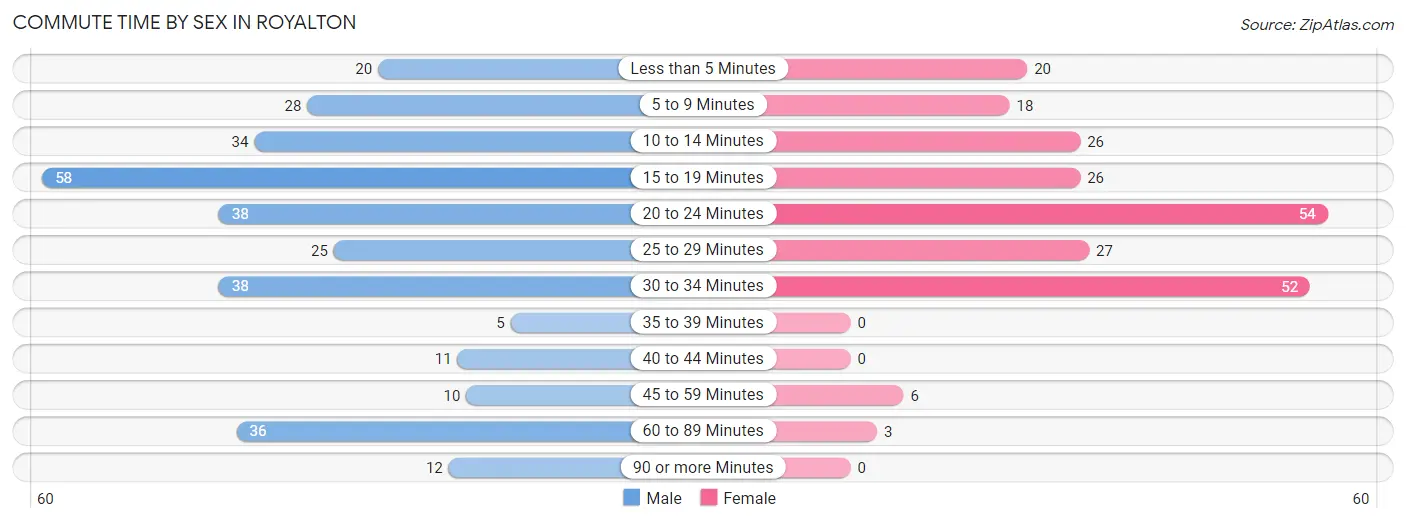
| Commute Time | Male | Female |
| Less than 5 Minutes | 20 (6.4%) | 20 (8.6%) |
| 5 to 9 Minutes | 28 (8.9%) | 18 (7.8%) |
| 10 to 14 Minutes | 34 (10.8%) | 26 (11.2%) |
| 15 to 19 Minutes | 58 (18.4%) | 26 (11.2%) |
| 20 to 24 Minutes | 38 (12.1%) | 54 (23.3%) |
| 25 to 29 Minutes | 25 (7.9%) | 27 (11.6%) |
| 30 to 34 Minutes | 38 (12.1%) | 52 (22.4%) |
| 35 to 39 Minutes | 5 (1.6%) | 0 (0.0%) |
| 40 to 44 Minutes | 11 (3.5%) | 0 (0.0%) |
| 45 to 59 Minutes | 10 (3.2%) | 6 (2.6%) |
| 60 to 89 Minutes | 36 (11.4%) | 3 (1.3%) |
| 90 or more Minutes | 12 (3.8%) | 0 (0.0%) |
Time of Departure to Work by Sex in Royalton
The most frequent times of departure to work in Royalton are 7:00 AM to 7:29 AM (97, 30.8%) for males and 7:00 AM to 7:29 AM (40, 17.2%) for females.
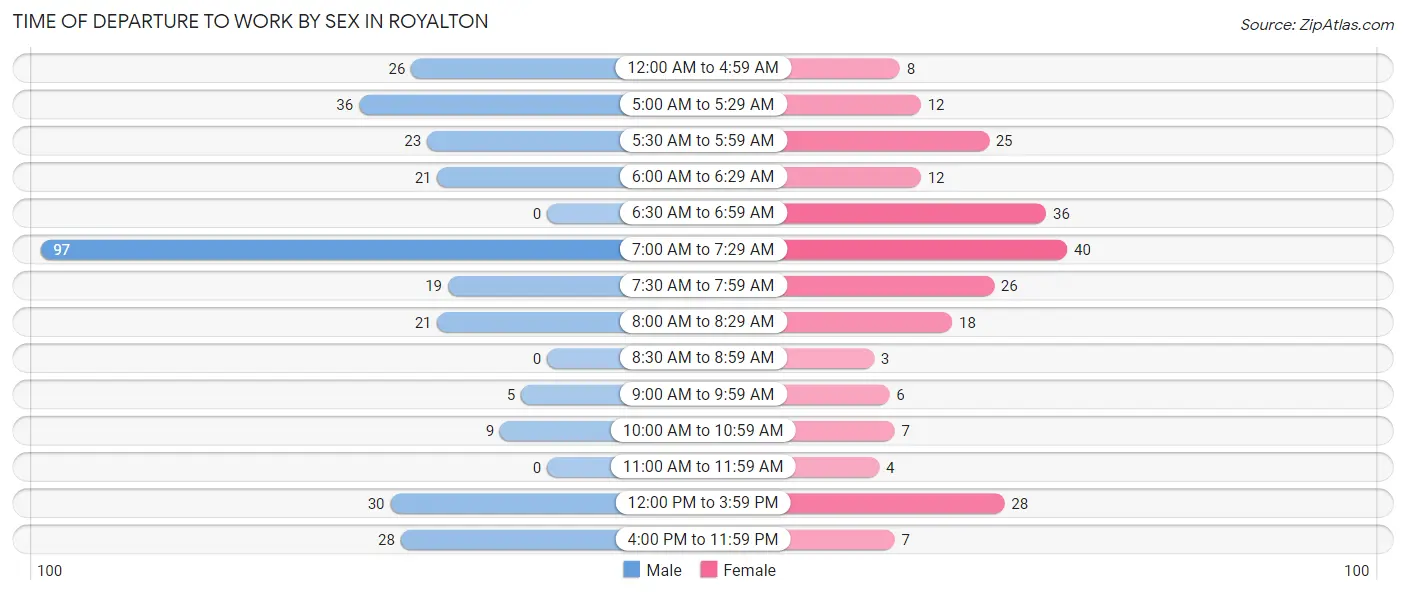
| Time of Departure | Male | Female |
| 12:00 AM to 4:59 AM | 26 (8.3%) | 8 (3.5%) |
| 5:00 AM to 5:29 AM | 36 (11.4%) | 12 (5.2%) |
| 5:30 AM to 5:59 AM | 23 (7.3%) | 25 (10.8%) |
| 6:00 AM to 6:29 AM | 21 (6.7%) | 12 (5.2%) |
| 6:30 AM to 6:59 AM | 0 (0.0%) | 36 (15.5%) |
| 7:00 AM to 7:29 AM | 97 (30.8%) | 40 (17.2%) |
| 7:30 AM to 7:59 AM | 19 (6.0%) | 26 (11.2%) |
| 8:00 AM to 8:29 AM | 21 (6.7%) | 18 (7.8%) |
| 8:30 AM to 8:59 AM | 0 (0.0%) | 3 (1.3%) |
| 9:00 AM to 9:59 AM | 5 (1.6%) | 6 (2.6%) |
| 10:00 AM to 10:59 AM | 9 (2.9%) | 7 (3.0%) |
| 11:00 AM to 11:59 AM | 0 (0.0%) | 4 (1.7%) |
| 12:00 PM to 3:59 PM | 30 (9.5%) | 28 (12.1%) |
| 4:00 PM to 11:59 PM | 28 (8.9%) | 7 (3.0%) |
| Total | 315 (100.0%) | 232 (100.0%) |
Housing Occupancy in Royalton
Occupancy by Ownership in Royalton
Of the total 488 dwellings in Royalton, owner-occupied units account for 311 (63.7%), while renter-occupied units make up 177 (36.3%).
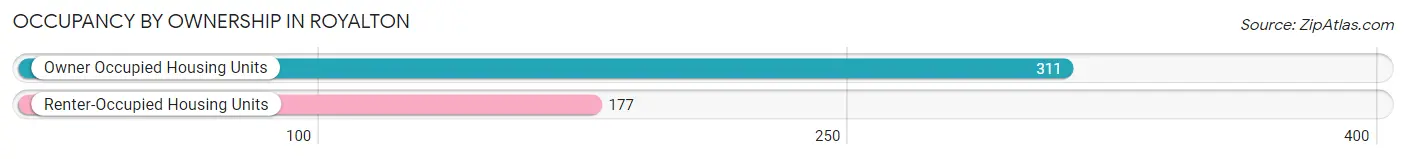
| Occupancy | # Housing Units | % Housing Units |
| Owner Occupied Housing Units | 311 | 63.7% |
| Renter-Occupied Housing Units | 177 | 36.3% |
| Total Occupied Housing Units | 488 | 100.0% |
Occupancy by Household Size in Royalton
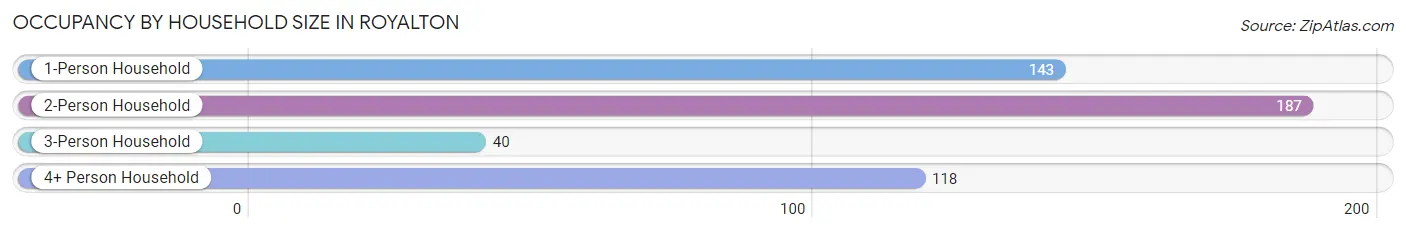
| Household Size | # Housing Units | % Housing Units |
| 1-Person Household | 143 | 29.3% |
| 2-Person Household | 187 | 38.3% |
| 3-Person Household | 40 | 8.2% |
| 4+ Person Household | 118 | 24.2% |
| Total Housing Units | 488 | 100.0% |
Occupancy by Ownership by Household Size in Royalton
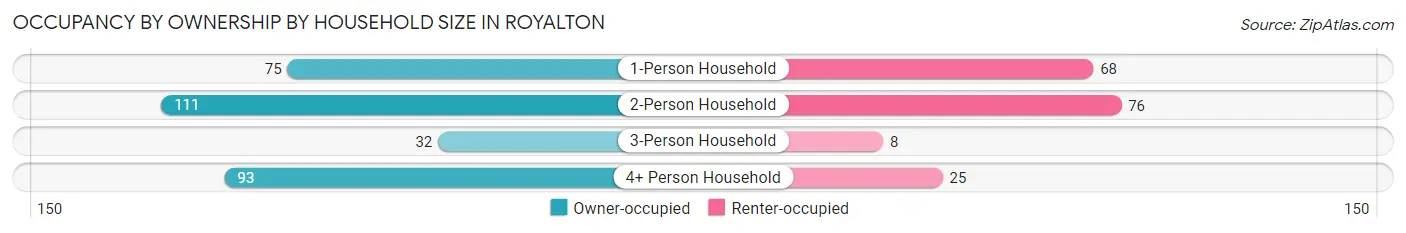
| Household Size | Owner-occupied | Renter-occupied |
| 1-Person Household | 75 (52.4%) | 68 (47.5%) |
| 2-Person Household | 111 (59.4%) | 76 (40.6%) |
| 3-Person Household | 32 (80.0%) | 8 (20.0%) |
| 4+ Person Household | 93 (78.8%) | 25 (21.2%) |
| Total Housing Units | 311 (63.7%) | 177 (36.3%) |
Occupancy by Educational Attainment in Royalton
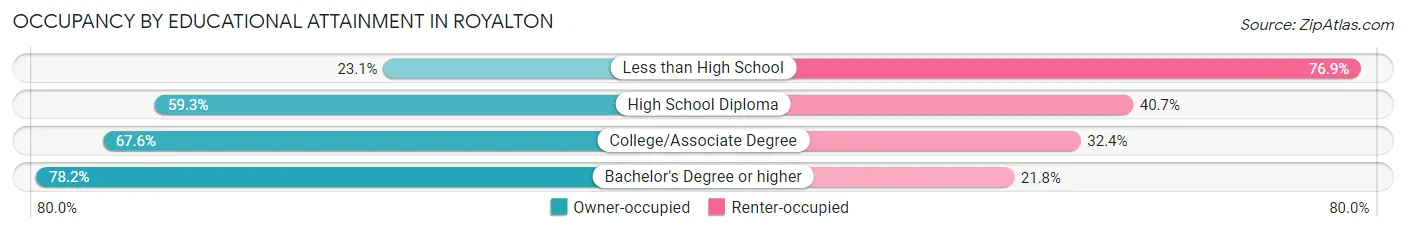
| Household Size | Owner-occupied | Renter-occupied |
| Less than High School | 6 (23.1%) | 20 (76.9%) |
| High School Diploma | 118 (59.3%) | 81 (40.7%) |
| College/Associate Degree | 119 (67.6%) | 57 (32.4%) |
| Bachelor's Degree or higher | 68 (78.2%) | 19 (21.8%) |
Occupancy by Age of Householder in Royalton
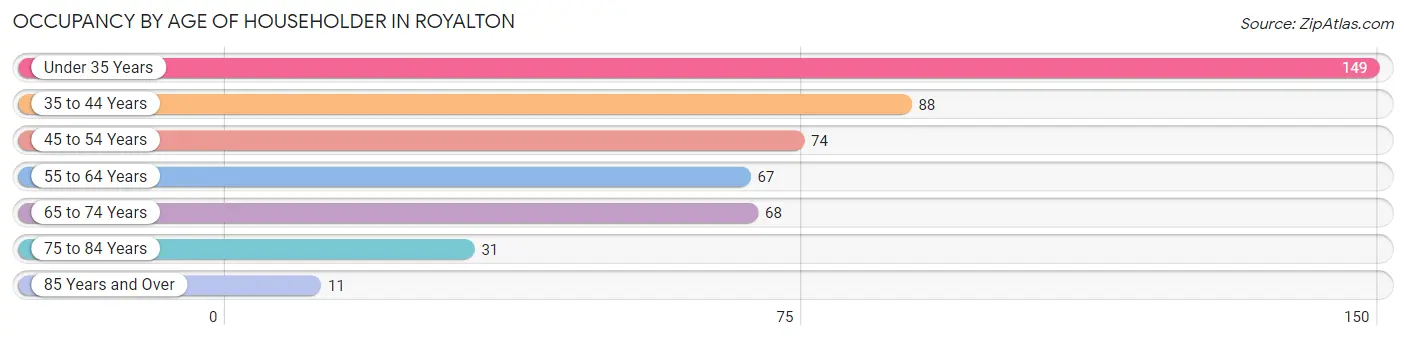
| Age Bracket | # Households | % Households |
| Under 35 Years | 149 | 30.5% |
| 35 to 44 Years | 88 | 18.0% |
| 45 to 54 Years | 74 | 15.2% |
| 55 to 64 Years | 67 | 13.7% |
| 65 to 74 Years | 68 | 13.9% |
| 75 to 84 Years | 31 | 6.4% |
| 85 Years and Over | 11 | 2.2% |
| Total | 488 | 100.0% |
Housing Finances in Royalton
Median Income by Occupancy in Royalton
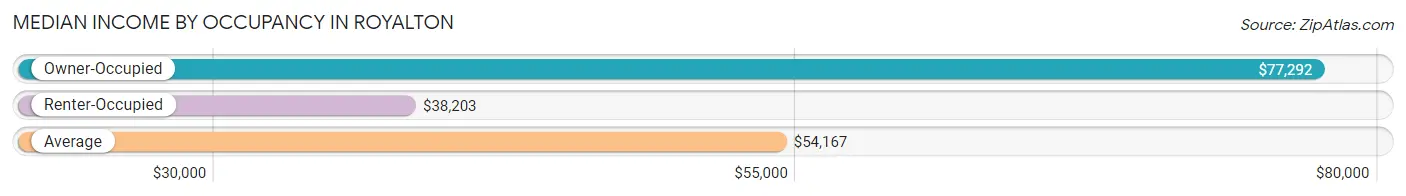
| Occupancy Type | # Households | Median Income |
| Owner-Occupied | 311 (63.7%) | $77,292 |
| Renter-Occupied | 177 (36.3%) | $38,203 |
| Average | 488 (100.0%) | $54,167 |
Occupancy by Householder Income Bracket in Royalton
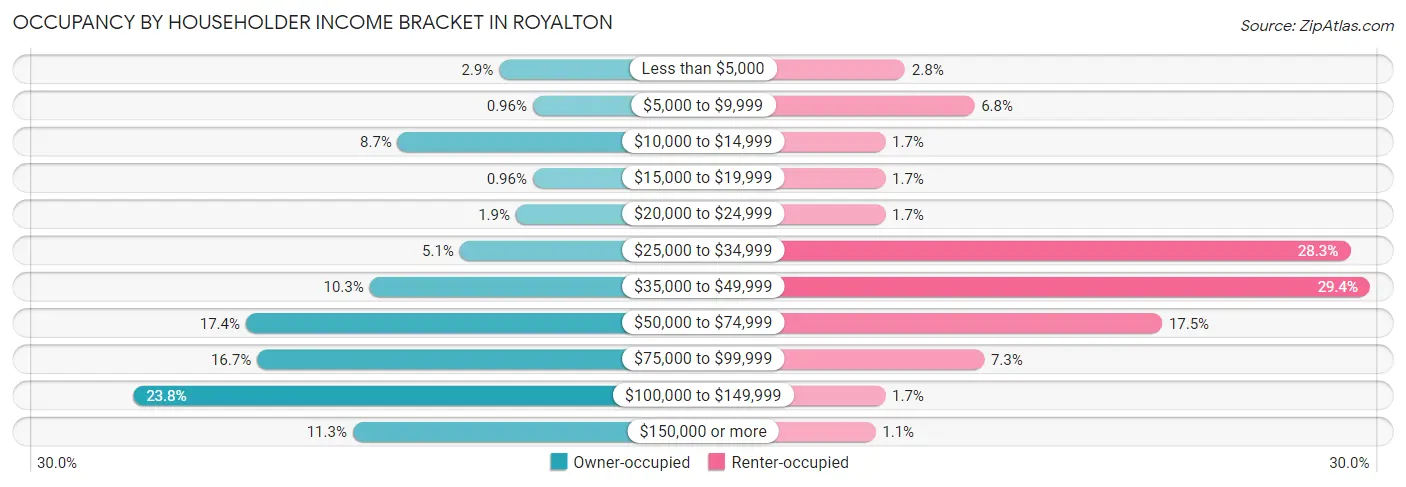
| Income Bracket | Owner-occupied | Renter-occupied |
| Less than $5,000 | 9 (2.9%) | 5 (2.8%) |
| $5,000 to $9,999 | 3 (1.0%) | 12 (6.8%) |
| $10,000 to $14,999 | 27 (8.7%) | 3 (1.7%) |
| $15,000 to $19,999 | 3 (1.0%) | 3 (1.7%) |
| $20,000 to $24,999 | 6 (1.9%) | 3 (1.7%) |
| $25,000 to $34,999 | 16 (5.1%) | 50 (28.2%) |
| $35,000 to $49,999 | 32 (10.3%) | 52 (29.4%) |
| $50,000 to $74,999 | 54 (17.4%) | 31 (17.5%) |
| $75,000 to $99,999 | 52 (16.7%) | 13 (7.3%) |
| $100,000 to $149,999 | 74 (23.8%) | 3 (1.7%) |
| $150,000 or more | 35 (11.3%) | 2 (1.1%) |
| Total | 311 (100.0%) | 177 (100.0%) |
Monthly Housing Cost Tiers in Royalton
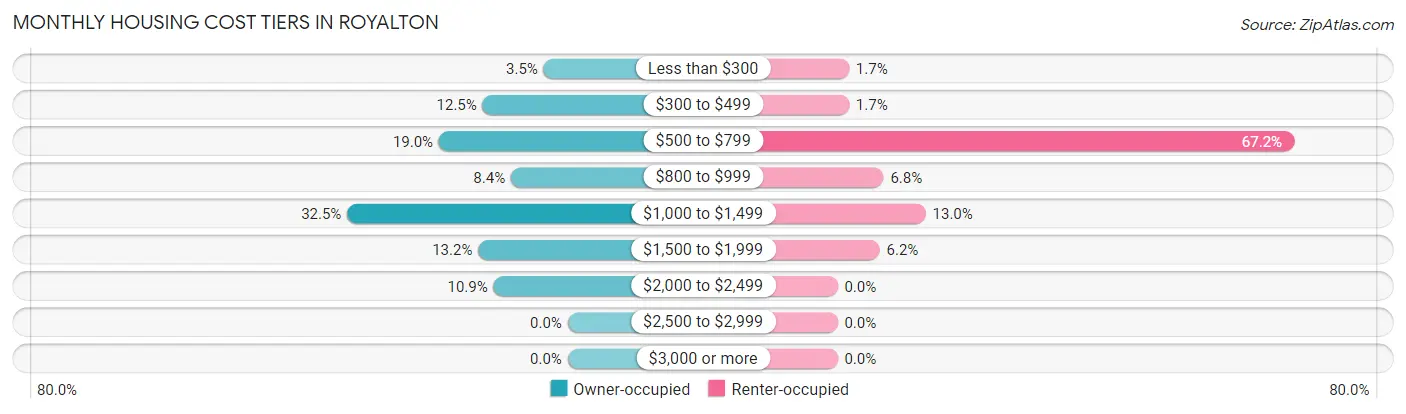
| Monthly Cost | Owner-occupied | Renter-occupied |
| Less than $300 | 11 (3.5%) | 3 (1.7%) |
| $300 to $499 | 39 (12.5%) | 3 (1.7%) |
| $500 to $799 | 59 (19.0%) | 119 (67.2%) |
| $800 to $999 | 26 (8.4%) | 12 (6.8%) |
| $1,000 to $1,499 | 101 (32.5%) | 23 (13.0%) |
| $1,500 to $1,999 | 41 (13.2%) | 11 (6.2%) |
| $2,000 to $2,499 | 34 (10.9%) | 0 (0.0%) |
| $2,500 to $2,999 | 0 (0.0%) | 0 (0.0%) |
| $3,000 or more | 0 (0.0%) | 0 (0.0%) |
| Total | 311 (100.0%) | 177 (100.0%) |
Physical Housing Characteristics in Royalton
Housing Structures in Royalton
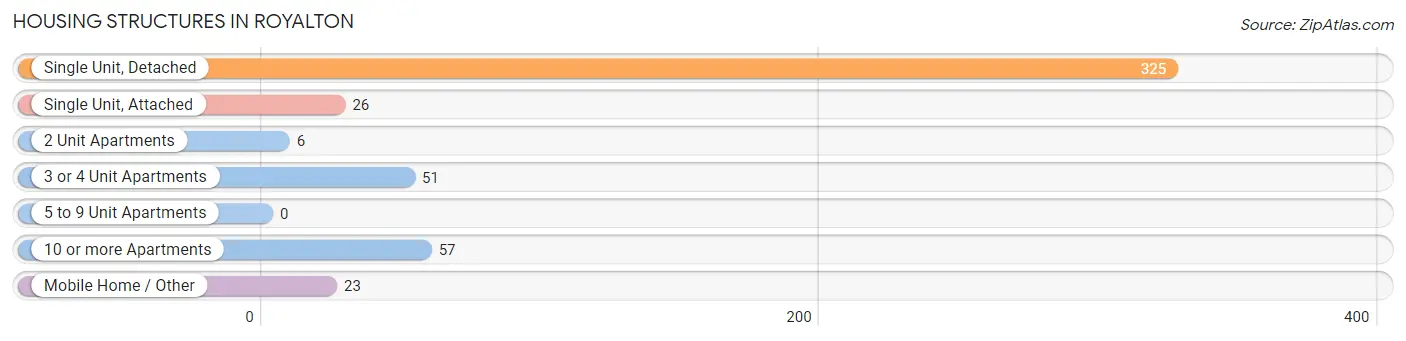
| Structure Type | # Housing Units | % Housing Units |
| Single Unit, Detached | 325 | 66.6% |
| Single Unit, Attached | 26 | 5.3% |
| 2 Unit Apartments | 6 | 1.2% |
| 3 or 4 Unit Apartments | 51 | 10.4% |
| 5 to 9 Unit Apartments | 0 | 0.0% |
| 10 or more Apartments | 57 | 11.7% |
| Mobile Home / Other | 23 | 4.7% |
| Total | 488 | 100.0% |
Housing Structures by Occupancy in Royalton
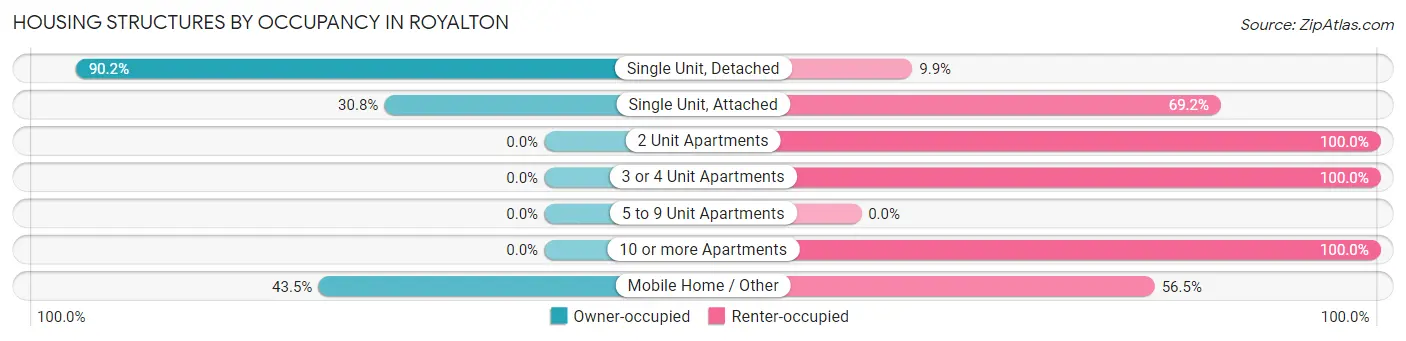
| Structure Type | Owner-occupied | Renter-occupied |
| Single Unit, Detached | 293 (90.1%) | 32 (9.9%) |
| Single Unit, Attached | 8 (30.8%) | 18 (69.2%) |
| 2 Unit Apartments | 0 (0.0%) | 6 (100.0%) |
| 3 or 4 Unit Apartments | 0 (0.0%) | 51 (100.0%) |
| 5 to 9 Unit Apartments | 0 (0.0%) | 0 (0.0%) |
| 10 or more Apartments | 0 (0.0%) | 57 (100.0%) |
| Mobile Home / Other | 10 (43.5%) | 13 (56.5%) |
| Total | 311 (63.7%) | 177 (36.3%) |
Housing Structures by Number of Rooms in Royalton
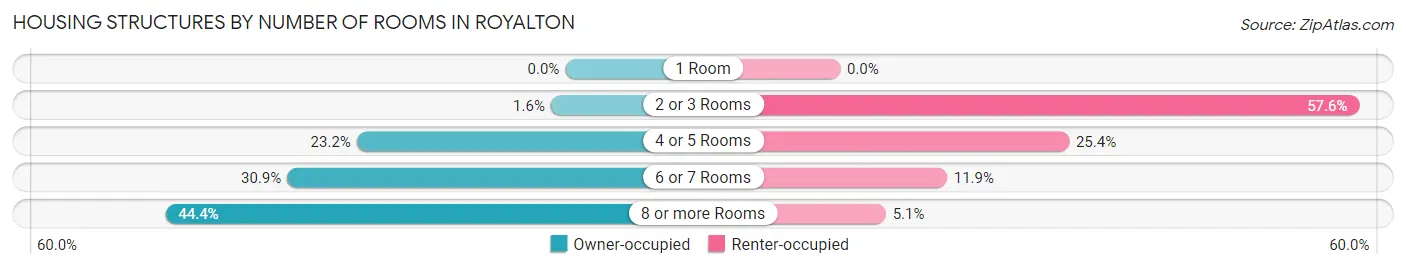
| Number of Rooms | Owner-occupied | Renter-occupied |
| 1 Room | 0 (0.0%) | 0 (0.0%) |
| 2 or 3 Rooms | 5 (1.6%) | 102 (57.6%) |
| 4 or 5 Rooms | 72 (23.2%) | 45 (25.4%) |
| 6 or 7 Rooms | 96 (30.9%) | 21 (11.9%) |
| 8 or more Rooms | 138 (44.4%) | 9 (5.1%) |
| Total | 311 (100.0%) | 177 (100.0%) |
Housing Structure by Heating Type in Royalton
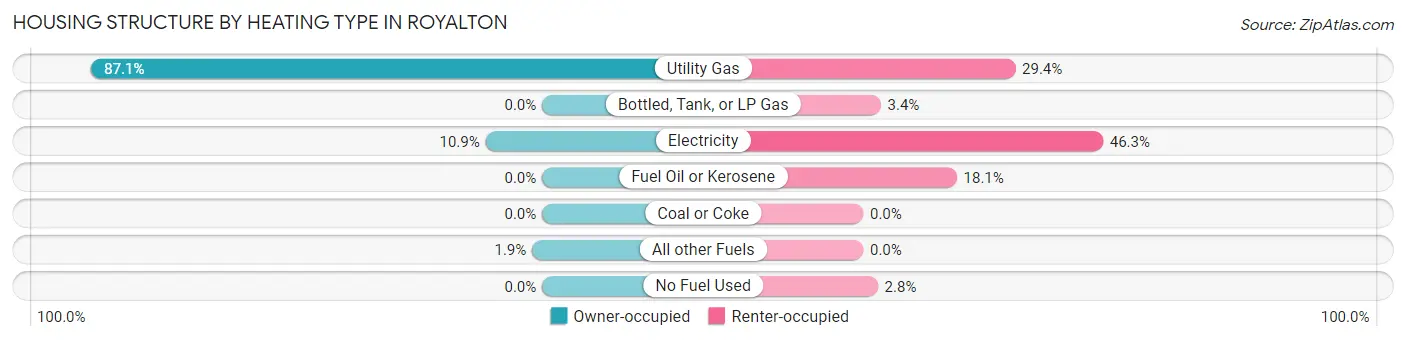
| Heating Type | Owner-occupied | Renter-occupied |
| Utility Gas | 271 (87.1%) | 52 (29.4%) |
| Bottled, Tank, or LP Gas | 0 (0.0%) | 6 (3.4%) |
| Electricity | 34 (10.9%) | 82 (46.3%) |
| Fuel Oil or Kerosene | 0 (0.0%) | 32 (18.1%) |
| Coal or Coke | 0 (0.0%) | 0 (0.0%) |
| All other Fuels | 6 (1.9%) | 0 (0.0%) |
| No Fuel Used | 0 (0.0%) | 5 (2.8%) |
| Total | 311 (100.0%) | 177 (100.0%) |
Household Vehicle Usage in Royalton
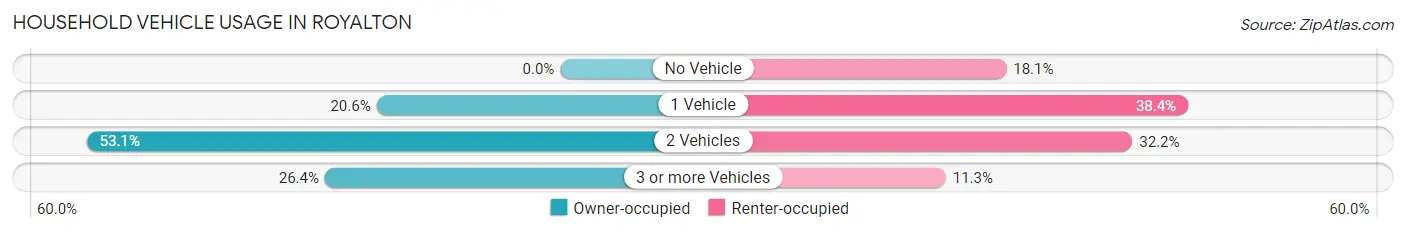
| Vehicles per Household | Owner-occupied | Renter-occupied |
| No Vehicle | 0 (0.0%) | 32 (18.1%) |
| 1 Vehicle | 64 (20.6%) | 68 (38.4%) |
| 2 Vehicles | 165 (53.0%) | 57 (32.2%) |
| 3 or more Vehicles | 82 (26.4%) | 20 (11.3%) |
| Total | 311 (100.0%) | 177 (100.0%) |
Real Estate & Mortgages in Royalton
Real Estate and Mortgage Overview in Royalton
| Characteristic | Without Mortgage | With Mortgage |
| Housing Units | 106 | 205 |
| Median Property Value | $155,000 | $192,700 |
| Median Household Income | $40,833 | $32 |
| Monthly Housing Costs | $518 | $0 |
| Real Estate Taxes | $2,125 | $0 |
Property Value by Mortgage Status in Royalton
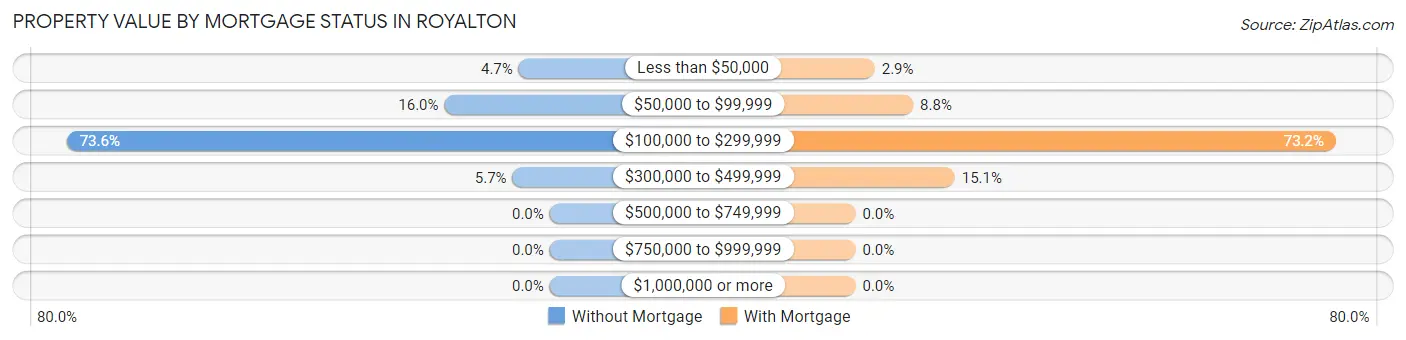
| Property Value | Without Mortgage | With Mortgage |
| Less than $50,000 | 5 (4.7%) | 6 (2.9%) |
| $50,000 to $99,999 | 17 (16.0%) | 18 (8.8%) |
| $100,000 to $299,999 | 78 (73.6%) | 150 (73.2%) |
| $300,000 to $499,999 | 6 (5.7%) | 31 (15.1%) |
| $500,000 to $749,999 | 0 (0.0%) | 0 (0.0%) |
| $750,000 to $999,999 | 0 (0.0%) | 0 (0.0%) |
| $1,000,000 or more | 0 (0.0%) | 0 (0.0%) |
| Total | 106 (100.0%) | 205 (100.0%) |
Household Income by Mortgage Status in Royalton
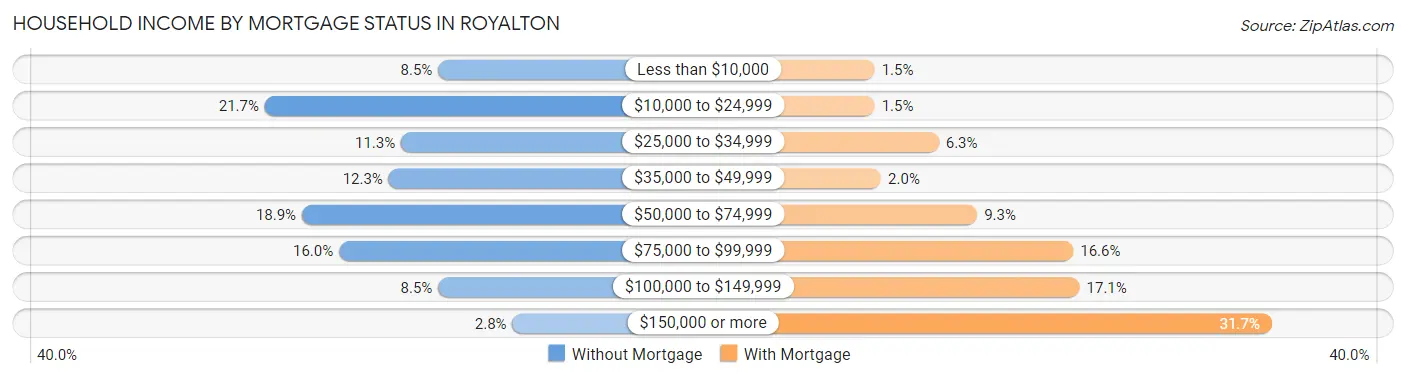
| Household Income | Without Mortgage | With Mortgage |
| Less than $10,000 | 9 (8.5%) | 3 (1.5%) |
| $10,000 to $24,999 | 23 (21.7%) | 3 (1.5%) |
| $25,000 to $34,999 | 12 (11.3%) | 13 (6.3%) |
| $35,000 to $49,999 | 13 (12.3%) | 4 (1.9%) |
| $50,000 to $74,999 | 20 (18.9%) | 19 (9.3%) |
| $75,000 to $99,999 | 17 (16.0%) | 34 (16.6%) |
| $100,000 to $149,999 | 9 (8.5%) | 35 (17.1%) |
| $150,000 or more | 3 (2.8%) | 65 (31.7%) |
| Total | 106 (100.0%) | 205 (100.0%) |
Property Value to Household Income Ratio in Royalton
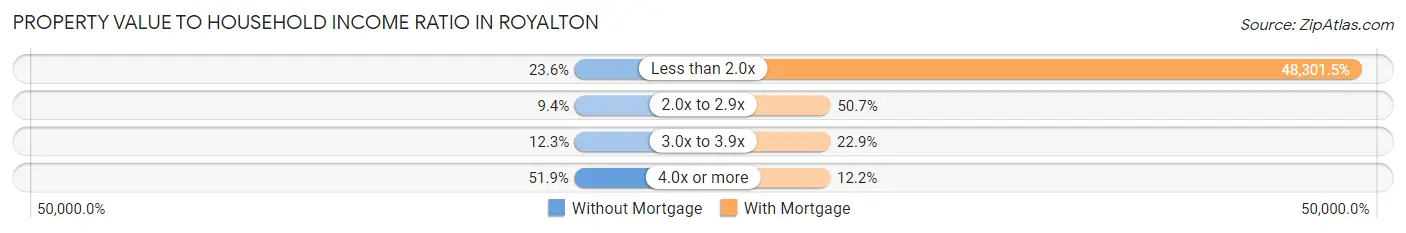
| Value-to-Income Ratio | Without Mortgage | With Mortgage |
| Less than 2.0x | 25 (23.6%) | 99,018 (48,301.5%) |
| 2.0x to 2.9x | 10 (9.4%) | 104 (50.7%) |
| 3.0x to 3.9x | 13 (12.3%) | 47 (22.9%) |
| 4.0x or more | 55 (51.9%) | 25 (12.2%) |
| Total | 106 (100.0%) | 205 (100.0%) |
Real Estate Taxes by Mortgage Status in Royalton
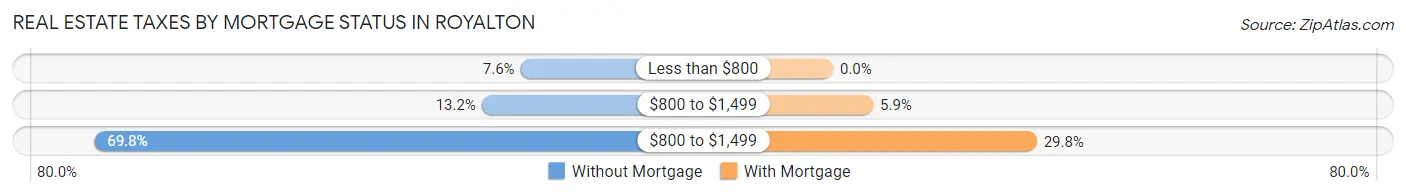
| Property Taxes | Without Mortgage | With Mortgage |
| Less than $800 | 8 (7.5%) | 0 (0.0%) |
| $800 to $1,499 | 14 (13.2%) | 12 (5.9%) |
| $800 to $1,499 | 74 (69.8%) | 61 (29.8%) |
| Total | 106 (100.0%) | 205 (100.0%) |
Health & Disability in Royalton
Health Insurance Coverage by Age in Royalton
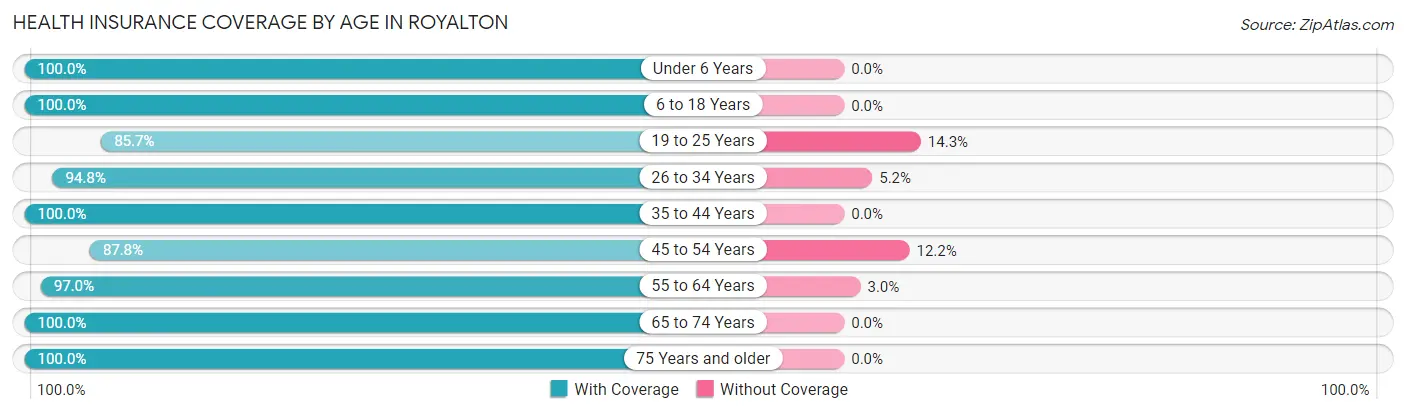
| Age Bracket | With Coverage | Without Coverage |
| Under 6 Years | 91 (100.0%) | 0 (0.0%) |
| 6 to 18 Years | 257 (100.0%) | 0 (0.0%) |
| 19 to 25 Years | 114 (85.7%) | 19 (14.3%) |
| 26 to 34 Years | 127 (94.8%) | 7 (5.2%) |
| 35 to 44 Years | 167 (100.0%) | 0 (0.0%) |
| 45 to 54 Years | 101 (87.8%) | 14 (12.2%) |
| 55 to 64 Years | 96 (97.0%) | 3 (3.0%) |
| 65 to 74 Years | 101 (100.0%) | 0 (0.0%) |
| 75 Years and older | 54 (100.0%) | 0 (0.0%) |
| Total | 1,108 (96.3%) | 43 (3.7%) |
Health Insurance Coverage by Citizenship Status in Royalton
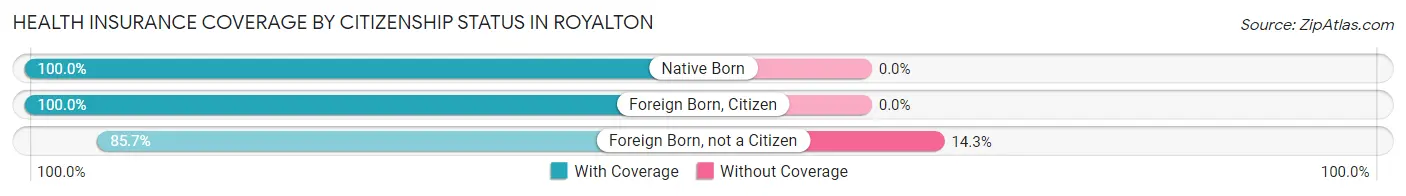
| Citizenship Status | With Coverage | Without Coverage |
| Native Born | 91 (100.0%) | 0 (0.0%) |
| Foreign Born, Citizen | 257 (100.0%) | 0 (0.0%) |
| Foreign Born, not a Citizen | 114 (85.7%) | 19 (14.3%) |
Health Insurance Coverage by Household Income in Royalton
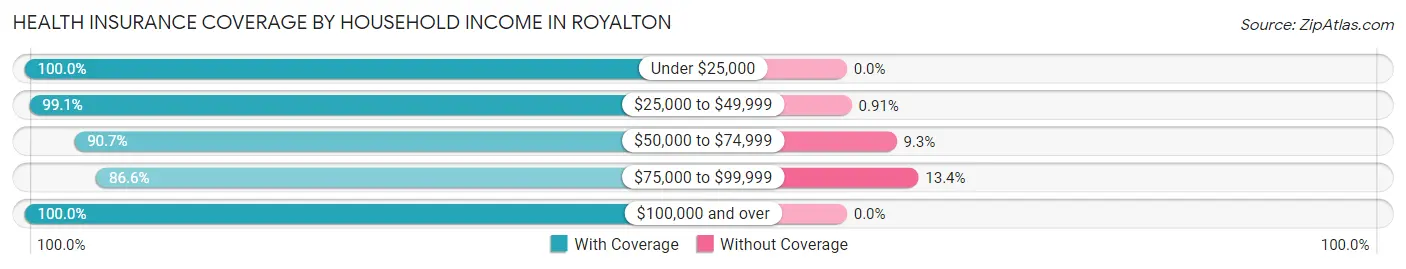
| Household Income | With Coverage | Without Coverage |
| Under $25,000 | 116 (100.0%) | 0 (0.0%) |
| $25,000 to $49,999 | 327 (99.1%) | 3 (0.9%) |
| $50,000 to $74,999 | 156 (90.7%) | 16 (9.3%) |
| $75,000 to $99,999 | 155 (86.6%) | 24 (13.4%) |
| $100,000 and over | 354 (100.0%) | 0 (0.0%) |
Public vs Private Health Insurance Coverage by Age in Royalton
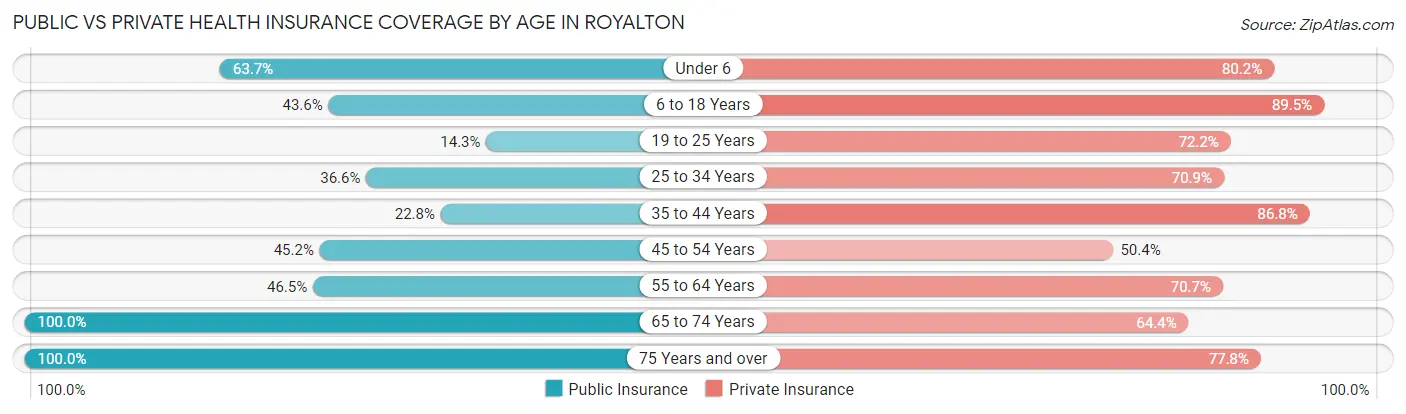
| Age Bracket | Public Insurance | Private Insurance |
| Under 6 | 58 (63.7%) | 73 (80.2%) |
| 6 to 18 Years | 112 (43.6%) | 230 (89.5%) |
| 19 to 25 Years | 19 (14.3%) | 96 (72.2%) |
| 25 to 34 Years | 49 (36.6%) | 95 (70.9%) |
| 35 to 44 Years | 38 (22.8%) | 145 (86.8%) |
| 45 to 54 Years | 52 (45.2%) | 58 (50.4%) |
| 55 to 64 Years | 46 (46.5%) | 70 (70.7%) |
| 65 to 74 Years | 101 (100.0%) | 65 (64.4%) |
| 75 Years and over | 54 (100.0%) | 42 (77.8%) |
| Total | 529 (46.0%) | 874 (75.9%) |
Disability Status by Sex by Age in Royalton
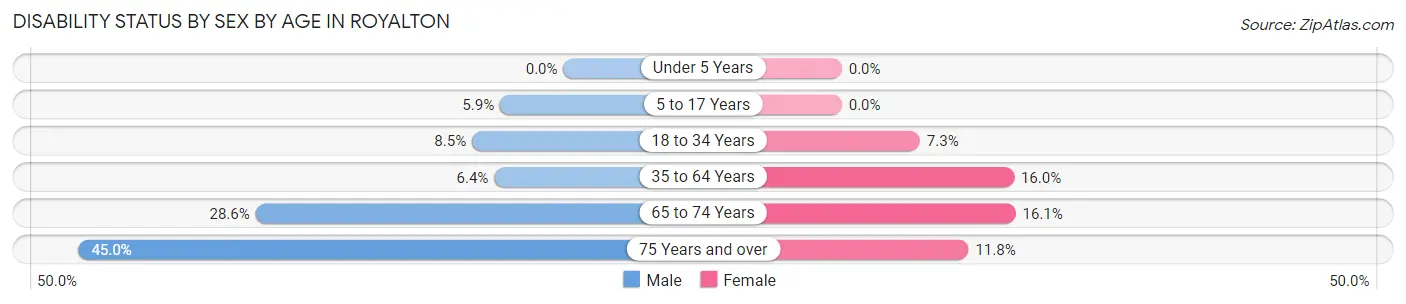
| Age Bracket | Male | Female |
| Under 5 Years | 0 (0.0%) | 0 (0.0%) |
| 5 to 17 Years | 8 (5.9%) | 0 (0.0%) |
| 18 to 34 Years | 14 (8.5%) | 10 (7.2%) |
| 35 to 64 Years | 12 (6.4%) | 31 (16.0%) |
| 65 to 74 Years | 20 (28.6%) | 5 (16.1%) |
| 75 Years and over | 9 (45.0%) | 4 (11.8%) |
Disability Class by Sex by Age in Royalton
Disability Class: Hearing Difficulty
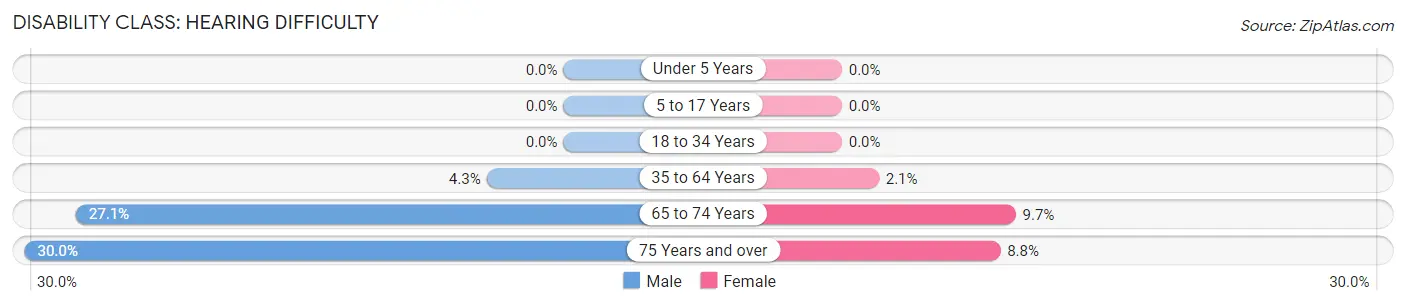
| Age Bracket | Male | Female |
| Under 5 Years | 0 (0.0%) | 0 (0.0%) |
| 5 to 17 Years | 0 (0.0%) | 0 (0.0%) |
| 18 to 34 Years | 0 (0.0%) | 0 (0.0%) |
| 35 to 64 Years | 8 (4.3%) | 4 (2.1%) |
| 65 to 74 Years | 19 (27.1%) | 3 (9.7%) |
| 75 Years and over | 6 (30.0%) | 3 (8.8%) |
Disability Class: Vision Difficulty
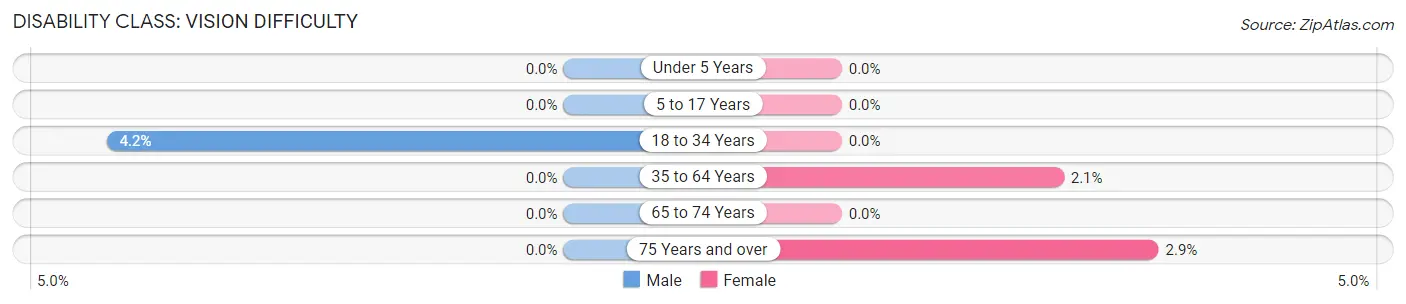
| Age Bracket | Male | Female |
| Under 5 Years | 0 (0.0%) | 0 (0.0%) |
| 5 to 17 Years | 0 (0.0%) | 0 (0.0%) |
| 18 to 34 Years | 7 (4.2%) | 0 (0.0%) |
| 35 to 64 Years | 0 (0.0%) | 4 (2.1%) |
| 65 to 74 Years | 0 (0.0%) | 0 (0.0%) |
| 75 Years and over | 0 (0.0%) | 1 (2.9%) |
Disability Class: Cognitive Difficulty
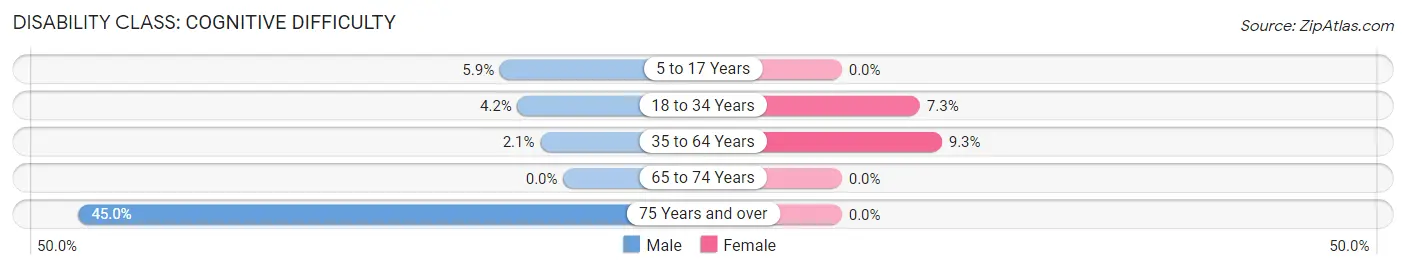
| Age Bracket | Male | Female |
| 5 to 17 Years | 8 (5.9%) | 0 (0.0%) |
| 18 to 34 Years | 7 (4.2%) | 10 (7.2%) |
| 35 to 64 Years | 4 (2.1%) | 18 (9.3%) |
| 65 to 74 Years | 0 (0.0%) | 0 (0.0%) |
| 75 Years and over | 9 (45.0%) | 0 (0.0%) |
Disability Class: Ambulatory Difficulty
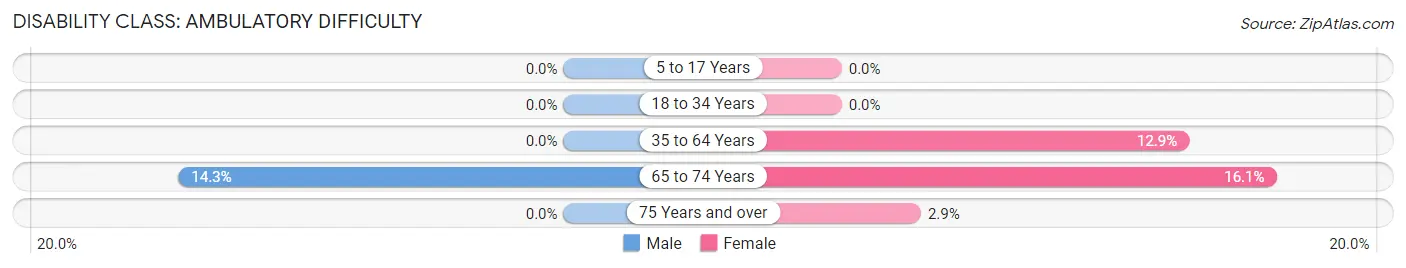
| Age Bracket | Male | Female |
| 5 to 17 Years | 0 (0.0%) | 0 (0.0%) |
| 18 to 34 Years | 0 (0.0%) | 0 (0.0%) |
| 35 to 64 Years | 0 (0.0%) | 25 (12.9%) |
| 65 to 74 Years | 10 (14.3%) | 5 (16.1%) |
| 75 Years and over | 0 (0.0%) | 1 (2.9%) |
Disability Class: Self-Care Difficulty
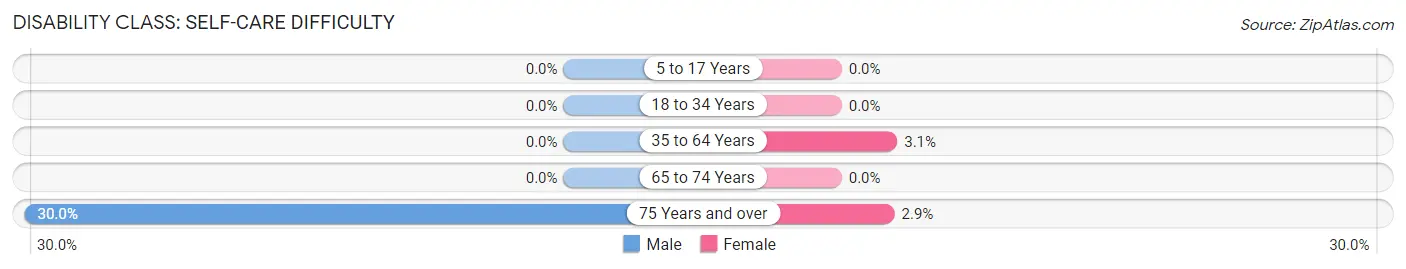
| Age Bracket | Male | Female |
| 5 to 17 Years | 0 (0.0%) | 0 (0.0%) |
| 18 to 34 Years | 0 (0.0%) | 0 (0.0%) |
| 35 to 64 Years | 0 (0.0%) | 6 (3.1%) |
| 65 to 74 Years | 0 (0.0%) | 0 (0.0%) |
| 75 Years and over | 6 (30.0%) | 1 (2.9%) |
Technology Access in Royalton
Computing Device Access in Royalton
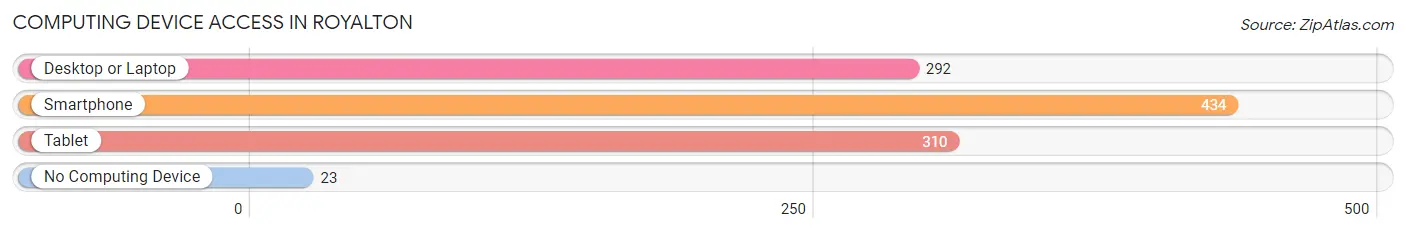
| Device Type | # Households | % Households |
| Desktop or Laptop | 292 | 59.8% |
| Smartphone | 434 | 88.9% |
| Tablet | 310 | 63.5% |
| No Computing Device | 23 | 4.7% |
| Total | 488 | 100.0% |
Internet Access in Royalton
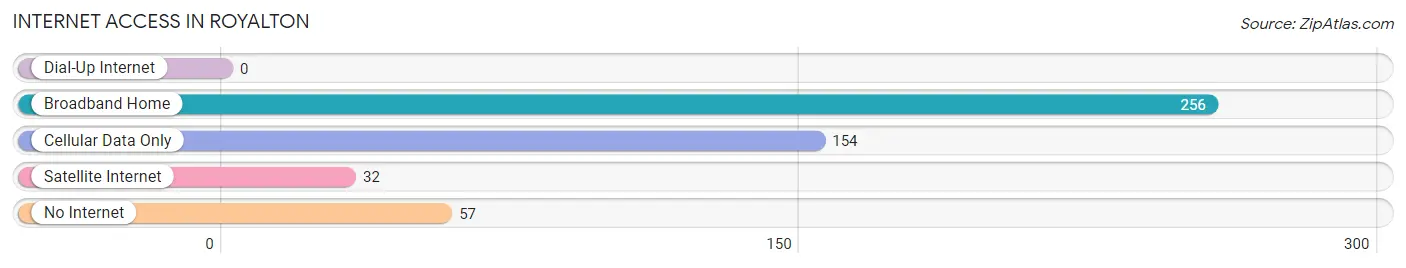
| Internet Type | # Households | % Households |
| Dial-Up Internet | 0 | 0.0% |
| Broadband Home | 256 | 52.5% |
| Cellular Data Only | 154 | 31.6% |
| Satellite Internet | 32 | 6.6% |
| No Internet | 57 | 11.7% |
| Total | 488 | 100.0% |
Royalton Summary
Royalton, Minnesota is a small city located in Morrison County, in the central part of the state. It is situated on the banks of the Platte River, and is part of the Little Falls Micropolitan Statistical Area. The city has a population of 1,845 people, according to the 2010 census.
History
The area that is now Royalton was first settled in 1856 by a group of German immigrants. The town was originally called “New Munich”, and was later renamed “Royalton” in honor of the Royal family of Bavaria. The town was officially incorporated in 1887.
In the early 1900s, Royalton was a thriving agricultural community, with many farms and businesses. The town was also home to a number of sawmills, which provided lumber for the area. In the 1920s, the town began to experience a decline in population, as many of the residents moved away to find work in larger cities.
Geography
Royalton is located in central Minnesota, in Morrison County. The city is situated on the banks of the Platte River, and is part of the Little Falls Micropolitan Statistical Area. The city has a total area of 1.2 square miles, all of which is land.
The city is located in a mostly rural area, with the nearest major city being St. Cloud, which is about 25 miles away. The city is also located near several lakes, including Lake Alexander, Lake Osakis, and Lake Wobegon.
Economy
The economy of Royalton is largely based on agriculture and tourism. The city is home to several farms, which produce a variety of crops, including corn, soybeans, and wheat. The city is also home to several small businesses, including restaurants, retail stores, and service providers.
The city is also a popular tourist destination, due to its proximity to several lakes and its historic downtown area. The city is home to several festivals and events throughout the year, including the Royalton Summerfest and the Royalton Harvest Festival.
Demographics
According to the 2010 census, the population of Royalton was 1,845 people. The racial makeup of the city was 97.3% White, 0.3% African American, 0.2% Native American, 0.3% Asian, 0.1% Pacific Islander, 0.7% from other races, and 0.9% from two or more races. Hispanic or Latino of any race were 1.7% of the population.
The median household income in Royalton was $45,938, and the median family income was $51,938. The per capita income for the city was $20,938. About 8.3% of families and 10.2% of the population were below the poverty line, including 14.2% of those under age 18 and 8.3% of those age 65 or over.
Common Questions
What is Per Capita Income in Royalton?
Per Capita income in Royalton is $28,082.
What is the Median Family Income in Royalton?
Median Family Income in Royalton is $75,625.
What is the Median Household income in Royalton?
Median Household Income in Royalton is $54,167.
What is Income or Wage Gap in Royalton?
Income or Wage Gap in Royalton is 21.2%.
Women in Royalton earn 78.8 cents for every dollar earned by a man.
What is Family Income Deficit in Royalton?
Family Income Deficit in Royalton is $6,755.
Families that are below poverty line in Royalton earn $6,755 less on average than the poverty threshold level.
What is Inequality or Gini Index in Royalton?
Inequality or Gini Index in Royalton is 0.38.
What is the Total Population of Royalton?
Total Population of Royalton is 1,179.
What is the Total Male Population of Royalton?
Total Male Population of Royalton is 630.
What is the Total Female Population of Royalton?
Total Female Population of Royalton is 549.
What is the Ratio of Males per 100 Females in Royalton?
There are 114.75 Males per 100 Females in Royalton.
What is the Ratio of Females per 100 Males in Royalton?
There are 87.14 Females per 100 Males in Royalton.
What is the Median Population Age in Royalton?
Median Population Age in Royalton is 33.8 Years.
What is the Average Family Size in Royalton
Average Family Size in Royalton is 3.2 People.
What is the Average Household Size in Royalton
Average Household Size in Royalton is 2.4 People.
How Large is the Labor Force in Royalton?
There are 640 People in the Labor Forcein in Royalton.
What is the Percentage of People in the Labor Force in Royalton?
72.9% of People are in the Labor Force in Royalton.
What is the Unemployment Rate in Royalton?
Unemployment Rate in Royalton is 7.7%.