Rose Creek, MN Map & Demographics
Rose Creek Map
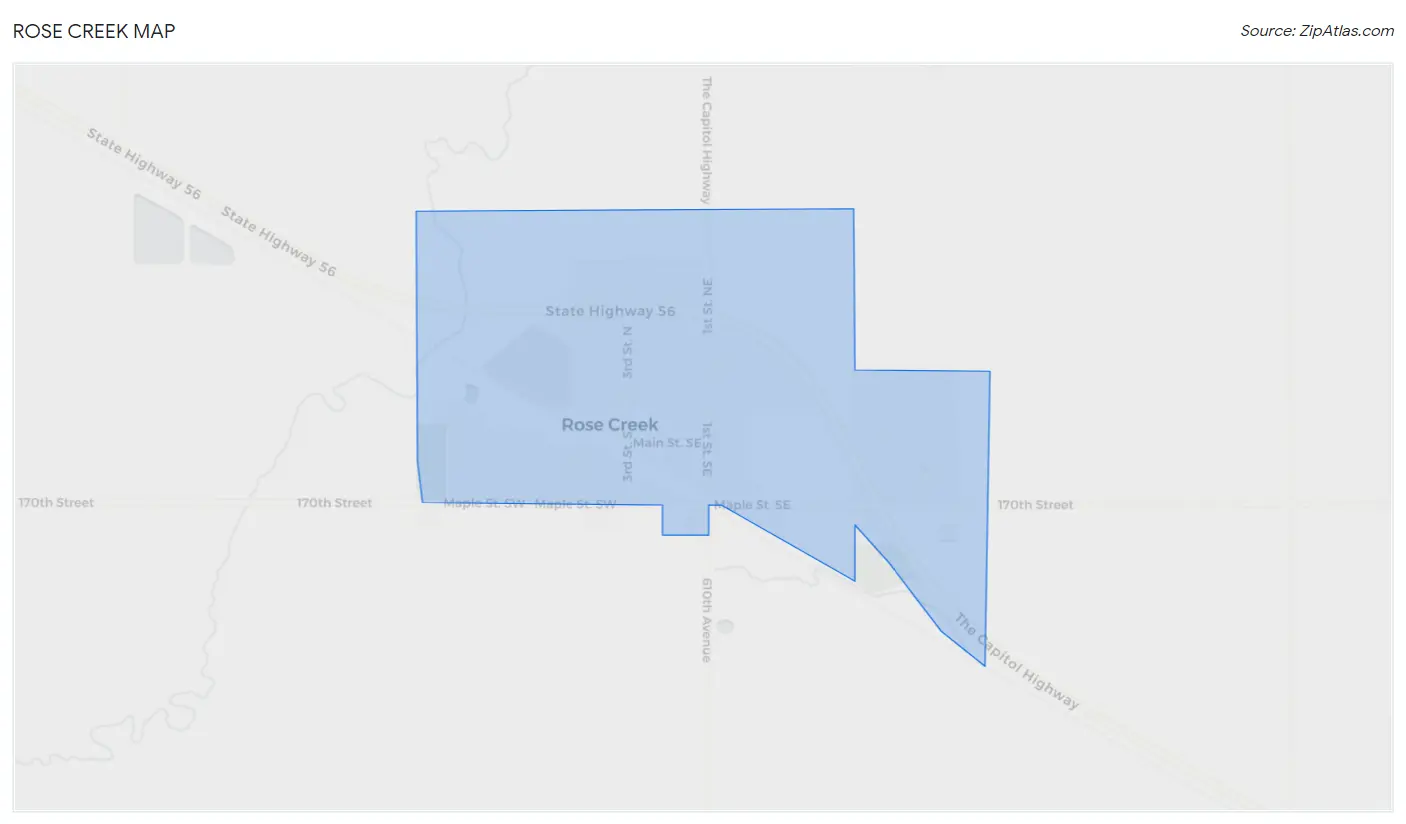
Rose Creek Overview
$31,183
PER CAPITA INCOME
$94,063
AVG FAMILY INCOME
$68,036
AVG HOUSEHOLD INCOME
22.5%
WAGE / INCOME GAP [ % ]
77.5¢/ $1
WAGE / INCOME GAP [ $ ]
0.37
INEQUALITY / GINI INDEX
473
TOTAL POPULATION
219
MALE POPULATION
254
FEMALE POPULATION
86.22
MALES / 100 FEMALES
115.98
FEMALES / 100 MALES
39.3
MEDIAN AGE
3.3
AVG FAMILY SIZE
2.6
AVG HOUSEHOLD SIZE
227
LABOR FORCE [ PEOPLE ]
65.0%
PERCENT IN LABOR FORCE
0.9%
UNEMPLOYMENT RATE
Rose Creek Zip Codes
Rose Creek Area Codes
Income in Rose Creek
Income Overview in Rose Creek
Per Capita Income in Rose Creek is $31,183, while median incomes of families and households are $94,063 and $68,036 respectively.
| Characteristic | Number | Measure |
| Per Capita Income | 473 | $31,183 |
| Median Family Income | 121 | $94,063 |
| Mean Family Income | 121 | $99,881 |
| Median Household Income | 181 | $68,036 |
| Mean Household Income | 181 | $80,571 |
| Income Deficit | 121 | $0 |
| Wage / Income Gap (%) | 473 | 22.47% |
| Wage / Income Gap ($) | 473 | 77.53¢ per $1 |
| Gini / Inequality Index | 473 | 0.37 |
Earnings by Sex in Rose Creek
Average Earnings in Rose Creek are $39,600, $48,438 for men and $37,552 for women, a difference of 22.5%.
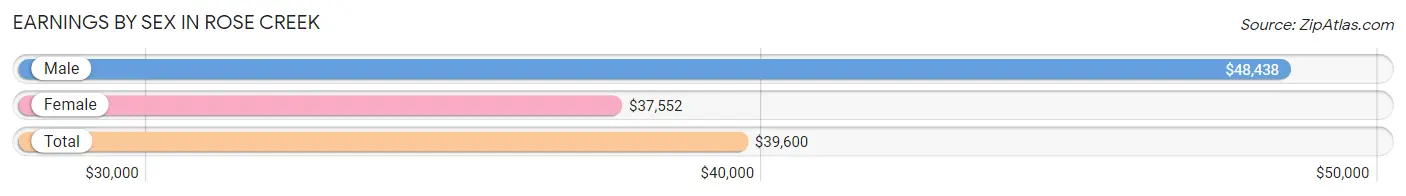
| Sex | Number | Average Earnings |
| Male | 121 (51.3%) | $48,438 |
| Female | 115 (48.7%) | $37,552 |
| Total | 236 (100.0%) | $39,600 |
Earnings by Sex by Income Bracket in Rose Creek
The most common earnings brackets in Rose Creek are $75,000 to $99,999 for men (34 | 28.1%) and $35,000 to $39,999 for women (28 | 24.3%).
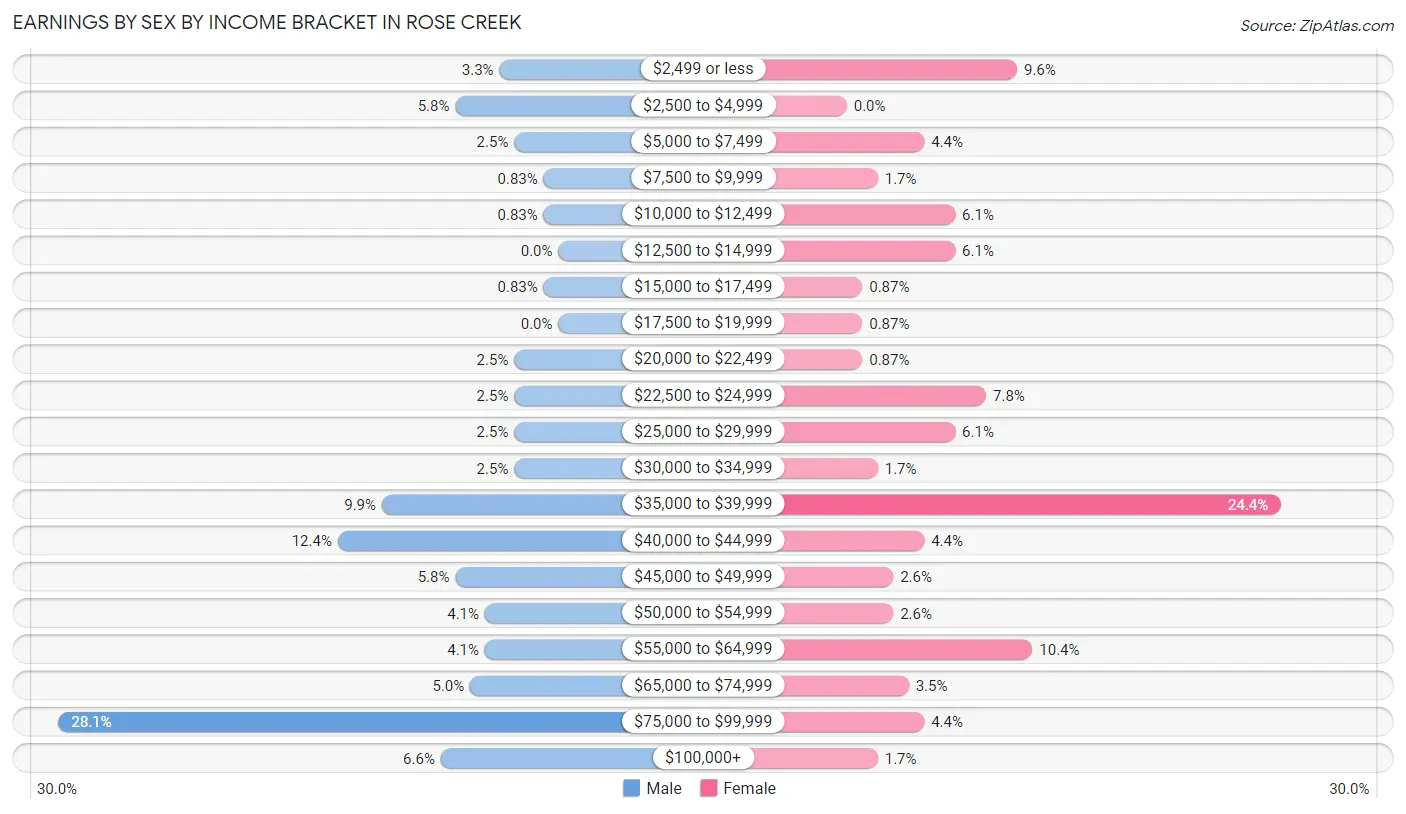
| Income | Male | Female |
| $2,499 or less | 4 (3.3%) | 11 (9.6%) |
| $2,500 to $4,999 | 7 (5.8%) | 0 (0.0%) |
| $5,000 to $7,499 | 3 (2.5%) | 5 (4.3%) |
| $7,500 to $9,999 | 1 (0.8%) | 2 (1.7%) |
| $10,000 to $12,499 | 1 (0.8%) | 7 (6.1%) |
| $12,500 to $14,999 | 0 (0.0%) | 7 (6.1%) |
| $15,000 to $17,499 | 1 (0.8%) | 1 (0.9%) |
| $17,500 to $19,999 | 0 (0.0%) | 1 (0.9%) |
| $20,000 to $22,499 | 3 (2.5%) | 1 (0.9%) |
| $22,500 to $24,999 | 3 (2.5%) | 9 (7.8%) |
| $25,000 to $29,999 | 3 (2.5%) | 7 (6.1%) |
| $30,000 to $34,999 | 3 (2.5%) | 2 (1.7%) |
| $35,000 to $39,999 | 12 (9.9%) | 28 (24.3%) |
| $40,000 to $44,999 | 15 (12.4%) | 5 (4.3%) |
| $45,000 to $49,999 | 7 (5.8%) | 3 (2.6%) |
| $50,000 to $54,999 | 5 (4.1%) | 3 (2.6%) |
| $55,000 to $64,999 | 5 (4.1%) | 12 (10.4%) |
| $65,000 to $74,999 | 6 (5.0%) | 4 (3.5%) |
| $75,000 to $99,999 | 34 (28.1%) | 5 (4.3%) |
| $100,000+ | 8 (6.6%) | 2 (1.7%) |
| Total | 121 (100.0%) | 115 (100.0%) |
Earnings by Sex by Educational Attainment in Rose Creek
Average earnings in Rose Creek are $57,917 for men and $38,490 for women, a difference of 33.5%. Men with an educational attainment of graduate degree enjoy the highest average annual earnings of $85,625, while those with high school diploma education earn the least with $43,750. Women with an educational attainment of graduate degree earn the most with the average annual earnings of $57,083, while those with high school diploma education have the smallest earnings of $25,938.
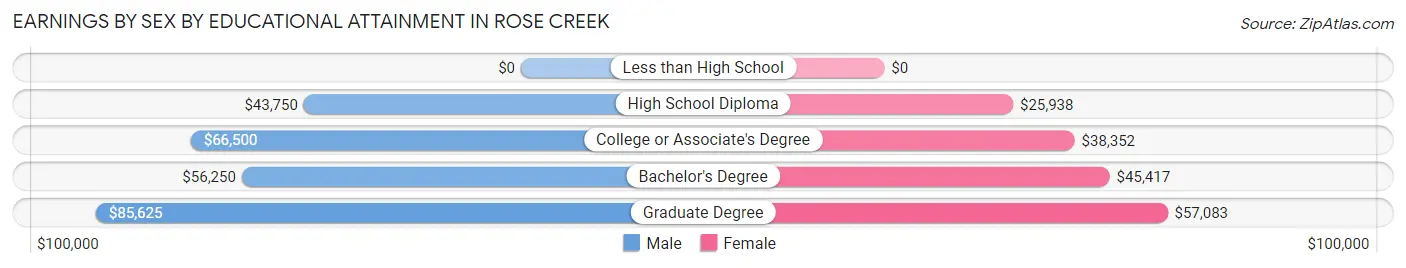
| Educational Attainment | Male Income | Female Income |
| Less than High School | - | - |
| High School Diploma | $43,750 | $25,938 |
| College or Associate's Degree | $66,500 | $38,352 |
| Bachelor's Degree | $56,250 | $45,417 |
| Graduate Degree | $85,625 | $57,083 |
| Total | $57,917 | $38,490 |
Family Income in Rose Creek
Family Income Brackets in Rose Creek
According to the Rose Creek family income data, there are 42 families falling into the $100,000 to $149,999 income range, which is the most common income bracket and makes up 34.7% of all families. Conversely, the $15,000 to $24,999 income bracket is the least frequent group with only 1 families (0.8%) belonging to this category.
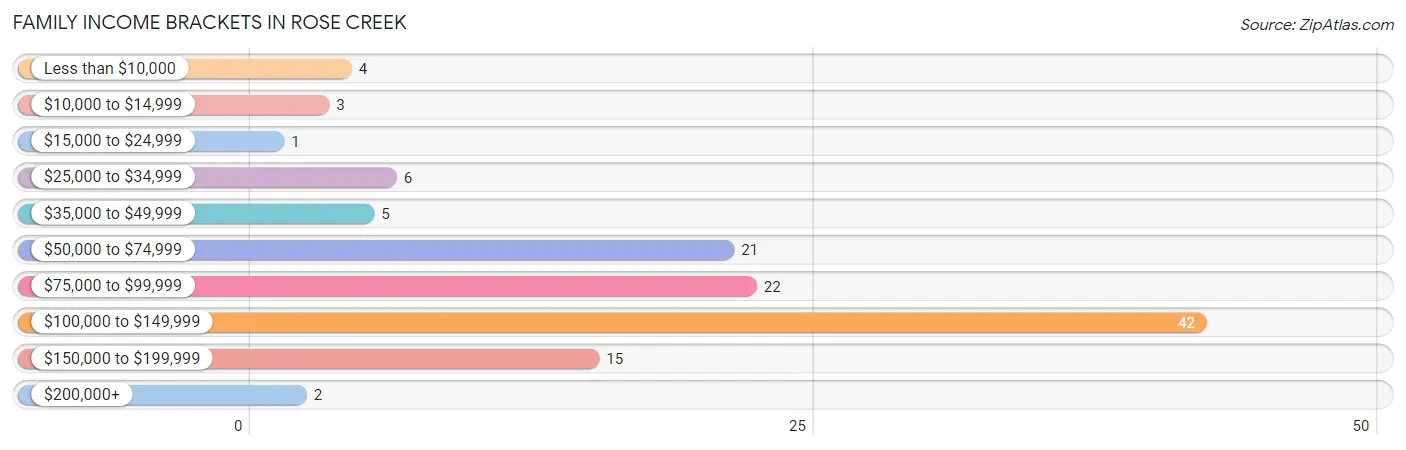
| Income Bracket | # Families | % Families |
| Less than $10,000 | 4 | 3.3% |
| $10,000 to $14,999 | 3 | 2.5% |
| $15,000 to $24,999 | 1 | 0.8% |
| $25,000 to $34,999 | 6 | 5.0% |
| $35,000 to $49,999 | 5 | 4.1% |
| $50,000 to $74,999 | 21 | 17.4% |
| $75,000 to $99,999 | 22 | 18.2% |
| $100,000 to $149,999 | 42 | 34.7% |
| $150,000 to $199,999 | 15 | 12.4% |
| $200,000+ | 2 | 1.7% |
Family Income by Famaliy Size in Rose Creek
5-person families (26 | 21.5%) account for the highest median family income in Rose Creek with $128,816 per family, while 2-person families (67 | 55.4%) have the highest median income of $38,125 per family member.
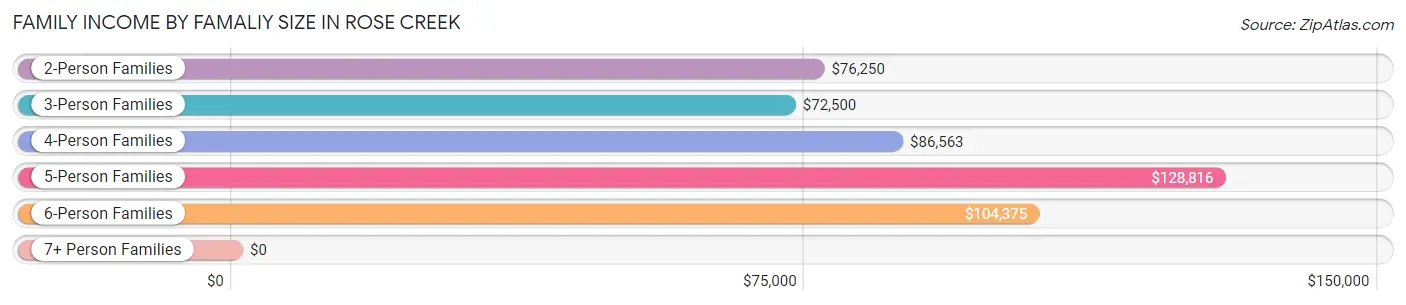
| Income Bracket | # Families | Median Income |
| 2-Person Families | 67 (55.4%) | $76,250 |
| 3-Person Families | 6 (5.0%) | $72,500 |
| 4-Person Families | 15 (12.4%) | $86,563 |
| 5-Person Families | 26 (21.5%) | $128,816 |
| 6-Person Families | 3 (2.5%) | $104,375 |
| 7+ Person Families | 4 (3.3%) | $0 |
| Total | 121 (100.0%) | $94,063 |
Family Income by Number of Earners in Rose Creek
The median family income in Rose Creek is $94,063, with families comprising 3+ earners (15) having the highest median family income of $127,083, while families with no earners (19) have the lowest median family income of $39,375, accounting for 12.4% and 15.7% of families, respectively.
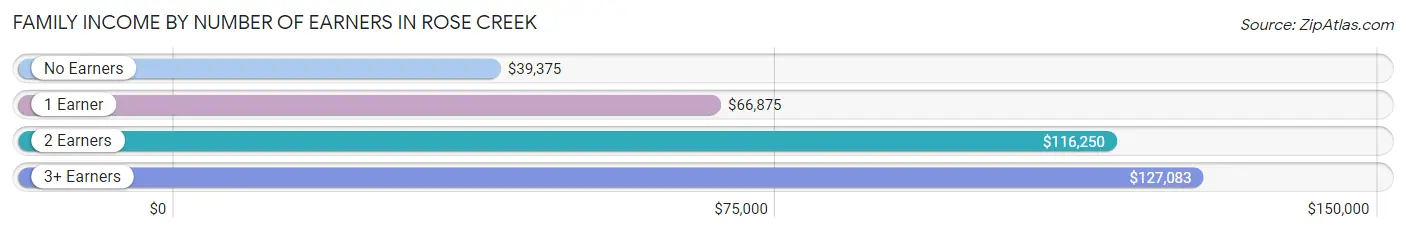
| Number of Earners | # Families | Median Income |
| No Earners | 19 (15.7%) | $39,375 |
| 1 Earner | 25 (20.7%) | $66,875 |
| 2 Earners | 62 (51.2%) | $116,250 |
| 3+ Earners | 15 (12.4%) | $127,083 |
| Total | 121 (100.0%) | $94,063 |
Household Income in Rose Creek
Household Income Brackets in Rose Creek
With 42 households falling in the category, the $100,000 to $149,999 income range is the most frequent in Rose Creek, accounting for 23.2% of all households. In contrast, only 2 households (1.1%) fall into the $200,000+ income bracket, making it the least populous group.
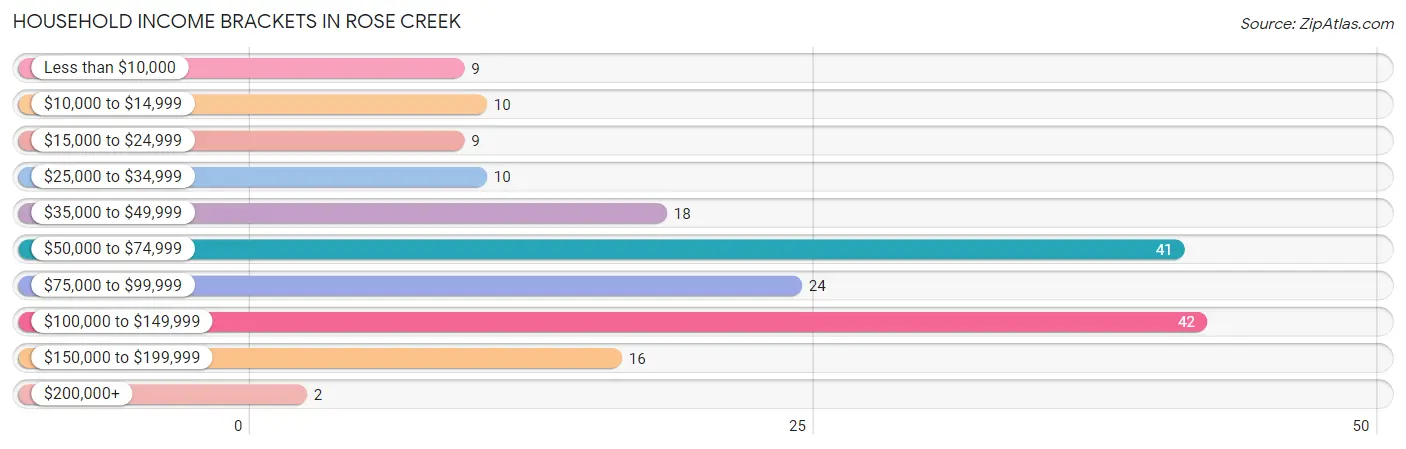
| Income Bracket | # Households | % Households |
| Less than $10,000 | 9 | 5.0% |
| $10,000 to $14,999 | 10 | 5.5% |
| $15,000 to $24,999 | 9 | 5.0% |
| $25,000 to $34,999 | 10 | 5.5% |
| $35,000 to $49,999 | 18 | 9.9% |
| $50,000 to $74,999 | 41 | 22.7% |
| $75,000 to $99,999 | 24 | 13.3% |
| $100,000 to $149,999 | 42 | 23.2% |
| $150,000 to $199,999 | 16 | 8.8% |
| $200,000+ | 2 | 1.1% |
Household Income by Householder Age in Rose Creek
The median household income in Rose Creek is $68,036, with the highest median household income of $127,961 found in the 25 to 44 years age bracket for the primary householder. A total of 47 households (26.0%) fall into this category. Meanwhile, the 65+ years age bracket for the primary householder has the lowest median household income of $56,250, with 80 households (44.2%) in this group.
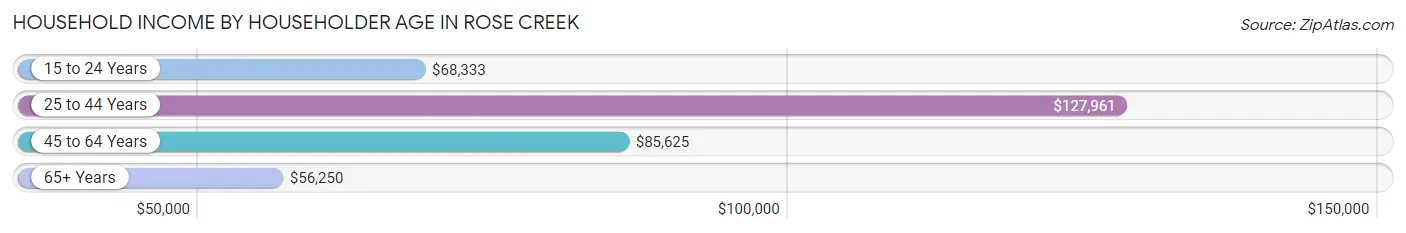
| Income Bracket | # Households | Median Income |
| 15 to 24 Years | 6 (3.3%) | $68,333 |
| 25 to 44 Years | 47 (26.0%) | $127,961 |
| 45 to 64 Years | 48 (26.5%) | $85,625 |
| 65+ Years | 80 (44.2%) | $56,250 |
| Total | 181 (100.0%) | $68,036 |
Poverty in Rose Creek
Income Below Poverty by Sex and Age in Rose Creek
With 5.5% poverty level for males and 7.5% for females among the residents of Rose Creek, 25 to 34 year old males and 75 year old and over females are the most vulnerable to poverty, with 1 males (16.7%) and 9 females (33.3%) in their respective age groups living below the poverty level.
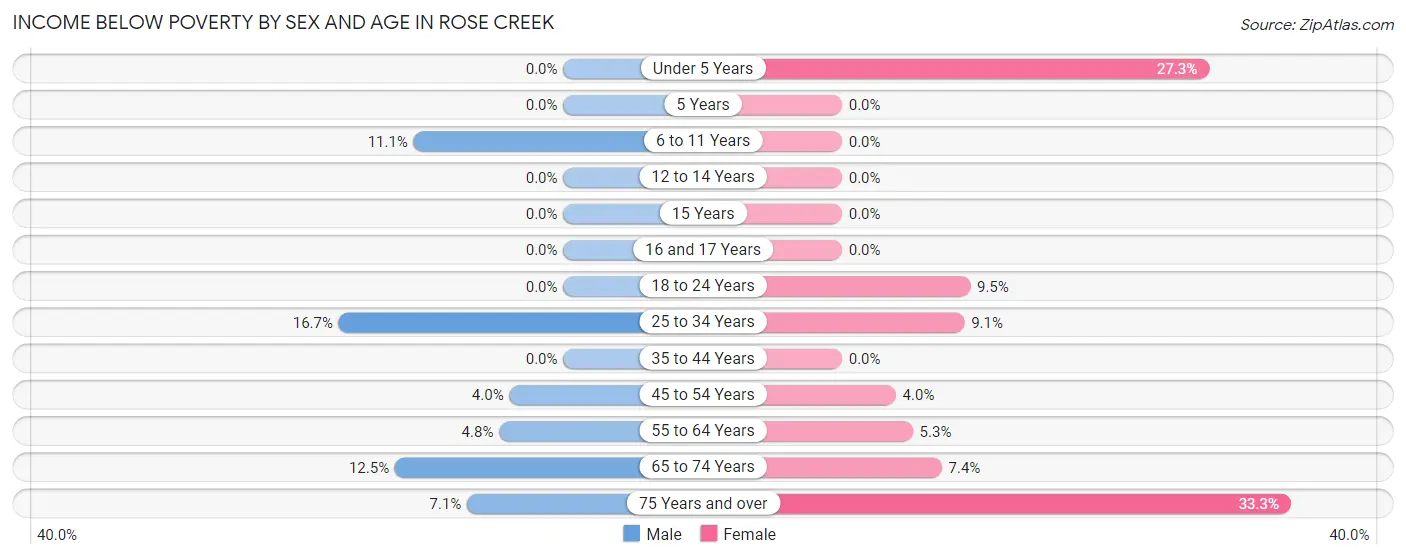
| Age Bracket | Male | Female |
| Under 5 Years | 0 (0.0%) | 3 (27.3%) |
| 5 Years | 0 (0.0%) | 0 (0.0%) |
| 6 to 11 Years | 2 (11.1%) | 0 (0.0%) |
| 12 to 14 Years | 0 (0.0%) | 0 (0.0%) |
| 15 Years | 0 (0.0%) | 0 (0.0%) |
| 16 and 17 Years | 0 (0.0%) | 0 (0.0%) |
| 18 to 24 Years | 0 (0.0%) | 2 (9.5%) |
| 25 to 34 Years | 1 (16.7%) | 1 (9.1%) |
| 35 to 44 Years | 0 (0.0%) | 0 (0.0%) |
| 45 to 54 Years | 1 (4.0%) | 1 (4.0%) |
| 55 to 64 Years | 1 (4.8%) | 1 (5.3%) |
| 65 to 74 Years | 6 (12.5%) | 2 (7.4%) |
| 75 Years and over | 1 (7.1%) | 9 (33.3%) |
| Total | 12 (5.5%) | 19 (7.5%) |
Income Above Poverty by Sex and Age in Rose Creek
According to the poverty statistics in Rose Creek, males aged under 5 years and females aged 5 years are the age groups that are most secure financially, with 100.0% of males and 100.0% of females in these age groups living above the poverty line.
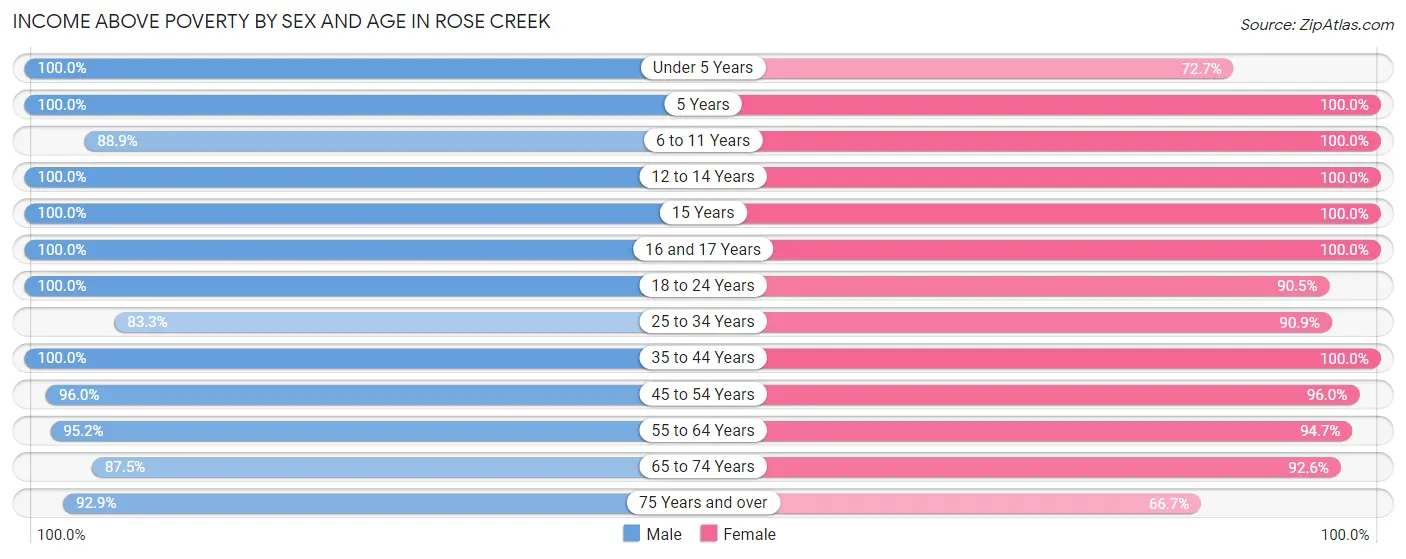
| Age Bracket | Male | Female |
| Under 5 Years | 2 (100.0%) | 8 (72.7%) |
| 5 Years | 5 (100.0%) | 3 (100.0%) |
| 6 to 11 Years | 16 (88.9%) | 30 (100.0%) |
| 12 to 14 Years | 8 (100.0%) | 31 (100.0%) |
| 15 Years | 4 (100.0%) | 10 (100.0%) |
| 16 and 17 Years | 12 (100.0%) | 2 (100.0%) |
| 18 to 24 Years | 14 (100.0%) | 19 (90.5%) |
| 25 to 34 Years | 5 (83.3%) | 10 (90.9%) |
| 35 to 44 Years | 40 (100.0%) | 37 (100.0%) |
| 45 to 54 Years | 24 (96.0%) | 24 (96.0%) |
| 55 to 64 Years | 20 (95.2%) | 18 (94.7%) |
| 65 to 74 Years | 42 (87.5%) | 25 (92.6%) |
| 75 Years and over | 13 (92.9%) | 18 (66.7%) |
| Total | 205 (94.5%) | 235 (92.5%) |
Income Below Poverty Among Married-Couple Families in Rose Creek
The poverty statistics for married-couple families in Rose Creek show that 3.7% or 4 of the total 108 families live below the poverty line. Families with no children have the highest poverty rate of 6.6%, comprising of 4 families. On the other hand, families with 1 or 2 children have the lowest poverty rate of 0.0%, which includes 0 families.
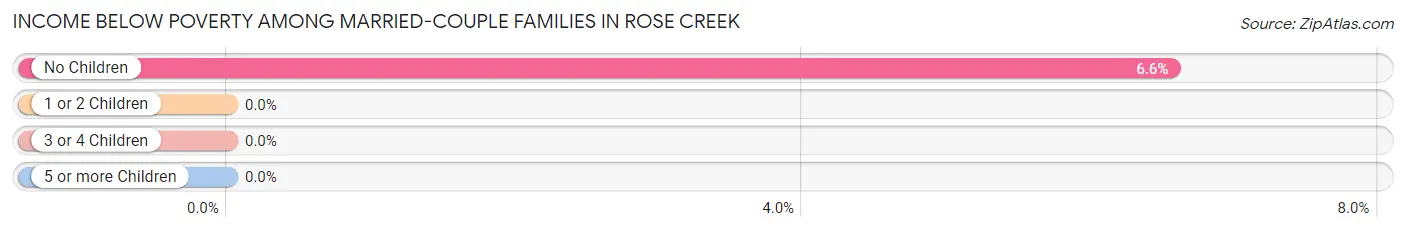
| Children | Above Poverty | Below Poverty |
| No Children | 57 (93.4%) | 4 (6.6%) |
| 1 or 2 Children | 17 (100.0%) | 0 (0.0%) |
| 3 or 4 Children | 27 (100.0%) | 0 (0.0%) |
| 5 or more Children | 3 (100.0%) | 0 (0.0%) |
| Total | 104 (96.3%) | 4 (3.7%) |
Income Below Poverty Among Single-Parent Households in Rose Creek
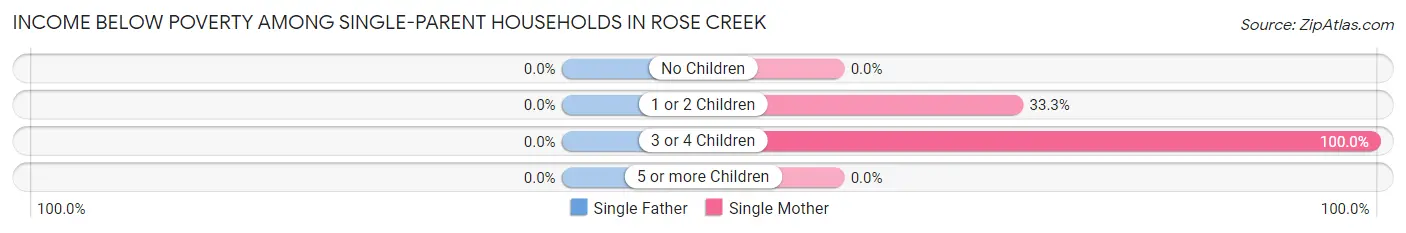
| Children | Single Father | Single Mother |
| No Children | 0 (0.0%) | 0 (0.0%) |
| 1 or 2 Children | 0 (0.0%) | 2 (33.3%) |
| 3 or 4 Children | 0 (0.0%) | 1 (100.0%) |
| 5 or more Children | 0 (0.0%) | 0 (0.0%) |
| Total | 0 (0.0%) | 3 (30.0%) |
Income Below Poverty Among Married-Couple vs Single-Parent Households in Rose Creek
The poverty data for Rose Creek shows that 4 of the married-couple family households (3.7%) and 3 of the single-parent households (23.1%) are living below the poverty level. Within the married-couple family households, those with no children have the highest poverty rate, with 4 households (6.6%) falling below the poverty line. Among the single-parent households, those with 3 or 4 children have the highest poverty rate, with 1 household (100.0%) living below poverty.
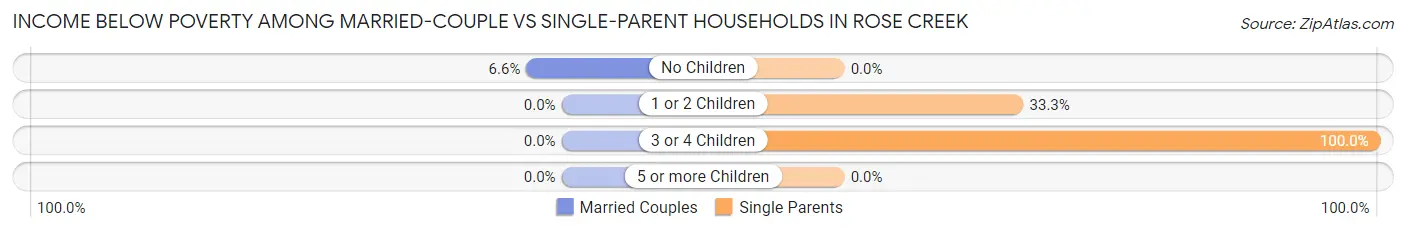
| Children | Married-Couple Families | Single-Parent Households |
| No Children | 4 (6.6%) | 0 (0.0%) |
| 1 or 2 Children | 0 (0.0%) | 2 (33.3%) |
| 3 or 4 Children | 0 (0.0%) | 1 (100.0%) |
| 5 or more Children | 0 (0.0%) | 0 (0.0%) |
| Total | 4 (3.7%) | 3 (23.1%) |
Race in Rose Creek
The most populous races in Rose Creek are White / Caucasian (451 | 95.4%), Two or more Races (18 | 3.8%), and Hispanic or Latino (13 | 2.8%).
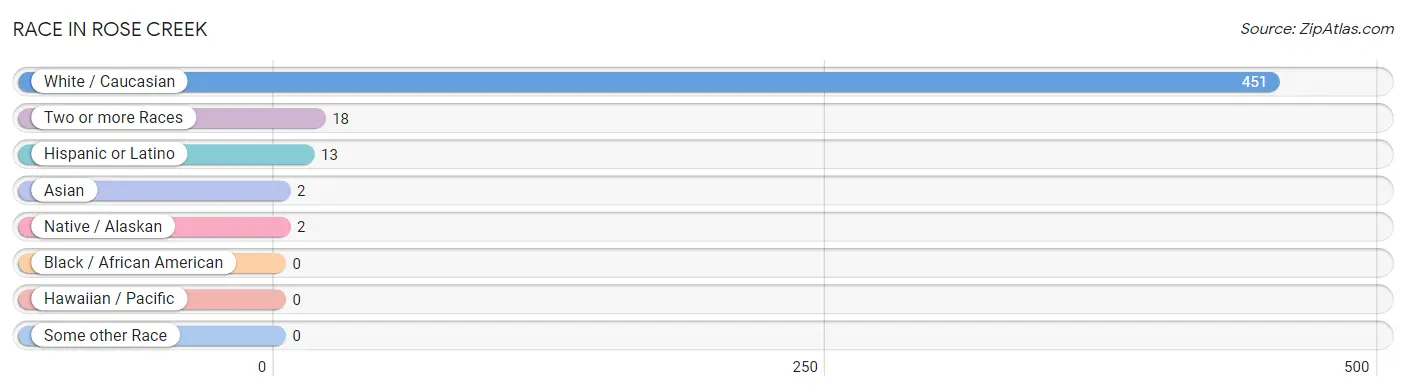
| Race | # Population | % Population |
| Asian | 2 | 0.4% |
| Black / African American | 0 | 0.0% |
| Hawaiian / Pacific | 0 | 0.0% |
| Hispanic or Latino | 13 | 2.8% |
| Native / Alaskan | 2 | 0.4% |
| White / Caucasian | 451 | 95.4% |
| Two or more Races | 18 | 3.8% |
| Some other Race | 0 | 0.0% |
| Total | 473 | 100.0% |
Ancestry in Rose Creek
The most populous ancestries reported in Rose Creek are German (178 | 37.6%), Norwegian (158 | 33.4%), Irish (38 | 8.0%), American (32 | 6.8%), and Scottish (16 | 3.4%), together accounting for 89.2% of all Rose Creek residents.
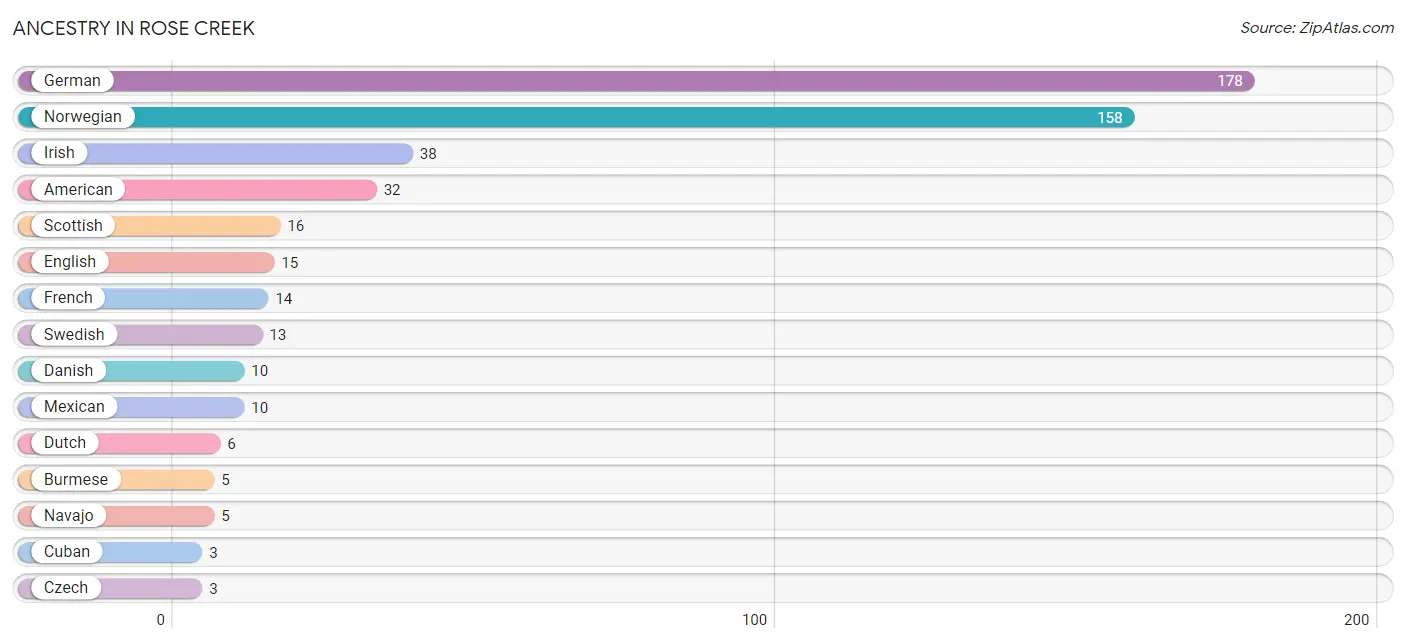
| Ancestry | # Population | % Population |
| American | 32 | 6.8% |
| Australian | 2 | 0.4% |
| Burmese | 5 | 1.1% |
| Cuban | 3 | 0.6% |
| Czech | 3 | 0.6% |
| Danish | 10 | 2.1% |
| Dutch | 6 | 1.3% |
| English | 15 | 3.2% |
| French | 14 | 3.0% |
| French Canadian | 3 | 0.6% |
| German | 178 | 37.6% |
| Irish | 38 | 8.0% |
| Lithuanian | 1 | 0.2% |
| Luxembourger | 1 | 0.2% |
| Mexican | 10 | 2.1% |
| Navajo | 5 | 1.1% |
| Norwegian | 158 | 33.4% |
| Scotch-Irish | 2 | 0.4% |
| Scottish | 16 | 3.4% |
| Swedish | 13 | 2.8% | View All 20 Rows |
Immigrants in Rose Creek
The most numerous immigrant groups reported in Rose Creek came from Central America (10 | 2.1%), Latin America (10 | 2.1%), Mexico (10 | 2.1%), Asia (2 | 0.4%), and Philippines (2 | 0.4%), together accounting for 7.2% of all Rose Creek residents.
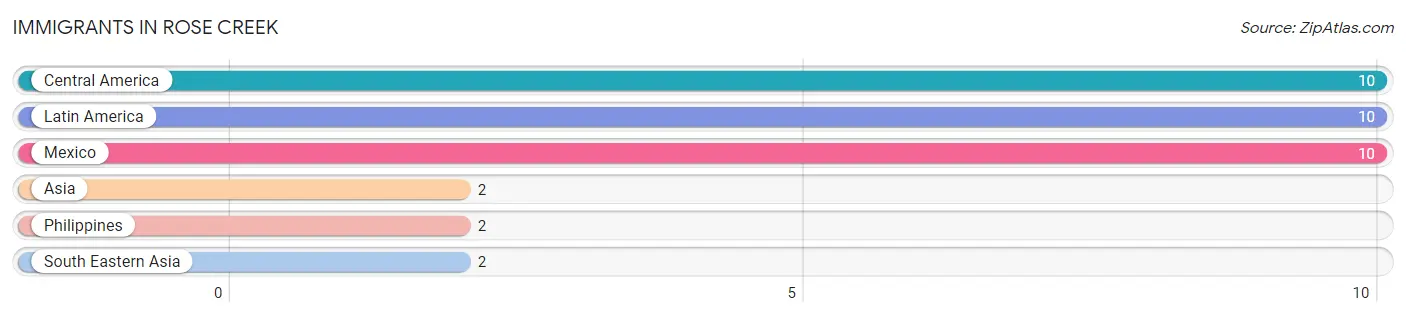
| Immigration Origin | # Population | % Population |
| Asia | 2 | 0.4% |
| Central America | 10 | 2.1% |
| Latin America | 10 | 2.1% |
| Mexico | 10 | 2.1% |
| Philippines | 2 | 0.4% |
| South Eastern Asia | 2 | 0.4% | View All 6 Rows |
Sex and Age in Rose Creek
Sex and Age in Rose Creek
The most populous age groups in Rose Creek are 35 to 39 Years (34 | 15.5%) for men and 10 to 14 Years (34 | 13.4%) for women.
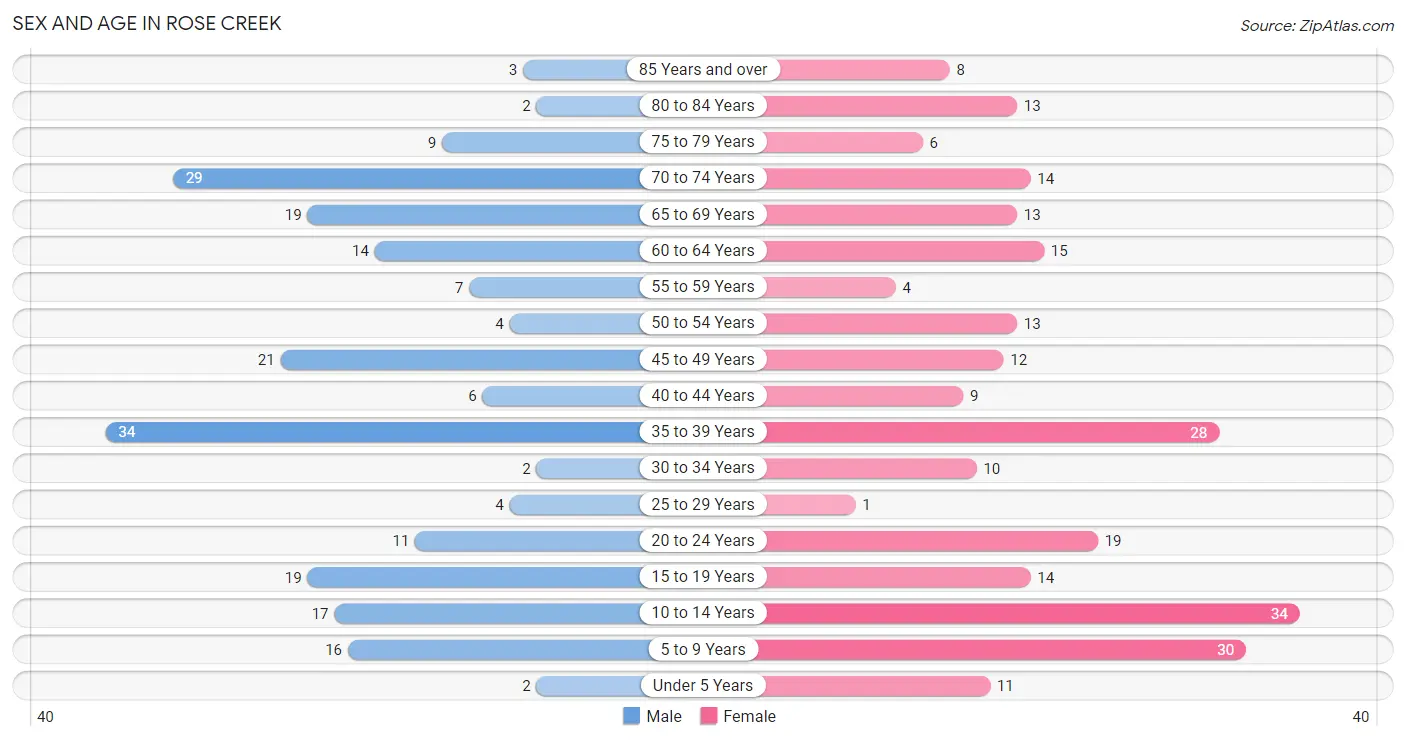
| Age Bracket | Male | Female |
| Under 5 Years | 2 (0.9%) | 11 (4.3%) |
| 5 to 9 Years | 16 (7.3%) | 30 (11.8%) |
| 10 to 14 Years | 17 (7.8%) | 34 (13.4%) |
| 15 to 19 Years | 19 (8.7%) | 14 (5.5%) |
| 20 to 24 Years | 11 (5.0%) | 19 (7.5%) |
| 25 to 29 Years | 4 (1.8%) | 1 (0.4%) |
| 30 to 34 Years | 2 (0.9%) | 10 (3.9%) |
| 35 to 39 Years | 34 (15.5%) | 28 (11.0%) |
| 40 to 44 Years | 6 (2.7%) | 9 (3.5%) |
| 45 to 49 Years | 21 (9.6%) | 12 (4.7%) |
| 50 to 54 Years | 4 (1.8%) | 13 (5.1%) |
| 55 to 59 Years | 7 (3.2%) | 4 (1.6%) |
| 60 to 64 Years | 14 (6.4%) | 15 (5.9%) |
| 65 to 69 Years | 19 (8.7%) | 13 (5.1%) |
| 70 to 74 Years | 29 (13.2%) | 14 (5.5%) |
| 75 to 79 Years | 9 (4.1%) | 6 (2.4%) |
| 80 to 84 Years | 2 (0.9%) | 13 (5.1%) |
| 85 Years and over | 3 (1.4%) | 8 (3.2%) |
| Total | 219 (100.0%) | 254 (100.0%) |
Families and Households in Rose Creek
Median Family Size in Rose Creek
The median family size in Rose Creek is 3.31 persons per family, with married-couple families (108 | 89.3%) accounting for the largest median family size of 3.37 persons per family. On the other hand, single female/mother families (10 | 8.3%) represent the smallest median family size with 2.60 persons per family.
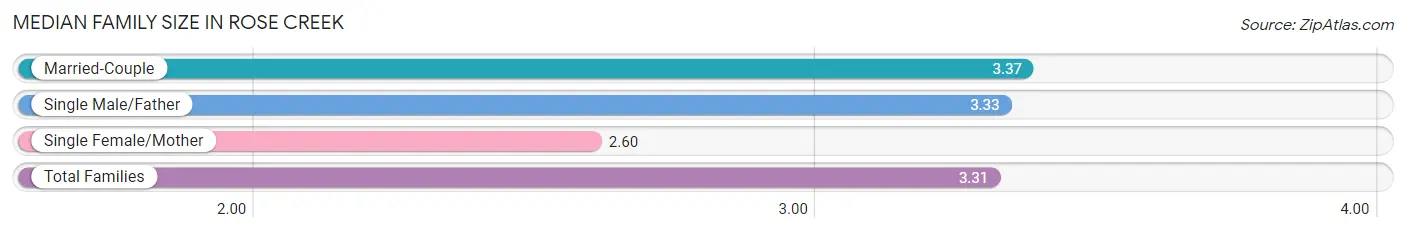
| Family Type | # Families | Family Size |
| Married-Couple | 108 (89.3%) | 3.37 |
| Single Male/Father | 3 (2.5%) | 3.33 |
| Single Female/Mother | 10 (8.3%) | 2.60 |
| Total Families | 121 (100.0%) | 3.31 |
Median Household Size in Rose Creek
The median household size in Rose Creek is 2.61 persons per household, with married-couple households (108 | 59.7%) accounting for the largest median household size of 3.41 persons per household. non-family households (60 | 33.2%) represent the smallest median household size with 1.03 persons per household.
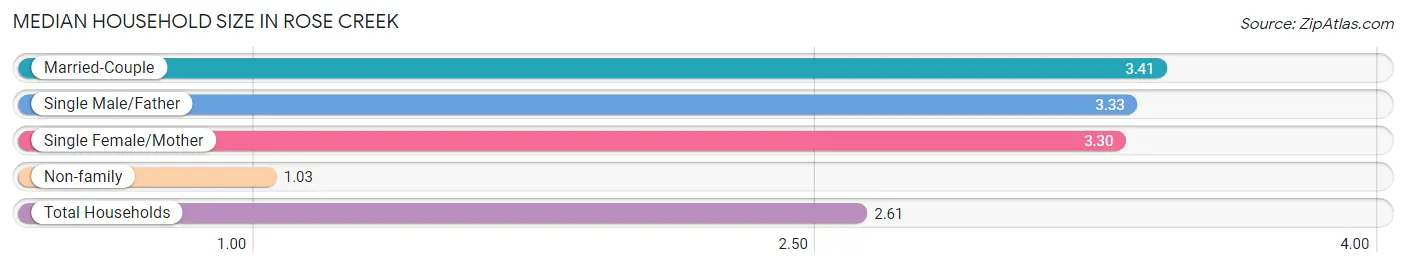
| Household Type | # Households | Household Size |
| Married-Couple | 108 (59.7%) | 3.41 |
| Single Male/Father | 3 (1.7%) | 3.33 |
| Single Female/Mother | 10 (5.5%) | 3.30 |
| Non-family | 60 (33.2%) | 1.03 |
| Total Households | 181 (100.0%) | 2.61 |
Household Size by Marriage Status in Rose Creek
Out of a total of 181 households in Rose Creek, 121 (66.8%) are family households, while 60 (33.2%) are nonfamily households. The most numerous type of family households are 2-person households, comprising 64, and the most common type of nonfamily households are 1-person households, comprising 58.
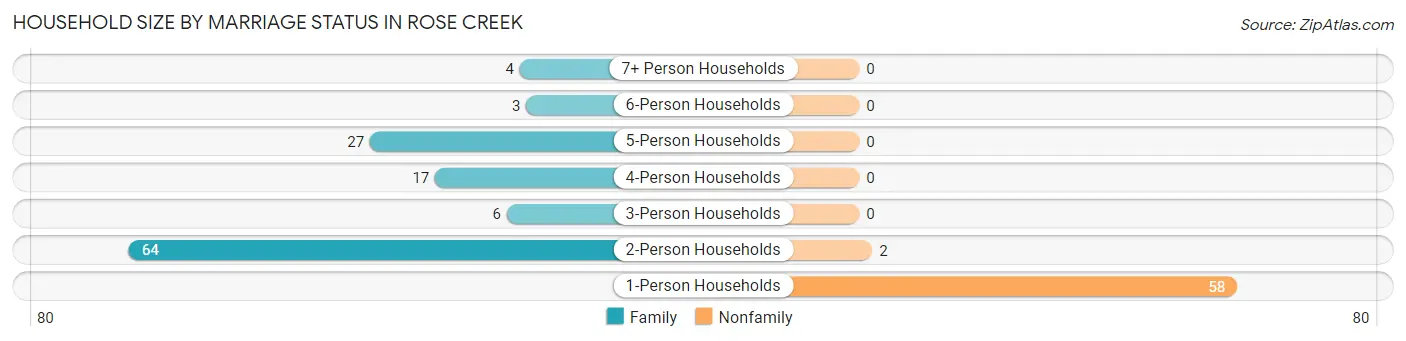
| Household Size | Family Households | Nonfamily Households |
| 1-Person Households | - | 58 (32.0%) |
| 2-Person Households | 64 (35.4%) | 2 (1.1%) |
| 3-Person Households | 6 (3.3%) | 0 (0.0%) |
| 4-Person Households | 17 (9.4%) | 0 (0.0%) |
| 5-Person Households | 27 (14.9%) | 0 (0.0%) |
| 6-Person Households | 3 (1.7%) | 0 (0.0%) |
| 7+ Person Households | 4 (2.2%) | 0 (0.0%) |
| Total | 121 (66.8%) | 60 (33.2%) |
Female Fertility in Rose Creek
Fertility by Age in Rose Creek
Average fertility rate in Rose Creek is 53.0 births per 1,000 women. Women in the age bracket of 20 to 34 years have the highest fertility rate with 167.0 births per 1,000 women. Women in the age bracket of 20 to 34 years acount for 100.0% of all women with births.
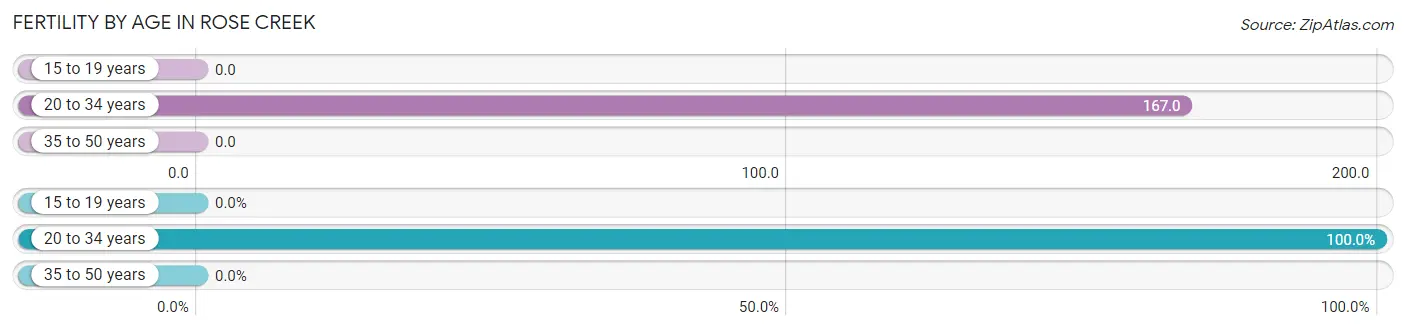
| Age Bracket | Women with Births | Births / 1,000 Women |
| 15 to 19 years | 0 (0.0%) | 0.0 |
| 20 to 34 years | 5 (100.0%) | 167.0 |
| 35 to 50 years | 0 (0.0%) | 0.0 |
| Total | 5 (100.0%) | 53.0 |
Fertility by Age by Marriage Status in Rose Creek
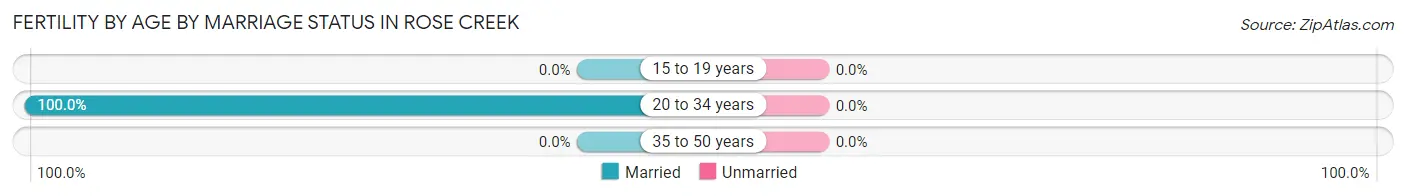
| Age Bracket | Married | Unmarried |
| 15 to 19 years | 0 (0.0%) | 0 (0.0%) |
| 20 to 34 years | 5 (100.0%) | 0 (0.0%) |
| 35 to 50 years | 0 (0.0%) | 0 (0.0%) |
| Total | 5 (100.0%) | 0 (0.0%) |
Fertility by Education in Rose Creek
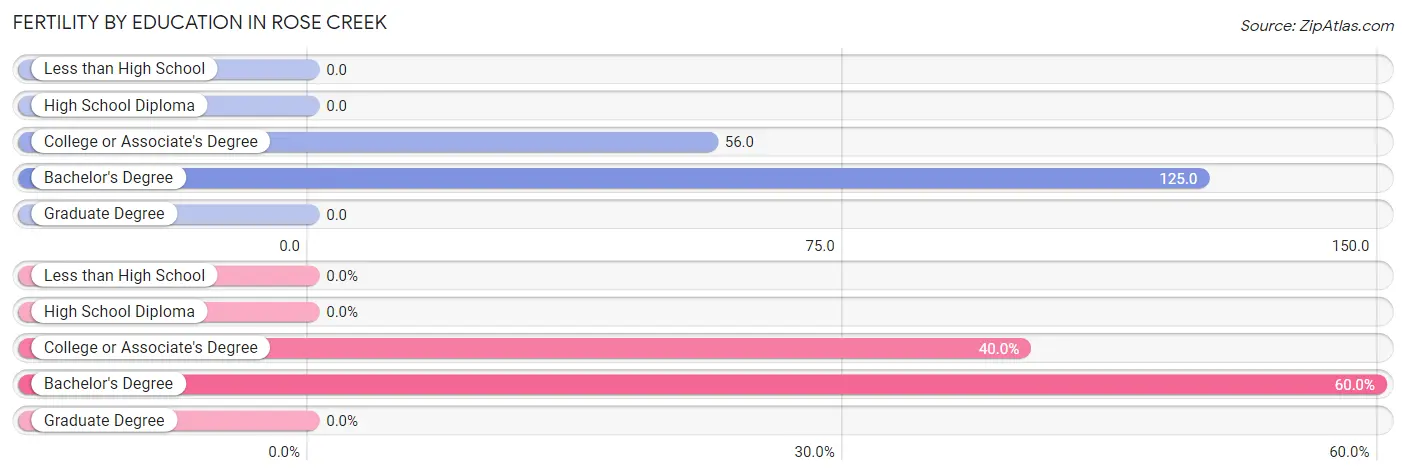
| Educational Attainment | Women with Births | Births / 1,000 Women |
| Less than High School | 0 (0.0%) | 0.0 |
| High School Diploma | 0 (0.0%) | 0.0 |
| College or Associate's Degree | 2 (40.0%) | 56.0 |
| Bachelor's Degree | 3 (60.0%) | 125.0 |
| Graduate Degree | 0 (0.0%) | 0.0 |
| Total | 5 (100.0%) | 53.0 |
Fertility by Education by Marriage Status in Rose Creek
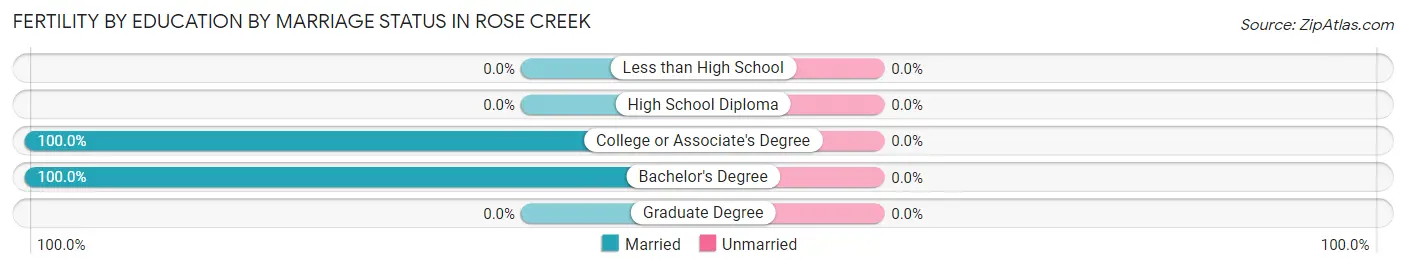
| Educational Attainment | Married | Unmarried |
| Less than High School | 0 (0.0%) | 0 (0.0%) |
| High School Diploma | 0 (0.0%) | 0 (0.0%) |
| College or Associate's Degree | 2 (100.0%) | 0 (0.0%) |
| Bachelor's Degree | 3 (100.0%) | 0 (0.0%) |
| Graduate Degree | 0 (0.0%) | 0 (0.0%) |
| Total | 5 (100.0%) | 0 (0.0%) |
Employment Characteristics in Rose Creek
Employment by Class of Employer in Rose Creek
Among the 221 employed individuals in Rose Creek, private company employees (145 | 65.6%), not-for-profit organizations (43 | 19.5%), and local government employees (19 | 8.6%) make up the most common classes of employment.
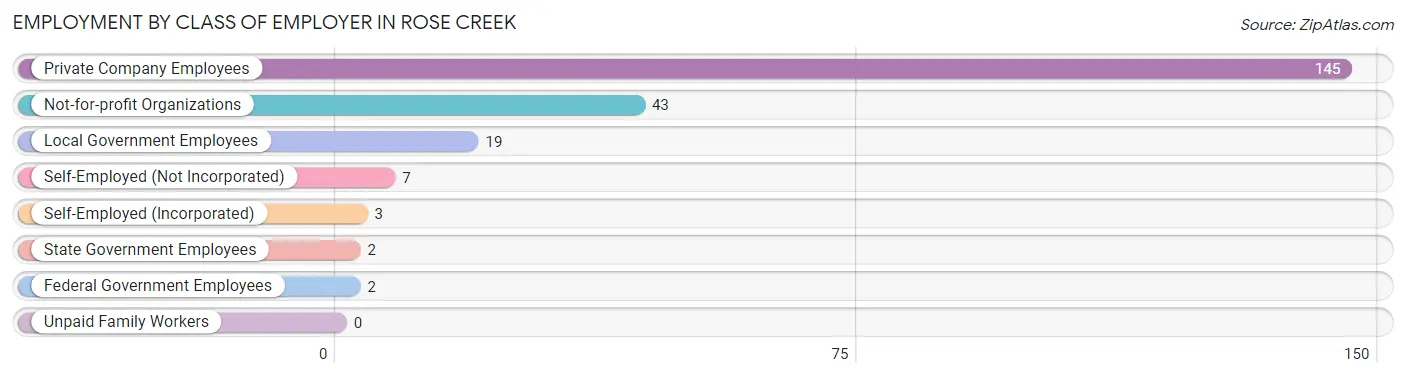
| Employer Class | # Employees | % Employees |
| Private Company Employees | 145 | 65.6% |
| Self-Employed (Incorporated) | 3 | 1.4% |
| Self-Employed (Not Incorporated) | 7 | 3.2% |
| Not-for-profit Organizations | 43 | 19.5% |
| Local Government Employees | 19 | 8.6% |
| State Government Employees | 2 | 0.9% |
| Federal Government Employees | 2 | 0.9% |
| Unpaid Family Workers | 0 | 0.0% |
| Total | 221 | 100.0% |
Employment Status by Age in Rose Creek
According to the labor force statistics for Rose Creek, out of the total population over 16 years of age (349), 65.0% or 227 individuals are in the labor force, with 0.9% or 2 of them unemployed. The age group with the highest labor force participation rate is 20 to 24 years, with 100.0% or 30 individuals in the labor force. Within the labor force, the 20 to 24 years age range has the highest percentage of unemployed individuals, with 6.7% or 2 of them being unemployed.
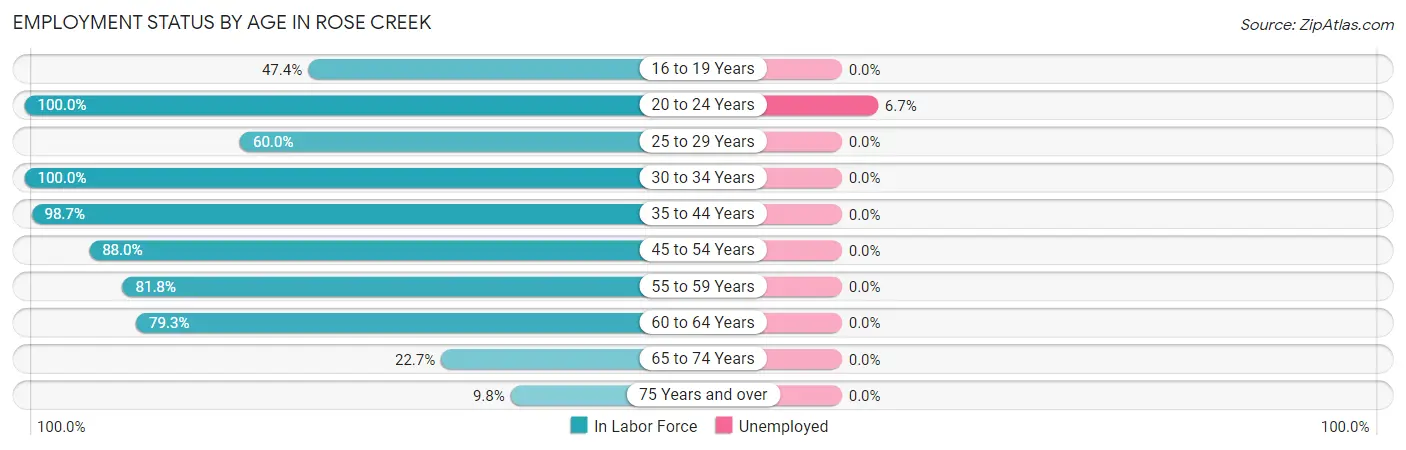
| Age Bracket | In Labor Force | Unemployed |
| 16 to 19 Years | 9 (47.4%) | 0 (0.0%) |
| 20 to 24 Years | 30 (100.0%) | 2 (6.7%) |
| 25 to 29 Years | 3 (60.0%) | 0 (0.0%) |
| 30 to 34 Years | 12 (100.0%) | 0 (0.0%) |
| 35 to 44 Years | 76 (98.7%) | 0 (0.0%) |
| 45 to 54 Years | 44 (88.0%) | 0 (0.0%) |
| 55 to 59 Years | 9 (81.8%) | 0 (0.0%) |
| 60 to 64 Years | 23 (79.3%) | 0 (0.0%) |
| 65 to 74 Years | 17 (22.7%) | 0 (0.0%) |
| 75 Years and over | 4 (9.8%) | 0 (0.0%) |
| Total | 227 (65.0%) | 2 (0.9%) |
Employment Status by Educational Attainment in Rose Creek
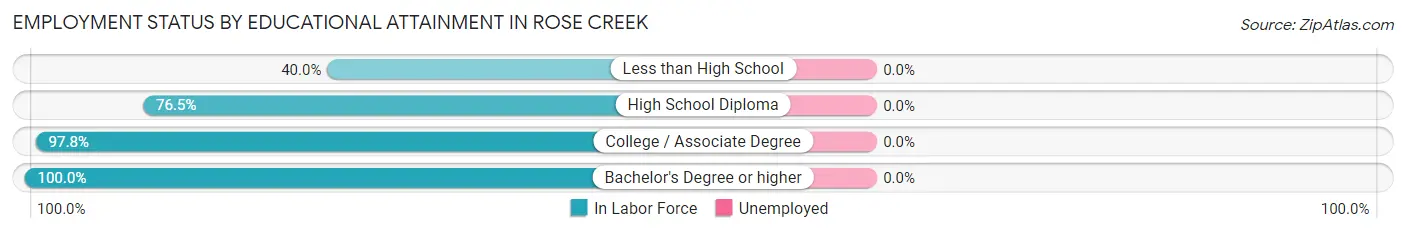
| Educational Attainment | In Labor Force | Unemployed |
| Less than High School | 2 (40.0%) | 0 (0.0%) |
| High School Diploma | 39 (76.5%) | 0 (0.0%) |
| College / Associate Degree | 88 (97.8%) | 0 (0.0%) |
| Bachelor's Degree or higher | 38 (100.0%) | 0 (0.0%) |
| Total | 167 (90.8%) | 0 (0.0%) |
Employment Occupations by Sex in Rose Creek
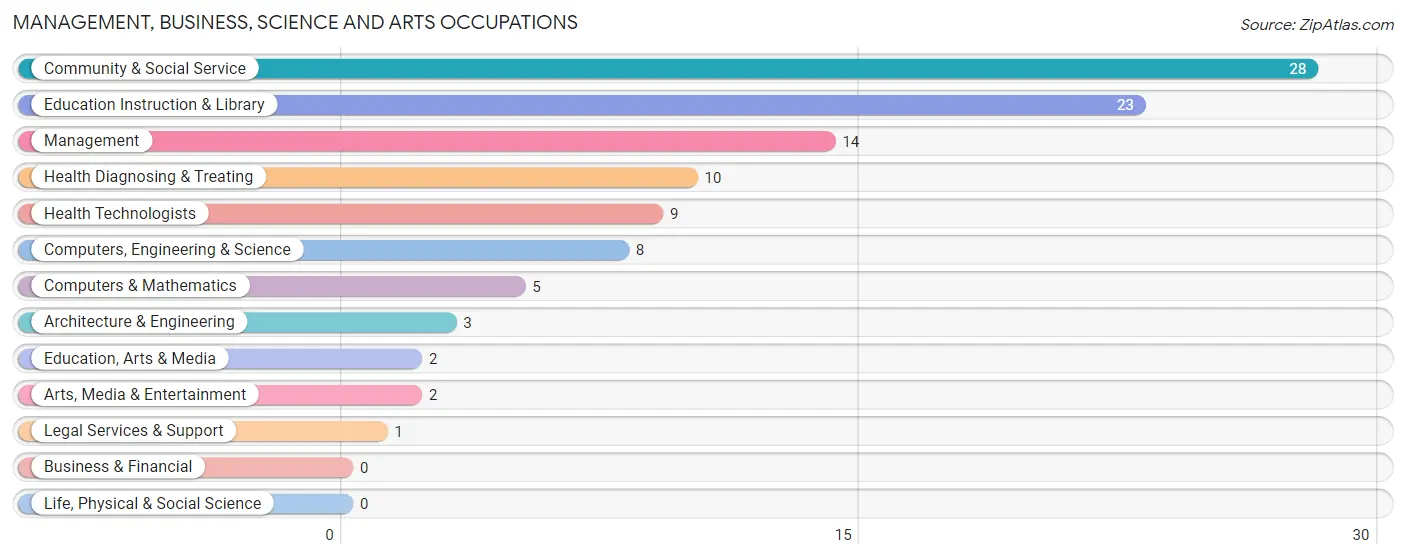
Management, Business, Science and Arts Occupations
The most common Management, Business, Science and Arts occupations in Rose Creek are Community & Social Service (28 | 12.4%), Education Instruction & Library (23 | 10.2%), Management (14 | 6.2%), Health Diagnosing & Treating (10 | 4.4%), and Health Technologists (9 | 4.0%).
Management, Business, Science and Arts Occupations by Sex
Within the Management, Business, Science and Arts occupations in Rose Creek, the most male-oriented occupations are Architecture & Engineering (100.0%), Management (92.9%), and Computers, Engineering & Science (50.0%), while the most female-oriented occupations are Education, Arts & Media (100.0%), Legal Services & Support (100.0%), and Arts, Media & Entertainment (100.0%).
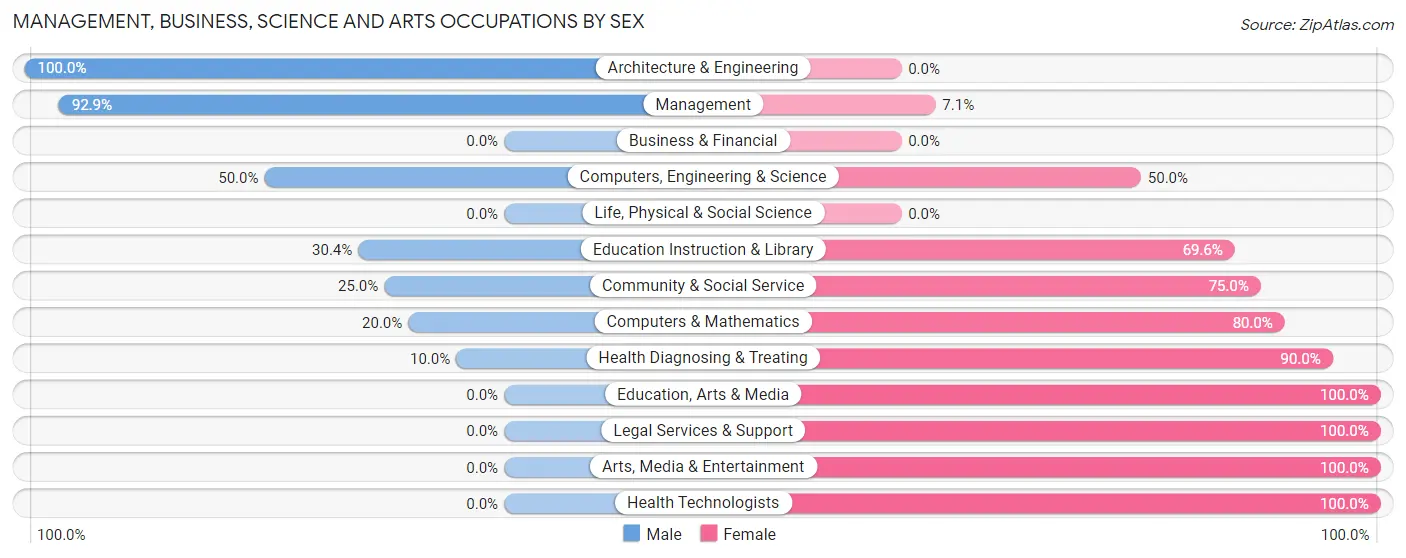
| Occupation | Male | Female |
| Management | 13 (92.9%) | 1 (7.1%) |
| Business & Financial | 0 (0.0%) | 0 (0.0%) |
| Computers, Engineering & Science | 4 (50.0%) | 4 (50.0%) |
| Computers & Mathematics | 1 (20.0%) | 4 (80.0%) |
| Architecture & Engineering | 3 (100.0%) | 0 (0.0%) |
| Life, Physical & Social Science | 0 (0.0%) | 0 (0.0%) |
| Community & Social Service | 7 (25.0%) | 21 (75.0%) |
| Education, Arts & Media | 0 (0.0%) | 2 (100.0%) |
| Legal Services & Support | 0 (0.0%) | 1 (100.0%) |
| Education Instruction & Library | 7 (30.4%) | 16 (69.6%) |
| Arts, Media & Entertainment | 0 (0.0%) | 2 (100.0%) |
| Health Diagnosing & Treating | 1 (10.0%) | 9 (90.0%) |
| Health Technologists | 0 (0.0%) | 9 (100.0%) |
| Total (Category) | 25 (41.7%) | 35 (58.3%) |
| Total (Overall) | 112 (49.8%) | 113 (50.2%) |
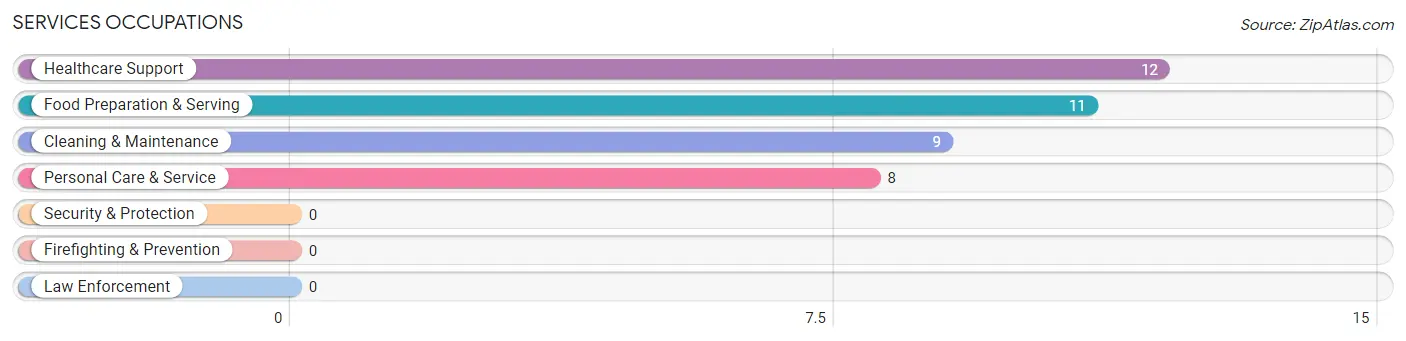
Services Occupations
The most common Services occupations in Rose Creek are Healthcare Support (12 | 5.3%), Food Preparation & Serving (11 | 4.9%), Cleaning & Maintenance (9 | 4.0%), and Personal Care & Service (8 | 3.6%).
Services Occupations by Sex
Within the Services occupations in Rose Creek, the most male-oriented occupations are Cleaning & Maintenance (100.0%), and Personal Care & Service (50.0%), while the most female-oriented occupations are Healthcare Support (100.0%), Food Preparation & Serving (100.0%), and Personal Care & Service (50.0%).
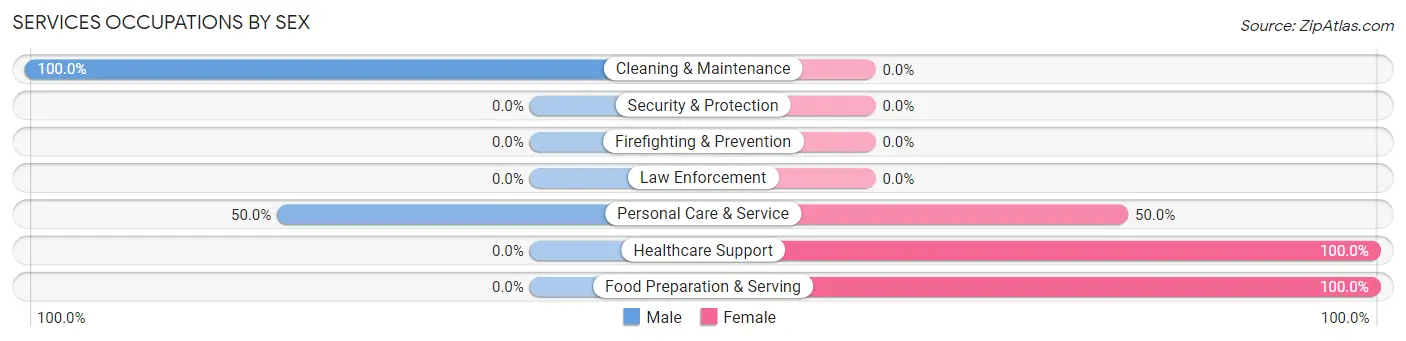
| Occupation | Male | Female |
| Healthcare Support | 0 (0.0%) | 12 (100.0%) |
| Security & Protection | 0 (0.0%) | 0 (0.0%) |
| Firefighting & Prevention | 0 (0.0%) | 0 (0.0%) |
| Law Enforcement | 0 (0.0%) | 0 (0.0%) |
| Food Preparation & Serving | 0 (0.0%) | 11 (100.0%) |
| Cleaning & Maintenance | 9 (100.0%) | 0 (0.0%) |
| Personal Care & Service | 4 (50.0%) | 4 (50.0%) |
| Total (Category) | 13 (32.5%) | 27 (67.5%) |
| Total (Overall) | 112 (49.8%) | 113 (50.2%) |
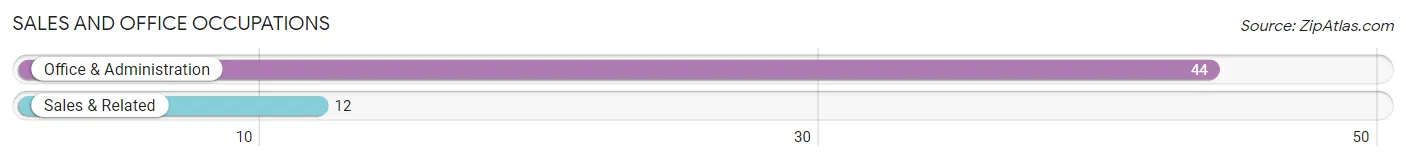
Sales and Office Occupations
The most common Sales and Office occupations in Rose Creek are Office & Administration (44 | 19.6%), and Sales & Related (12 | 5.3%).
Sales and Office Occupations by Sex

| Occupation | Male | Female |
| Sales & Related | 9 (75.0%) | 3 (25.0%) |
| Office & Administration | 2 (4.5%) | 42 (95.5%) |
| Total (Category) | 11 (19.6%) | 45 (80.4%) |
| Total (Overall) | 112 (49.8%) | 113 (50.2%) |
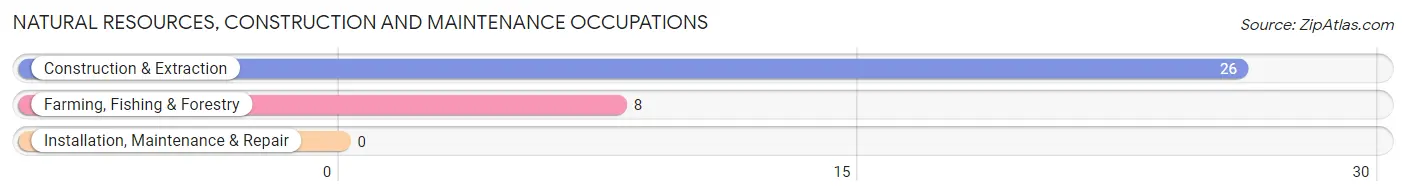
Natural Resources, Construction and Maintenance Occupations
The most common Natural Resources, Construction and Maintenance occupations in Rose Creek are Construction & Extraction (26 | 11.6%), and Farming, Fishing & Forestry (8 | 3.6%).
Natural Resources, Construction and Maintenance Occupations by Sex
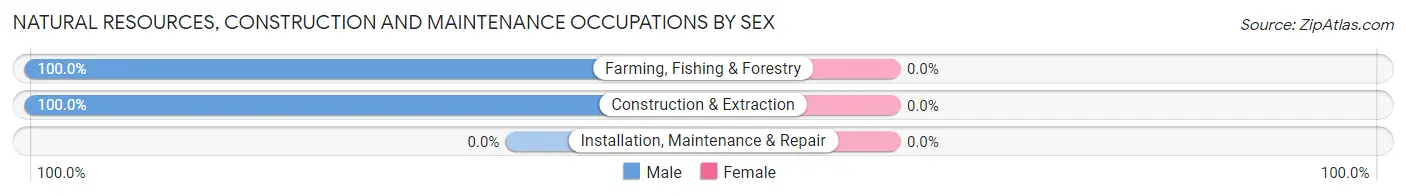
| Occupation | Male | Female |
| Farming, Fishing & Forestry | 8 (100.0%) | 0 (0.0%) |
| Construction & Extraction | 26 (100.0%) | 0 (0.0%) |
| Installation, Maintenance & Repair | 0 (0.0%) | 0 (0.0%) |
| Total (Category) | 34 (100.0%) | 0 (0.0%) |
| Total (Overall) | 112 (49.8%) | 113 (50.2%) |
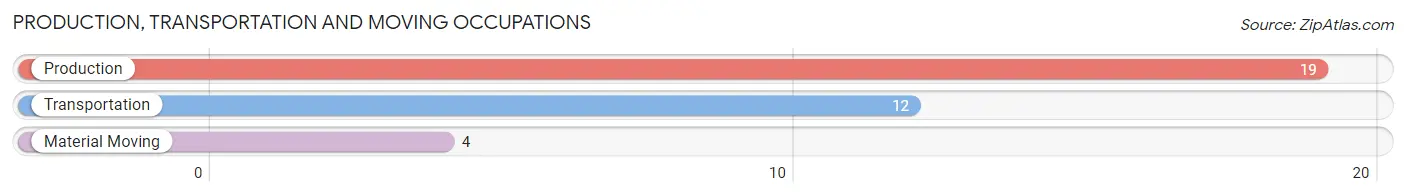
Production, Transportation and Moving Occupations
The most common Production, Transportation and Moving occupations in Rose Creek are Production (19 | 8.4%), Transportation (12 | 5.3%), and Material Moving (4 | 1.8%).
Production, Transportation and Moving Occupations by Sex
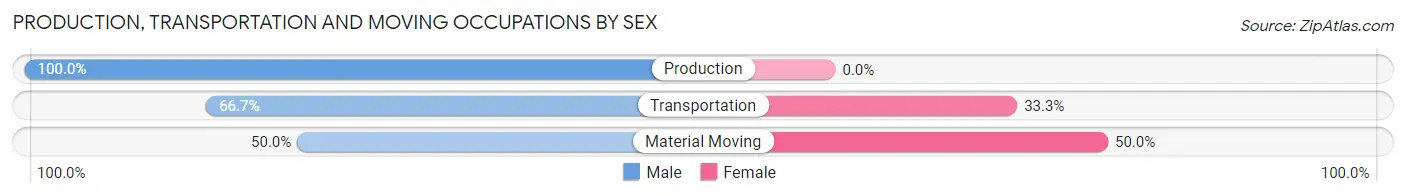
| Occupation | Male | Female |
| Production | 19 (100.0%) | 0 (0.0%) |
| Transportation | 8 (66.7%) | 4 (33.3%) |
| Material Moving | 2 (50.0%) | 2 (50.0%) |
| Total (Category) | 29 (82.9%) | 6 (17.1%) |
| Total (Overall) | 112 (49.8%) | 113 (50.2%) |
Employment Industries by Sex in Rose Creek
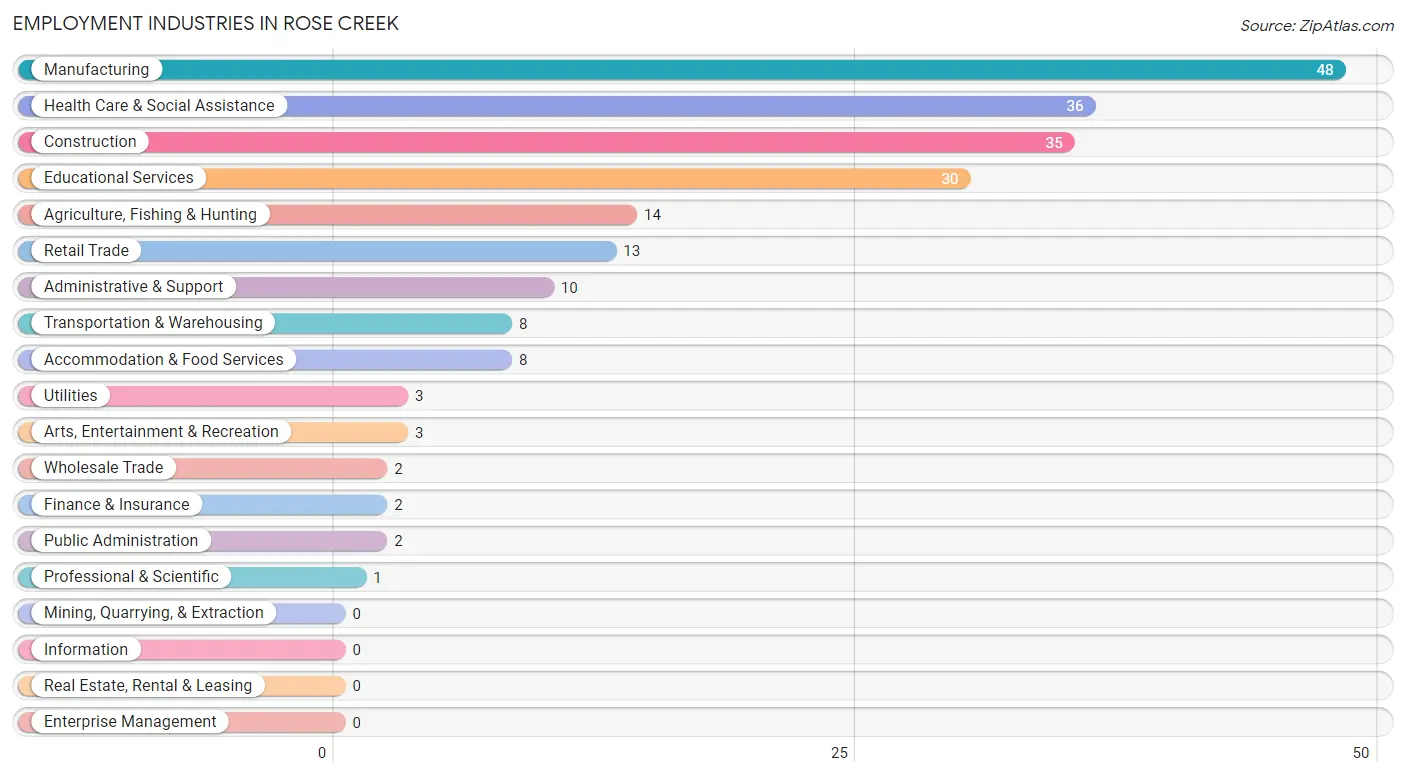
Employment Industries in Rose Creek
The major employment industries in Rose Creek include Manufacturing (48 | 21.3%), Health Care & Social Assistance (36 | 16.0%), Construction (35 | 15.6%), Educational Services (30 | 13.3%), and Agriculture, Fishing & Hunting (14 | 6.2%).
Employment Industries by Sex in Rose Creek
The Rose Creek industries that see more men than women are Wholesale Trade (100.0%), Utilities (100.0%), and Arts, Entertainment & Recreation (100.0%), whereas the industries that tend to have a higher number of women are Finance & Insurance (100.0%), Professional & Scientific (100.0%), and Accommodation & Food Services (100.0%).
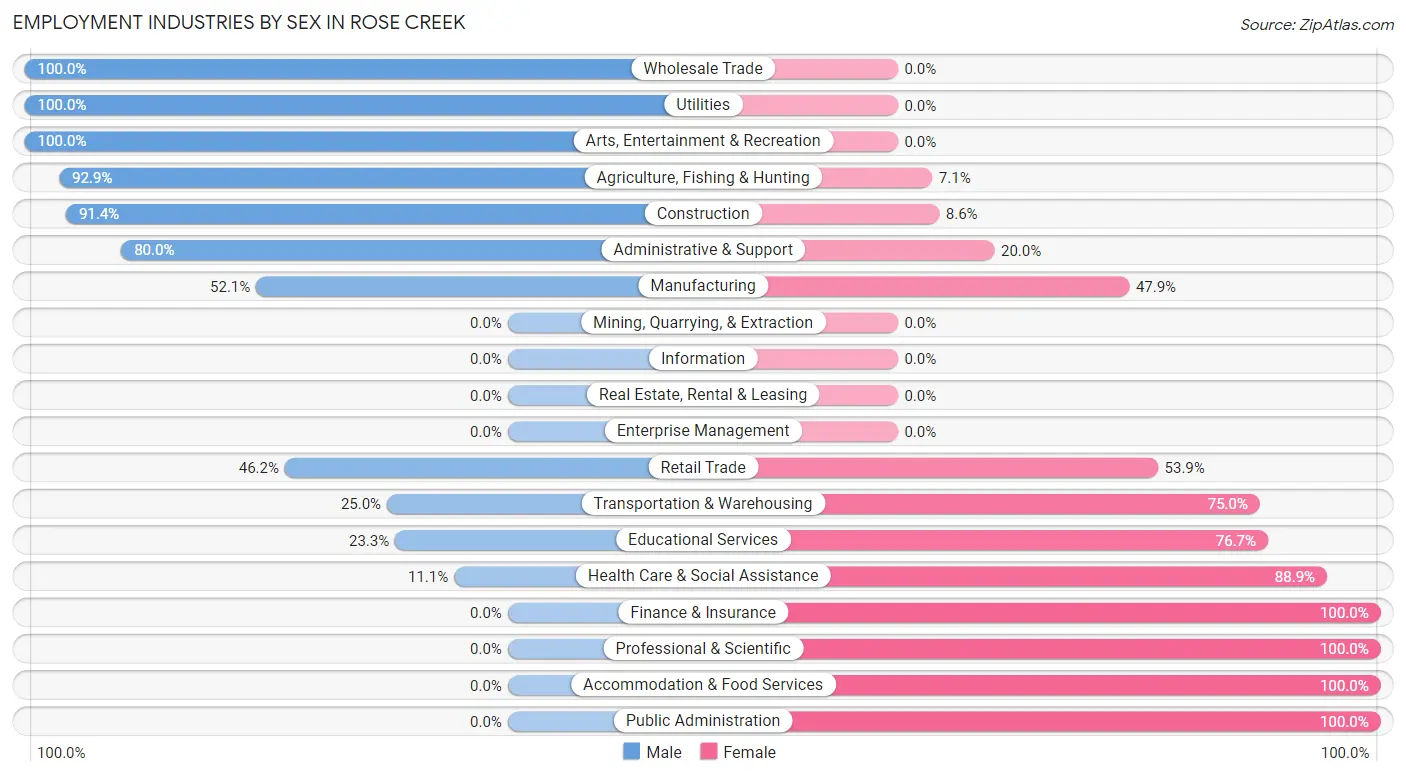
| Industry | Male | Female |
| Agriculture, Fishing & Hunting | 13 (92.9%) | 1 (7.1%) |
| Mining, Quarrying, & Extraction | 0 (0.0%) | 0 (0.0%) |
| Construction | 32 (91.4%) | 3 (8.6%) |
| Manufacturing | 25 (52.1%) | 23 (47.9%) |
| Wholesale Trade | 2 (100.0%) | 0 (0.0%) |
| Retail Trade | 6 (46.2%) | 7 (53.8%) |
| Transportation & Warehousing | 2 (25.0%) | 6 (75.0%) |
| Utilities | 3 (100.0%) | 0 (0.0%) |
| Information | 0 (0.0%) | 0 (0.0%) |
| Finance & Insurance | 0 (0.0%) | 2 (100.0%) |
| Real Estate, Rental & Leasing | 0 (0.0%) | 0 (0.0%) |
| Professional & Scientific | 0 (0.0%) | 1 (100.0%) |
| Enterprise Management | 0 (0.0%) | 0 (0.0%) |
| Administrative & Support | 8 (80.0%) | 2 (20.0%) |
| Educational Services | 7 (23.3%) | 23 (76.7%) |
| Health Care & Social Assistance | 4 (11.1%) | 32 (88.9%) |
| Arts, Entertainment & Recreation | 3 (100.0%) | 0 (0.0%) |
| Accommodation & Food Services | 0 (0.0%) | 8 (100.0%) |
| Public Administration | 0 (0.0%) | 2 (100.0%) |
| Total | 112 (49.8%) | 113 (50.2%) |
Education in Rose Creek
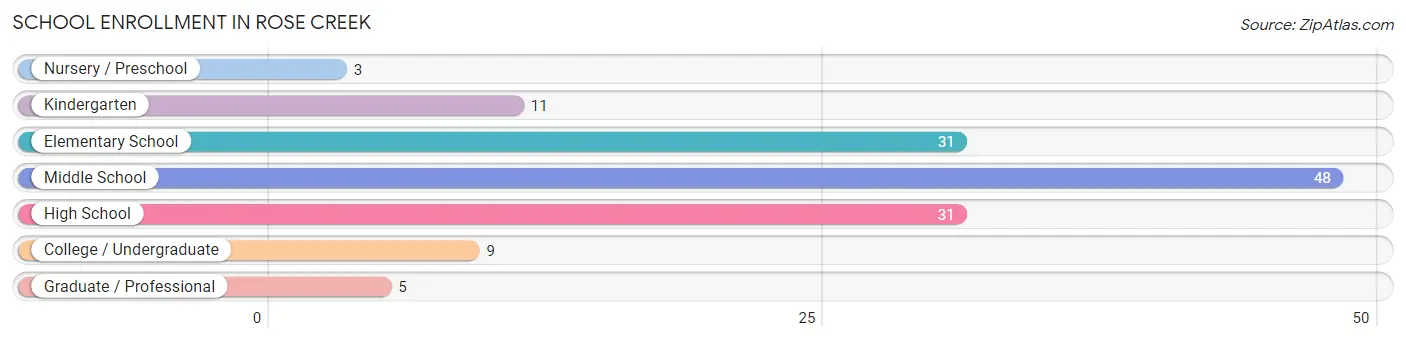
School Enrollment in Rose Creek
The most common levels of schooling among the 138 students in Rose Creek are middle school (48 | 34.8%), elementary school (31 | 22.5%), and high school (31 | 22.5%).
| School Level | # Students | % Students |
| Nursery / Preschool | 3 | 2.2% |
| Kindergarten | 11 | 8.0% |
| Elementary School | 31 | 22.5% |
| Middle School | 48 | 34.8% |
| High School | 31 | 22.5% |
| College / Undergraduate | 9 | 6.5% |
| Graduate / Professional | 5 | 3.6% |
| Total | 138 | 100.0% |
School Enrollment by Age by Funding Source in Rose Creek
Out of a total of 138 students who are enrolled in schools in Rose Creek, 39 (28.3%) attend a private institution, while the remaining 99 (71.7%) are enrolled in public schools. The age group of 5 to 9 year old has the highest likelihood of being enrolled in private schools, with 22 (51.2% in the age bracket) enrolled. Conversely, the age group of 3 to 4 year olds has the lowest likelihood of being enrolled in a private school, with 1 (100.0% in the age bracket) attending a public institution.
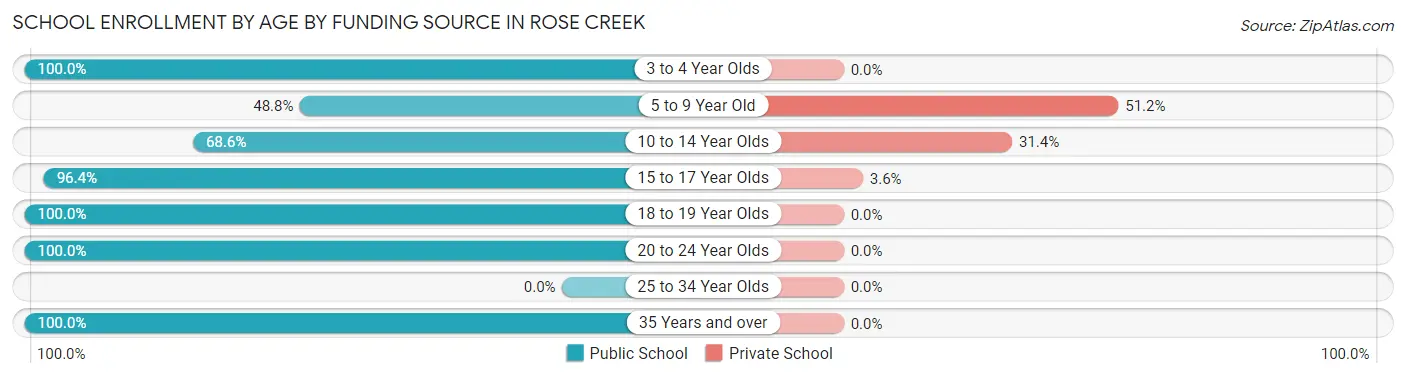
| Age Bracket | Public School | Private School |
| 3 to 4 Year Olds | 1 (100.0%) | 0 (0.0%) |
| 5 to 9 Year Old | 21 (48.8%) | 22 (51.2%) |
| 10 to 14 Year Olds | 35 (68.6%) | 16 (31.4%) |
| 15 to 17 Year Olds | 27 (96.4%) | 1 (3.6%) |
| 18 to 19 Year Olds | 1 (100.0%) | 0 (0.0%) |
| 20 to 24 Year Olds | 11 (100.0%) | 0 (0.0%) |
| 25 to 34 Year Olds | 0 (0.0%) | 0 (0.0%) |
| 35 Years and over | 3 (100.0%) | 0 (0.0%) |
| Total | 99 (71.7%) | 39 (28.3%) |
Educational Attainment by Field of Study in Rose Creek
Education (32 | 50.8%), business (8 | 12.7%), bio, nature & agricultural (5 | 7.9%), physical & health sciences (3 | 4.8%), and engineering (3 | 4.8%) are the most common fields of study among 63 individuals in Rose Creek who have obtained a bachelor's degree or higher.
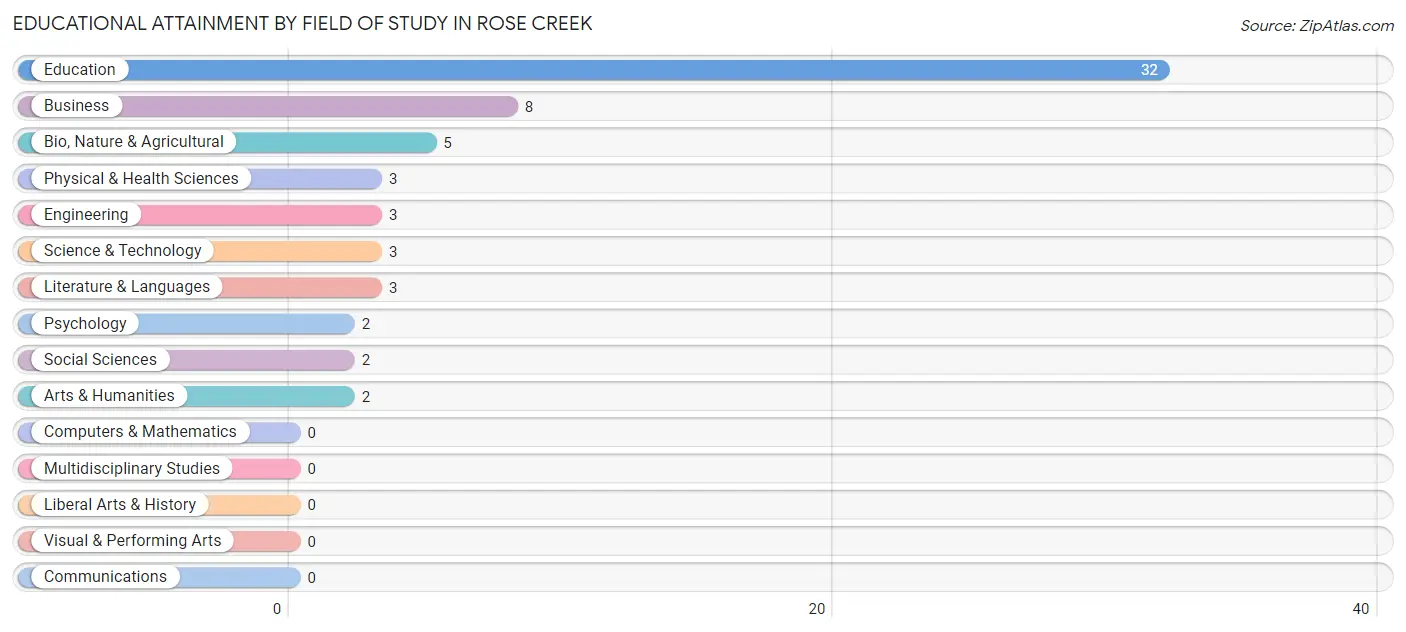
| Field of Study | # Graduates | % Graduates |
| Computers & Mathematics | 0 | 0.0% |
| Bio, Nature & Agricultural | 5 | 7.9% |
| Physical & Health Sciences | 3 | 4.8% |
| Psychology | 2 | 3.2% |
| Social Sciences | 2 | 3.2% |
| Engineering | 3 | 4.8% |
| Multidisciplinary Studies | 0 | 0.0% |
| Science & Technology | 3 | 4.8% |
| Business | 8 | 12.7% |
| Education | 32 | 50.8% |
| Literature & Languages | 3 | 4.8% |
| Liberal Arts & History | 0 | 0.0% |
| Visual & Performing Arts | 0 | 0.0% |
| Communications | 0 | 0.0% |
| Arts & Humanities | 2 | 3.2% |
| Total | 63 | 100.0% |
Transportation & Commute in Rose Creek
Vehicle Availability by Sex in Rose Creek
The most prevalent vehicle ownership categories in Rose Creek are males with 3 vehicles (57, accounting for 52.8%) and females with 3 vehicles (48, making up 50.4%).
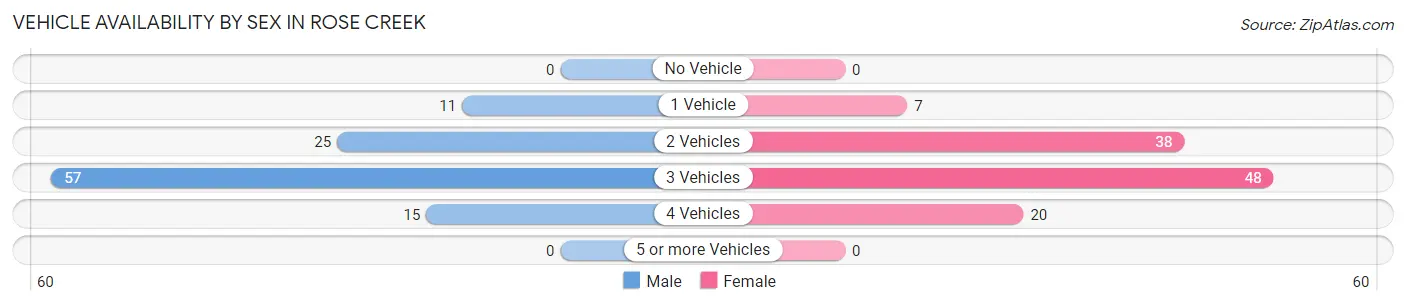
| Vehicles Available | Male | Female |
| No Vehicle | 0 (0.0%) | 0 (0.0%) |
| 1 Vehicle | 11 (10.2%) | 7 (6.2%) |
| 2 Vehicles | 25 (23.2%) | 38 (33.6%) |
| 3 Vehicles | 57 (52.8%) | 48 (42.5%) |
| 4 Vehicles | 15 (13.9%) | 20 (17.7%) |
| 5 or more Vehicles | 0 (0.0%) | 0 (0.0%) |
| Total | 108 (100.0%) | 113 (100.0%) |
Commute Time in Rose Creek
The most frequently occuring commute durations in Rose Creek are 15 to 19 minutes (53 commuters, 25.1%), 35 to 39 minutes (30 commuters, 14.2%), and 10 to 14 minutes (24 commuters, 11.4%).
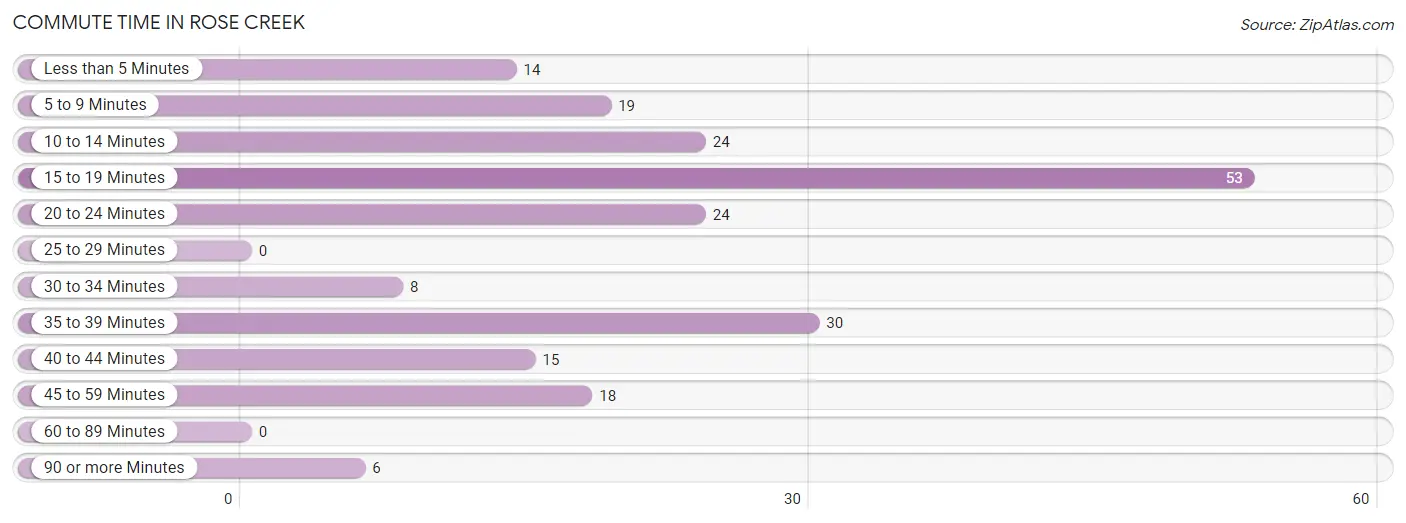
| Commute Time | # Commuters | % Commuters |
| Less than 5 Minutes | 14 | 6.6% |
| 5 to 9 Minutes | 19 | 9.0% |
| 10 to 14 Minutes | 24 | 11.4% |
| 15 to 19 Minutes | 53 | 25.1% |
| 20 to 24 Minutes | 24 | 11.4% |
| 25 to 29 Minutes | 0 | 0.0% |
| 30 to 34 Minutes | 8 | 3.8% |
| 35 to 39 Minutes | 30 | 14.2% |
| 40 to 44 Minutes | 15 | 7.1% |
| 45 to 59 Minutes | 18 | 8.5% |
| 60 to 89 Minutes | 0 | 0.0% |
| 90 or more Minutes | 6 | 2.8% |
Commute Time by Sex in Rose Creek
The most common commute times in Rose Creek are 15 to 19 minutes (35 commuters, 32.7%) for males and 35 to 39 minutes (23 commuters, 22.1%) for females.
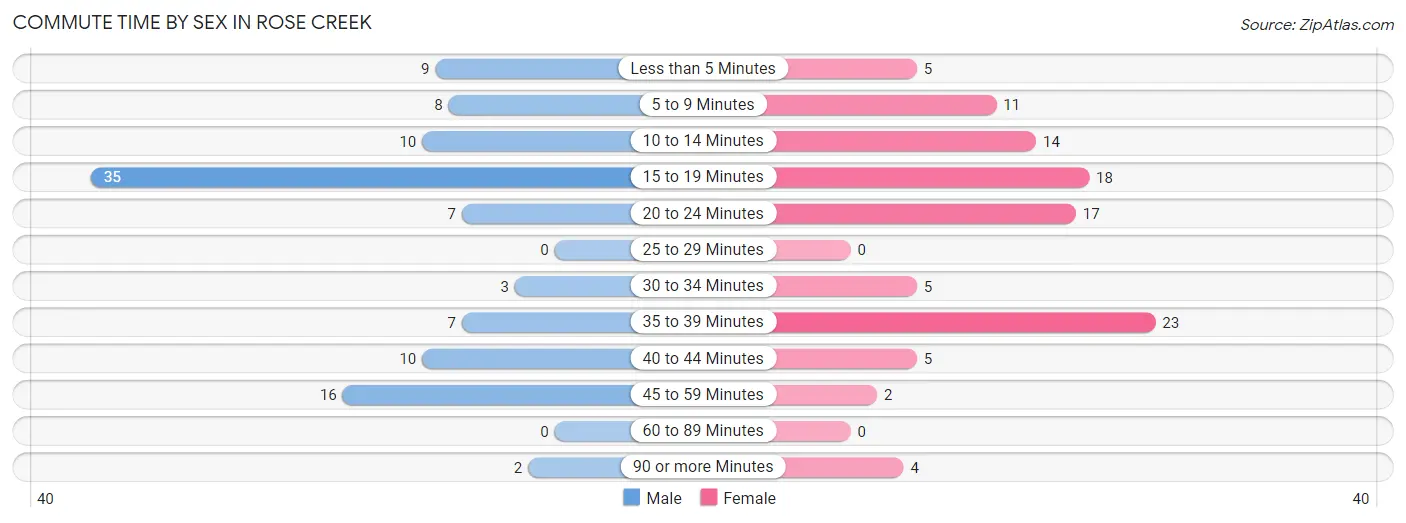
| Commute Time | Male | Female |
| Less than 5 Minutes | 9 (8.4%) | 5 (4.8%) |
| 5 to 9 Minutes | 8 (7.5%) | 11 (10.6%) |
| 10 to 14 Minutes | 10 (9.3%) | 14 (13.5%) |
| 15 to 19 Minutes | 35 (32.7%) | 18 (17.3%) |
| 20 to 24 Minutes | 7 (6.5%) | 17 (16.4%) |
| 25 to 29 Minutes | 0 (0.0%) | 0 (0.0%) |
| 30 to 34 Minutes | 3 (2.8%) | 5 (4.8%) |
| 35 to 39 Minutes | 7 (6.5%) | 23 (22.1%) |
| 40 to 44 Minutes | 10 (9.3%) | 5 (4.8%) |
| 45 to 59 Minutes | 16 (14.9%) | 2 (1.9%) |
| 60 to 89 Minutes | 0 (0.0%) | 0 (0.0%) |
| 90 or more Minutes | 2 (1.9%) | 4 (3.8%) |
Time of Departure to Work by Sex in Rose Creek
The most frequent times of departure to work in Rose Creek are 5:30 AM to 5:59 AM (33, 30.8%) for males and 5:30 AM to 5:59 AM (29, 27.9%) for females.
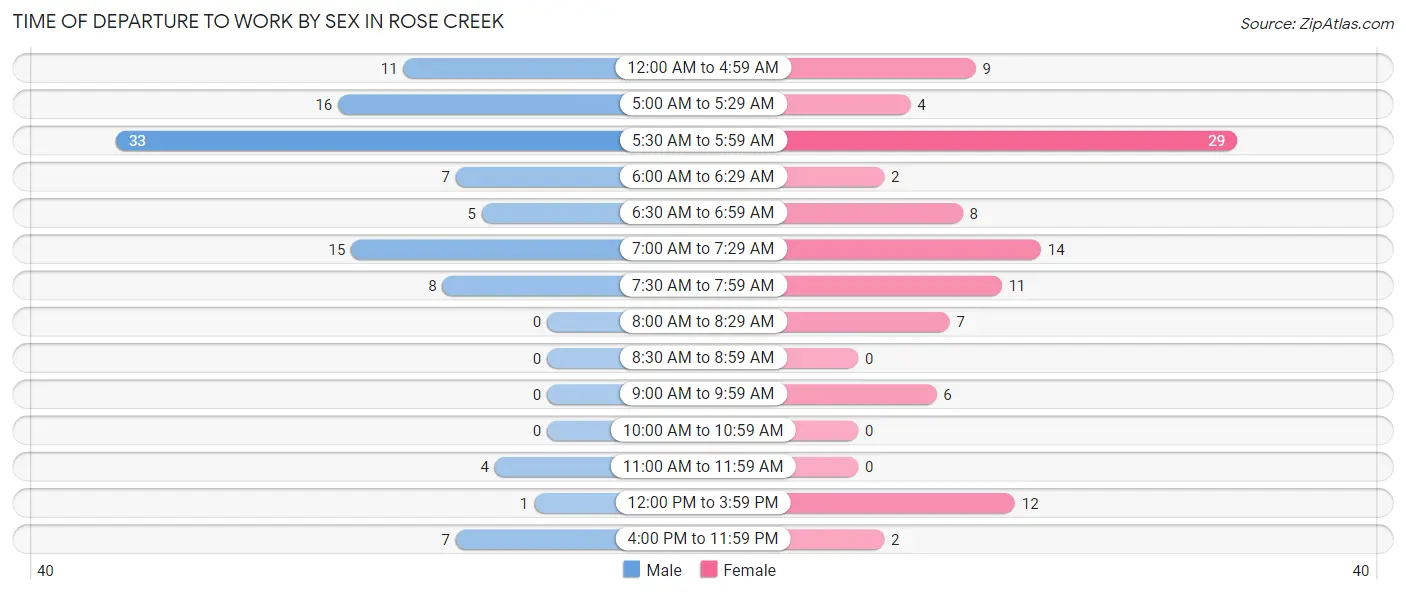
| Time of Departure | Male | Female |
| 12:00 AM to 4:59 AM | 11 (10.3%) | 9 (8.6%) |
| 5:00 AM to 5:29 AM | 16 (14.9%) | 4 (3.8%) |
| 5:30 AM to 5:59 AM | 33 (30.8%) | 29 (27.9%) |
| 6:00 AM to 6:29 AM | 7 (6.5%) | 2 (1.9%) |
| 6:30 AM to 6:59 AM | 5 (4.7%) | 8 (7.7%) |
| 7:00 AM to 7:29 AM | 15 (14.0%) | 14 (13.5%) |
| 7:30 AM to 7:59 AM | 8 (7.5%) | 11 (10.6%) |
| 8:00 AM to 8:29 AM | 0 (0.0%) | 7 (6.7%) |
| 8:30 AM to 8:59 AM | 0 (0.0%) | 0 (0.0%) |
| 9:00 AM to 9:59 AM | 0 (0.0%) | 6 (5.8%) |
| 10:00 AM to 10:59 AM | 0 (0.0%) | 0 (0.0%) |
| 11:00 AM to 11:59 AM | 4 (3.7%) | 0 (0.0%) |
| 12:00 PM to 3:59 PM | 1 (0.9%) | 12 (11.5%) |
| 4:00 PM to 11:59 PM | 7 (6.5%) | 2 (1.9%) |
| Total | 107 (100.0%) | 104 (100.0%) |
Housing Occupancy in Rose Creek
Occupancy by Ownership in Rose Creek
Of the total 181 dwellings in Rose Creek, owner-occupied units account for 166 (91.7%), while renter-occupied units make up 15 (8.3%).
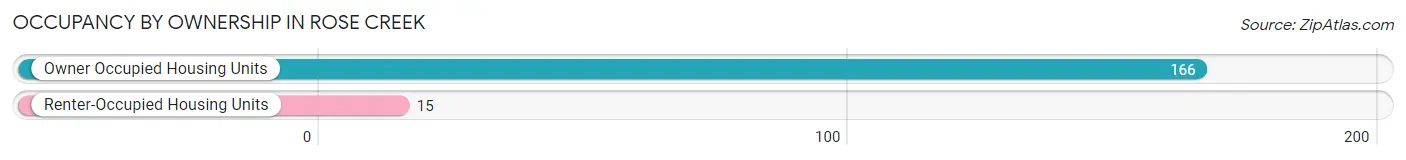
| Occupancy | # Housing Units | % Housing Units |
| Owner Occupied Housing Units | 166 | 91.7% |
| Renter-Occupied Housing Units | 15 | 8.3% |
| Total Occupied Housing Units | 181 | 100.0% |
Occupancy by Household Size in Rose Creek
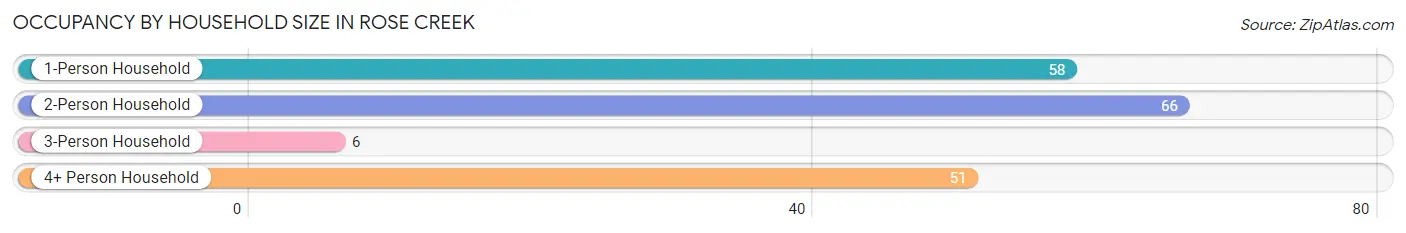
| Household Size | # Housing Units | % Housing Units |
| 1-Person Household | 58 | 32.0% |
| 2-Person Household | 66 | 36.5% |
| 3-Person Household | 6 | 3.3% |
| 4+ Person Household | 51 | 28.2% |
| Total Housing Units | 181 | 100.0% |
Occupancy by Ownership by Household Size in Rose Creek
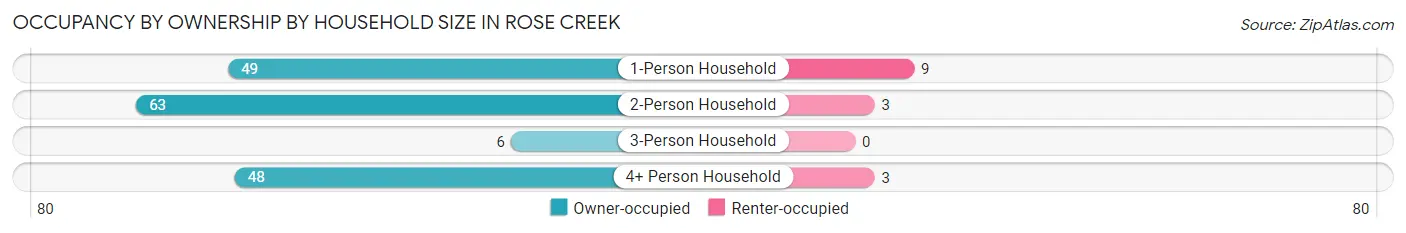
| Household Size | Owner-occupied | Renter-occupied |
| 1-Person Household | 49 (84.5%) | 9 (15.5%) |
| 2-Person Household | 63 (95.5%) | 3 (4.5%) |
| 3-Person Household | 6 (100.0%) | 0 (0.0%) |
| 4+ Person Household | 48 (94.1%) | 3 (5.9%) |
| Total Housing Units | 166 (91.7%) | 15 (8.3%) |
Occupancy by Educational Attainment in Rose Creek
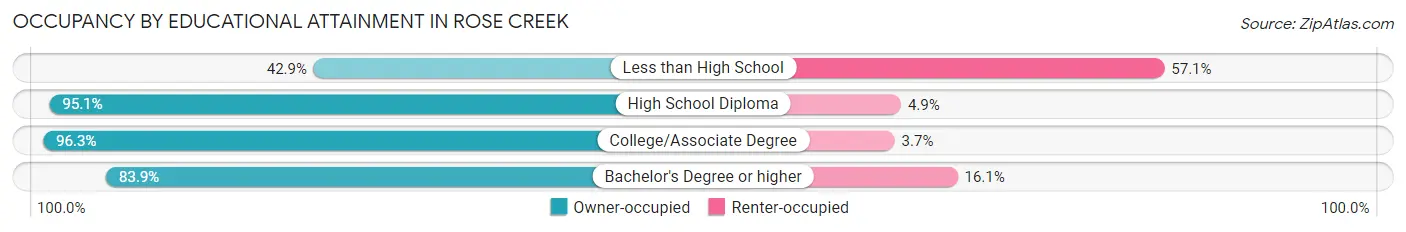
| Household Size | Owner-occupied | Renter-occupied |
| Less than High School | 3 (42.9%) | 4 (57.1%) |
| High School Diploma | 58 (95.1%) | 3 (4.9%) |
| College/Associate Degree | 79 (96.3%) | 3 (3.7%) |
| Bachelor's Degree or higher | 26 (83.9%) | 5 (16.1%) |
Occupancy by Age of Householder in Rose Creek
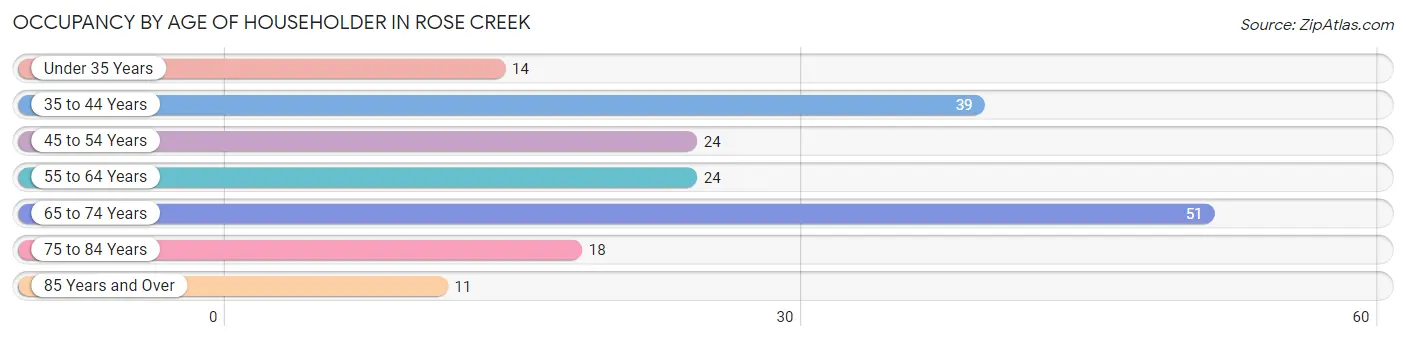
| Age Bracket | # Households | % Households |
| Under 35 Years | 14 | 7.7% |
| 35 to 44 Years | 39 | 21.5% |
| 45 to 54 Years | 24 | 13.3% |
| 55 to 64 Years | 24 | 13.3% |
| 65 to 74 Years | 51 | 28.2% |
| 75 to 84 Years | 18 | 9.9% |
| 85 Years and Over | 11 | 6.1% |
| Total | 181 | 100.0% |
Housing Finances in Rose Creek
Median Income by Occupancy in Rose Creek
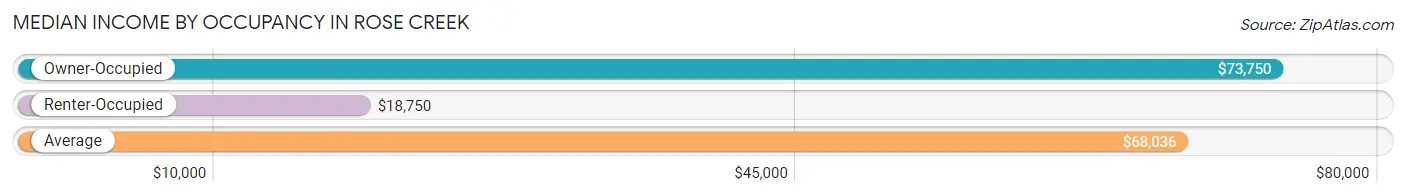
| Occupancy Type | # Households | Median Income |
| Owner-Occupied | 166 (91.7%) | $73,750 |
| Renter-Occupied | 15 (8.3%) | $18,750 |
| Average | 181 (100.0%) | $68,036 |
Occupancy by Householder Income Bracket in Rose Creek
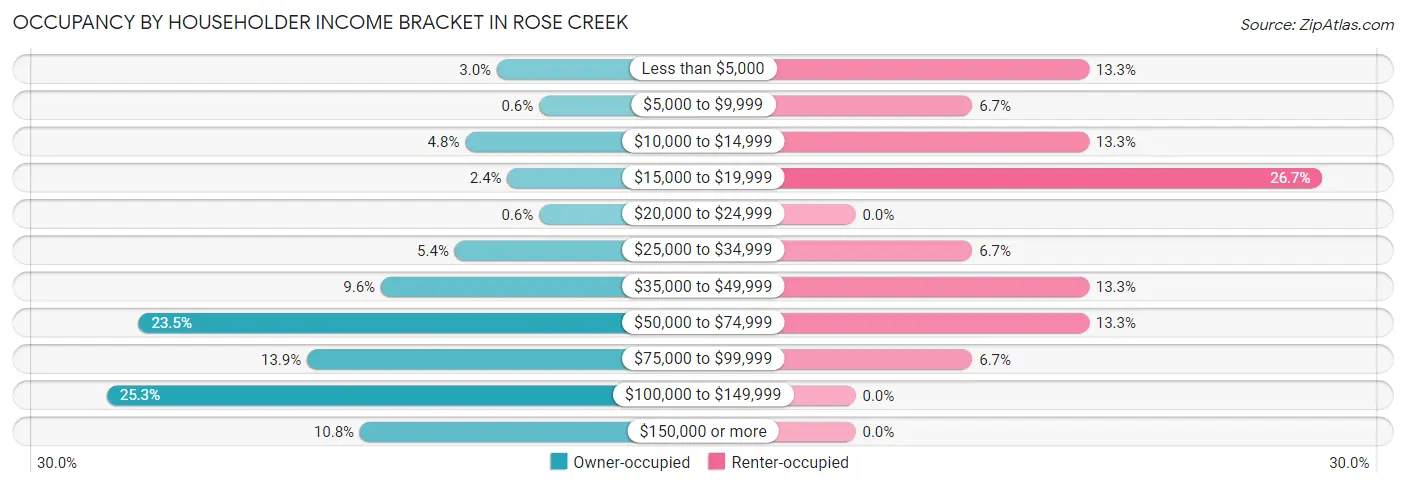
| Income Bracket | Owner-occupied | Renter-occupied |
| Less than $5,000 | 5 (3.0%) | 2 (13.3%) |
| $5,000 to $9,999 | 1 (0.6%) | 1 (6.7%) |
| $10,000 to $14,999 | 8 (4.8%) | 2 (13.3%) |
| $15,000 to $19,999 | 4 (2.4%) | 4 (26.7%) |
| $20,000 to $24,999 | 1 (0.6%) | 0 (0.0%) |
| $25,000 to $34,999 | 9 (5.4%) | 1 (6.7%) |
| $35,000 to $49,999 | 16 (9.6%) | 2 (13.3%) |
| $50,000 to $74,999 | 39 (23.5%) | 2 (13.3%) |
| $75,000 to $99,999 | 23 (13.9%) | 1 (6.7%) |
| $100,000 to $149,999 | 42 (25.3%) | 0 (0.0%) |
| $150,000 or more | 18 (10.8%) | 0 (0.0%) |
| Total | 166 (100.0%) | 15 (100.0%) |
Monthly Housing Cost Tiers in Rose Creek
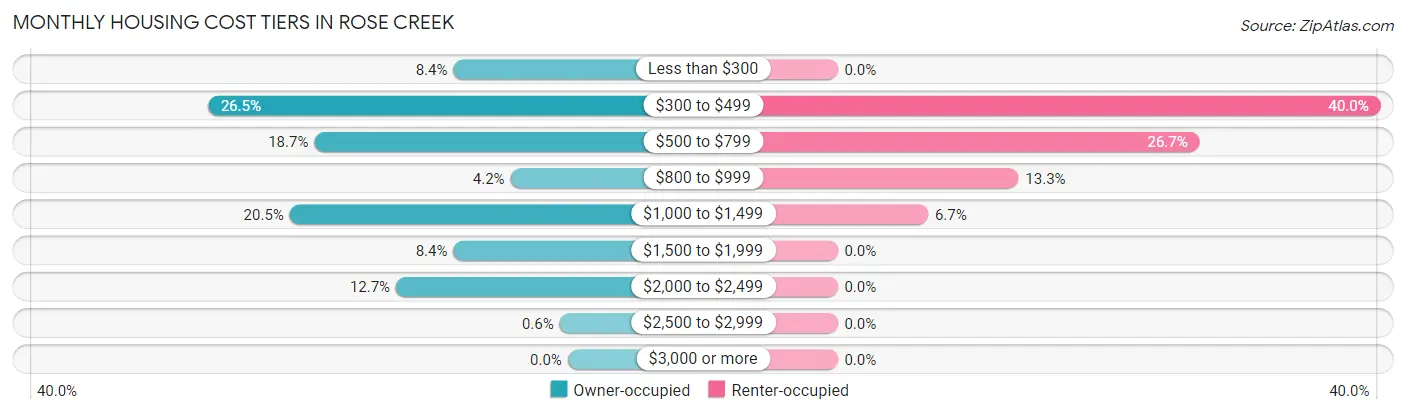
| Monthly Cost | Owner-occupied | Renter-occupied |
| Less than $300 | 14 (8.4%) | 0 (0.0%) |
| $300 to $499 | 44 (26.5%) | 6 (40.0%) |
| $500 to $799 | 31 (18.7%) | 4 (26.7%) |
| $800 to $999 | 7 (4.2%) | 2 (13.3%) |
| $1,000 to $1,499 | 34 (20.5%) | 1 (6.7%) |
| $1,500 to $1,999 | 14 (8.4%) | 0 (0.0%) |
| $2,000 to $2,499 | 21 (12.7%) | 0 (0.0%) |
| $2,500 to $2,999 | 1 (0.6%) | 0 (0.0%) |
| $3,000 or more | 0 (0.0%) | 0 (0.0%) |
| Total | 166 (100.0%) | 15 (100.0%) |
Physical Housing Characteristics in Rose Creek
Housing Structures in Rose Creek
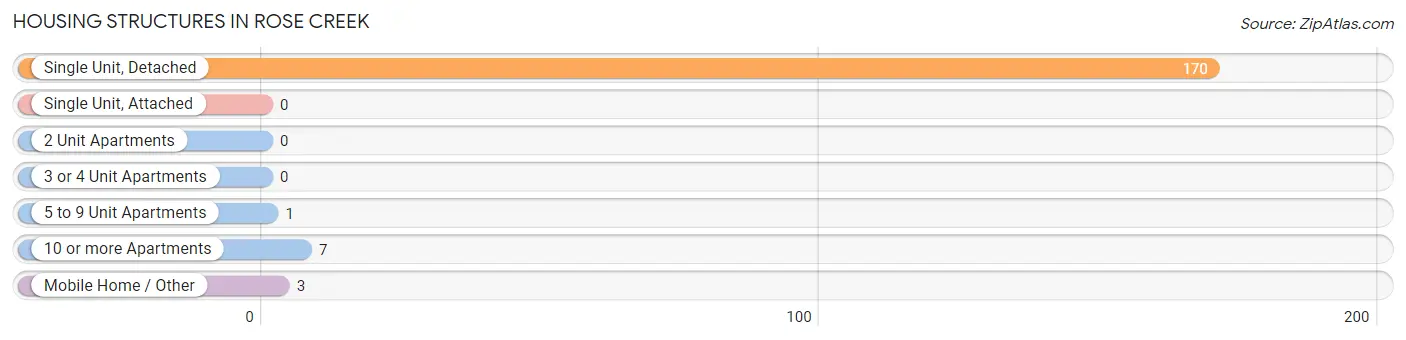
| Structure Type | # Housing Units | % Housing Units |
| Single Unit, Detached | 170 | 93.9% |
| Single Unit, Attached | 0 | 0.0% |
| 2 Unit Apartments | 0 | 0.0% |
| 3 or 4 Unit Apartments | 0 | 0.0% |
| 5 to 9 Unit Apartments | 1 | 0.5% |
| 10 or more Apartments | 7 | 3.9% |
| Mobile Home / Other | 3 | 1.7% |
| Total | 181 | 100.0% |
Housing Structures by Occupancy in Rose Creek
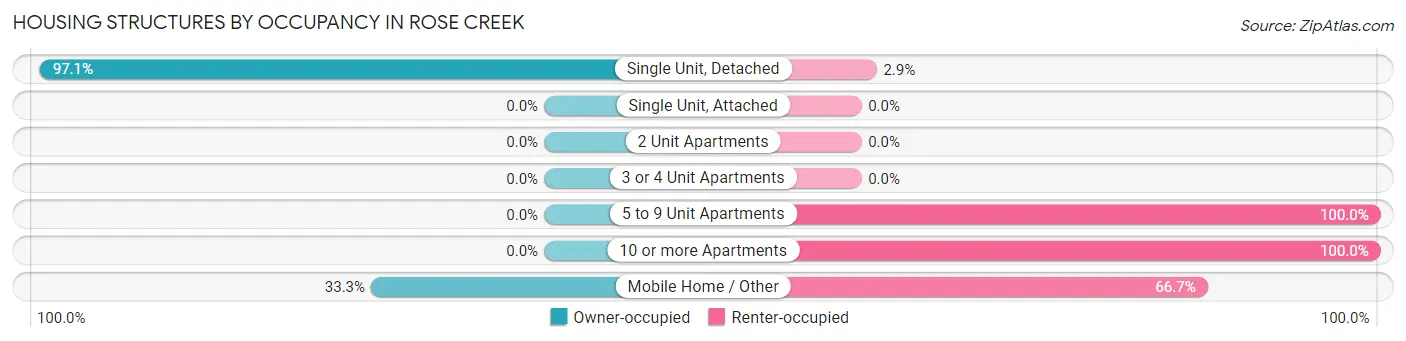
| Structure Type | Owner-occupied | Renter-occupied |
| Single Unit, Detached | 165 (97.1%) | 5 (2.9%) |
| Single Unit, Attached | 0 (0.0%) | 0 (0.0%) |
| 2 Unit Apartments | 0 (0.0%) | 0 (0.0%) |
| 3 or 4 Unit Apartments | 0 (0.0%) | 0 (0.0%) |
| 5 to 9 Unit Apartments | 0 (0.0%) | 1 (100.0%) |
| 10 or more Apartments | 0 (0.0%) | 7 (100.0%) |
| Mobile Home / Other | 1 (33.3%) | 2 (66.7%) |
| Total | 166 (91.7%) | 15 (8.3%) |
Housing Structures by Number of Rooms in Rose Creek
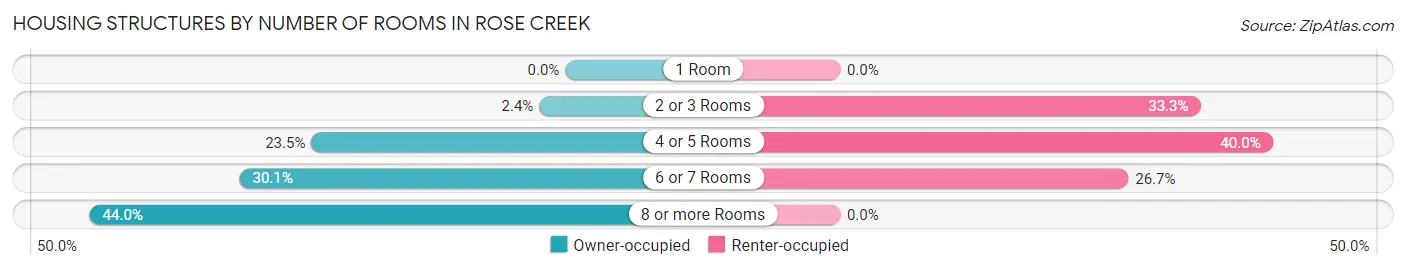
| Number of Rooms | Owner-occupied | Renter-occupied |
| 1 Room | 0 (0.0%) | 0 (0.0%) |
| 2 or 3 Rooms | 4 (2.4%) | 5 (33.3%) |
| 4 or 5 Rooms | 39 (23.5%) | 6 (40.0%) |
| 6 or 7 Rooms | 50 (30.1%) | 4 (26.7%) |
| 8 or more Rooms | 73 (44.0%) | 0 (0.0%) |
| Total | 166 (100.0%) | 15 (100.0%) |
Housing Structure by Heating Type in Rose Creek
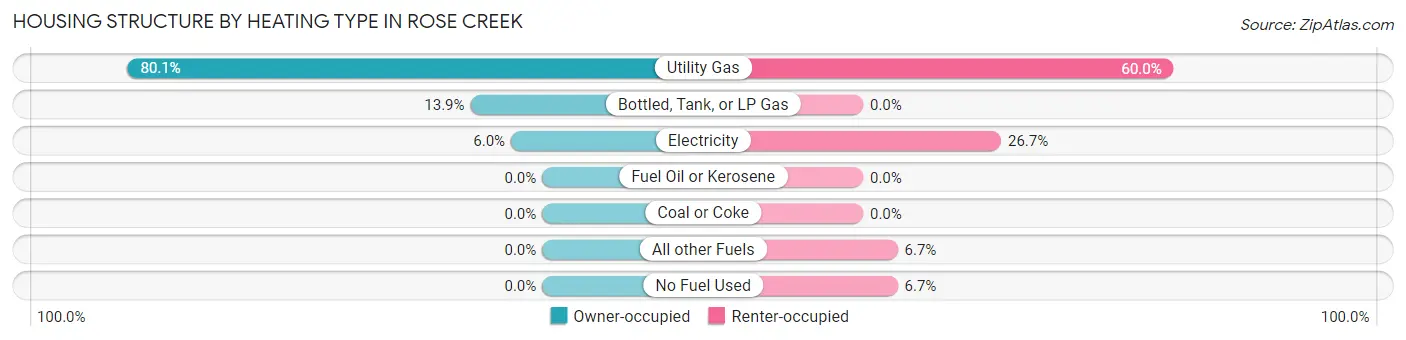
| Heating Type | Owner-occupied | Renter-occupied |
| Utility Gas | 133 (80.1%) | 9 (60.0%) |
| Bottled, Tank, or LP Gas | 23 (13.9%) | 0 (0.0%) |
| Electricity | 10 (6.0%) | 4 (26.7%) |
| Fuel Oil or Kerosene | 0 (0.0%) | 0 (0.0%) |
| Coal or Coke | 0 (0.0%) | 0 (0.0%) |
| All other Fuels | 0 (0.0%) | 1 (6.7%) |
| No Fuel Used | 0 (0.0%) | 1 (6.7%) |
| Total | 166 (100.0%) | 15 (100.0%) |
Household Vehicle Usage in Rose Creek
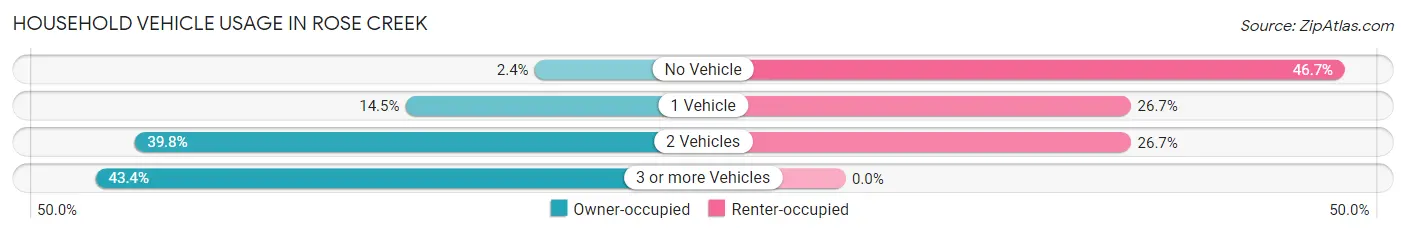
| Vehicles per Household | Owner-occupied | Renter-occupied |
| No Vehicle | 4 (2.4%) | 7 (46.7%) |
| 1 Vehicle | 24 (14.5%) | 4 (26.7%) |
| 2 Vehicles | 66 (39.8%) | 4 (26.7%) |
| 3 or more Vehicles | 72 (43.4%) | 0 (0.0%) |
| Total | 166 (100.0%) | 15 (100.0%) |
Real Estate & Mortgages in Rose Creek
Real Estate and Mortgage Overview in Rose Creek
| Characteristic | Without Mortgage | With Mortgage |
| Housing Units | 77 | 89 |
| Median Property Value | $112,500 | $144,900 |
| Median Household Income | $66,875 | $7 |
| Monthly Housing Costs | $424 | $0 |
| Real Estate Taxes | $1,447 | $12 |
Property Value by Mortgage Status in Rose Creek
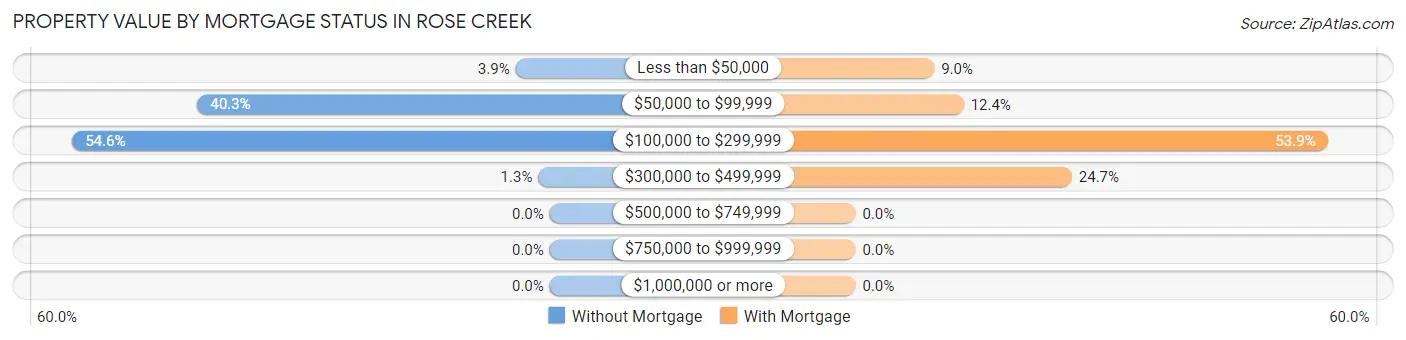
| Property Value | Without Mortgage | With Mortgage |
| Less than $50,000 | 3 (3.9%) | 8 (9.0%) |
| $50,000 to $99,999 | 31 (40.3%) | 11 (12.4%) |
| $100,000 to $299,999 | 42 (54.5%) | 48 (53.9%) |
| $300,000 to $499,999 | 1 (1.3%) | 22 (24.7%) |
| $500,000 to $749,999 | 0 (0.0%) | 0 (0.0%) |
| $750,000 to $999,999 | 0 (0.0%) | 0 (0.0%) |
| $1,000,000 or more | 0 (0.0%) | 0 (0.0%) |
| Total | 77 (100.0%) | 89 (100.0%) |
Household Income by Mortgage Status in Rose Creek
| Household Income | Without Mortgage | With Mortgage |
| Less than $10,000 | 4 (5.2%) | 0 (0.0%) |
| $10,000 to $24,999 | 9 (11.7%) | 2 (2.2%) |
| $25,000 to $34,999 | 5 (6.5%) | 4 (4.5%) |
| $35,000 to $49,999 | 10 (13.0%) | 4 (4.5%) |
| $50,000 to $74,999 | 15 (19.5%) | 6 (6.7%) |
| $75,000 to $99,999 | 13 (16.9%) | 24 (27.0%) |
| $100,000 to $149,999 | 10 (13.0%) | 10 (11.2%) |
| $150,000 or more | 11 (14.3%) | 32 (36.0%) |
| Total | 77 (100.0%) | 89 (100.0%) |
Property Value to Household Income Ratio in Rose Creek
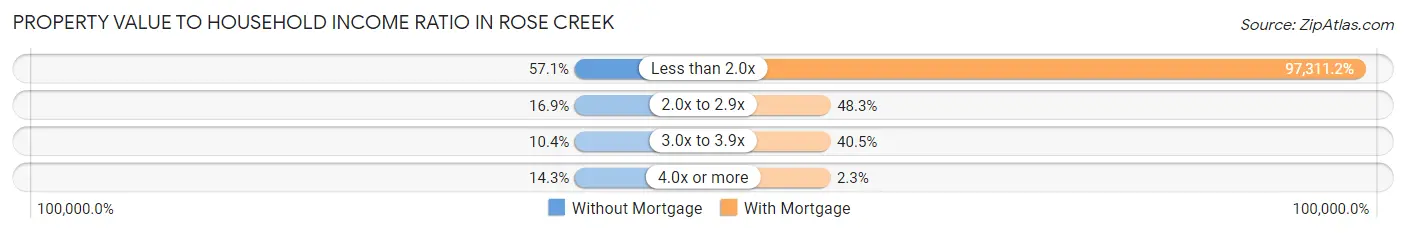
| Value-to-Income Ratio | Without Mortgage | With Mortgage |
| Less than 2.0x | 44 (57.1%) | 86,607 (97,311.2%) |
| 2.0x to 2.9x | 13 (16.9%) | 43 (48.3%) |
| 3.0x to 3.9x | 8 (10.4%) | 36 (40.5%) |
| 4.0x or more | 11 (14.3%) | 2 (2.2%) |
| Total | 77 (100.0%) | 89 (100.0%) |
Real Estate Taxes by Mortgage Status in Rose Creek
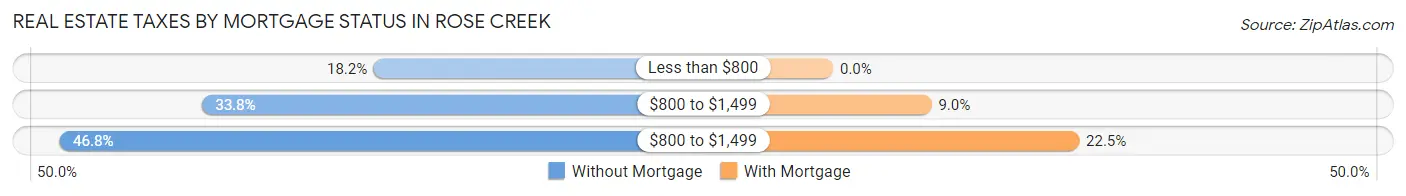
| Property Taxes | Without Mortgage | With Mortgage |
| Less than $800 | 14 (18.2%) | 0 (0.0%) |
| $800 to $1,499 | 26 (33.8%) | 8 (9.0%) |
| $800 to $1,499 | 36 (46.8%) | 20 (22.5%) |
| Total | 77 (100.0%) | 89 (100.0%) |
Health & Disability in Rose Creek
Health Insurance Coverage by Age in Rose Creek
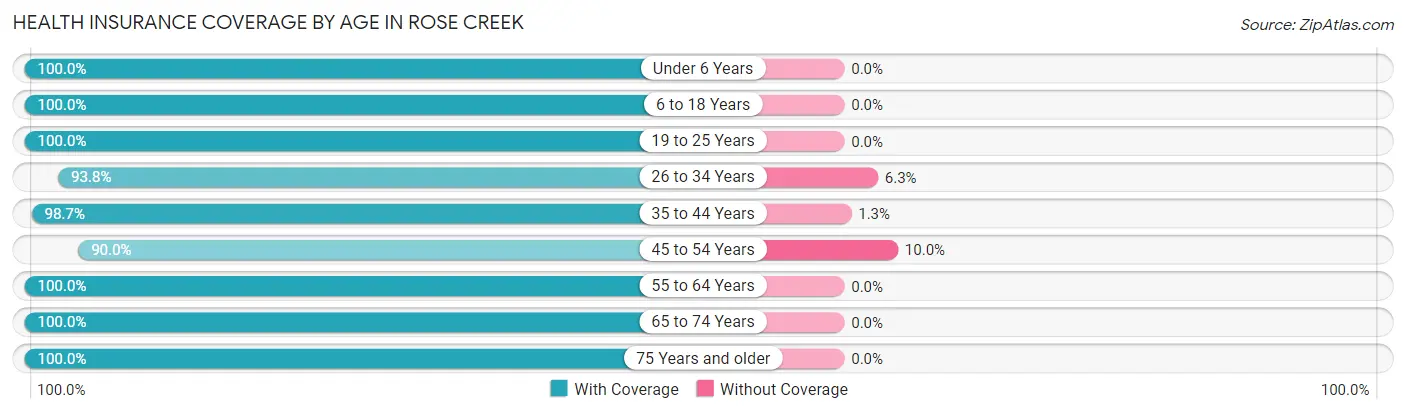
| Age Bracket | With Coverage | Without Coverage |
| Under 6 Years | 21 (100.0%) | 0 (0.0%) |
| 6 to 18 Years | 121 (100.0%) | 0 (0.0%) |
| 19 to 25 Years | 32 (100.0%) | 0 (0.0%) |
| 26 to 34 Years | 15 (93.8%) | 1 (6.2%) |
| 35 to 44 Years | 76 (98.7%) | 1 (1.3%) |
| 45 to 54 Years | 45 (90.0%) | 5 (10.0%) |
| 55 to 64 Years | 40 (100.0%) | 0 (0.0%) |
| 65 to 74 Years | 75 (100.0%) | 0 (0.0%) |
| 75 Years and older | 41 (100.0%) | 0 (0.0%) |
| Total | 466 (98.5%) | 7 (1.5%) |
Health Insurance Coverage by Citizenship Status in Rose Creek
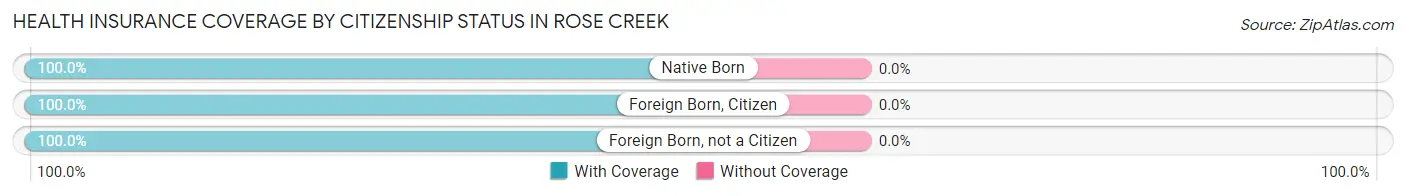
| Citizenship Status | With Coverage | Without Coverage |
| Native Born | 21 (100.0%) | 0 (0.0%) |
| Foreign Born, Citizen | 121 (100.0%) | 0 (0.0%) |
| Foreign Born, not a Citizen | 32 (100.0%) | 0 (0.0%) |
Health Insurance Coverage by Household Income in Rose Creek
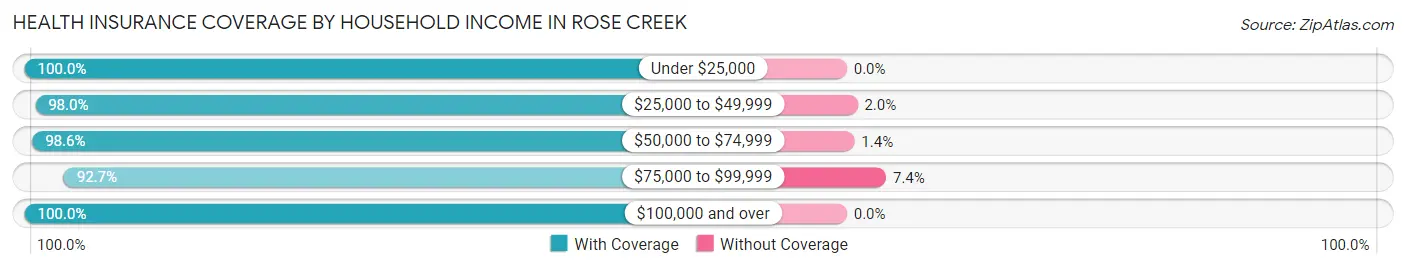
| Household Income | With Coverage | Without Coverage |
| Under $25,000 | 37 (100.0%) | 0 (0.0%) |
| $25,000 to $49,999 | 49 (98.0%) | 1 (2.0%) |
| $50,000 to $74,999 | 69 (98.6%) | 1 (1.4%) |
| $75,000 to $99,999 | 63 (92.6%) | 5 (7.3%) |
| $100,000 and over | 248 (100.0%) | 0 (0.0%) |
Public vs Private Health Insurance Coverage by Age in Rose Creek
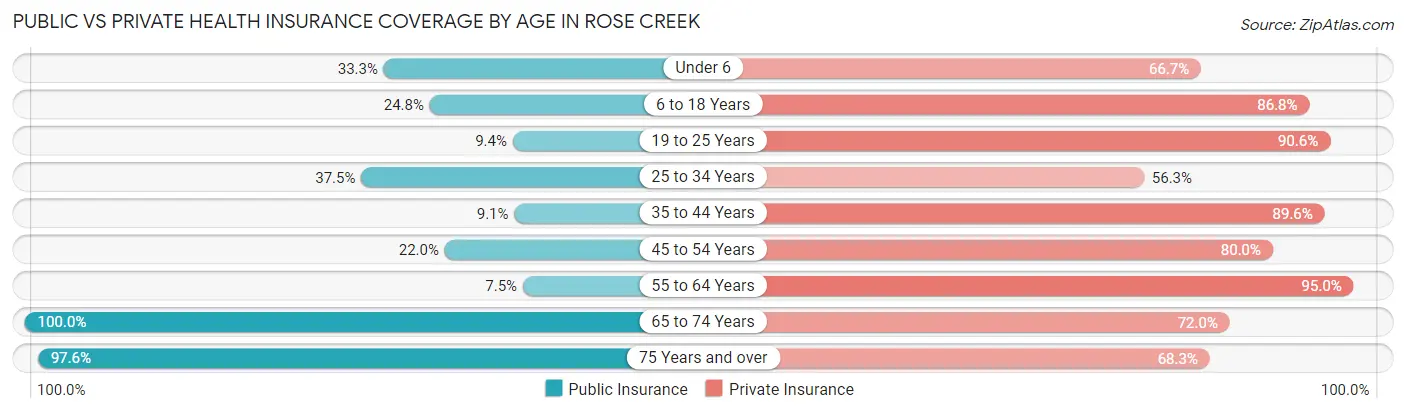
| Age Bracket | Public Insurance | Private Insurance |
| Under 6 | 7 (33.3%) | 14 (66.7%) |
| 6 to 18 Years | 30 (24.8%) | 105 (86.8%) |
| 19 to 25 Years | 3 (9.4%) | 29 (90.6%) |
| 25 to 34 Years | 6 (37.5%) | 9 (56.2%) |
| 35 to 44 Years | 7 (9.1%) | 69 (89.6%) |
| 45 to 54 Years | 11 (22.0%) | 40 (80.0%) |
| 55 to 64 Years | 3 (7.5%) | 38 (95.0%) |
| 65 to 74 Years | 75 (100.0%) | 54 (72.0%) |
| 75 Years and over | 40 (97.6%) | 28 (68.3%) |
| Total | 182 (38.5%) | 386 (81.6%) |
Disability Status by Sex by Age in Rose Creek
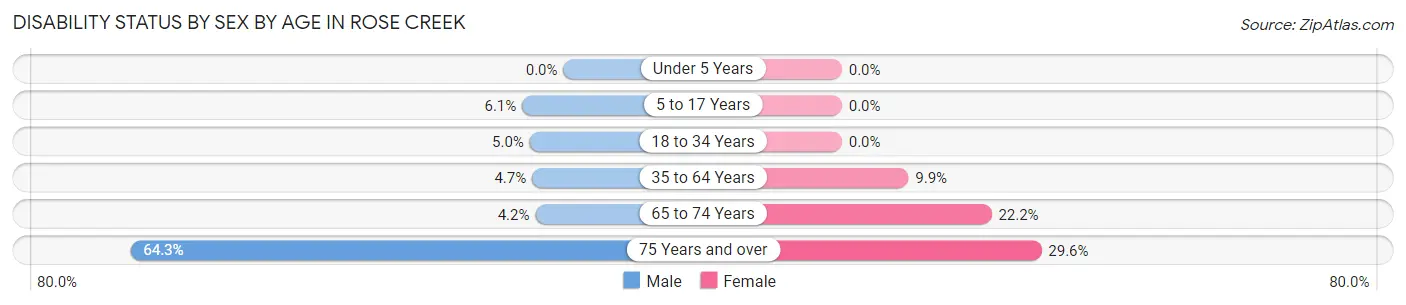
| Age Bracket | Male | Female |
| Under 5 Years | 0 (0.0%) | 0 (0.0%) |
| 5 to 17 Years | 3 (6.1%) | 0 (0.0%) |
| 18 to 34 Years | 1 (5.0%) | 0 (0.0%) |
| 35 to 64 Years | 4 (4.6%) | 8 (9.9%) |
| 65 to 74 Years | 2 (4.2%) | 6 (22.2%) |
| 75 Years and over | 9 (64.3%) | 8 (29.6%) |
Disability Class by Sex by Age in Rose Creek
Disability Class: Hearing Difficulty
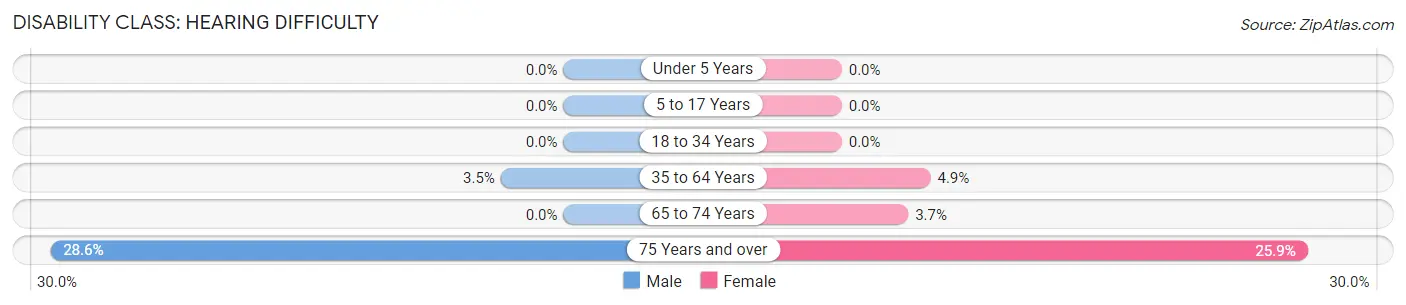
| Age Bracket | Male | Female |
| Under 5 Years | 0 (0.0%) | 0 (0.0%) |
| 5 to 17 Years | 0 (0.0%) | 0 (0.0%) |
| 18 to 34 Years | 0 (0.0%) | 0 (0.0%) |
| 35 to 64 Years | 3 (3.5%) | 4 (4.9%) |
| 65 to 74 Years | 0 (0.0%) | 1 (3.7%) |
| 75 Years and over | 4 (28.6%) | 7 (25.9%) |
Disability Class: Vision Difficulty
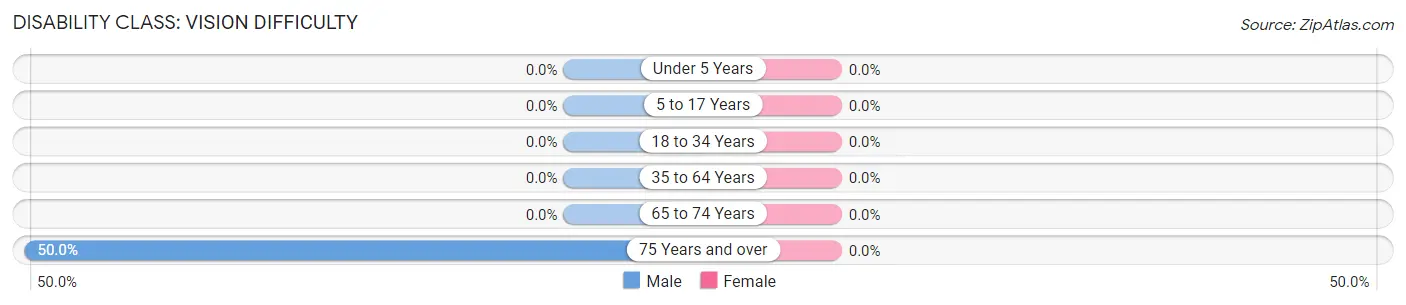
| Age Bracket | Male | Female |
| Under 5 Years | 0 (0.0%) | 0 (0.0%) |
| 5 to 17 Years | 0 (0.0%) | 0 (0.0%) |
| 18 to 34 Years | 0 (0.0%) | 0 (0.0%) |
| 35 to 64 Years | 0 (0.0%) | 0 (0.0%) |
| 65 to 74 Years | 0 (0.0%) | 0 (0.0%) |
| 75 Years and over | 7 (50.0%) | 0 (0.0%) |
Disability Class: Cognitive Difficulty
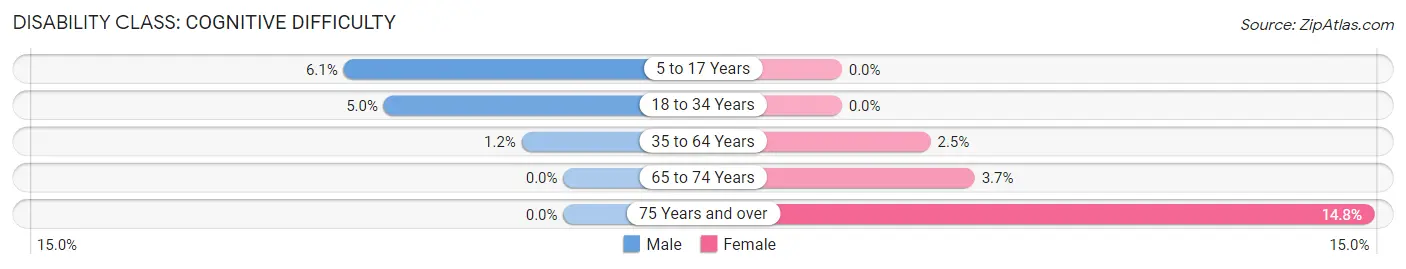
| Age Bracket | Male | Female |
| 5 to 17 Years | 3 (6.1%) | 0 (0.0%) |
| 18 to 34 Years | 1 (5.0%) | 0 (0.0%) |
| 35 to 64 Years | 1 (1.2%) | 2 (2.5%) |
| 65 to 74 Years | 0 (0.0%) | 1 (3.7%) |
| 75 Years and over | 0 (0.0%) | 4 (14.8%) |
Disability Class: Ambulatory Difficulty
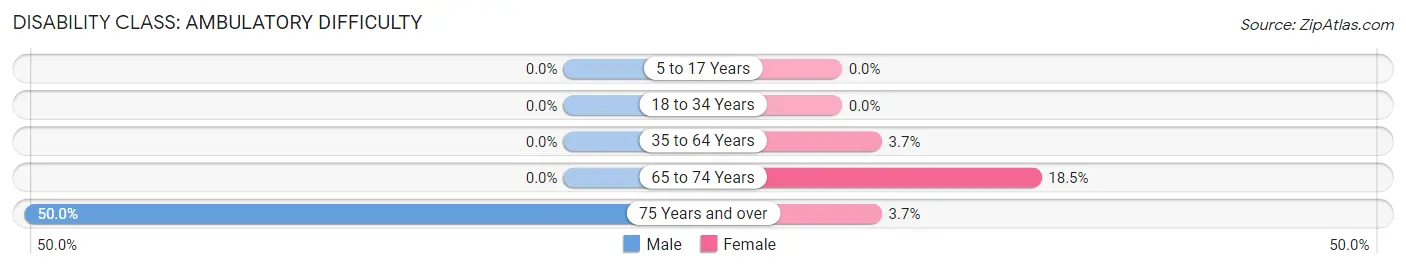
| Age Bracket | Male | Female |
| 5 to 17 Years | 0 (0.0%) | 0 (0.0%) |
| 18 to 34 Years | 0 (0.0%) | 0 (0.0%) |
| 35 to 64 Years | 0 (0.0%) | 3 (3.7%) |
| 65 to 74 Years | 0 (0.0%) | 5 (18.5%) |
| 75 Years and over | 7 (50.0%) | 1 (3.7%) |
Disability Class: Self-Care Difficulty
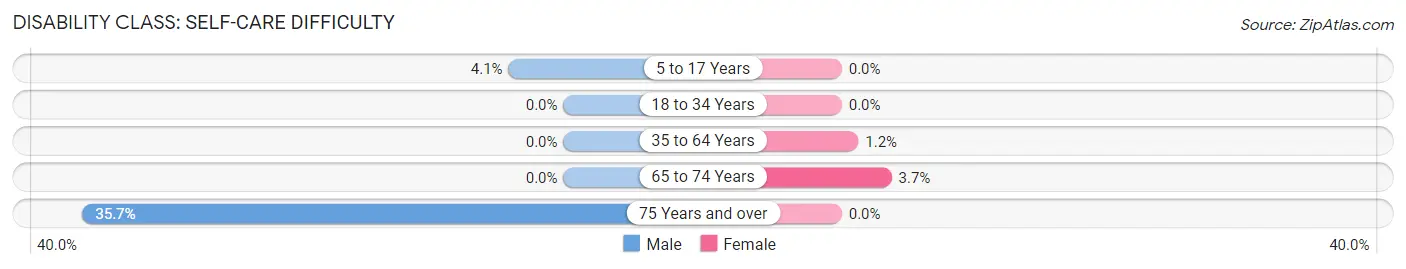
| Age Bracket | Male | Female |
| 5 to 17 Years | 2 (4.1%) | 0 (0.0%) |
| 18 to 34 Years | 0 (0.0%) | 0 (0.0%) |
| 35 to 64 Years | 0 (0.0%) | 1 (1.2%) |
| 65 to 74 Years | 0 (0.0%) | 1 (3.7%) |
| 75 Years and over | 5 (35.7%) | 0 (0.0%) |
Technology Access in Rose Creek
Computing Device Access in Rose Creek
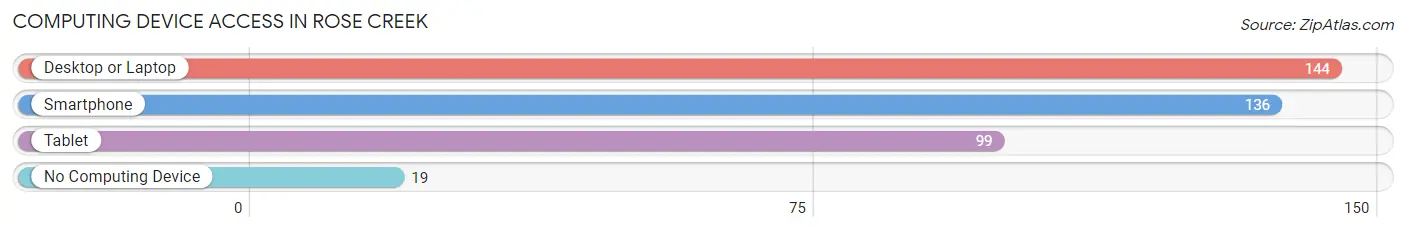
| Device Type | # Households | % Households |
| Desktop or Laptop | 144 | 79.6% |
| Smartphone | 136 | 75.1% |
| Tablet | 99 | 54.7% |
| No Computing Device | 19 | 10.5% |
| Total | 181 | 100.0% |
Internet Access in Rose Creek
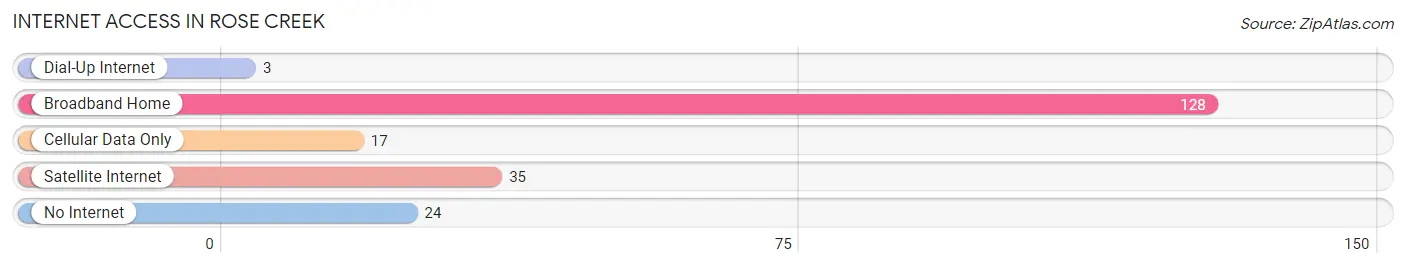
| Internet Type | # Households | % Households |
| Dial-Up Internet | 3 | 1.7% |
| Broadband Home | 128 | 70.7% |
| Cellular Data Only | 17 | 9.4% |
| Satellite Internet | 35 | 19.3% |
| No Internet | 24 | 13.3% |
| Total | 181 | 100.0% |
Rose Creek Summary
History
The small town of Rose Creek, Minnesota is located in Mower County, in the southeastern part of the state. It is situated on the banks of the Cedar River, and is surrounded by rolling hills and farmland. The town was founded in 1856 by a group of settlers from New York, who were looking for a place to settle and start a new life. The town was named after the wild roses that grew along the banks of the river.
The first settlers in Rose Creek were mostly farmers, and the town quickly grew to become a thriving agricultural community. The town was home to a variety of businesses, including a general store, a blacksmith, a sawmill, and a grist mill. The town also had a school, a post office, and a church.
In the late 1800s, the railroad came to Rose Creek, and the town began to grow even more. The railroad brought new people and new businesses to the area, and the town soon had a variety of stores, restaurants, and other businesses.
In the early 1900s, Rose Creek was a bustling little town. The population had grown to over 500 people, and the town had a variety of businesses, including a bank, a hotel, a movie theater, and a variety of other stores.
The town continued to grow and prosper until the Great Depression hit in the 1930s. Many of the businesses in Rose Creek closed, and the population began to decline. The town was able to survive the depression, but it never fully recovered.
In the 1950s, the town began to experience a resurgence. The population began to grow again, and new businesses opened up. The town was able to attract new residents, and the population grew to over 1,000 people by the end of the decade.
Today, Rose Creek is a small, but vibrant community. The population is around 1,500 people, and the town has a variety of businesses, including a grocery store, a hardware store, a bank, and a variety of other stores. The town also has a library, a post office, and a variety of churches.
Geography
Rose Creek is located in Mower County, in the southeastern part of Minnesota. The town is situated on the banks of the Cedar River, and is surrounded by rolling hills and farmland. The town is located about 30 miles from the city of Austin, and about 50 miles from the city of Rochester.
The town has a total area of 1.2 square miles, all of which is land. The town is located at an elevation of 945 feet above sea level.
Economy
The economy of Rose Creek is largely based on agriculture. The town is home to a variety of farms, and the surrounding area is known for its production of corn, soybeans, and other crops. The town also has a variety of businesses, including a grocery store, a hardware store, a bank, and a variety of other stores.
Demographics
As of the 2010 census, the population of Rose Creek was 1,521 people. The racial makeup of the town was 97.3% White, 0.7% African American, 0.2% Native American, 0.2% Asian, 0.2% from other races, and 1.6% from two or more races. Hispanic or Latino of any race were 1.2% of the population.
The median household income in Rose Creek was $45,938, and the median family income was $51,250. The per capita income for the town was $20,945. About 8.2% of families and 10.2% of the population were below the poverty line, including 14.2% of those under age 18 and 8.3% of those age 65 or over.
Common Questions
What is Per Capita Income in Rose Creek?
Per Capita income in Rose Creek is $31,183.
What is the Median Family Income in Rose Creek?
Median Family Income in Rose Creek is $94,063.
What is the Median Household income in Rose Creek?
Median Household Income in Rose Creek is $68,036.
What is Income or Wage Gap in Rose Creek?
Income or Wage Gap in Rose Creek is 22.5%.
Women in Rose Creek earn 77.5 cents for every dollar earned by a man.
What is Inequality or Gini Index in Rose Creek?
Inequality or Gini Index in Rose Creek is 0.37.
What is the Total Population of Rose Creek?
Total Population of Rose Creek is 473.
What is the Total Male Population of Rose Creek?
Total Male Population of Rose Creek is 219.
What is the Total Female Population of Rose Creek?
Total Female Population of Rose Creek is 254.
What is the Ratio of Males per 100 Females in Rose Creek?
There are 86.22 Males per 100 Females in Rose Creek.
What is the Ratio of Females per 100 Males in Rose Creek?
There are 115.98 Females per 100 Males in Rose Creek.
What is the Median Population Age in Rose Creek?
Median Population Age in Rose Creek is 39.3 Years.
What is the Average Family Size in Rose Creek
Average Family Size in Rose Creek is 3.3 People.
What is the Average Household Size in Rose Creek
Average Household Size in Rose Creek is 2.6 People.
How Large is the Labor Force in Rose Creek?
There are 227 People in the Labor Forcein in Rose Creek.
What is the Percentage of People in the Labor Force in Rose Creek?
65.0% of People are in the Labor Force in Rose Creek.
What is the Unemployment Rate in Rose Creek?
Unemployment Rate in Rose Creek is 0.9%.