Roosevelt, MN Map & Demographics
Roosevelt Map
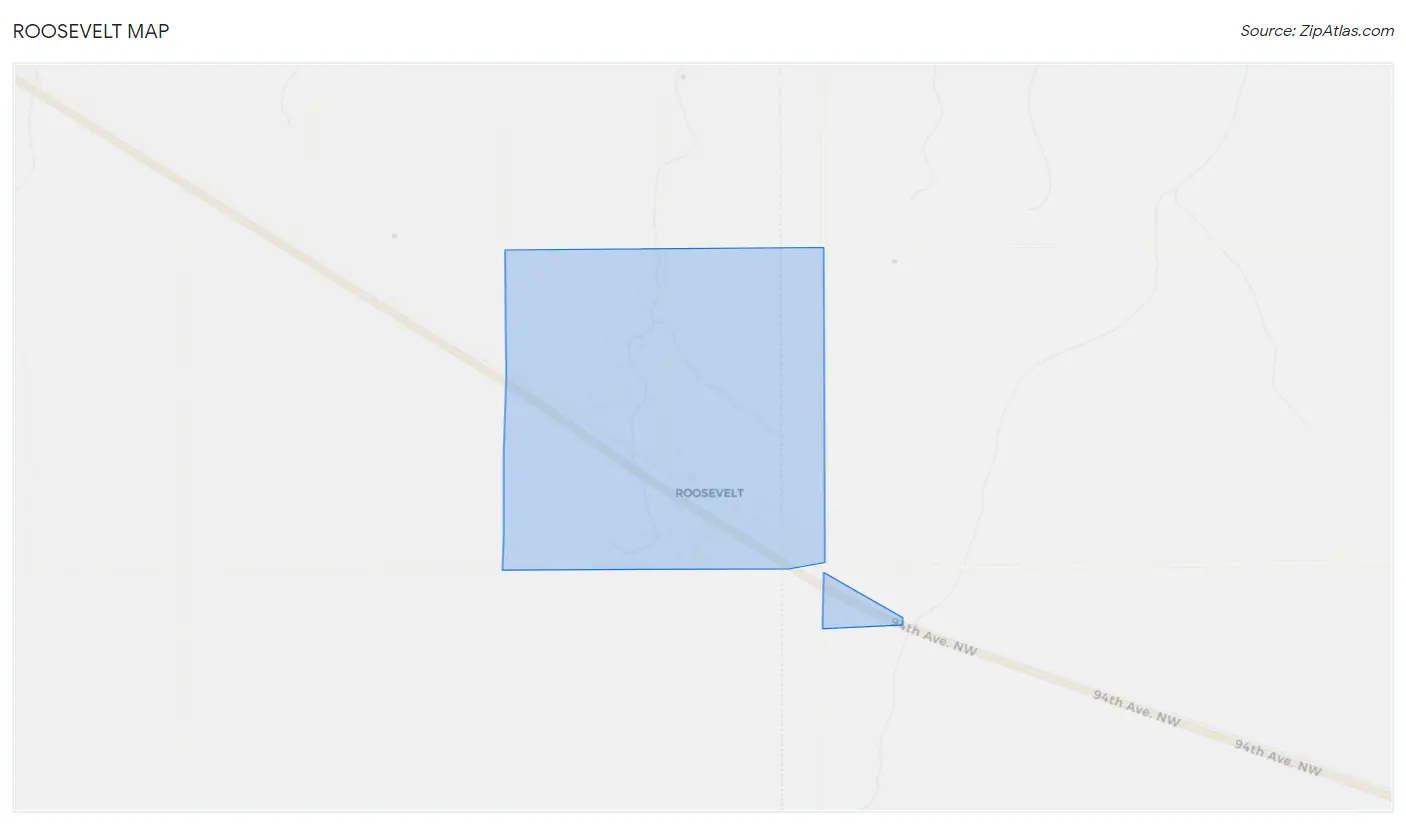
Roosevelt Overview
$25,341
PER CAPITA INCOME
$61,875
AVG FAMILY INCOME
$56,000
AVG HOUSEHOLD INCOME
0.22
INEQUALITY / GINI INDEX
175
TOTAL POPULATION
106
MALE POPULATION
69
FEMALE POPULATION
153.62
MALES / 100 FEMALES
65.09
FEMALES / 100 MALES
36.3
MEDIAN AGE
3.7
AVG FAMILY SIZE
3.2
AVG HOUSEHOLD SIZE
101
LABOR FORCE [ PEOPLE ]
73.7%
PERCENT IN LABOR FORCE
Roosevelt Zip Codes
Roosevelt Area Codes
Income in Roosevelt
Income Overview in Roosevelt
Per Capita Income in Roosevelt is $25,341, while median incomes of families and households are $61,875 and $56,000 respectively.
| Characteristic | Number | Measure |
| Per Capita Income | 175 | $25,341 |
| Median Family Income | 42 | $61,875 |
| Mean Family Income | 42 | $70,007 |
| Median Household Income | 54 | $56,000 |
| Mean Household Income | 54 | $65,381 |
| Income Deficit | 42 | $0 |
| Wage / Income Gap (%) | 175 | 0.00% |
| Wage / Income Gap ($) | 175 | 100.00¢ per $1 |
| Gini / Inequality Index | 175 | 0.22 |
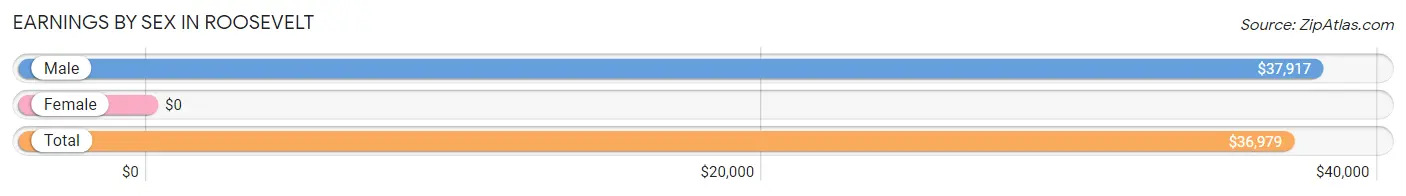
Earnings by Sex in Roosevelt
| Sex | Number | Average Earnings |
| Male | 81 (75.7%) | $37,917 |
| Female | 26 (24.3%) | $0 |
| Total | 107 (100.0%) | $36,979 |
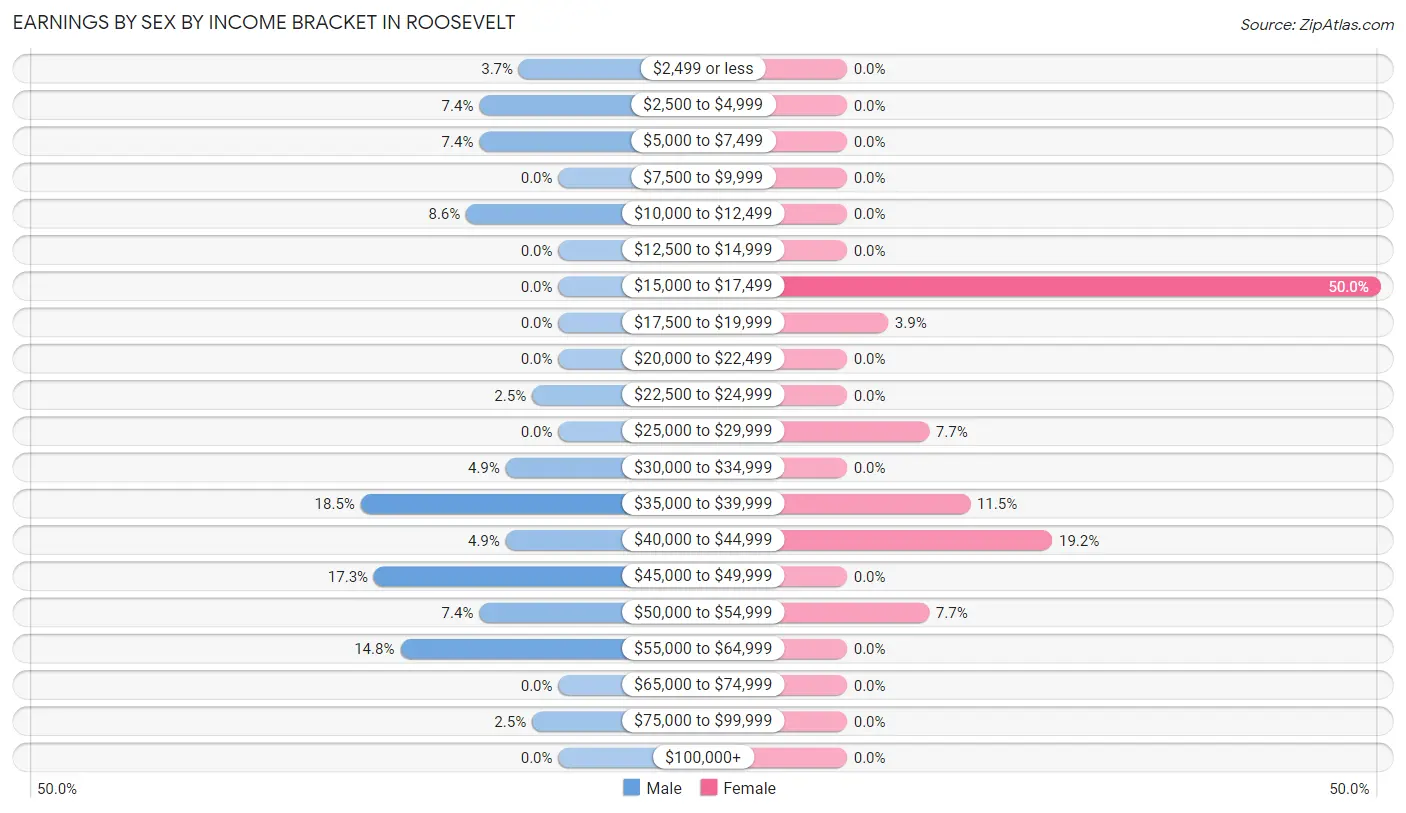
Earnings by Sex by Income Bracket in Roosevelt
The most common earnings brackets in Roosevelt are $35,000 to $39,999 for men (15 | 18.5%) and $15,000 to $17,499 for women (13 | 50.0%).
| Income | Male | Female |
| $2,499 or less | 3 (3.7%) | 0 (0.0%) |
| $2,500 to $4,999 | 6 (7.4%) | 0 (0.0%) |
| $5,000 to $7,499 | 6 (7.4%) | 0 (0.0%) |
| $7,500 to $9,999 | 0 (0.0%) | 0 (0.0%) |
| $10,000 to $12,499 | 7 (8.6%) | 0 (0.0%) |
| $12,500 to $14,999 | 0 (0.0%) | 0 (0.0%) |
| $15,000 to $17,499 | 0 (0.0%) | 13 (50.0%) |
| $17,500 to $19,999 | 0 (0.0%) | 1 (3.8%) |
| $20,000 to $22,499 | 0 (0.0%) | 0 (0.0%) |
| $22,500 to $24,999 | 2 (2.5%) | 0 (0.0%) |
| $25,000 to $29,999 | 0 (0.0%) | 2 (7.7%) |
| $30,000 to $34,999 | 4 (4.9%) | 0 (0.0%) |
| $35,000 to $39,999 | 15 (18.5%) | 3 (11.5%) |
| $40,000 to $44,999 | 4 (4.9%) | 5 (19.2%) |
| $45,000 to $49,999 | 14 (17.3%) | 0 (0.0%) |
| $50,000 to $54,999 | 6 (7.4%) | 2 (7.7%) |
| $55,000 to $64,999 | 12 (14.8%) | 0 (0.0%) |
| $65,000 to $74,999 | 0 (0.0%) | 0 (0.0%) |
| $75,000 to $99,999 | 2 (2.5%) | 0 (0.0%) |
| $100,000+ | 0 (0.0%) | 0 (0.0%) |
| Total | 81 (100.0%) | 26 (100.0%) |
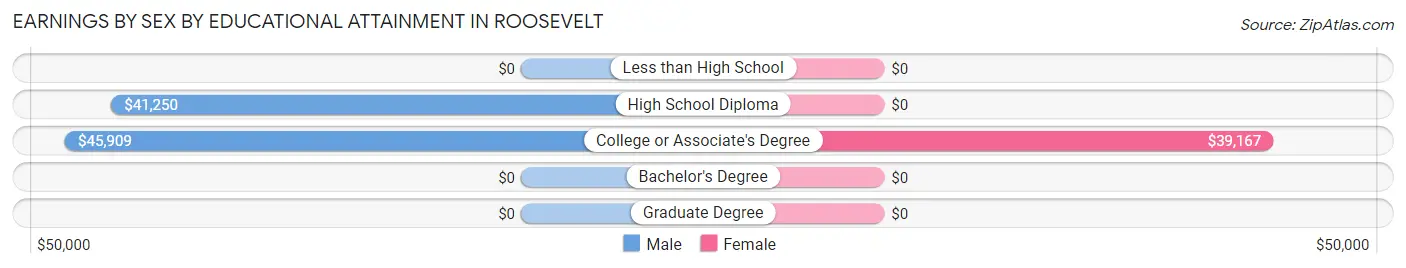
Earnings by Sex by Educational Attainment in Roosevelt
Average earnings in Roosevelt are $45,455 for men and $37,917 for women, a difference of 16.6%. Men with an educational attainment of college or associate's degree enjoy the highest average annual earnings of $45,909, while those with high school diploma education earn the least with $41,250. Women with an educational attainment of college or associate's degree earn the most with the average annual earnings of $39,167, while those with college or associate's degree education have the smallest earnings of $39,167.
| Educational Attainment | Male Income | Female Income |
| Less than High School | - | - |
| High School Diploma | $41,250 | $0 |
| College or Associate's Degree | $45,909 | $39,167 |
| Bachelor's Degree | - | - |
| Graduate Degree | - | - |
| Total | $45,455 | $37,917 |
Family Income in Roosevelt
Family Income Brackets in Roosevelt
According to the Roosevelt family income data, there are 29 families falling into the $50,000 to $74,999 income range, which is the most common income bracket and makes up 69.1% of all families.
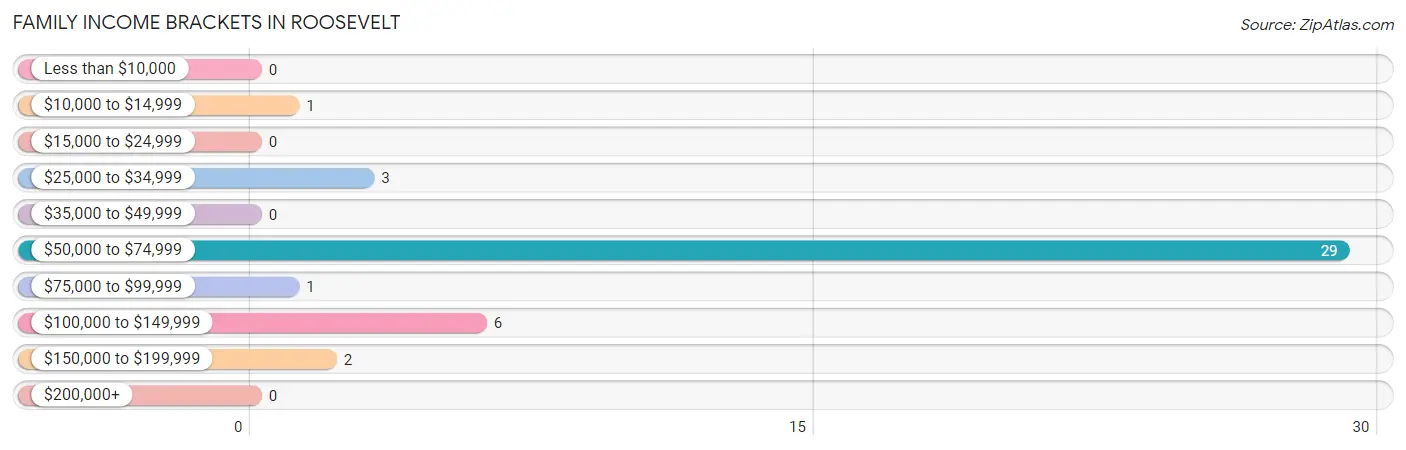
| Income Bracket | # Families | % Families |
| Less than $10,000 | 0 | 0.0% |
| $10,000 to $14,999 | 1 | 2.4% |
| $15,000 to $24,999 | 0 | 0.0% |
| $25,000 to $34,999 | 3 | 7.1% |
| $35,000 to $49,999 | 0 | 0.0% |
| $50,000 to $74,999 | 29 | 69.0% |
| $75,000 to $99,999 | 1 | 2.4% |
| $100,000 to $149,999 | 6 | 14.3% |
| $150,000 to $199,999 | 2 | 4.8% |
| $200,000+ | 0 | 0.0% |
Family Income by Famaliy Size in Roosevelt
2-person families (18 | 42.9%) account for the highest median family income in Roosevelt with $70,000 per family, while 2-person families (18 | 42.9%) have the highest median income of $35,000 per family member.
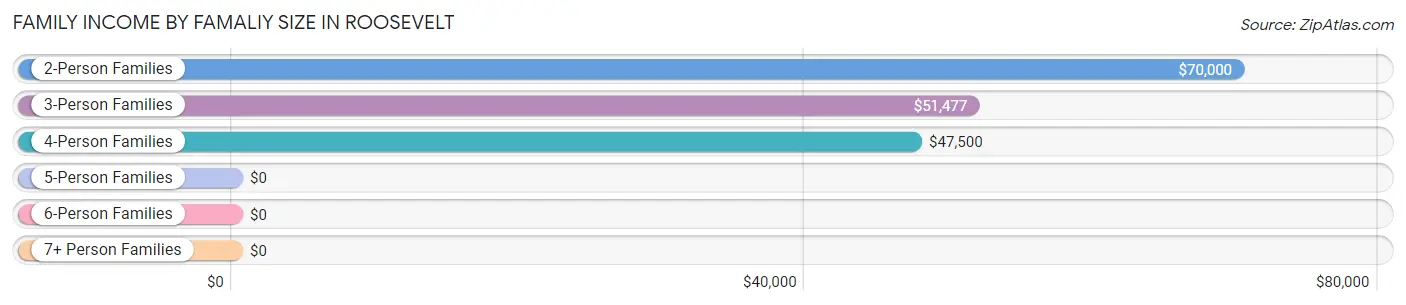
| Income Bracket | # Families | Median Income |
| 2-Person Families | 18 (42.9%) | $70,000 |
| 3-Person Families | 13 (30.9%) | $51,477 |
| 4-Person Families | 4 (9.5%) | $47,500 |
| 5-Person Families | 1 (2.4%) | $0 |
| 6-Person Families | 1 (2.4%) | $0 |
| 7+ Person Families | 5 (11.9%) | $0 |
| Total | 42 (100.0%) | $61,875 |
Family Income by Number of Earners in Roosevelt
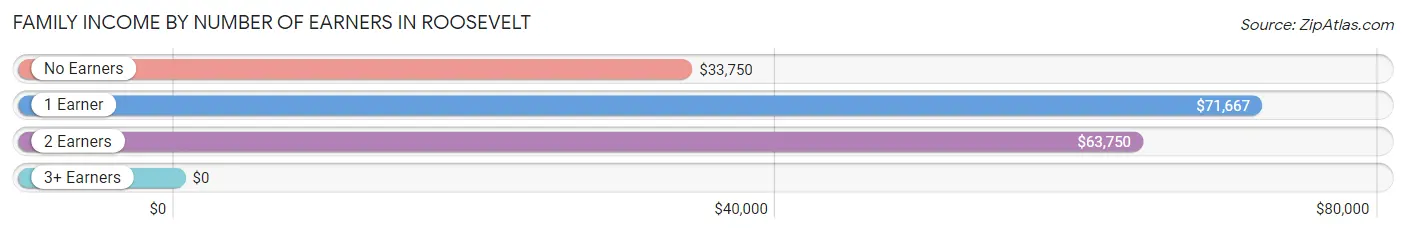
| Number of Earners | # Families | Median Income |
| No Earners | 4 (9.5%) | $33,750 |
| 1 Earner | 12 (28.6%) | $71,667 |
| 2 Earners | 13 (30.9%) | $63,750 |
| 3+ Earners | 13 (30.9%) | $0 |
| Total | 42 (100.0%) | $61,875 |
Household Income in Roosevelt
Household Income Brackets in Roosevelt
With 31 households falling in the category, the $50,000 to $74,999 income range is the most frequent in Roosevelt, accounting for 57.4% of all households.
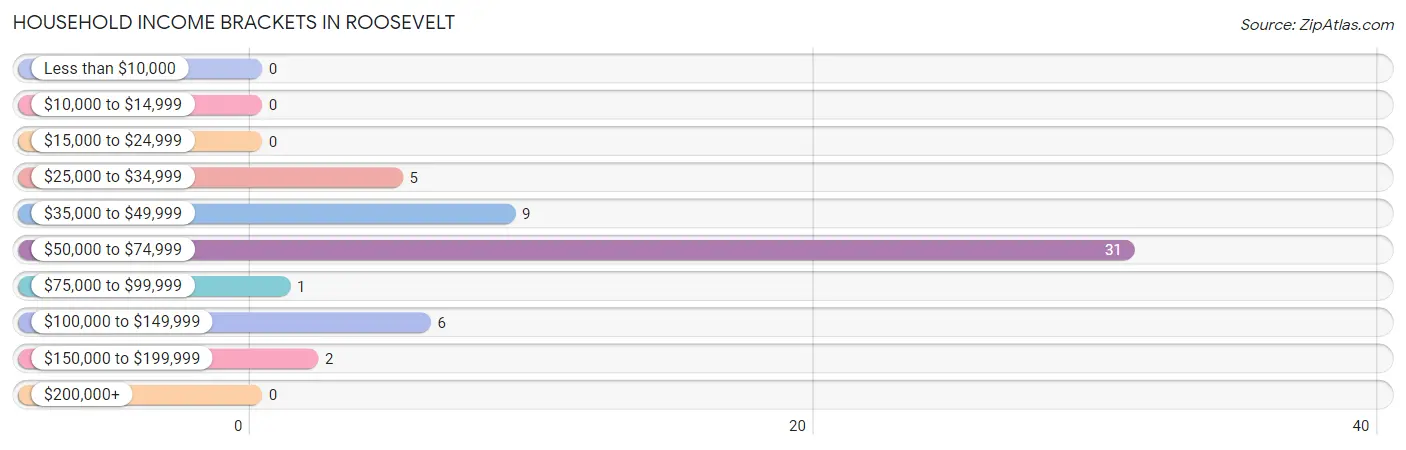
| Income Bracket | # Households | % Households |
| Less than $10,000 | 0 | 0.0% |
| $10,000 to $14,999 | 0 | 0.0% |
| $15,000 to $24,999 | 0 | 0.0% |
| $25,000 to $34,999 | 5 | 9.3% |
| $35,000 to $49,999 | 9 | 16.7% |
| $50,000 to $74,999 | 31 | 57.4% |
| $75,000 to $99,999 | 1 | 1.9% |
| $100,000 to $149,999 | 6 | 11.1% |
| $150,000 to $199,999 | 2 | 3.7% |
| $200,000+ | 0 | 0.0% |
Household Income by Householder Age in Roosevelt
The median household income in Roosevelt is $56,000, with the highest median household income of $62,750 found in the 25 to 44 years age bracket for the primary householder. A total of 9 households (16.7%) fall into this category. Meanwhile, the 15 to 24 years age bracket for the primary householder has the lowest median household income of $0, with 2 households (3.7%) in this group.
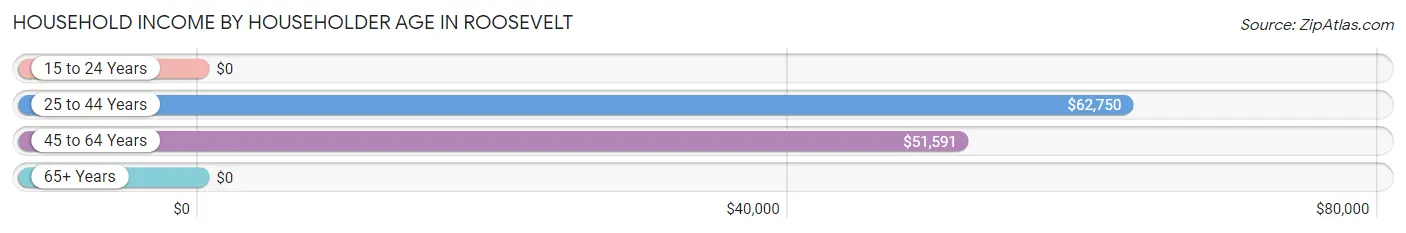
| Income Bracket | # Households | Median Income |
| 15 to 24 Years | 2 (3.7%) | $0 |
| 25 to 44 Years | 9 (16.7%) | $62,750 |
| 45 to 64 Years | 34 (63.0%) | $51,591 |
| 65+ Years | 9 (16.7%) | $0 |
| Total | 54 (100.0%) | $56,000 |
Poverty in Roosevelt
Income Below Poverty by Sex and Age in Roosevelt
With 10.4% poverty level for males and 1.5% for females among the residents of Roosevelt, 6 to 11 year old males and 45 to 54 year old females are the most vulnerable to poverty, with 1 males (100.0%) and 1 females (12.5%) in their respective age groups living below the poverty level.
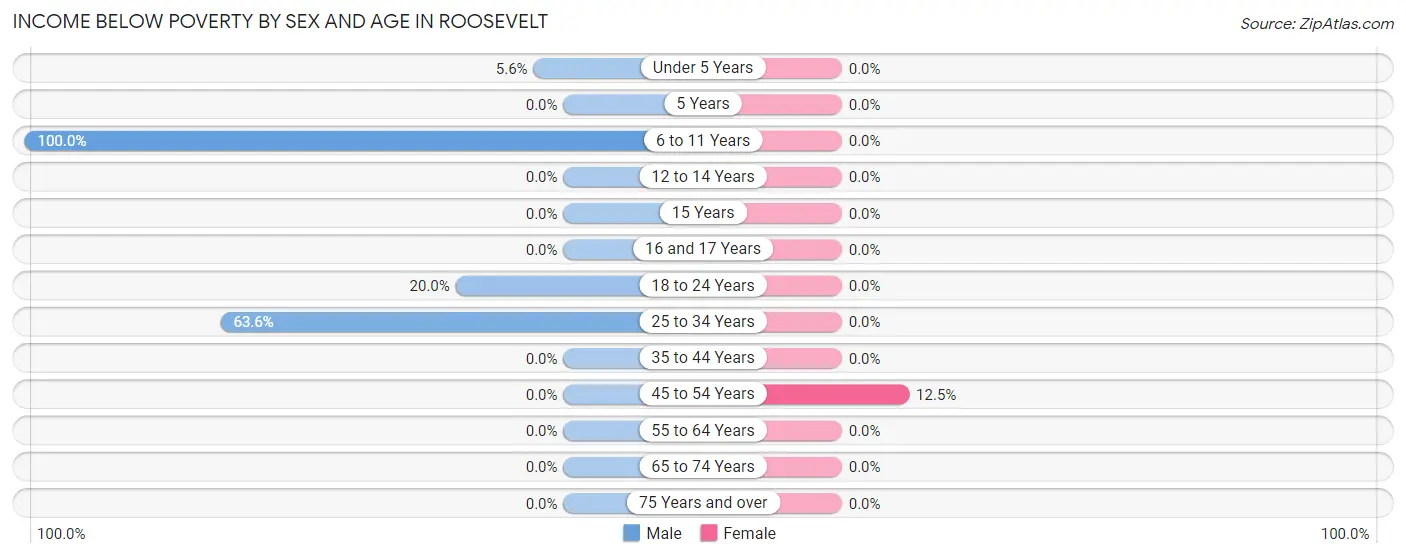
| Age Bracket | Male | Female |
| Under 5 Years | 1 (5.6%) | 0 (0.0%) |
| 5 Years | 0 (0.0%) | 0 (0.0%) |
| 6 to 11 Years | 1 (100.0%) | 0 (0.0%) |
| 12 to 14 Years | 0 (0.0%) | 0 (0.0%) |
| 15 Years | 0 (0.0%) | 0 (0.0%) |
| 16 and 17 Years | 0 (0.0%) | 0 (0.0%) |
| 18 to 24 Years | 2 (20.0%) | 0 (0.0%) |
| 25 to 34 Years | 7 (63.6%) | 0 (0.0%) |
| 35 to 44 Years | 0 (0.0%) | 0 (0.0%) |
| 45 to 54 Years | 0 (0.0%) | 1 (12.5%) |
| 55 to 64 Years | 0 (0.0%) | 0 (0.0%) |
| 65 to 74 Years | 0 (0.0%) | 0 (0.0%) |
| 75 Years and over | 0 (0.0%) | 0 (0.0%) |
| Total | 11 (10.4%) | 1 (1.5%) |
Income Above Poverty by Sex and Age in Roosevelt
According to the poverty statistics in Roosevelt, males aged 16 and 17 years and females aged 5 years are the age groups that are most secure financially, with 100.0% of males and 100.0% of females in these age groups living above the poverty line.
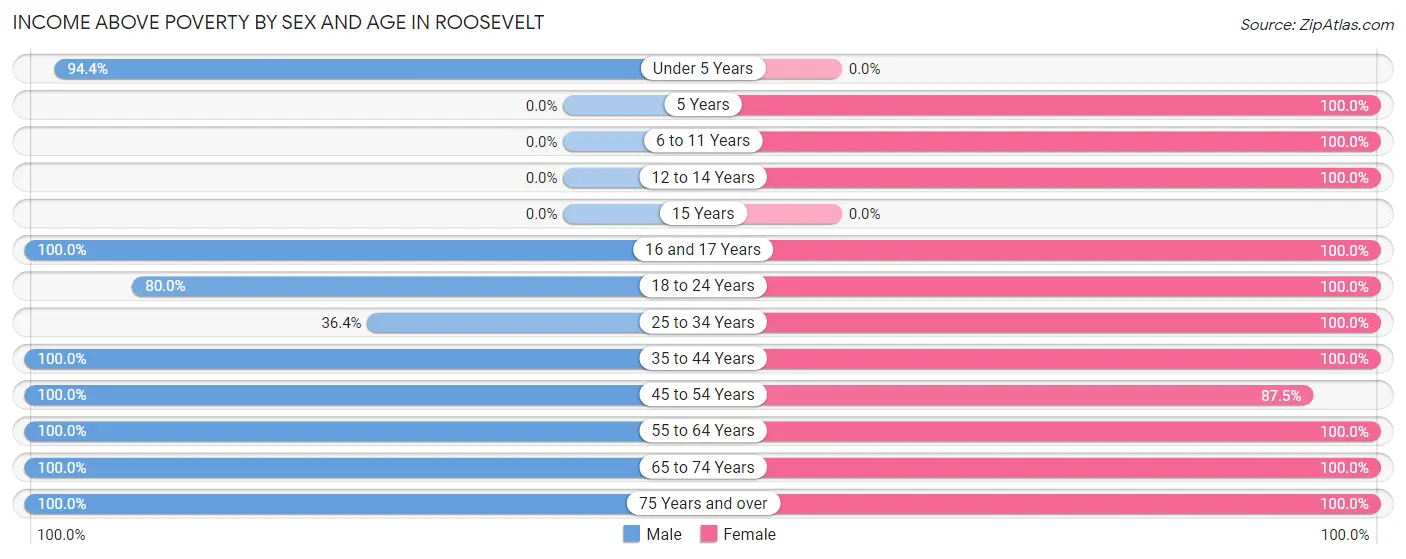
| Age Bracket | Male | Female |
| Under 5 Years | 17 (94.4%) | 0 (0.0%) |
| 5 Years | 0 (0.0%) | 1 (100.0%) |
| 6 to 11 Years | 0 (0.0%) | 11 (100.0%) |
| 12 to 14 Years | 0 (0.0%) | 7 (100.0%) |
| 15 Years | 0 (0.0%) | 0 (0.0%) |
| 16 and 17 Years | 9 (100.0%) | 9 (100.0%) |
| 18 to 24 Years | 8 (80.0%) | 2 (100.0%) |
| 25 to 34 Years | 4 (36.4%) | 6 (100.0%) |
| 35 to 44 Years | 11 (100.0%) | 5 (100.0%) |
| 45 to 54 Years | 7 (100.0%) | 7 (87.5%) |
| 55 to 64 Years | 31 (100.0%) | 13 (100.0%) |
| 65 to 74 Years | 6 (100.0%) | 3 (100.0%) |
| 75 Years and over | 2 (100.0%) | 4 (100.0%) |
| Total | 95 (89.6%) | 68 (98.6%) |
Income Below Poverty Among Married-Couple Families in Roosevelt
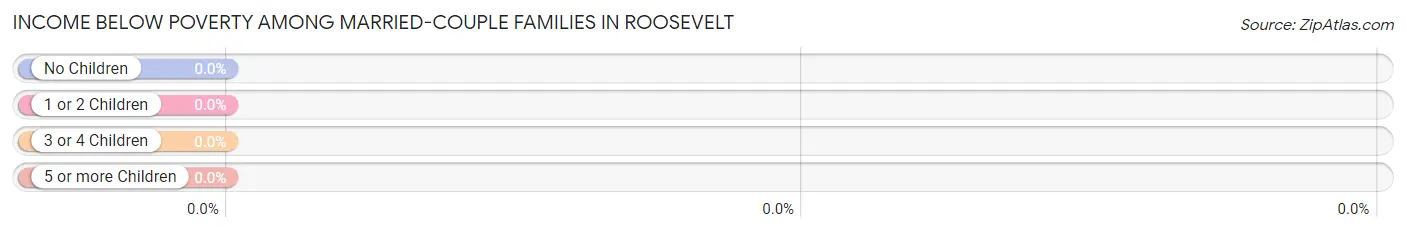
| Children | Above Poverty | Below Poverty |
| No Children | 18 (100.0%) | 0 (0.0%) |
| 1 or 2 Children | 1 (100.0%) | 0 (0.0%) |
| 3 or 4 Children | 1 (100.0%) | 0 (0.0%) |
| 5 or more Children | 0 (0.0%) | 0 (0.0%) |
| Total | 20 (100.0%) | 0 (0.0%) |
Income Below Poverty Among Single-Parent Households in Roosevelt
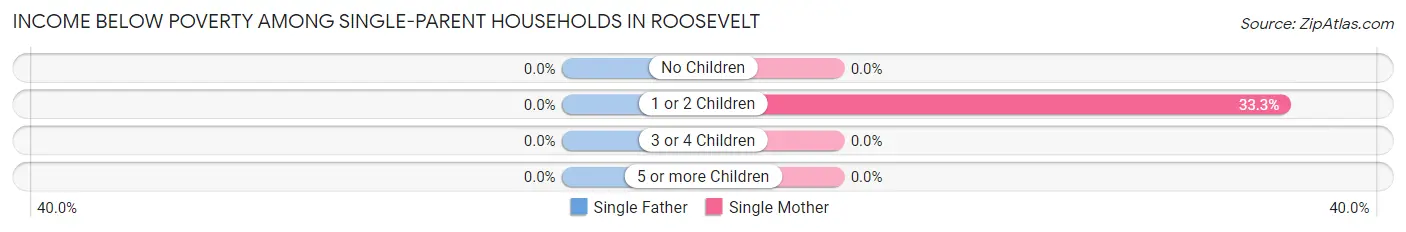
| Children | Single Father | Single Mother |
| No Children | 0 (0.0%) | 0 (0.0%) |
| 1 or 2 Children | 0 (0.0%) | 1 (33.3%) |
| 3 or 4 Children | 0 (0.0%) | 0 (0.0%) |
| 5 or more Children | 0 (0.0%) | 0 (0.0%) |
| Total | 0 (0.0%) | 1 (9.1%) |
Income Below Poverty Among Married-Couple vs Single-Parent Households in Roosevelt
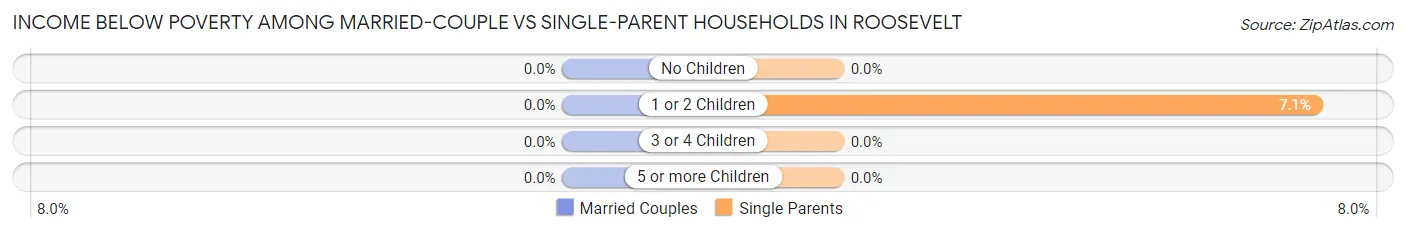
| Children | Married-Couple Families | Single-Parent Households |
| No Children | 0 (0.0%) | 0 (0.0%) |
| 1 or 2 Children | 0 (0.0%) | 1 (7.1%) |
| 3 or 4 Children | 0 (0.0%) | 0 (0.0%) |
| 5 or more Children | 0 (0.0%) | 0 (0.0%) |
| Total | 0 (0.0%) | 1 (4.5%) |
Race in Roosevelt
The most populous races in Roosevelt are White / Caucasian (151 | 86.3%), Two or more Races (17 | 9.7%), and Hispanic or Latino (9 | 5.1%).
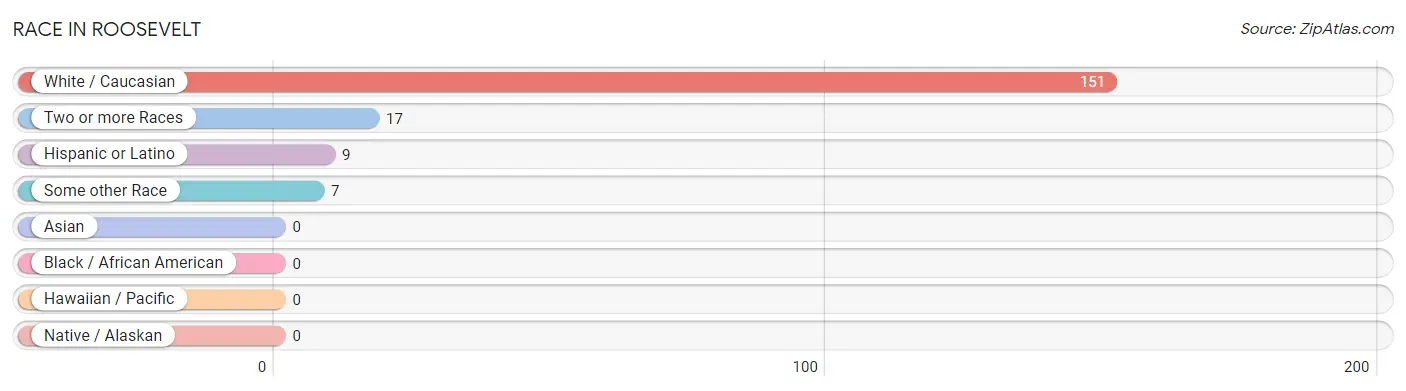
| Race | # Population | % Population |
| Asian | 0 | 0.0% |
| Black / African American | 0 | 0.0% |
| Hawaiian / Pacific | 0 | 0.0% |
| Hispanic or Latino | 9 | 5.1% |
| Native / Alaskan | 0 | 0.0% |
| White / Caucasian | 151 | 86.3% |
| Two or more Races | 17 | 9.7% |
| Some other Race | 7 | 4.0% |
| Total | 175 | 100.0% |
Ancestry in Roosevelt
The most populous ancestries reported in Roosevelt are German (56 | 32.0%), Swedish (13 | 7.4%), Dutch (9 | 5.1%), Mexican (9 | 5.1%), and Norwegian (8 | 4.6%), together accounting for 54.3% of all Roosevelt residents.
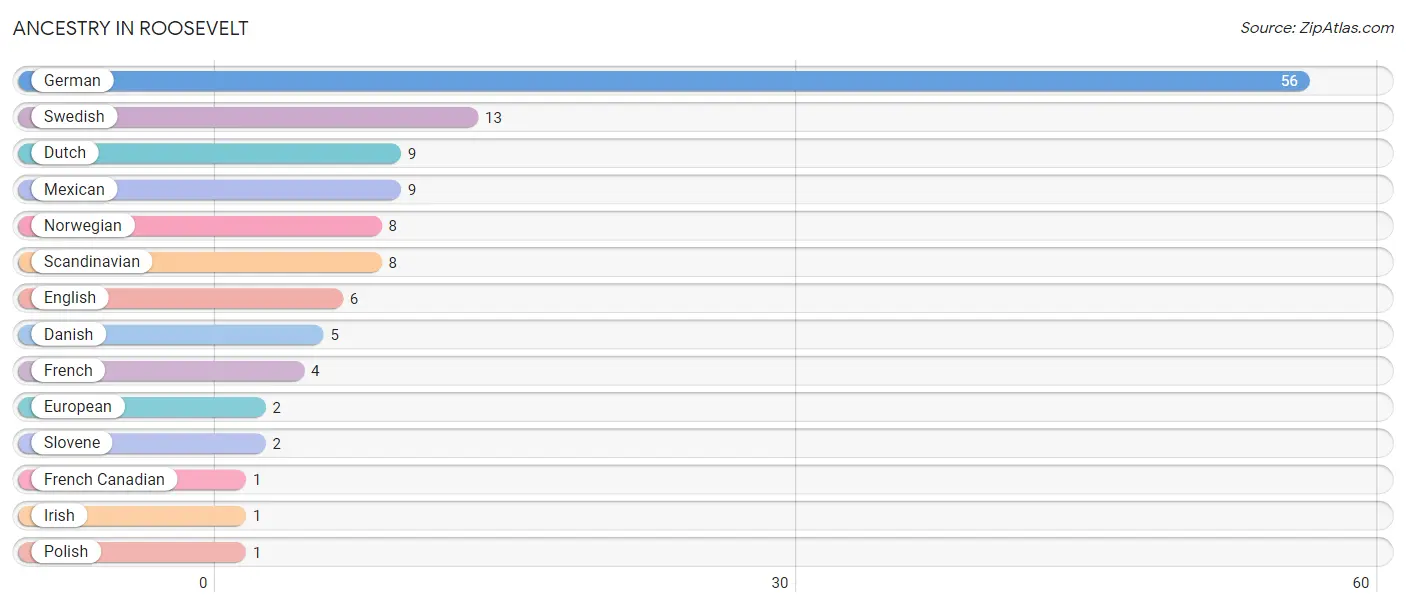
| Ancestry | # Population | % Population |
| Danish | 5 | 2.9% |
| Dutch | 9 | 5.1% |
| English | 6 | 3.4% |
| European | 2 | 1.1% |
| French | 4 | 2.3% |
| French Canadian | 1 | 0.6% |
| German | 56 | 32.0% |
| Irish | 1 | 0.6% |
| Mexican | 9 | 5.1% |
| Norwegian | 8 | 4.6% |
| Polish | 1 | 0.6% |
| Scandinavian | 8 | 4.6% |
| Slovene | 2 | 1.1% |
| Swedish | 13 | 7.4% | View All 14 Rows |
Immigrants in Roosevelt

| Immigration Origin | # Population | % Population | View All 0 Rows |
Sex and Age in Roosevelt
Sex and Age in Roosevelt
The most populous age groups in Roosevelt are 55 to 59 Years (23 | 21.7%) for men and 5 to 9 Years (12 | 17.4%) for women.
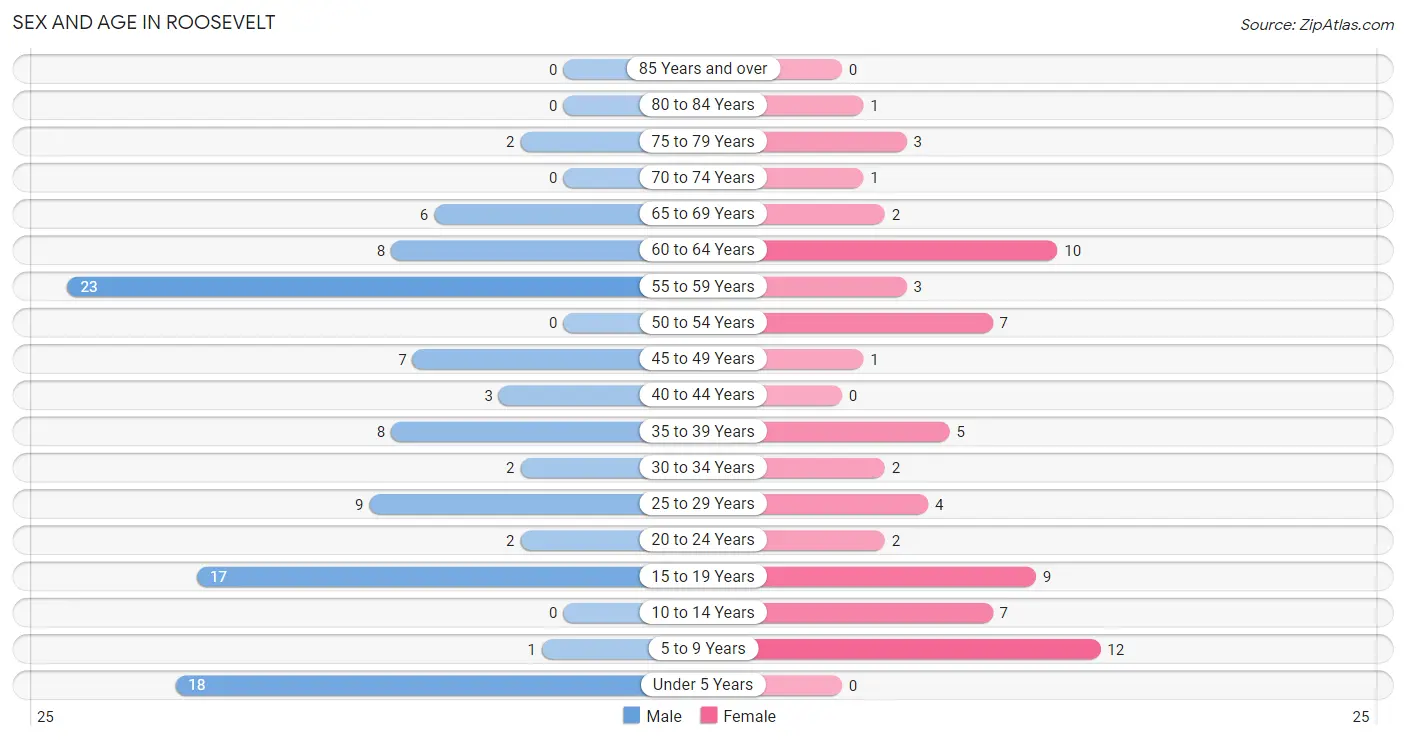
| Age Bracket | Male | Female |
| Under 5 Years | 18 (17.0%) | 0 (0.0%) |
| 5 to 9 Years | 1 (0.9%) | 12 (17.4%) |
| 10 to 14 Years | 0 (0.0%) | 7 (10.1%) |
| 15 to 19 Years | 17 (16.0%) | 9 (13.0%) |
| 20 to 24 Years | 2 (1.9%) | 2 (2.9%) |
| 25 to 29 Years | 9 (8.5%) | 4 (5.8%) |
| 30 to 34 Years | 2 (1.9%) | 2 (2.9%) |
| 35 to 39 Years | 8 (7.5%) | 5 (7.2%) |
| 40 to 44 Years | 3 (2.8%) | 0 (0.0%) |
| 45 to 49 Years | 7 (6.6%) | 1 (1.5%) |
| 50 to 54 Years | 0 (0.0%) | 7 (10.1%) |
| 55 to 59 Years | 23 (21.7%) | 3 (4.3%) |
| 60 to 64 Years | 8 (7.5%) | 10 (14.5%) |
| 65 to 69 Years | 6 (5.7%) | 2 (2.9%) |
| 70 to 74 Years | 0 (0.0%) | 1 (1.5%) |
| 75 to 79 Years | 2 (1.9%) | 3 (4.3%) |
| 80 to 84 Years | 0 (0.0%) | 1 (1.5%) |
| 85 Years and over | 0 (0.0%) | 0 (0.0%) |
| Total | 106 (100.0%) | 69 (100.0%) |
Families and Households in Roosevelt
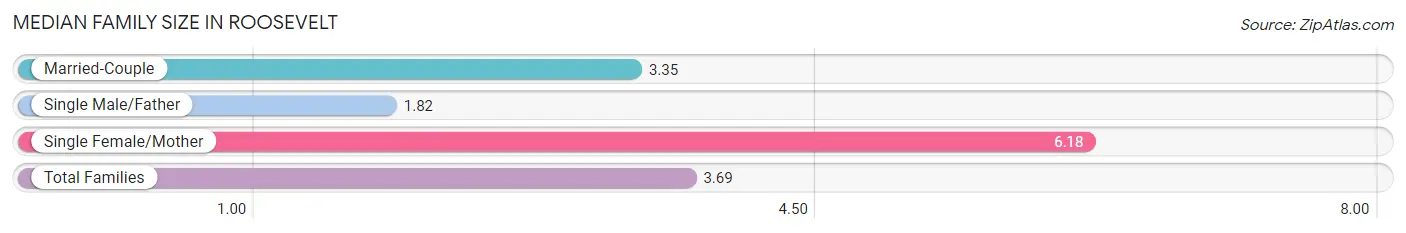
Median Family Size in Roosevelt
The median family size in Roosevelt is 3.69 persons per family, with single female/mother families (11 | 26.2%) accounting for the largest median family size of 6.18 persons per family. On the other hand, single male/father families (11 | 26.2%) represent the smallest median family size with 1.82 persons per family.
| Family Type | # Families | Family Size |
| Married-Couple | 20 (47.6%) | 3.35 |
| Single Male/Father | 11 (26.2%) | 1.82 |
| Single Female/Mother | 11 (26.2%) | 6.18 |
| Total Families | 42 (100.0%) | 3.69 |
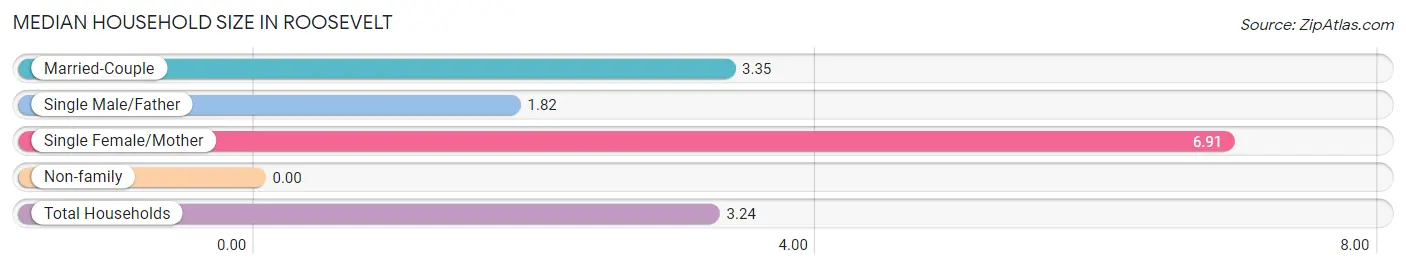
Median Household Size in Roosevelt
| Household Type | # Households | Household Size |
| Married-Couple | 20 (37.0%) | 3.35 |
| Single Male/Father | 11 (20.4%) | 1.82 |
| Single Female/Mother | 11 (20.4%) | 6.91 |
| Non-family | 12 (22.2%) | - |
| Total Households | 54 (100.0%) | 3.24 |
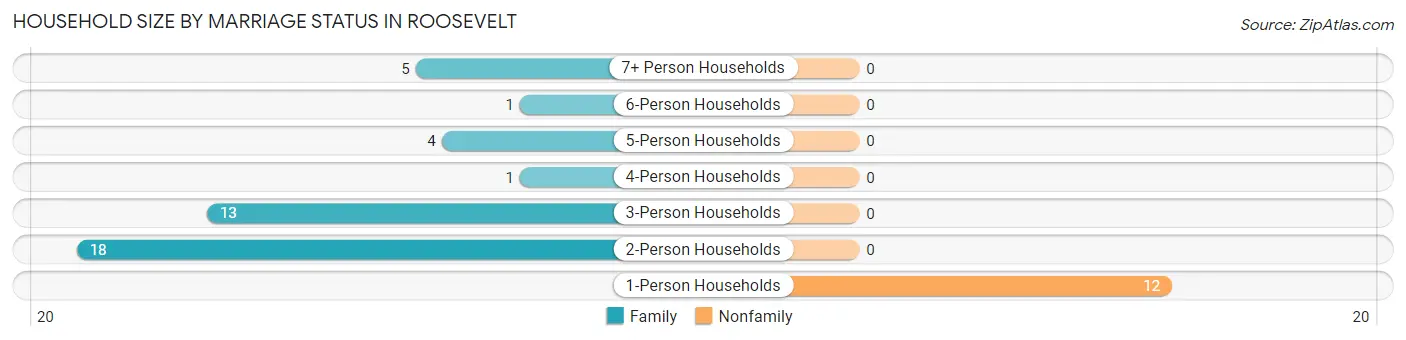
Household Size by Marriage Status in Roosevelt
Out of a total of 54 households in Roosevelt, 42 (77.8%) are family households, while 12 (22.2%) are nonfamily households. The most numerous type of family households are 2-person households, comprising 18, and the most common type of nonfamily households are 1-person households, comprising 12.
| Household Size | Family Households | Nonfamily Households |
| 1-Person Households | - | 12 (22.2%) |
| 2-Person Households | 18 (33.3%) | 0 (0.0%) |
| 3-Person Households | 13 (24.1%) | 0 (0.0%) |
| 4-Person Households | 1 (1.8%) | 0 (0.0%) |
| 5-Person Households | 4 (7.4%) | 0 (0.0%) |
| 6-Person Households | 1 (1.8%) | 0 (0.0%) |
| 7+ Person Households | 5 (9.3%) | 0 (0.0%) |
| Total | 42 (77.8%) | 12 (22.2%) |
Female Fertility in Roosevelt
Fertility by Age in Roosevelt
Average fertility rate in Roosevelt is 240.0 births per 1,000 women. Women in the age bracket of 35 to 50 years have the highest fertility rate with 625.0 births per 1,000 women. Women in the age bracket of 35 to 50 years acount for 83.3% of all women with births.
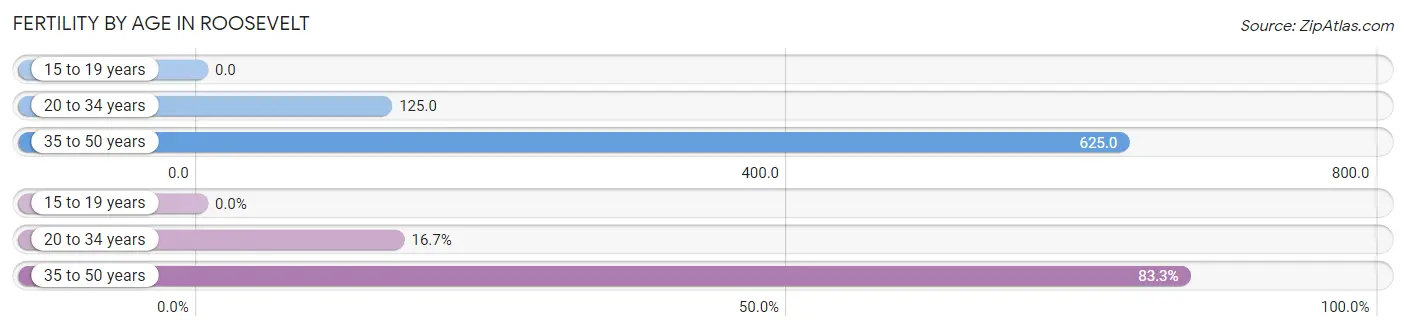
| Age Bracket | Women with Births | Births / 1,000 Women |
| 15 to 19 years | 0 (0.0%) | 0.0 |
| 20 to 34 years | 1 (16.7%) | 125.0 |
| 35 to 50 years | 5 (83.3%) | 625.0 |
| Total | 6 (100.0%) | 240.0 |
Fertility by Age by Marriage Status in Roosevelt
16.7% of women with births (6) in Roosevelt are married. The highest percentage of unmarried women with births falls into 35 to 50 years age bracket with 100.0% of them unmarried at the time of birth, while the lowest percentage of unmarried women with births belong to 20 to 34 years age bracket with 0.0% of them unmarried.
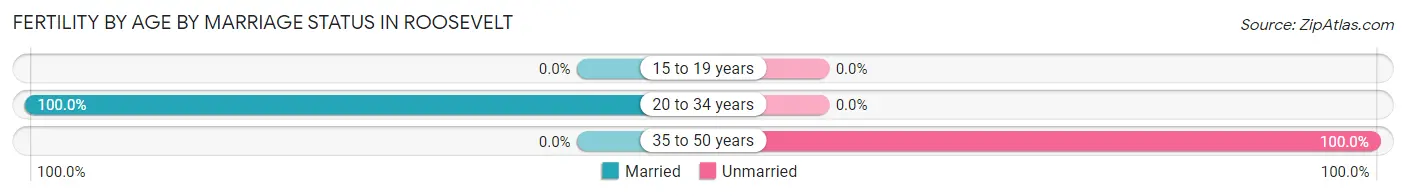
| Age Bracket | Married | Unmarried |
| 15 to 19 years | 0 (0.0%) | 0 (0.0%) |
| 20 to 34 years | 1 (100.0%) | 0 (0.0%) |
| 35 to 50 years | 0 (0.0%) | 5 (100.0%) |
| Total | 1 (16.7%) | 5 (83.3%) |
Fertility by Education in Roosevelt
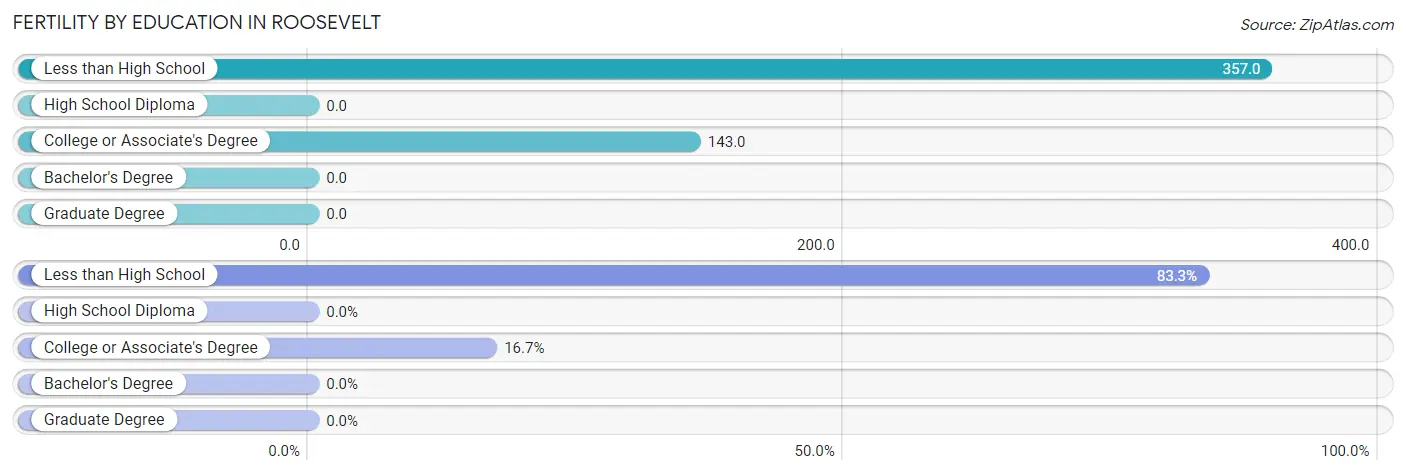
| Educational Attainment | Women with Births | Births / 1,000 Women |
| Less than High School | 5 (83.3%) | 357.0 |
| High School Diploma | 0 (0.0%) | 0.0 |
| College or Associate's Degree | 1 (16.7%) | 143.0 |
| Bachelor's Degree | 0 (0.0%) | 0.0 |
| Graduate Degree | 0 (0.0%) | 0.0 |
| Total | 6 (100.0%) | 240.0 |
Fertility by Education by Marriage Status in Roosevelt
83.3% of women with births in Roosevelt are unmarried. Women with the educational attainment of college or associate's degree are most likely to be married with 100.0% of them married at childbirth, while women with the educational attainment of less than high school are least likely to be married with 100.0% of them unmarried at childbirth.
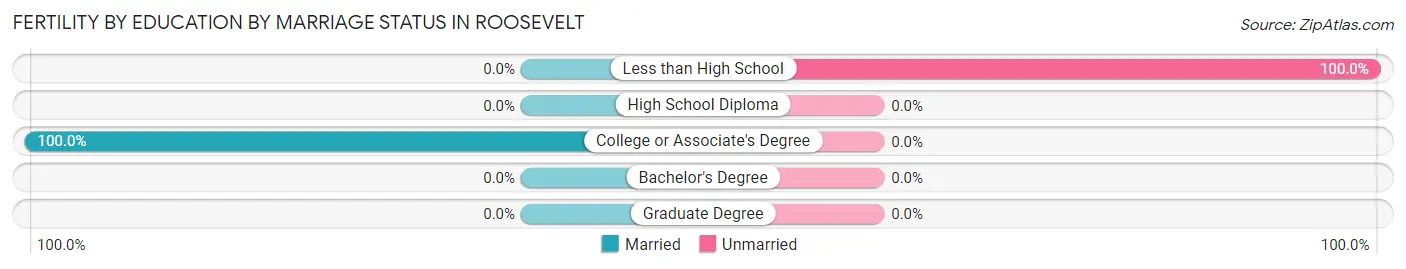
| Educational Attainment | Married | Unmarried |
| Less than High School | 0 (0.0%) | 5 (100.0%) |
| High School Diploma | 0 (0.0%) | 0 (0.0%) |
| College or Associate's Degree | 1 (100.0%) | 0 (0.0%) |
| Bachelor's Degree | 0 (0.0%) | 0 (0.0%) |
| Graduate Degree | 0 (0.0%) | 0 (0.0%) |
| Total | 1 (16.7%) | 5 (83.3%) |
Employment Characteristics in Roosevelt
Employment by Class of Employer in Roosevelt
Among the 100 employed individuals in Roosevelt, private company employees (73 | 73.0%), not-for-profit organizations (14 | 14.0%), and local government employees (7 | 7.0%) make up the most common classes of employment.
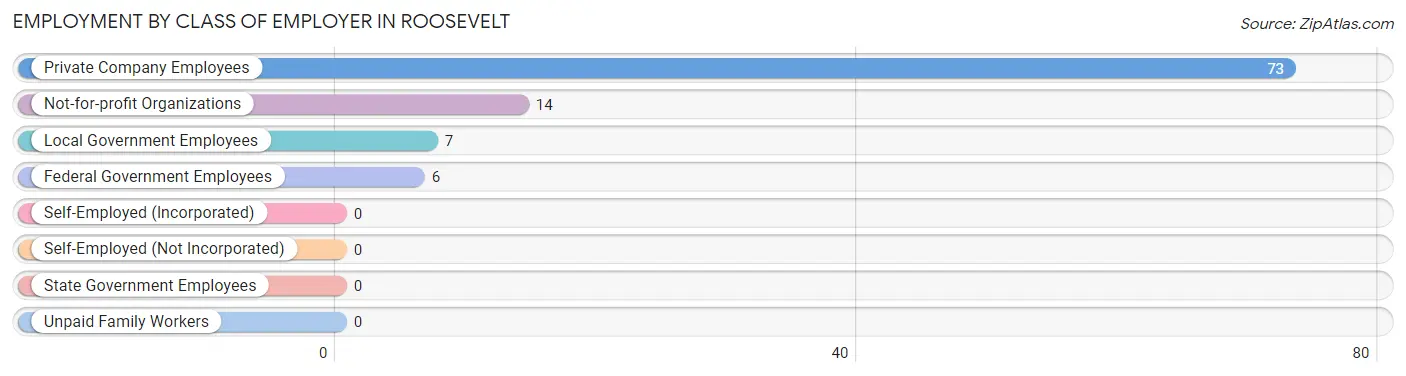
| Employer Class | # Employees | % Employees |
| Private Company Employees | 73 | 73.0% |
| Self-Employed (Incorporated) | 0 | 0.0% |
| Self-Employed (Not Incorporated) | 0 | 0.0% |
| Not-for-profit Organizations | 14 | 14.0% |
| Local Government Employees | 7 | 7.0% |
| State Government Employees | 0 | 0.0% |
| Federal Government Employees | 6 | 6.0% |
| Unpaid Family Workers | 0 | 0.0% |
| Total | 100 | 100.0% |
Employment Status by Age in Roosevelt
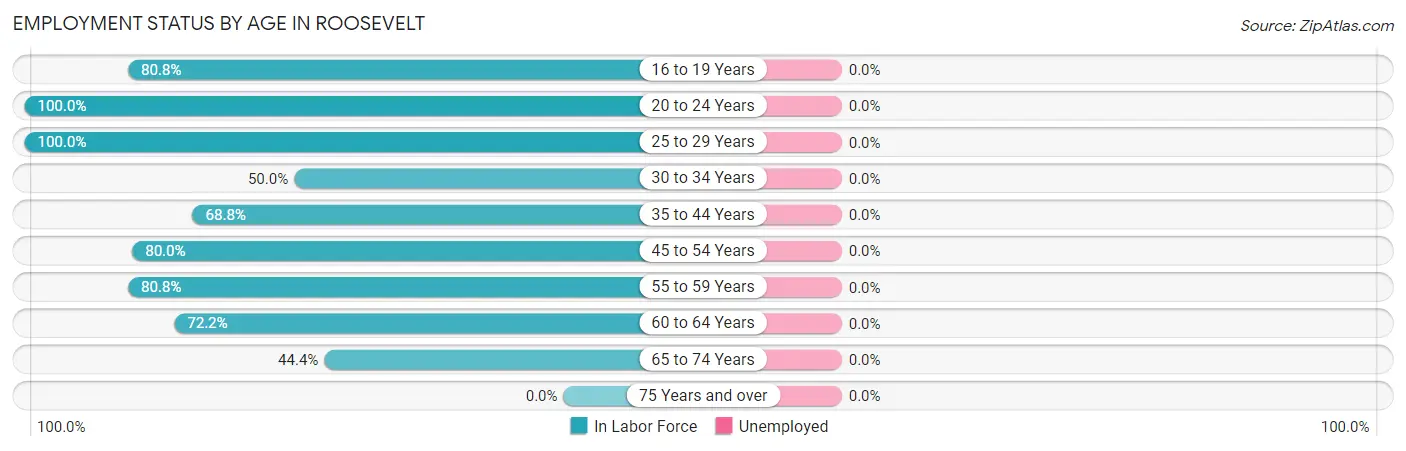
| Age Bracket | In Labor Force | Unemployed |
| 16 to 19 Years | 21 (80.8%) | 0 (0.0%) |
| 20 to 24 Years | 4 (100.0%) | 0 (0.0%) |
| 25 to 29 Years | 13 (100.0%) | 0 (0.0%) |
| 30 to 34 Years | 2 (50.0%) | 0 (0.0%) |
| 35 to 44 Years | 11 (68.8%) | 0 (0.0%) |
| 45 to 54 Years | 12 (80.0%) | 0 (0.0%) |
| 55 to 59 Years | 21 (80.8%) | 0 (0.0%) |
| 60 to 64 Years | 13 (72.2%) | 0 (0.0%) |
| 65 to 74 Years | 4 (44.4%) | 0 (0.0%) |
| 75 Years and over | 0 (0.0%) | 0 (0.0%) |
| Total | 101 (73.7%) | 0 (0.0%) |
Employment Status by Educational Attainment in Roosevelt
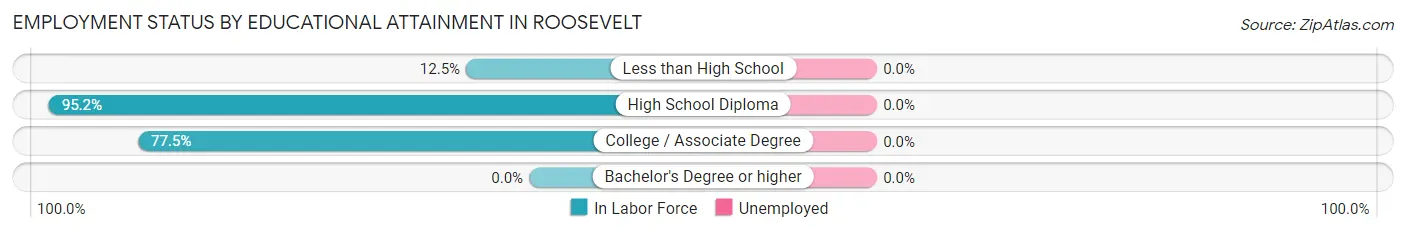
| Educational Attainment | In Labor Force | Unemployed |
| Less than High School | 1 (12.5%) | 0 (0.0%) |
| High School Diploma | 40 (95.2%) | 0 (0.0%) |
| College / Associate Degree | 31 (77.5%) | 0 (0.0%) |
| Bachelor's Degree or higher | 0 (0.0%) | 0 (0.0%) |
| Total | 72 (78.3%) | 0 (0.0%) |
Employment Occupations by Sex in Roosevelt
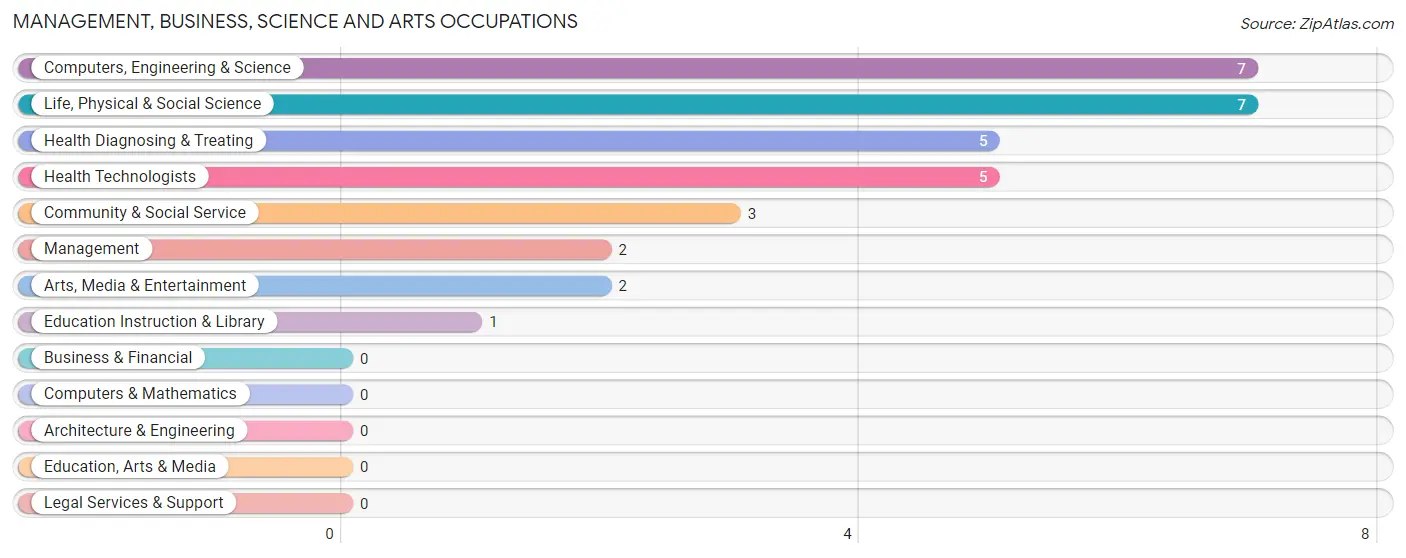
Management, Business, Science and Arts Occupations
The most common Management, Business, Science and Arts occupations in Roosevelt are Computers, Engineering & Science (7 | 6.9%), Life, Physical & Social Science (7 | 6.9%), Health Diagnosing & Treating (5 | 5.0%), Health Technologists (5 | 5.0%), and Community & Social Service (3 | 3.0%).
Management, Business, Science and Arts Occupations by Sex
Within the Management, Business, Science and Arts occupations in Roosevelt, the most male-oriented occupations are Management (100.0%), Computers, Engineering & Science (100.0%), and Life, Physical & Social Science (100.0%), while the most female-oriented occupations are Education Instruction & Library (100.0%), Health Diagnosing & Treating (100.0%), and Health Technologists (100.0%).
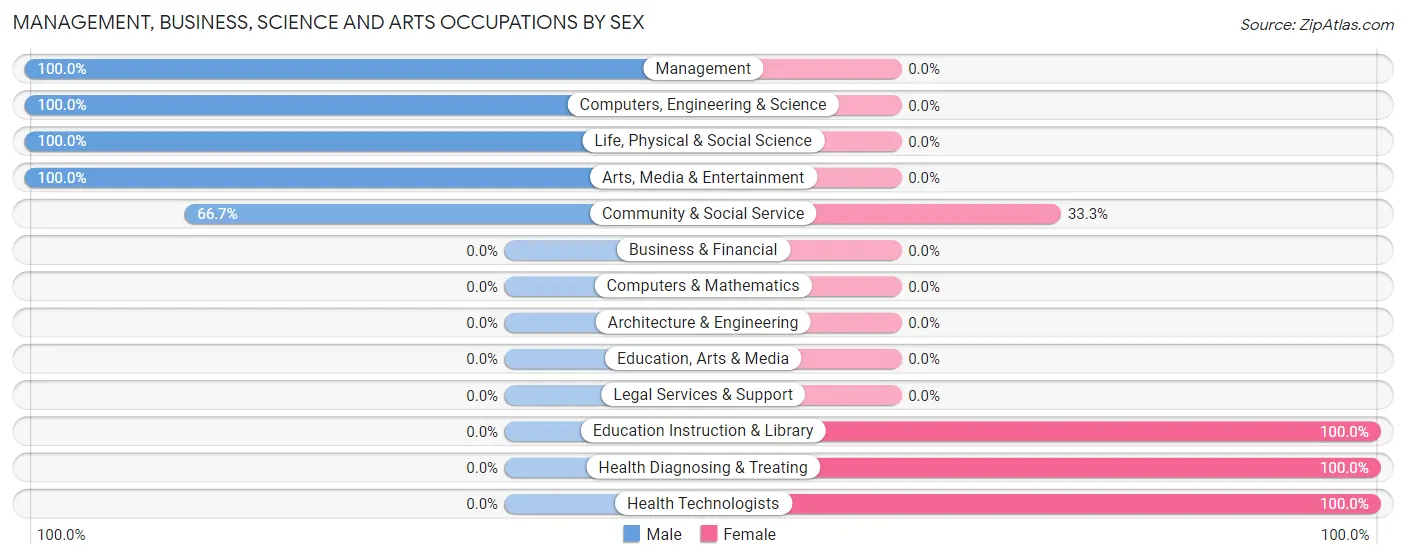
| Occupation | Male | Female |
| Management | 2 (100.0%) | 0 (0.0%) |
| Business & Financial | 0 (0.0%) | 0 (0.0%) |
| Computers, Engineering & Science | 7 (100.0%) | 0 (0.0%) |
| Computers & Mathematics | 0 (0.0%) | 0 (0.0%) |
| Architecture & Engineering | 0 (0.0%) | 0 (0.0%) |
| Life, Physical & Social Science | 7 (100.0%) | 0 (0.0%) |
| Community & Social Service | 2 (66.7%) | 1 (33.3%) |
| Education, Arts & Media | 0 (0.0%) | 0 (0.0%) |
| Legal Services & Support | 0 (0.0%) | 0 (0.0%) |
| Education Instruction & Library | 0 (0.0%) | 1 (100.0%) |
| Arts, Media & Entertainment | 2 (100.0%) | 0 (0.0%) |
| Health Diagnosing & Treating | 0 (0.0%) | 5 (100.0%) |
| Health Technologists | 0 (0.0%) | 5 (100.0%) |
| Total (Category) | 11 (64.7%) | 6 (35.3%) |
| Total (Overall) | 75 (74.3%) | 26 (25.7%) |
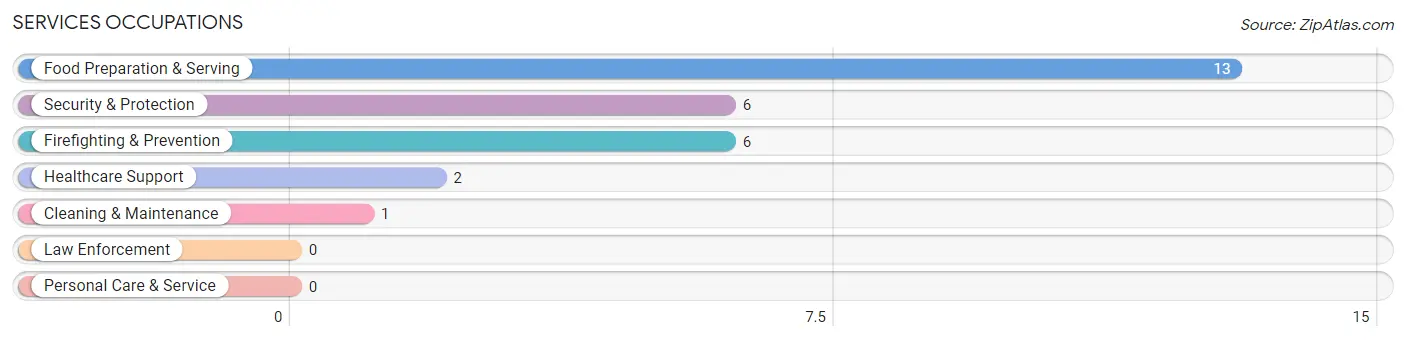
Services Occupations
The most common Services occupations in Roosevelt are Food Preparation & Serving (13 | 12.9%), Security & Protection (6 | 5.9%), Firefighting & Prevention (6 | 5.9%), Healthcare Support (2 | 2.0%), and Cleaning & Maintenance (1 | 1.0%).
Services Occupations by Sex
Within the Services occupations in Roosevelt, the most male-oriented occupations are Security & Protection (100.0%), Firefighting & Prevention (100.0%), and Cleaning & Maintenance (100.0%), while the most female-oriented occupations are Healthcare Support (100.0%), and Food Preparation & Serving (69.2%).
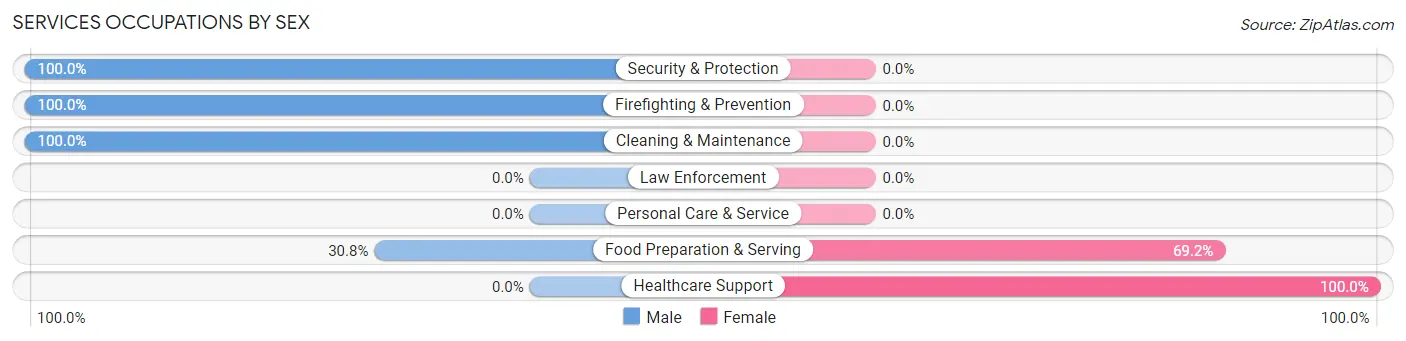
| Occupation | Male | Female |
| Healthcare Support | 0 (0.0%) | 2 (100.0%) |
| Security & Protection | 6 (100.0%) | 0 (0.0%) |
| Firefighting & Prevention | 6 (100.0%) | 0 (0.0%) |
| Law Enforcement | 0 (0.0%) | 0 (0.0%) |
| Food Preparation & Serving | 4 (30.8%) | 9 (69.2%) |
| Cleaning & Maintenance | 1 (100.0%) | 0 (0.0%) |
| Personal Care & Service | 0 (0.0%) | 0 (0.0%) |
| Total (Category) | 11 (50.0%) | 11 (50.0%) |
| Total (Overall) | 75 (74.3%) | 26 (25.7%) |
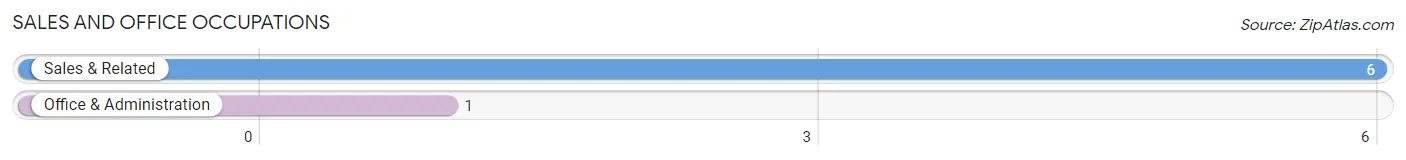
Sales and Office Occupations
The most common Sales and Office occupations in Roosevelt are Sales & Related (6 | 5.9%), and Office & Administration (1 | 1.0%).
Sales and Office Occupations by Sex
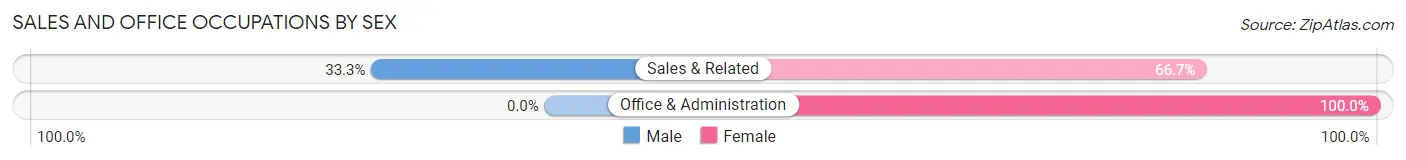
| Occupation | Male | Female |
| Sales & Related | 2 (33.3%) | 4 (66.7%) |
| Office & Administration | 0 (0.0%) | 1 (100.0%) |
| Total (Category) | 2 (28.6%) | 5 (71.4%) |
| Total (Overall) | 75 (74.3%) | 26 (25.7%) |
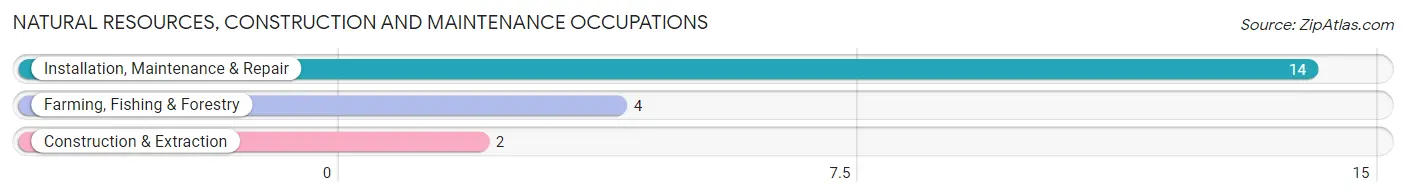
Natural Resources, Construction and Maintenance Occupations
The most common Natural Resources, Construction and Maintenance occupations in Roosevelt are Installation, Maintenance & Repair (14 | 13.9%), Farming, Fishing & Forestry (4 | 4.0%), and Construction & Extraction (2 | 2.0%).
Natural Resources, Construction and Maintenance Occupations by Sex
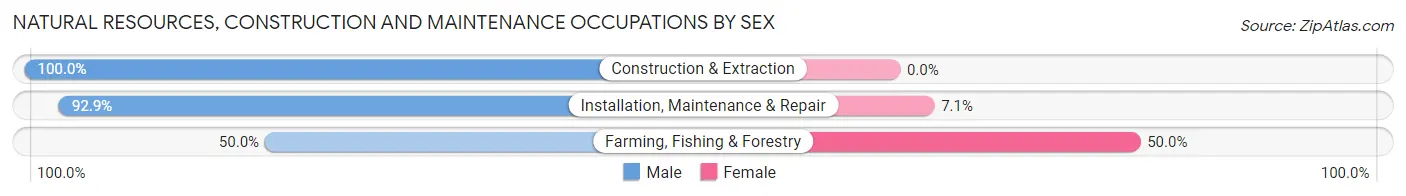
| Occupation | Male | Female |
| Farming, Fishing & Forestry | 2 (50.0%) | 2 (50.0%) |
| Construction & Extraction | 2 (100.0%) | 0 (0.0%) |
| Installation, Maintenance & Repair | 13 (92.9%) | 1 (7.1%) |
| Total (Category) | 17 (85.0%) | 3 (15.0%) |
| Total (Overall) | 75 (74.3%) | 26 (25.7%) |
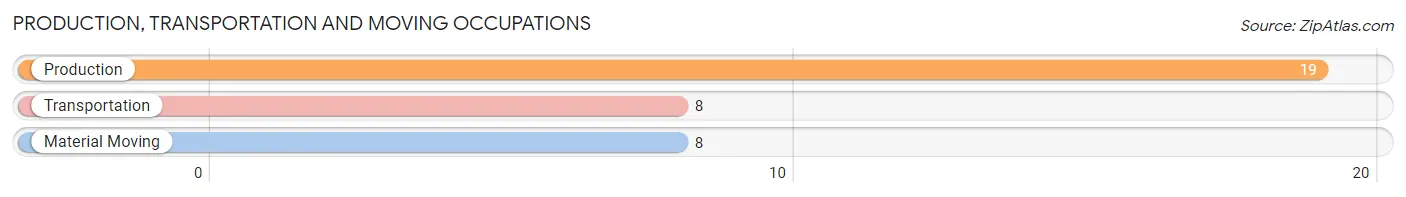
Production, Transportation and Moving Occupations
The most common Production, Transportation and Moving occupations in Roosevelt are Production (19 | 18.8%), Transportation (8 | 7.9%), and Material Moving (8 | 7.9%).
Production, Transportation and Moving Occupations by Sex
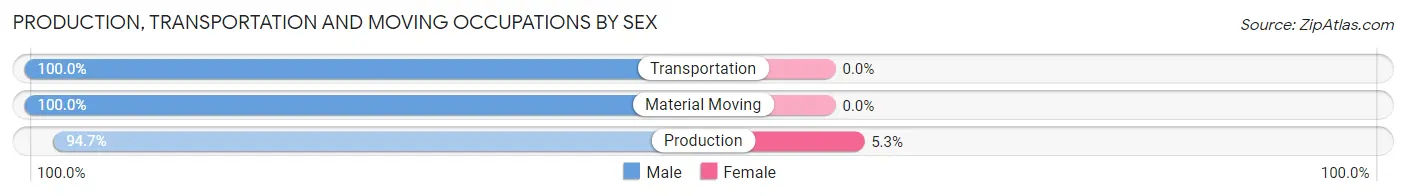
| Occupation | Male | Female |
| Production | 18 (94.7%) | 1 (5.3%) |
| Transportation | 8 (100.0%) | 0 (0.0%) |
| Material Moving | 8 (100.0%) | 0 (0.0%) |
| Total (Category) | 34 (97.1%) | 1 (2.9%) |
| Total (Overall) | 75 (74.3%) | 26 (25.7%) |
Employment Industries by Sex in Roosevelt
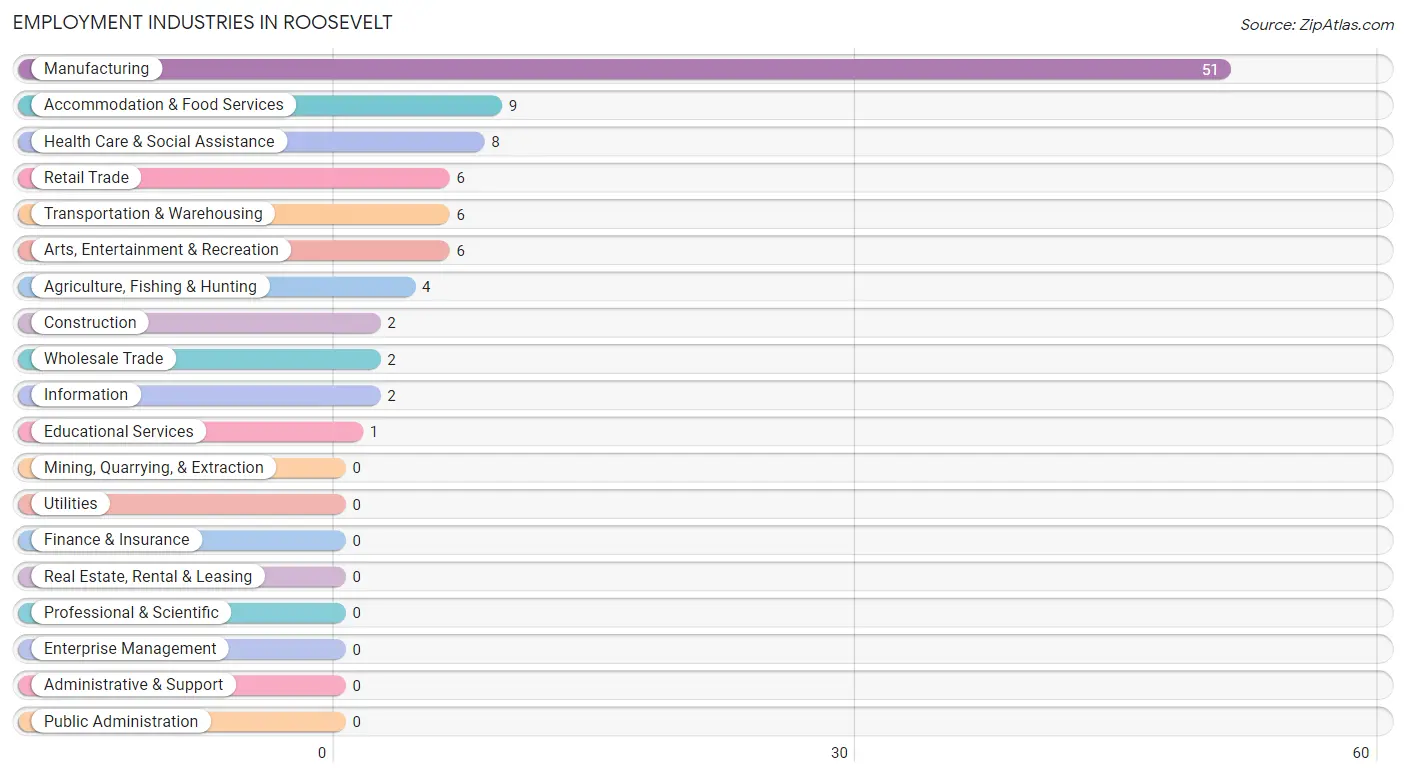
Employment Industries in Roosevelt
The major employment industries in Roosevelt include Manufacturing (51 | 50.5%), Accommodation & Food Services (9 | 8.9%), Health Care & Social Assistance (8 | 7.9%), Retail Trade (6 | 5.9%), and Transportation & Warehousing (6 | 5.9%).
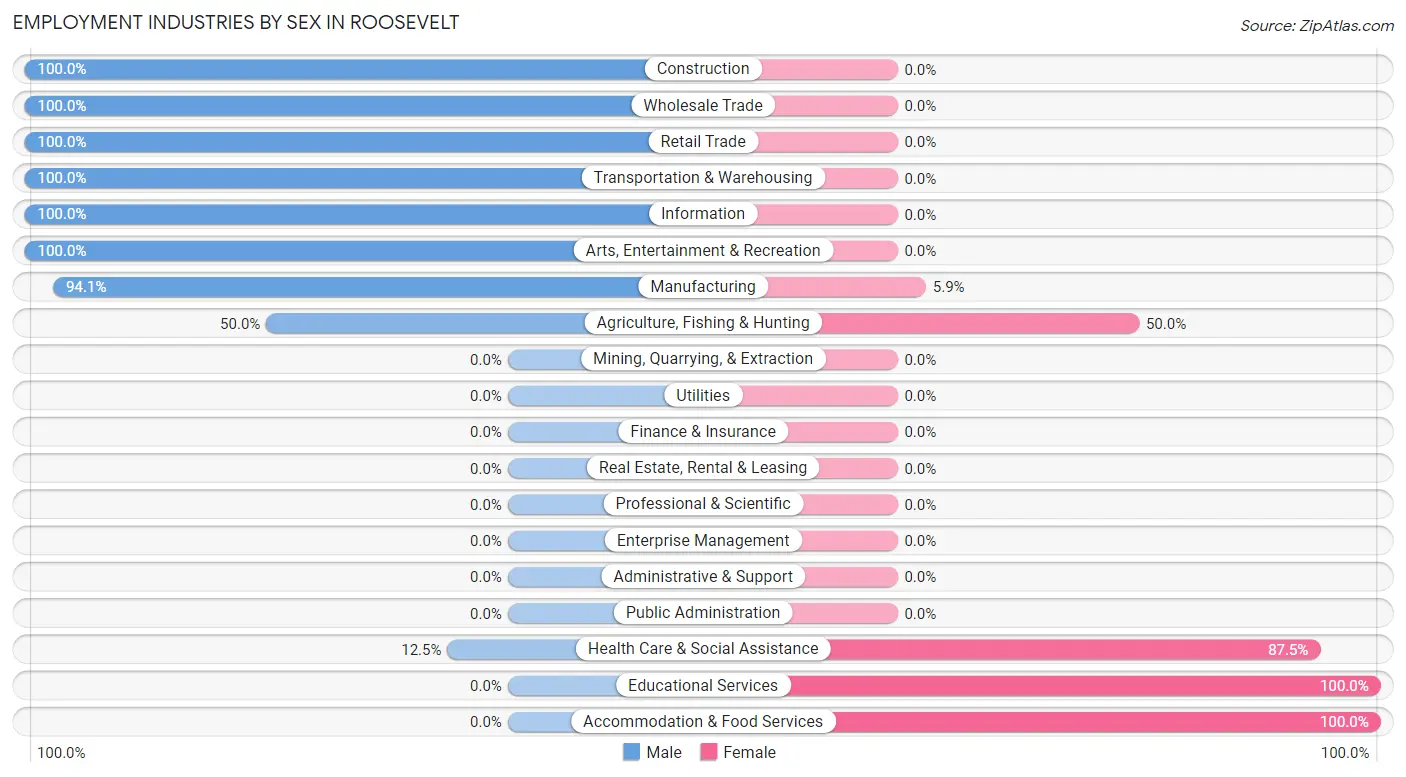
Employment Industries by Sex in Roosevelt
The Roosevelt industries that see more men than women are Construction (100.0%), Wholesale Trade (100.0%), and Retail Trade (100.0%), whereas the industries that tend to have a higher number of women are Educational Services (100.0%), Accommodation & Food Services (100.0%), and Health Care & Social Assistance (87.5%).
| Industry | Male | Female |
| Agriculture, Fishing & Hunting | 2 (50.0%) | 2 (50.0%) |
| Mining, Quarrying, & Extraction | 0 (0.0%) | 0 (0.0%) |
| Construction | 2 (100.0%) | 0 (0.0%) |
| Manufacturing | 48 (94.1%) | 3 (5.9%) |
| Wholesale Trade | 2 (100.0%) | 0 (0.0%) |
| Retail Trade | 6 (100.0%) | 0 (0.0%) |
| Transportation & Warehousing | 6 (100.0%) | 0 (0.0%) |
| Utilities | 0 (0.0%) | 0 (0.0%) |
| Information | 2 (100.0%) | 0 (0.0%) |
| Finance & Insurance | 0 (0.0%) | 0 (0.0%) |
| Real Estate, Rental & Leasing | 0 (0.0%) | 0 (0.0%) |
| Professional & Scientific | 0 (0.0%) | 0 (0.0%) |
| Enterprise Management | 0 (0.0%) | 0 (0.0%) |
| Administrative & Support | 0 (0.0%) | 0 (0.0%) |
| Educational Services | 0 (0.0%) | 1 (100.0%) |
| Health Care & Social Assistance | 1 (12.5%) | 7 (87.5%) |
| Arts, Entertainment & Recreation | 6 (100.0%) | 0 (0.0%) |
| Accommodation & Food Services | 0 (0.0%) | 9 (100.0%) |
| Public Administration | 0 (0.0%) | 0 (0.0%) |
| Total | 75 (74.3%) | 26 (25.7%) |
Education in Roosevelt
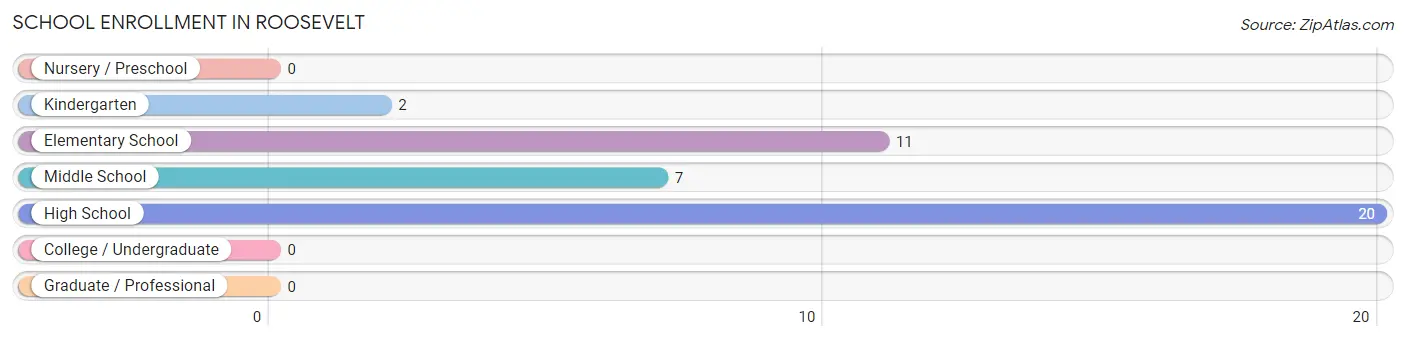
School Enrollment in Roosevelt
The most common levels of schooling among the 40 students in Roosevelt are high school (20 | 50.0%), elementary school (11 | 27.5%), and middle school (7 | 17.5%).
| School Level | # Students | % Students |
| Nursery / Preschool | 0 | 0.0% |
| Kindergarten | 2 | 5.0% |
| Elementary School | 11 | 27.5% |
| Middle School | 7 | 17.5% |
| High School | 20 | 50.0% |
| College / Undergraduate | 0 | 0.0% |
| Graduate / Professional | 0 | 0.0% |
| Total | 40 | 100.0% |
School Enrollment by Age by Funding Source in Roosevelt
Out of a total of 40 students who are enrolled in schools in Roosevelt, 1 (2.5%) attend a private institution, while the remaining 39 (97.5%) are enrolled in public schools. The age group of 5 to 9 year old has the highest likelihood of being enrolled in private schools, with 1 (7.7% in the age bracket) enrolled. Conversely, the age group of 10 to 14 year olds has the lowest likelihood of being enrolled in a private school, with 7 (100.0% in the age bracket) attending a public institution.
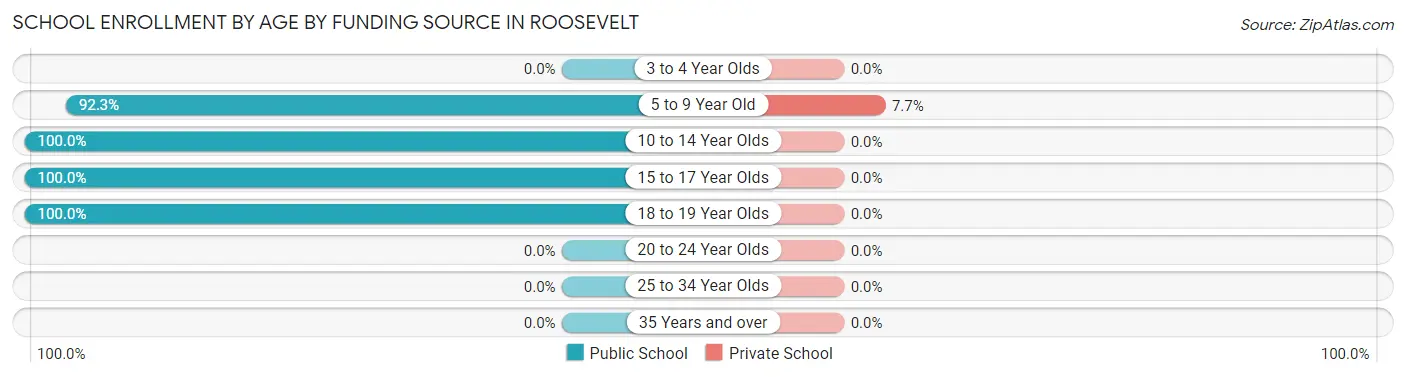
| Age Bracket | Public School | Private School |
| 3 to 4 Year Olds | 0 (0.0%) | 0 (0.0%) |
| 5 to 9 Year Old | 12 (92.3%) | 1 (7.7%) |
| 10 to 14 Year Olds | 7 (100.0%) | 0 (0.0%) |
| 15 to 17 Year Olds | 18 (100.0%) | 0 (0.0%) |
| 18 to 19 Year Olds | 2 (100.0%) | 0 (0.0%) |
| 20 to 24 Year Olds | 0 (0.0%) | 0 (0.0%) |
| 25 to 34 Year Olds | 0 (0.0%) | 0 (0.0%) |
| 35 Years and over | 0 (0.0%) | 0 (0.0%) |
| Total | 39 (97.5%) | 1 (2.5%) |
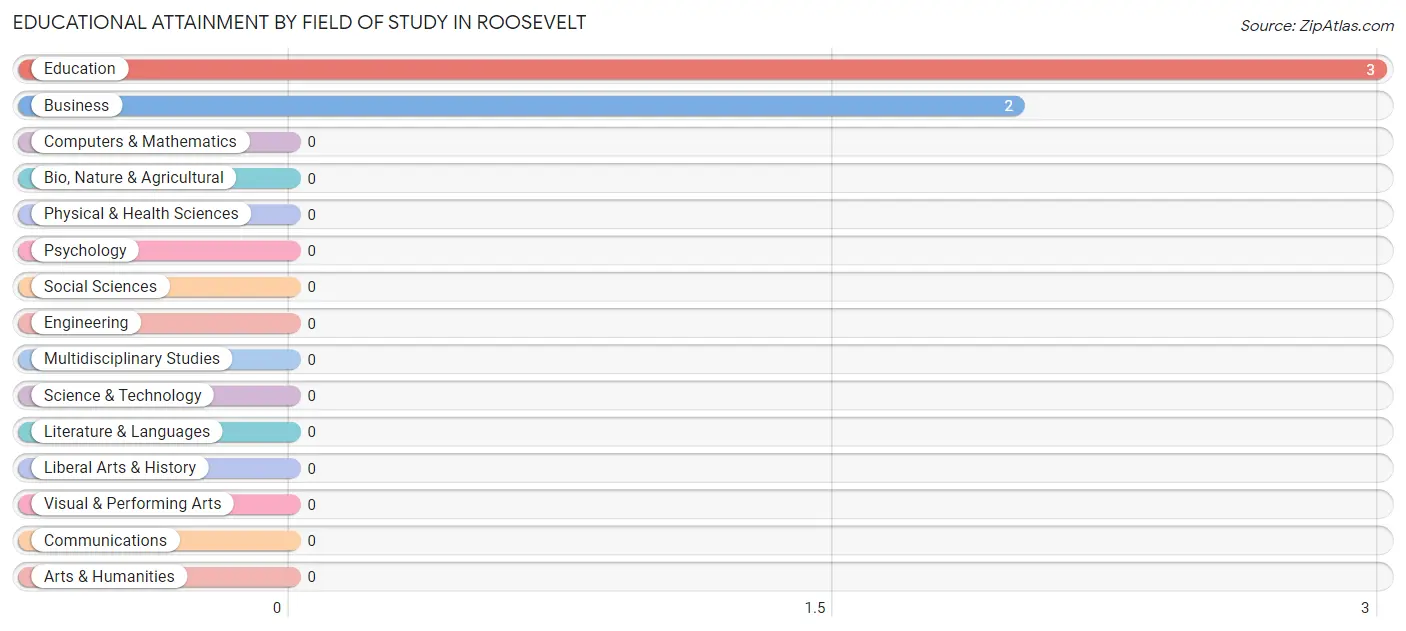
Educational Attainment by Field of Study in Roosevelt
Education (3 | 60.0%), and business (2 | 40.0%) are the most common fields of study among 5 individuals in Roosevelt who have obtained a bachelor's degree or higher.
| Field of Study | # Graduates | % Graduates |
| Computers & Mathematics | 0 | 0.0% |
| Bio, Nature & Agricultural | 0 | 0.0% |
| Physical & Health Sciences | 0 | 0.0% |
| Psychology | 0 | 0.0% |
| Social Sciences | 0 | 0.0% |
| Engineering | 0 | 0.0% |
| Multidisciplinary Studies | 0 | 0.0% |
| Science & Technology | 0 | 0.0% |
| Business | 2 | 40.0% |
| Education | 3 | 60.0% |
| Literature & Languages | 0 | 0.0% |
| Liberal Arts & History | 0 | 0.0% |
| Visual & Performing Arts | 0 | 0.0% |
| Communications | 0 | 0.0% |
| Arts & Humanities | 0 | 0.0% |
| Total | 5 | 100.0% |
Transportation & Commute in Roosevelt
Vehicle Availability by Sex in Roosevelt
The most prevalent vehicle ownership categories in Roosevelt are males with 3 vehicles (41, accounting for 55.4%) and females with 3 vehicles (6, making up 157.7%).
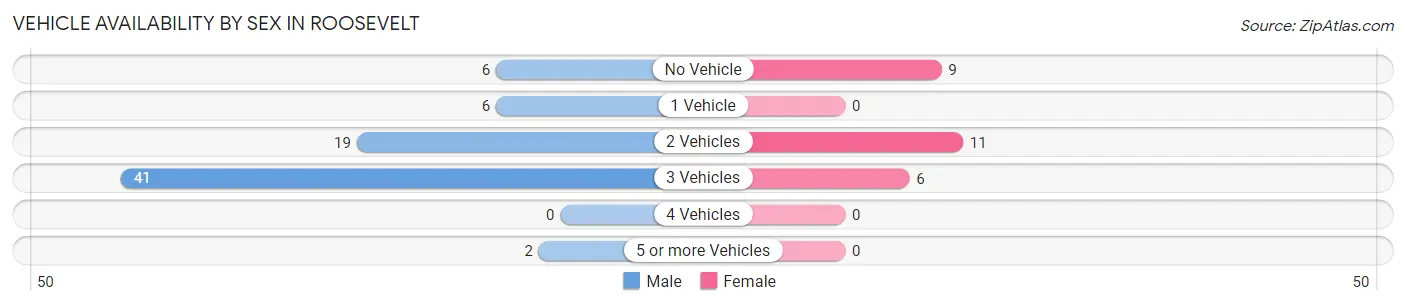
| Vehicles Available | Male | Female |
| No Vehicle | 6 (8.1%) | 9 (34.6%) |
| 1 Vehicle | 6 (8.1%) | 0 (0.0%) |
| 2 Vehicles | 19 (25.7%) | 11 (42.3%) |
| 3 Vehicles | 41 (55.4%) | 6 (23.1%) |
| 4 Vehicles | 0 (0.0%) | 0 (0.0%) |
| 5 or more Vehicles | 2 (2.7%) | 0 (0.0%) |
| Total | 74 (100.0%) | 26 (100.0%) |
Commute Time in Roosevelt
The most frequently occuring commute durations in Roosevelt are 15 to 19 minutes (38 commuters, 38.8%), 10 to 14 minutes (28 commuters, 28.6%), and 20 to 24 minutes (20 commuters, 20.4%).
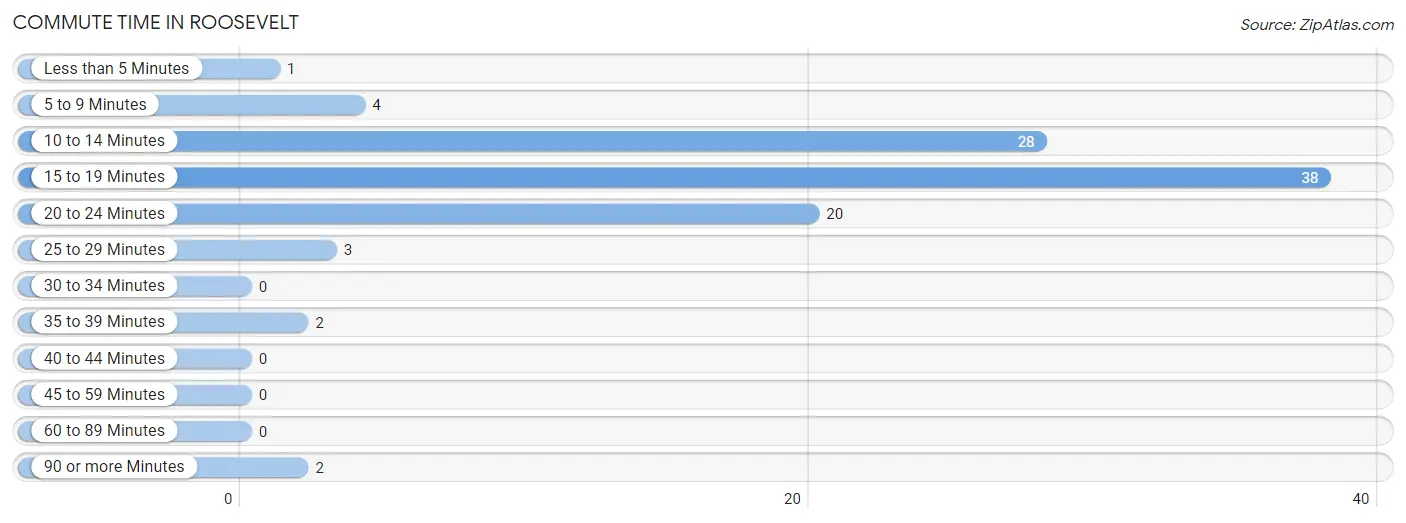
| Commute Time | # Commuters | % Commuters |
| Less than 5 Minutes | 1 | 1.0% |
| 5 to 9 Minutes | 4 | 4.1% |
| 10 to 14 Minutes | 28 | 28.6% |
| 15 to 19 Minutes | 38 | 38.8% |
| 20 to 24 Minutes | 20 | 20.4% |
| 25 to 29 Minutes | 3 | 3.1% |
| 30 to 34 Minutes | 0 | 0.0% |
| 35 to 39 Minutes | 2 | 2.0% |
| 40 to 44 Minutes | 0 | 0.0% |
| 45 to 59 Minutes | 0 | 0.0% |
| 60 to 89 Minutes | 0 | 0.0% |
| 90 or more Minutes | 2 | 2.0% |
Commute Time by Sex in Roosevelt
The most common commute times in Roosevelt are 15 to 19 minutes (32 commuters, 44.4%) for males and 20 to 24 minutes (11 commuters, 42.3%) for females.
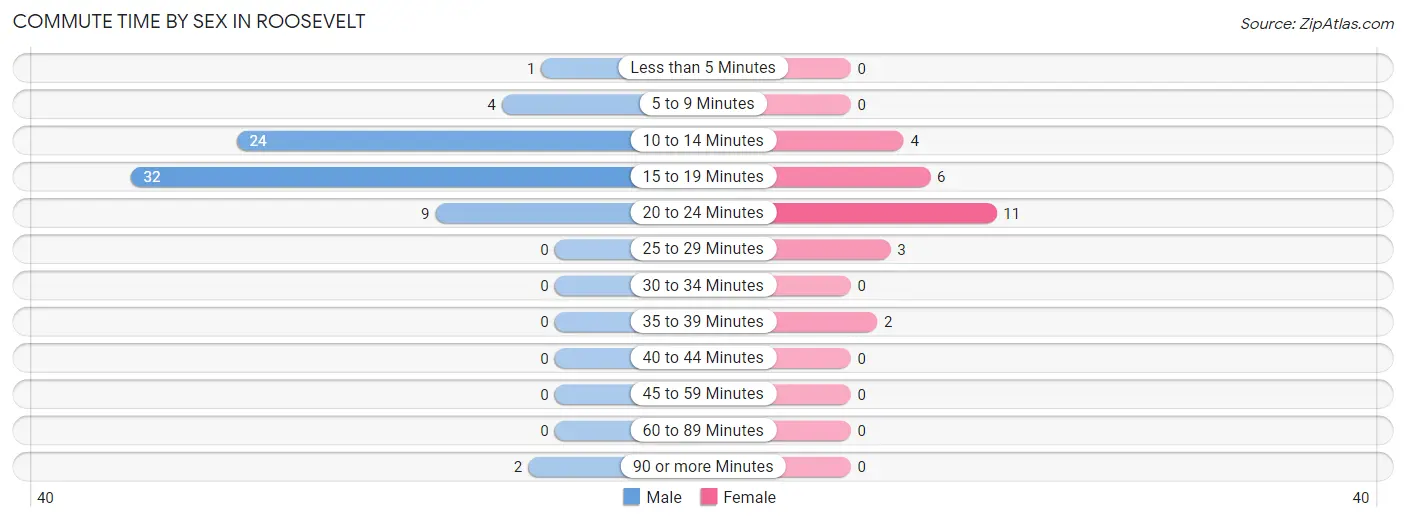
| Commute Time | Male | Female |
| Less than 5 Minutes | 1 (1.4%) | 0 (0.0%) |
| 5 to 9 Minutes | 4 (5.6%) | 0 (0.0%) |
| 10 to 14 Minutes | 24 (33.3%) | 4 (15.4%) |
| 15 to 19 Minutes | 32 (44.4%) | 6 (23.1%) |
| 20 to 24 Minutes | 9 (12.5%) | 11 (42.3%) |
| 25 to 29 Minutes | 0 (0.0%) | 3 (11.5%) |
| 30 to 34 Minutes | 0 (0.0%) | 0 (0.0%) |
| 35 to 39 Minutes | 0 (0.0%) | 2 (7.7%) |
| 40 to 44 Minutes | 0 (0.0%) | 0 (0.0%) |
| 45 to 59 Minutes | 0 (0.0%) | 0 (0.0%) |
| 60 to 89 Minutes | 0 (0.0%) | 0 (0.0%) |
| 90 or more Minutes | 2 (2.8%) | 0 (0.0%) |
Time of Departure to Work by Sex in Roosevelt
The most frequent times of departure to work in Roosevelt are 12:00 AM to 4:59 AM (36, 50.0%) for males and 12:00 PM to 3:59 PM (9, 34.6%) for females.
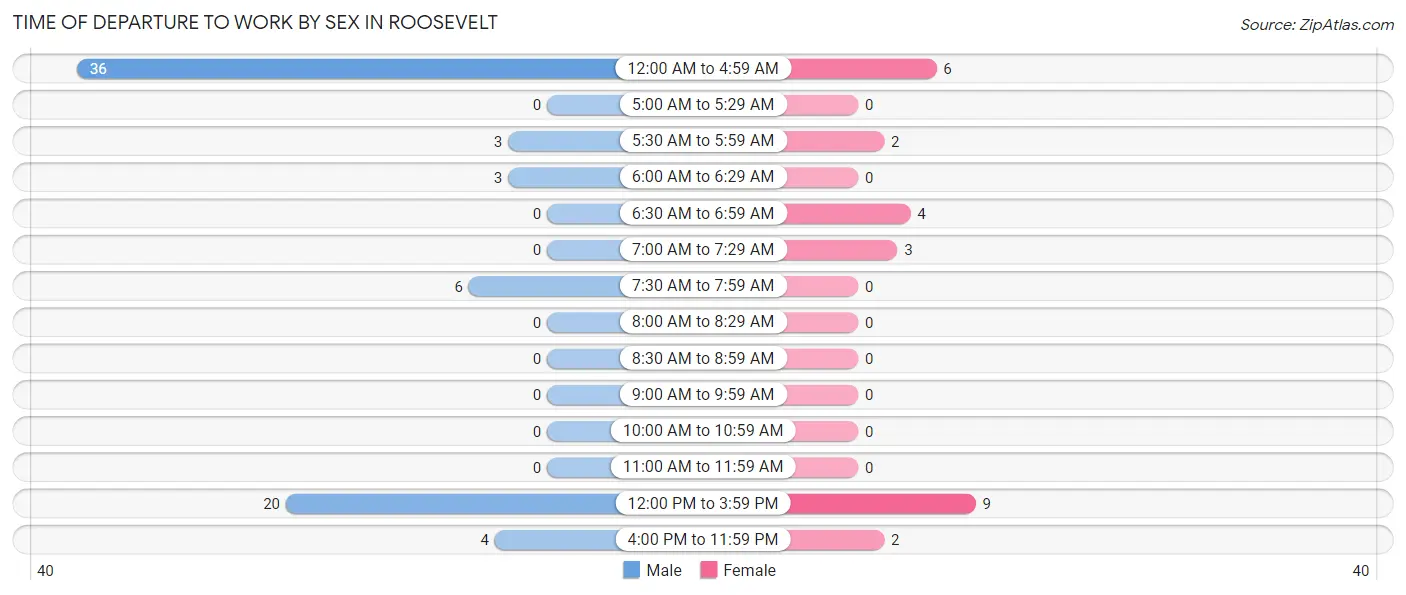
| Time of Departure | Male | Female |
| 12:00 AM to 4:59 AM | 36 (50.0%) | 6 (23.1%) |
| 5:00 AM to 5:29 AM | 0 (0.0%) | 0 (0.0%) |
| 5:30 AM to 5:59 AM | 3 (4.2%) | 2 (7.7%) |
| 6:00 AM to 6:29 AM | 3 (4.2%) | 0 (0.0%) |
| 6:30 AM to 6:59 AM | 0 (0.0%) | 4 (15.4%) |
| 7:00 AM to 7:29 AM | 0 (0.0%) | 3 (11.5%) |
| 7:30 AM to 7:59 AM | 6 (8.3%) | 0 (0.0%) |
| 8:00 AM to 8:29 AM | 0 (0.0%) | 0 (0.0%) |
| 8:30 AM to 8:59 AM | 0 (0.0%) | 0 (0.0%) |
| 9:00 AM to 9:59 AM | 0 (0.0%) | 0 (0.0%) |
| 10:00 AM to 10:59 AM | 0 (0.0%) | 0 (0.0%) |
| 11:00 AM to 11:59 AM | 0 (0.0%) | 0 (0.0%) |
| 12:00 PM to 3:59 PM | 20 (27.8%) | 9 (34.6%) |
| 4:00 PM to 11:59 PM | 4 (5.6%) | 2 (7.7%) |
| Total | 72 (100.0%) | 26 (100.0%) |
Housing Occupancy in Roosevelt
Occupancy by Ownership in Roosevelt
Of the total 54 dwellings in Roosevelt, owner-occupied units account for 44 (81.5%), while renter-occupied units make up 10 (18.5%).
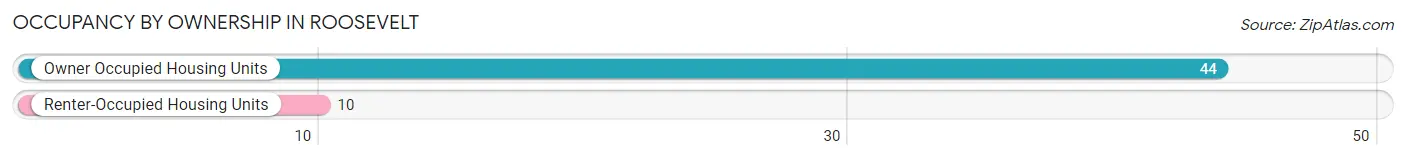
| Occupancy | # Housing Units | % Housing Units |
| Owner Occupied Housing Units | 44 | 81.5% |
| Renter-Occupied Housing Units | 10 | 18.5% |
| Total Occupied Housing Units | 54 | 100.0% |
Occupancy by Household Size in Roosevelt
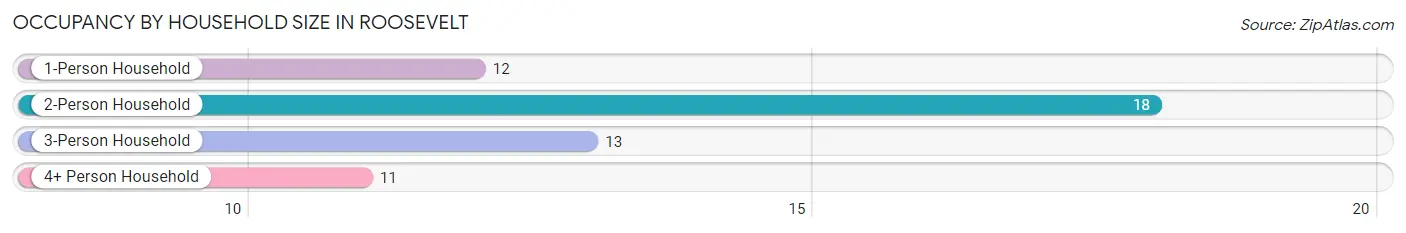
| Household Size | # Housing Units | % Housing Units |
| 1-Person Household | 12 | 22.2% |
| 2-Person Household | 18 | 33.3% |
| 3-Person Household | 13 | 24.1% |
| 4+ Person Household | 11 | 20.4% |
| Total Housing Units | 54 | 100.0% |
Occupancy by Ownership by Household Size in Roosevelt
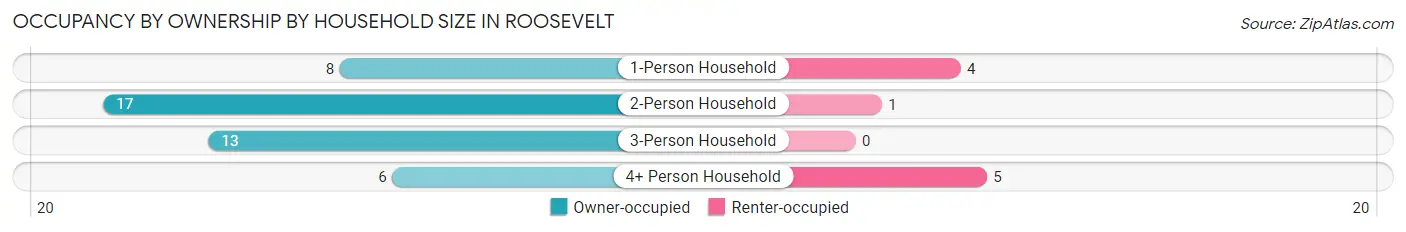
| Household Size | Owner-occupied | Renter-occupied |
| 1-Person Household | 8 (66.7%) | 4 (33.3%) |
| 2-Person Household | 17 (94.4%) | 1 (5.6%) |
| 3-Person Household | 13 (100.0%) | 0 (0.0%) |
| 4+ Person Household | 6 (54.5%) | 5 (45.5%) |
| Total Housing Units | 44 (81.5%) | 10 (18.5%) |
Occupancy by Educational Attainment in Roosevelt
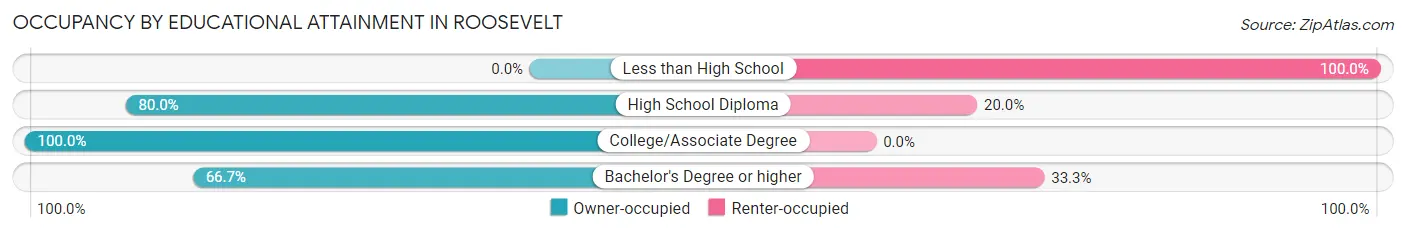
| Household Size | Owner-occupied | Renter-occupied |
| Less than High School | 0 (0.0%) | 5 (100.0%) |
| High School Diploma | 16 (80.0%) | 4 (20.0%) |
| College/Associate Degree | 26 (100.0%) | 0 (0.0%) |
| Bachelor's Degree or higher | 2 (66.7%) | 1 (33.3%) |
Occupancy by Age of Householder in Roosevelt
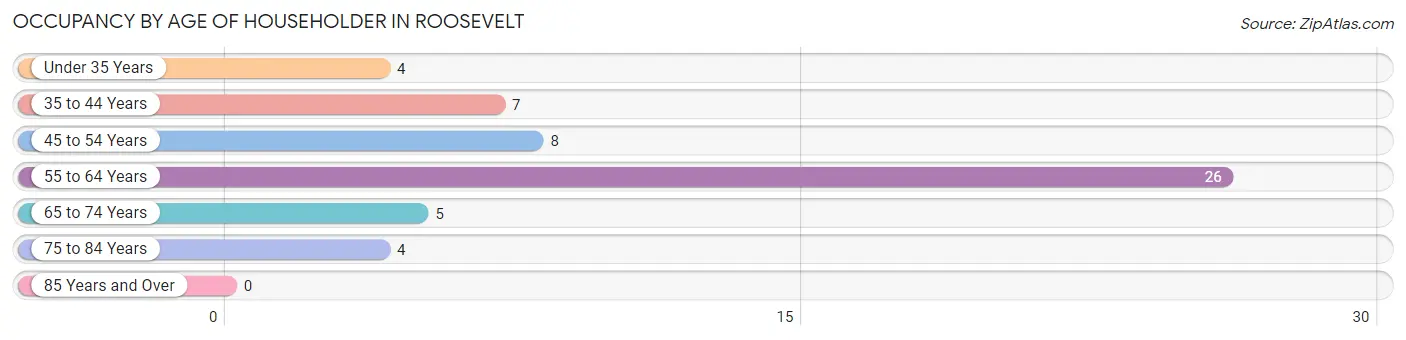
| Age Bracket | # Households | % Households |
| Under 35 Years | 4 | 7.4% |
| 35 to 44 Years | 7 | 13.0% |
| 45 to 54 Years | 8 | 14.8% |
| 55 to 64 Years | 26 | 48.1% |
| 65 to 74 Years | 5 | 9.3% |
| 75 to 84 Years | 4 | 7.4% |
| 85 Years and Over | 0 | 0.0% |
| Total | 54 | 100.0% |
Housing Finances in Roosevelt
Median Income by Occupancy in Roosevelt
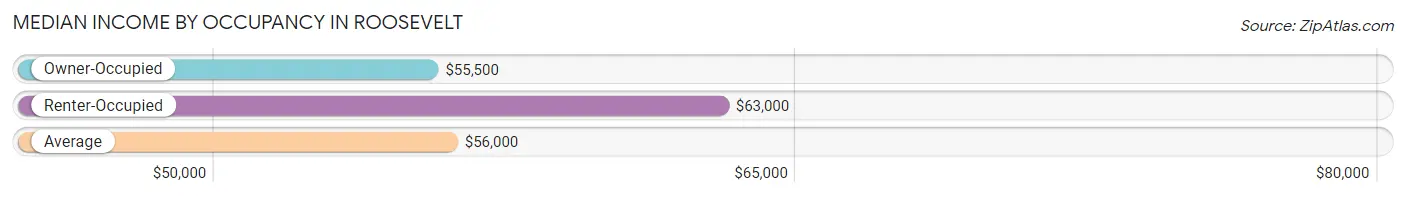
| Occupancy Type | # Households | Median Income |
| Owner-Occupied | 44 (81.5%) | $55,500 |
| Renter-Occupied | 10 (18.5%) | $63,000 |
| Average | 54 (100.0%) | $56,000 |
Occupancy by Householder Income Bracket in Roosevelt
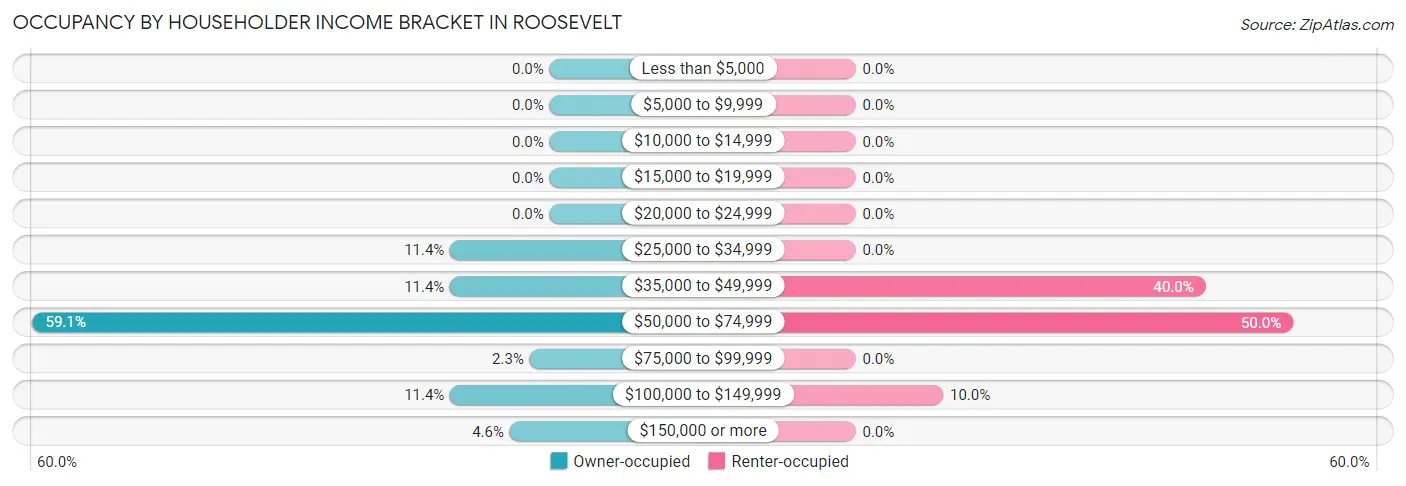
| Income Bracket | Owner-occupied | Renter-occupied |
| Less than $5,000 | 0 (0.0%) | 0 (0.0%) |
| $5,000 to $9,999 | 0 (0.0%) | 0 (0.0%) |
| $10,000 to $14,999 | 0 (0.0%) | 0 (0.0%) |
| $15,000 to $19,999 | 0 (0.0%) | 0 (0.0%) |
| $20,000 to $24,999 | 0 (0.0%) | 0 (0.0%) |
| $25,000 to $34,999 | 5 (11.4%) | 0 (0.0%) |
| $35,000 to $49,999 | 5 (11.4%) | 4 (40.0%) |
| $50,000 to $74,999 | 26 (59.1%) | 5 (50.0%) |
| $75,000 to $99,999 | 1 (2.3%) | 0 (0.0%) |
| $100,000 to $149,999 | 5 (11.4%) | 1 (10.0%) |
| $150,000 or more | 2 (4.5%) | 0 (0.0%) |
| Total | 44 (100.0%) | 10 (100.0%) |
Monthly Housing Cost Tiers in Roosevelt
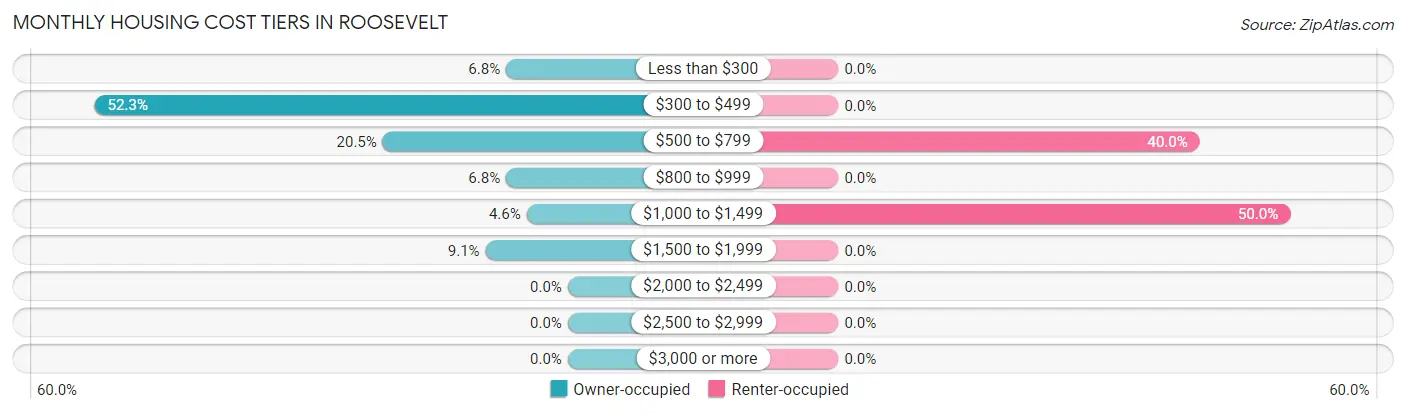
| Monthly Cost | Owner-occupied | Renter-occupied |
| Less than $300 | 3 (6.8%) | 0 (0.0%) |
| $300 to $499 | 23 (52.3%) | 0 (0.0%) |
| $500 to $799 | 9 (20.4%) | 4 (40.0%) |
| $800 to $999 | 3 (6.8%) | 0 (0.0%) |
| $1,000 to $1,499 | 2 (4.5%) | 5 (50.0%) |
| $1,500 to $1,999 | 4 (9.1%) | 0 (0.0%) |
| $2,000 to $2,499 | 0 (0.0%) | 0 (0.0%) |
| $2,500 to $2,999 | 0 (0.0%) | 0 (0.0%) |
| $3,000 or more | 0 (0.0%) | 0 (0.0%) |
| Total | 44 (100.0%) | 10 (100.0%) |
Physical Housing Characteristics in Roosevelt
Housing Structures in Roosevelt
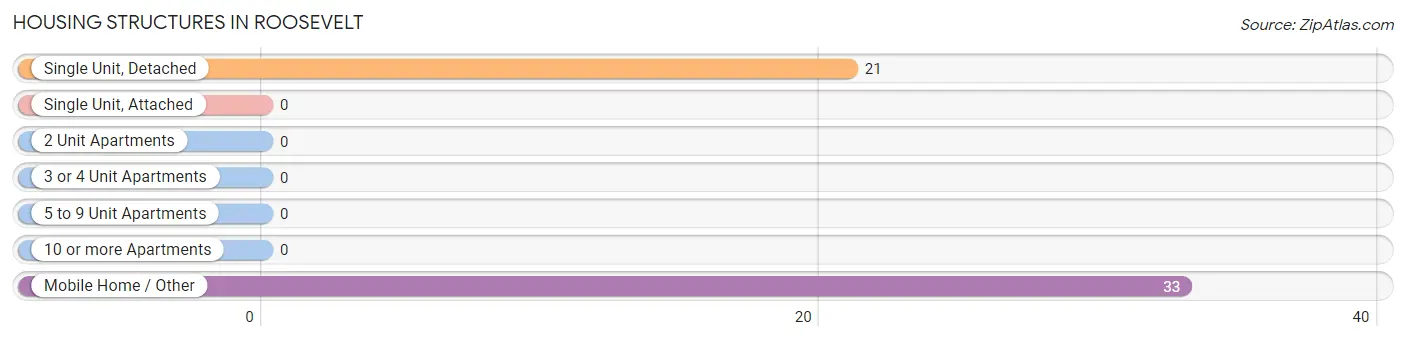
| Structure Type | # Housing Units | % Housing Units |
| Single Unit, Detached | 21 | 38.9% |
| Single Unit, Attached | 0 | 0.0% |
| 2 Unit Apartments | 0 | 0.0% |
| 3 or 4 Unit Apartments | 0 | 0.0% |
| 5 to 9 Unit Apartments | 0 | 0.0% |
| 10 or more Apartments | 0 | 0.0% |
| Mobile Home / Other | 33 | 61.1% |
| Total | 54 | 100.0% |
Housing Structures by Occupancy in Roosevelt
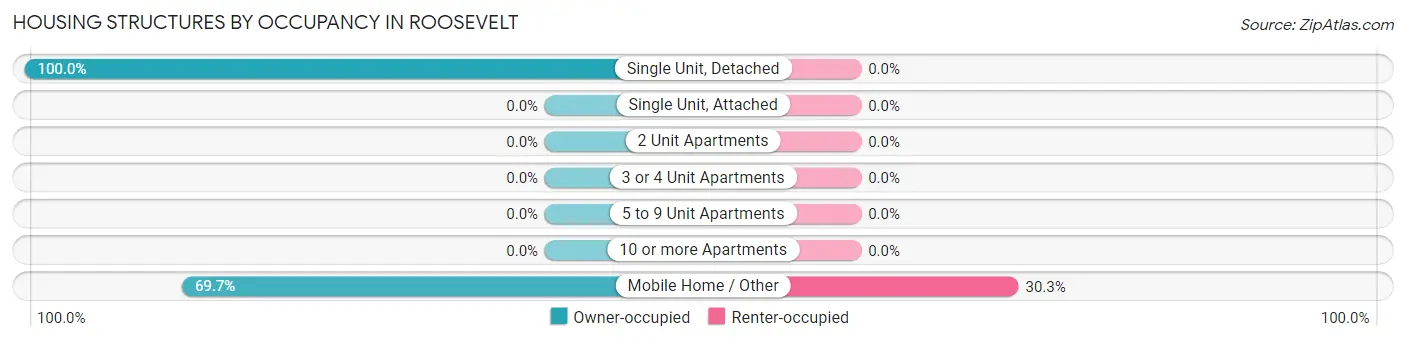
| Structure Type | Owner-occupied | Renter-occupied |
| Single Unit, Detached | 21 (100.0%) | 0 (0.0%) |
| Single Unit, Attached | 0 (0.0%) | 0 (0.0%) |
| 2 Unit Apartments | 0 (0.0%) | 0 (0.0%) |
| 3 or 4 Unit Apartments | 0 (0.0%) | 0 (0.0%) |
| 5 to 9 Unit Apartments | 0 (0.0%) | 0 (0.0%) |
| 10 or more Apartments | 0 (0.0%) | 0 (0.0%) |
| Mobile Home / Other | 23 (69.7%) | 10 (30.3%) |
| Total | 44 (81.5%) | 10 (18.5%) |
Housing Structures by Number of Rooms in Roosevelt
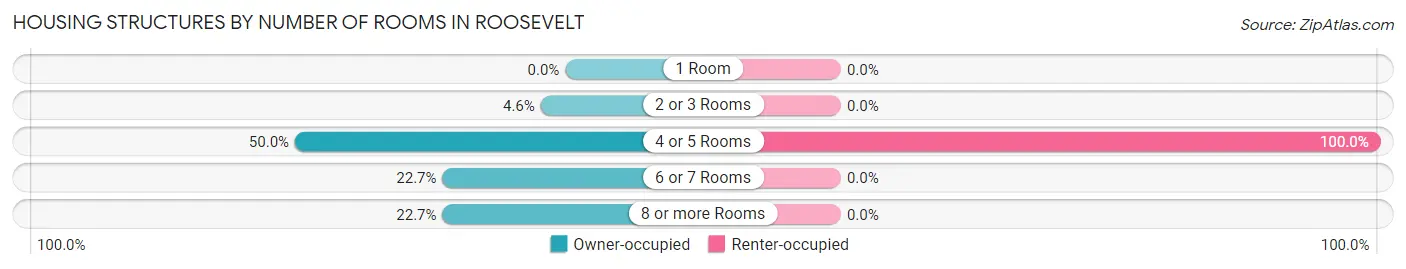
| Number of Rooms | Owner-occupied | Renter-occupied |
| 1 Room | 0 (0.0%) | 0 (0.0%) |
| 2 or 3 Rooms | 2 (4.5%) | 0 (0.0%) |
| 4 or 5 Rooms | 22 (50.0%) | 10 (100.0%) |
| 6 or 7 Rooms | 10 (22.7%) | 0 (0.0%) |
| 8 or more Rooms | 10 (22.7%) | 0 (0.0%) |
| Total | 44 (100.0%) | 10 (100.0%) |
Housing Structure by Heating Type in Roosevelt
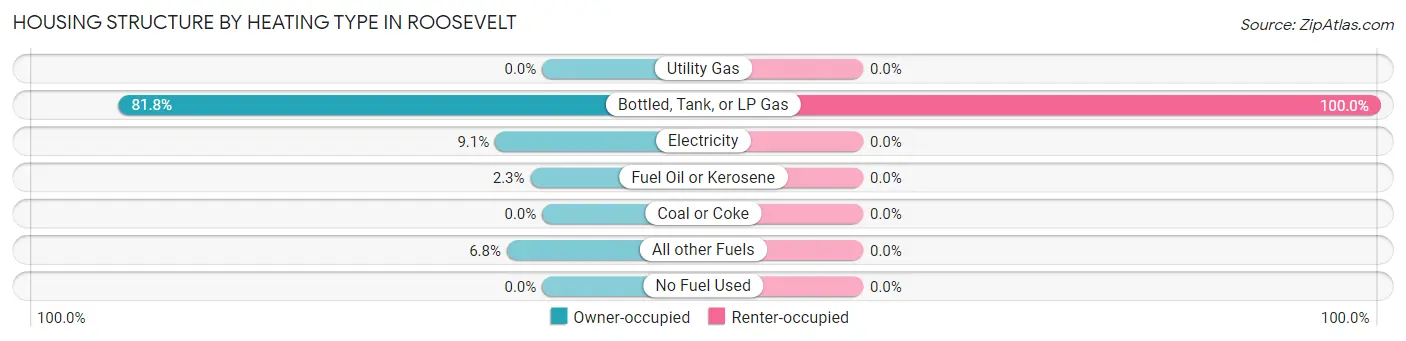
| Heating Type | Owner-occupied | Renter-occupied |
| Utility Gas | 0 (0.0%) | 0 (0.0%) |
| Bottled, Tank, or LP Gas | 36 (81.8%) | 10 (100.0%) |
| Electricity | 4 (9.1%) | 0 (0.0%) |
| Fuel Oil or Kerosene | 1 (2.3%) | 0 (0.0%) |
| Coal or Coke | 0 (0.0%) | 0 (0.0%) |
| All other Fuels | 3 (6.8%) | 0 (0.0%) |
| No Fuel Used | 0 (0.0%) | 0 (0.0%) |
| Total | 44 (100.0%) | 10 (100.0%) |
Household Vehicle Usage in Roosevelt
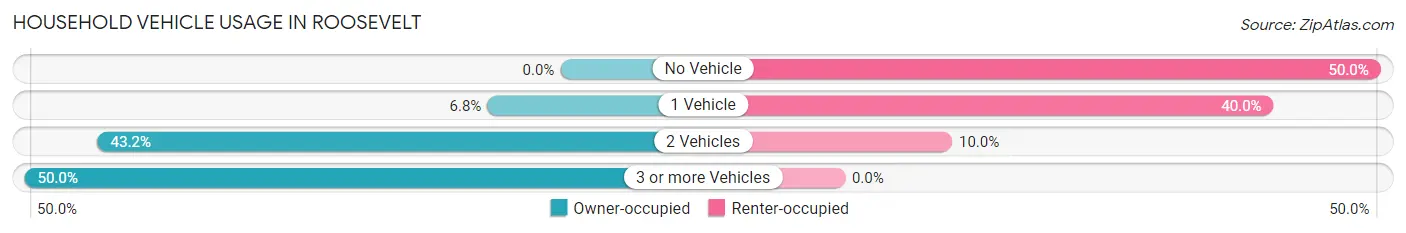
| Vehicles per Household | Owner-occupied | Renter-occupied |
| No Vehicle | 0 (0.0%) | 5 (50.0%) |
| 1 Vehicle | 3 (6.8%) | 4 (40.0%) |
| 2 Vehicles | 19 (43.2%) | 1 (10.0%) |
| 3 or more Vehicles | 22 (50.0%) | 0 (0.0%) |
| Total | 44 (100.0%) | 10 (100.0%) |
Real Estate & Mortgages in Roosevelt
Real Estate and Mortgage Overview in Roosevelt
| Characteristic | Without Mortgage | With Mortgage |
| Housing Units | 38 | 6 |
| Median Property Value | - | - |
| Median Household Income | $55,625 | $1 |
| Monthly Housing Costs | $347 | $0 |
| Real Estate Taxes | - | - |
Property Value by Mortgage Status in Roosevelt
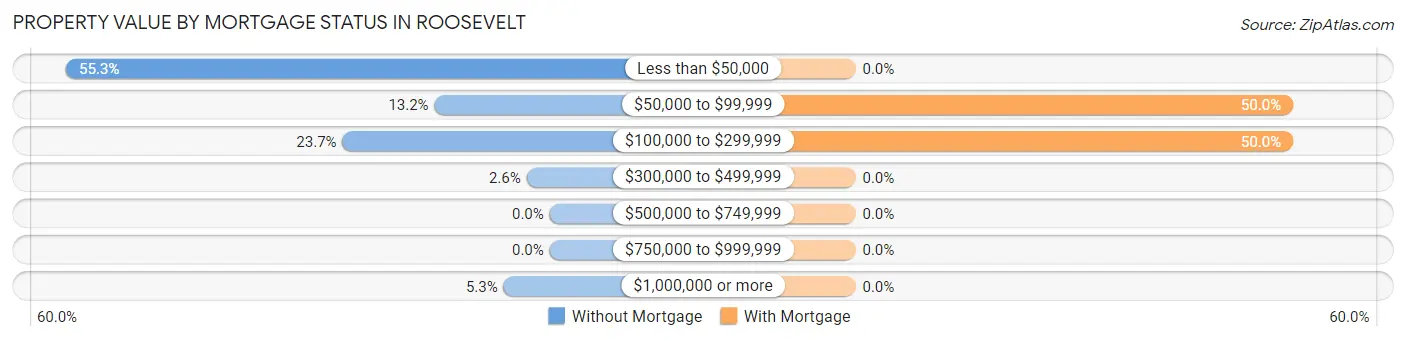
| Property Value | Without Mortgage | With Mortgage |
| Less than $50,000 | 21 (55.3%) | 0 (0.0%) |
| $50,000 to $99,999 | 5 (13.2%) | 3 (50.0%) |
| $100,000 to $299,999 | 9 (23.7%) | 3 (50.0%) |
| $300,000 to $499,999 | 1 (2.6%) | 0 (0.0%) |
| $500,000 to $749,999 | 0 (0.0%) | 0 (0.0%) |
| $750,000 to $999,999 | 0 (0.0%) | 0 (0.0%) |
| $1,000,000 or more | 2 (5.3%) | 0 (0.0%) |
| Total | 38 (100.0%) | 6 (100.0%) |
Household Income by Mortgage Status in Roosevelt
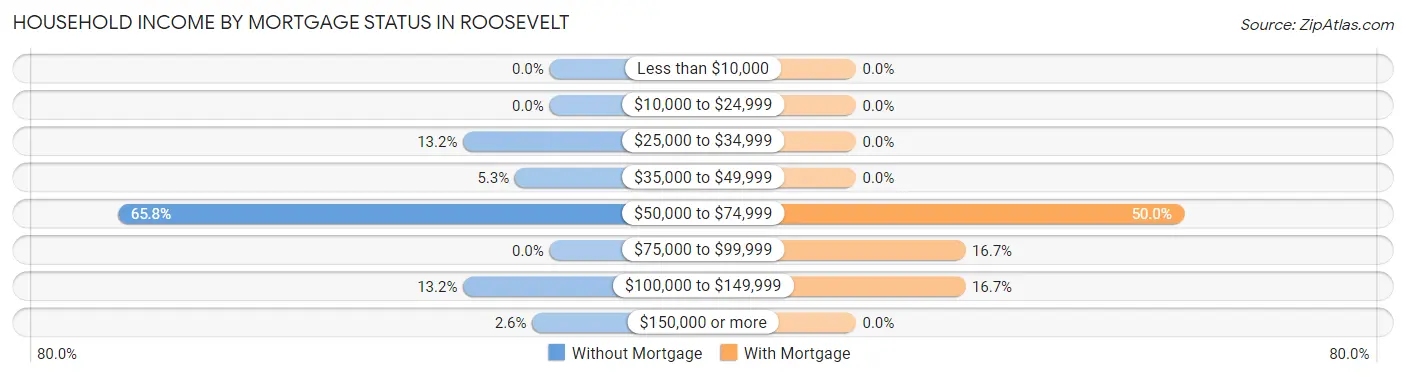
| Household Income | Without Mortgage | With Mortgage |
| Less than $10,000 | 0 (0.0%) | 0 (0.0%) |
| $10,000 to $24,999 | 0 (0.0%) | 0 (0.0%) |
| $25,000 to $34,999 | 5 (13.2%) | 0 (0.0%) |
| $35,000 to $49,999 | 2 (5.3%) | 0 (0.0%) |
| $50,000 to $74,999 | 25 (65.8%) | 3 (50.0%) |
| $75,000 to $99,999 | 0 (0.0%) | 1 (16.7%) |
| $100,000 to $149,999 | 5 (13.2%) | 1 (16.7%) |
| $150,000 or more | 1 (2.6%) | 0 (0.0%) |
| Total | 38 (100.0%) | 6 (100.0%) |
Property Value to Household Income Ratio in Roosevelt
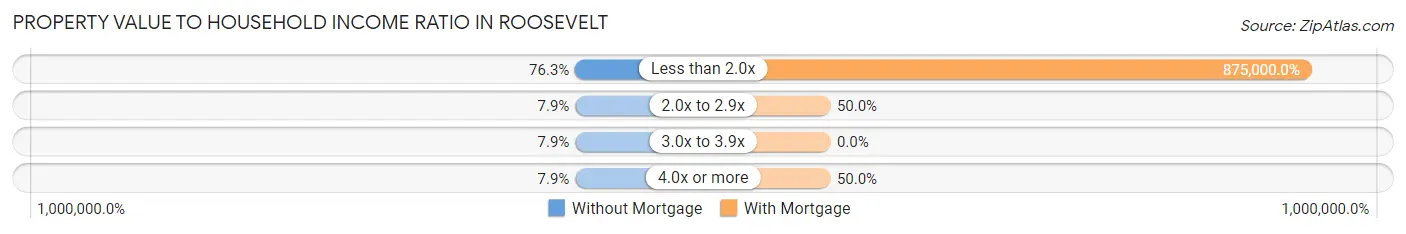
| Value-to-Income Ratio | Without Mortgage | With Mortgage |
| Less than 2.0x | 29 (76.3%) | 52,500 (875,000.0%) |
| 2.0x to 2.9x | 3 (7.9%) | 3 (50.0%) |
| 3.0x to 3.9x | 3 (7.9%) | 0 (0.0%) |
| 4.0x or more | 3 (7.9%) | 3 (50.0%) |
| Total | 38 (100.0%) | 6 (100.0%) |
Real Estate Taxes by Mortgage Status in Roosevelt
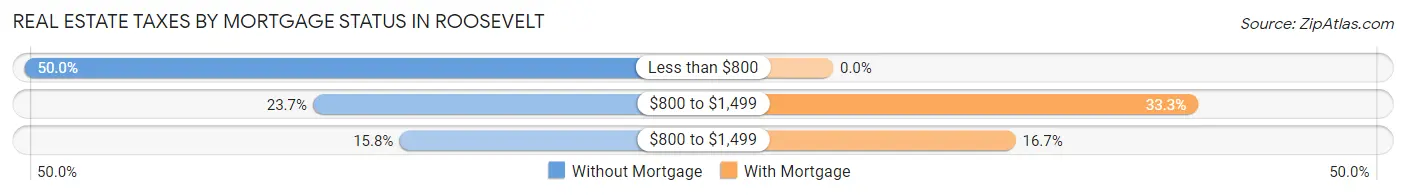
| Property Taxes | Without Mortgage | With Mortgage |
| Less than $800 | 19 (50.0%) | 0 (0.0%) |
| $800 to $1,499 | 9 (23.7%) | 2 (33.3%) |
| $800 to $1,499 | 6 (15.8%) | 1 (16.7%) |
| Total | 38 (100.0%) | 6 (100.0%) |
Health & Disability in Roosevelt
Health Insurance Coverage by Age in Roosevelt
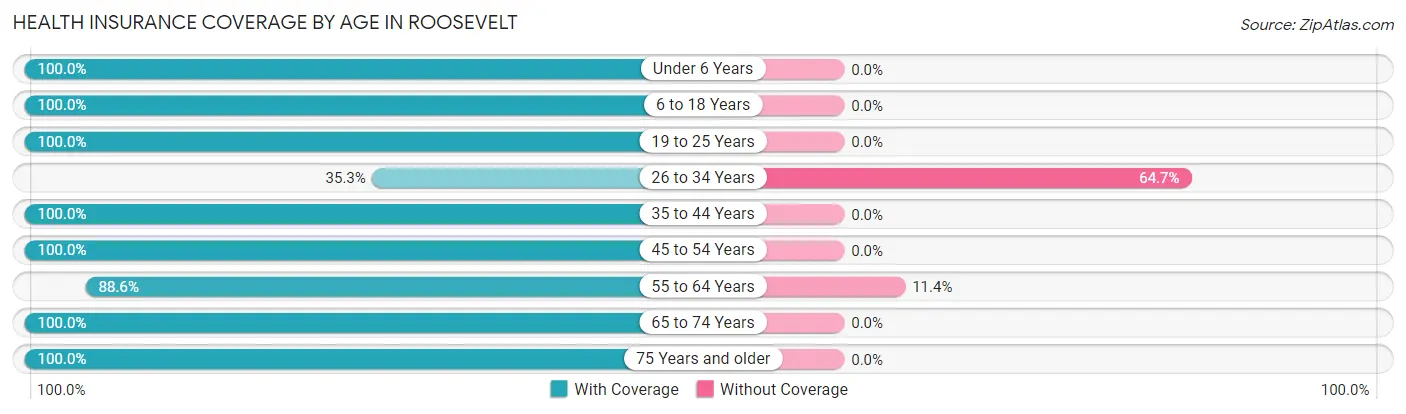
| Age Bracket | With Coverage | Without Coverage |
| Under 6 Years | 19 (100.0%) | 0 (0.0%) |
| 6 to 18 Years | 43 (100.0%) | 0 (0.0%) |
| 19 to 25 Years | 6 (100.0%) | 0 (0.0%) |
| 26 to 34 Years | 6 (35.3%) | 11 (64.7%) |
| 35 to 44 Years | 16 (100.0%) | 0 (0.0%) |
| 45 to 54 Years | 15 (100.0%) | 0 (0.0%) |
| 55 to 64 Years | 39 (88.6%) | 5 (11.4%) |
| 65 to 74 Years | 9 (100.0%) | 0 (0.0%) |
| 75 Years and older | 6 (100.0%) | 0 (0.0%) |
| Total | 159 (90.9%) | 16 (9.1%) |
Health Insurance Coverage by Citizenship Status in Roosevelt
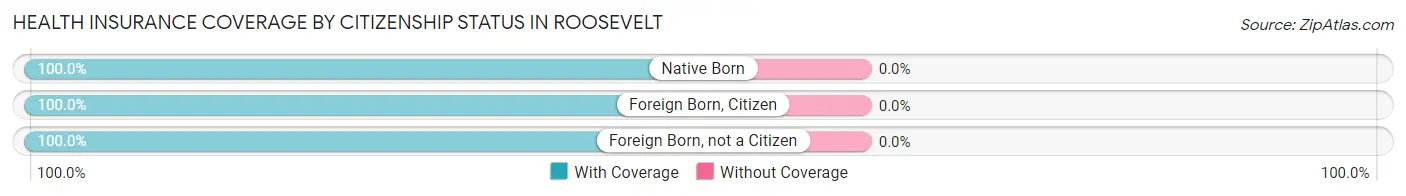
| Citizenship Status | With Coverage | Without Coverage |
| Native Born | 19 (100.0%) | 0 (0.0%) |
| Foreign Born, Citizen | 43 (100.0%) | 0 (0.0%) |
| Foreign Born, not a Citizen | 6 (100.0%) | 0 (0.0%) |
Health Insurance Coverage by Household Income in Roosevelt
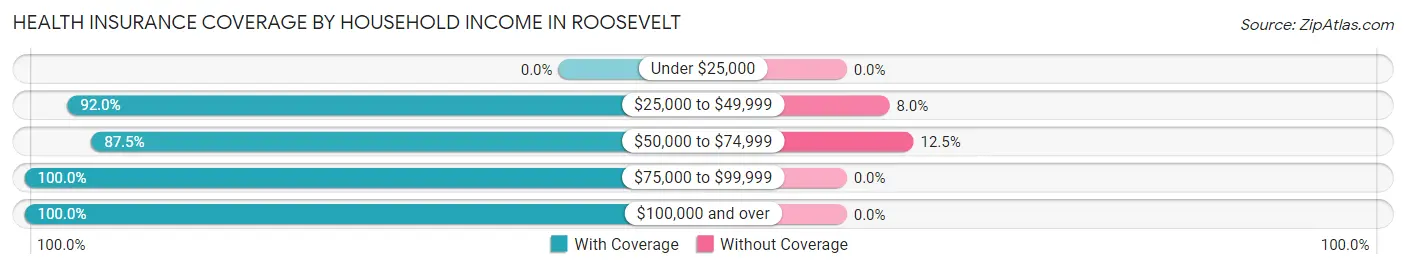
| Household Income | With Coverage | Without Coverage |
| Under $25,000 | 0 (0.0%) | 0 (0.0%) |
| $25,000 to $49,999 | 23 (92.0%) | 2 (8.0%) |
| $50,000 to $74,999 | 98 (87.5%) | 14 (12.5%) |
| $75,000 to $99,999 | 4 (100.0%) | 0 (0.0%) |
| $100,000 and over | 34 (100.0%) | 0 (0.0%) |
Public vs Private Health Insurance Coverage by Age in Roosevelt
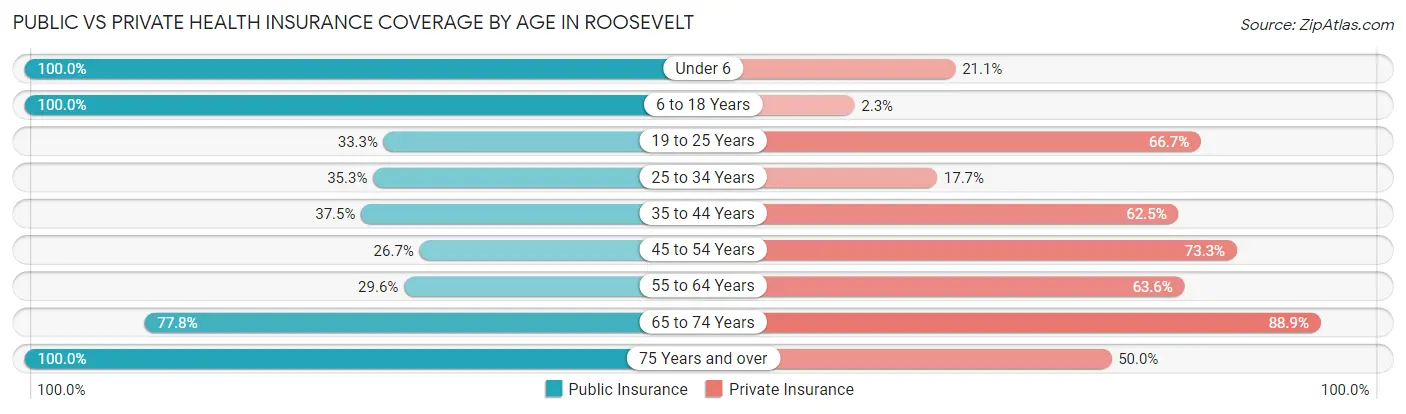
| Age Bracket | Public Insurance | Private Insurance |
| Under 6 | 19 (100.0%) | 4 (21.0%) |
| 6 to 18 Years | 43 (100.0%) | 1 (2.3%) |
| 19 to 25 Years | 2 (33.3%) | 4 (66.7%) |
| 25 to 34 Years | 6 (35.3%) | 3 (17.6%) |
| 35 to 44 Years | 6 (37.5%) | 10 (62.5%) |
| 45 to 54 Years | 4 (26.7%) | 11 (73.3%) |
| 55 to 64 Years | 13 (29.5%) | 28 (63.6%) |
| 65 to 74 Years | 7 (77.8%) | 8 (88.9%) |
| 75 Years and over | 6 (100.0%) | 3 (50.0%) |
| Total | 106 (60.6%) | 72 (41.1%) |
Disability Status by Sex by Age in Roosevelt
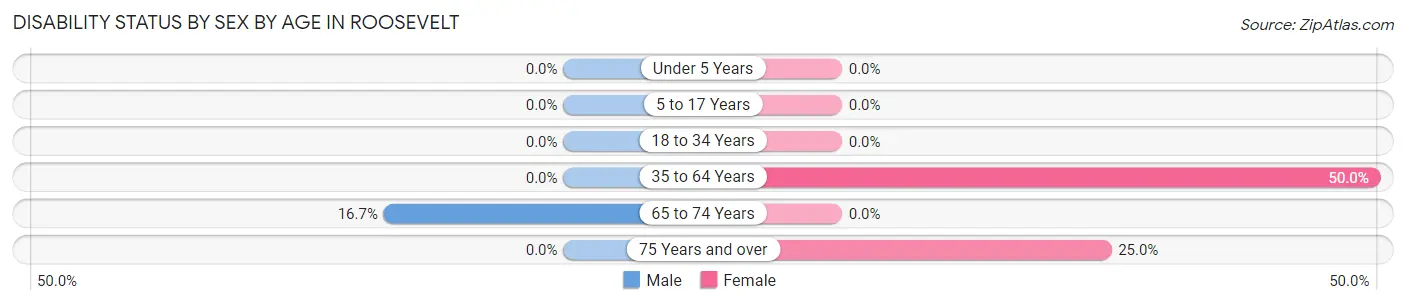
| Age Bracket | Male | Female |
| Under 5 Years | 0 (0.0%) | 0 (0.0%) |
| 5 to 17 Years | 0 (0.0%) | 0 (0.0%) |
| 18 to 34 Years | 0 (0.0%) | 0 (0.0%) |
| 35 to 64 Years | 0 (0.0%) | 13 (50.0%) |
| 65 to 74 Years | 1 (16.7%) | 0 (0.0%) |
| 75 Years and over | 0 (0.0%) | 1 (25.0%) |
Disability Class by Sex by Age in Roosevelt
Disability Class: Hearing Difficulty
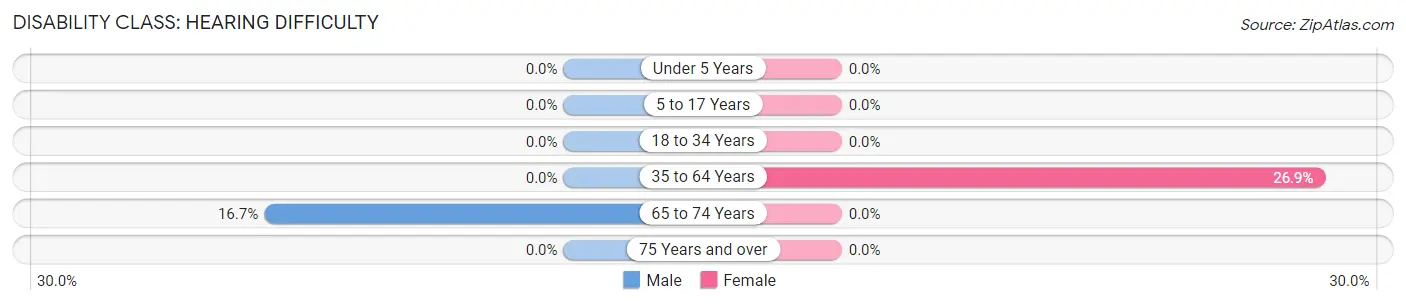
| Age Bracket | Male | Female |
| Under 5 Years | 0 (0.0%) | 0 (0.0%) |
| 5 to 17 Years | 0 (0.0%) | 0 (0.0%) |
| 18 to 34 Years | 0 (0.0%) | 0 (0.0%) |
| 35 to 64 Years | 0 (0.0%) | 7 (26.9%) |
| 65 to 74 Years | 1 (16.7%) | 0 (0.0%) |
| 75 Years and over | 0 (0.0%) | 0 (0.0%) |
Disability Class: Vision Difficulty
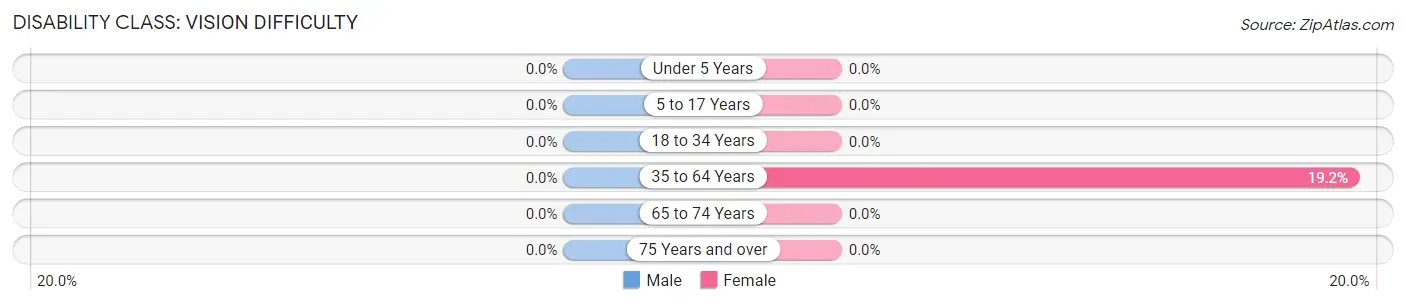
| Age Bracket | Male | Female |
| Under 5 Years | 0 (0.0%) | 0 (0.0%) |
| 5 to 17 Years | 0 (0.0%) | 0 (0.0%) |
| 18 to 34 Years | 0 (0.0%) | 0 (0.0%) |
| 35 to 64 Years | 0 (0.0%) | 5 (19.2%) |
| 65 to 74 Years | 0 (0.0%) | 0 (0.0%) |
| 75 Years and over | 0 (0.0%) | 0 (0.0%) |
Disability Class: Cognitive Difficulty
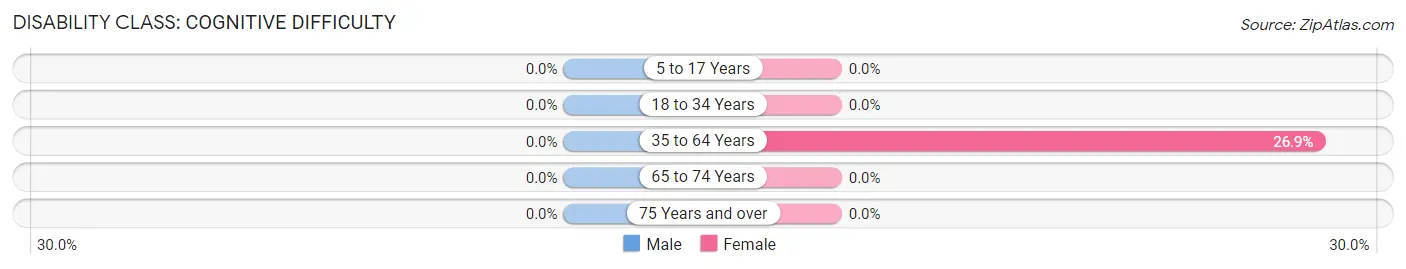
| Age Bracket | Male | Female |
| 5 to 17 Years | 0 (0.0%) | 0 (0.0%) |
| 18 to 34 Years | 0 (0.0%) | 0 (0.0%) |
| 35 to 64 Years | 0 (0.0%) | 7 (26.9%) |
| 65 to 74 Years | 0 (0.0%) | 0 (0.0%) |
| 75 Years and over | 0 (0.0%) | 0 (0.0%) |
Disability Class: Ambulatory Difficulty
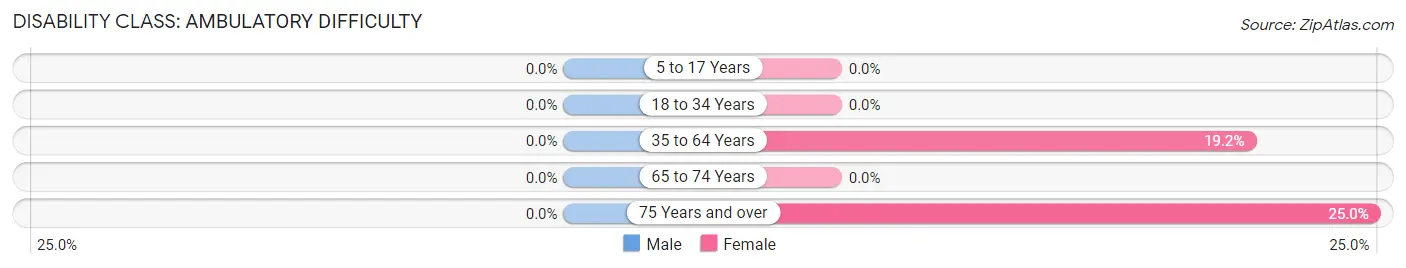
| Age Bracket | Male | Female |
| 5 to 17 Years | 0 (0.0%) | 0 (0.0%) |
| 18 to 34 Years | 0 (0.0%) | 0 (0.0%) |
| 35 to 64 Years | 0 (0.0%) | 5 (19.2%) |
| 65 to 74 Years | 0 (0.0%) | 0 (0.0%) |
| 75 Years and over | 0 (0.0%) | 1 (25.0%) |
Disability Class: Self-Care Difficulty
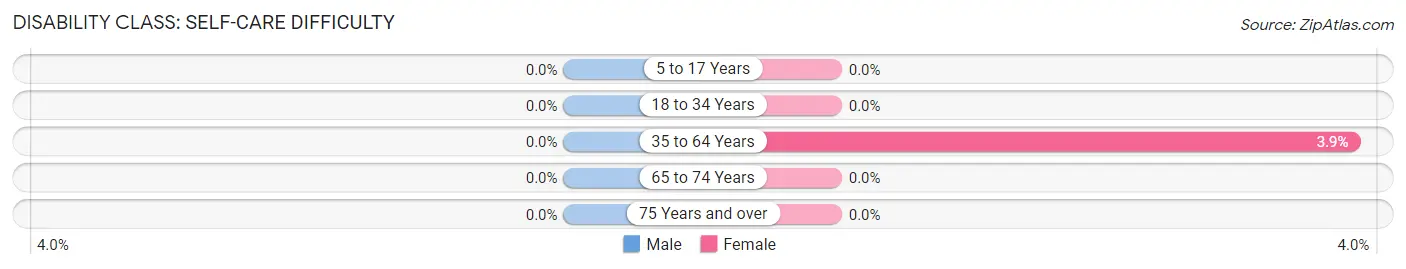
| Age Bracket | Male | Female |
| 5 to 17 Years | 0 (0.0%) | 0 (0.0%) |
| 18 to 34 Years | 0 (0.0%) | 0 (0.0%) |
| 35 to 64 Years | 0 (0.0%) | 1 (3.8%) |
| 65 to 74 Years | 0 (0.0%) | 0 (0.0%) |
| 75 Years and over | 0 (0.0%) | 0 (0.0%) |
Technology Access in Roosevelt
Computing Device Access in Roosevelt
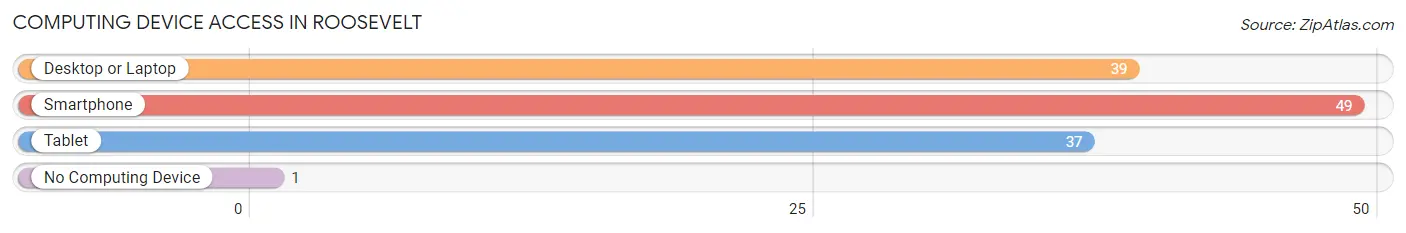
| Device Type | # Households | % Households |
| Desktop or Laptop | 39 | 72.2% |
| Smartphone | 49 | 90.7% |
| Tablet | 37 | 68.5% |
| No Computing Device | 1 | 1.8% |
| Total | 54 | 100.0% |
Internet Access in Roosevelt
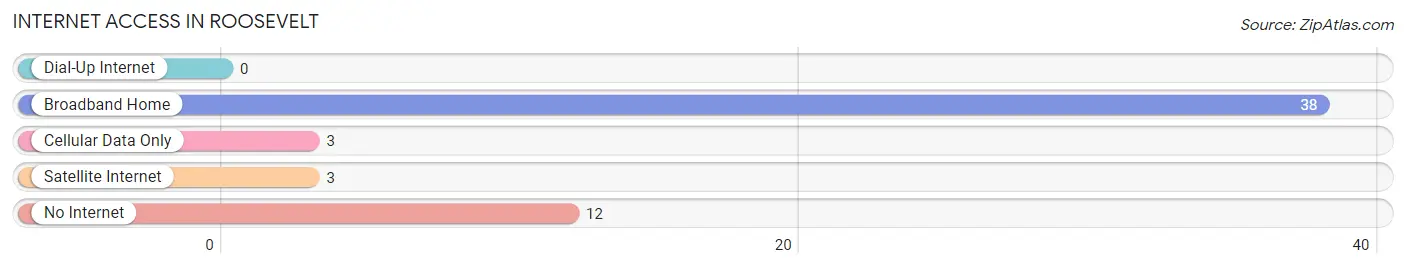
| Internet Type | # Households | % Households |
| Dial-Up Internet | 0 | 0.0% |
| Broadband Home | 38 | 70.4% |
| Cellular Data Only | 3 | 5.6% |
| Satellite Internet | 3 | 5.6% |
| No Internet | 12 | 22.2% |
| Total | 54 | 100.0% |
Roosevelt Summary
Roosevelt, Minnesota is a small city located in the northwestern corner of the state, just south of the Canadian border. It is part of the larger Kittson County, which is home to a population of just over 5,000 people. The city itself has a population of just over 1,000 people, making it one of the smallest cities in the state.
History
The area that is now Roosevelt was first settled in the late 1800s by Scandinavian immigrants. The city was officially incorporated in 1906 and was named after President Theodore Roosevelt. The city was originally a farming community, but it soon developed into a small industrial center. The city was home to a number of small businesses, including a sawmill, a flour mill, and a creamery.
Geography
Roosevelt is located in the northwestern corner of Minnesota, just south of the Canadian border. It is part of Kittson County, which is bordered by the Red River to the east and the Pembina River to the west. The city is situated on the banks of the Red River, which is a major tributary of the Mississippi River. The city is located in a flat, open area, with the nearest hills located several miles to the south.
Economy
The economy of Roosevelt is largely based on agriculture and manufacturing. The city is home to a number of small businesses, including a sawmill, a flour mill, and a creamery. The city is also home to a number of small retail stores, restaurants, and other services. The city is also home to a number of small industrial businesses, including a plastics factory and a metal fabrication plant.
Demographics
As of the 2010 census, the population of Roosevelt was 1,072. The racial makeup of the city was 97.2% White, 0.7% African American, 0.3% Native American, 0.2% Asian, 0.1% Pacific Islander, 0.3% from other races, and 1.3% from two or more races. Hispanic or Latino of any race were 1.3% of the population.
The median income for a household in the city was $37,500, and the median income for a family was $45,000. The per capita income for the city was $18,000. About 11.2% of families and 14.2% of the population were below the poverty line, including 18.2% of those under age 18 and 8.3% of those age 65 or over.
Roosevelt is a small city with a rich history and a diverse population. The city is home to a number of small businesses and industries, and it is a great place to live and work. The city is also home to a number of parks and recreational areas, making it a great place to spend time outdoors.
Common Questions
What is Per Capita Income in Roosevelt?
Per Capita income in Roosevelt is $25,341.
What is the Median Family Income in Roosevelt?
Median Family Income in Roosevelt is $61,875.
What is the Median Household income in Roosevelt?
Median Household Income in Roosevelt is $56,000.
What is Inequality or Gini Index in Roosevelt?
Inequality or Gini Index in Roosevelt is 0.22.
What is the Total Population of Roosevelt?
Total Population of Roosevelt is 175.
What is the Total Male Population of Roosevelt?
Total Male Population of Roosevelt is 106.
What is the Total Female Population of Roosevelt?
Total Female Population of Roosevelt is 69.
What is the Ratio of Males per 100 Females in Roosevelt?
There are 153.62 Males per 100 Females in Roosevelt.
What is the Ratio of Females per 100 Males in Roosevelt?
There are 65.09 Females per 100 Males in Roosevelt.
What is the Median Population Age in Roosevelt?
Median Population Age in Roosevelt is 36.3 Years.
What is the Average Family Size in Roosevelt
Average Family Size in Roosevelt is 3.7 People.
What is the Average Household Size in Roosevelt
Average Household Size in Roosevelt is 3.2 People.
How Large is the Labor Force in Roosevelt?
There are 101 People in the Labor Forcein in Roosevelt.
What is the Percentage of People in the Labor Force in Roosevelt?
73.7% of People are in the Labor Force in Roosevelt.