Renville, MN Map & Demographics
Renville Map
Renville Overview
$26,577
PER CAPITA INCOME
$58,942
AVG FAMILY INCOME
$64,412
AVG HOUSEHOLD INCOME
35.1%
WAGE / INCOME GAP [ % ]
64.9¢/ $1
WAGE / INCOME GAP [ $ ]
0.35
INEQUALITY / GINI INDEX
1,397
TOTAL POPULATION
680
MALE POPULATION
717
FEMALE POPULATION
94.84
MALES / 100 FEMALES
105.44
FEMALES / 100 MALES
31.7
MEDIAN AGE
3.3
AVG FAMILY SIZE
2.7
AVG HOUSEHOLD SIZE
644
LABOR FORCE [ PEOPLE ]
65.3%
PERCENT IN LABOR FORCE
6.7%
UNEMPLOYMENT RATE
Renville Zip Codes
Renville Area Codes
Income in Renville
Income Overview in Renville
Per Capita Income in Renville is $26,577, while median incomes of families and households are $58,942 and $64,412 respectively.
| Characteristic | Number | Measure |
| Per Capita Income | 1,397 | $26,577 |
| Median Family Income | 347 | $58,942 |
| Mean Family Income | 347 | $74,831 |
| Median Household Income | 490 | $64,412 |
| Mean Household Income | 490 | $71,049 |
| Income Deficit | 347 | $0 |
| Wage / Income Gap (%) | 1,397 | 35.08% |
| Wage / Income Gap ($) | 1,397 | 64.92¢ per $1 |
| Gini / Inequality Index | 1,397 | 0.35 |
Earnings by Sex in Renville
Average Earnings in Renville are $42,952, $53,914 for men and $35,000 for women, a difference of 35.1%.
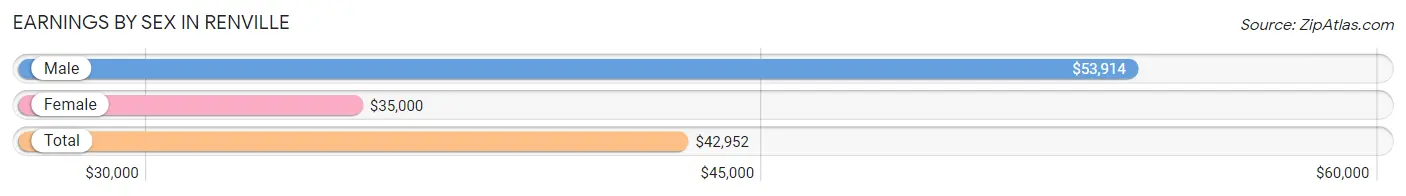
| Sex | Number | Average Earnings |
| Male | 349 (52.2%) | $53,914 |
| Female | 320 (47.8%) | $35,000 |
| Total | 669 (100.0%) | $42,952 |
Earnings by Sex by Income Bracket in Renville
The most common earnings brackets in Renville are $55,000 to $64,999 for men (81 | 23.2%) and $40,000 to $44,999 for women (50 | 15.6%).
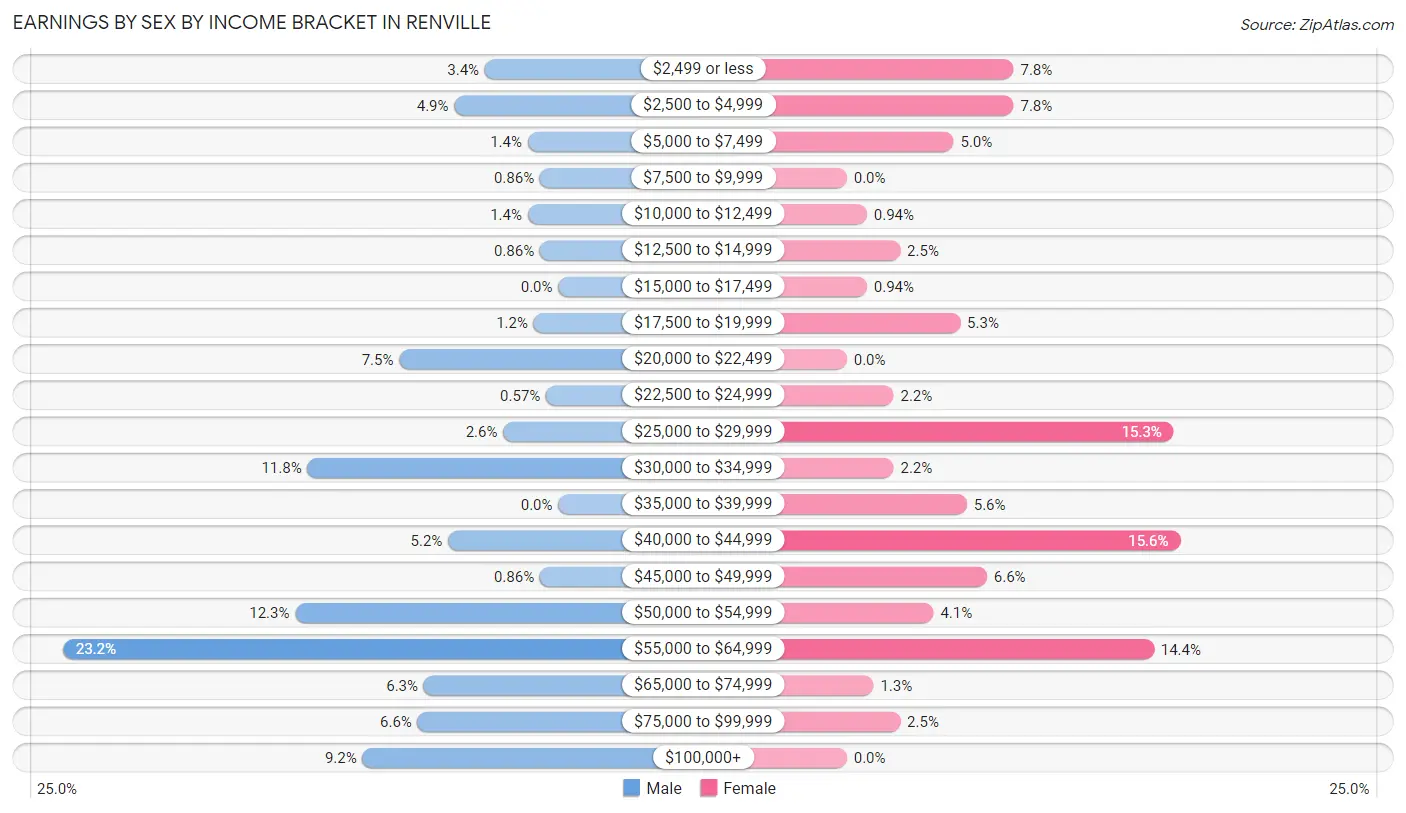
| Income | Male | Female |
| $2,499 or less | 12 (3.4%) | 25 (7.8%) |
| $2,500 to $4,999 | 17 (4.9%) | 25 (7.8%) |
| $5,000 to $7,499 | 5 (1.4%) | 16 (5.0%) |
| $7,500 to $9,999 | 3 (0.9%) | 0 (0.0%) |
| $10,000 to $12,499 | 5 (1.4%) | 3 (0.9%) |
| $12,500 to $14,999 | 3 (0.9%) | 8 (2.5%) |
| $15,000 to $17,499 | 0 (0.0%) | 3 (0.9%) |
| $17,500 to $19,999 | 4 (1.1%) | 17 (5.3%) |
| $20,000 to $22,499 | 26 (7.4%) | 0 (0.0%) |
| $22,500 to $24,999 | 2 (0.6%) | 7 (2.2%) |
| $25,000 to $29,999 | 9 (2.6%) | 49 (15.3%) |
| $30,000 to $34,999 | 41 (11.7%) | 7 (2.2%) |
| $35,000 to $39,999 | 0 (0.0%) | 18 (5.6%) |
| $40,000 to $44,999 | 18 (5.2%) | 50 (15.6%) |
| $45,000 to $49,999 | 3 (0.9%) | 21 (6.6%) |
| $50,000 to $54,999 | 43 (12.3%) | 13 (4.1%) |
| $55,000 to $64,999 | 81 (23.2%) | 46 (14.4%) |
| $65,000 to $74,999 | 22 (6.3%) | 4 (1.3%) |
| $75,000 to $99,999 | 23 (6.6%) | 8 (2.5%) |
| $100,000+ | 32 (9.2%) | 0 (0.0%) |
| Total | 349 (100.0%) | 320 (100.0%) |
Earnings by Sex by Educational Attainment in Renville
Average earnings in Renville are $54,309 for men and $40,417 for women, a difference of 25.6%. Men with an educational attainment of high school diploma enjoy the highest average annual earnings of $58,370, while those with bachelor's degree education earn the least with $40,625. Women with an educational attainment of bachelor's degree earn the most with the average annual earnings of $44,500, while those with college or associate's degree education have the smallest earnings of $43,750.
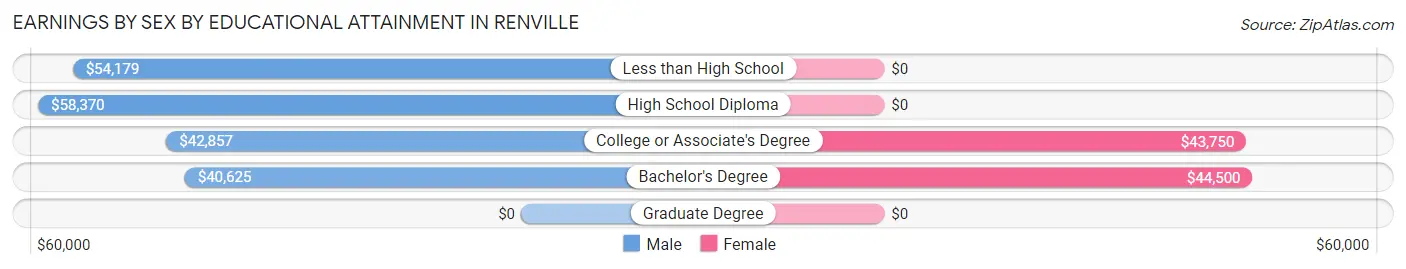
| Educational Attainment | Male Income | Female Income |
| Less than High School | $54,179 | $0 |
| High School Diploma | $58,370 | $0 |
| College or Associate's Degree | $42,857 | $43,750 |
| Bachelor's Degree | $40,625 | $44,500 |
| Graduate Degree | - | - |
| Total | $54,309 | $40,417 |
Family Income in Renville
Family Income Brackets in Renville
According to the Renville family income data, there are 92 families falling into the $50,000 to $74,999 income range, which is the most common income bracket and makes up 26.5% of all families. Conversely, the $200,000+ income bracket is the least frequent group with only 8 families (2.3%) belonging to this category.
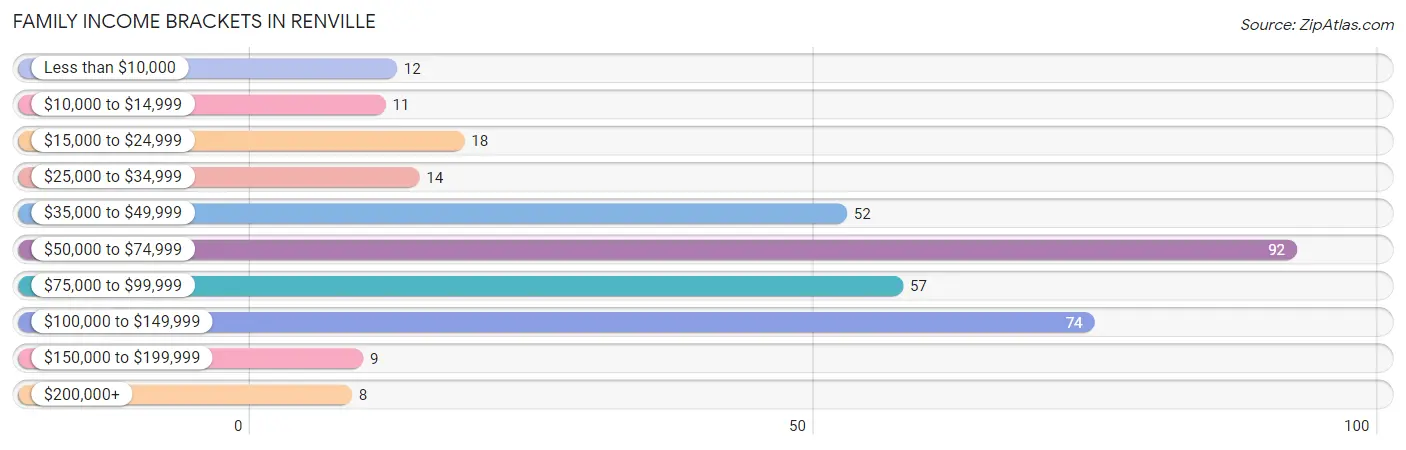
| Income Bracket | # Families | % Families |
| Less than $10,000 | 12 | 3.5% |
| $10,000 to $14,999 | 11 | 3.2% |
| $15,000 to $24,999 | 18 | 5.2% |
| $25,000 to $34,999 | 14 | 4.0% |
| $35,000 to $49,999 | 52 | 15.0% |
| $50,000 to $74,999 | 92 | 26.5% |
| $75,000 to $99,999 | 57 | 16.4% |
| $100,000 to $149,999 | 74 | 21.3% |
| $150,000 to $199,999 | 9 | 2.6% |
| $200,000+ | 8 | 2.3% |
Family Income by Famaliy Size in Renville
3-person families (35 | 10.1%) account for the highest median family income in Renville with $104,625 per family, while 3-person families (35 | 10.1%) have the highest median income of $34,875 per family member.
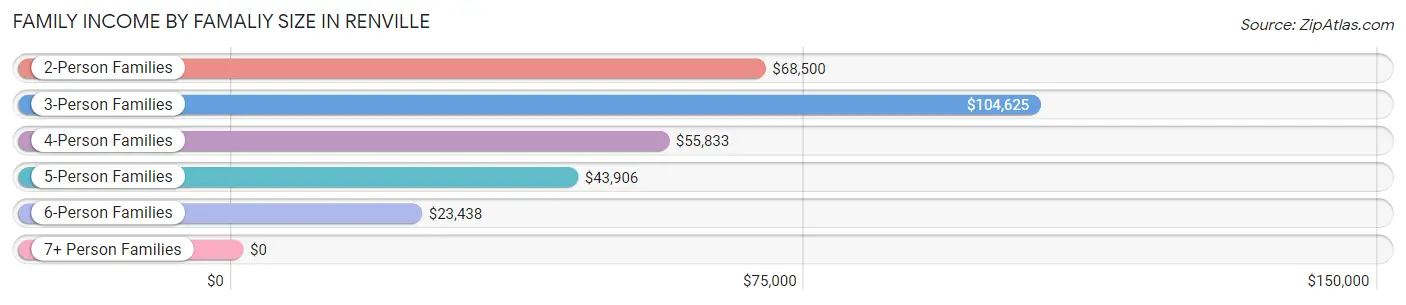
| Income Bracket | # Families | Median Income |
| 2-Person Families | 184 (53.0%) | $68,500 |
| 3-Person Families | 35 (10.1%) | $104,625 |
| 4-Person Families | 72 (20.7%) | $55,833 |
| 5-Person Families | 19 (5.5%) | $43,906 |
| 6-Person Families | 34 (9.8%) | $23,438 |
| 7+ Person Families | 3 (0.9%) | $0 |
| Total | 347 (100.0%) | $58,942 |
Family Income by Number of Earners in Renville
The median family income in Renville is $58,942, with families comprising 3+ earners (27) having the highest median family income of $103,125, while families with no earners (36) have the lowest median family income of $52,500, accounting for 7.8% and 10.4% of families, respectively.
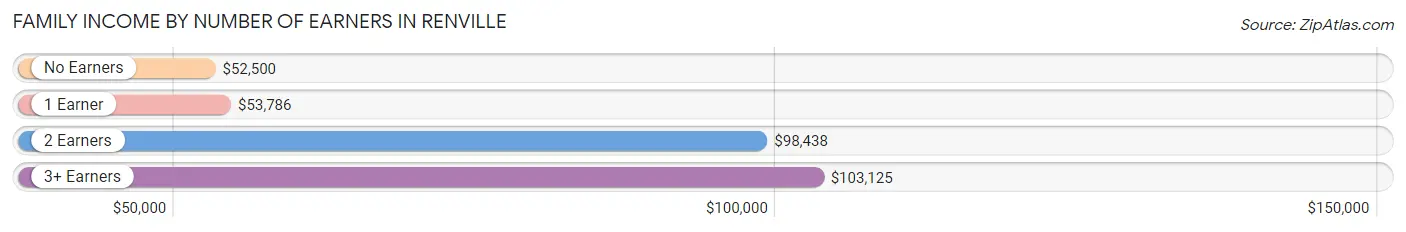
| Number of Earners | # Families | Median Income |
| No Earners | 36 (10.4%) | $52,500 |
| 1 Earner | 162 (46.7%) | $53,786 |
| 2 Earners | 122 (35.2%) | $98,438 |
| 3+ Earners | 27 (7.8%) | $103,125 |
| Total | 347 (100.0%) | $58,942 |
Household Income in Renville
Household Income Brackets in Renville
With 106 households falling in the category, the $75,000 to $99,999 income range is the most frequent in Renville, accounting for 21.6% of all households. In contrast, only 8 households (1.6%) fall into the $200,000+ income bracket, making it the least populous group.

| Income Bracket | # Households | % Households |
| Less than $10,000 | 16 | 3.3% |
| $10,000 to $14,999 | 18 | 3.7% |
| $15,000 to $24,999 | 47 | 9.6% |
| $25,000 to $34,999 | 44 | 9.0% |
| $35,000 to $49,999 | 54 | 11.0% |
| $50,000 to $74,999 | 88 | 18.0% |
| $75,000 to $99,999 | 106 | 21.6% |
| $100,000 to $149,999 | 100 | 20.4% |
| $150,000 to $199,999 | 9 | 1.8% |
| $200,000+ | 8 | 1.6% |
Household Income by Householder Age in Renville
The median household income in Renville is $64,412, with the highest median household income of $89,000 found in the 45 to 64 years age bracket for the primary householder. A total of 98 households (20.0%) fall into this category. Meanwhile, the 15 to 24 years age bracket for the primary householder has the lowest median household income of $0, with 21 households (4.3%) in this group.
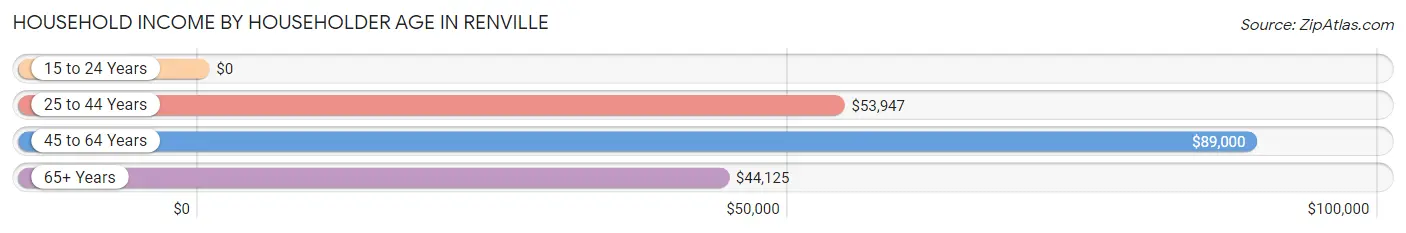
| Income Bracket | # Households | Median Income |
| 15 to 24 Years | 21 (4.3%) | $0 |
| 25 to 44 Years | 246 (50.2%) | $53,947 |
| 45 to 64 Years | 98 (20.0%) | $89,000 |
| 65+ Years | 125 (25.5%) | $44,125 |
| Total | 490 (100.0%) | $64,412 |
Poverty in Renville
Income Below Poverty by Sex and Age in Renville
With 12.6% poverty level for males and 19.5% for females among the residents of Renville, 16 and 17 year old males and 5 year old females are the most vulnerable to poverty, with 11 males (100.0%) and 15 females (62.5%) in their respective age groups living below the poverty level.
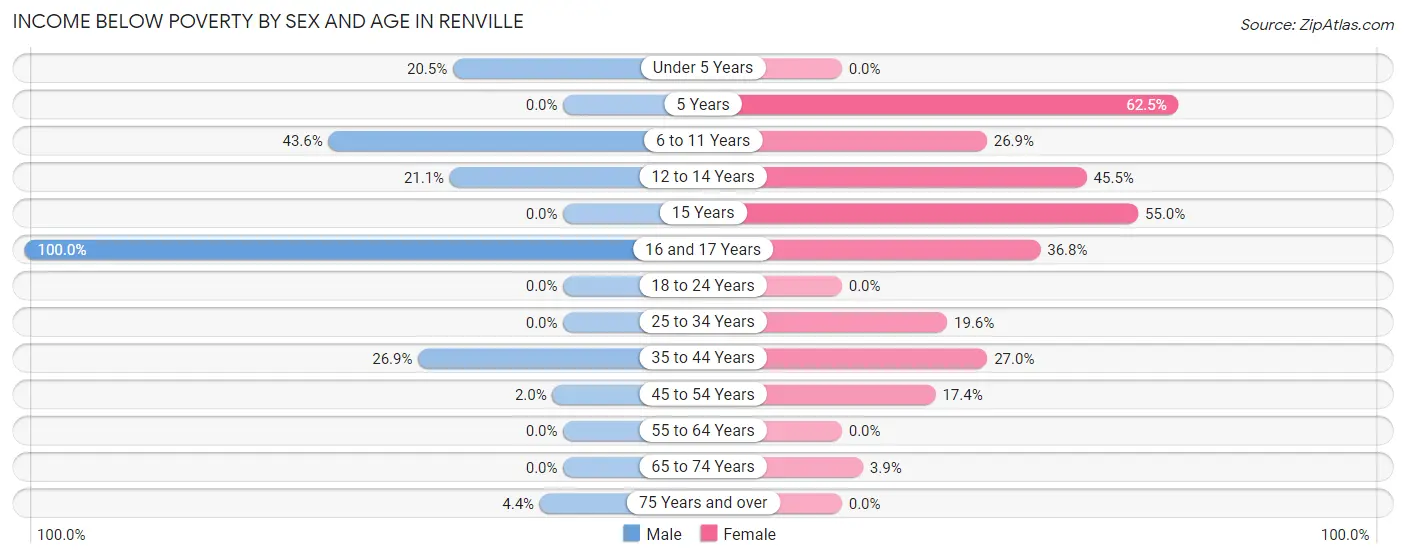
| Age Bracket | Male | Female |
| Under 5 Years | 17 (20.5%) | 0 (0.0%) |
| 5 Years | 0 (0.0%) | 15 (62.5%) |
| 6 to 11 Years | 17 (43.6%) | 35 (26.9%) |
| 12 to 14 Years | 8 (21.0%) | 5 (45.5%) |
| 15 Years | 0 (0.0%) | 11 (55.0%) |
| 16 and 17 Years | 11 (100.0%) | 7 (36.8%) |
| 18 to 24 Years | 0 (0.0%) | 0 (0.0%) |
| 25 to 34 Years | 0 (0.0%) | 26 (19.6%) |
| 35 to 44 Years | 28 (26.9%) | 27 (27.0%) |
| 45 to 54 Years | 1 (2.0%) | 4 (17.4%) |
| 55 to 64 Years | 0 (0.0%) | 0 (0.0%) |
| 65 to 74 Years | 0 (0.0%) | 2 (3.9%) |
| 75 Years and over | 2 (4.3%) | 0 (0.0%) |
| Total | 84 (12.6%) | 132 (19.5%) |
Income Above Poverty by Sex and Age in Renville
According to the poverty statistics in Renville, males aged 5 years and females aged under 5 years are the age groups that are most secure financially, with 100.0% of males and 100.0% of females in these age groups living above the poverty line.
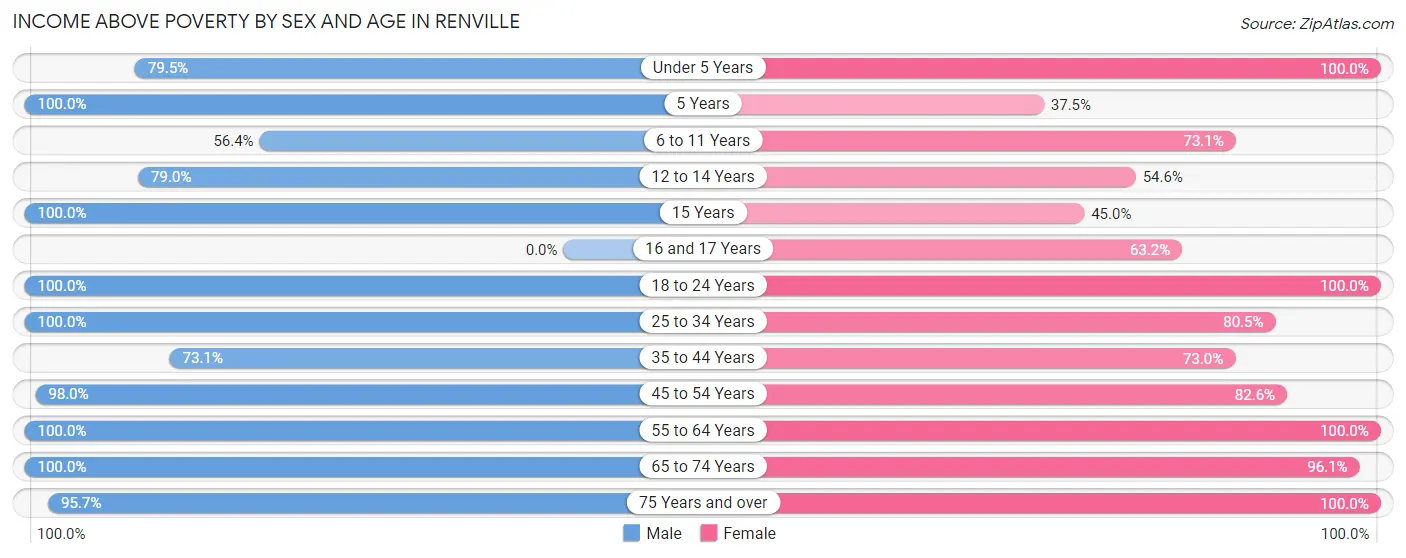
| Age Bracket | Male | Female |
| Under 5 Years | 66 (79.5%) | 15 (100.0%) |
| 5 Years | 48 (100.0%) | 9 (37.5%) |
| 6 to 11 Years | 22 (56.4%) | 95 (73.1%) |
| 12 to 14 Years | 30 (78.9%) | 6 (54.5%) |
| 15 Years | 3 (100.0%) | 9 (45.0%) |
| 16 and 17 Years | 0 (0.0%) | 12 (63.2%) |
| 18 to 24 Years | 43 (100.0%) | 41 (100.0%) |
| 25 to 34 Years | 100 (100.0%) | 107 (80.4%) |
| 35 to 44 Years | 76 (73.1%) | 73 (73.0%) |
| 45 to 54 Years | 49 (98.0%) | 19 (82.6%) |
| 55 to 64 Years | 54 (100.0%) | 60 (100.0%) |
| 65 to 74 Years | 47 (100.0%) | 49 (96.1%) |
| 75 Years and over | 44 (95.7%) | 51 (100.0%) |
| Total | 582 (87.4%) | 546 (80.5%) |
Income Below Poverty Among Married-Couple Families in Renville
The poverty statistics for married-couple families in Renville show that 11.2% or 26 of the total 232 families live below the poverty line. Families with 3 or 4 children have the highest poverty rate of 63.0%, comprising of 17 families. On the other hand, families with 5 or more children have the lowest poverty rate of 0.0%, which includes 0 families.
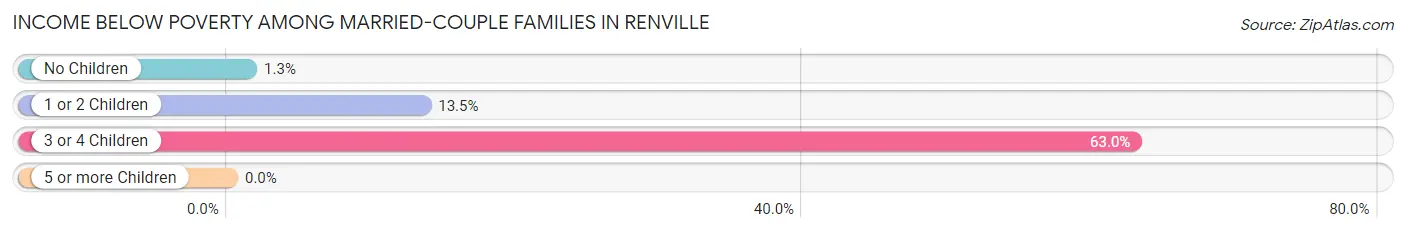
| Children | Above Poverty | Below Poverty |
| No Children | 148 (98.7%) | 2 (1.3%) |
| 1 or 2 Children | 45 (86.5%) | 7 (13.5%) |
| 3 or 4 Children | 10 (37.0%) | 17 (63.0%) |
| 5 or more Children | 3 (100.0%) | 0 (0.0%) |
| Total | 206 (88.8%) | 26 (11.2%) |
Income Below Poverty Among Single-Parent Households in Renville
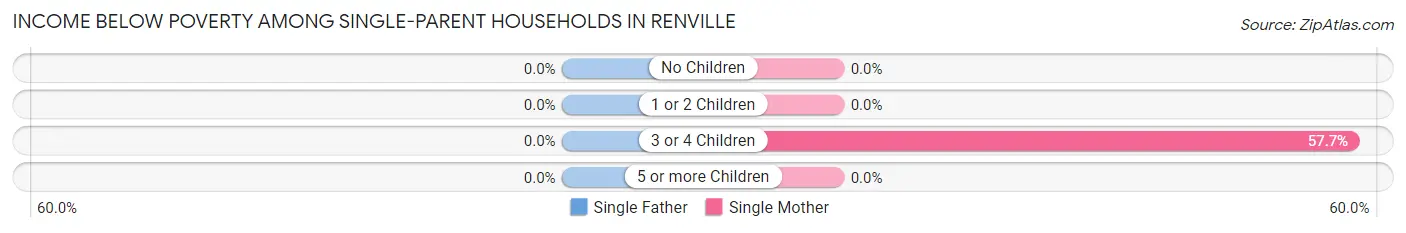
| Children | Single Father | Single Mother |
| No Children | 0 (0.0%) | 0 (0.0%) |
| 1 or 2 Children | 0 (0.0%) | 0 (0.0%) |
| 3 or 4 Children | 0 (0.0%) | 15 (57.7%) |
| 5 or more Children | 0 (0.0%) | 0 (0.0%) |
| Total | 0 (0.0%) | 15 (34.9%) |
Income Below Poverty Among Married-Couple vs Single-Parent Households in Renville
The poverty data for Renville shows that 26 of the married-couple family households (11.2%) and 15 of the single-parent households (13.0%) are living below the poverty level. Within the married-couple family households, those with 3 or 4 children have the highest poverty rate, with 17 households (63.0%) falling below the poverty line. Among the single-parent households, those with 3 or 4 children have the highest poverty rate, with 15 household (36.6%) living below poverty.
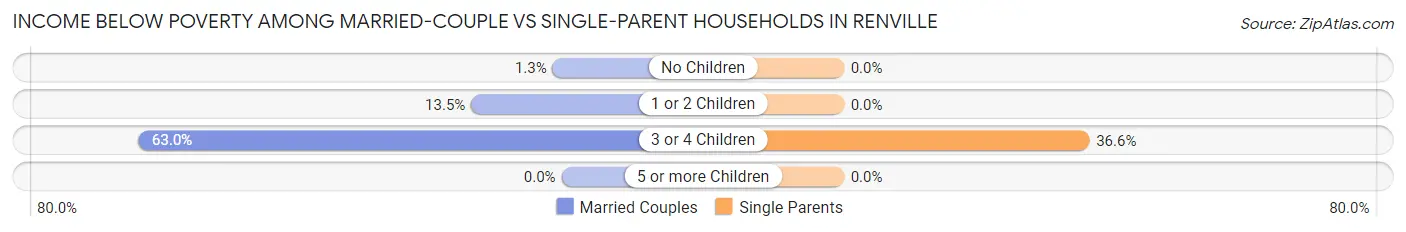
| Children | Married-Couple Families | Single-Parent Households |
| No Children | 2 (1.3%) | 0 (0.0%) |
| 1 or 2 Children | 7 (13.5%) | 0 (0.0%) |
| 3 or 4 Children | 17 (63.0%) | 15 (36.6%) |
| 5 or more Children | 0 (0.0%) | 0 (0.0%) |
| Total | 26 (11.2%) | 15 (13.0%) |
Race in Renville
The most populous races in Renville are White / Caucasian (1,064 | 76.2%), Hispanic or Latino (356 | 25.5%), and Some other Race (210 | 15.0%).
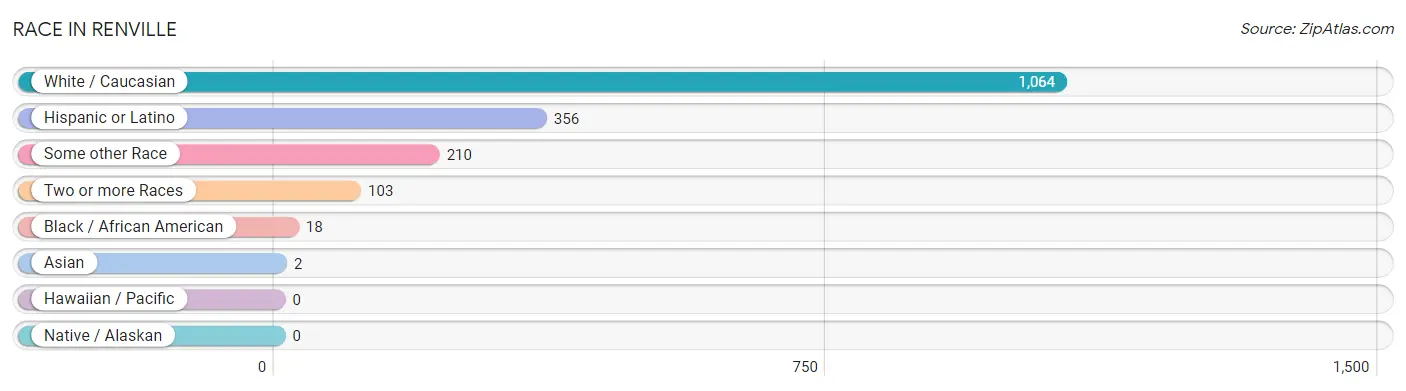
| Race | # Population | % Population |
| Asian | 2 | 0.1% |
| Black / African American | 18 | 1.3% |
| Hawaiian / Pacific | 0 | 0.0% |
| Hispanic or Latino | 356 | 25.5% |
| Native / Alaskan | 0 | 0.0% |
| White / Caucasian | 1,064 | 76.2% |
| Two or more Races | 103 | 7.4% |
| Some other Race | 210 | 15.0% |
| Total | 1,397 | 100.0% |
Ancestry in Renville
The most populous ancestries reported in Renville are German (456 | 32.6%), Mexican (348 | 24.9%), Norwegian (316 | 22.6%), Irish (230 | 16.5%), and Dutch (46 | 3.3%), together accounting for 99.9% of all Renville residents.
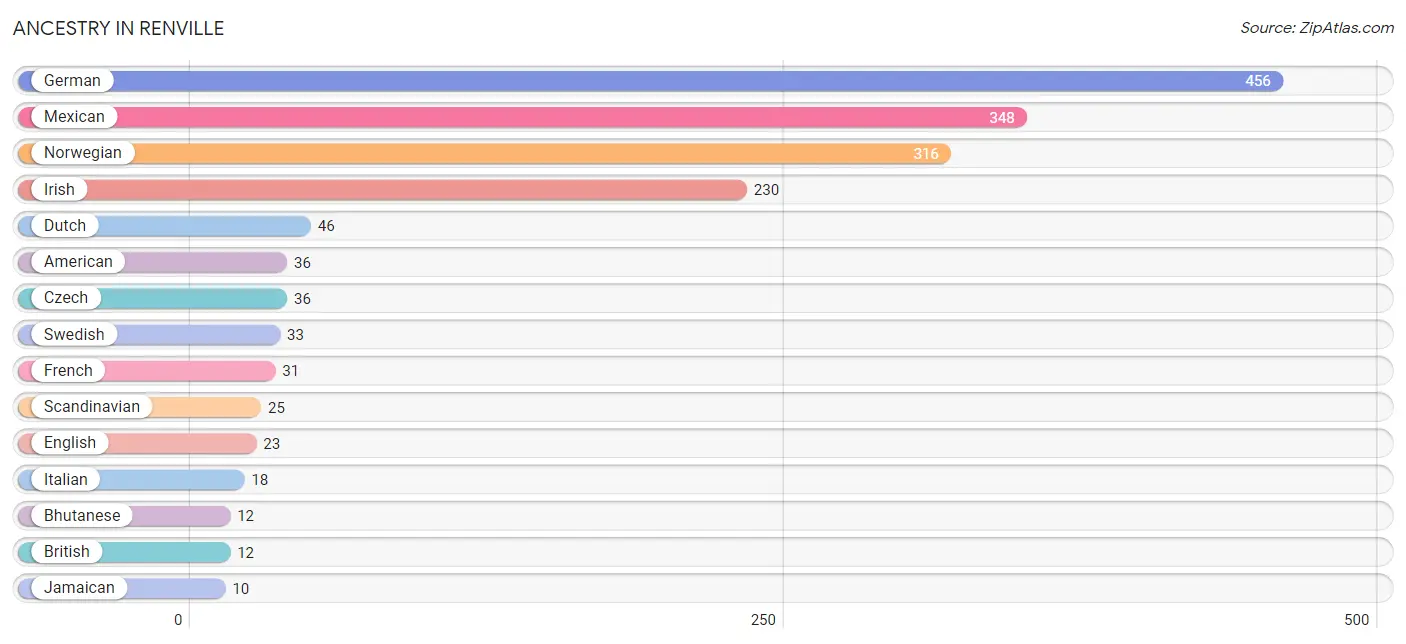
| Ancestry | # Population | % Population |
| American | 36 | 2.6% |
| Arab | 4 | 0.3% |
| Bhutanese | 12 | 0.9% |
| British | 12 | 0.9% |
| Central American | 8 | 0.6% |
| Czech | 36 | 2.6% |
| Danish | 7 | 0.5% |
| Dutch | 46 | 3.3% |
| Egyptian | 4 | 0.3% |
| English | 23 | 1.7% |
| Finnish | 3 | 0.2% |
| French | 31 | 2.2% |
| German | 456 | 32.6% |
| Guatemalan | 8 | 0.6% |
| Irish | 230 | 16.5% |
| Italian | 18 | 1.3% |
| Jamaican | 10 | 0.7% |
| Korean | 2 | 0.1% |
| Mexican | 348 | 24.9% |
| Norwegian | 316 | 22.6% |
| Polish | 9 | 0.6% |
| Scandinavian | 25 | 1.8% |
| Scotch-Irish | 3 | 0.2% |
| Scottish | 5 | 0.4% |
| Swedish | 33 | 2.4% | View All 25 Rows |
Immigrants in Renville
The most numerous immigrant groups reported in Renville came from Central America (27 | 1.9%), Latin America (27 | 1.9%), Mexico (23 | 1.7%), Asia (6 | 0.4%), and Guatemala (4 | 0.3%), together accounting for 6.2% of all Renville residents.
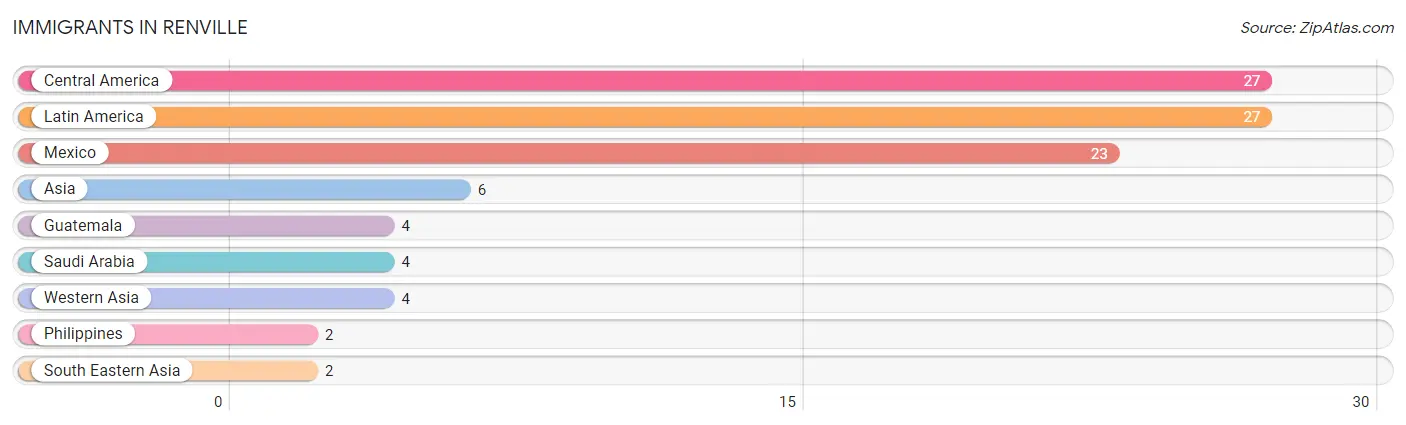
| Immigration Origin | # Population | % Population |
| Asia | 6 | 0.4% |
| Central America | 27 | 1.9% |
| Guatemala | 4 | 0.3% |
| Latin America | 27 | 1.9% |
| Mexico | 23 | 1.7% |
| Philippines | 2 | 0.1% |
| Saudi Arabia | 4 | 0.3% |
| South Eastern Asia | 2 | 0.1% |
| Western Asia | 4 | 0.3% | View All 9 Rows |
Sex and Age in Renville
Sex and Age in Renville
The most populous age groups in Renville are 5 to 9 Years (86 | 12.7%) for men and 5 to 9 Years (151 | 21.1%) for women.
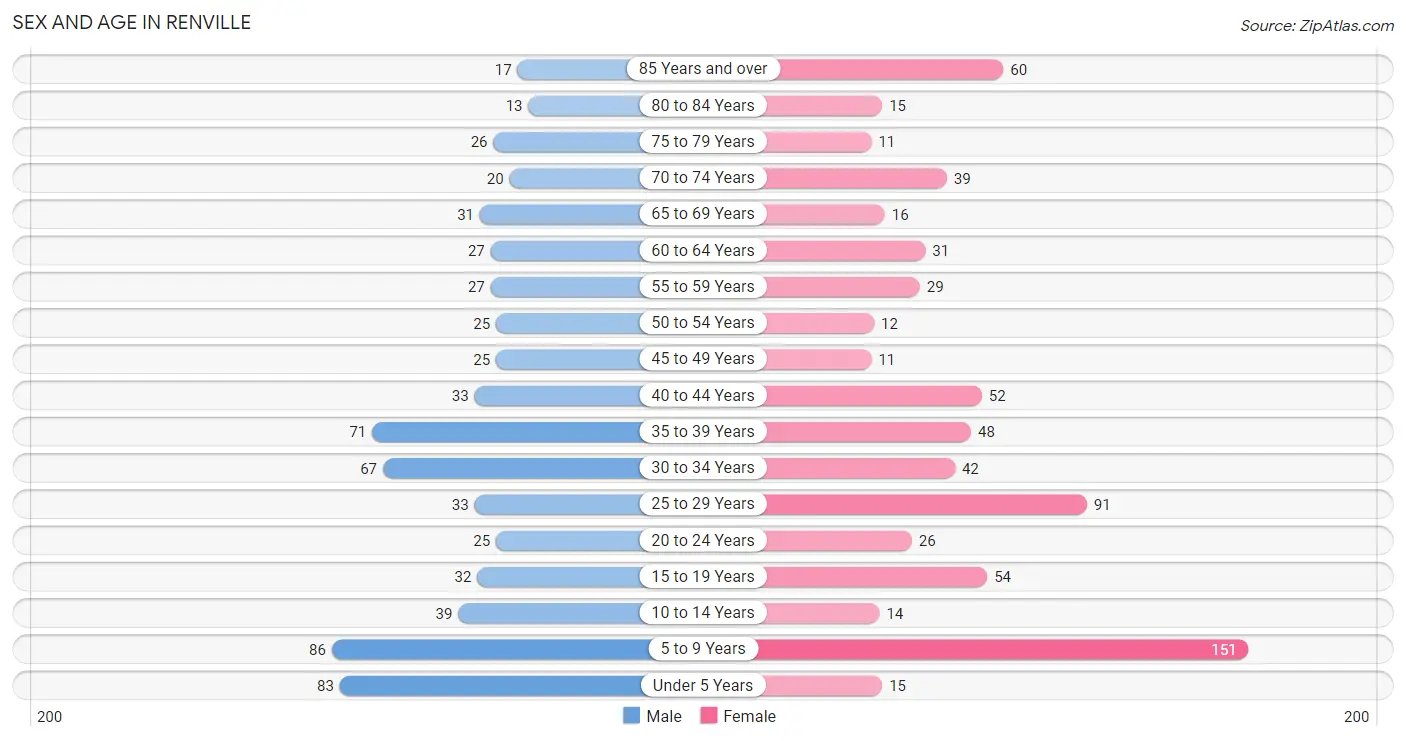
| Age Bracket | Male | Female |
| Under 5 Years | 83 (12.2%) | 15 (2.1%) |
| 5 to 9 Years | 86 (12.7%) | 151 (21.1%) |
| 10 to 14 Years | 39 (5.7%) | 14 (1.9%) |
| 15 to 19 Years | 32 (4.7%) | 54 (7.5%) |
| 20 to 24 Years | 25 (3.7%) | 26 (3.6%) |
| 25 to 29 Years | 33 (4.9%) | 91 (12.7%) |
| 30 to 34 Years | 67 (9.9%) | 42 (5.9%) |
| 35 to 39 Years | 71 (10.4%) | 48 (6.7%) |
| 40 to 44 Years | 33 (4.9%) | 52 (7.2%) |
| 45 to 49 Years | 25 (3.7%) | 11 (1.5%) |
| 50 to 54 Years | 25 (3.7%) | 12 (1.7%) |
| 55 to 59 Years | 27 (4.0%) | 29 (4.0%) |
| 60 to 64 Years | 27 (4.0%) | 31 (4.3%) |
| 65 to 69 Years | 31 (4.6%) | 16 (2.2%) |
| 70 to 74 Years | 20 (2.9%) | 39 (5.4%) |
| 75 to 79 Years | 26 (3.8%) | 11 (1.5%) |
| 80 to 84 Years | 13 (1.9%) | 15 (2.1%) |
| 85 Years and over | 17 (2.5%) | 60 (8.4%) |
| Total | 680 (100.0%) | 717 (100.0%) |
Families and Households in Renville
Median Family Size in Renville
The median family size in Renville is 3.27 persons per family, with single female/mother families (43 | 12.4%) accounting for the largest median family size of 4.37 persons per family. On the other hand, married-couple families (232 | 66.9%) represent the smallest median family size with 3.01 persons per family.
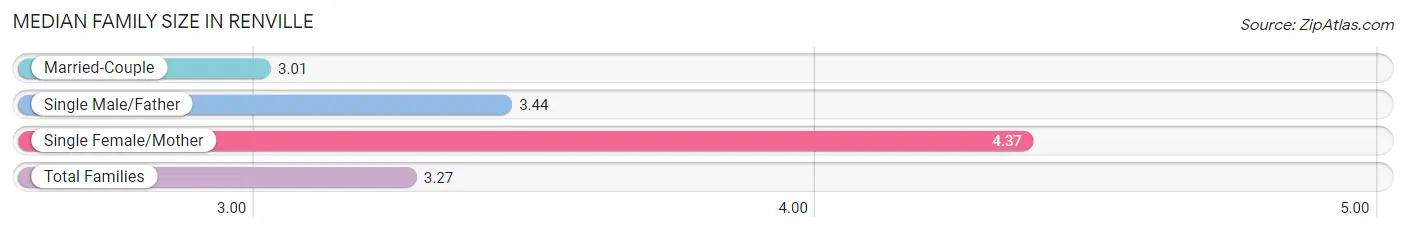
| Family Type | # Families | Family Size |
| Married-Couple | 232 (66.9%) | 3.01 |
| Single Male/Father | 72 (20.7%) | 3.44 |
| Single Female/Mother | 43 (12.4%) | 4.37 |
| Total Families | 347 (100.0%) | 3.27 |
Median Household Size in Renville
The median household size in Renville is 2.73 persons per household, with single female/mother households (43 | 8.8%) accounting for the largest median household size of 4.58 persons per household. non-family households (143 | 29.2%) represent the smallest median household size with 1.17 persons per household.
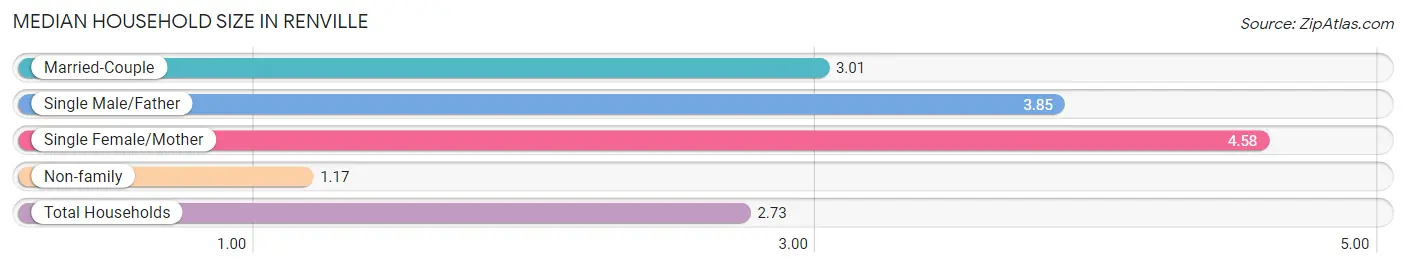
| Household Type | # Households | Household Size |
| Married-Couple | 232 (47.3%) | 3.01 |
| Single Male/Father | 72 (14.7%) | 3.85 |
| Single Female/Mother | 43 (8.8%) | 4.58 |
| Non-family | 143 (29.2%) | 1.17 |
| Total Households | 490 (100.0%) | 2.73 |
Household Size by Marriage Status in Renville
Out of a total of 490 households in Renville, 347 (70.8%) are family households, while 143 (29.2%) are nonfamily households. The most numerous type of family households are 2-person households, comprising 171, and the most common type of nonfamily households are 1-person households, comprising 122.
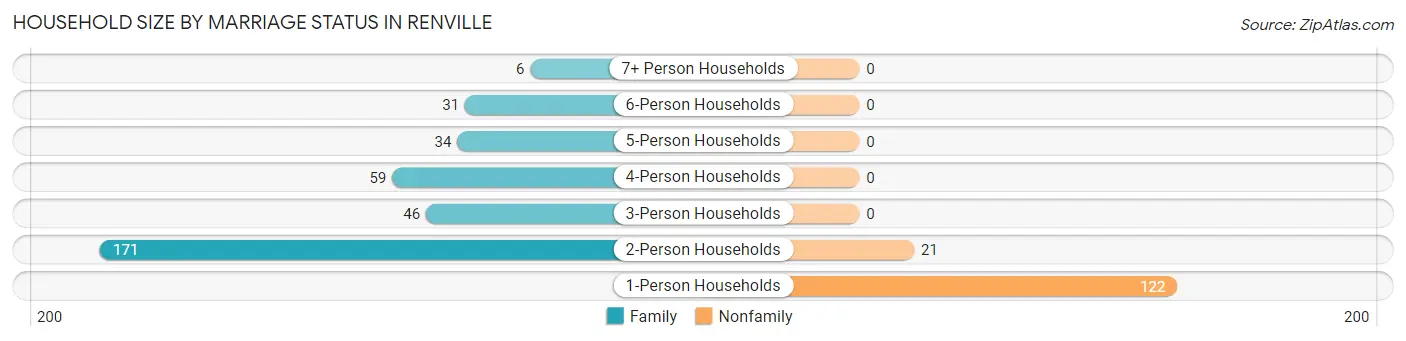
| Household Size | Family Households | Nonfamily Households |
| 1-Person Households | - | 122 (24.9%) |
| 2-Person Households | 171 (34.9%) | 21 (4.3%) |
| 3-Person Households | 46 (9.4%) | 0 (0.0%) |
| 4-Person Households | 59 (12.0%) | 0 (0.0%) |
| 5-Person Households | 34 (6.9%) | 0 (0.0%) |
| 6-Person Households | 31 (6.3%) | 0 (0.0%) |
| 7+ Person Households | 6 (1.2%) | 0 (0.0%) |
| Total | 347 (70.8%) | 143 (29.2%) |
Female Fertility in Renville
Fertility by Age in Renville
Average fertility rate in Renville is 12.0 births per 1,000 women. Women in the age bracket of 20 to 34 years have the highest fertility rate with 25.0 births per 1,000 women. Women in the age bracket of 20 to 34 years acount for 100.0% of all women with births.
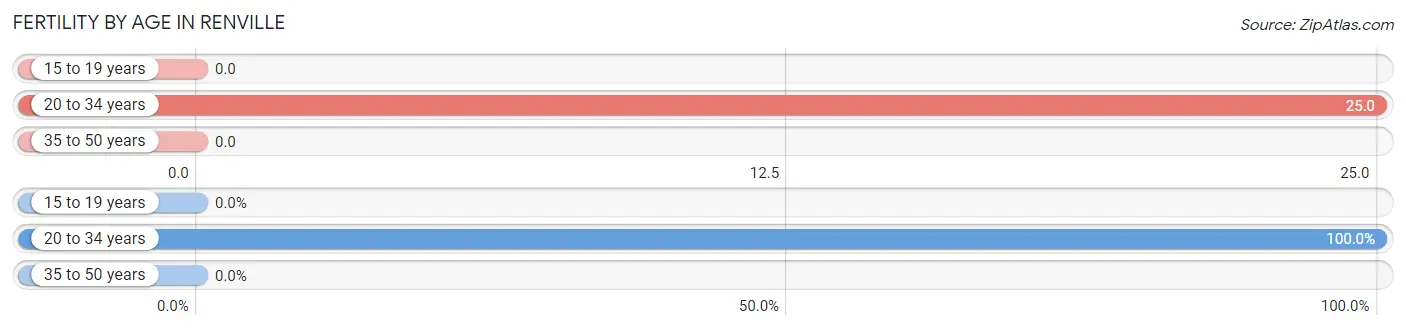
| Age Bracket | Women with Births | Births / 1,000 Women |
| 15 to 19 years | 0 (0.0%) | 0.0 |
| 20 to 34 years | 4 (100.0%) | 25.0 |
| 35 to 50 years | 0 (0.0%) | 0.0 |
| Total | 4 (100.0%) | 12.0 |
Fertility by Age by Marriage Status in Renville
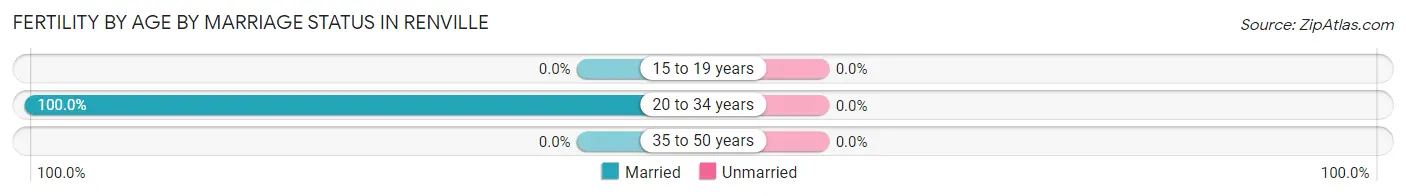
| Age Bracket | Married | Unmarried |
| 15 to 19 years | 0 (0.0%) | 0 (0.0%) |
| 20 to 34 years | 4 (100.0%) | 0 (0.0%) |
| 35 to 50 years | 0 (0.0%) | 0 (0.0%) |
| Total | 4 (100.0%) | 0 (0.0%) |
Fertility by Education in Renville
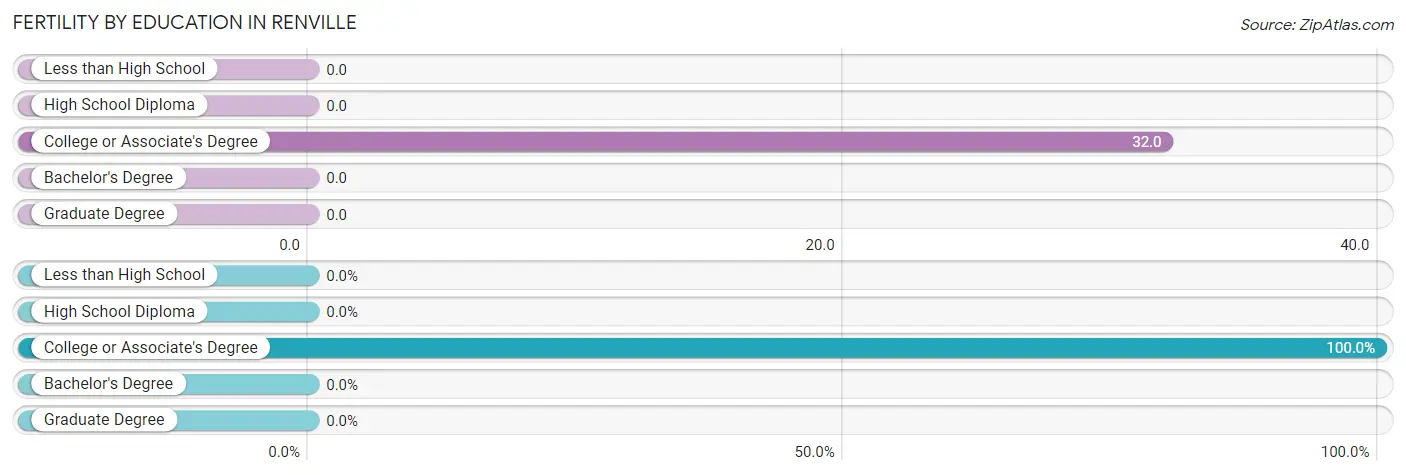
| Educational Attainment | Women with Births | Births / 1,000 Women |
| Less than High School | 0 (0.0%) | 0.0 |
| High School Diploma | 0 (0.0%) | 0.0 |
| College or Associate's Degree | 4 (100.0%) | 32.0 |
| Bachelor's Degree | 0 (0.0%) | 0.0 |
| Graduate Degree | 0 (0.0%) | 0.0 |
| Total | 4 (100.0%) | 12.0 |
Fertility by Education by Marriage Status in Renville
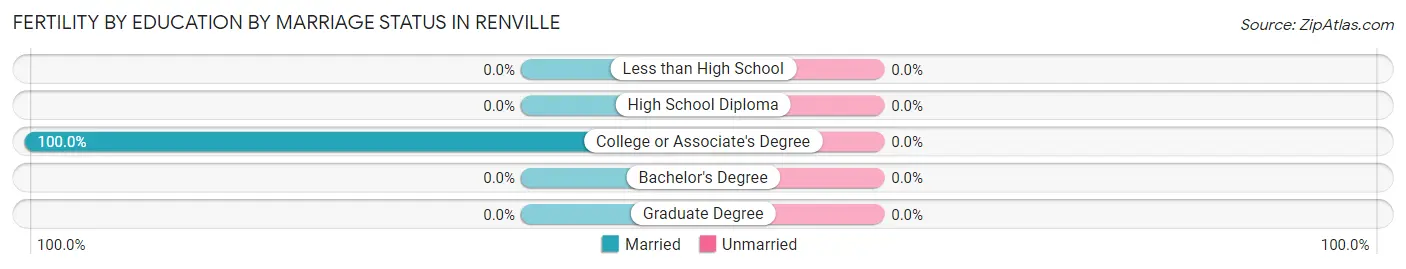
| Educational Attainment | Married | Unmarried |
| Less than High School | 0 (0.0%) | 0 (0.0%) |
| High School Diploma | 0 (0.0%) | 0 (0.0%) |
| College or Associate's Degree | 4 (100.0%) | 0 (0.0%) |
| Bachelor's Degree | 0 (0.0%) | 0 (0.0%) |
| Graduate Degree | 0 (0.0%) | 0 (0.0%) |
| Total | 4 (100.0%) | 0 (0.0%) |
Employment Characteristics in Renville
Employment by Class of Employer in Renville
Among the 583 employed individuals in Renville, private company employees (438 | 75.1%), not-for-profit organizations (66 | 11.3%), and local government employees (37 | 6.4%) make up the most common classes of employment.
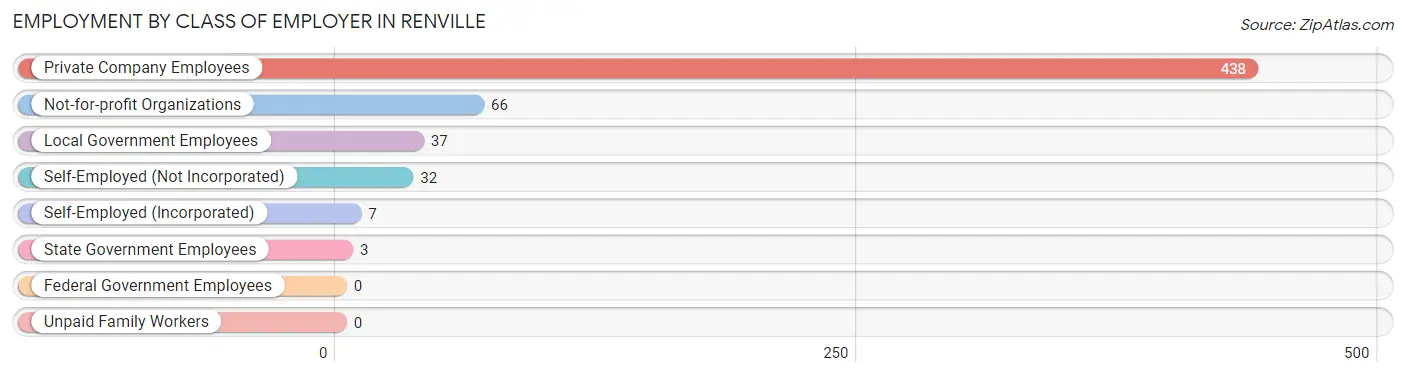
| Employer Class | # Employees | % Employees |
| Private Company Employees | 438 | 75.1% |
| Self-Employed (Incorporated) | 7 | 1.2% |
| Self-Employed (Not Incorporated) | 32 | 5.5% |
| Not-for-profit Organizations | 66 | 11.3% |
| Local Government Employees | 37 | 6.4% |
| State Government Employees | 3 | 0.5% |
| Federal Government Employees | 0 | 0.0% |
| Unpaid Family Workers | 0 | 0.0% |
| Total | 583 | 100.0% |
Employment Status by Age in Renville
According to the labor force statistics for Renville, out of the total population over 16 years of age (986), 65.3% or 644 individuals are in the labor force, with 6.7% or 43 of them unemployed. The age group with the highest labor force participation rate is 20 to 24 years, with 100.0% or 51 individuals in the labor force. Within the labor force, the 20 to 24 years age range has the highest percentage of unemployed individuals, with 29.4% or 15 of them being unemployed.
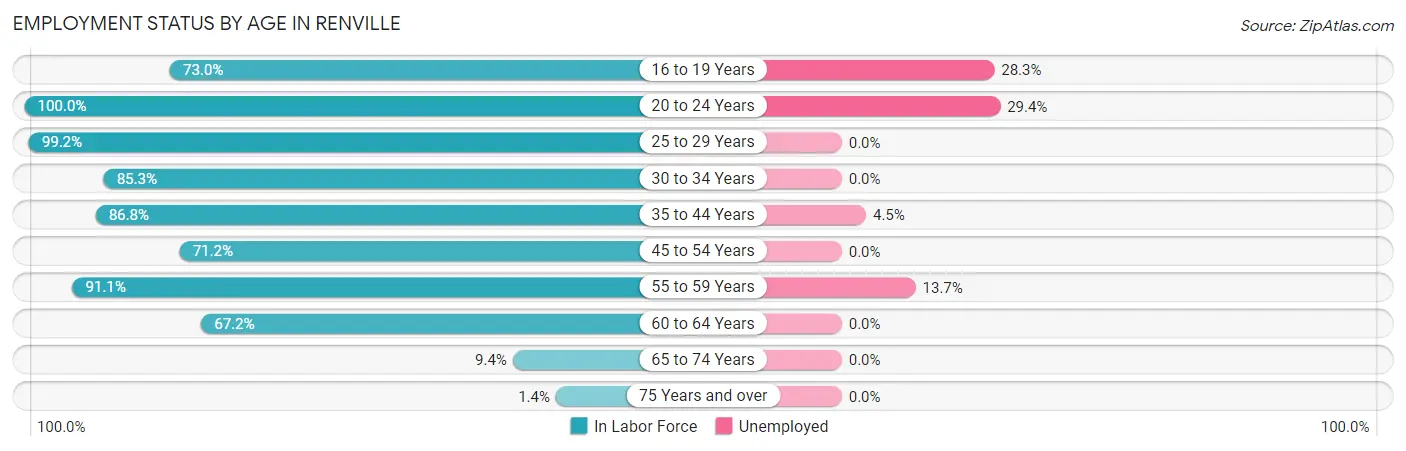
| Age Bracket | In Labor Force | Unemployed |
| 16 to 19 Years | 46 (73.0%) | 13 (28.3%) |
| 20 to 24 Years | 51 (100.0%) | 15 (29.4%) |
| 25 to 29 Years | 123 (99.2%) | 0 (0.0%) |
| 30 to 34 Years | 93 (85.3%) | 0 (0.0%) |
| 35 to 44 Years | 177 (86.8%) | 8 (4.5%) |
| 45 to 54 Years | 52 (71.2%) | 0 (0.0%) |
| 55 to 59 Years | 51 (91.1%) | 7 (13.7%) |
| 60 to 64 Years | 39 (67.2%) | 0 (0.0%) |
| 65 to 74 Years | 10 (9.4%) | 0 (0.0%) |
| 75 Years and over | 2 (1.4%) | 0 (0.0%) |
| Total | 644 (65.3%) | 43 (6.7%) |
Employment Status by Educational Attainment in Renville
According to labor force statistics for Renville, 85.7% of individuals (535) out of the total population between 25 and 64 years of age (624) are in the labor force, with 2.8% or 15 of them being unemployed. The group with the highest labor force participation rate are those with the educational attainment of high school diploma, with 91.2% or 156 individuals in the labor force. Within the labor force, individuals with less than high school education have the highest percentage of unemployment, with 11.9% or 8 of them being unemployed.

| Educational Attainment | In Labor Force | Unemployed |
| Less than High School | 67 (77.0%) | 10 (11.9%) |
| High School Diploma | 156 (91.2%) | 0 (0.0%) |
| College / Associate Degree | 238 (86.9%) | 8 (2.9%) |
| Bachelor's Degree or higher | 74 (80.4%) | 0 (0.0%) |
| Total | 535 (85.7%) | 17 (2.8%) |
Employment Occupations by Sex in Renville
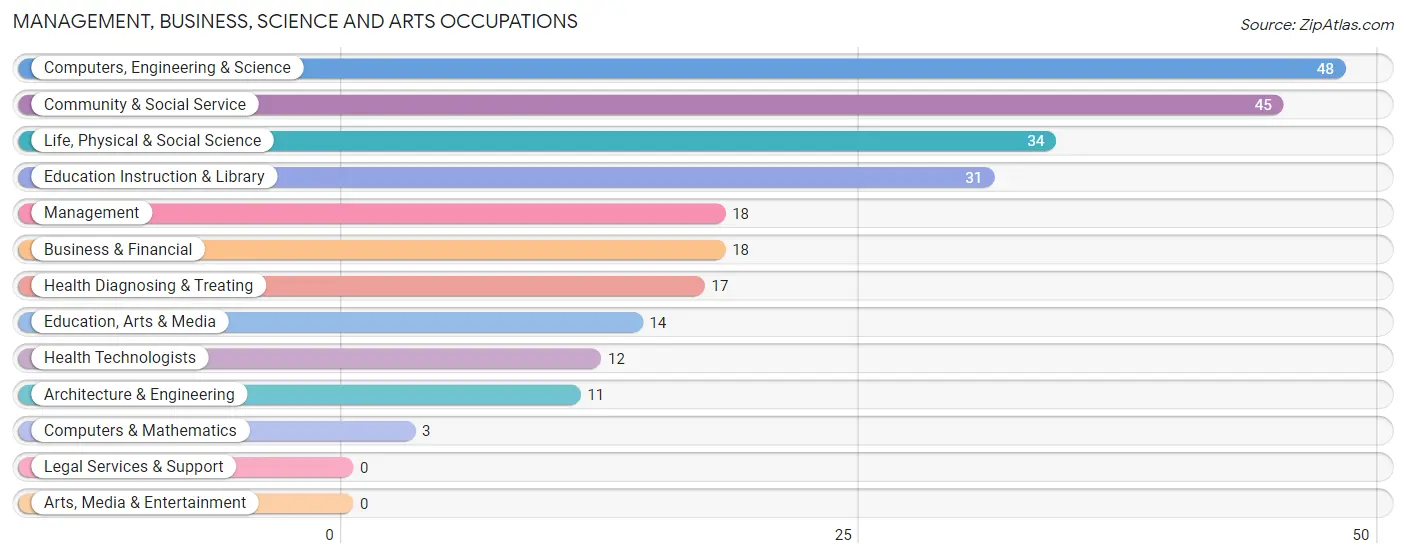
Management, Business, Science and Arts Occupations
The most common Management, Business, Science and Arts occupations in Renville are Computers, Engineering & Science (48 | 8.0%), Community & Social Service (45 | 7.5%), Life, Physical & Social Science (34 | 5.7%), Education Instruction & Library (31 | 5.2%), and Management (18 | 3.0%).
Management, Business, Science and Arts Occupations by Sex
Within the Management, Business, Science and Arts occupations in Renville, the most male-oriented occupations are Computers & Mathematics (100.0%), Architecture & Engineering (100.0%), and Business & Financial (83.3%), while the most female-oriented occupations are Health Diagnosing & Treating (100.0%), Health Technologists (100.0%), and Education, Arts & Media (85.7%).
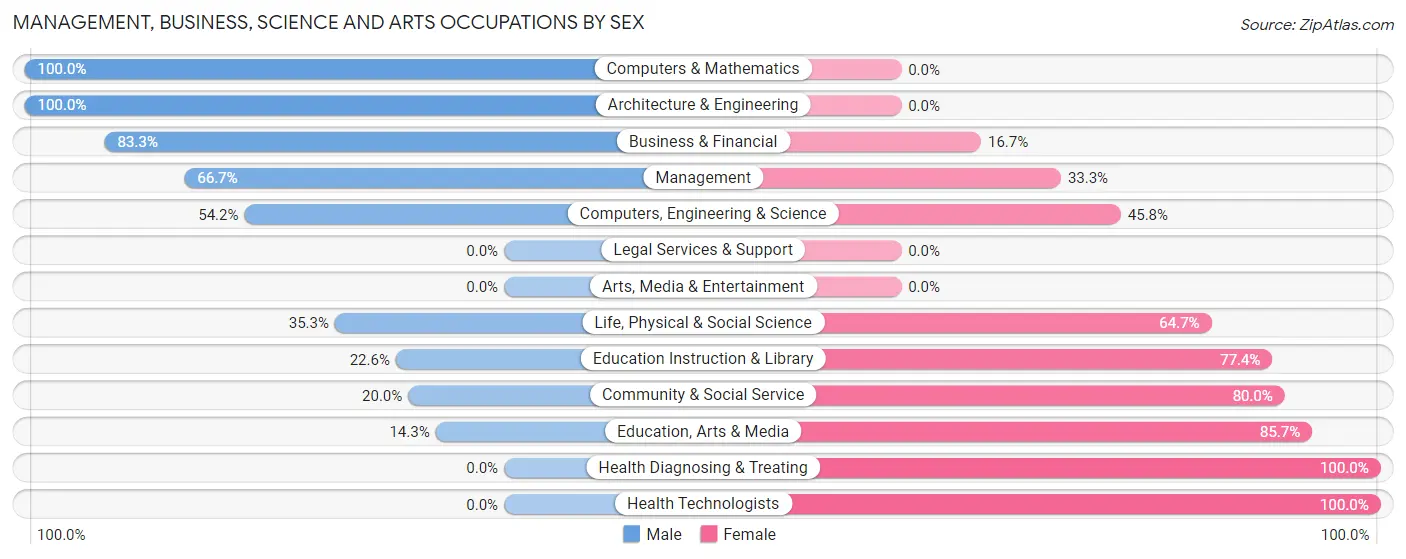
| Occupation | Male | Female |
| Management | 12 (66.7%) | 6 (33.3%) |
| Business & Financial | 15 (83.3%) | 3 (16.7%) |
| Computers, Engineering & Science | 26 (54.2%) | 22 (45.8%) |
| Computers & Mathematics | 3 (100.0%) | 0 (0.0%) |
| Architecture & Engineering | 11 (100.0%) | 0 (0.0%) |
| Life, Physical & Social Science | 12 (35.3%) | 22 (64.7%) |
| Community & Social Service | 9 (20.0%) | 36 (80.0%) |
| Education, Arts & Media | 2 (14.3%) | 12 (85.7%) |
| Legal Services & Support | 0 (0.0%) | 0 (0.0%) |
| Education Instruction & Library | 7 (22.6%) | 24 (77.4%) |
| Arts, Media & Entertainment | 0 (0.0%) | 0 (0.0%) |
| Health Diagnosing & Treating | 0 (0.0%) | 17 (100.0%) |
| Health Technologists | 0 (0.0%) | 12 (100.0%) |
| Total (Category) | 62 (42.5%) | 84 (57.5%) |
| Total (Overall) | 312 (51.9%) | 289 (48.1%) |
Services Occupations
The most common Services occupations in Renville are Healthcare Support (63 | 10.5%), Food Preparation & Serving (23 | 3.8%), Personal Care & Service (10 | 1.7%), and Cleaning & Maintenance (5 | 0.8%).
Services Occupations by Sex
Within the Services occupations in Renville, the most male-oriented occupations are Cleaning & Maintenance (20.0%), and Healthcare Support (1.6%), while the most female-oriented occupations are Food Preparation & Serving (100.0%), Personal Care & Service (100.0%), and Healthcare Support (98.4%).
| Occupation | Male | Female |
| Healthcare Support | 1 (1.6%) | 62 (98.4%) |
| Security & Protection | 0 (0.0%) | 0 (0.0%) |
| Firefighting & Prevention | 0 (0.0%) | 0 (0.0%) |
| Law Enforcement | 0 (0.0%) | 0 (0.0%) |
| Food Preparation & Serving | 0 (0.0%) | 23 (100.0%) |
| Cleaning & Maintenance | 1 (20.0%) | 4 (80.0%) |
| Personal Care & Service | 0 (0.0%) | 10 (100.0%) |
| Total (Category) | 2 (2.0%) | 99 (98.0%) |
| Total (Overall) | 312 (51.9%) | 289 (48.1%) |
Sales and Office Occupations
The most common Sales and Office occupations in Renville are Sales & Related (36 | 6.0%), and Office & Administration (36 | 6.0%).
Sales and Office Occupations by Sex
| Occupation | Male | Female |
| Sales & Related | 3 (8.3%) | 33 (91.7%) |
| Office & Administration | 5 (13.9%) | 31 (86.1%) |
| Total (Category) | 8 (11.1%) | 64 (88.9%) |
| Total (Overall) | 312 (51.9%) | 289 (48.1%) |
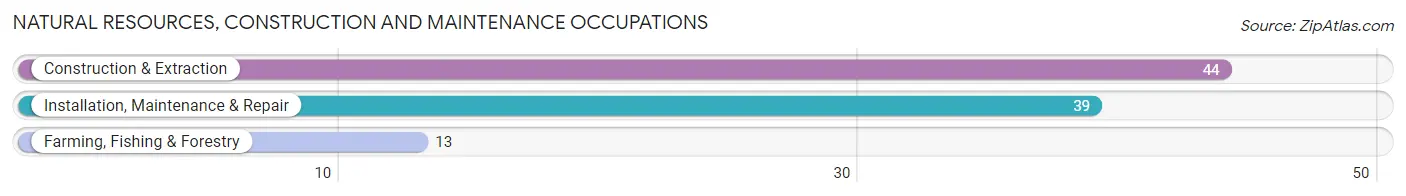
Natural Resources, Construction and Maintenance Occupations
The most common Natural Resources, Construction and Maintenance occupations in Renville are Construction & Extraction (44 | 7.3%), Installation, Maintenance & Repair (39 | 6.5%), and Farming, Fishing & Forestry (13 | 2.2%).
Natural Resources, Construction and Maintenance Occupations by Sex
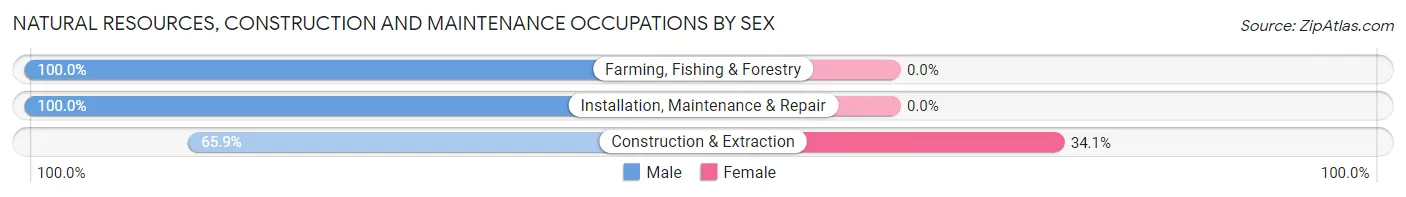
| Occupation | Male | Female |
| Farming, Fishing & Forestry | 13 (100.0%) | 0 (0.0%) |
| Construction & Extraction | 29 (65.9%) | 15 (34.1%) |
| Installation, Maintenance & Repair | 39 (100.0%) | 0 (0.0%) |
| Total (Category) | 81 (84.4%) | 15 (15.6%) |
| Total (Overall) | 312 (51.9%) | 289 (48.1%) |
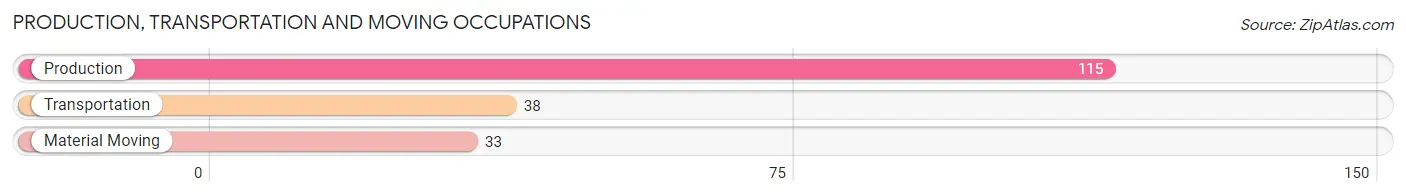
Production, Transportation and Moving Occupations
The most common Production, Transportation and Moving occupations in Renville are Production (115 | 19.1%), Transportation (38 | 6.3%), and Material Moving (33 | 5.5%).
Production, Transportation and Moving Occupations by Sex
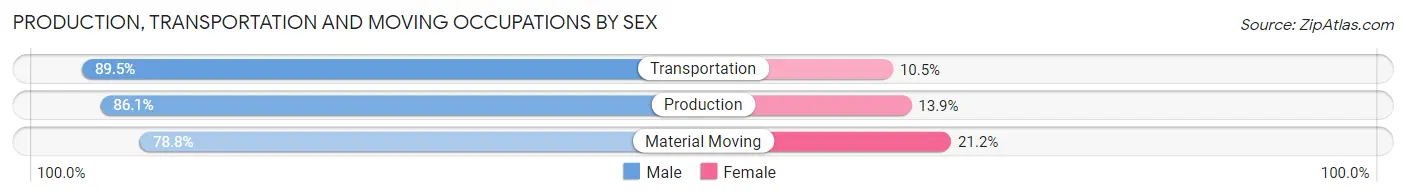
| Occupation | Male | Female |
| Production | 99 (86.1%) | 16 (13.9%) |
| Transportation | 34 (89.5%) | 4 (10.5%) |
| Material Moving | 26 (78.8%) | 7 (21.2%) |
| Total (Category) | 159 (85.5%) | 27 (14.5%) |
| Total (Overall) | 312 (51.9%) | 289 (48.1%) |
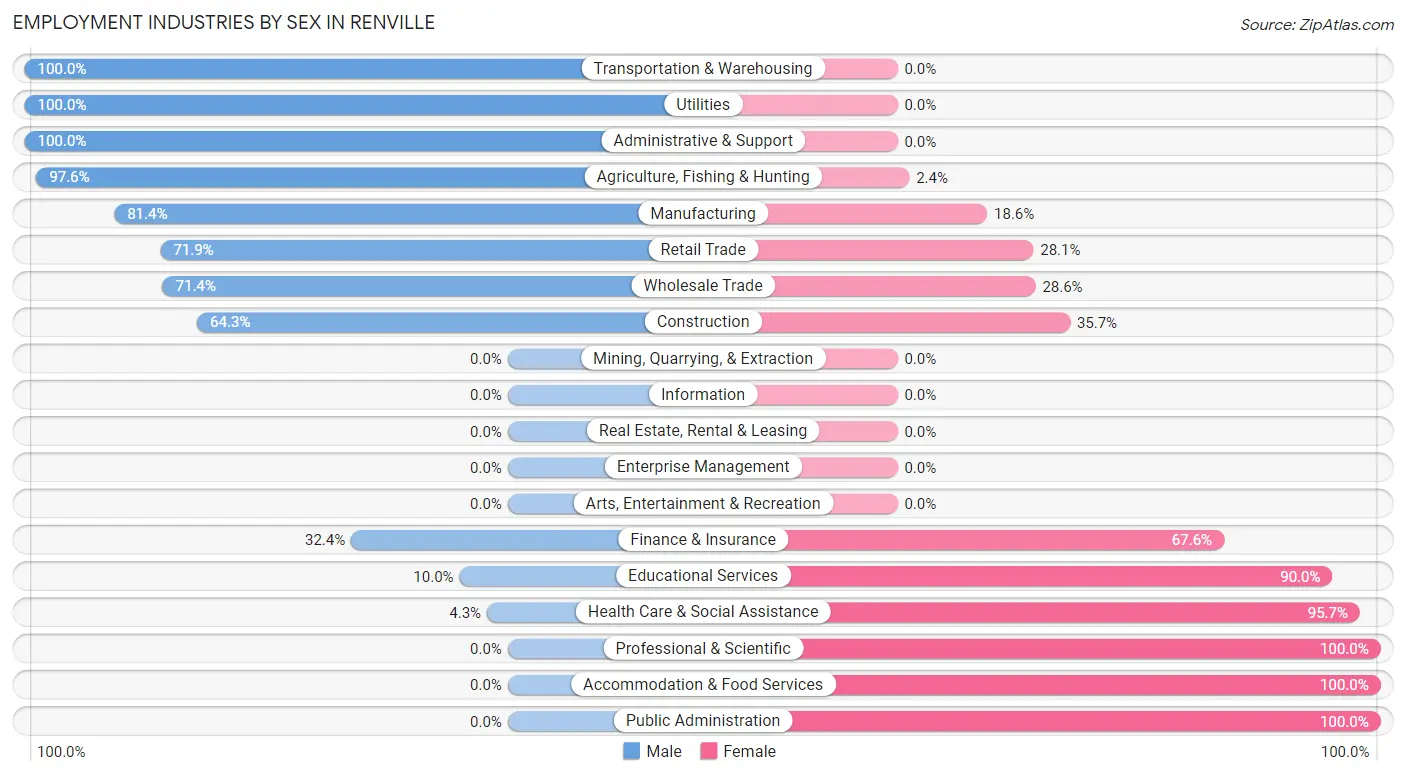
Employment Industries by Sex in Renville
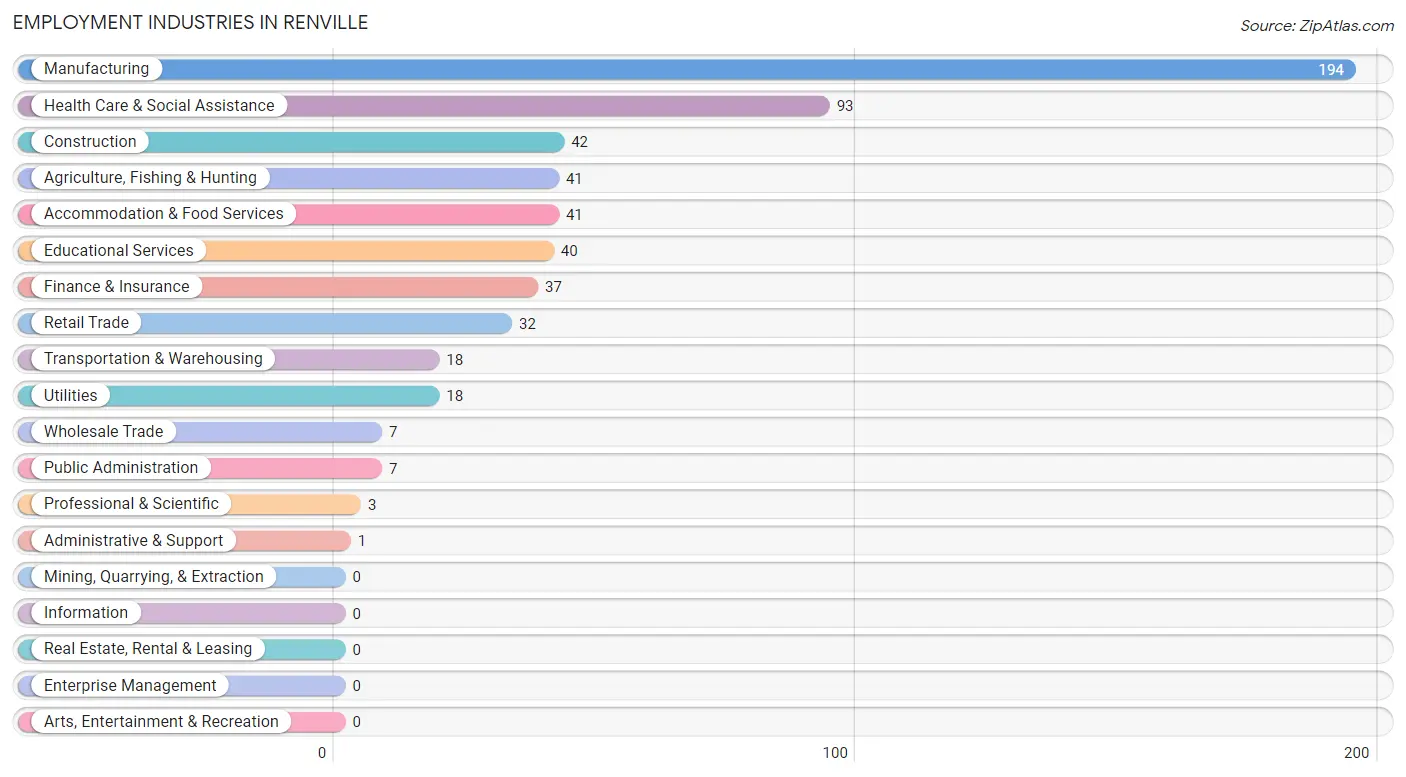
Employment Industries in Renville
The major employment industries in Renville include Manufacturing (194 | 32.3%), Health Care & Social Assistance (93 | 15.5%), Construction (42 | 7.0%), Agriculture, Fishing & Hunting (41 | 6.8%), and Accommodation & Food Services (41 | 6.8%).
Employment Industries by Sex in Renville
The Renville industries that see more men than women are Transportation & Warehousing (100.0%), Utilities (100.0%), and Administrative & Support (100.0%), whereas the industries that tend to have a higher number of women are Professional & Scientific (100.0%), Accommodation & Food Services (100.0%), and Public Administration (100.0%).
| Industry | Male | Female |
| Agriculture, Fishing & Hunting | 40 (97.6%) | 1 (2.4%) |
| Mining, Quarrying, & Extraction | 0 (0.0%) | 0 (0.0%) |
| Construction | 27 (64.3%) | 15 (35.7%) |
| Manufacturing | 158 (81.4%) | 36 (18.6%) |
| Wholesale Trade | 5 (71.4%) | 2 (28.6%) |
| Retail Trade | 23 (71.9%) | 9 (28.1%) |
| Transportation & Warehousing | 18 (100.0%) | 0 (0.0%) |
| Utilities | 18 (100.0%) | 0 (0.0%) |
| Information | 0 (0.0%) | 0 (0.0%) |
| Finance & Insurance | 12 (32.4%) | 25 (67.6%) |
| Real Estate, Rental & Leasing | 0 (0.0%) | 0 (0.0%) |
| Professional & Scientific | 0 (0.0%) | 3 (100.0%) |
| Enterprise Management | 0 (0.0%) | 0 (0.0%) |
| Administrative & Support | 1 (100.0%) | 0 (0.0%) |
| Educational Services | 4 (10.0%) | 36 (90.0%) |
| Health Care & Social Assistance | 4 (4.3%) | 89 (95.7%) |
| Arts, Entertainment & Recreation | 0 (0.0%) | 0 (0.0%) |
| Accommodation & Food Services | 0 (0.0%) | 41 (100.0%) |
| Public Administration | 0 (0.0%) | 7 (100.0%) |
| Total | 312 (51.9%) | 289 (48.1%) |
Education in Renville
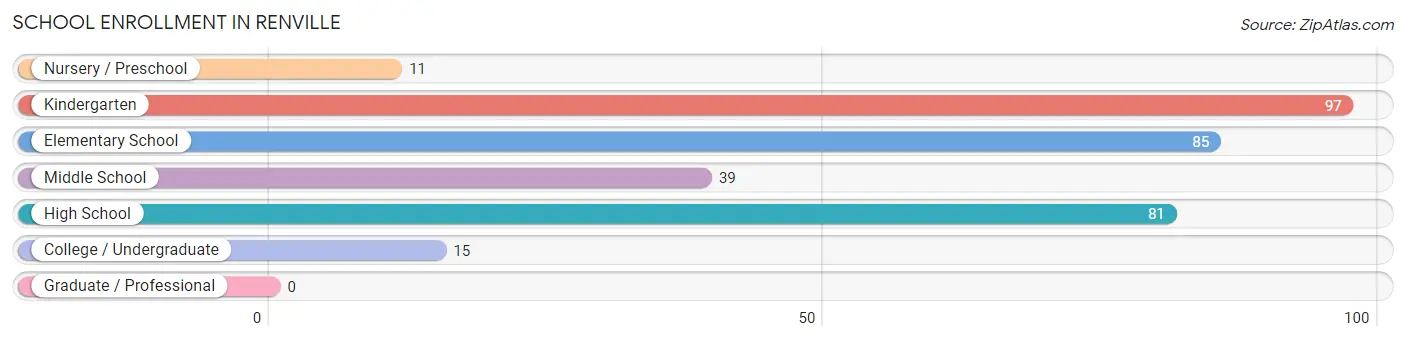
School Enrollment in Renville
The most common levels of schooling among the 328 students in Renville are kindergarten (97 | 29.6%), elementary school (85 | 25.9%), and high school (81 | 24.7%).
| School Level | # Students | % Students |
| Nursery / Preschool | 11 | 3.4% |
| Kindergarten | 97 | 29.6% |
| Elementary School | 85 | 25.9% |
| Middle School | 39 | 11.9% |
| High School | 81 | 24.7% |
| College / Undergraduate | 15 | 4.6% |
| Graduate / Professional | 0 | 0.0% |
| Total | 328 | 100.0% |
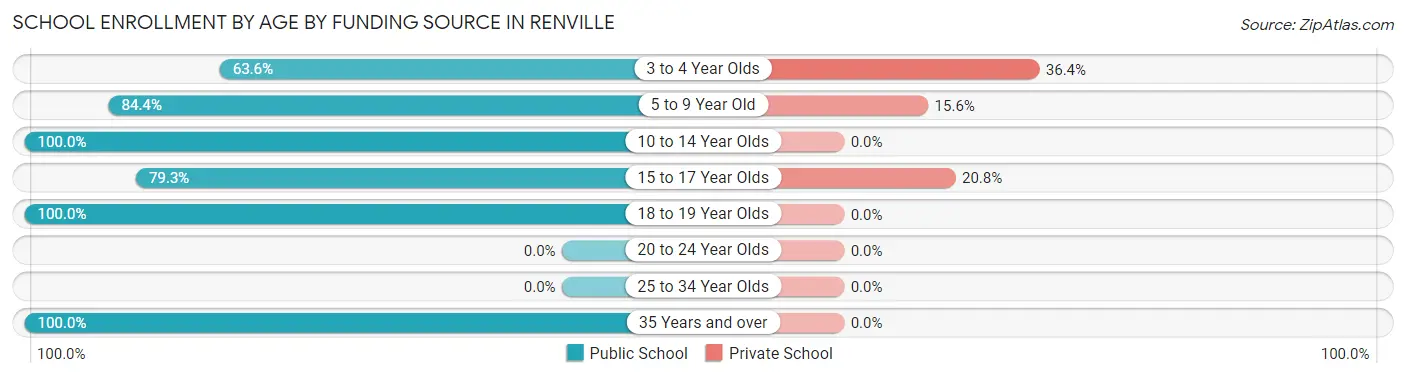
School Enrollment by Age by Funding Source in Renville
Out of a total of 328 students who are enrolled in schools in Renville, 43 (13.1%) attend a private institution, while the remaining 285 (86.9%) are enrolled in public schools. The age group of 3 to 4 year olds has the highest likelihood of being enrolled in private schools, with 4 (36.4% in the age bracket) enrolled. Conversely, the age group of 10 to 14 year olds has the lowest likelihood of being enrolled in a private school, with 42 (100.0% in the age bracket) attending a public institution.
| Age Bracket | Public School | Private School |
| 3 to 4 Year Olds | 7 (63.6%) | 4 (36.4%) |
| 5 to 9 Year Old | 151 (84.4%) | 28 (15.6%) |
| 10 to 14 Year Olds | 42 (100.0%) | 0 (0.0%) |
| 15 to 17 Year Olds | 42 (79.2%) | 11 (20.7%) |
| 18 to 19 Year Olds | 28 (100.0%) | 0 (0.0%) |
| 20 to 24 Year Olds | 0 (0.0%) | 0 (0.0%) |
| 25 to 34 Year Olds | 0 (0.0%) | 0 (0.0%) |
| 35 Years and over | 15 (100.0%) | 0 (0.0%) |
| Total | 285 (86.9%) | 43 (13.1%) |
Educational Attainment by Field of Study in Renville
Business (46 | 37.4%), education (30 | 24.4%), bio, nature & agricultural (14 | 11.4%), social sciences (10 | 8.1%), and science & technology (5 | 4.1%) are the most common fields of study among 123 individuals in Renville who have obtained a bachelor's degree or higher.
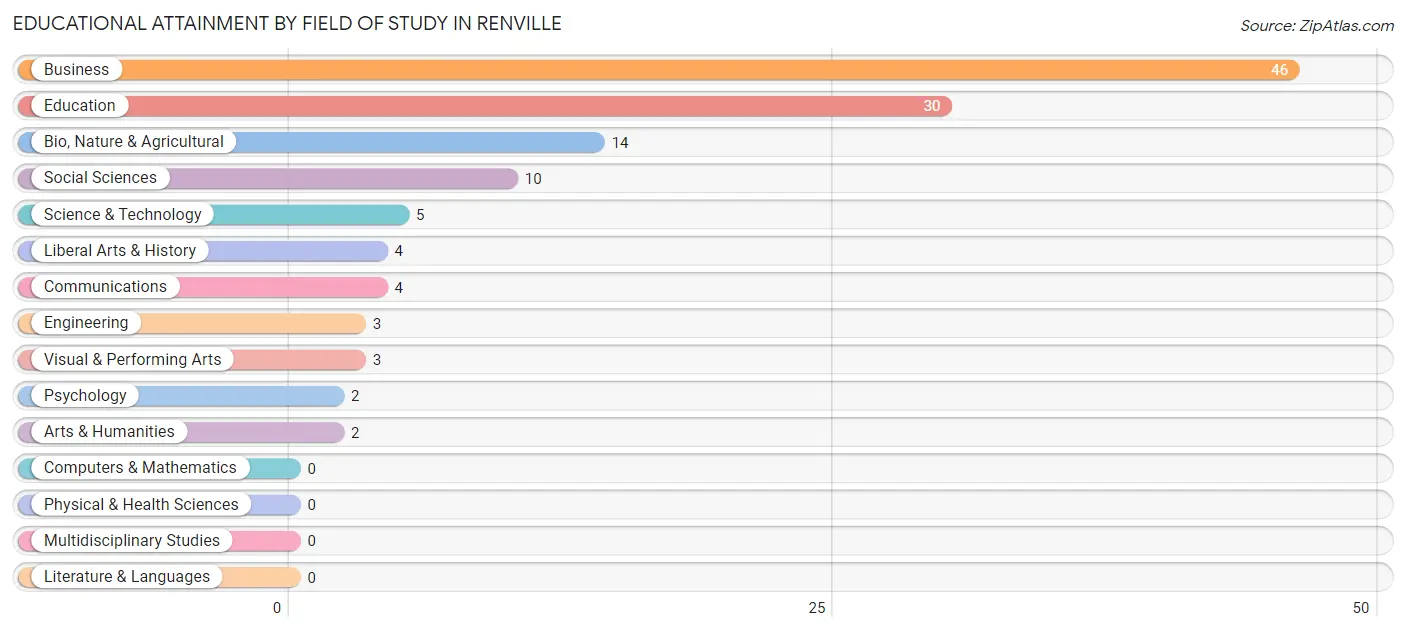
| Field of Study | # Graduates | % Graduates |
| Computers & Mathematics | 0 | 0.0% |
| Bio, Nature & Agricultural | 14 | 11.4% |
| Physical & Health Sciences | 0 | 0.0% |
| Psychology | 2 | 1.6% |
| Social Sciences | 10 | 8.1% |
| Engineering | 3 | 2.4% |
| Multidisciplinary Studies | 0 | 0.0% |
| Science & Technology | 5 | 4.1% |
| Business | 46 | 37.4% |
| Education | 30 | 24.4% |
| Literature & Languages | 0 | 0.0% |
| Liberal Arts & History | 4 | 3.3% |
| Visual & Performing Arts | 3 | 2.4% |
| Communications | 4 | 3.3% |
| Arts & Humanities | 2 | 1.6% |
| Total | 123 | 100.0% |
Transportation & Commute in Renville
Vehicle Availability by Sex in Renville
The most prevalent vehicle ownership categories in Renville are males with 2 vehicles (106, accounting for 36.4%) and females with 2 vehicles (107, making up 36.7%).
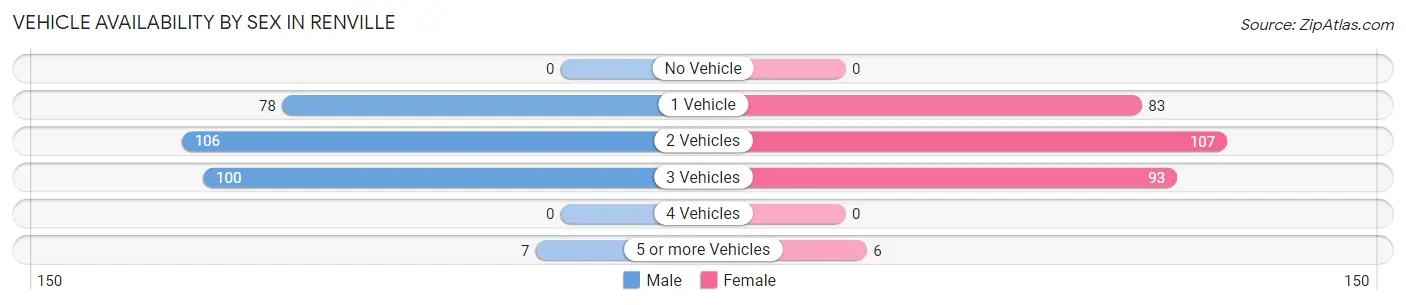
| Vehicles Available | Male | Female |
| No Vehicle | 0 (0.0%) | 0 (0.0%) |
| 1 Vehicle | 78 (26.8%) | 83 (28.7%) |
| 2 Vehicles | 106 (36.4%) | 107 (37.0%) |
| 3 Vehicles | 100 (34.4%) | 93 (32.2%) |
| 4 Vehicles | 0 (0.0%) | 0 (0.0%) |
| 5 or more Vehicles | 7 (2.4%) | 6 (2.1%) |
| Total | 291 (100.0%) | 289 (100.0%) |
Commute Time in Renville
The most frequently occuring commute durations in Renville are 5 to 9 minutes (219 commuters, 37.9%), 10 to 14 minutes (87 commuters, 15.0%), and less than 5 minutes (52 commuters, 9.0%).
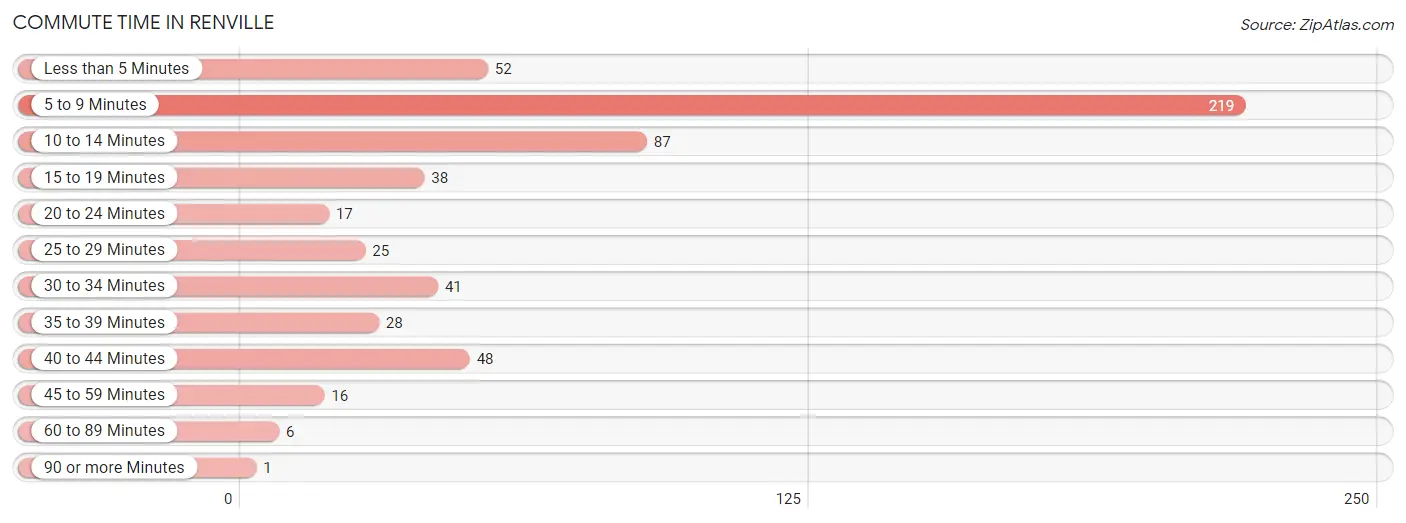
| Commute Time | # Commuters | % Commuters |
| Less than 5 Minutes | 52 | 9.0% |
| 5 to 9 Minutes | 219 | 37.9% |
| 10 to 14 Minutes | 87 | 15.0% |
| 15 to 19 Minutes | 38 | 6.6% |
| 20 to 24 Minutes | 17 | 2.9% |
| 25 to 29 Minutes | 25 | 4.3% |
| 30 to 34 Minutes | 41 | 7.1% |
| 35 to 39 Minutes | 28 | 4.8% |
| 40 to 44 Minutes | 48 | 8.3% |
| 45 to 59 Minutes | 16 | 2.8% |
| 60 to 89 Minutes | 6 | 1.0% |
| 90 or more Minutes | 1 | 0.2% |
Commute Time by Sex in Renville
The most common commute times in Renville are 5 to 9 minutes (118 commuters, 40.4%) for males and 5 to 9 minutes (101 commuters, 35.3%) for females.
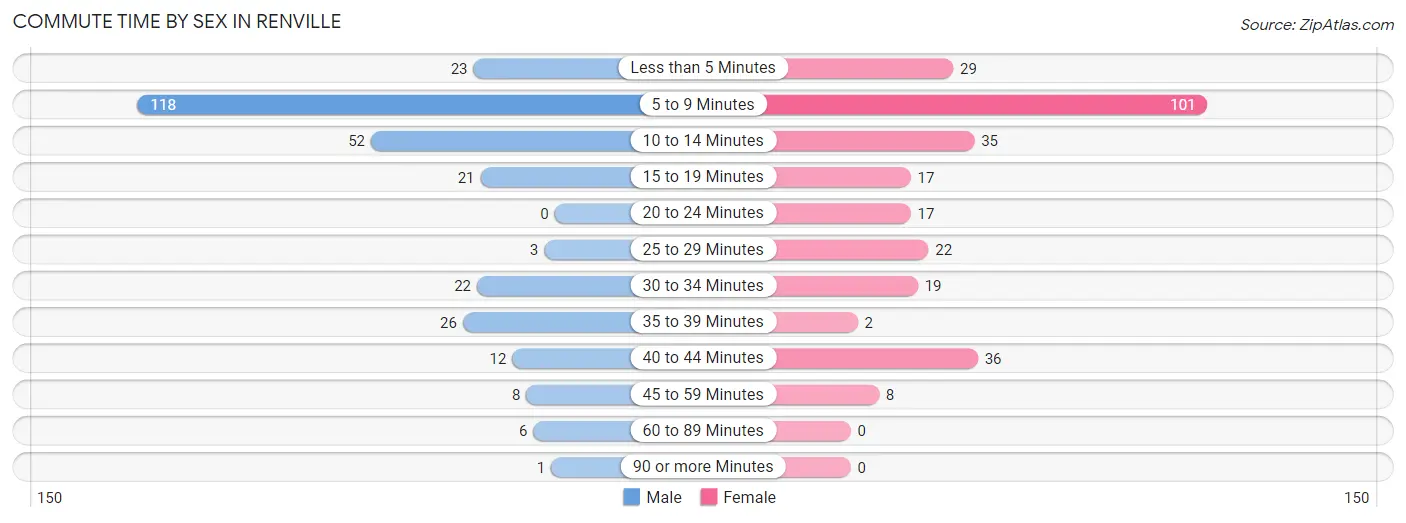
| Commute Time | Male | Female |
| Less than 5 Minutes | 23 (7.9%) | 29 (10.1%) |
| 5 to 9 Minutes | 118 (40.4%) | 101 (35.3%) |
| 10 to 14 Minutes | 52 (17.8%) | 35 (12.2%) |
| 15 to 19 Minutes | 21 (7.2%) | 17 (5.9%) |
| 20 to 24 Minutes | 0 (0.0%) | 17 (5.9%) |
| 25 to 29 Minutes | 3 (1.0%) | 22 (7.7%) |
| 30 to 34 Minutes | 22 (7.5%) | 19 (6.6%) |
| 35 to 39 Minutes | 26 (8.9%) | 2 (0.7%) |
| 40 to 44 Minutes | 12 (4.1%) | 36 (12.6%) |
| 45 to 59 Minutes | 8 (2.7%) | 8 (2.8%) |
| 60 to 89 Minutes | 6 (2.1%) | 0 (0.0%) |
| 90 or more Minutes | 1 (0.3%) | 0 (0.0%) |
Time of Departure to Work by Sex in Renville
The most frequent times of departure to work in Renville are 6:00 AM to 6:29 AM (94, 32.2%) for males and 7:00 AM to 7:29 AM (75, 26.2%) for females.
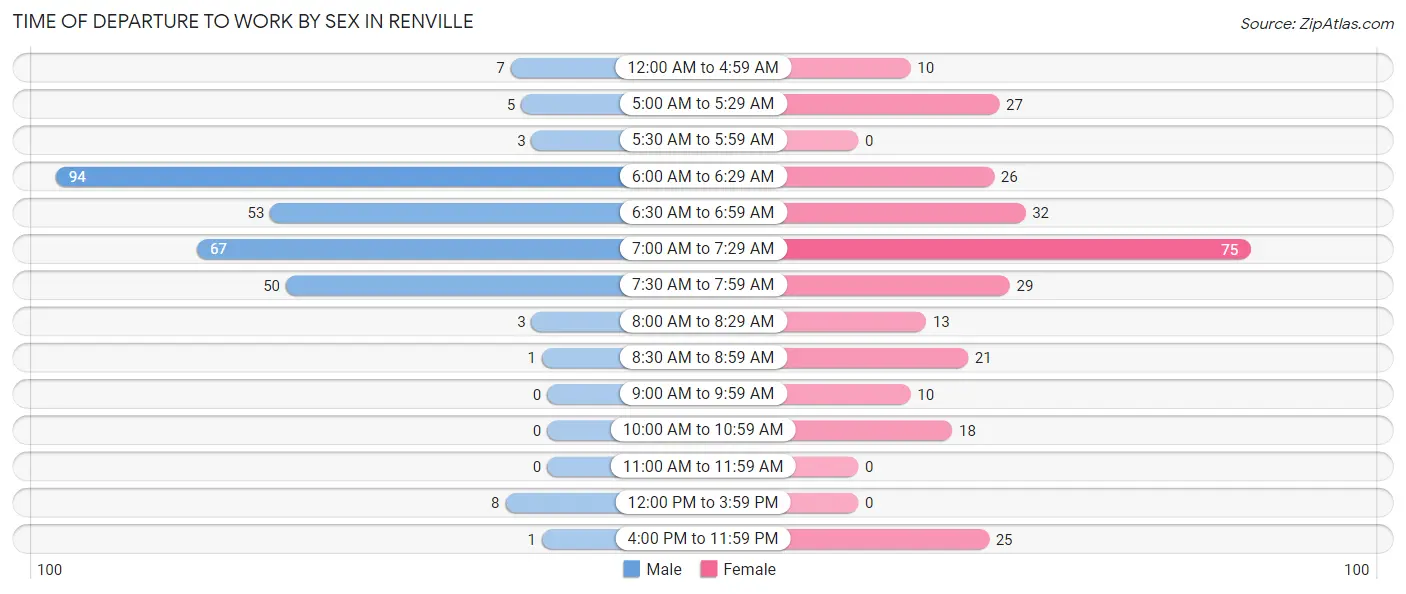
| Time of Departure | Male | Female |
| 12:00 AM to 4:59 AM | 7 (2.4%) | 10 (3.5%) |
| 5:00 AM to 5:29 AM | 5 (1.7%) | 27 (9.4%) |
| 5:30 AM to 5:59 AM | 3 (1.0%) | 0 (0.0%) |
| 6:00 AM to 6:29 AM | 94 (32.2%) | 26 (9.1%) |
| 6:30 AM to 6:59 AM | 53 (18.1%) | 32 (11.2%) |
| 7:00 AM to 7:29 AM | 67 (23.0%) | 75 (26.2%) |
| 7:30 AM to 7:59 AM | 50 (17.1%) | 29 (10.1%) |
| 8:00 AM to 8:29 AM | 3 (1.0%) | 13 (4.5%) |
| 8:30 AM to 8:59 AM | 1 (0.3%) | 21 (7.3%) |
| 9:00 AM to 9:59 AM | 0 (0.0%) | 10 (3.5%) |
| 10:00 AM to 10:59 AM | 0 (0.0%) | 18 (6.3%) |
| 11:00 AM to 11:59 AM | 0 (0.0%) | 0 (0.0%) |
| 12:00 PM to 3:59 PM | 8 (2.7%) | 0 (0.0%) |
| 4:00 PM to 11:59 PM | 1 (0.3%) | 25 (8.7%) |
| Total | 292 (100.0%) | 286 (100.0%) |
Housing Occupancy in Renville
Occupancy by Ownership in Renville
Of the total 490 dwellings in Renville, owner-occupied units account for 340 (69.4%), while renter-occupied units make up 150 (30.6%).
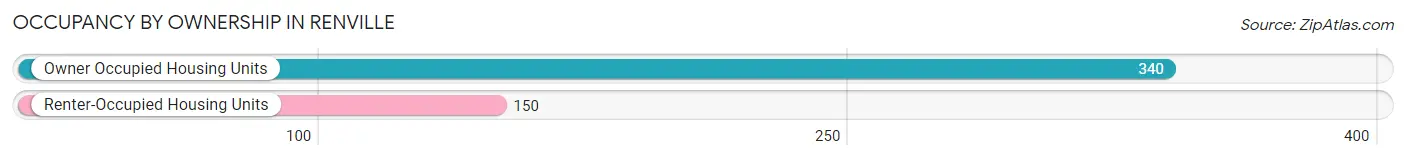
| Occupancy | # Housing Units | % Housing Units |
| Owner Occupied Housing Units | 340 | 69.4% |
| Renter-Occupied Housing Units | 150 | 30.6% |
| Total Occupied Housing Units | 490 | 100.0% |
Occupancy by Household Size in Renville
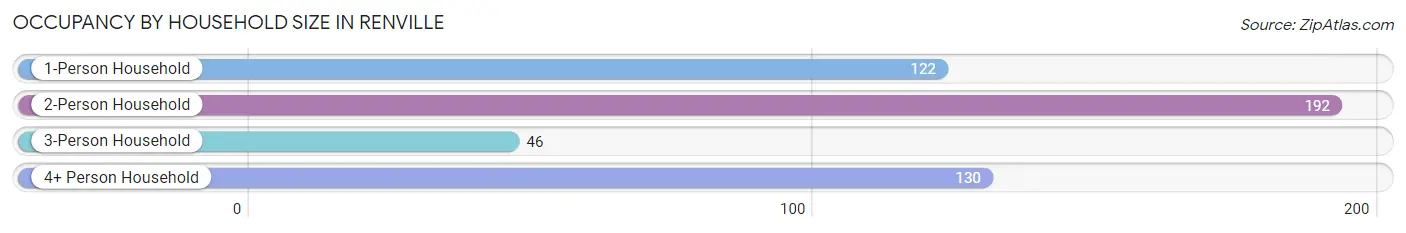
| Household Size | # Housing Units | % Housing Units |
| 1-Person Household | 122 | 24.9% |
| 2-Person Household | 192 | 39.2% |
| 3-Person Household | 46 | 9.4% |
| 4+ Person Household | 130 | 26.5% |
| Total Housing Units | 490 | 100.0% |
Occupancy by Ownership by Household Size in Renville
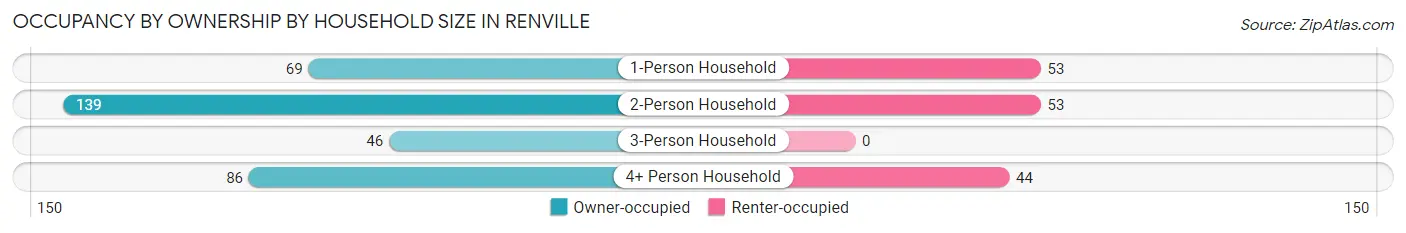
| Household Size | Owner-occupied | Renter-occupied |
| 1-Person Household | 69 (56.6%) | 53 (43.4%) |
| 2-Person Household | 139 (72.4%) | 53 (27.6%) |
| 3-Person Household | 46 (100.0%) | 0 (0.0%) |
| 4+ Person Household | 86 (66.1%) | 44 (33.9%) |
| Total Housing Units | 340 (69.4%) | 150 (30.6%) |
Occupancy by Educational Attainment in Renville
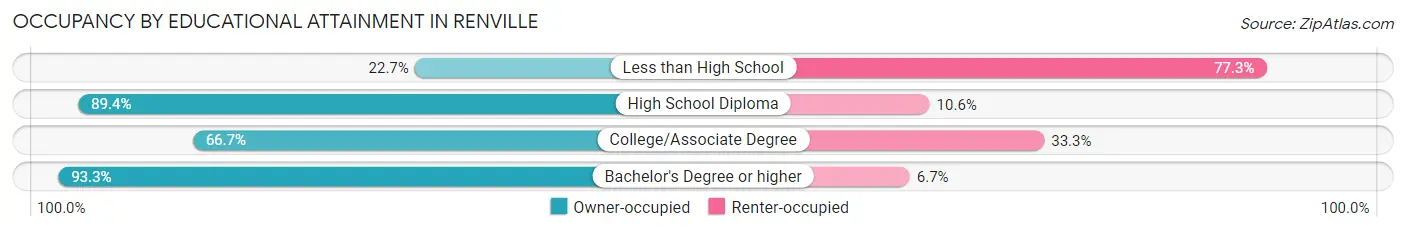
| Household Size | Owner-occupied | Renter-occupied |
| Less than High School | 17 (22.7%) | 58 (77.3%) |
| High School Diploma | 135 (89.4%) | 16 (10.6%) |
| College/Associate Degree | 146 (66.7%) | 73 (33.3%) |
| Bachelor's Degree or higher | 42 (93.3%) | 3 (6.7%) |
Occupancy by Age of Householder in Renville
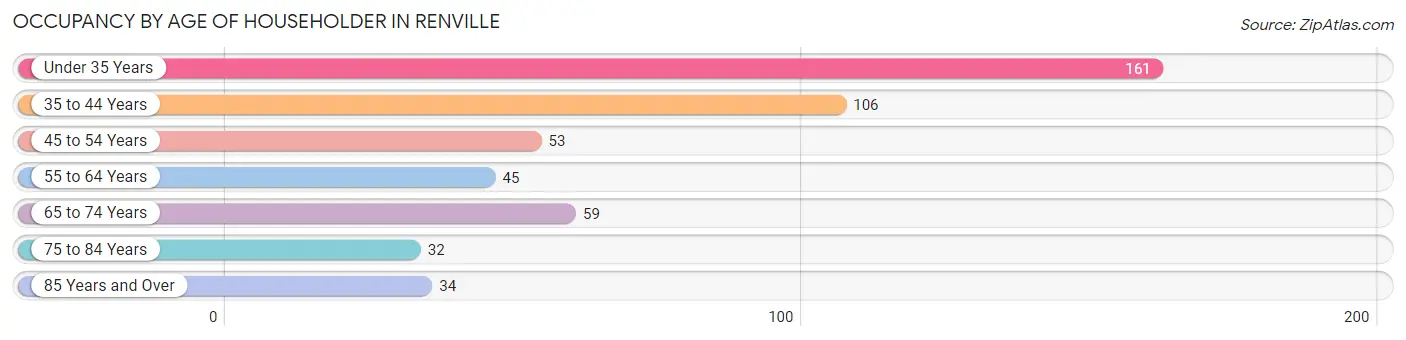
| Age Bracket | # Households | % Households |
| Under 35 Years | 161 | 32.9% |
| 35 to 44 Years | 106 | 21.6% |
| 45 to 54 Years | 53 | 10.8% |
| 55 to 64 Years | 45 | 9.2% |
| 65 to 74 Years | 59 | 12.0% |
| 75 to 84 Years | 32 | 6.5% |
| 85 Years and Over | 34 | 6.9% |
| Total | 490 | 100.0% |
Housing Finances in Renville
Median Income by Occupancy in Renville
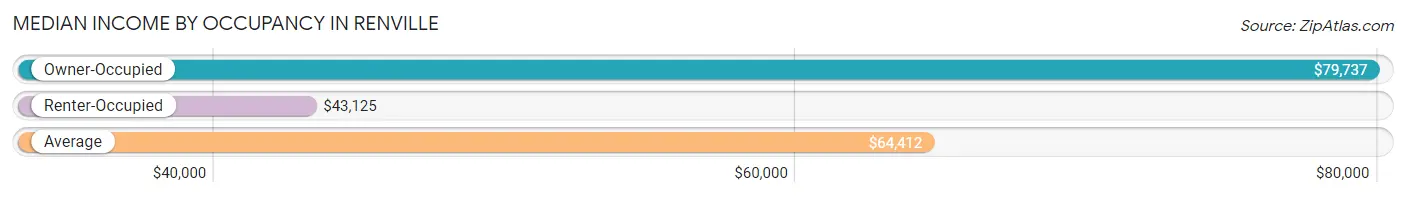
| Occupancy Type | # Households | Median Income |
| Owner-Occupied | 340 (69.4%) | $79,737 |
| Renter-Occupied | 150 (30.6%) | $43,125 |
| Average | 490 (100.0%) | $64,412 |
Occupancy by Householder Income Bracket in Renville
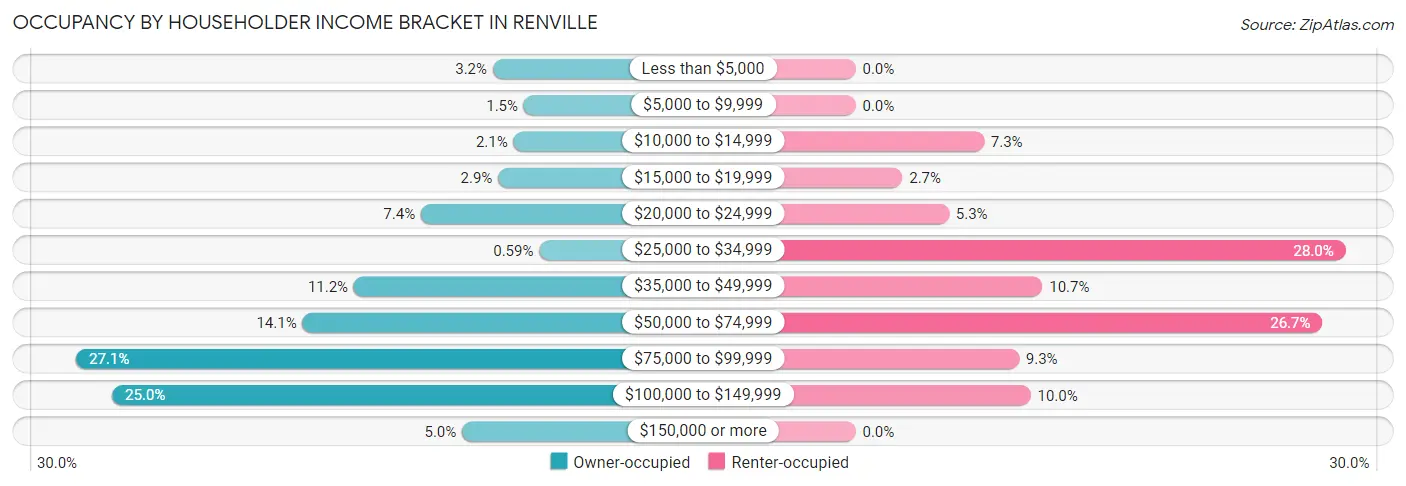
| Income Bracket | Owner-occupied | Renter-occupied |
| Less than $5,000 | 11 (3.2%) | 0 (0.0%) |
| $5,000 to $9,999 | 5 (1.5%) | 0 (0.0%) |
| $10,000 to $14,999 | 7 (2.1%) | 11 (7.3%) |
| $15,000 to $19,999 | 10 (2.9%) | 4 (2.7%) |
| $20,000 to $24,999 | 25 (7.3%) | 8 (5.3%) |
| $25,000 to $34,999 | 2 (0.6%) | 42 (28.0%) |
| $35,000 to $49,999 | 38 (11.2%) | 16 (10.7%) |
| $50,000 to $74,999 | 48 (14.1%) | 40 (26.7%) |
| $75,000 to $99,999 | 92 (27.1%) | 14 (9.3%) |
| $100,000 to $149,999 | 85 (25.0%) | 15 (10.0%) |
| $150,000 or more | 17 (5.0%) | 0 (0.0%) |
| Total | 340 (100.0%) | 150 (100.0%) |
Monthly Housing Cost Tiers in Renville
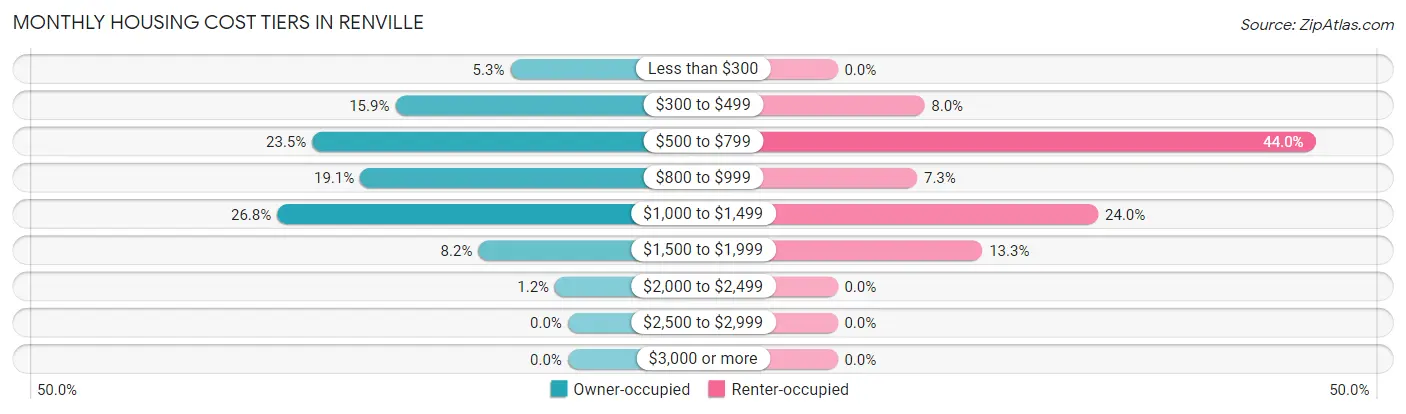
| Monthly Cost | Owner-occupied | Renter-occupied |
| Less than $300 | 18 (5.3%) | 0 (0.0%) |
| $300 to $499 | 54 (15.9%) | 12 (8.0%) |
| $500 to $799 | 80 (23.5%) | 66 (44.0%) |
| $800 to $999 | 65 (19.1%) | 11 (7.3%) |
| $1,000 to $1,499 | 91 (26.8%) | 36 (24.0%) |
| $1,500 to $1,999 | 28 (8.2%) | 20 (13.3%) |
| $2,000 to $2,499 | 4 (1.2%) | 0 (0.0%) |
| $2,500 to $2,999 | 0 (0.0%) | 0 (0.0%) |
| $3,000 or more | 0 (0.0%) | 0 (0.0%) |
| Total | 340 (100.0%) | 150 (100.0%) |
Physical Housing Characteristics in Renville
Housing Structures in Renville
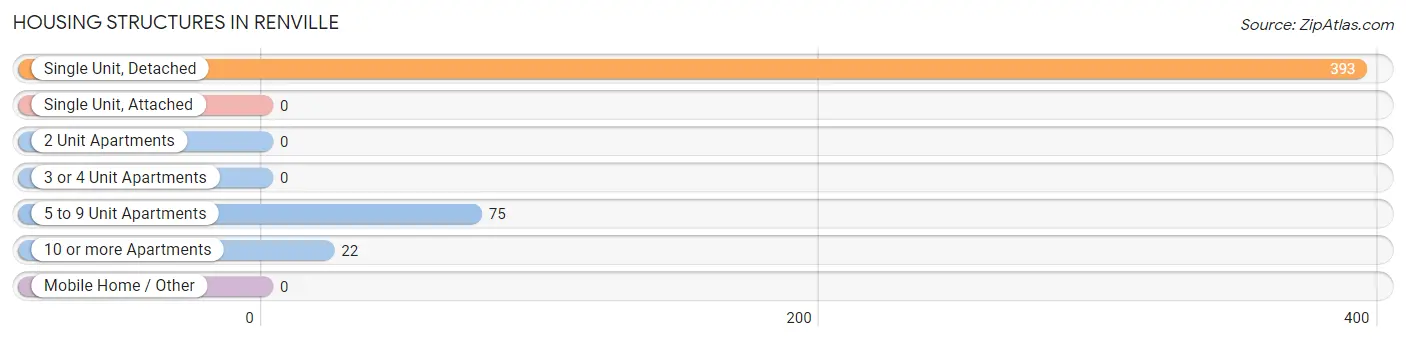
| Structure Type | # Housing Units | % Housing Units |
| Single Unit, Detached | 393 | 80.2% |
| Single Unit, Attached | 0 | 0.0% |
| 2 Unit Apartments | 0 | 0.0% |
| 3 or 4 Unit Apartments | 0 | 0.0% |
| 5 to 9 Unit Apartments | 75 | 15.3% |
| 10 or more Apartments | 22 | 4.5% |
| Mobile Home / Other | 0 | 0.0% |
| Total | 490 | 100.0% |
Housing Structures by Occupancy in Renville
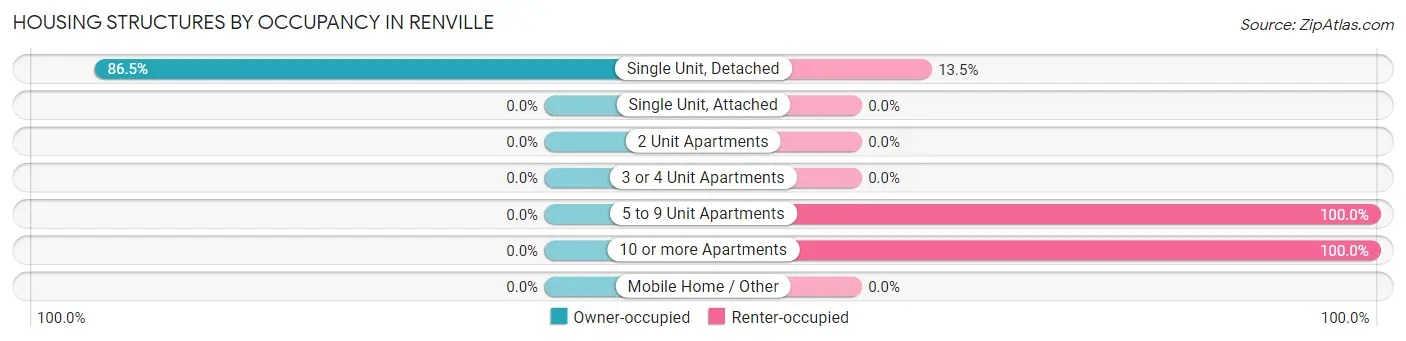
| Structure Type | Owner-occupied | Renter-occupied |
| Single Unit, Detached | 340 (86.5%) | 53 (13.5%) |
| Single Unit, Attached | 0 (0.0%) | 0 (0.0%) |
| 2 Unit Apartments | 0 (0.0%) | 0 (0.0%) |
| 3 or 4 Unit Apartments | 0 (0.0%) | 0 (0.0%) |
| 5 to 9 Unit Apartments | 0 (0.0%) | 75 (100.0%) |
| 10 or more Apartments | 0 (0.0%) | 22 (100.0%) |
| Mobile Home / Other | 0 (0.0%) | 0 (0.0%) |
| Total | 340 (69.4%) | 150 (30.6%) |
Housing Structures by Number of Rooms in Renville
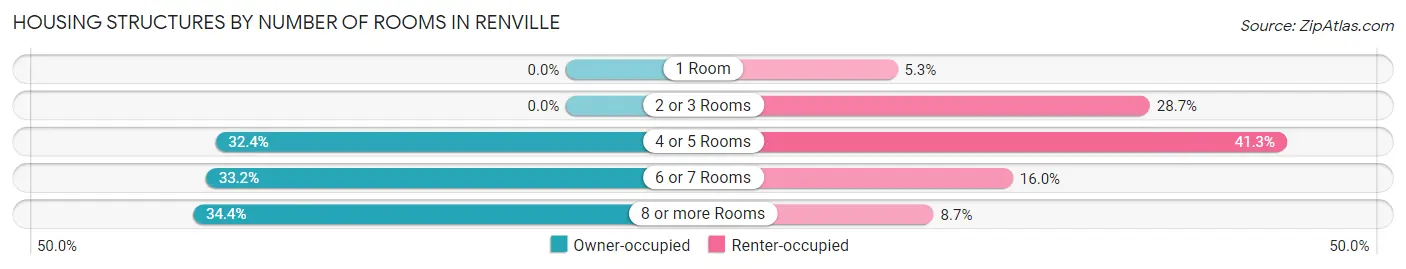
| Number of Rooms | Owner-occupied | Renter-occupied |
| 1 Room | 0 (0.0%) | 8 (5.3%) |
| 2 or 3 Rooms | 0 (0.0%) | 43 (28.7%) |
| 4 or 5 Rooms | 110 (32.4%) | 62 (41.3%) |
| 6 or 7 Rooms | 113 (33.2%) | 24 (16.0%) |
| 8 or more Rooms | 117 (34.4%) | 13 (8.7%) |
| Total | 340 (100.0%) | 150 (100.0%) |
Housing Structure by Heating Type in Renville
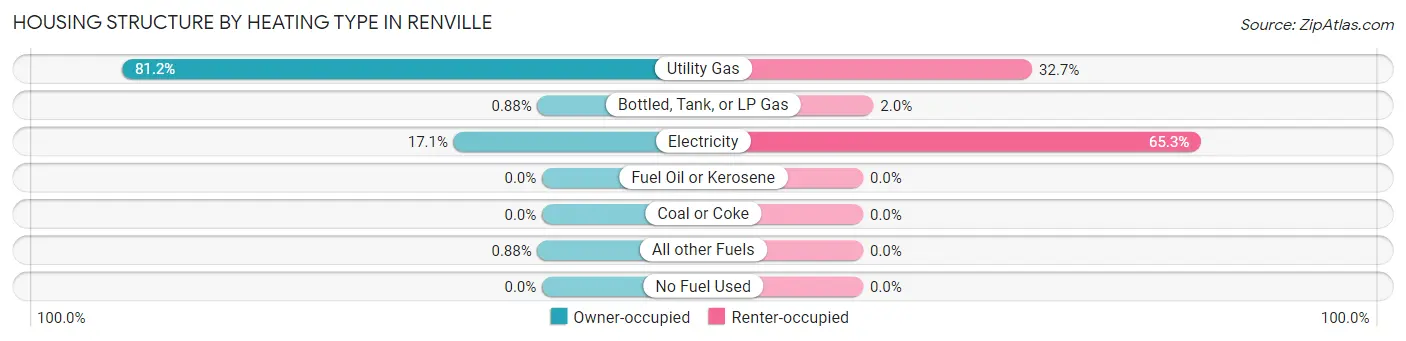
| Heating Type | Owner-occupied | Renter-occupied |
| Utility Gas | 276 (81.2%) | 49 (32.7%) |
| Bottled, Tank, or LP Gas | 3 (0.9%) | 3 (2.0%) |
| Electricity | 58 (17.1%) | 98 (65.3%) |
| Fuel Oil or Kerosene | 0 (0.0%) | 0 (0.0%) |
| Coal or Coke | 0 (0.0%) | 0 (0.0%) |
| All other Fuels | 3 (0.9%) | 0 (0.0%) |
| No Fuel Used | 0 (0.0%) | 0 (0.0%) |
| Total | 340 (100.0%) | 150 (100.0%) |
Household Vehicle Usage in Renville
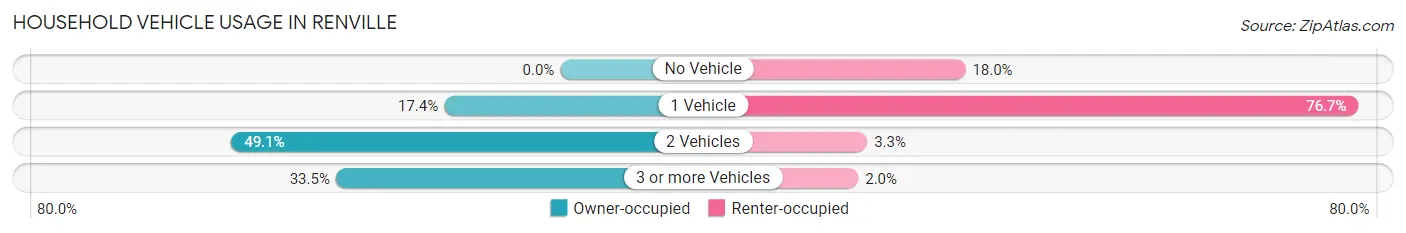
| Vehicles per Household | Owner-occupied | Renter-occupied |
| No Vehicle | 0 (0.0%) | 27 (18.0%) |
| 1 Vehicle | 59 (17.3%) | 115 (76.7%) |
| 2 Vehicles | 167 (49.1%) | 5 (3.3%) |
| 3 or more Vehicles | 114 (33.5%) | 3 (2.0%) |
| Total | 340 (100.0%) | 150 (100.0%) |
Real Estate & Mortgages in Renville
Real Estate and Mortgage Overview in Renville
| Characteristic | Without Mortgage | With Mortgage |
| Housing Units | 129 | 211 |
| Median Property Value | $96,300 | $102,700 |
| Median Household Income | $62,083 | $4 |
| Monthly Housing Costs | $450 | $0 |
| Real Estate Taxes | $1,516 | $3 |
Property Value by Mortgage Status in Renville
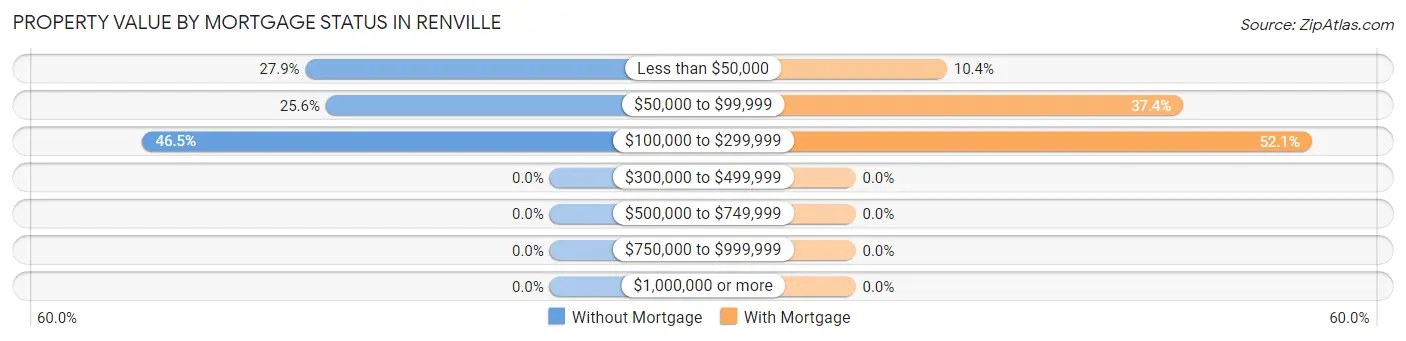
| Property Value | Without Mortgage | With Mortgage |
| Less than $50,000 | 36 (27.9%) | 22 (10.4%) |
| $50,000 to $99,999 | 33 (25.6%) | 79 (37.4%) |
| $100,000 to $299,999 | 60 (46.5%) | 110 (52.1%) |
| $300,000 to $499,999 | 0 (0.0%) | 0 (0.0%) |
| $500,000 to $749,999 | 0 (0.0%) | 0 (0.0%) |
| $750,000 to $999,999 | 0 (0.0%) | 0 (0.0%) |
| $1,000,000 or more | 0 (0.0%) | 0 (0.0%) |
| Total | 129 (100.0%) | 211 (100.0%) |
Household Income by Mortgage Status in Renville
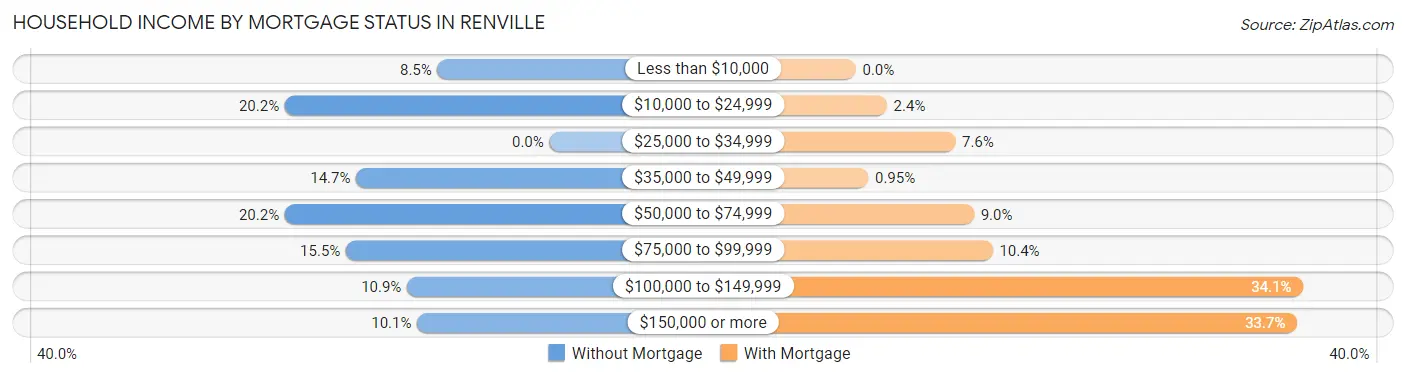
| Household Income | Without Mortgage | With Mortgage |
| Less than $10,000 | 11 (8.5%) | 0 (0.0%) |
| $10,000 to $24,999 | 26 (20.2%) | 5 (2.4%) |
| $25,000 to $34,999 | 0 (0.0%) | 16 (7.6%) |
| $35,000 to $49,999 | 19 (14.7%) | 2 (0.9%) |
| $50,000 to $74,999 | 26 (20.2%) | 19 (9.0%) |
| $75,000 to $99,999 | 20 (15.5%) | 22 (10.4%) |
| $100,000 to $149,999 | 14 (10.8%) | 72 (34.1%) |
| $150,000 or more | 13 (10.1%) | 71 (33.7%) |
| Total | 129 (100.0%) | 211 (100.0%) |
Property Value to Household Income Ratio in Renville
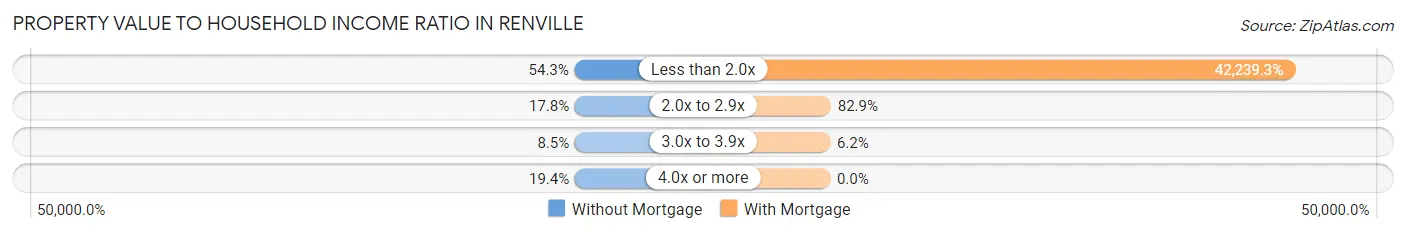
| Value-to-Income Ratio | Without Mortgage | With Mortgage |
| Less than 2.0x | 70 (54.3%) | 89,125 (42,239.3%) |
| 2.0x to 2.9x | 23 (17.8%) | 175 (82.9%) |
| 3.0x to 3.9x | 11 (8.5%) | 13 (6.2%) |
| 4.0x or more | 25 (19.4%) | 0 (0.0%) |
| Total | 129 (100.0%) | 211 (100.0%) |
Real Estate Taxes by Mortgage Status in Renville
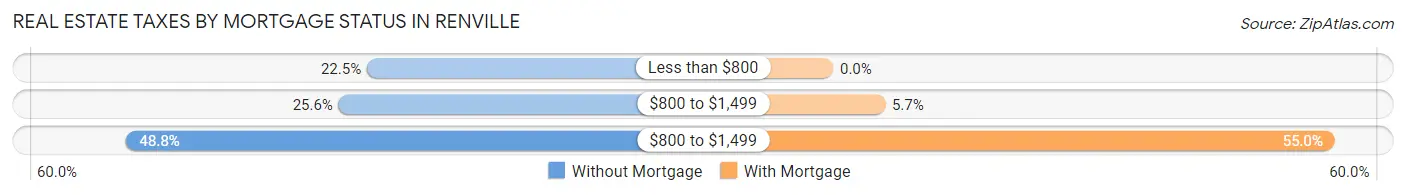
| Property Taxes | Without Mortgage | With Mortgage |
| Less than $800 | 29 (22.5%) | 0 (0.0%) |
| $800 to $1,499 | 33 (25.6%) | 12 (5.7%) |
| $800 to $1,499 | 63 (48.8%) | 116 (55.0%) |
| Total | 129 (100.0%) | 211 (100.0%) |
Health & Disability in Renville
Health Insurance Coverage by Age in Renville
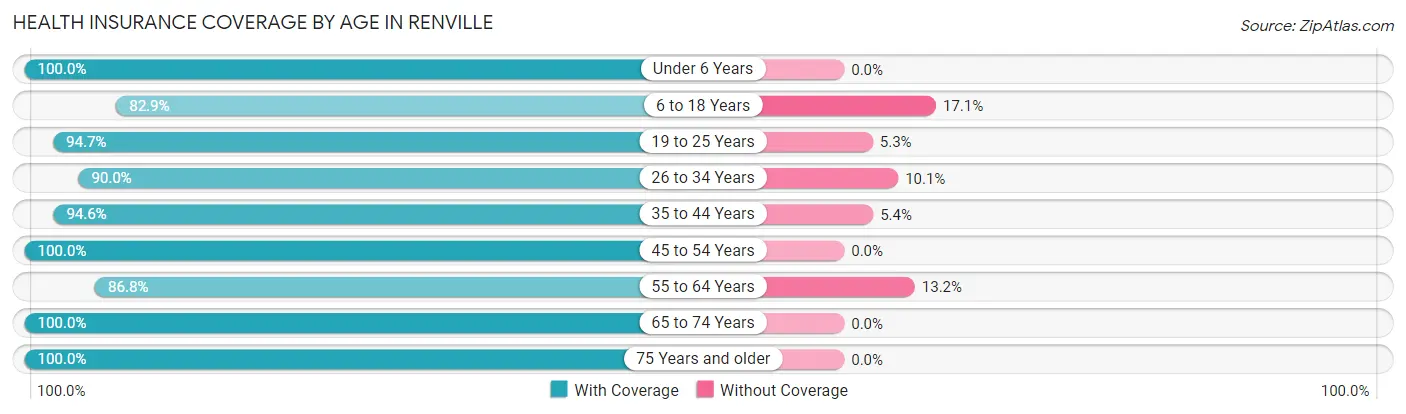
| Age Bracket | With Coverage | Without Coverage |
| Under 6 Years | 170 (100.0%) | 0 (0.0%) |
| 6 to 18 Years | 252 (82.9%) | 52 (17.1%) |
| 19 to 25 Years | 71 (94.7%) | 4 (5.3%) |
| 26 to 34 Years | 188 (89.9%) | 21 (10.1%) |
| 35 to 44 Years | 193 (94.6%) | 11 (5.4%) |
| 45 to 54 Years | 73 (100.0%) | 0 (0.0%) |
| 55 to 64 Years | 99 (86.8%) | 15 (13.2%) |
| 65 to 74 Years | 98 (100.0%) | 0 (0.0%) |
| 75 Years and older | 97 (100.0%) | 0 (0.0%) |
| Total | 1,241 (92.3%) | 103 (7.7%) |
Health Insurance Coverage by Citizenship Status in Renville
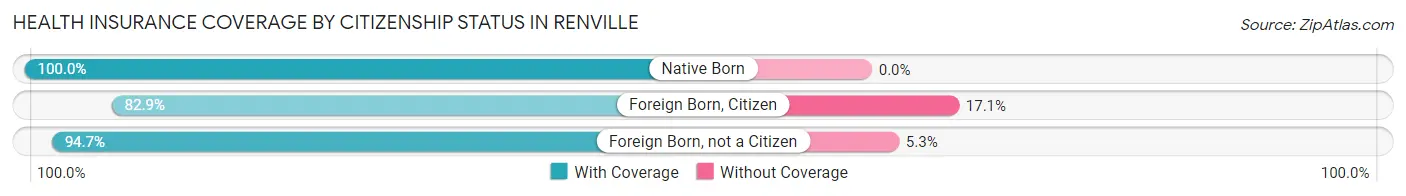
| Citizenship Status | With Coverage | Without Coverage |
| Native Born | 170 (100.0%) | 0 (0.0%) |
| Foreign Born, Citizen | 252 (82.9%) | 52 (17.1%) |
| Foreign Born, not a Citizen | 71 (94.7%) | 4 (5.3%) |
Health Insurance Coverage by Household Income in Renville
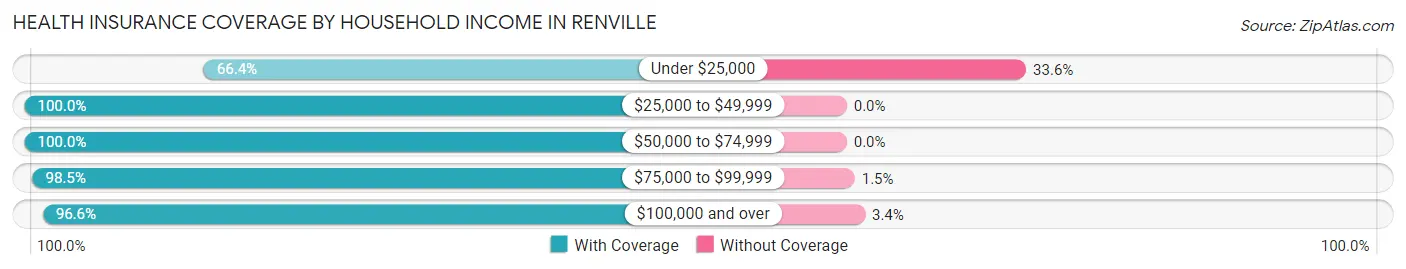
| Household Income | With Coverage | Without Coverage |
| Under $25,000 | 166 (66.4%) | 84 (33.6%) |
| $25,000 to $49,999 | 211 (100.0%) | 0 (0.0%) |
| $50,000 to $74,999 | 173 (100.0%) | 0 (0.0%) |
| $75,000 to $99,999 | 263 (98.5%) | 4 (1.5%) |
| $100,000 and over | 423 (96.6%) | 15 (3.4%) |
Public vs Private Health Insurance Coverage by Age in Renville
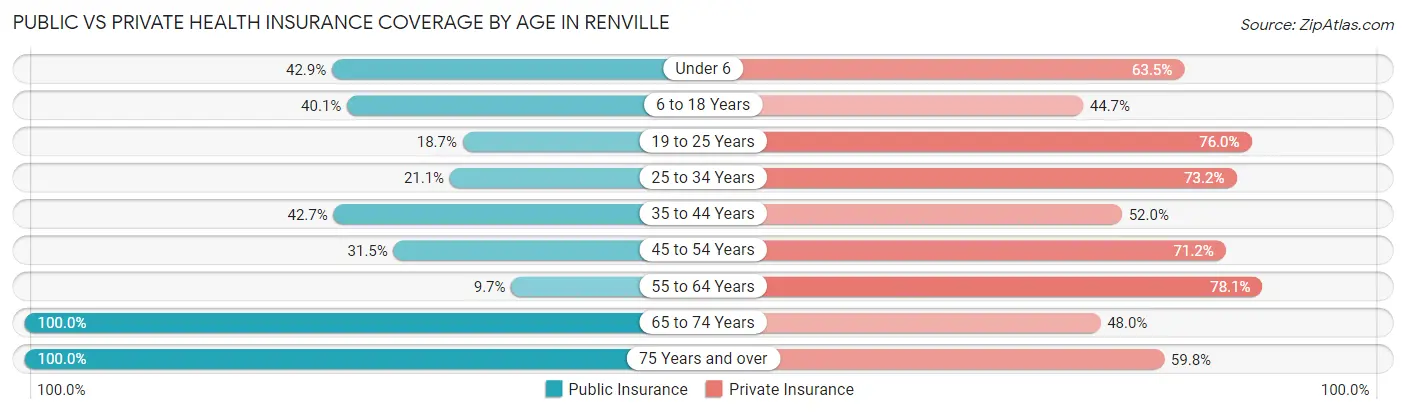
| Age Bracket | Public Insurance | Private Insurance |
| Under 6 | 73 (42.9%) | 108 (63.5%) |
| 6 to 18 Years | 122 (40.1%) | 136 (44.7%) |
| 19 to 25 Years | 14 (18.7%) | 57 (76.0%) |
| 25 to 34 Years | 44 (21.0%) | 153 (73.2%) |
| 35 to 44 Years | 87 (42.6%) | 106 (52.0%) |
| 45 to 54 Years | 23 (31.5%) | 52 (71.2%) |
| 55 to 64 Years | 11 (9.7%) | 89 (78.1%) |
| 65 to 74 Years | 98 (100.0%) | 47 (48.0%) |
| 75 Years and over | 97 (100.0%) | 58 (59.8%) |
| Total | 569 (42.3%) | 806 (60.0%) |
Disability Status by Sex by Age in Renville
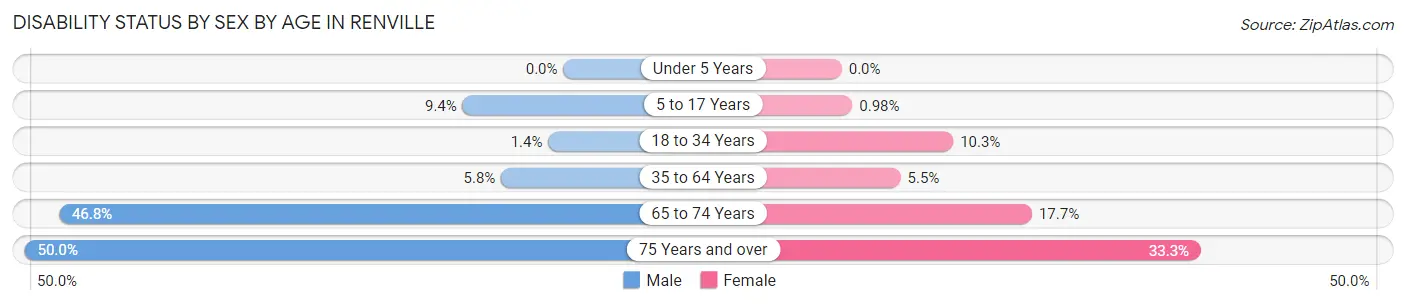
| Age Bracket | Male | Female |
| Under 5 Years | 0 (0.0%) | 0 (0.0%) |
| 5 to 17 Years | 13 (9.3%) | 2 (1.0%) |
| 18 to 34 Years | 2 (1.4%) | 18 (10.3%) |
| 35 to 64 Years | 12 (5.8%) | 10 (5.5%) |
| 65 to 74 Years | 22 (46.8%) | 9 (17.6%) |
| 75 Years and over | 23 (50.0%) | 17 (33.3%) |
Disability Class by Sex by Age in Renville
Disability Class: Hearing Difficulty
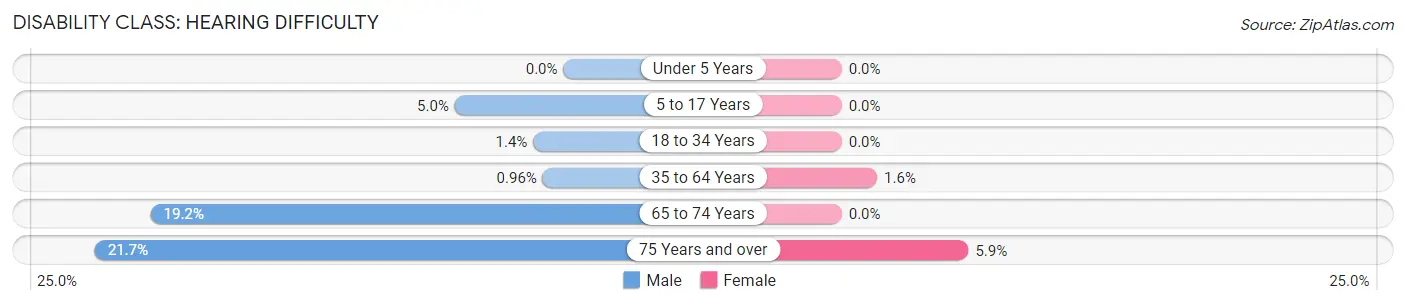
| Age Bracket | Male | Female |
| Under 5 Years | 0 (0.0%) | 0 (0.0%) |
| 5 to 17 Years | 7 (5.0%) | 0 (0.0%) |
| 18 to 34 Years | 2 (1.4%) | 0 (0.0%) |
| 35 to 64 Years | 2 (1.0%) | 3 (1.6%) |
| 65 to 74 Years | 9 (19.2%) | 0 (0.0%) |
| 75 Years and over | 10 (21.7%) | 3 (5.9%) |
Disability Class: Vision Difficulty
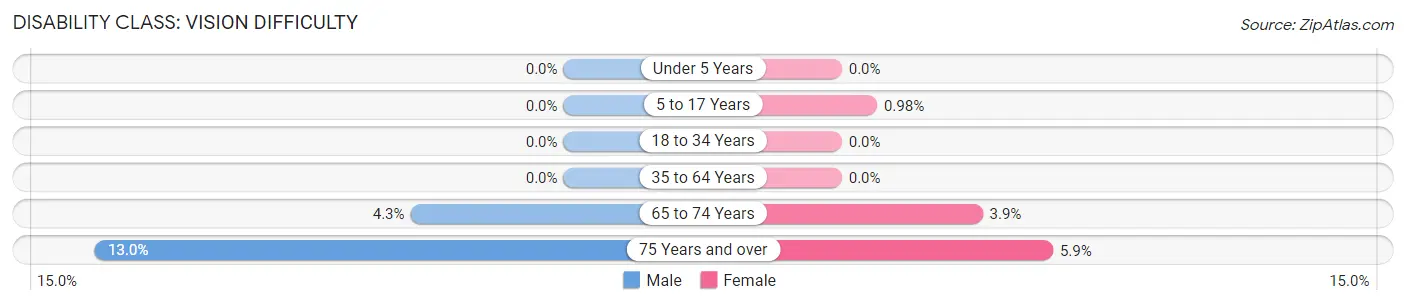
| Age Bracket | Male | Female |
| Under 5 Years | 0 (0.0%) | 0 (0.0%) |
| 5 to 17 Years | 0 (0.0%) | 2 (1.0%) |
| 18 to 34 Years | 0 (0.0%) | 0 (0.0%) |
| 35 to 64 Years | 0 (0.0%) | 0 (0.0%) |
| 65 to 74 Years | 2 (4.3%) | 2 (3.9%) |
| 75 Years and over | 6 (13.0%) | 3 (5.9%) |
Disability Class: Cognitive Difficulty
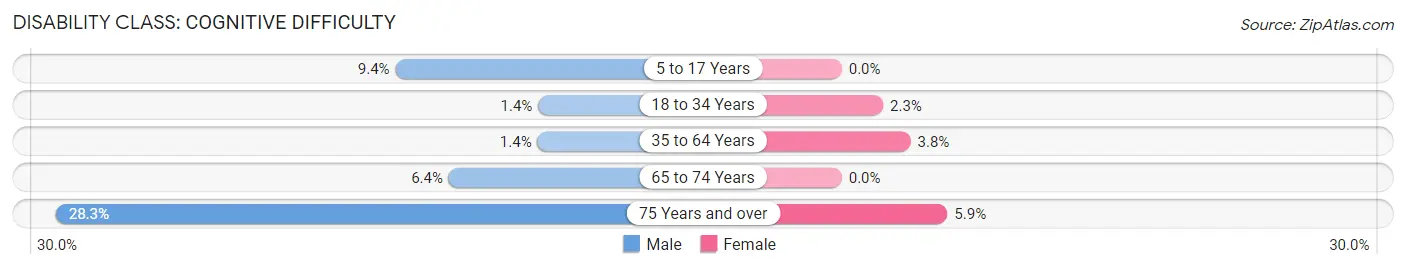
| Age Bracket | Male | Female |
| 5 to 17 Years | 13 (9.3%) | 0 (0.0%) |
| 18 to 34 Years | 2 (1.4%) | 4 (2.3%) |
| 35 to 64 Years | 3 (1.4%) | 7 (3.8%) |
| 65 to 74 Years | 3 (6.4%) | 0 (0.0%) |
| 75 Years and over | 13 (28.3%) | 3 (5.9%) |
Disability Class: Ambulatory Difficulty
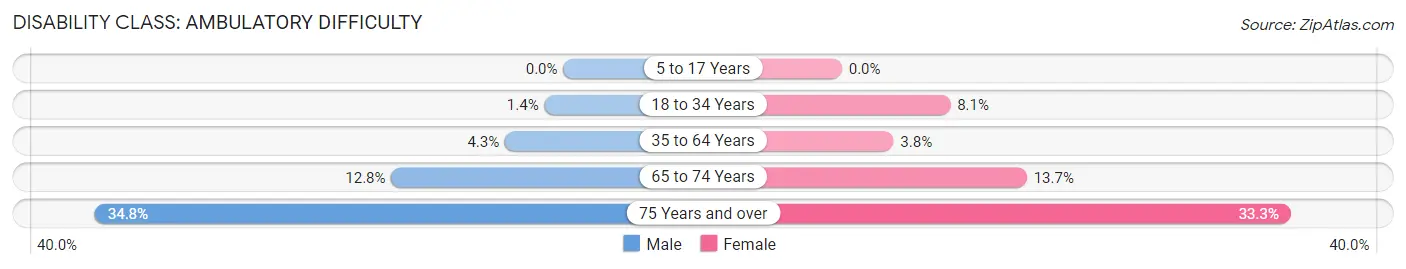
| Age Bracket | Male | Female |
| 5 to 17 Years | 0 (0.0%) | 0 (0.0%) |
| 18 to 34 Years | 2 (1.4%) | 14 (8.1%) |
| 35 to 64 Years | 9 (4.3%) | 7 (3.8%) |
| 65 to 74 Years | 6 (12.8%) | 7 (13.7%) |
| 75 Years and over | 16 (34.8%) | 17 (33.3%) |
Disability Class: Self-Care Difficulty
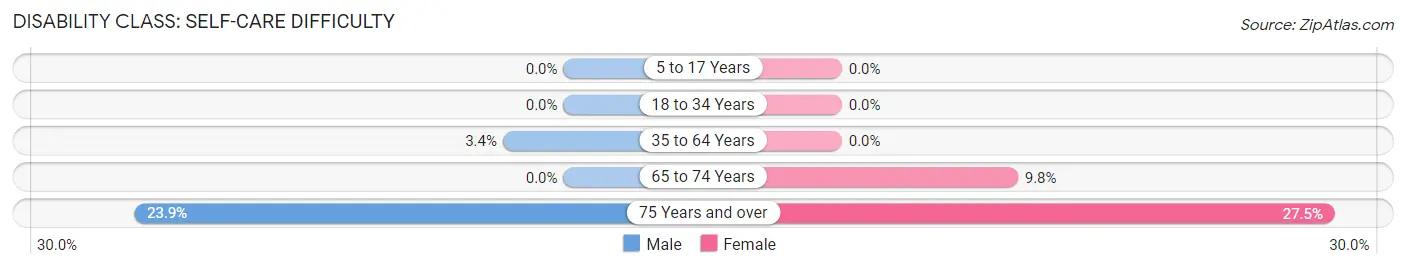
| Age Bracket | Male | Female |
| 5 to 17 Years | 0 (0.0%) | 0 (0.0%) |
| 18 to 34 Years | 0 (0.0%) | 0 (0.0%) |
| 35 to 64 Years | 7 (3.4%) | 0 (0.0%) |
| 65 to 74 Years | 0 (0.0%) | 5 (9.8%) |
| 75 Years and over | 11 (23.9%) | 14 (27.5%) |
Technology Access in Renville
Computing Device Access in Renville
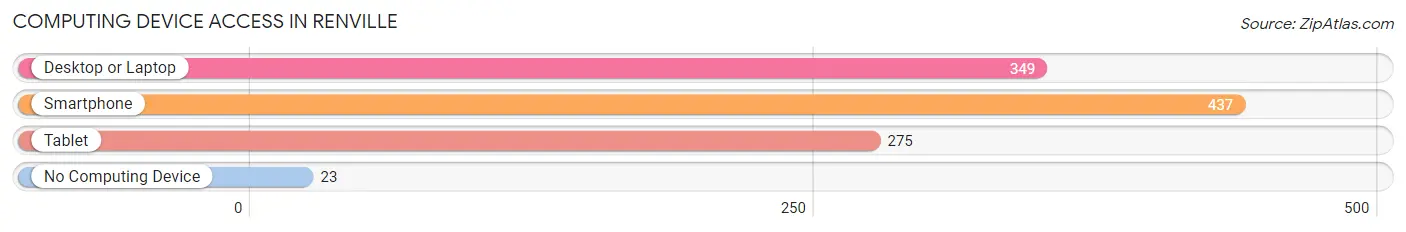
| Device Type | # Households | % Households |
| Desktop or Laptop | 349 | 71.2% |
| Smartphone | 437 | 89.2% |
| Tablet | 275 | 56.1% |
| No Computing Device | 23 | 4.7% |
| Total | 490 | 100.0% |
Internet Access in Renville
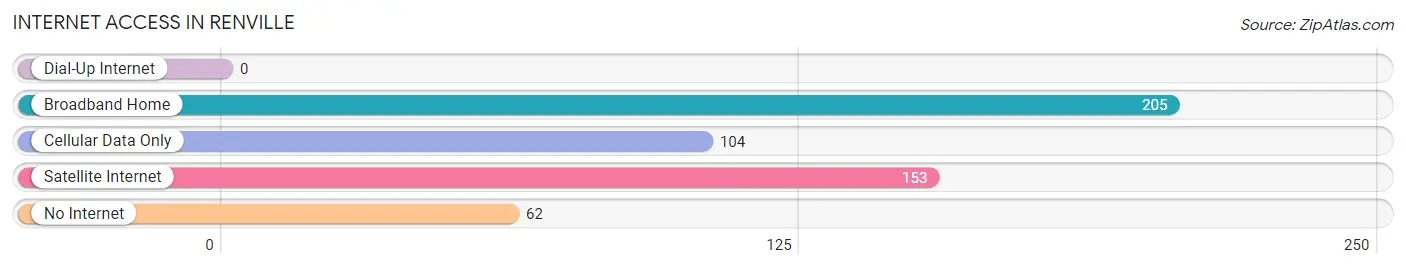
| Internet Type | # Households | % Households |
| Dial-Up Internet | 0 | 0.0% |
| Broadband Home | 205 | 41.8% |
| Cellular Data Only | 104 | 21.2% |
| Satellite Internet | 153 | 31.2% |
| No Internet | 62 | 12.7% |
| Total | 490 | 100.0% |
Renville Summary
Renville, Minnesota is a small city located in the western part of the state, about an hour and a half west of Minneapolis. It is the county seat of Renville County and has a population of just over 2,000 people. The city is situated on the banks of the Minnesota River and is surrounded by rolling hills and farmland.
Renville was founded in 1871 by a group of settlers from the nearby town of Redwood Falls. The city was named after the Renville family, who were among the first settlers in the area. The city was incorporated in 1887 and has since grown to become a thriving community.
Geographically, Renville is located in the Minnesota River Valley, which is part of the larger Minnesota River Basin. The city is situated on the banks of the Minnesota River and is surrounded by rolling hills and farmland. The city is also located near the junction of two major highways, US Highway 212 and Minnesota State Highway 19.
The economy of Renville is largely based on agriculture and manufacturing. The city is home to several large agricultural companies, including Cargill, Land O’Lakes, and CHS. The city also has a number of manufacturing companies, including a large paper mill and a plastics plant. In addition, the city is home to several small businesses, including restaurants, retail stores, and service providers.
Demographically, Renville is a predominantly white city, with a population that is 94.3% white. The city also has a small Hispanic population, which makes up 2.3% of the population. The median household income in Renville is $45,845, which is slightly lower than the state average. The city also has a higher than average poverty rate, with 17.2% of the population living below the poverty line.
Renville is a small city with a rich history and a vibrant economy. The city is home to a diverse population and is a great place to live and work. With its close proximity to Minneapolis and its rural setting, Renville is an ideal place to call home.
Common Questions
What is Per Capita Income in Renville?
Per Capita income in Renville is $26,577.
What is the Median Family Income in Renville?
Median Family Income in Renville is $58,942.
What is the Median Household income in Renville?
Median Household Income in Renville is $64,412.
What is Income or Wage Gap in Renville?
Income or Wage Gap in Renville is 35.1%.
Women in Renville earn 64.9 cents for every dollar earned by a man.
What is Inequality or Gini Index in Renville?
Inequality or Gini Index in Renville is 0.35.
What is the Total Population of Renville?
Total Population of Renville is 1,397.
What is the Total Male Population of Renville?
Total Male Population of Renville is 680.
What is the Total Female Population of Renville?
Total Female Population of Renville is 717.
What is the Ratio of Males per 100 Females in Renville?
There are 94.84 Males per 100 Females in Renville.
What is the Ratio of Females per 100 Males in Renville?
There are 105.44 Females per 100 Males in Renville.
What is the Median Population Age in Renville?
Median Population Age in Renville is 31.7 Years.
What is the Average Family Size in Renville
Average Family Size in Renville is 3.3 People.
What is the Average Household Size in Renville
Average Household Size in Renville is 2.7 People.
How Large is the Labor Force in Renville?
There are 644 People in the Labor Forcein in Renville.
What is the Percentage of People in the Labor Force in Renville?
65.3% of People are in the Labor Force in Renville.
What is the Unemployment Rate in Renville?
Unemployment Rate in Renville is 6.7%.