Remer, MN Map & Demographics
Remer Map
Remer Overview
$26,873
PER CAPITA INCOME
$44,583
AVG FAMILY INCOME
$31,406
AVG HOUSEHOLD INCOME
68.3%
WAGE / INCOME GAP [ % ]
31.7¢/ $1
WAGE / INCOME GAP [ $ ]
0.50
INEQUALITY / GINI INDEX
363
TOTAL POPULATION
191
MALE POPULATION
172
FEMALE POPULATION
111.05
MALES / 100 FEMALES
90.05
FEMALES / 100 MALES
49.1
MEDIAN AGE
3.0
AVG FAMILY SIZE
2.1
AVG HOUSEHOLD SIZE
174
LABOR FORCE [ PEOPLE ]
54.2%
PERCENT IN LABOR FORCE
12.1%
UNEMPLOYMENT RATE
Remer Zip Codes
Remer Area Codes
Income in Remer
Income Overview in Remer
Per Capita Income in Remer is $26,873, while median incomes of families and households are $44,583 and $31,406 respectively.
| Characteristic | Number | Measure |
| Per Capita Income | 363 | $26,873 |
| Median Family Income | 81 | $44,583 |
| Mean Family Income | 81 | $69,169 |
| Median Household Income | 161 | $31,406 |
| Mean Household Income | 161 | $51,381 |
| Income Deficit | 81 | $0 |
| Wage / Income Gap (%) | 363 | 68.32% |
| Wage / Income Gap ($) | 363 | 31.68¢ per $1 |
| Gini / Inequality Index | 363 | 0.50 |
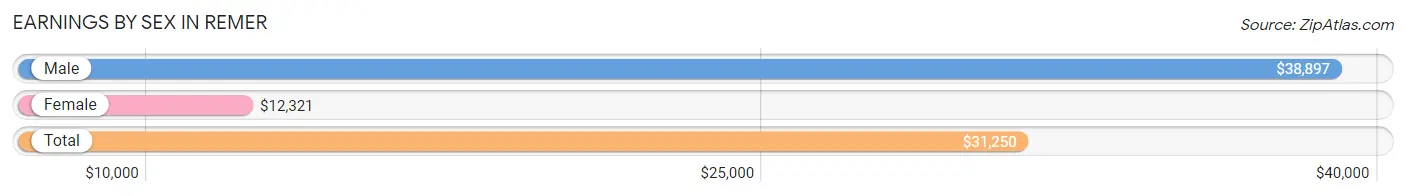
Earnings by Sex in Remer
Average Earnings in Remer are $31,250, $38,897 for men and $12,321 for women, a difference of 68.3%.
| Sex | Number | Average Earnings |
| Male | 95 (53.4%) | $38,897 |
| Female | 83 (46.6%) | $12,321 |
| Total | 178 (100.0%) | $31,250 |
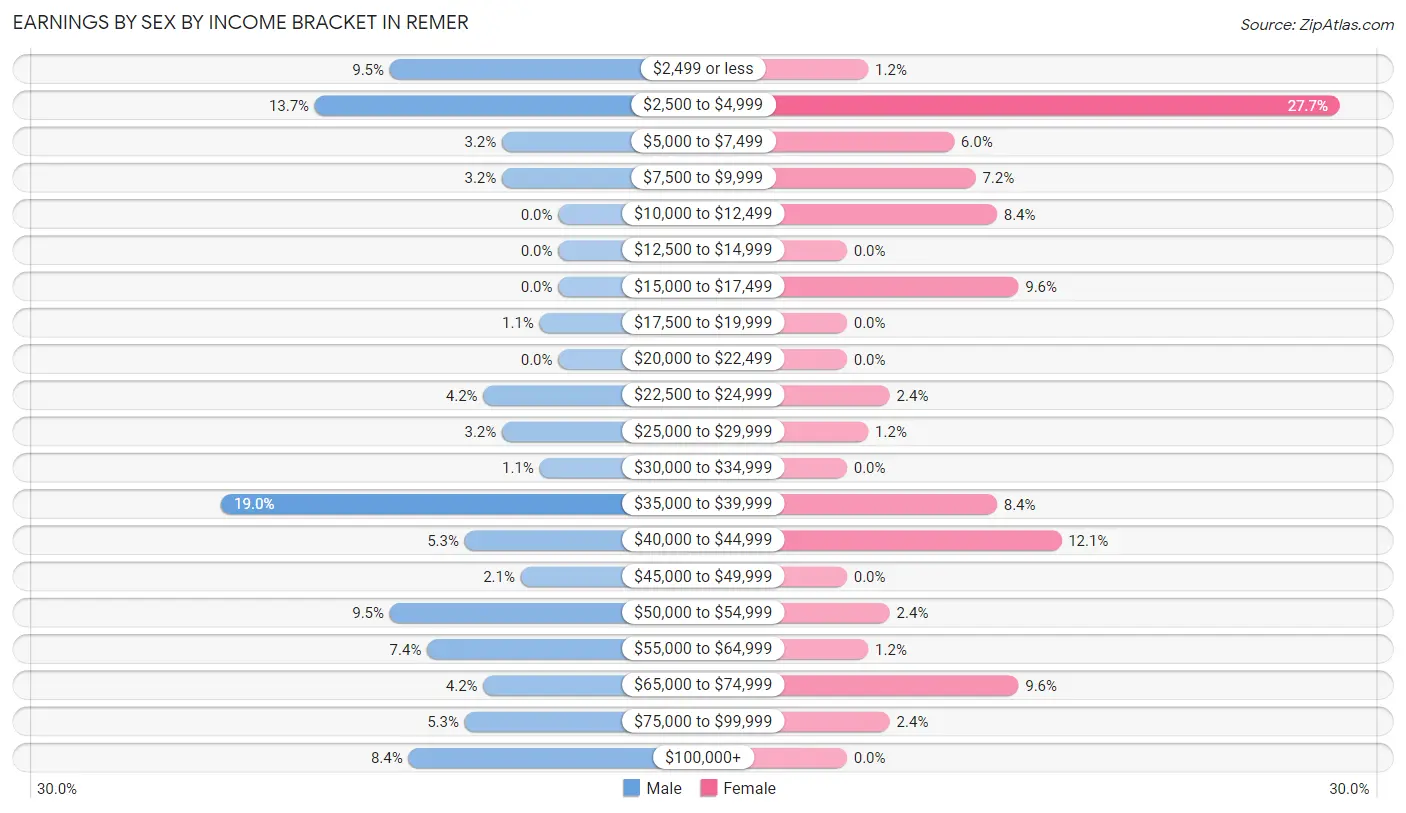
Earnings by Sex by Income Bracket in Remer
The most common earnings brackets in Remer are $35,000 to $39,999 for men (18 | 19.0%) and $2,500 to $4,999 for women (23 | 27.7%).
| Income | Male | Female |
| $2,499 or less | 9 (9.5%) | 1 (1.2%) |
| $2,500 to $4,999 | 13 (13.7%) | 23 (27.7%) |
| $5,000 to $7,499 | 3 (3.2%) | 5 (6.0%) |
| $7,500 to $9,999 | 3 (3.2%) | 6 (7.2%) |
| $10,000 to $12,499 | 0 (0.0%) | 7 (8.4%) |
| $12,500 to $14,999 | 0 (0.0%) | 0 (0.0%) |
| $15,000 to $17,499 | 0 (0.0%) | 8 (9.6%) |
| $17,500 to $19,999 | 1 (1.1%) | 0 (0.0%) |
| $20,000 to $22,499 | 0 (0.0%) | 0 (0.0%) |
| $22,500 to $24,999 | 4 (4.2%) | 2 (2.4%) |
| $25,000 to $29,999 | 3 (3.2%) | 1 (1.2%) |
| $30,000 to $34,999 | 1 (1.1%) | 0 (0.0%) |
| $35,000 to $39,999 | 18 (19.0%) | 7 (8.4%) |
| $40,000 to $44,999 | 5 (5.3%) | 10 (12.0%) |
| $45,000 to $49,999 | 2 (2.1%) | 0 (0.0%) |
| $50,000 to $54,999 | 9 (9.5%) | 2 (2.4%) |
| $55,000 to $64,999 | 7 (7.4%) | 1 (1.2%) |
| $65,000 to $74,999 | 4 (4.2%) | 8 (9.6%) |
| $75,000 to $99,999 | 5 (5.3%) | 2 (2.4%) |
| $100,000+ | 8 (8.4%) | 0 (0.0%) |
| Total | 95 (100.0%) | 83 (100.0%) |
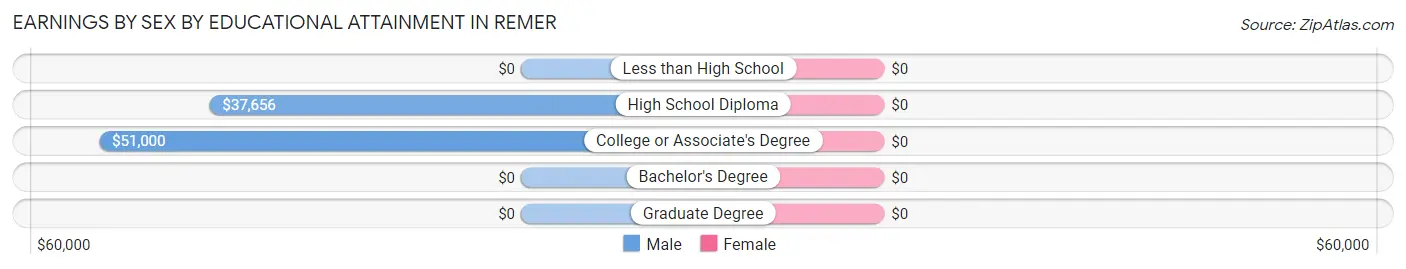
Earnings by Sex by Educational Attainment in Remer
| Educational Attainment | Male Income | Female Income |
| Less than High School | - | - |
| High School Diploma | $37,656 | $0 |
| College or Associate's Degree | $51,000 | $0 |
| Bachelor's Degree | - | - |
| Graduate Degree | - | - |
| Total | $39,779 | $0 |
Family Income in Remer
Family Income Brackets in Remer
According to the Remer family income data, there are 19 families falling into the less than $10,000 income range, which is the most common income bracket and makes up 23.5% of all families. Conversely, the $10,000 to $14,999 income bracket is the least frequent group with only 2 families (2.5%) belonging to this category.
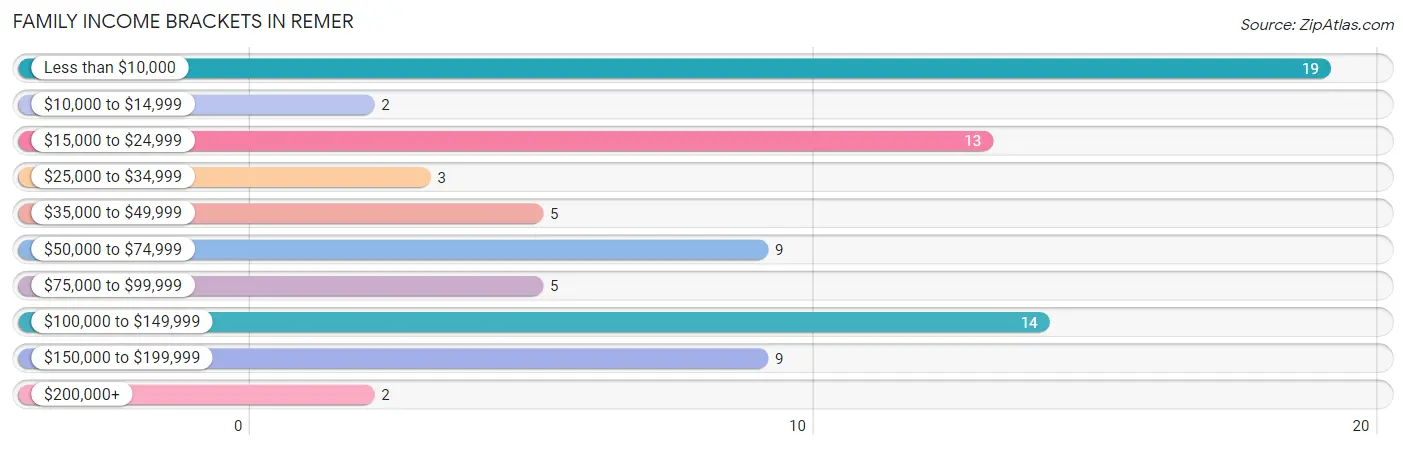
| Income Bracket | # Families | % Families |
| Less than $10,000 | 19 | 23.5% |
| $10,000 to $14,999 | 2 | 2.5% |
| $15,000 to $24,999 | 13 | 16.0% |
| $25,000 to $34,999 | 3 | 3.7% |
| $35,000 to $49,999 | 5 | 6.2% |
| $50,000 to $74,999 | 9 | 11.1% |
| $75,000 to $99,999 | 5 | 6.2% |
| $100,000 to $149,999 | 14 | 17.3% |
| $150,000 to $199,999 | 9 | 11.1% |
| $200,000+ | 2 | 2.5% |
Family Income by Famaliy Size in Remer
3-person families (15 | 18.5%) account for the highest median family income in Remer with $88,125 per family, while 3-person families (15 | 18.5%) have the highest median income of $29,375 per family member.
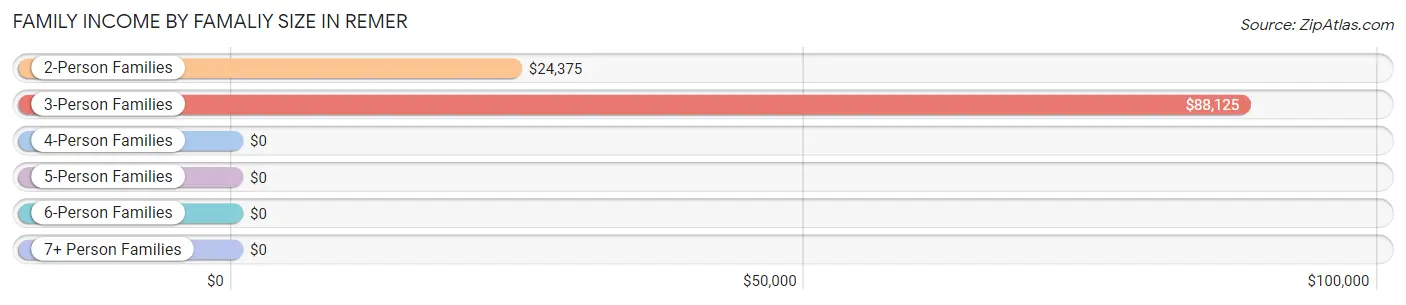
| Income Bracket | # Families | Median Income |
| 2-Person Families | 46 (56.8%) | $24,375 |
| 3-Person Families | 15 (18.5%) | $88,125 |
| 4-Person Families | 10 (12.3%) | $0 |
| 5-Person Families | 9 (11.1%) | $0 |
| 6-Person Families | 1 (1.2%) | $0 |
| 7+ Person Families | 0 (0.0%) | $0 |
| Total | 81 (100.0%) | $44,583 |
Family Income by Number of Earners in Remer
The median family income in Remer is $44,583, with families comprising 3+ earners (14) having the highest median family income of $169,375, while families with 1 earner (24) have the lowest median family income of $8,125, accounting for 17.3% and 29.6% of families, respectively.
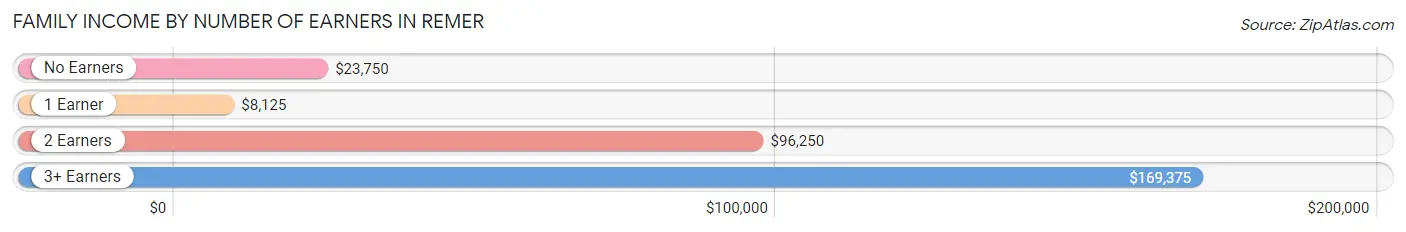
| Number of Earners | # Families | Median Income |
| No Earners | 18 (22.2%) | $23,750 |
| 1 Earner | 24 (29.6%) | $8,125 |
| 2 Earners | 25 (30.9%) | $96,250 |
| 3+ Earners | 14 (17.3%) | $169,375 |
| Total | 81 (100.0%) | $44,583 |
Household Income in Remer
Household Income Brackets in Remer
With 41 households falling in the category, the $15,000 to $24,999 income range is the most frequent in Remer, accounting for 25.5% of all households. In contrast, only 2 households (1.2%) fall into the $200,000+ income bracket, making it the least populous group.
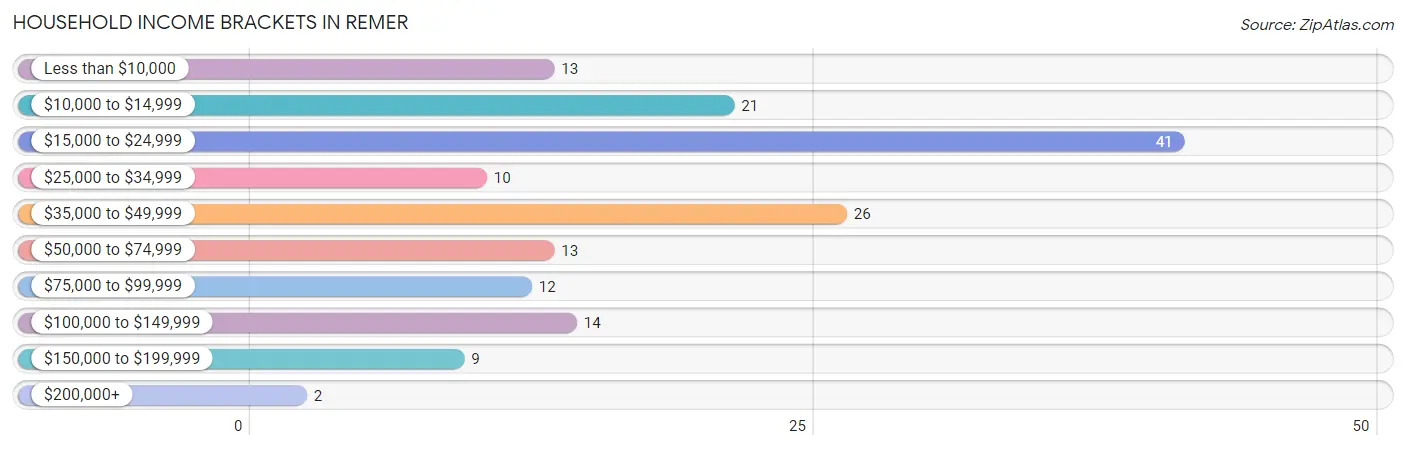
| Income Bracket | # Households | % Households |
| Less than $10,000 | 13 | 8.1% |
| $10,000 to $14,999 | 21 | 13.0% |
| $15,000 to $24,999 | 41 | 25.5% |
| $25,000 to $34,999 | 10 | 6.2% |
| $35,000 to $49,999 | 26 | 16.1% |
| $50,000 to $74,999 | 13 | 8.1% |
| $75,000 to $99,999 | 12 | 7.5% |
| $100,000 to $149,999 | 14 | 8.7% |
| $150,000 to $199,999 | 9 | 5.6% |
| $200,000+ | 2 | 1.2% |
Household Income by Householder Age in Remer
The median household income in Remer is $31,406, with the highest median household income of $43,571 found in the 15 to 24 years age bracket for the primary householder. A total of 14 households (8.7%) fall into this category. Meanwhile, the 65+ years age bracket for the primary householder has the lowest median household income of $19,000, with 50 households (31.1%) in this group.
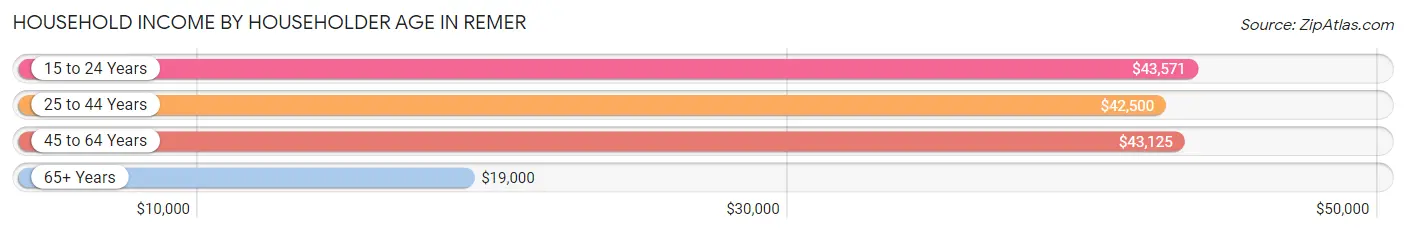
| Income Bracket | # Households | Median Income |
| 15 to 24 Years | 14 (8.7%) | $43,571 |
| 25 to 44 Years | 34 (21.1%) | $42,500 |
| 45 to 64 Years | 63 (39.1%) | $43,125 |
| 65+ Years | 50 (31.1%) | $19,000 |
| Total | 161 (100.0%) | $31,406 |
Poverty in Remer
Income Below Poverty by Sex and Age in Remer
With 17.4% poverty level for males and 32.6% for females among the residents of Remer, 5 year old males and 12 to 14 year old females are the most vulnerable to poverty, with 2 males (100.0%) and 3 females (100.0%) in their respective age groups living below the poverty level.
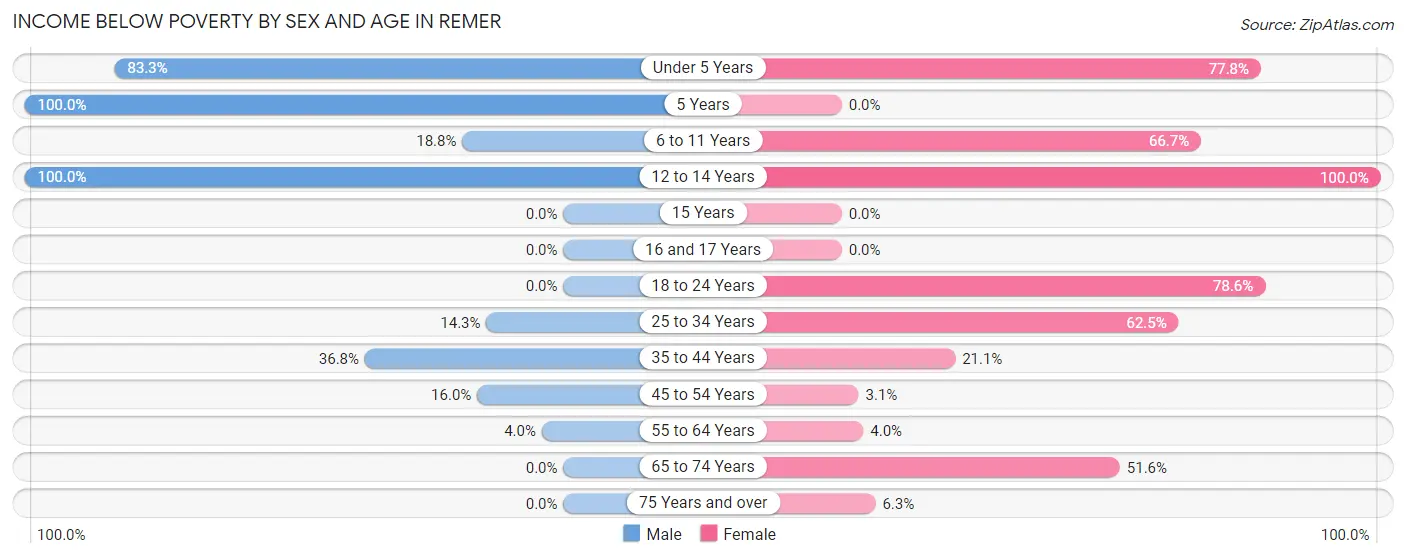
| Age Bracket | Male | Female |
| Under 5 Years | 5 (83.3%) | 7 (77.8%) |
| 5 Years | 2 (100.0%) | 0 (0.0%) |
| 6 to 11 Years | 3 (18.8%) | 2 (66.7%) |
| 12 to 14 Years | 3 (100.0%) | 3 (100.0%) |
| 15 Years | 0 (0.0%) | 0 (0.0%) |
| 16 and 17 Years | 0 (0.0%) | 0 (0.0%) |
| 18 to 24 Years | 0 (0.0%) | 11 (78.6%) |
| 25 to 34 Years | 4 (14.3%) | 10 (62.5%) |
| 35 to 44 Years | 7 (36.8%) | 4 (21.0%) |
| 45 to 54 Years | 4 (16.0%) | 1 (3.1%) |
| 55 to 64 Years | 1 (4.0%) | 1 (4.0%) |
| 65 to 74 Years | 0 (0.0%) | 16 (51.6%) |
| 75 Years and over | 0 (0.0%) | 1 (6.2%) |
| Total | 29 (17.4%) | 56 (32.6%) |
Income Above Poverty by Sex and Age in Remer
According to the poverty statistics in Remer, males aged 16 and 17 years and females aged 16 and 17 years are the age groups that are most secure financially, with 100.0% of males and 100.0% of females in these age groups living above the poverty line.
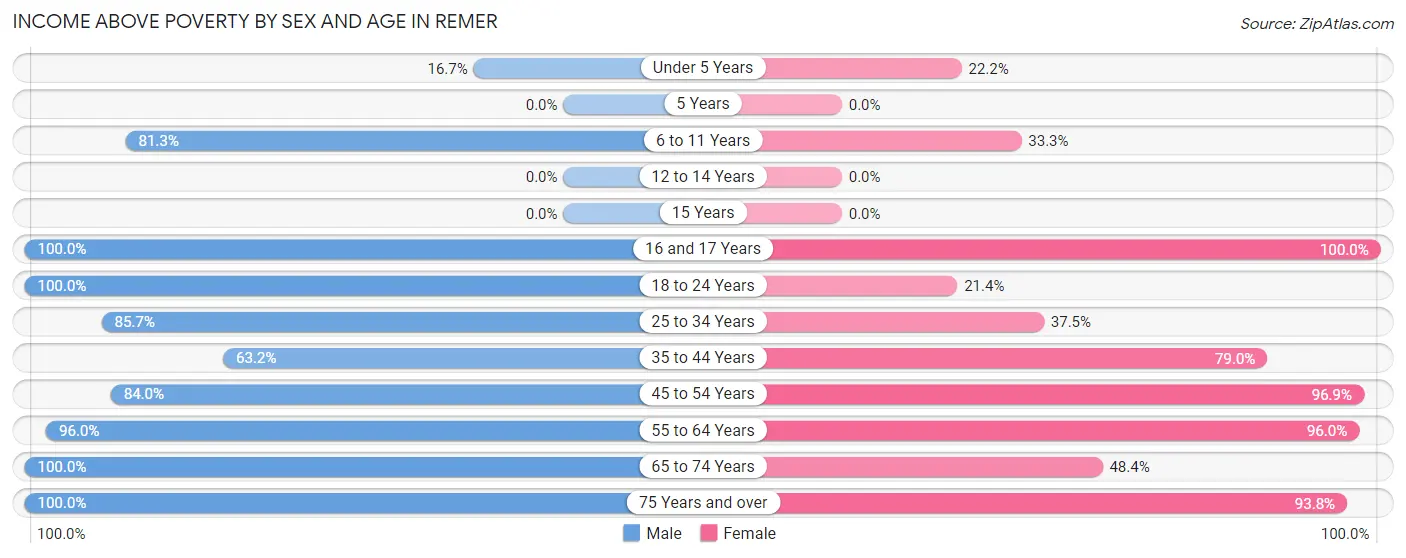
| Age Bracket | Male | Female |
| Under 5 Years | 1 (16.7%) | 2 (22.2%) |
| 5 Years | 0 (0.0%) | 0 (0.0%) |
| 6 to 11 Years | 13 (81.2%) | 1 (33.3%) |
| 12 to 14 Years | 0 (0.0%) | 0 (0.0%) |
| 15 Years | 0 (0.0%) | 0 (0.0%) |
| 16 and 17 Years | 5 (100.0%) | 4 (100.0%) |
| 18 to 24 Years | 17 (100.0%) | 3 (21.4%) |
| 25 to 34 Years | 24 (85.7%) | 6 (37.5%) |
| 35 to 44 Years | 12 (63.2%) | 15 (78.9%) |
| 45 to 54 Years | 21 (84.0%) | 31 (96.9%) |
| 55 to 64 Years | 24 (96.0%) | 24 (96.0%) |
| 65 to 74 Years | 9 (100.0%) | 15 (48.4%) |
| 75 Years and over | 12 (100.0%) | 15 (93.8%) |
| Total | 138 (82.6%) | 116 (67.4%) |
Income Below Poverty Among Married-Couple Families in Remer
The poverty statistics for married-couple families in Remer show that 10.6% or 5 of the total 47 families live below the poverty line. Families with 1 or 2 children have the highest poverty rate of 13.3%, comprising of 2 families. On the other hand, families with no children have the lowest poverty rate of 9.4%, which includes 3 families.
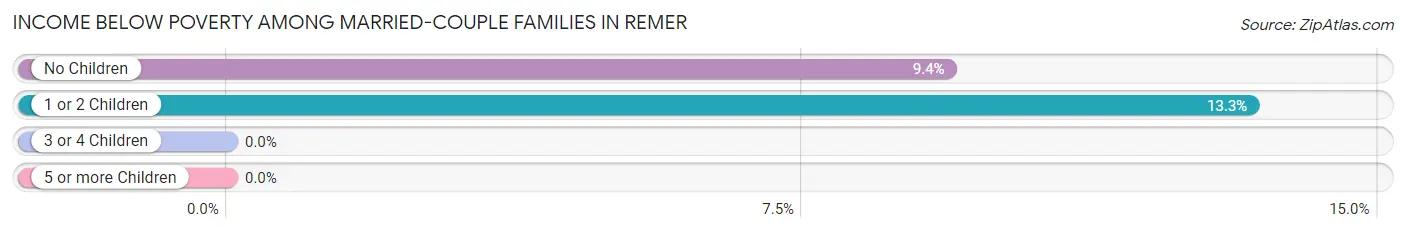
| Children | Above Poverty | Below Poverty |
| No Children | 29 (90.6%) | 3 (9.4%) |
| 1 or 2 Children | 13 (86.7%) | 2 (13.3%) |
| 3 or 4 Children | 0 (0.0%) | 0 (0.0%) |
| 5 or more Children | 0 (0.0%) | 0 (0.0%) |
| Total | 42 (89.4%) | 5 (10.6%) |
Income Below Poverty Among Single-Parent Households in Remer
According to the poverty data in Remer, 40.0% or 2 single-father households and 62.1% or 18 single-mother households are living below the poverty line. Among single-father households, those with no children have the highest poverty rate, with 2 households (50.0%) experiencing poverty. Likewise, among single-mother households, those with 1 or 2 children have the highest poverty rate, with 12 households (100.0%) falling below the poverty line.
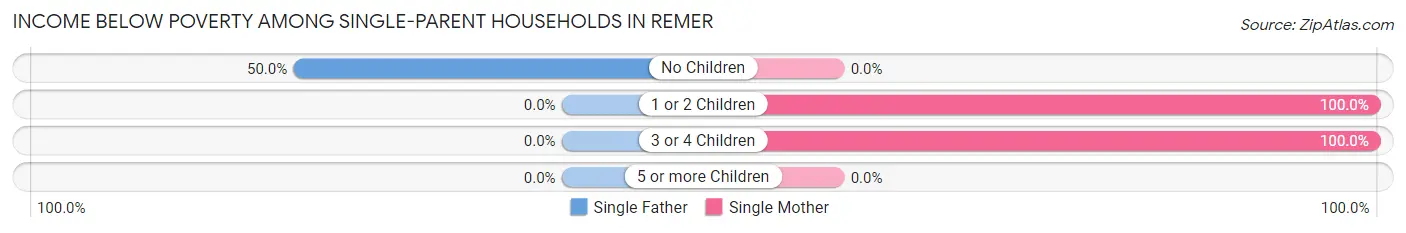
| Children | Single Father | Single Mother |
| No Children | 2 (50.0%) | 0 (0.0%) |
| 1 or 2 Children | 0 (0.0%) | 12 (100.0%) |
| 3 or 4 Children | 0 (0.0%) | 6 (100.0%) |
| 5 or more Children | 0 (0.0%) | 0 (0.0%) |
| Total | 2 (40.0%) | 18 (62.1%) |
Income Below Poverty Among Married-Couple vs Single-Parent Households in Remer
The poverty data for Remer shows that 5 of the married-couple family households (10.6%) and 20 of the single-parent households (58.8%) are living below the poverty level. Within the married-couple family households, those with 1 or 2 children have the highest poverty rate, with 2 households (13.3%) falling below the poverty line. Among the single-parent households, those with 3 or 4 children have the highest poverty rate, with 6 household (100.0%) living below poverty.
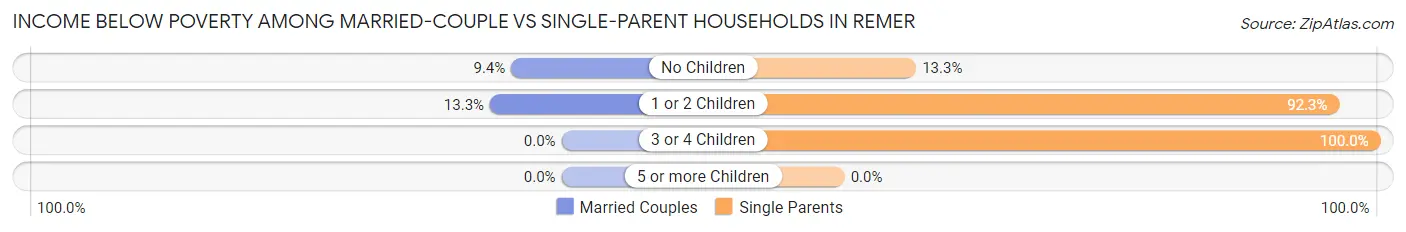
| Children | Married-Couple Families | Single-Parent Households |
| No Children | 3 (9.4%) | 2 (13.3%) |
| 1 or 2 Children | 2 (13.3%) | 12 (92.3%) |
| 3 or 4 Children | 0 (0.0%) | 6 (100.0%) |
| 5 or more Children | 0 (0.0%) | 0 (0.0%) |
| Total | 5 (10.6%) | 20 (58.8%) |
Race in Remer
The most populous races in Remer are White / Caucasian (318 | 87.6%), Two or more Races (30 | 8.3%), and Native / Alaskan (12 | 3.3%).
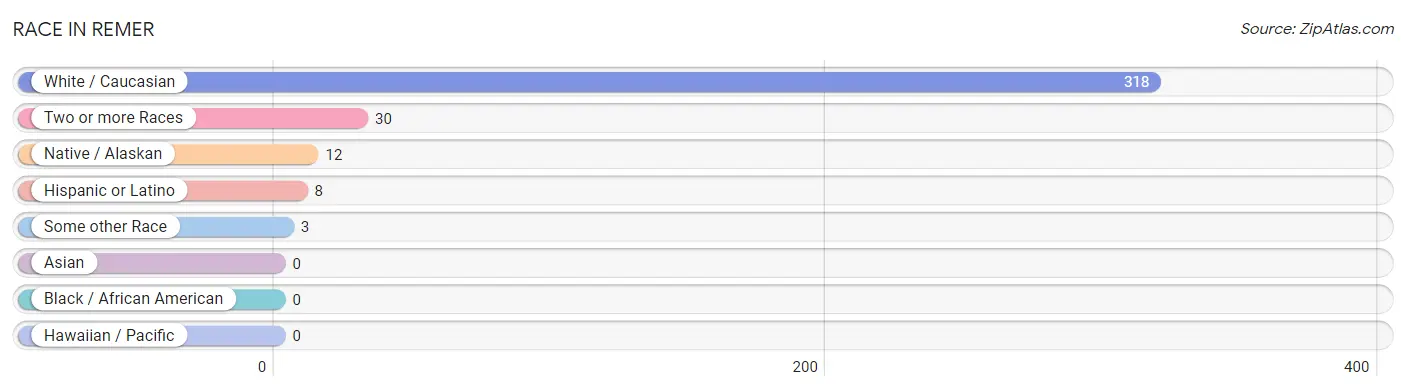
| Race | # Population | % Population |
| Asian | 0 | 0.0% |
| Black / African American | 0 | 0.0% |
| Hawaiian / Pacific | 0 | 0.0% |
| Hispanic or Latino | 8 | 2.2% |
| Native / Alaskan | 12 | 3.3% |
| White / Caucasian | 318 | 87.6% |
| Two or more Races | 30 | 8.3% |
| Some other Race | 3 | 0.8% |
| Total | 363 | 100.0% |
Ancestry in Remer
The most populous ancestries reported in Remer are German (110 | 30.3%), Irish (52 | 14.3%), Norwegian (51 | 14.1%), Swedish (32 | 8.8%), and American (28 | 7.7%), together accounting for 75.2% of all Remer residents.
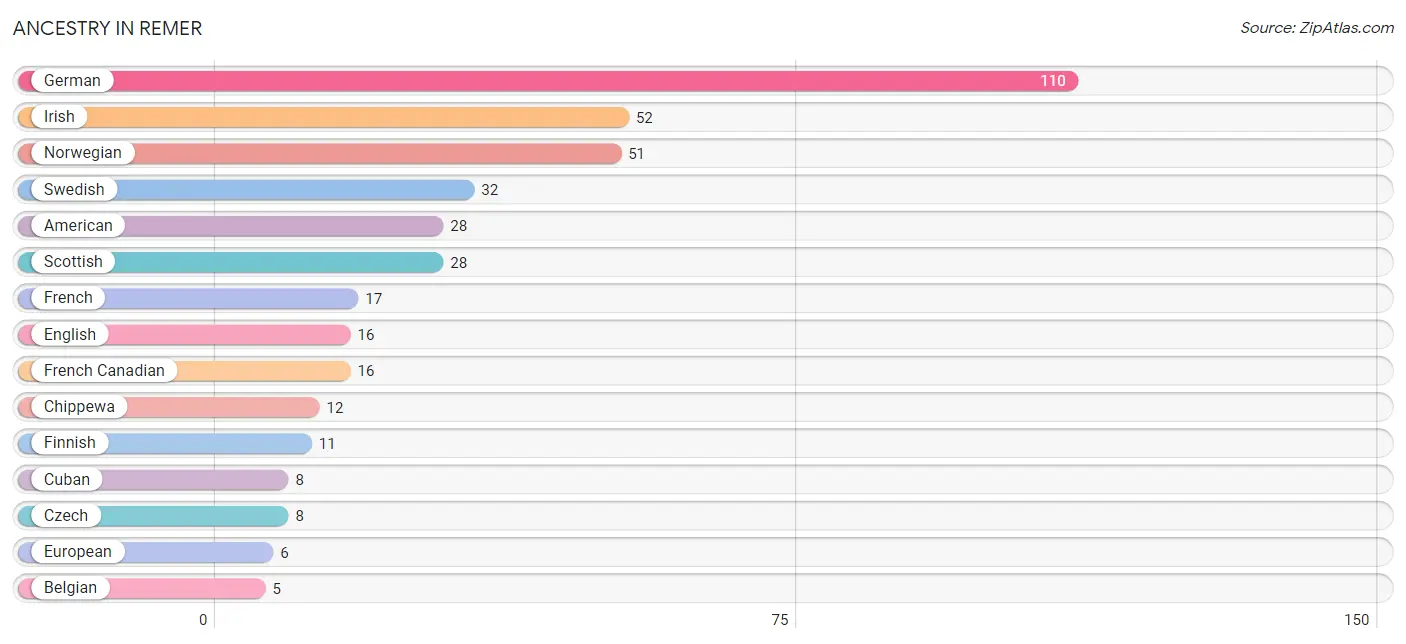
| Ancestry | # Population | % Population |
| American | 28 | 7.7% |
| Belgian | 5 | 1.4% |
| Cherokee | 2 | 0.5% |
| Chippewa | 12 | 3.3% |
| Cuban | 8 | 2.2% |
| Czech | 8 | 2.2% |
| Danish | 4 | 1.1% |
| Dutch | 2 | 0.5% |
| English | 16 | 4.4% |
| European | 6 | 1.7% |
| Finnish | 11 | 3.0% |
| French | 17 | 4.7% |
| French Canadian | 16 | 4.4% |
| German | 110 | 30.3% |
| Irish | 52 | 14.3% |
| Italian | 3 | 0.8% |
| Norwegian | 51 | 14.1% |
| Polish | 3 | 0.8% |
| Russian | 1 | 0.3% |
| Scotch-Irish | 2 | 0.5% |
| Scottish | 28 | 7.7% |
| Serbian | 3 | 0.8% |
| Swedish | 32 | 8.8% | View All 23 Rows |
Immigrants in Remer

| Immigration Origin | # Population | % Population | View All 0 Rows |
Sex and Age in Remer
Sex and Age in Remer
The most populous age groups in Remer are 75 to 79 Years (30 | 15.7%) for men and 50 to 54 Years (25 | 14.5%) for women.
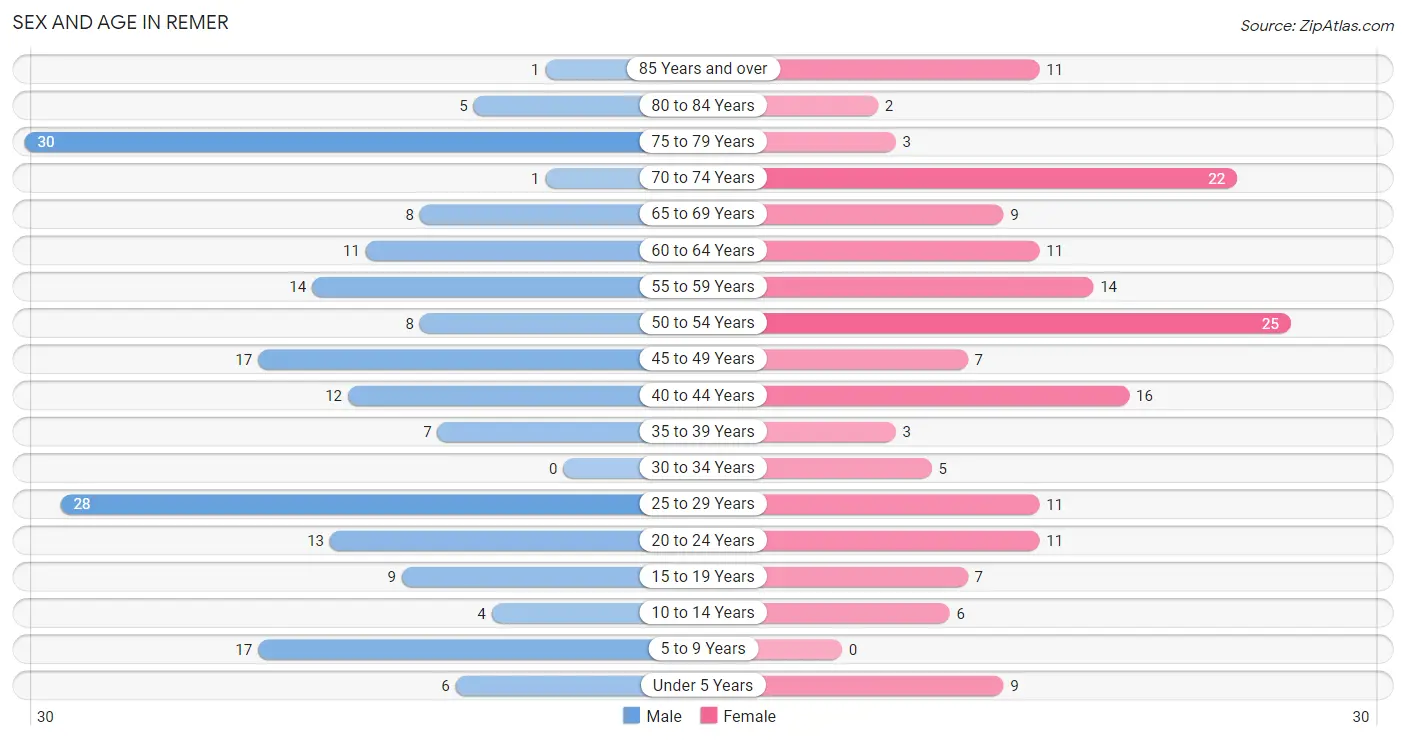
| Age Bracket | Male | Female |
| Under 5 Years | 6 (3.1%) | 9 (5.2%) |
| 5 to 9 Years | 17 (8.9%) | 0 (0.0%) |
| 10 to 14 Years | 4 (2.1%) | 6 (3.5%) |
| 15 to 19 Years | 9 (4.7%) | 7 (4.1%) |
| 20 to 24 Years | 13 (6.8%) | 11 (6.4%) |
| 25 to 29 Years | 28 (14.7%) | 11 (6.4%) |
| 30 to 34 Years | 0 (0.0%) | 5 (2.9%) |
| 35 to 39 Years | 7 (3.7%) | 3 (1.7%) |
| 40 to 44 Years | 12 (6.3%) | 16 (9.3%) |
| 45 to 49 Years | 17 (8.9%) | 7 (4.1%) |
| 50 to 54 Years | 8 (4.2%) | 25 (14.5%) |
| 55 to 59 Years | 14 (7.3%) | 14 (8.1%) |
| 60 to 64 Years | 11 (5.8%) | 11 (6.4%) |
| 65 to 69 Years | 8 (4.2%) | 9 (5.2%) |
| 70 to 74 Years | 1 (0.5%) | 22 (12.8%) |
| 75 to 79 Years | 30 (15.7%) | 3 (1.7%) |
| 80 to 84 Years | 5 (2.6%) | 2 (1.2%) |
| 85 Years and over | 1 (0.5%) | 11 (6.4%) |
| Total | 191 (100.0%) | 172 (100.0%) |
Families and Households in Remer
Median Family Size in Remer
The median family size in Remer is 2.95 persons per family, with married-couple families (47 | 58.0%) accounting for the largest median family size of 3.17 persons per family. On the other hand, single male/father families (5 | 6.2%) represent the smallest median family size with 2.20 persons per family.
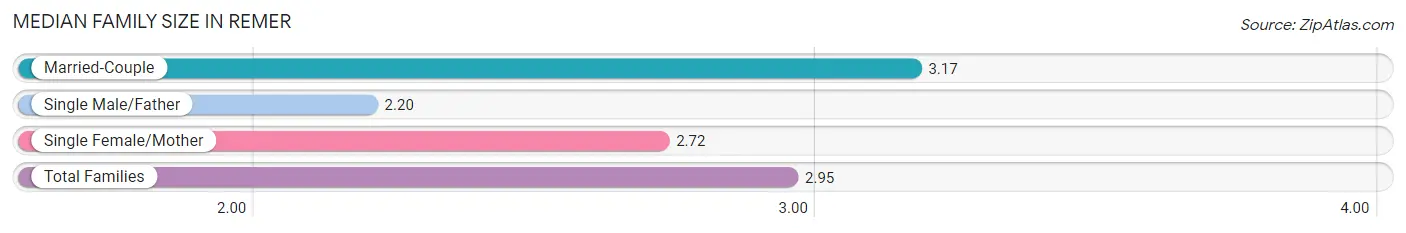
| Family Type | # Families | Family Size |
| Married-Couple | 47 (58.0%) | 3.17 |
| Single Male/Father | 5 (6.2%) | 2.20 |
| Single Female/Mother | 29 (35.8%) | 2.72 |
| Total Families | 81 (100.0%) | 2.95 |
Median Household Size in Remer
The median household size in Remer is 2.11 persons per household, with married-couple households (47 | 29.2%) accounting for the largest median household size of 3.17 persons per household. non-family households (80 | 49.7%) represent the smallest median household size with 1.13 persons per household.
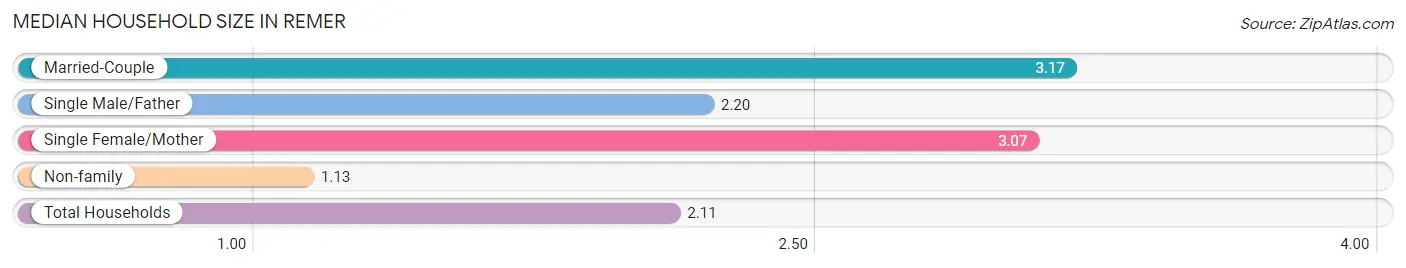
| Household Type | # Households | Household Size |
| Married-Couple | 47 (29.2%) | 3.17 |
| Single Male/Father | 5 (3.1%) | 2.20 |
| Single Female/Mother | 29 (18.0%) | 3.07 |
| Non-family | 80 (49.7%) | 1.13 |
| Total Households | 161 (100.0%) | 2.11 |
Household Size by Marriage Status in Remer
Out of a total of 161 households in Remer, 81 (50.3%) are family households, while 80 (49.7%) are nonfamily households. The most numerous type of family households are 2-person households, comprising 39, and the most common type of nonfamily households are 1-person households, comprising 69.
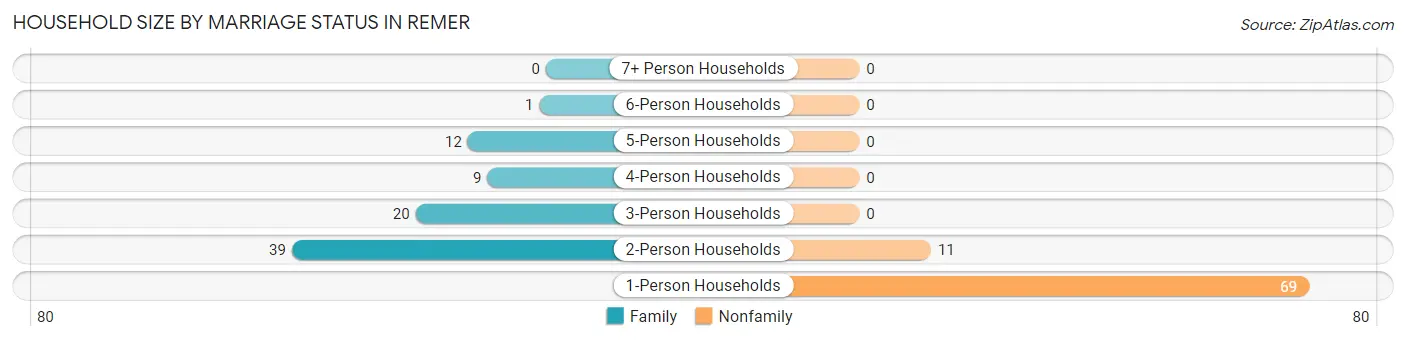
| Household Size | Family Households | Nonfamily Households |
| 1-Person Households | - | 69 (42.9%) |
| 2-Person Households | 39 (24.2%) | 11 (6.8%) |
| 3-Person Households | 20 (12.4%) | 0 (0.0%) |
| 4-Person Households | 9 (5.6%) | 0 (0.0%) |
| 5-Person Households | 12 (7.4%) | 0 (0.0%) |
| 6-Person Households | 1 (0.6%) | 0 (0.0%) |
| 7+ Person Households | 0 (0.0%) | 0 (0.0%) |
| Total | 81 (50.3%) | 80 (49.7%) |
Female Fertility in Remer
Fertility by Age in Remer
| Age Bracket | Women with Births | Births / 1,000 Women |
| 15 to 19 years | 0 (0.0%) | 0.0 |
| 20 to 34 years | 0 (0.0%) | 0.0 |
| 35 to 50 years | 0 (0.0%) | 0.0 |
| Total | 0 (0.0%) | 0.0 |
Fertility by Age by Marriage Status in Remer
| Age Bracket | Married | Unmarried |
| 15 to 19 years | 0 (0.0%) | 0 (0.0%) |
| 20 to 34 years | 0 (0.0%) | 0 (0.0%) |
| 35 to 50 years | 0 (0.0%) | 0 (0.0%) |
| Total | 0 (0.0%) | 0 (0.0%) |
Fertility by Education in Remer
| Educational Attainment | Women with Births | Births / 1,000 Women |
| Less than High School | 0 (0.0%) | 0.0 |
| High School Diploma | 0 (0.0%) | 0.0 |
| College or Associate's Degree | 0 (0.0%) | 0.0 |
| Bachelor's Degree | 0 (0.0%) | 0.0 |
| Graduate Degree | 0 (0.0%) | 0.0 |
| Total | 0 (0.0%) | 0.0 |
Fertility by Education by Marriage Status in Remer
| Educational Attainment | Married | Unmarried |
| Less than High School | 0 (0.0%) | 0 (0.0%) |
| High School Diploma | 0 (0.0%) | 0 (0.0%) |
| College or Associate's Degree | 0 (0.0%) | 0 (0.0%) |
| Bachelor's Degree | 0 (0.0%) | 0 (0.0%) |
| Graduate Degree | 0 (0.0%) | 0 (0.0%) |
| Total | 0 (0.0%) | 0 (0.0%) |
Employment Characteristics in Remer
Employment by Class of Employer in Remer
Among the 153 employed individuals in Remer, private company employees (85 | 55.6%), local government employees (34 | 22.2%), and not-for-profit organizations (21 | 13.7%) make up the most common classes of employment.
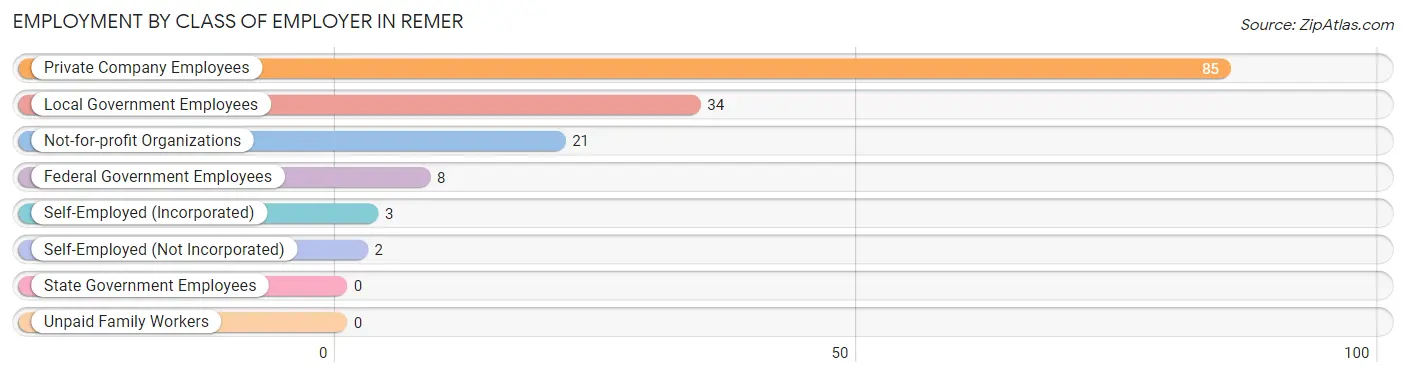
| Employer Class | # Employees | % Employees |
| Private Company Employees | 85 | 55.6% |
| Self-Employed (Incorporated) | 3 | 2.0% |
| Self-Employed (Not Incorporated) | 2 | 1.3% |
| Not-for-profit Organizations | 21 | 13.7% |
| Local Government Employees | 34 | 22.2% |
| State Government Employees | 0 | 0.0% |
| Federal Government Employees | 8 | 5.2% |
| Unpaid Family Workers | 0 | 0.0% |
| Total | 153 | 100.0% |
Employment Status by Age in Remer
According to the labor force statistics for Remer, out of the total population over 16 years of age (321), 54.2% or 174 individuals are in the labor force, with 12.1% or 21 of them unemployed. The age group with the highest labor force participation rate is 20 to 24 years, with 100.0% or 24 individuals in the labor force. Within the labor force, the 16 to 19 years age range has the highest percentage of unemployed individuals, with 70.0% or 7 of them being unemployed.
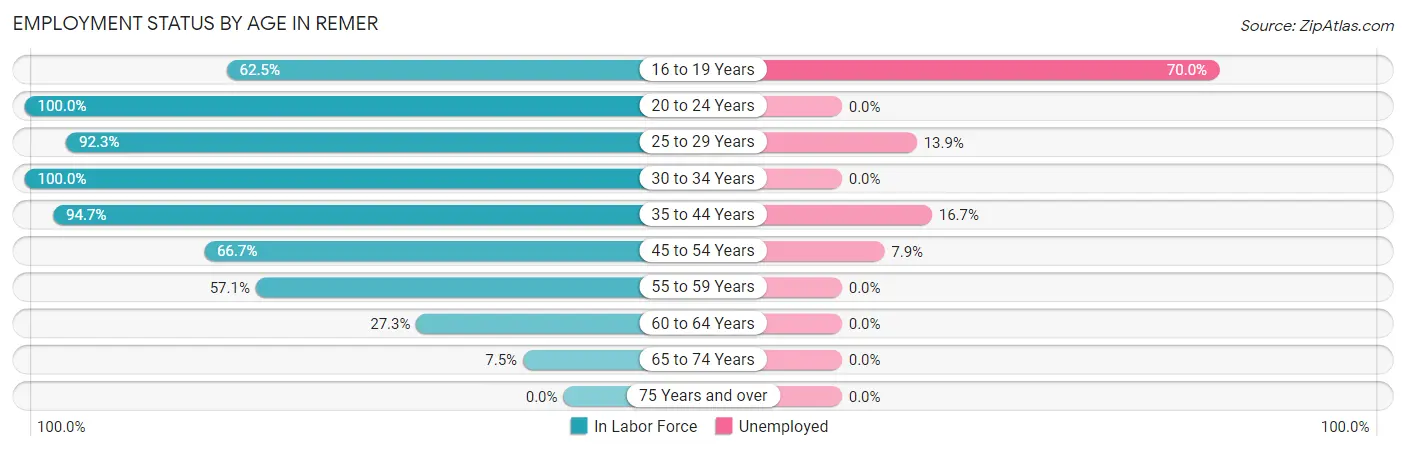
| Age Bracket | In Labor Force | Unemployed |
| 16 to 19 Years | 10 (62.5%) | 7 (70.0%) |
| 20 to 24 Years | 24 (100.0%) | 0 (0.0%) |
| 25 to 29 Years | 36 (92.3%) | 5 (13.9%) |
| 30 to 34 Years | 5 (100.0%) | 0 (0.0%) |
| 35 to 44 Years | 36 (94.7%) | 6 (16.7%) |
| 45 to 54 Years | 38 (66.7%) | 3 (7.9%) |
| 55 to 59 Years | 16 (57.1%) | 0 (0.0%) |
| 60 to 64 Years | 6 (27.3%) | 0 (0.0%) |
| 65 to 74 Years | 3 (7.5%) | 0 (0.0%) |
| 75 Years and over | 0 (0.0%) | 0 (0.0%) |
| Total | 174 (54.2%) | 21 (12.1%) |
Employment Status by Educational Attainment in Remer
According to labor force statistics for Remer, 72.5% of individuals (137) out of the total population between 25 and 64 years of age (189) are in the labor force, with 10.2% or 14 of them being unemployed. The group with the highest labor force participation rate are those with the educational attainment of bachelor's degree or higher, with 82.4% or 14 individuals in the labor force. Within the labor force, individuals with college / associate degree education have the highest percentage of unemployment, with 15.4% or 10 of them being unemployed.
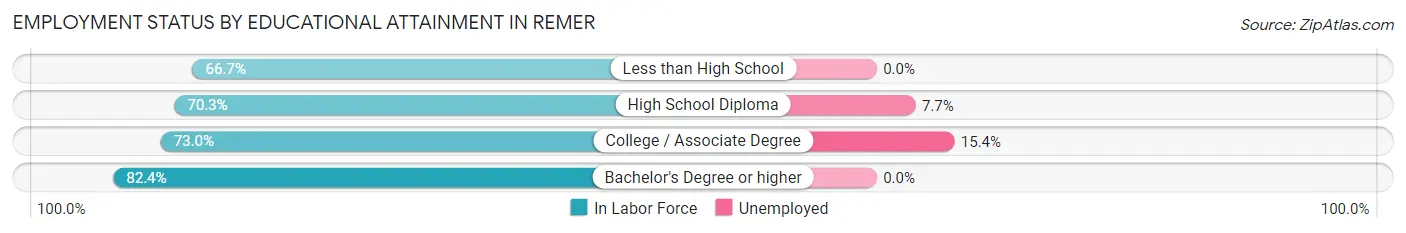
| Educational Attainment | In Labor Force | Unemployed |
| Less than High School | 6 (66.7%) | 0 (0.0%) |
| High School Diploma | 52 (70.3%) | 6 (7.7%) |
| College / Associate Degree | 65 (73.0%) | 14 (15.4%) |
| Bachelor's Degree or higher | 14 (82.4%) | 0 (0.0%) |
| Total | 137 (72.5%) | 19 (10.2%) |
Employment Occupations by Sex in Remer
Management, Business, Science and Arts Occupations
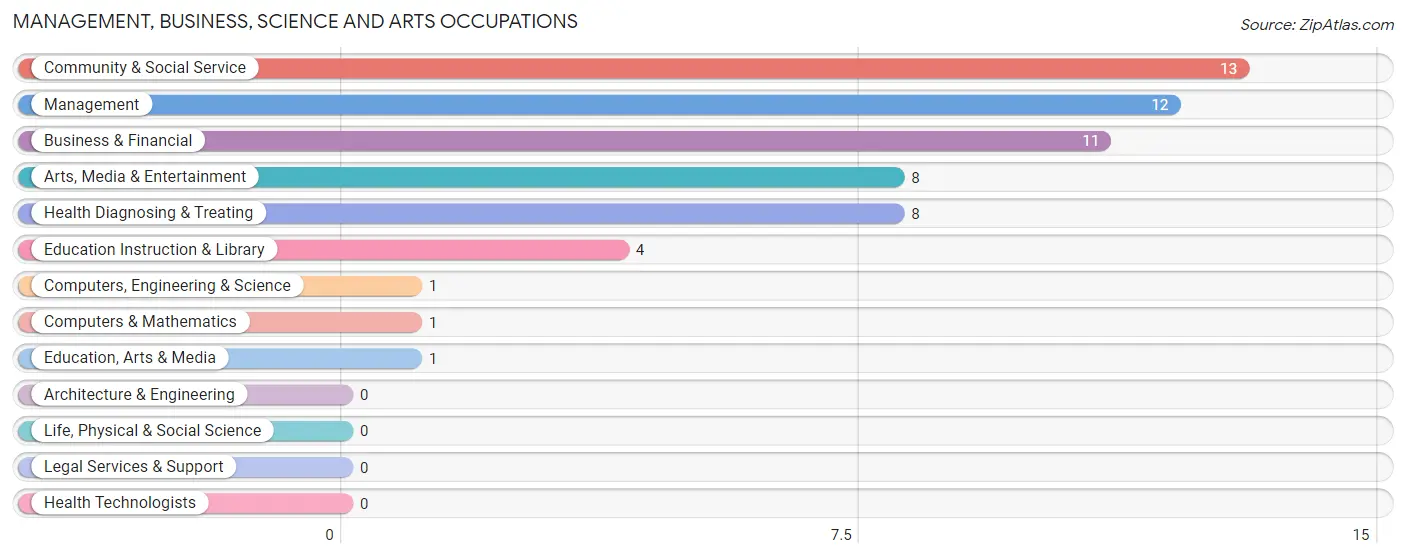
The most common Management, Business, Science and Arts occupations in Remer are Community & Social Service (13 | 8.5%), Management (12 | 7.8%), Business & Financial (11 | 7.2%), Arts, Media & Entertainment (8 | 5.2%), and Health Diagnosing & Treating (8 | 5.2%).
Management, Business, Science and Arts Occupations by Sex
Within the Management, Business, Science and Arts occupations in Remer, the most male-oriented occupations are Computers, Engineering & Science (100.0%), Computers & Mathematics (100.0%), and Education, Arts & Media (100.0%), while the most female-oriented occupations are Business & Financial (100.0%), Health Diagnosing & Treating (100.0%), and Education Instruction & Library (50.0%).
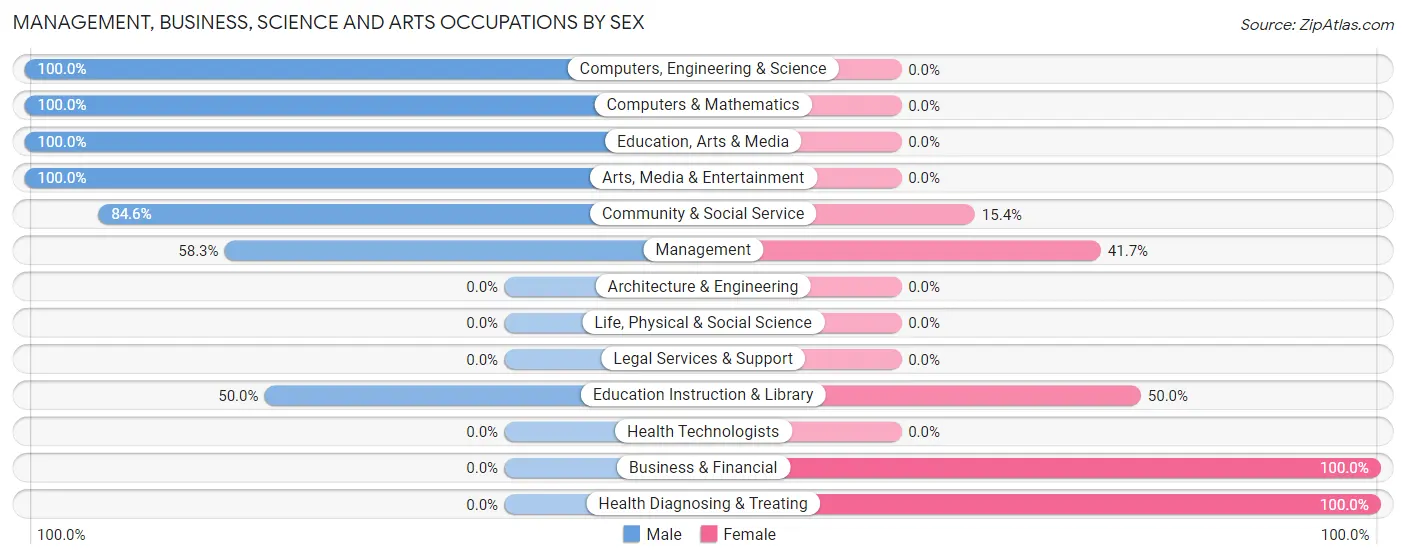
| Occupation | Male | Female |
| Management | 7 (58.3%) | 5 (41.7%) |
| Business & Financial | 0 (0.0%) | 11 (100.0%) |
| Computers, Engineering & Science | 1 (100.0%) | 0 (0.0%) |
| Computers & Mathematics | 1 (100.0%) | 0 (0.0%) |
| Architecture & Engineering | 0 (0.0%) | 0 (0.0%) |
| Life, Physical & Social Science | 0 (0.0%) | 0 (0.0%) |
| Community & Social Service | 11 (84.6%) | 2 (15.4%) |
| Education, Arts & Media | 1 (100.0%) | 0 (0.0%) |
| Legal Services & Support | 0 (0.0%) | 0 (0.0%) |
| Education Instruction & Library | 2 (50.0%) | 2 (50.0%) |
| Arts, Media & Entertainment | 8 (100.0%) | 0 (0.0%) |
| Health Diagnosing & Treating | 0 (0.0%) | 8 (100.0%) |
| Health Technologists | 0 (0.0%) | 0 (0.0%) |
| Total (Category) | 19 (42.2%) | 26 (57.8%) |
| Total (Overall) | 80 (52.3%) | 73 (47.7%) |
Services Occupations
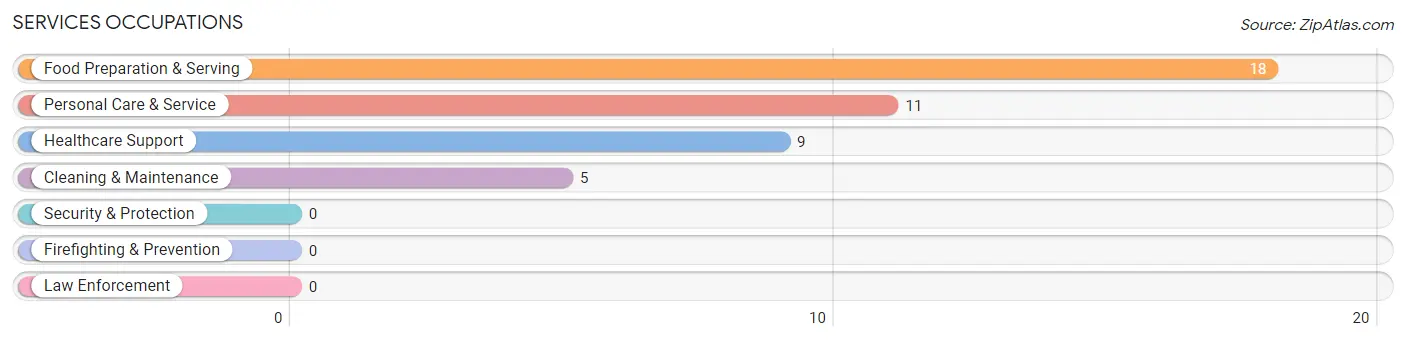
The most common Services occupations in Remer are Food Preparation & Serving (18 | 11.8%), Personal Care & Service (11 | 7.2%), Healthcare Support (9 | 5.9%), and Cleaning & Maintenance (5 | 3.3%).
Services Occupations by Sex
Within the Services occupations in Remer, the most male-oriented occupations are Personal Care & Service (90.9%), Cleaning & Maintenance (60.0%), and Food Preparation & Serving (11.1%), while the most female-oriented occupations are Healthcare Support (100.0%), Food Preparation & Serving (88.9%), and Cleaning & Maintenance (40.0%).
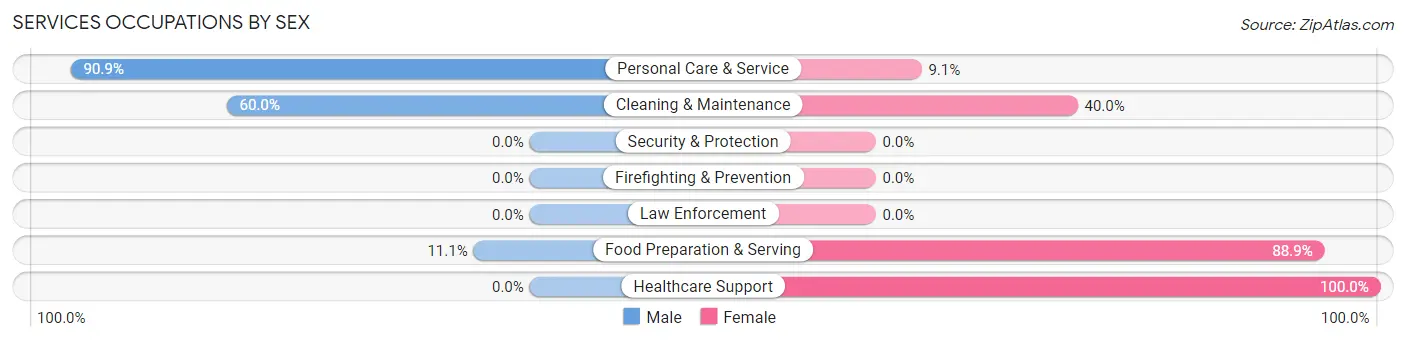
| Occupation | Male | Female |
| Healthcare Support | 0 (0.0%) | 9 (100.0%) |
| Security & Protection | 0 (0.0%) | 0 (0.0%) |
| Firefighting & Prevention | 0 (0.0%) | 0 (0.0%) |
| Law Enforcement | 0 (0.0%) | 0 (0.0%) |
| Food Preparation & Serving | 2 (11.1%) | 16 (88.9%) |
| Cleaning & Maintenance | 3 (60.0%) | 2 (40.0%) |
| Personal Care & Service | 10 (90.9%) | 1 (9.1%) |
| Total (Category) | 15 (34.9%) | 28 (65.1%) |
| Total (Overall) | 80 (52.3%) | 73 (47.7%) |
Sales and Office Occupations
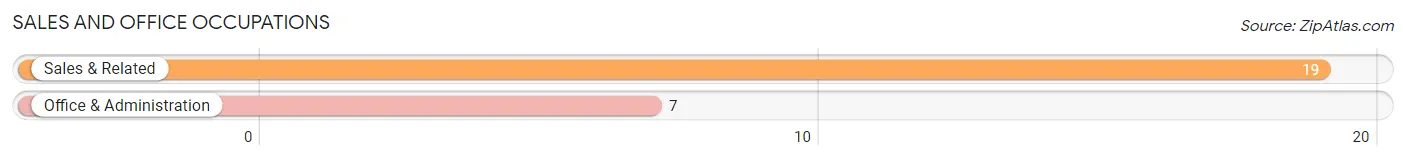
The most common Sales and Office occupations in Remer are Sales & Related (19 | 12.4%), and Office & Administration (7 | 4.6%).
Sales and Office Occupations by Sex
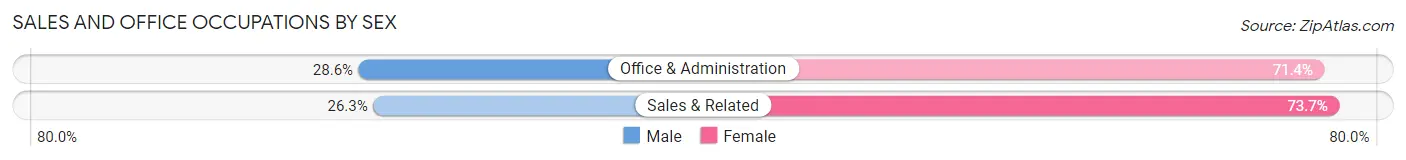
| Occupation | Male | Female |
| Sales & Related | 5 (26.3%) | 14 (73.7%) |
| Office & Administration | 2 (28.6%) | 5 (71.4%) |
| Total (Category) | 7 (26.9%) | 19 (73.1%) |
| Total (Overall) | 80 (52.3%) | 73 (47.7%) |
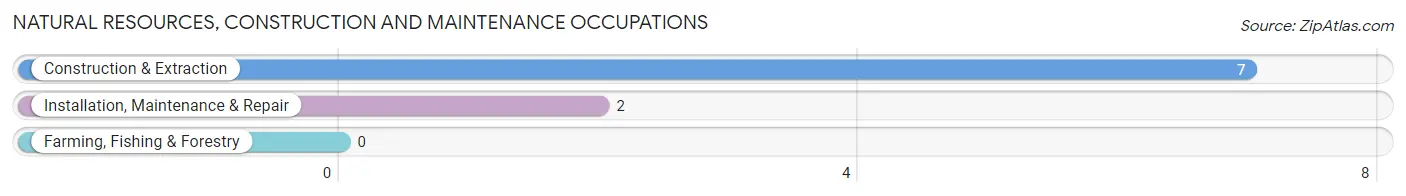
Natural Resources, Construction and Maintenance Occupations
The most common Natural Resources, Construction and Maintenance occupations in Remer are Construction & Extraction (7 | 4.6%), and Installation, Maintenance & Repair (2 | 1.3%).
Natural Resources, Construction and Maintenance Occupations by Sex
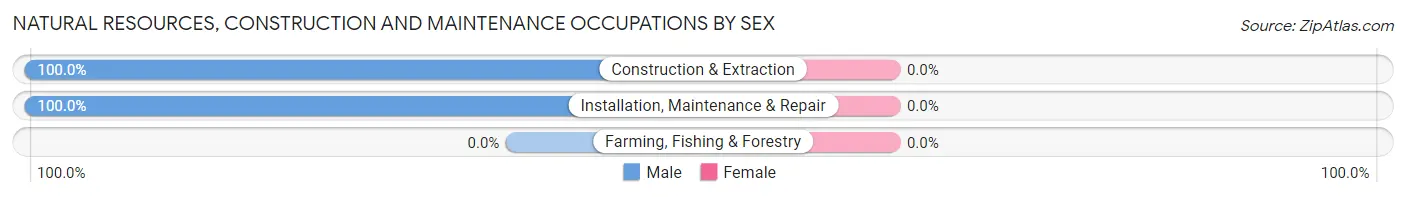
| Occupation | Male | Female |
| Farming, Fishing & Forestry | 0 (0.0%) | 0 (0.0%) |
| Construction & Extraction | 7 (100.0%) | 0 (0.0%) |
| Installation, Maintenance & Repair | 2 (100.0%) | 0 (0.0%) |
| Total (Category) | 9 (100.0%) | 0 (0.0%) |
| Total (Overall) | 80 (52.3%) | 73 (47.7%) |
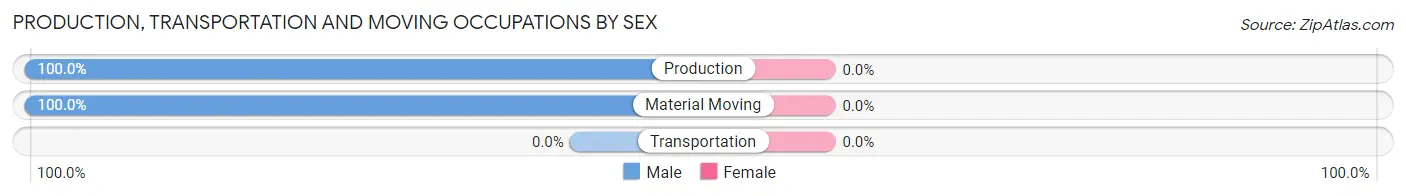
Production, Transportation and Moving Occupations
The most common Production, Transportation and Moving occupations in Remer are Production (20 | 13.1%), and Material Moving (10 | 6.5%).
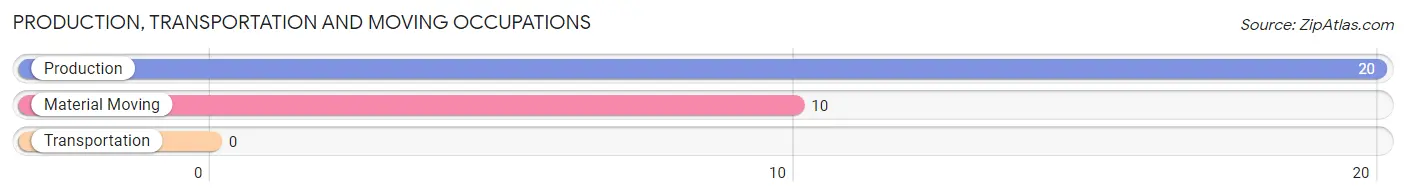
Production, Transportation and Moving Occupations by Sex
| Occupation | Male | Female |
| Production | 20 (100.0%) | 0 (0.0%) |
| Transportation | 0 (0.0%) | 0 (0.0%) |
| Material Moving | 10 (100.0%) | 0 (0.0%) |
| Total (Category) | 30 (100.0%) | 0 (0.0%) |
| Total (Overall) | 80 (52.3%) | 73 (47.7%) |
Employment Industries by Sex in Remer
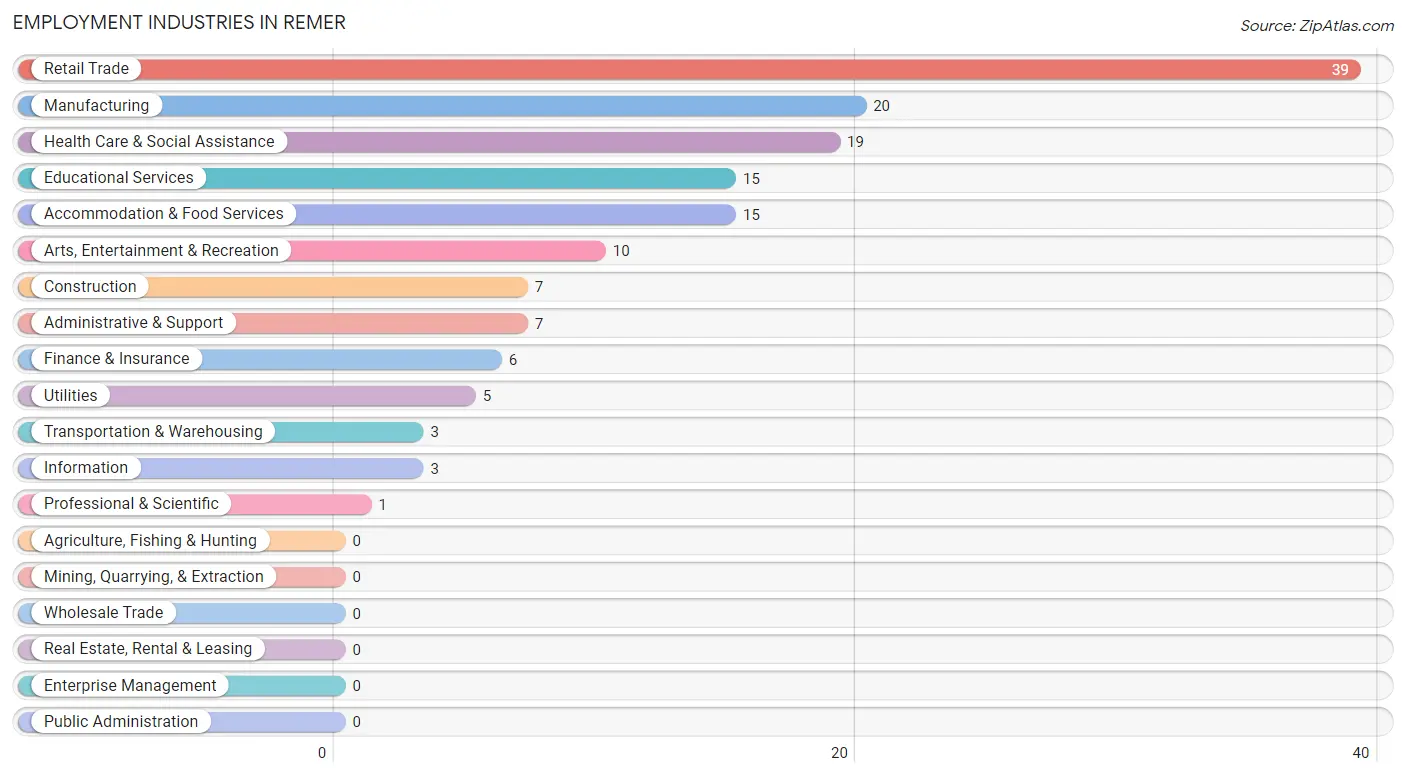
Employment Industries in Remer
The major employment industries in Remer include Retail Trade (39 | 25.5%), Manufacturing (20 | 13.1%), Health Care & Social Assistance (19 | 12.4%), Educational Services (15 | 9.8%), and Accommodation & Food Services (15 | 9.8%).
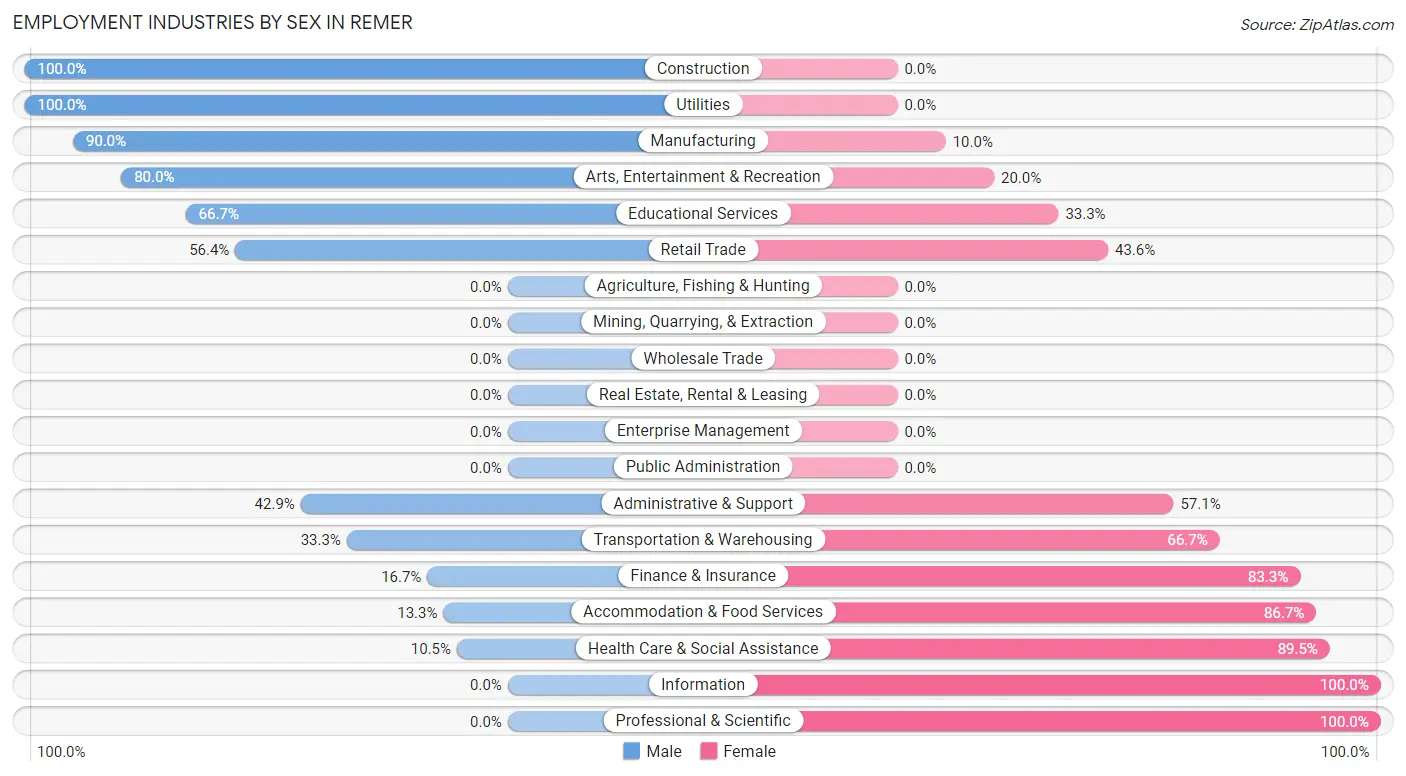
Employment Industries by Sex in Remer
The Remer industries that see more men than women are Construction (100.0%), Utilities (100.0%), and Manufacturing (90.0%), whereas the industries that tend to have a higher number of women are Information (100.0%), Professional & Scientific (100.0%), and Health Care & Social Assistance (89.5%).
| Industry | Male | Female |
| Agriculture, Fishing & Hunting | 0 (0.0%) | 0 (0.0%) |
| Mining, Quarrying, & Extraction | 0 (0.0%) | 0 (0.0%) |
| Construction | 7 (100.0%) | 0 (0.0%) |
| Manufacturing | 18 (90.0%) | 2 (10.0%) |
| Wholesale Trade | 0 (0.0%) | 0 (0.0%) |
| Retail Trade | 22 (56.4%) | 17 (43.6%) |
| Transportation & Warehousing | 1 (33.3%) | 2 (66.7%) |
| Utilities | 5 (100.0%) | 0 (0.0%) |
| Information | 0 (0.0%) | 3 (100.0%) |
| Finance & Insurance | 1 (16.7%) | 5 (83.3%) |
| Real Estate, Rental & Leasing | 0 (0.0%) | 0 (0.0%) |
| Professional & Scientific | 0 (0.0%) | 1 (100.0%) |
| Enterprise Management | 0 (0.0%) | 0 (0.0%) |
| Administrative & Support | 3 (42.9%) | 4 (57.1%) |
| Educational Services | 10 (66.7%) | 5 (33.3%) |
| Health Care & Social Assistance | 2 (10.5%) | 17 (89.5%) |
| Arts, Entertainment & Recreation | 8 (80.0%) | 2 (20.0%) |
| Accommodation & Food Services | 2 (13.3%) | 13 (86.7%) |
| Public Administration | 0 (0.0%) | 0 (0.0%) |
| Total | 80 (52.3%) | 73 (47.7%) |
Education in Remer
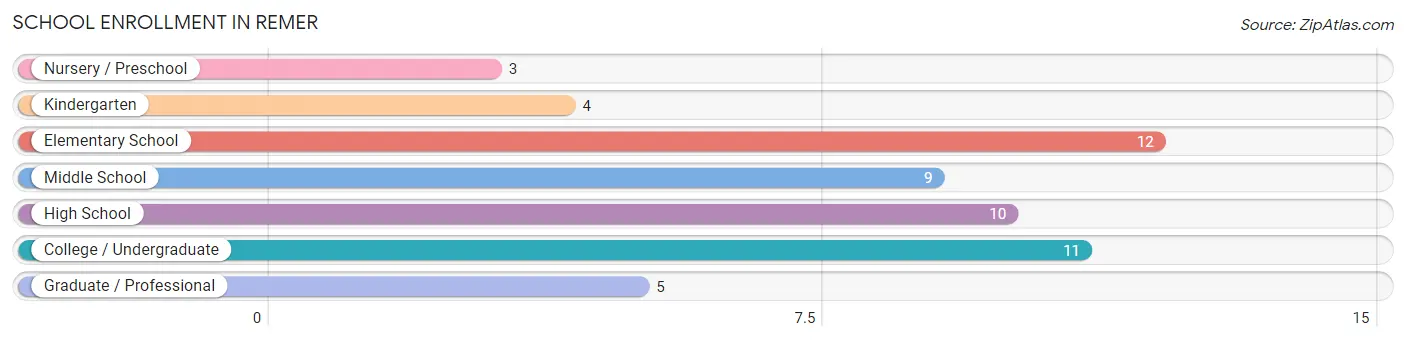
School Enrollment in Remer
The most common levels of schooling among the 54 students in Remer are elementary school (12 | 22.2%), college / undergraduate (11 | 20.4%), and high school (10 | 18.5%).
| School Level | # Students | % Students |
| Nursery / Preschool | 3 | 5.6% |
| Kindergarten | 4 | 7.4% |
| Elementary School | 12 | 22.2% |
| Middle School | 9 | 16.7% |
| High School | 10 | 18.5% |
| College / Undergraduate | 11 | 20.4% |
| Graduate / Professional | 5 | 9.3% |
| Total | 54 | 100.0% |
School Enrollment by Age by Funding Source in Remer
Out of a total of 54 students who are enrolled in schools in Remer, 3 (5.6%) attend a private institution, while the remaining 51 (94.4%) are enrolled in public schools. The age group of 3 to 4 year olds has the highest likelihood of being enrolled in private schools, with 1 (100.0% in the age bracket) enrolled. Conversely, the age group of 10 to 14 year olds has the lowest likelihood of being enrolled in a private school, with 10 (100.0% in the age bracket) attending a public institution.
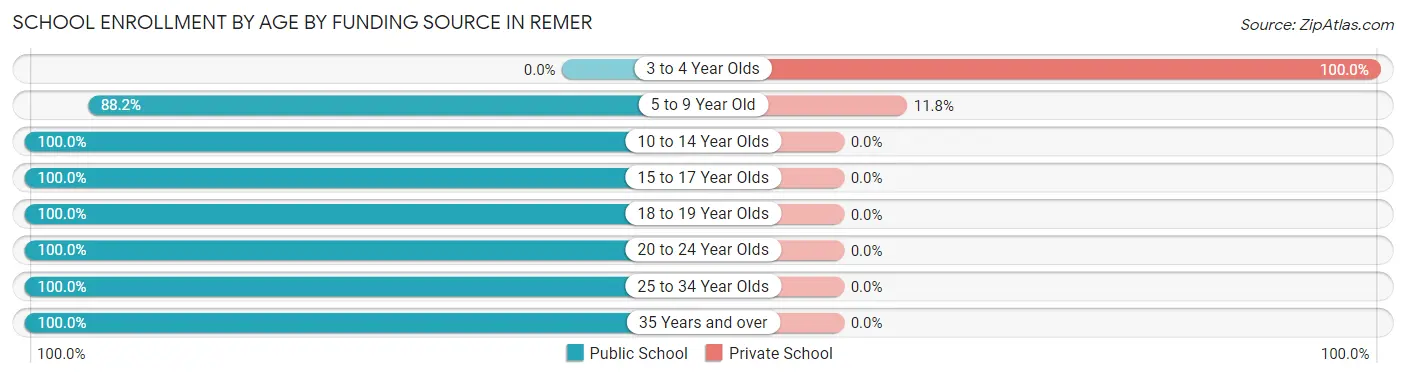
| Age Bracket | Public School | Private School |
| 3 to 4 Year Olds | 0 (0.0%) | 1 (100.0%) |
| 5 to 9 Year Old | 15 (88.2%) | 2 (11.8%) |
| 10 to 14 Year Olds | 10 (100.0%) | 0 (0.0%) |
| 15 to 17 Year Olds | 9 (100.0%) | 0 (0.0%) |
| 18 to 19 Year Olds | 1 (100.0%) | 0 (0.0%) |
| 20 to 24 Year Olds | 8 (100.0%) | 0 (0.0%) |
| 25 to 34 Year Olds | 3 (100.0%) | 0 (0.0%) |
| 35 Years and over | 5 (100.0%) | 0 (0.0%) |
| Total | 51 (94.4%) | 3 (5.6%) |
Educational Attainment by Field of Study in Remer
Business (29 | 63.0%), psychology (5 | 10.9%), education (5 | 10.9%), computers & mathematics (2 | 4.3%), and bio, nature & agricultural (2 | 4.3%) are the most common fields of study among 46 individuals in Remer who have obtained a bachelor's degree or higher.
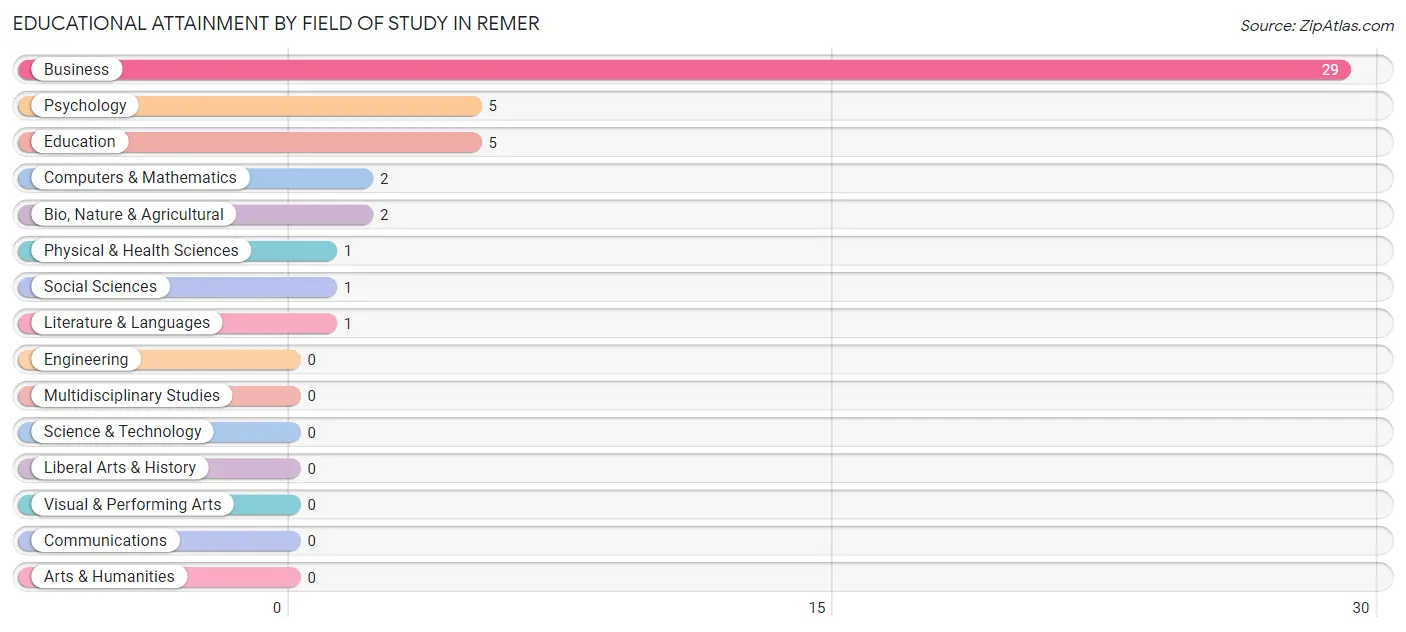
| Field of Study | # Graduates | % Graduates |
| Computers & Mathematics | 2 | 4.3% |
| Bio, Nature & Agricultural | 2 | 4.3% |
| Physical & Health Sciences | 1 | 2.2% |
| Psychology | 5 | 10.9% |
| Social Sciences | 1 | 2.2% |
| Engineering | 0 | 0.0% |
| Multidisciplinary Studies | 0 | 0.0% |
| Science & Technology | 0 | 0.0% |
| Business | 29 | 63.0% |
| Education | 5 | 10.9% |
| Literature & Languages | 1 | 2.2% |
| Liberal Arts & History | 0 | 0.0% |
| Visual & Performing Arts | 0 | 0.0% |
| Communications | 0 | 0.0% |
| Arts & Humanities | 0 | 0.0% |
| Total | 46 | 100.0% |
Transportation & Commute in Remer
Vehicle Availability by Sex in Remer
The most prevalent vehicle ownership categories in Remer are males with 2 vehicles (32, accounting for 40.0%) and females with 2 vehicles (25, making up 43.8%).
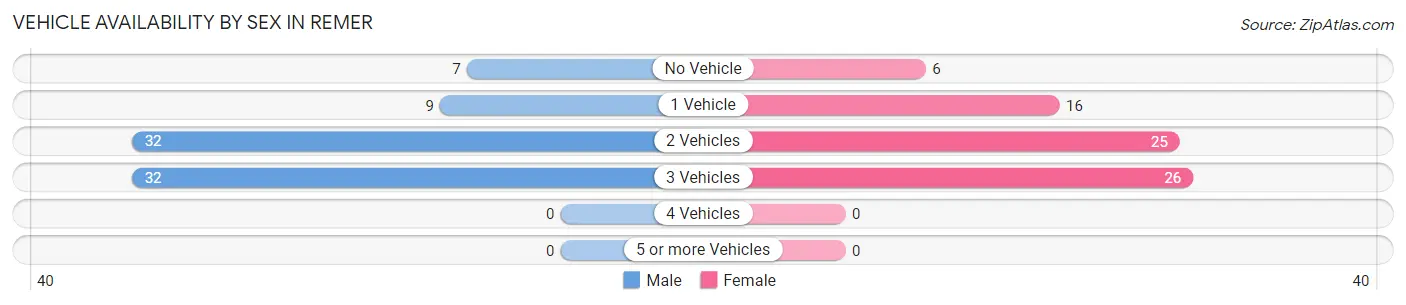
| Vehicles Available | Male | Female |
| No Vehicle | 7 (8.7%) | 6 (8.2%) |
| 1 Vehicle | 9 (11.3%) | 16 (21.9%) |
| 2 Vehicles | 32 (40.0%) | 25 (34.3%) |
| 3 Vehicles | 32 (40.0%) | 26 (35.6%) |
| 4 Vehicles | 0 (0.0%) | 0 (0.0%) |
| 5 or more Vehicles | 0 (0.0%) | 0 (0.0%) |
| Total | 80 (100.0%) | 73 (100.0%) |
Commute Time in Remer
The most frequently occuring commute durations in Remer are less than 5 minutes (43 commuters, 30.1%), 5 to 9 minutes (39 commuters, 27.3%), and 10 to 14 minutes (20 commuters, 14.0%).
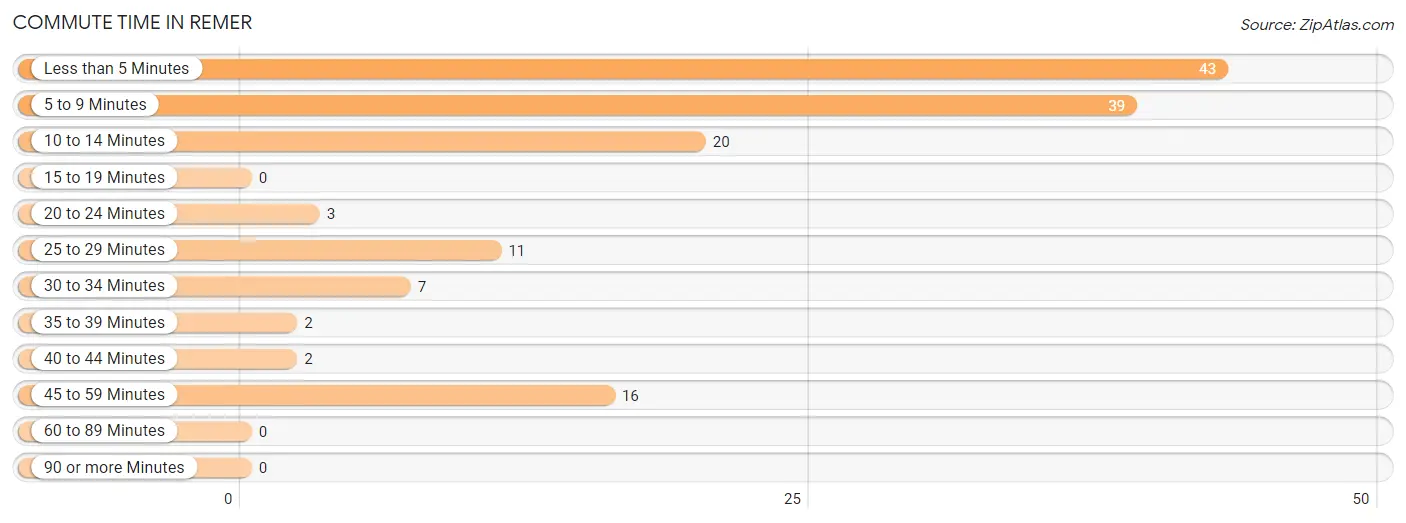
| Commute Time | # Commuters | % Commuters |
| Less than 5 Minutes | 43 | 30.1% |
| 5 to 9 Minutes | 39 | 27.3% |
| 10 to 14 Minutes | 20 | 14.0% |
| 15 to 19 Minutes | 0 | 0.0% |
| 20 to 24 Minutes | 3 | 2.1% |
| 25 to 29 Minutes | 11 | 7.7% |
| 30 to 34 Minutes | 7 | 4.9% |
| 35 to 39 Minutes | 2 | 1.4% |
| 40 to 44 Minutes | 2 | 1.4% |
| 45 to 59 Minutes | 16 | 11.2% |
| 60 to 89 Minutes | 0 | 0.0% |
| 90 or more Minutes | 0 | 0.0% |
Commute Time by Sex in Remer
The most common commute times in Remer are less than 5 minutes (24 commuters, 31.6%) for males and 5 to 9 minutes (23 commuters, 34.3%) for females.
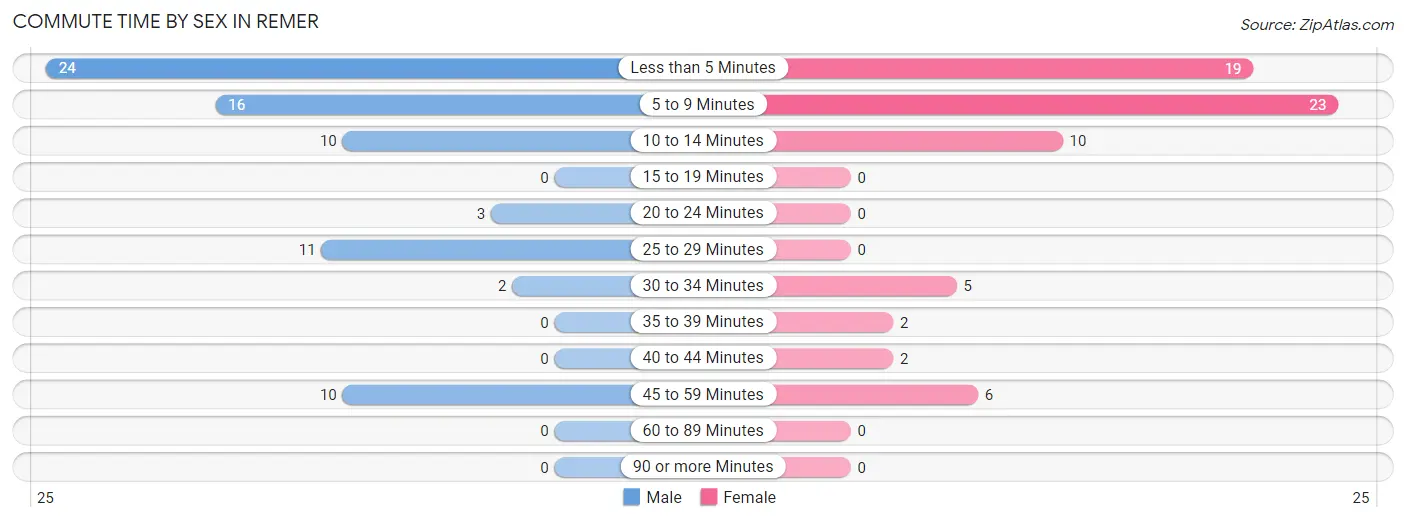
| Commute Time | Male | Female |
| Less than 5 Minutes | 24 (31.6%) | 19 (28.4%) |
| 5 to 9 Minutes | 16 (21.0%) | 23 (34.3%) |
| 10 to 14 Minutes | 10 (13.2%) | 10 (14.9%) |
| 15 to 19 Minutes | 0 (0.0%) | 0 (0.0%) |
| 20 to 24 Minutes | 3 (4.0%) | 0 (0.0%) |
| 25 to 29 Minutes | 11 (14.5%) | 0 (0.0%) |
| 30 to 34 Minutes | 2 (2.6%) | 5 (7.5%) |
| 35 to 39 Minutes | 0 (0.0%) | 2 (3.0%) |
| 40 to 44 Minutes | 0 (0.0%) | 2 (3.0%) |
| 45 to 59 Minutes | 10 (13.2%) | 6 (9.0%) |
| 60 to 89 Minutes | 0 (0.0%) | 0 (0.0%) |
| 90 or more Minutes | 0 (0.0%) | 0 (0.0%) |
Time of Departure to Work by Sex in Remer
The most frequent times of departure to work in Remer are 6:30 AM to 6:59 AM (24, 31.6%) for males and 12:00 PM to 3:59 PM (12, 17.9%) for females.
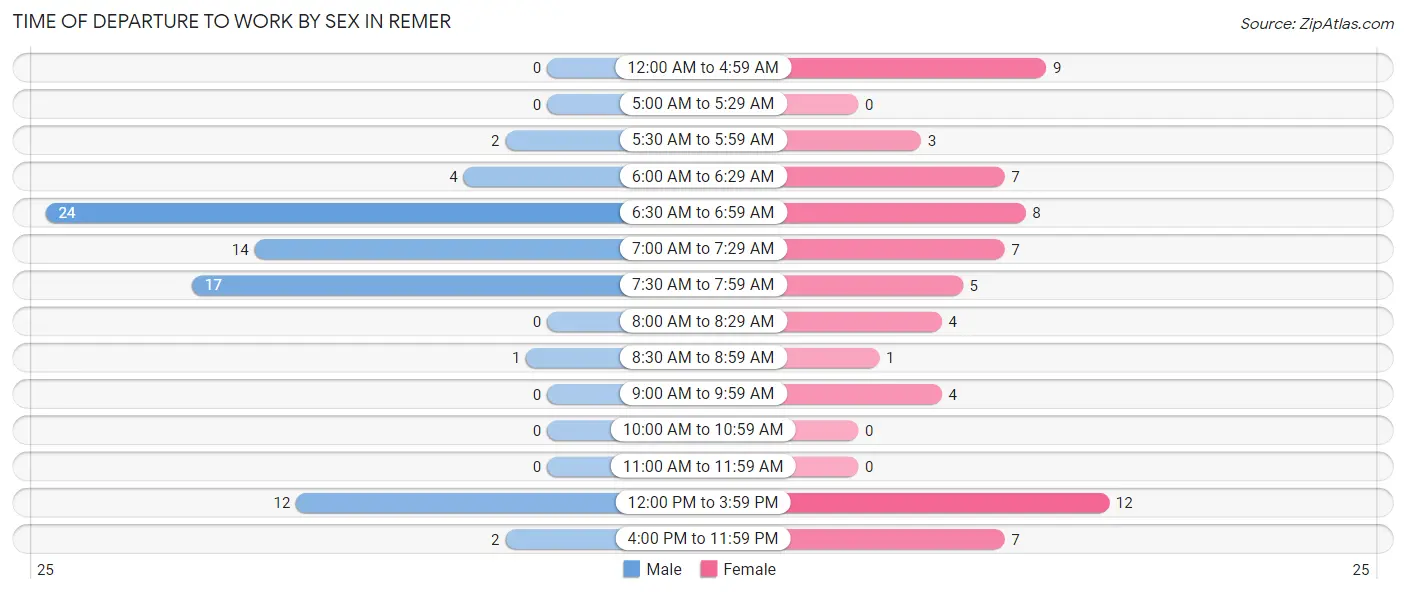
| Time of Departure | Male | Female |
| 12:00 AM to 4:59 AM | 0 (0.0%) | 9 (13.4%) |
| 5:00 AM to 5:29 AM | 0 (0.0%) | 0 (0.0%) |
| 5:30 AM to 5:59 AM | 2 (2.6%) | 3 (4.5%) |
| 6:00 AM to 6:29 AM | 4 (5.3%) | 7 (10.4%) |
| 6:30 AM to 6:59 AM | 24 (31.6%) | 8 (11.9%) |
| 7:00 AM to 7:29 AM | 14 (18.4%) | 7 (10.4%) |
| 7:30 AM to 7:59 AM | 17 (22.4%) | 5 (7.5%) |
| 8:00 AM to 8:29 AM | 0 (0.0%) | 4 (6.0%) |
| 8:30 AM to 8:59 AM | 1 (1.3%) | 1 (1.5%) |
| 9:00 AM to 9:59 AM | 0 (0.0%) | 4 (6.0%) |
| 10:00 AM to 10:59 AM | 0 (0.0%) | 0 (0.0%) |
| 11:00 AM to 11:59 AM | 0 (0.0%) | 0 (0.0%) |
| 12:00 PM to 3:59 PM | 12 (15.8%) | 12 (17.9%) |
| 4:00 PM to 11:59 PM | 2 (2.6%) | 7 (10.4%) |
| Total | 76 (100.0%) | 67 (100.0%) |
Housing Occupancy in Remer
Occupancy by Ownership in Remer
Of the total 161 dwellings in Remer, owner-occupied units account for 103 (64.0%), while renter-occupied units make up 58 (36.0%).
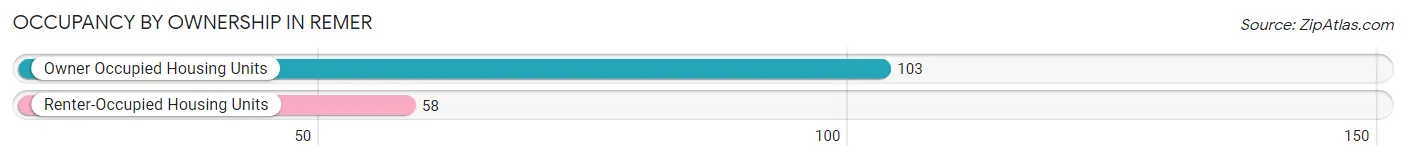
| Occupancy | # Housing Units | % Housing Units |
| Owner Occupied Housing Units | 103 | 64.0% |
| Renter-Occupied Housing Units | 58 | 36.0% |
| Total Occupied Housing Units | 161 | 100.0% |
Occupancy by Household Size in Remer
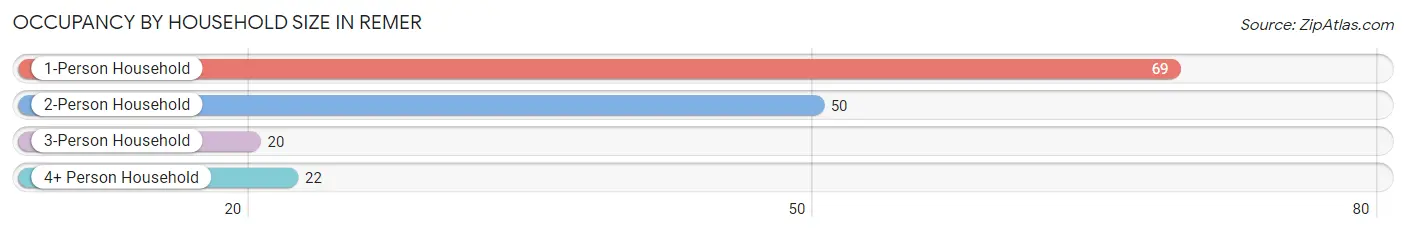
| Household Size | # Housing Units | % Housing Units |
| 1-Person Household | 69 | 42.9% |
| 2-Person Household | 50 | 31.1% |
| 3-Person Household | 20 | 12.4% |
| 4+ Person Household | 22 | 13.7% |
| Total Housing Units | 161 | 100.0% |
Occupancy by Ownership by Household Size in Remer
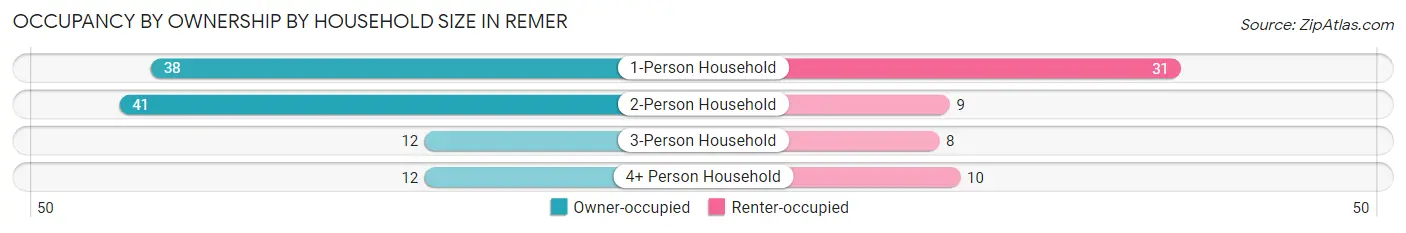
| Household Size | Owner-occupied | Renter-occupied |
| 1-Person Household | 38 (55.1%) | 31 (44.9%) |
| 2-Person Household | 41 (82.0%) | 9 (18.0%) |
| 3-Person Household | 12 (60.0%) | 8 (40.0%) |
| 4+ Person Household | 12 (54.5%) | 10 (45.5%) |
| Total Housing Units | 103 (64.0%) | 58 (36.0%) |
Occupancy by Educational Attainment in Remer
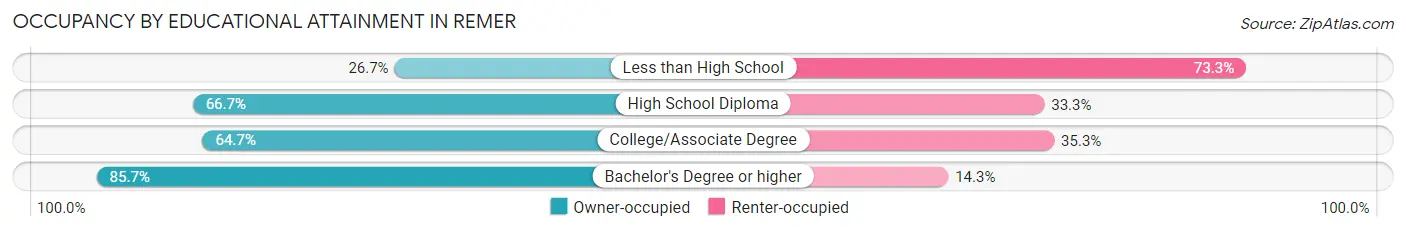
| Household Size | Owner-occupied | Renter-occupied |
| Less than High School | 4 (26.7%) | 11 (73.3%) |
| High School Diploma | 54 (66.7%) | 27 (33.3%) |
| College/Associate Degree | 33 (64.7%) | 18 (35.3%) |
| Bachelor's Degree or higher | 12 (85.7%) | 2 (14.3%) |
Occupancy by Age of Householder in Remer
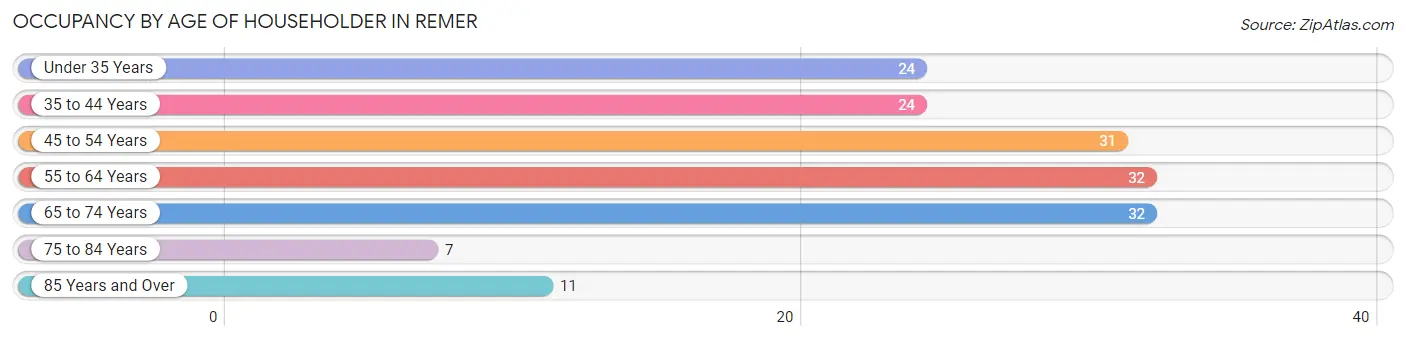
| Age Bracket | # Households | % Households |
| Under 35 Years | 24 | 14.9% |
| 35 to 44 Years | 24 | 14.9% |
| 45 to 54 Years | 31 | 19.3% |
| 55 to 64 Years | 32 | 19.9% |
| 65 to 74 Years | 32 | 19.9% |
| 75 to 84 Years | 7 | 4.3% |
| 85 Years and Over | 11 | 6.8% |
| Total | 161 | 100.0% |
Housing Finances in Remer
Median Income by Occupancy in Remer
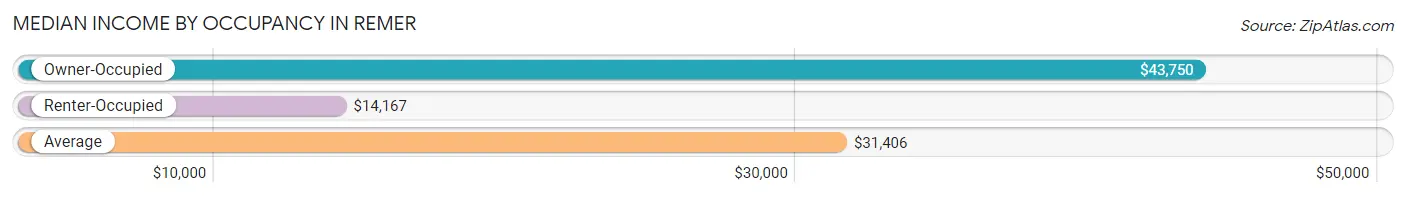
| Occupancy Type | # Households | Median Income |
| Owner-Occupied | 103 (64.0%) | $43,750 |
| Renter-Occupied | 58 (36.0%) | $14,167 |
| Average | 161 (100.0%) | $31,406 |
Occupancy by Householder Income Bracket in Remer
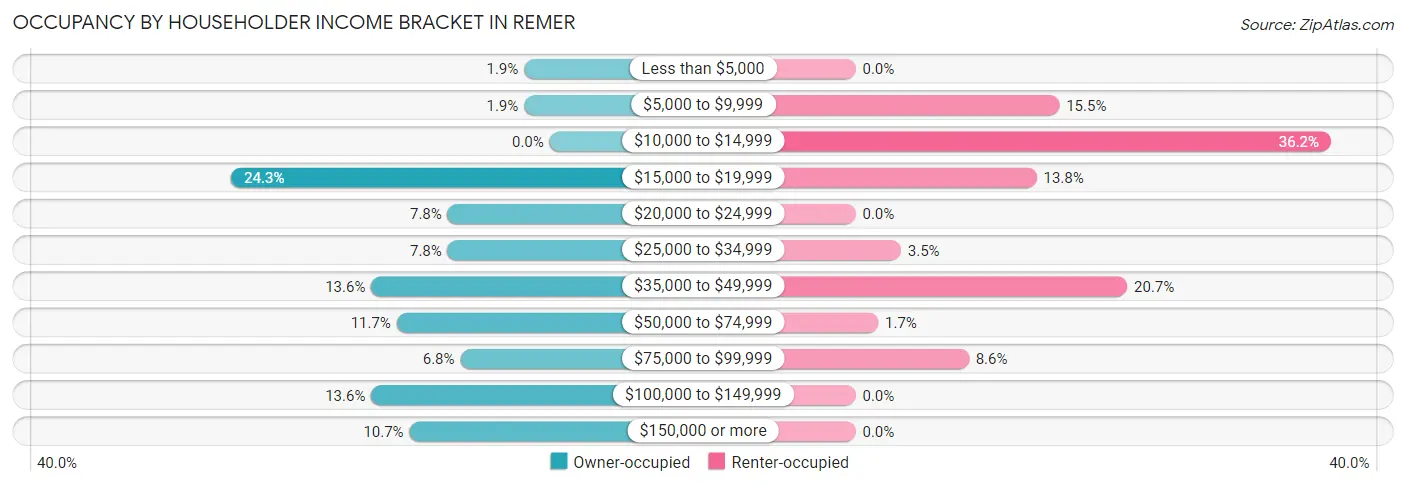
| Income Bracket | Owner-occupied | Renter-occupied |
| Less than $5,000 | 2 (1.9%) | 0 (0.0%) |
| $5,000 to $9,999 | 2 (1.9%) | 9 (15.5%) |
| $10,000 to $14,999 | 0 (0.0%) | 21 (36.2%) |
| $15,000 to $19,999 | 25 (24.3%) | 8 (13.8%) |
| $20,000 to $24,999 | 8 (7.8%) | 0 (0.0%) |
| $25,000 to $34,999 | 8 (7.8%) | 2 (3.5%) |
| $35,000 to $49,999 | 14 (13.6%) | 12 (20.7%) |
| $50,000 to $74,999 | 12 (11.7%) | 1 (1.7%) |
| $75,000 to $99,999 | 7 (6.8%) | 5 (8.6%) |
| $100,000 to $149,999 | 14 (13.6%) | 0 (0.0%) |
| $150,000 or more | 11 (10.7%) | 0 (0.0%) |
| Total | 103 (100.0%) | 58 (100.0%) |
Monthly Housing Cost Tiers in Remer
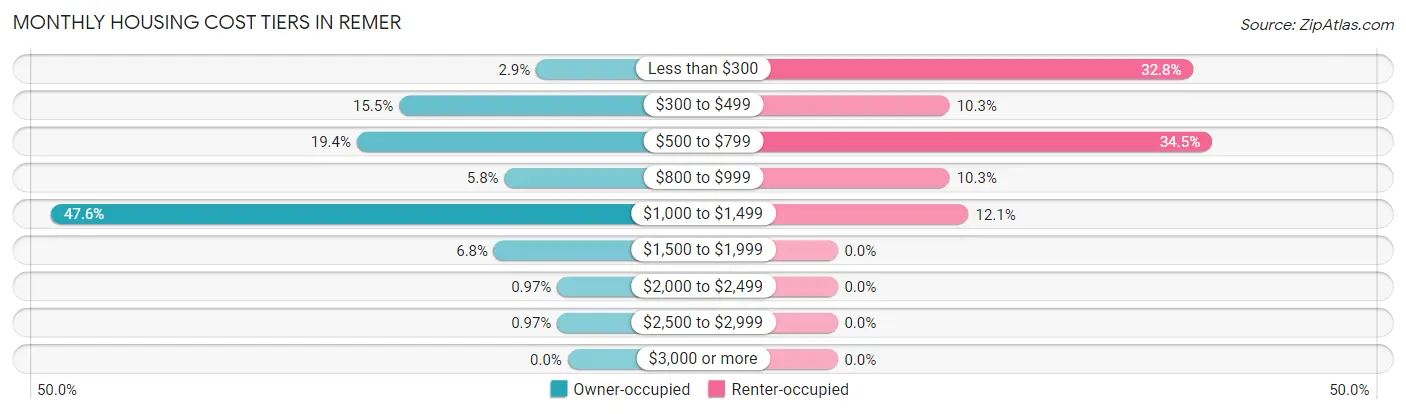
| Monthly Cost | Owner-occupied | Renter-occupied |
| Less than $300 | 3 (2.9%) | 19 (32.8%) |
| $300 to $499 | 16 (15.5%) | 6 (10.3%) |
| $500 to $799 | 20 (19.4%) | 20 (34.5%) |
| $800 to $999 | 6 (5.8%) | 6 (10.3%) |
| $1,000 to $1,499 | 49 (47.6%) | 7 (12.1%) |
| $1,500 to $1,999 | 7 (6.8%) | 0 (0.0%) |
| $2,000 to $2,499 | 1 (1.0%) | 0 (0.0%) |
| $2,500 to $2,999 | 1 (1.0%) | 0 (0.0%) |
| $3,000 or more | 0 (0.0%) | 0 (0.0%) |
| Total | 103 (100.0%) | 58 (100.0%) |
Physical Housing Characteristics in Remer
Housing Structures in Remer
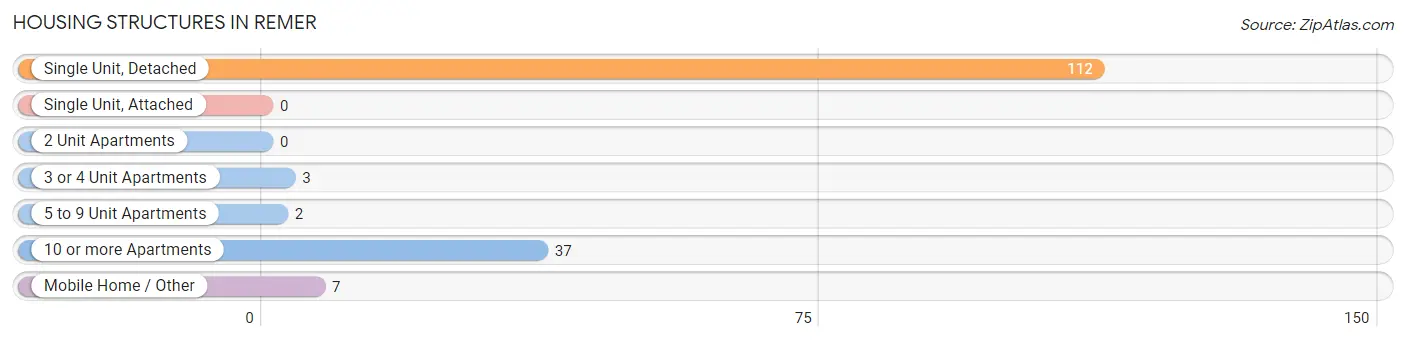
| Structure Type | # Housing Units | % Housing Units |
| Single Unit, Detached | 112 | 69.6% |
| Single Unit, Attached | 0 | 0.0% |
| 2 Unit Apartments | 0 | 0.0% |
| 3 or 4 Unit Apartments | 3 | 1.9% |
| 5 to 9 Unit Apartments | 2 | 1.2% |
| 10 or more Apartments | 37 | 23.0% |
| Mobile Home / Other | 7 | 4.3% |
| Total | 161 | 100.0% |
Housing Structures by Occupancy in Remer
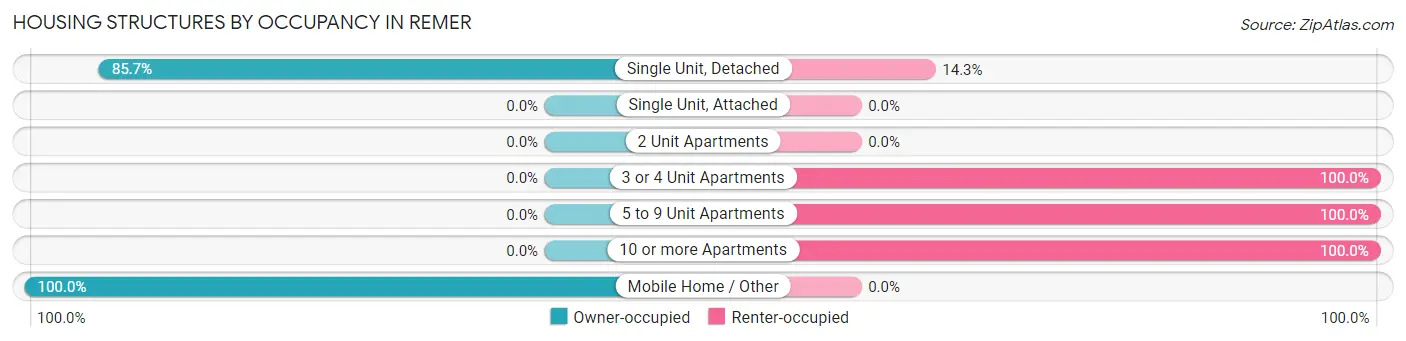
| Structure Type | Owner-occupied | Renter-occupied |
| Single Unit, Detached | 96 (85.7%) | 16 (14.3%) |
| Single Unit, Attached | 0 (0.0%) | 0 (0.0%) |
| 2 Unit Apartments | 0 (0.0%) | 0 (0.0%) |
| 3 or 4 Unit Apartments | 0 (0.0%) | 3 (100.0%) |
| 5 to 9 Unit Apartments | 0 (0.0%) | 2 (100.0%) |
| 10 or more Apartments | 0 (0.0%) | 37 (100.0%) |
| Mobile Home / Other | 7 (100.0%) | 0 (0.0%) |
| Total | 103 (64.0%) | 58 (36.0%) |
Housing Structures by Number of Rooms in Remer
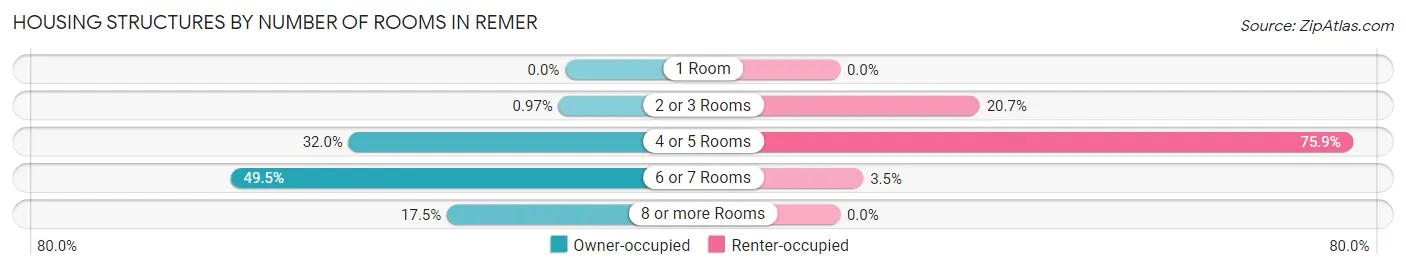
| Number of Rooms | Owner-occupied | Renter-occupied |
| 1 Room | 0 (0.0%) | 0 (0.0%) |
| 2 or 3 Rooms | 1 (1.0%) | 12 (20.7%) |
| 4 or 5 Rooms | 33 (32.0%) | 44 (75.9%) |
| 6 or 7 Rooms | 51 (49.5%) | 2 (3.5%) |
| 8 or more Rooms | 18 (17.5%) | 0 (0.0%) |
| Total | 103 (100.0%) | 58 (100.0%) |
Housing Structure by Heating Type in Remer
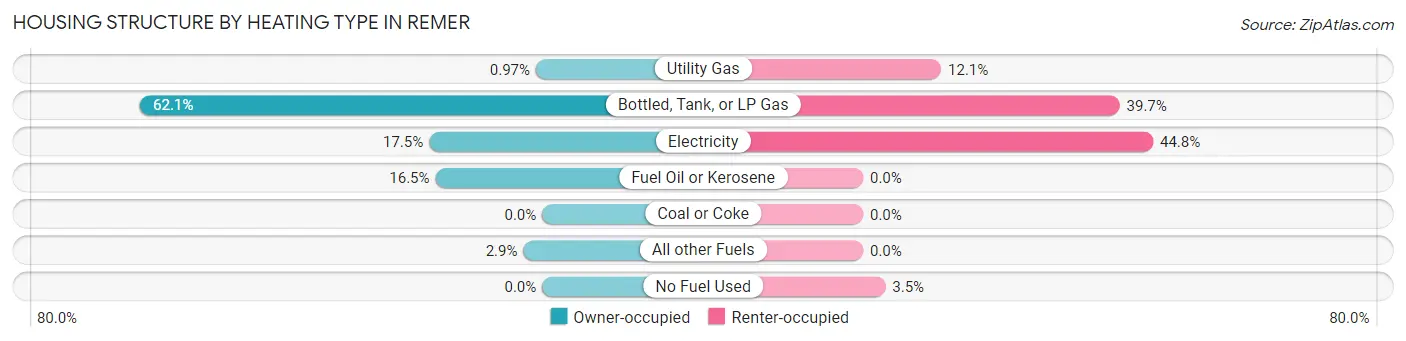
| Heating Type | Owner-occupied | Renter-occupied |
| Utility Gas | 1 (1.0%) | 7 (12.1%) |
| Bottled, Tank, or LP Gas | 64 (62.1%) | 23 (39.7%) |
| Electricity | 18 (17.5%) | 26 (44.8%) |
| Fuel Oil or Kerosene | 17 (16.5%) | 0 (0.0%) |
| Coal or Coke | 0 (0.0%) | 0 (0.0%) |
| All other Fuels | 3 (2.9%) | 0 (0.0%) |
| No Fuel Used | 0 (0.0%) | 2 (3.5%) |
| Total | 103 (100.0%) | 58 (100.0%) |
Household Vehicle Usage in Remer
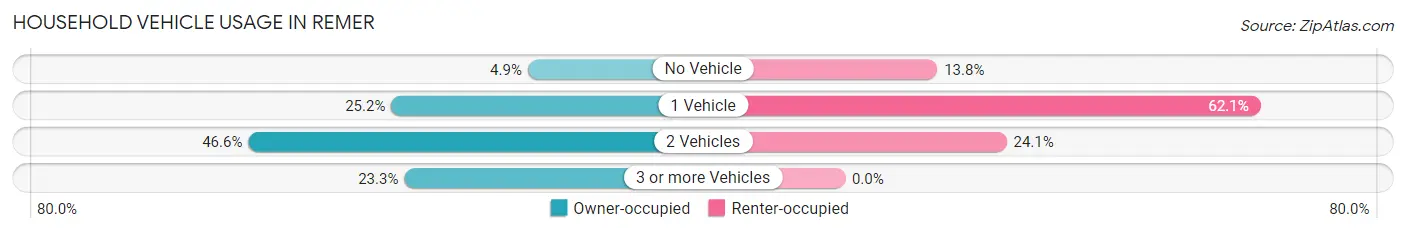
| Vehicles per Household | Owner-occupied | Renter-occupied |
| No Vehicle | 5 (4.9%) | 8 (13.8%) |
| 1 Vehicle | 26 (25.2%) | 36 (62.1%) |
| 2 Vehicles | 48 (46.6%) | 14 (24.1%) |
| 3 or more Vehicles | 24 (23.3%) | 0 (0.0%) |
| Total | 103 (100.0%) | 58 (100.0%) |
Real Estate & Mortgages in Remer
Real Estate and Mortgage Overview in Remer
| Characteristic | Without Mortgage | With Mortgage |
| Housing Units | 35 | 68 |
| Median Property Value | $86,300 | $139,300 |
| Median Household Income | $30,625 | $11 |
| Monthly Housing Costs | $485 | $0 |
| Real Estate Taxes | $764 | $10 |
Property Value by Mortgage Status in Remer
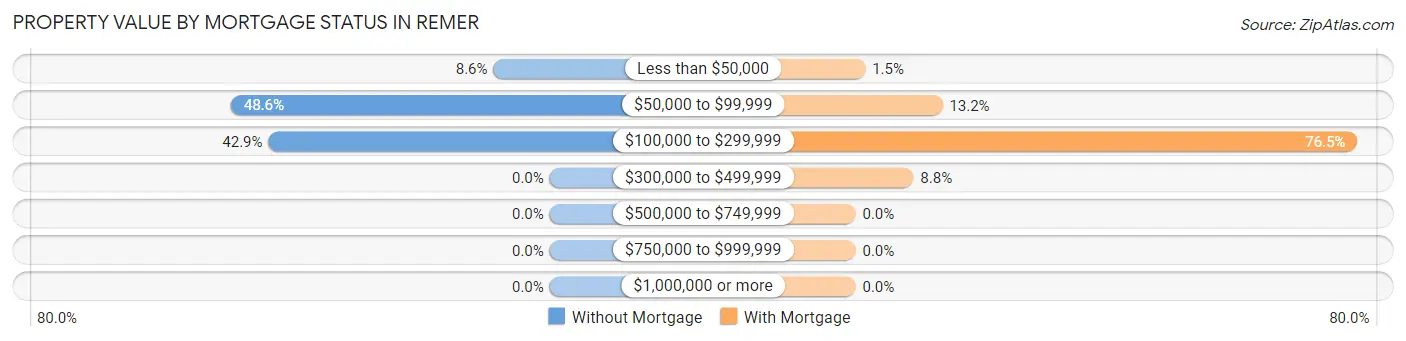
| Property Value | Without Mortgage | With Mortgage |
| Less than $50,000 | 3 (8.6%) | 1 (1.5%) |
| $50,000 to $99,999 | 17 (48.6%) | 9 (13.2%) |
| $100,000 to $299,999 | 15 (42.9%) | 52 (76.5%) |
| $300,000 to $499,999 | 0 (0.0%) | 6 (8.8%) |
| $500,000 to $749,999 | 0 (0.0%) | 0 (0.0%) |
| $750,000 to $999,999 | 0 (0.0%) | 0 (0.0%) |
| $1,000,000 or more | 0 (0.0%) | 0 (0.0%) |
| Total | 35 (100.0%) | 68 (100.0%) |
Household Income by Mortgage Status in Remer
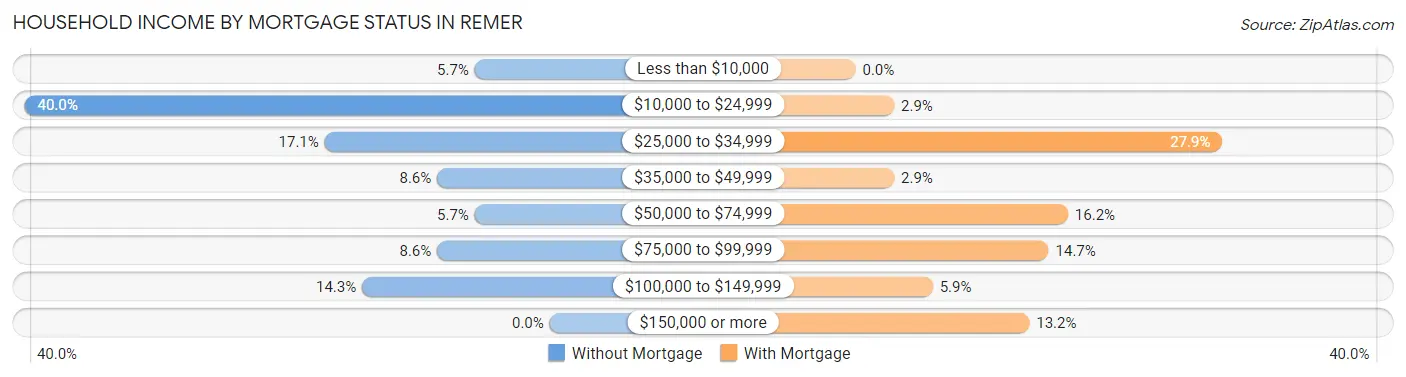
| Household Income | Without Mortgage | With Mortgage |
| Less than $10,000 | 2 (5.7%) | 0 (0.0%) |
| $10,000 to $24,999 | 14 (40.0%) | 2 (2.9%) |
| $25,000 to $34,999 | 6 (17.1%) | 19 (27.9%) |
| $35,000 to $49,999 | 3 (8.6%) | 2 (2.9%) |
| $50,000 to $74,999 | 2 (5.7%) | 11 (16.2%) |
| $75,000 to $99,999 | 3 (8.6%) | 10 (14.7%) |
| $100,000 to $149,999 | 5 (14.3%) | 4 (5.9%) |
| $150,000 or more | 0 (0.0%) | 9 (13.2%) |
| Total | 35 (100.0%) | 68 (100.0%) |
Property Value to Household Income Ratio in Remer
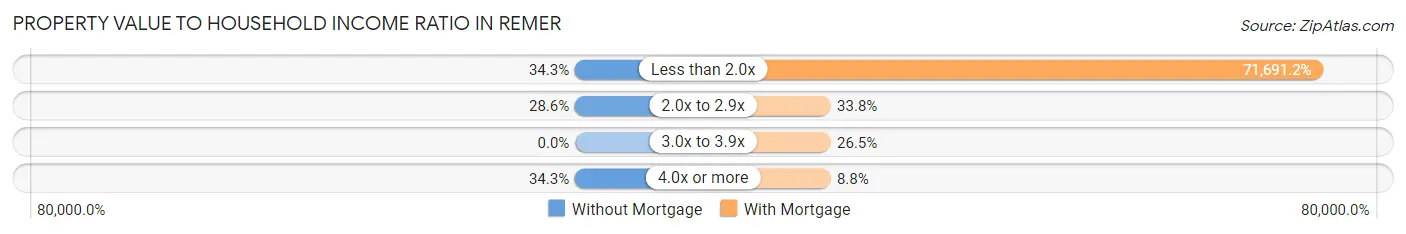
| Value-to-Income Ratio | Without Mortgage | With Mortgage |
| Less than 2.0x | 12 (34.3%) | 48,750 (71,691.2%) |
| 2.0x to 2.9x | 10 (28.6%) | 23 (33.8%) |
| 3.0x to 3.9x | 0 (0.0%) | 18 (26.5%) |
| 4.0x or more | 12 (34.3%) | 6 (8.8%) |
| Total | 35 (100.0%) | 68 (100.0%) |
Real Estate Taxes by Mortgage Status in Remer
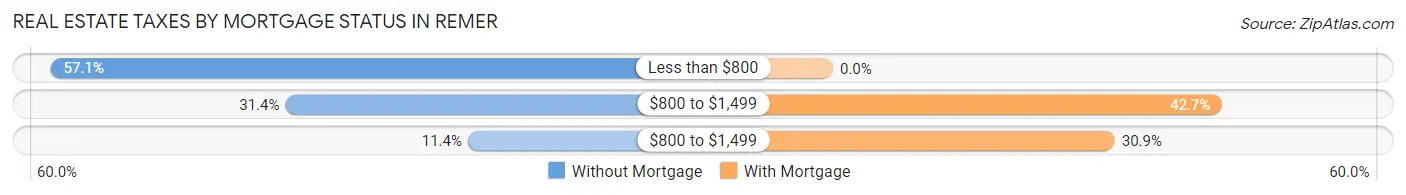
| Property Taxes | Without Mortgage | With Mortgage |
| Less than $800 | 20 (57.1%) | 0 (0.0%) |
| $800 to $1,499 | 11 (31.4%) | 29 (42.6%) |
| $800 to $1,499 | 4 (11.4%) | 21 (30.9%) |
| Total | 35 (100.0%) | 68 (100.0%) |
Health & Disability in Remer
Health Insurance Coverage by Age in Remer
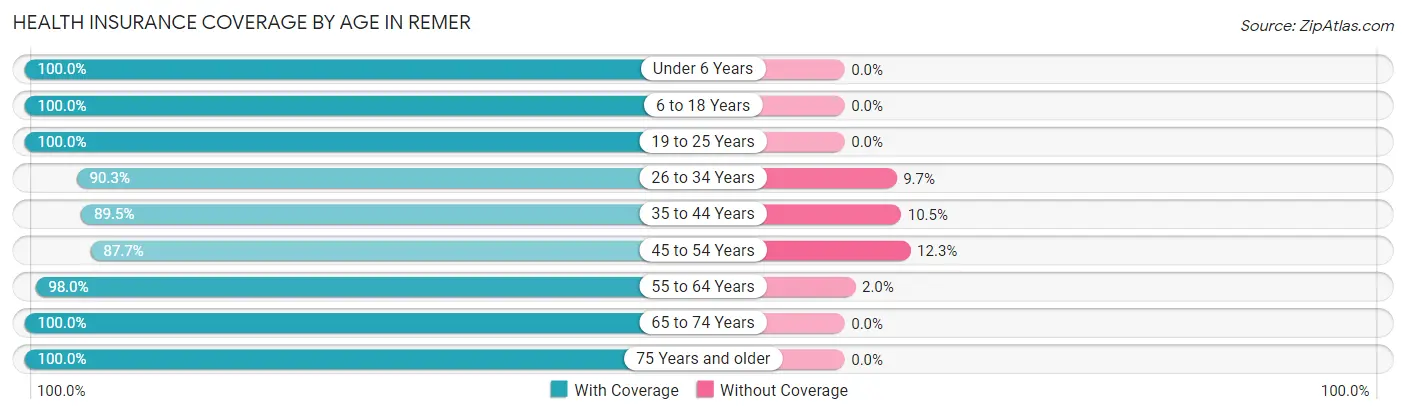
| Age Bracket | With Coverage | Without Coverage |
| Under 6 Years | 17 (100.0%) | 0 (0.0%) |
| 6 to 18 Years | 35 (100.0%) | 0 (0.0%) |
| 19 to 25 Years | 43 (100.0%) | 0 (0.0%) |
| 26 to 34 Years | 28 (90.3%) | 3 (9.7%) |
| 35 to 44 Years | 34 (89.5%) | 4 (10.5%) |
| 45 to 54 Years | 50 (87.7%) | 7 (12.3%) |
| 55 to 64 Years | 49 (98.0%) | 1 (2.0%) |
| 65 to 74 Years | 40 (100.0%) | 0 (0.0%) |
| 75 Years and older | 28 (100.0%) | 0 (0.0%) |
| Total | 324 (95.6%) | 15 (4.4%) |
Health Insurance Coverage by Citizenship Status in Remer
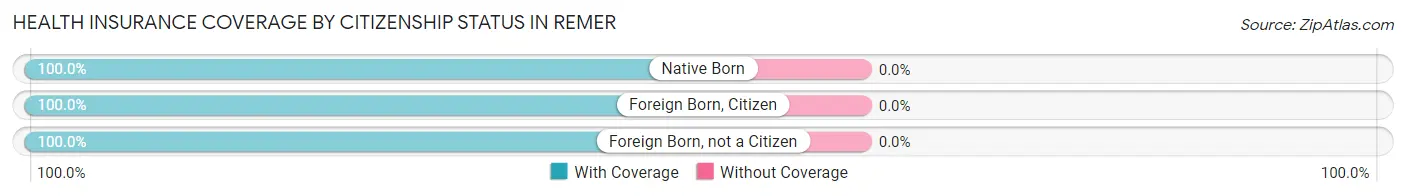
| Citizenship Status | With Coverage | Without Coverage |
| Native Born | 17 (100.0%) | 0 (0.0%) |
| Foreign Born, Citizen | 35 (100.0%) | 0 (0.0%) |
| Foreign Born, not a Citizen | 43 (100.0%) | 0 (0.0%) |
Health Insurance Coverage by Household Income in Remer
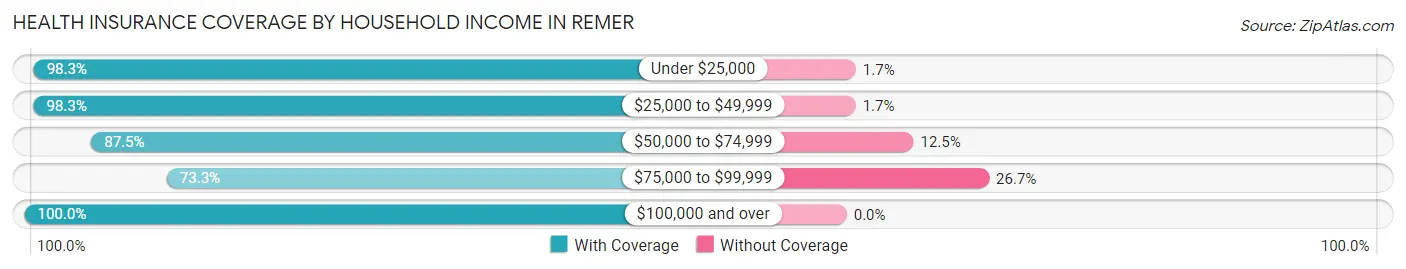
| Household Income | With Coverage | Without Coverage |
| Under $25,000 | 115 (98.3%) | 2 (1.7%) |
| $25,000 to $49,999 | 59 (98.3%) | 1 (1.7%) |
| $50,000 to $74,999 | 28 (87.5%) | 4 (12.5%) |
| $75,000 to $99,999 | 22 (73.3%) | 8 (26.7%) |
| $100,000 and over | 100 (100.0%) | 0 (0.0%) |
Public vs Private Health Insurance Coverage by Age in Remer
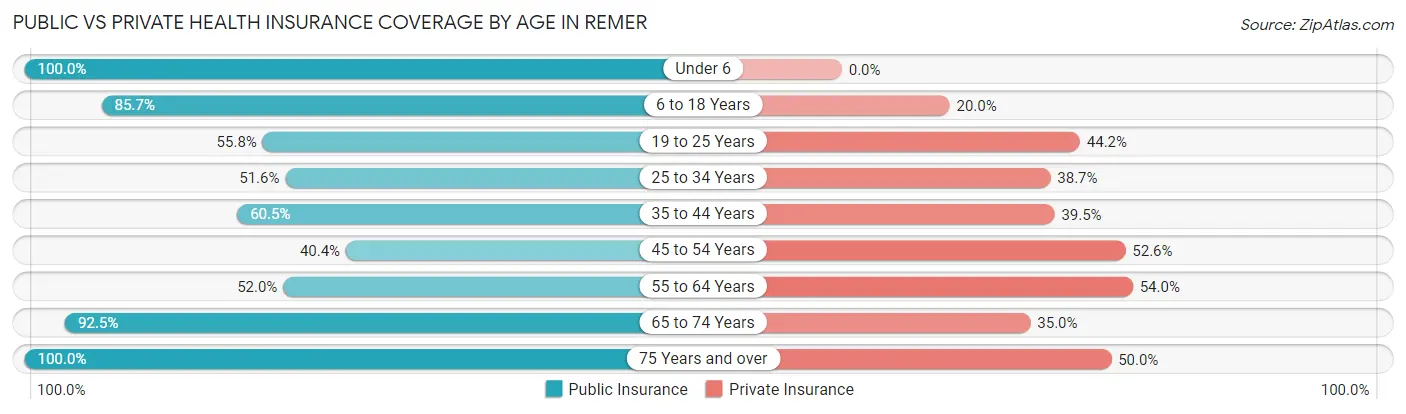
| Age Bracket | Public Insurance | Private Insurance |
| Under 6 | 17 (100.0%) | 0 (0.0%) |
| 6 to 18 Years | 30 (85.7%) | 7 (20.0%) |
| 19 to 25 Years | 24 (55.8%) | 19 (44.2%) |
| 25 to 34 Years | 16 (51.6%) | 12 (38.7%) |
| 35 to 44 Years | 23 (60.5%) | 15 (39.5%) |
| 45 to 54 Years | 23 (40.4%) | 30 (52.6%) |
| 55 to 64 Years | 26 (52.0%) | 27 (54.0%) |
| 65 to 74 Years | 37 (92.5%) | 14 (35.0%) |
| 75 Years and over | 28 (100.0%) | 14 (50.0%) |
| Total | 224 (66.1%) | 138 (40.7%) |
Disability Status by Sex by Age in Remer
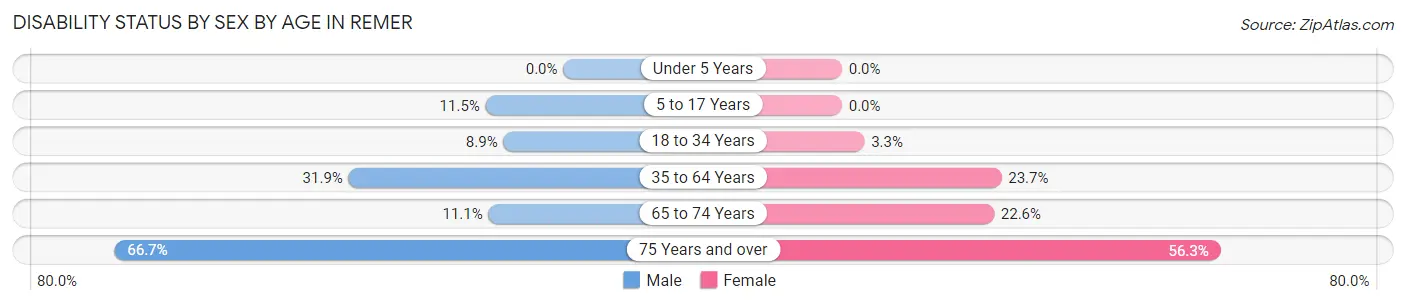
| Age Bracket | Male | Female |
| Under 5 Years | 0 (0.0%) | 0 (0.0%) |
| 5 to 17 Years | 3 (11.5%) | 0 (0.0%) |
| 18 to 34 Years | 4 (8.9%) | 1 (3.3%) |
| 35 to 64 Years | 22 (31.9%) | 18 (23.7%) |
| 65 to 74 Years | 1 (11.1%) | 7 (22.6%) |
| 75 Years and over | 8 (66.7%) | 9 (56.2%) |
Disability Class by Sex by Age in Remer
Disability Class: Hearing Difficulty
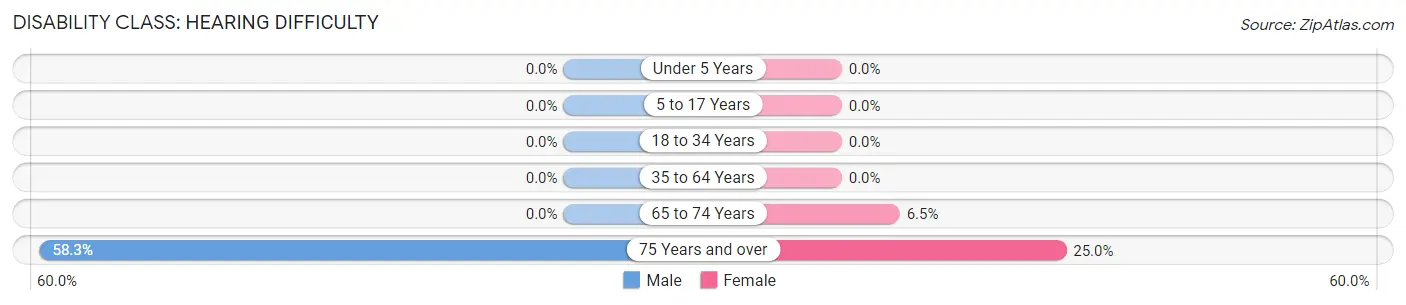
| Age Bracket | Male | Female |
| Under 5 Years | 0 (0.0%) | 0 (0.0%) |
| 5 to 17 Years | 0 (0.0%) | 0 (0.0%) |
| 18 to 34 Years | 0 (0.0%) | 0 (0.0%) |
| 35 to 64 Years | 0 (0.0%) | 0 (0.0%) |
| 65 to 74 Years | 0 (0.0%) | 2 (6.5%) |
| 75 Years and over | 7 (58.3%) | 4 (25.0%) |
Disability Class: Vision Difficulty
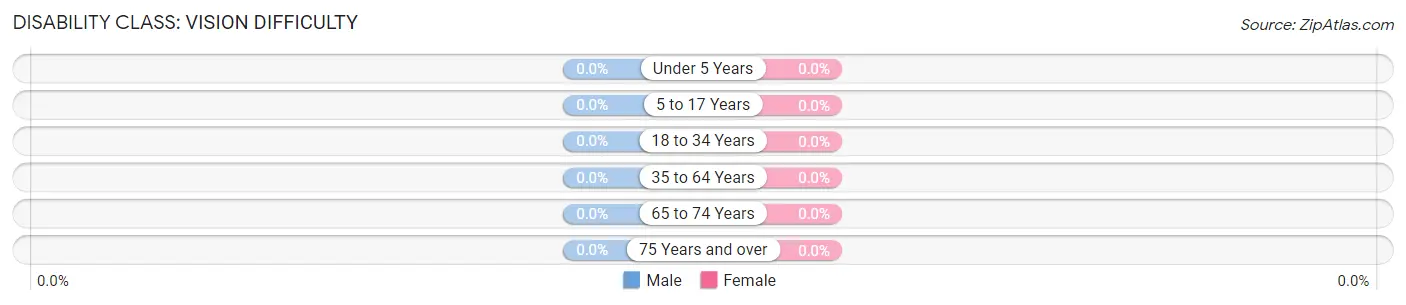
| Age Bracket | Male | Female |
| Under 5 Years | 0 (0.0%) | 0 (0.0%) |
| 5 to 17 Years | 0 (0.0%) | 0 (0.0%) |
| 18 to 34 Years | 0 (0.0%) | 0 (0.0%) |
| 35 to 64 Years | 0 (0.0%) | 0 (0.0%) |
| 65 to 74 Years | 0 (0.0%) | 0 (0.0%) |
| 75 Years and over | 0 (0.0%) | 0 (0.0%) |
Disability Class: Cognitive Difficulty
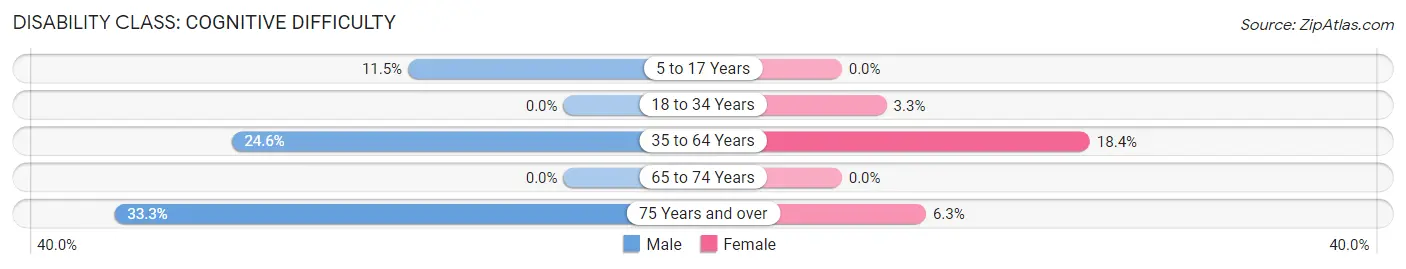
| Age Bracket | Male | Female |
| 5 to 17 Years | 3 (11.5%) | 0 (0.0%) |
| 18 to 34 Years | 0 (0.0%) | 1 (3.3%) |
| 35 to 64 Years | 17 (24.6%) | 14 (18.4%) |
| 65 to 74 Years | 0 (0.0%) | 0 (0.0%) |
| 75 Years and over | 4 (33.3%) | 1 (6.2%) |
Disability Class: Ambulatory Difficulty
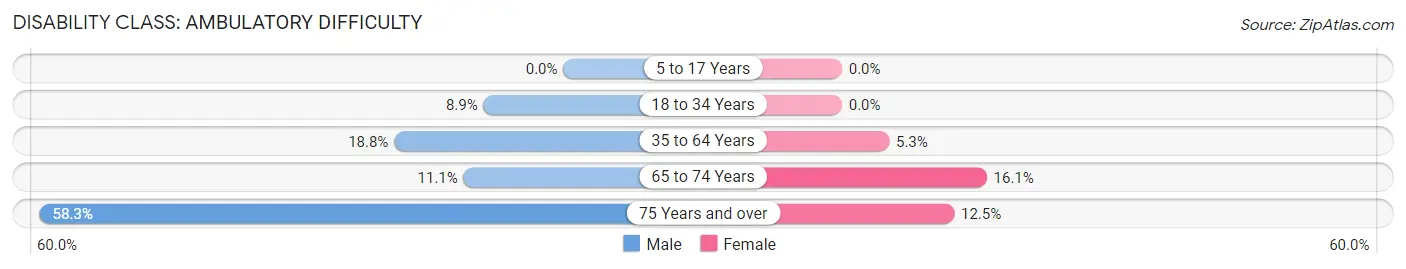
| Age Bracket | Male | Female |
| 5 to 17 Years | 0 (0.0%) | 0 (0.0%) |
| 18 to 34 Years | 4 (8.9%) | 0 (0.0%) |
| 35 to 64 Years | 13 (18.8%) | 4 (5.3%) |
| 65 to 74 Years | 1 (11.1%) | 5 (16.1%) |
| 75 Years and over | 7 (58.3%) | 2 (12.5%) |
Disability Class: Self-Care Difficulty
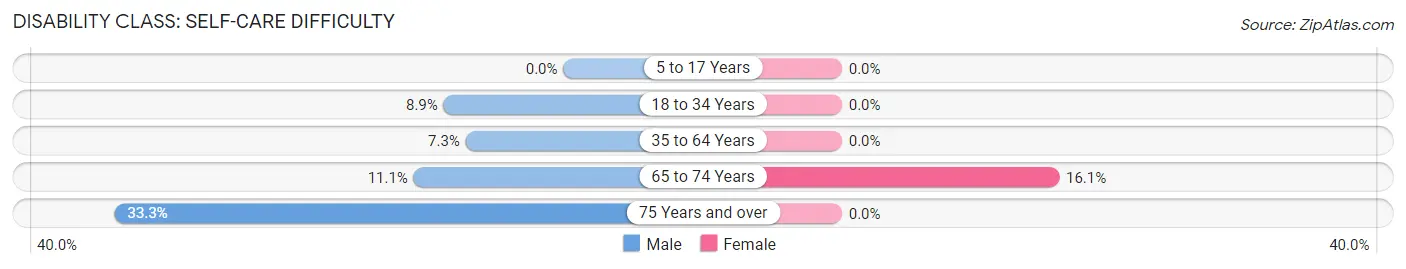
| Age Bracket | Male | Female |
| 5 to 17 Years | 0 (0.0%) | 0 (0.0%) |
| 18 to 34 Years | 4 (8.9%) | 0 (0.0%) |
| 35 to 64 Years | 5 (7.2%) | 0 (0.0%) |
| 65 to 74 Years | 1 (11.1%) | 5 (16.1%) |
| 75 Years and over | 4 (33.3%) | 0 (0.0%) |
Technology Access in Remer
Computing Device Access in Remer
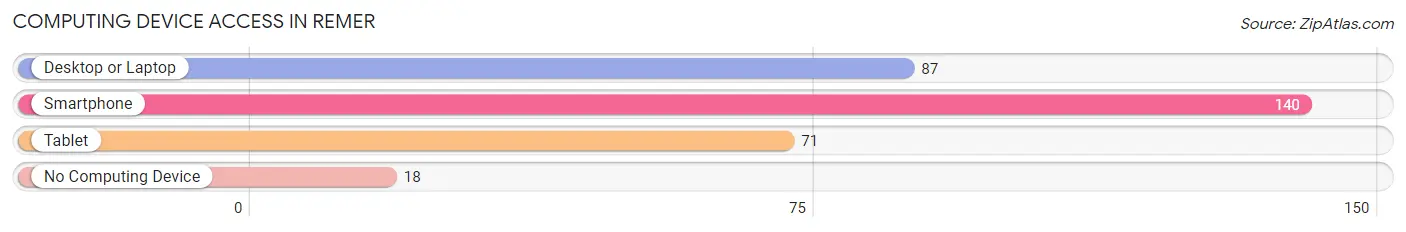
| Device Type | # Households | % Households |
| Desktop or Laptop | 87 | 54.0% |
| Smartphone | 140 | 87.0% |
| Tablet | 71 | 44.1% |
| No Computing Device | 18 | 11.2% |
| Total | 161 | 100.0% |
Internet Access in Remer
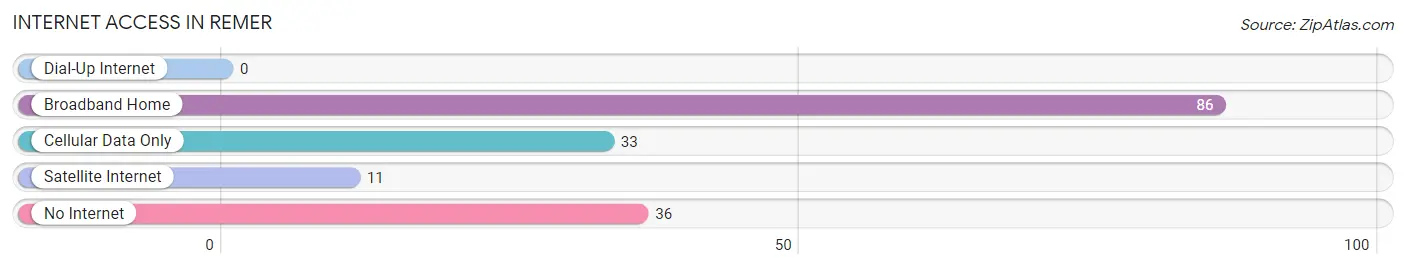
| Internet Type | # Households | % Households |
| Dial-Up Internet | 0 | 0.0% |
| Broadband Home | 86 | 53.4% |
| Cellular Data Only | 33 | 20.5% |
| Satellite Internet | 11 | 6.8% |
| No Internet | 36 | 22.4% |
| Total | 161 | 100.0% |
Remer Summary
Remer, Minnesota is a small town located in Cass County, in the north-central part of the state. It is situated on the banks of the Turtle River, and is surrounded by the Chippewa National Forest. The town was founded in 1887, and has a population of approximately 600 people.
Geography
Remer is located in the heart of Minnesota's lake country, and is surrounded by numerous lakes and rivers. The Turtle River runs through the town, and is a popular destination for fishing and canoeing. The town is also home to several small lakes, including Lake Remer, which is the largest lake in the area. The town is located in a heavily forested area, and is surrounded by the Chippewa National Forest. The town is located approximately 30 miles north of Grand Rapids, and is accessible by Highway 6.
Economy
The economy of Remer is largely based on tourism and forestry. The town is a popular destination for fishing, hunting, and camping, and is home to several resorts and campgrounds. The town is also home to several logging companies, which harvest timber from the surrounding forests. The town is also home to several small businesses, including a grocery store, a hardware store, and a restaurant.
Demographics
As of the 2010 census, the population of Remer was 590 people. The racial makeup of the town was 97.2% White, 0.2% African American, 0.2% Native American, 0.2% Asian, 0.2% from other races, and 1.9% from two or more races. The median household income was $37,500, and the median family income was $45,000. The per capita income was $18,000.
History
Remer was founded in 1887 by a group of settlers from Wisconsin. The town was named after the Turtle River, which runs through the town. The town was originally a logging town, and the surrounding forests were heavily logged in the late 19th and early 20th centuries. The town was also home to several resorts, which attracted tourists from all over the region. In the 1950s, the town began to focus more on tourism, and the logging industry began to decline. Today, the town is a popular destination for fishing, hunting, and camping, and is home to several resorts and campgrounds.
Common Questions
What is Per Capita Income in Remer?
Per Capita income in Remer is $26,873.
What is the Median Family Income in Remer?
Median Family Income in Remer is $44,583.
What is the Median Household income in Remer?
Median Household Income in Remer is $31,406.
What is Income or Wage Gap in Remer?
Income or Wage Gap in Remer is 68.3%.
Women in Remer earn 31.7 cents for every dollar earned by a man.
What is Inequality or Gini Index in Remer?
Inequality or Gini Index in Remer is 0.50.
What is the Total Population of Remer?
Total Population of Remer is 363.
What is the Total Male Population of Remer?
Total Male Population of Remer is 191.
What is the Total Female Population of Remer?
Total Female Population of Remer is 172.
What is the Ratio of Males per 100 Females in Remer?
There are 111.05 Males per 100 Females in Remer.
What is the Ratio of Females per 100 Males in Remer?
There are 90.05 Females per 100 Males in Remer.
What is the Median Population Age in Remer?
Median Population Age in Remer is 49.1 Years.
What is the Average Family Size in Remer
Average Family Size in Remer is 3.0 People.
What is the Average Household Size in Remer
Average Household Size in Remer is 2.1 People.
How Large is the Labor Force in Remer?
There are 174 People in the Labor Forcein in Remer.
What is the Percentage of People in the Labor Force in Remer?
54.2% of People are in the Labor Force in Remer.
What is the Unemployment Rate in Remer?
Unemployment Rate in Remer is 12.1%.