Red Lake Falls, MN Map & Demographics
Red Lake Falls Map
Red Lake Falls Overview
$33,521
PER CAPITA INCOME
$92,054
AVG FAMILY INCOME
$58,239
AVG HOUSEHOLD INCOME
19.7%
WAGE / INCOME GAP [ % ]
80.3¢/ $1
WAGE / INCOME GAP [ $ ]
0.39
INEQUALITY / GINI INDEX
1,288
TOTAL POPULATION
651
MALE POPULATION
637
FEMALE POPULATION
102.20
MALES / 100 FEMALES
97.85
FEMALES / 100 MALES
44.1
MEDIAN AGE
3.1
AVG FAMILY SIZE
2.2
AVG HOUSEHOLD SIZE
659
LABOR FORCE [ PEOPLE ]
67.0%
PERCENT IN LABOR FORCE
0.8%
UNEMPLOYMENT RATE
Red Lake Falls Zip Codes
Red Lake Falls Area Codes
Income in Red Lake Falls
Income Overview in Red Lake Falls
Per Capita Income in Red Lake Falls is $33,521, while median incomes of families and households are $92,054 and $58,239 respectively.
| Characteristic | Number | Measure |
| Per Capita Income | 1,288 | $33,521 |
| Median Family Income | 311 | $92,054 |
| Mean Family Income | 311 | $96,930 |
| Median Household Income | 561 | $58,239 |
| Mean Household Income | 561 | $72,615 |
| Income Deficit | 311 | $0 |
| Wage / Income Gap (%) | 1,288 | 19.66% |
| Wage / Income Gap ($) | 1,288 | 80.34¢ per $1 |
| Gini / Inequality Index | 1,288 | 0.39 |
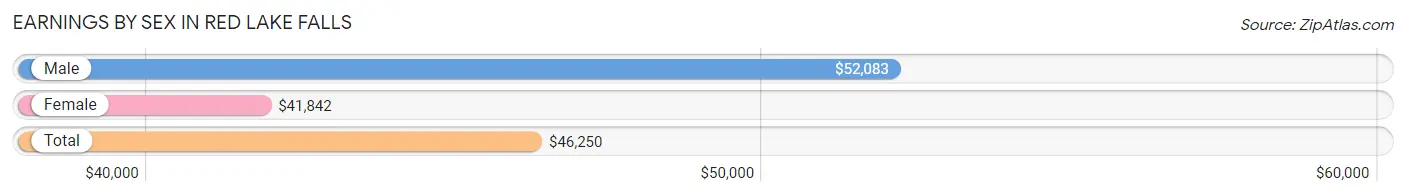
Earnings by Sex in Red Lake Falls
Average Earnings in Red Lake Falls are $46,250, $52,083 for men and $41,842 for women, a difference of 19.7%.
| Sex | Number | Average Earnings |
| Male | 322 (48.2%) | $52,083 |
| Female | 346 (51.8%) | $41,842 |
| Total | 668 (100.0%) | $46,250 |
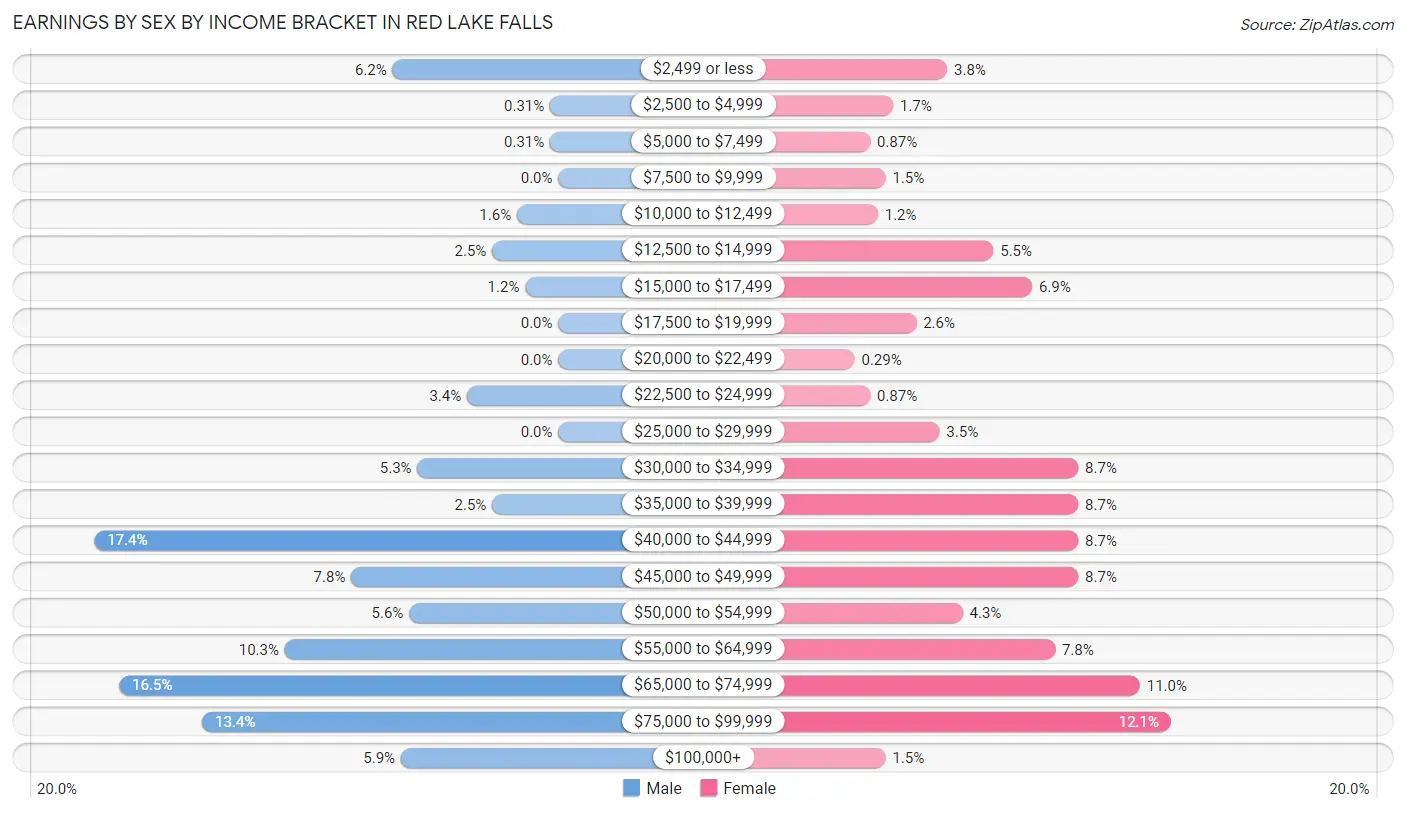
Earnings by Sex by Income Bracket in Red Lake Falls
The most common earnings brackets in Red Lake Falls are $40,000 to $44,999 for men (56 | 17.4%) and $75,000 to $99,999 for women (42 | 12.1%).
| Income | Male | Female |
| $2,499 or less | 20 (6.2%) | 13 (3.8%) |
| $2,500 to $4,999 | 1 (0.3%) | 6 (1.7%) |
| $5,000 to $7,499 | 1 (0.3%) | 3 (0.9%) |
| $7,500 to $9,999 | 0 (0.0%) | 5 (1.5%) |
| $10,000 to $12,499 | 5 (1.5%) | 4 (1.2%) |
| $12,500 to $14,999 | 8 (2.5%) | 19 (5.5%) |
| $15,000 to $17,499 | 4 (1.2%) | 24 (6.9%) |
| $17,500 to $19,999 | 0 (0.0%) | 9 (2.6%) |
| $20,000 to $22,499 | 0 (0.0%) | 1 (0.3%) |
| $22,500 to $24,999 | 11 (3.4%) | 3 (0.9%) |
| $25,000 to $29,999 | 0 (0.0%) | 12 (3.5%) |
| $30,000 to $34,999 | 17 (5.3%) | 30 (8.7%) |
| $35,000 to $39,999 | 8 (2.5%) | 30 (8.7%) |
| $40,000 to $44,999 | 56 (17.4%) | 30 (8.7%) |
| $45,000 to $49,999 | 25 (7.8%) | 30 (8.7%) |
| $50,000 to $54,999 | 18 (5.6%) | 15 (4.3%) |
| $55,000 to $64,999 | 33 (10.2%) | 27 (7.8%) |
| $65,000 to $74,999 | 53 (16.5%) | 38 (11.0%) |
| $75,000 to $99,999 | 43 (13.4%) | 42 (12.1%) |
| $100,000+ | 19 (5.9%) | 5 (1.5%) |
| Total | 322 (100.0%) | 346 (100.0%) |
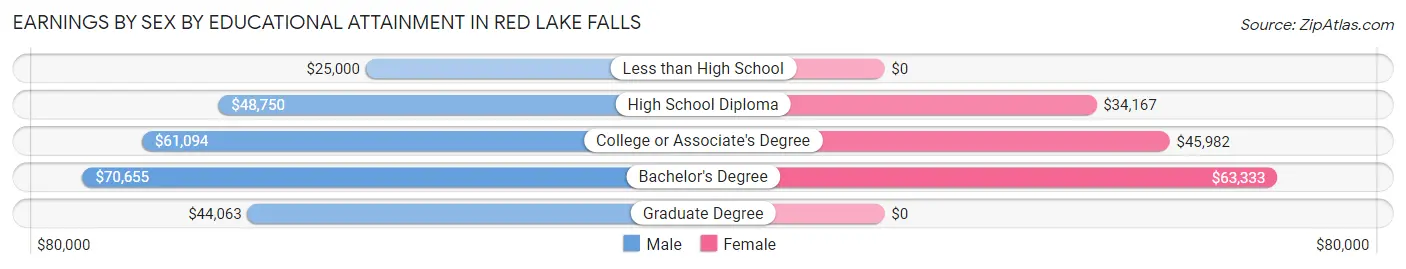
Earnings by Sex by Educational Attainment in Red Lake Falls
Average earnings in Red Lake Falls are $56,250 for men and $45,000 for women, a difference of 20.0%. Men with an educational attainment of bachelor's degree enjoy the highest average annual earnings of $70,655, while those with less than high school education earn the least with $25,000. Women with an educational attainment of bachelor's degree earn the most with the average annual earnings of $63,333, while those with high school diploma education have the smallest earnings of $34,167.
| Educational Attainment | Male Income | Female Income |
| Less than High School | $25,000 | $0 |
| High School Diploma | $48,750 | $34,167 |
| College or Associate's Degree | $61,094 | $45,982 |
| Bachelor's Degree | $70,655 | $63,333 |
| Graduate Degree | $44,063 | $0 |
| Total | $56,250 | $45,000 |
Family Income in Red Lake Falls
Family Income Brackets in Red Lake Falls
According to the Red Lake Falls family income data, there are 85 families falling into the $100,000 to $149,999 income range, which is the most common income bracket and makes up 27.3% of all families.
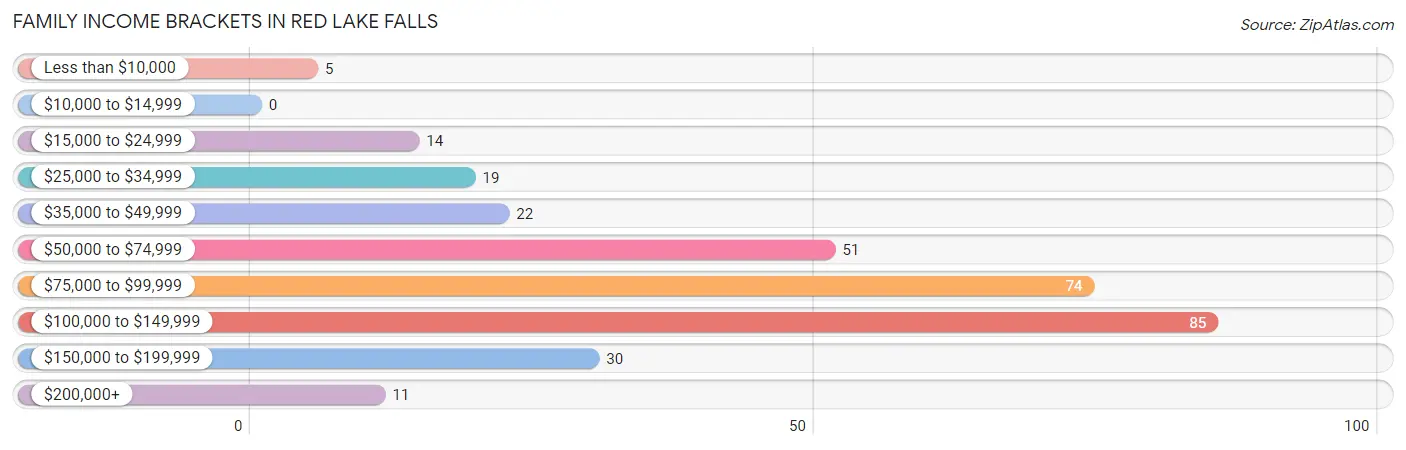
| Income Bracket | # Families | % Families |
| Less than $10,000 | 5 | 1.6% |
| $10,000 to $14,999 | 0 | 0.0% |
| $15,000 to $24,999 | 14 | 4.5% |
| $25,000 to $34,999 | 19 | 6.1% |
| $35,000 to $49,999 | 22 | 7.1% |
| $50,000 to $74,999 | 51 | 16.4% |
| $75,000 to $99,999 | 74 | 23.8% |
| $100,000 to $149,999 | 85 | 27.3% |
| $150,000 to $199,999 | 30 | 9.6% |
| $200,000+ | 11 | 3.5% |
Family Income by Famaliy Size in Red Lake Falls
4-person families (39 | 12.5%) account for the highest median family income in Red Lake Falls with $150,625 per family, while 2-person families (182 | 58.5%) have the highest median income of $42,084 per family member.
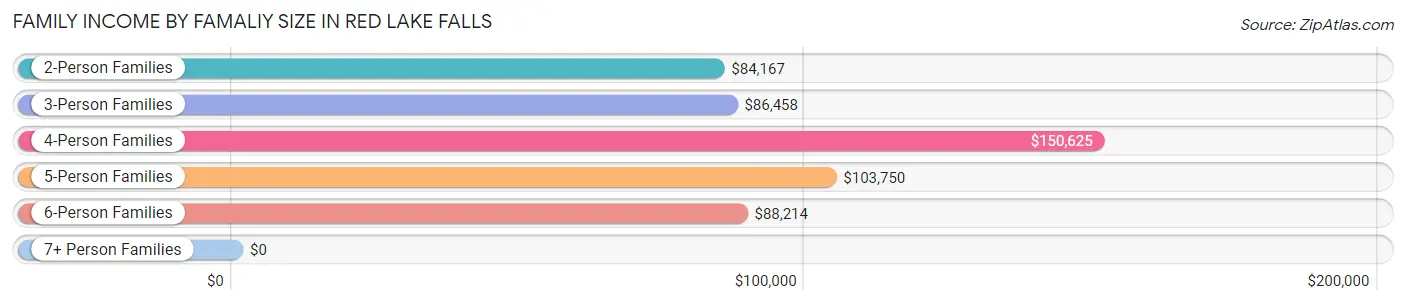
| Income Bracket | # Families | Median Income |
| 2-Person Families | 182 (58.5%) | $84,167 |
| 3-Person Families | 52 (16.7%) | $86,458 |
| 4-Person Families | 39 (12.5%) | $150,625 |
| 5-Person Families | 19 (6.1%) | $103,750 |
| 6-Person Families | 10 (3.2%) | $88,214 |
| 7+ Person Families | 9 (2.9%) | $0 |
| Total | 311 (100.0%) | $92,054 |
Family Income by Number of Earners in Red Lake Falls
The median family income in Red Lake Falls is $92,054, with families comprising 3+ earners (19) having the highest median family income of $250,001, while families with no earners (32) have the lowest median family income of $57,500, accounting for 6.1% and 10.3% of families, respectively.
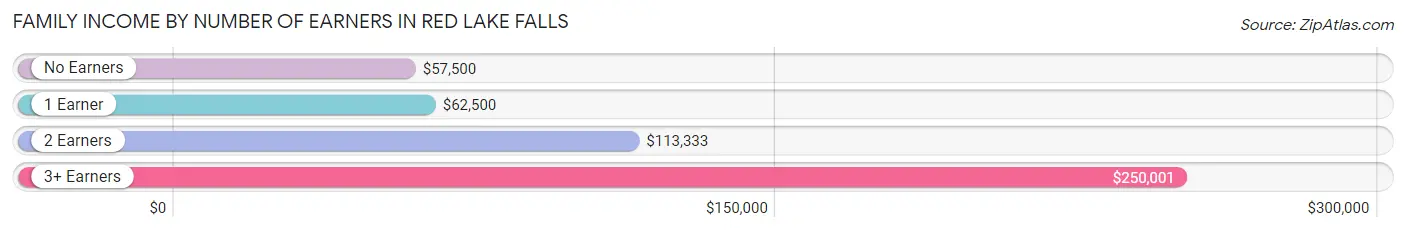
| Number of Earners | # Families | Median Income |
| No Earners | 32 (10.3%) | $57,500 |
| 1 Earner | 100 (32.2%) | $62,500 |
| 2 Earners | 160 (51.4%) | $113,333 |
| 3+ Earners | 19 (6.1%) | $250,001 |
| Total | 311 (100.0%) | $92,054 |
Household Income in Red Lake Falls
Household Income Brackets in Red Lake Falls
With 105 households falling in the category, the $100,000 to $149,999 income range is the most frequent in Red Lake Falls, accounting for 18.7% of all households. In contrast, only 11 households (2.0%) fall into the less than $10,000 income bracket, making it the least populous group.
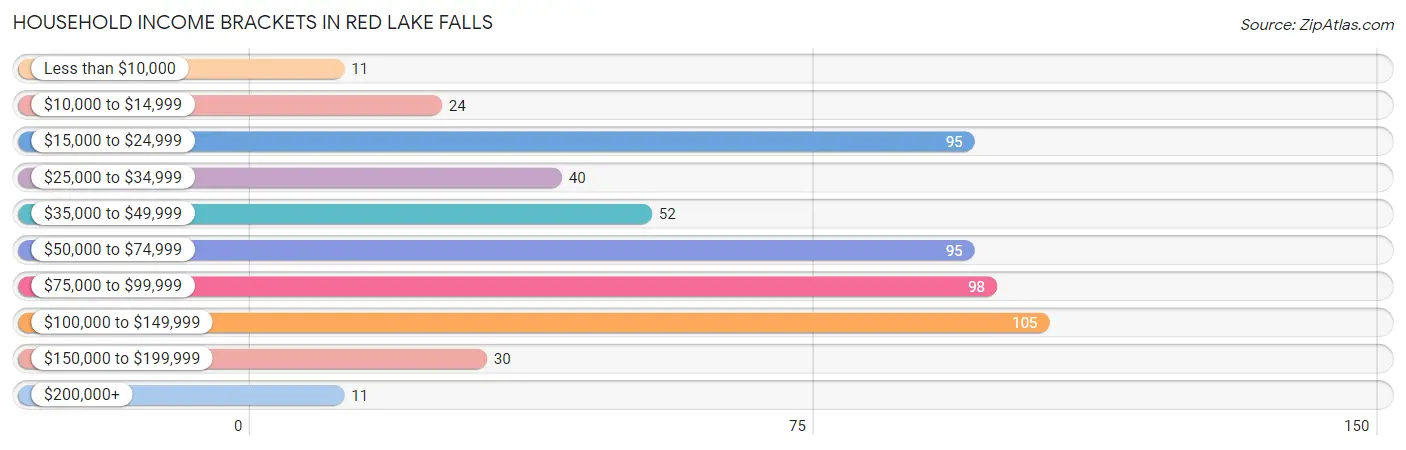
| Income Bracket | # Households | % Households |
| Less than $10,000 | 11 | 2.0% |
| $10,000 to $14,999 | 24 | 4.3% |
| $15,000 to $24,999 | 95 | 16.9% |
| $25,000 to $34,999 | 40 | 7.1% |
| $35,000 to $49,999 | 52 | 9.3% |
| $50,000 to $74,999 | 95 | 16.9% |
| $75,000 to $99,999 | 98 | 17.5% |
| $100,000 to $149,999 | 105 | 18.7% |
| $150,000 to $199,999 | 30 | 5.3% |
| $200,000+ | 11 | 2.0% |
Household Income by Householder Age in Red Lake Falls
The median household income in Red Lake Falls is $58,239, with the highest median household income of $94,167 found in the 25 to 44 years age bracket for the primary householder. A total of 136 households (24.2%) fall into this category. Meanwhile, the 15 to 24 years age bracket for the primary householder has the lowest median household income of $0, with 23 households (4.1%) in this group.
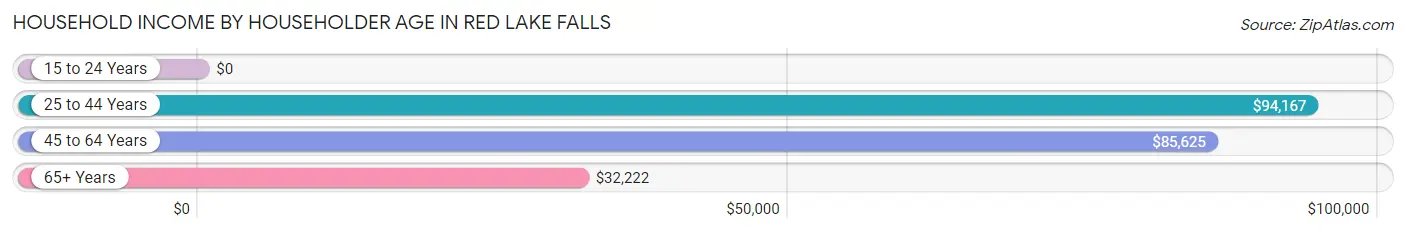
| Income Bracket | # Households | Median Income |
| 15 to 24 Years | 23 (4.1%) | $0 |
| 25 to 44 Years | 136 (24.2%) | $94,167 |
| 45 to 64 Years | 200 (35.6%) | $85,625 |
| 65+ Years | 202 (36.0%) | $32,222 |
| Total | 561 (100.0%) | $58,239 |
Poverty in Red Lake Falls
Income Below Poverty by Sex and Age in Red Lake Falls
With 11.8% poverty level for males and 8.6% for females among the residents of Red Lake Falls, 16 and 17 year old males and under 5 year old females are the most vulnerable to poverty, with 8 males (57.1%) and 12 females (29.3%) in their respective age groups living below the poverty level.
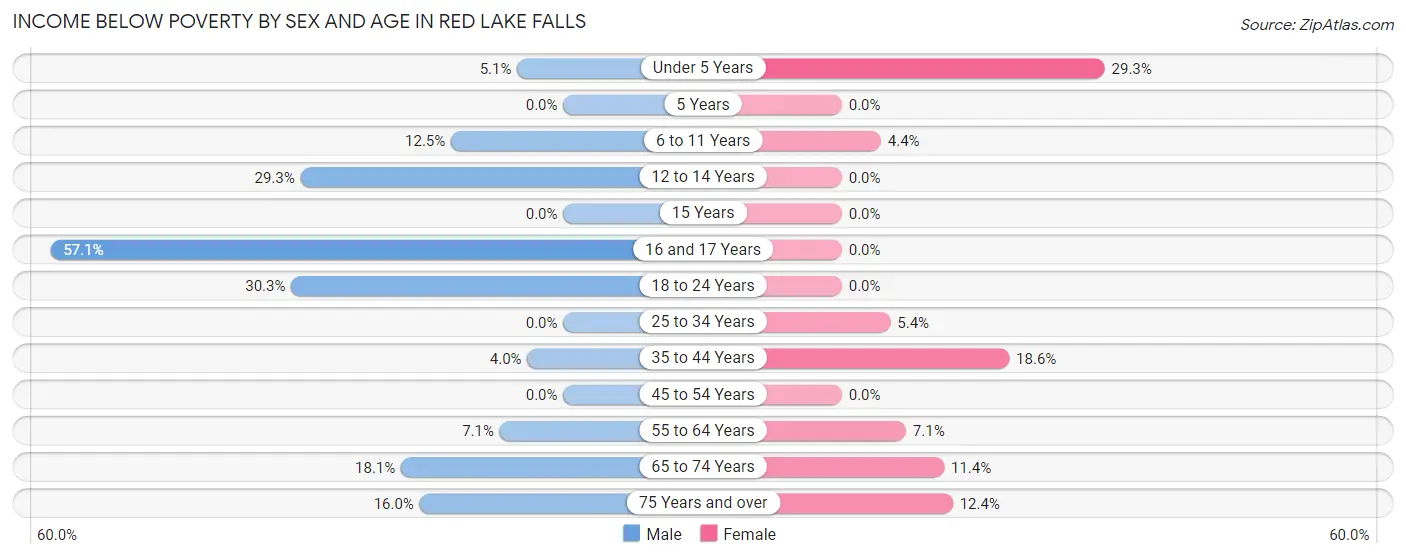
| Age Bracket | Male | Female |
| Under 5 Years | 2 (5.1%) | 12 (29.3%) |
| 5 Years | 0 (0.0%) | 0 (0.0%) |
| 6 to 11 Years | 10 (12.5%) | 2 (4.3%) |
| 12 to 14 Years | 12 (29.3%) | 0 (0.0%) |
| 15 Years | 0 (0.0%) | 0 (0.0%) |
| 16 and 17 Years | 8 (57.1%) | 0 (0.0%) |
| 18 to 24 Years | 10 (30.3%) | 0 (0.0%) |
| 25 to 34 Years | 0 (0.0%) | 4 (5.4%) |
| 35 to 44 Years | 3 (4.0%) | 11 (18.6%) |
| 45 to 54 Years | 0 (0.0%) | 0 (0.0%) |
| 55 to 64 Years | 8 (7.1%) | 7 (7.1%) |
| 65 to 74 Years | 15 (18.1%) | 9 (11.4%) |
| 75 Years and over | 8 (16.0%) | 10 (12.3%) |
| Total | 76 (11.8%) | 55 (8.6%) |
Income Above Poverty by Sex and Age in Red Lake Falls
According to the poverty statistics in Red Lake Falls, males aged 5 years and females aged 5 years are the age groups that are most secure financially, with 100.0% of males and 100.0% of females in these age groups living above the poverty line.
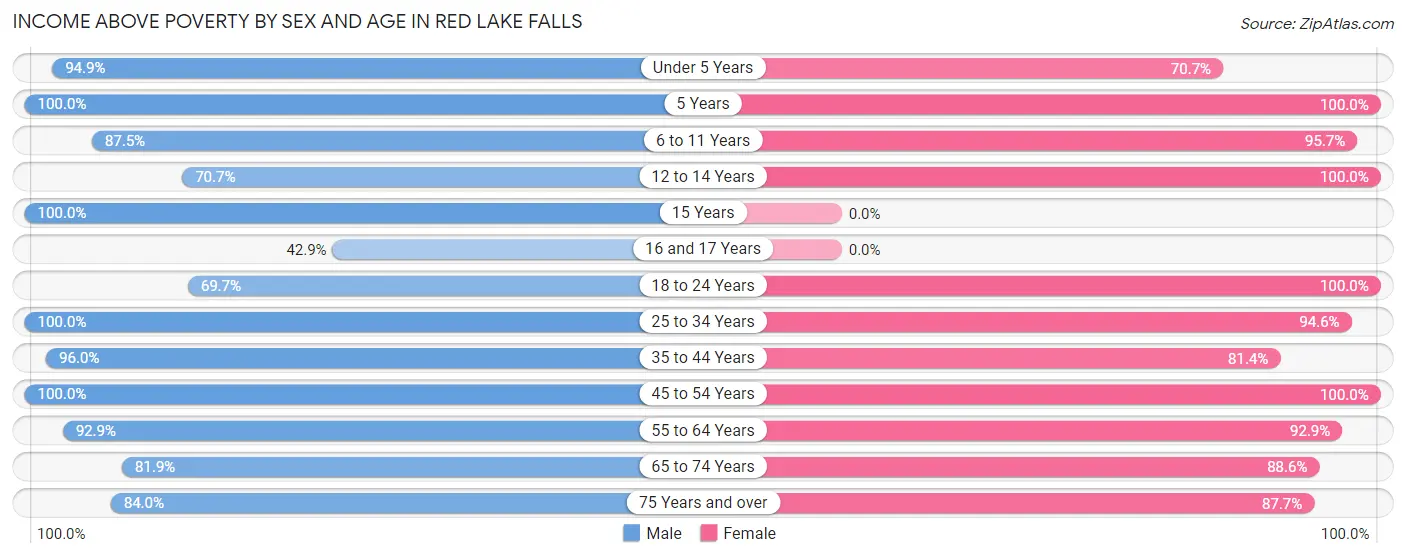
| Age Bracket | Male | Female |
| Under 5 Years | 37 (94.9%) | 29 (70.7%) |
| 5 Years | 5 (100.0%) | 9 (100.0%) |
| 6 to 11 Years | 70 (87.5%) | 44 (95.7%) |
| 12 to 14 Years | 29 (70.7%) | 31 (100.0%) |
| 15 Years | 13 (100.0%) | 0 (0.0%) |
| 16 and 17 Years | 6 (42.9%) | 0 (0.0%) |
| 18 to 24 Years | 23 (69.7%) | 37 (100.0%) |
| 25 to 34 Years | 54 (100.0%) | 70 (94.6%) |
| 35 to 44 Years | 72 (96.0%) | 48 (81.4%) |
| 45 to 54 Years | 45 (100.0%) | 82 (100.0%) |
| 55 to 64 Years | 105 (92.9%) | 91 (92.9%) |
| 65 to 74 Years | 68 (81.9%) | 70 (88.6%) |
| 75 Years and over | 42 (84.0%) | 71 (87.6%) |
| Total | 569 (88.2%) | 582 (91.4%) |
Income Below Poverty Among Married-Couple Families in Red Lake Falls
The poverty statistics for married-couple families in Red Lake Falls show that 1.6% or 4 of the total 249 families live below the poverty line. Families with no children have the highest poverty rate of 2.3%, comprising of 4 families. On the other hand, families with 1 or 2 children have the lowest poverty rate of 0.0%, which includes 0 families.
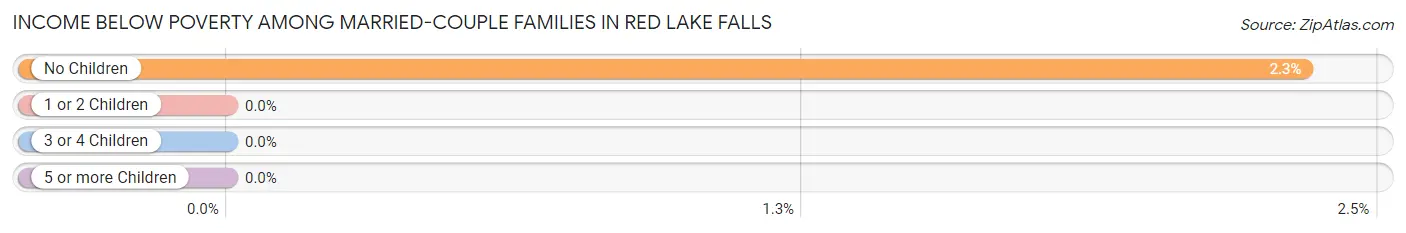
| Children | Above Poverty | Below Poverty |
| No Children | 167 (97.7%) | 4 (2.3%) |
| 1 or 2 Children | 51 (100.0%) | 0 (0.0%) |
| 3 or 4 Children | 21 (100.0%) | 0 (0.0%) |
| 5 or more Children | 6 (100.0%) | 0 (0.0%) |
| Total | 245 (98.4%) | 4 (1.6%) |
Income Below Poverty Among Single-Parent Households in Red Lake Falls
According to the poverty data in Red Lake Falls, 20.0% or 3 single-father households and 21.3% or 10 single-mother households are living below the poverty line. Among single-father households, those with 5 or more children have the highest poverty rate, with 3 households (100.0%) experiencing poverty. Likewise, among single-mother households, those with 1 or 2 children have the highest poverty rate, with 10 households (31.2%) falling below the poverty line.
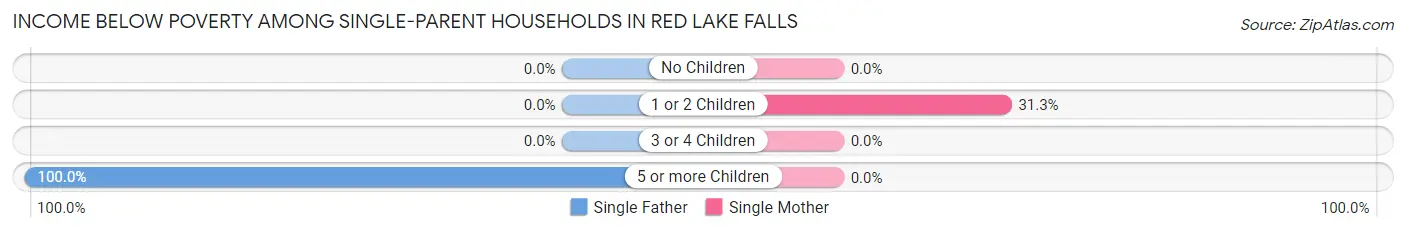
| Children | Single Father | Single Mother |
| No Children | 0 (0.0%) | 0 (0.0%) |
| 1 or 2 Children | 0 (0.0%) | 10 (31.2%) |
| 3 or 4 Children | 0 (0.0%) | 0 (0.0%) |
| 5 or more Children | 3 (100.0%) | 0 (0.0%) |
| Total | 3 (20.0%) | 10 (21.3%) |
Income Below Poverty Among Married-Couple vs Single-Parent Households in Red Lake Falls
The poverty data for Red Lake Falls shows that 4 of the married-couple family households (1.6%) and 13 of the single-parent households (21.0%) are living below the poverty level. Within the married-couple family households, those with no children have the highest poverty rate, with 4 households (2.3%) falling below the poverty line. Among the single-parent households, those with 5 or more children have the highest poverty rate, with 3 household (50.0%) living below poverty.
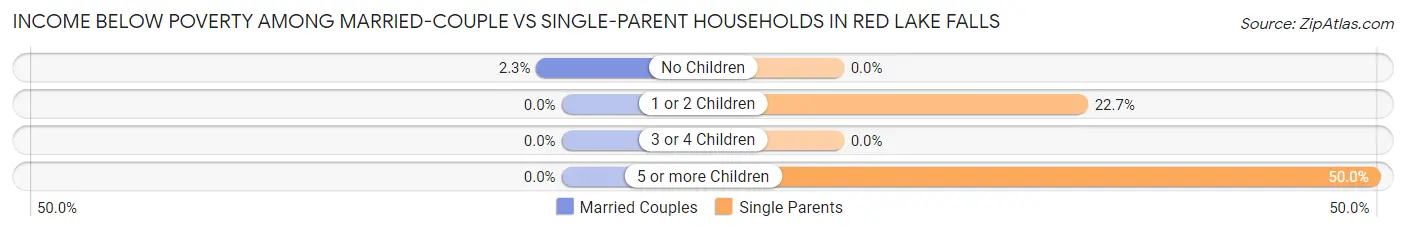
| Children | Married-Couple Families | Single-Parent Households |
| No Children | 4 (2.3%) | 0 (0.0%) |
| 1 or 2 Children | 0 (0.0%) | 10 (22.7%) |
| 3 or 4 Children | 0 (0.0%) | 0 (0.0%) |
| 5 or more Children | 0 (0.0%) | 3 (50.0%) |
| Total | 4 (1.6%) | 13 (21.0%) |
Race in Red Lake Falls
The most populous races in Red Lake Falls are White / Caucasian (1,173 | 91.1%), Hispanic or Latino (69 | 5.4%), and Two or more Races (69 | 5.4%).
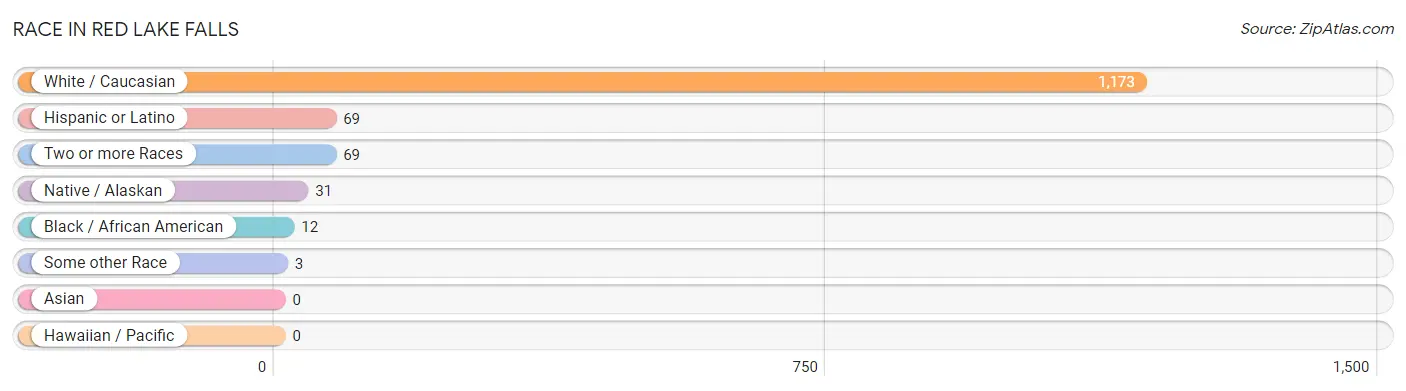
| Race | # Population | % Population |
| Asian | 0 | 0.0% |
| Black / African American | 12 | 0.9% |
| Hawaiian / Pacific | 0 | 0.0% |
| Hispanic or Latino | 69 | 5.4% |
| Native / Alaskan | 31 | 2.4% |
| White / Caucasian | 1,173 | 91.1% |
| Two or more Races | 69 | 5.4% |
| Some other Race | 3 | 0.2% |
| Total | 1,288 | 100.0% |
Ancestry in Red Lake Falls
The most populous ancestries reported in Red Lake Falls are German (448 | 34.8%), French (194 | 15.1%), Norwegian (193 | 15.0%), Irish (106 | 8.2%), and Mexican (65 | 5.1%), together accounting for 78.1% of all Red Lake Falls residents.
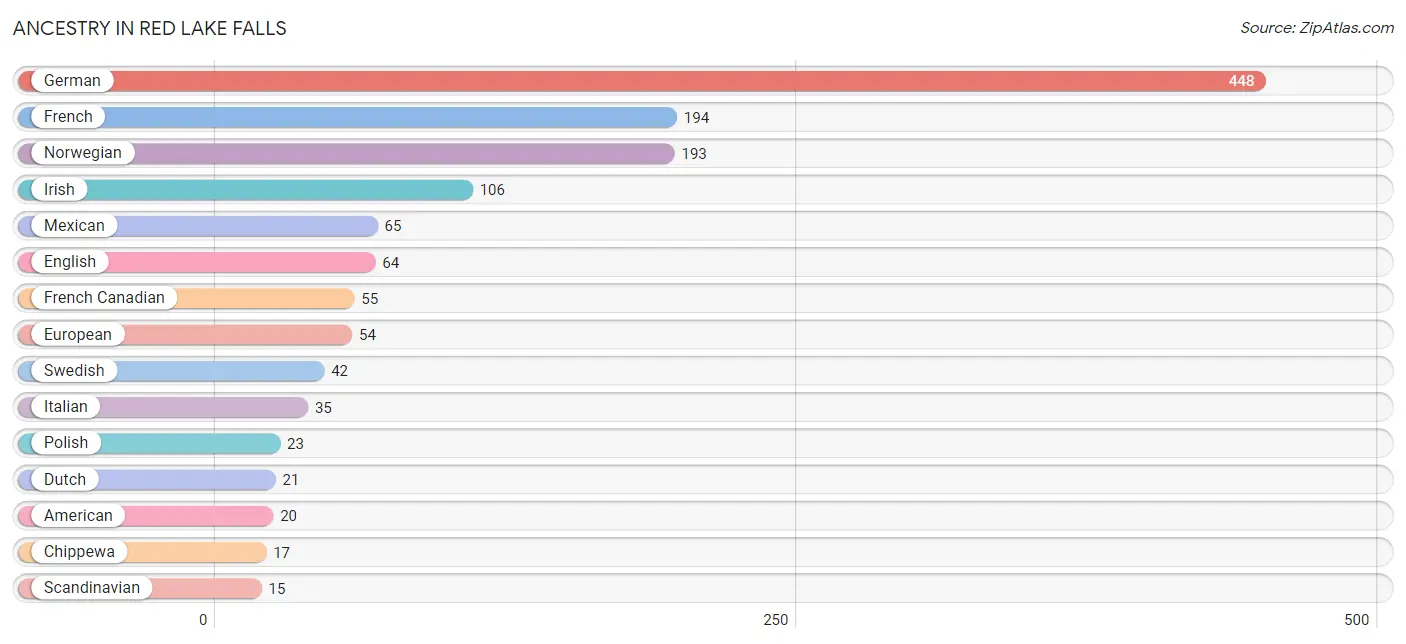
| Ancestry | # Population | % Population |
| American | 20 | 1.5% |
| Belgian | 11 | 0.9% |
| Burmese | 14 | 1.1% |
| Cherokee | 4 | 0.3% |
| Chippewa | 17 | 1.3% |
| Cuban | 2 | 0.2% |
| Czech | 2 | 0.2% |
| Danish | 12 | 0.9% |
| Dutch | 21 | 1.6% |
| English | 64 | 5.0% |
| European | 54 | 4.2% |
| Finnish | 3 | 0.2% |
| French | 194 | 15.1% |
| French American Indian | 8 | 0.6% |
| French Canadian | 55 | 4.3% |
| German | 448 | 34.8% |
| Hungarian | 2 | 0.2% |
| Irish | 106 | 8.2% |
| Italian | 35 | 2.7% |
| Mexican | 65 | 5.1% |
| Norwegian | 193 | 15.0% |
| Polish | 23 | 1.8% |
| Russian | 4 | 0.3% |
| Scandinavian | 15 | 1.2% |
| Scottish | 6 | 0.5% |
| Swedish | 42 | 3.3% |
| Ukrainian | 2 | 0.2% | View All 27 Rows |
Immigrants in Red Lake Falls
The most numerous immigrant groups reported in Red Lake Falls came from Canada (4 | 0.3%), Europe (3 | 0.2%), Caribbean (2 | 0.2%), Cuba (2 | 0.2%), and Eastern Europe (2 | 0.2%), together accounting for 1.0% of all Red Lake Falls residents.
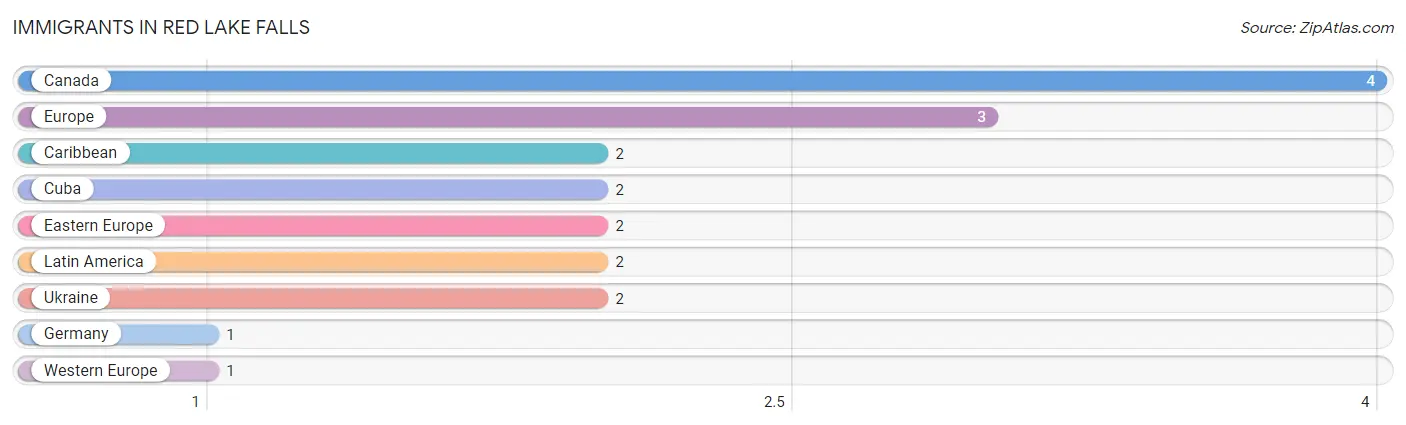
| Immigration Origin | # Population | % Population |
| Canada | 4 | 0.3% |
| Caribbean | 2 | 0.2% |
| Cuba | 2 | 0.2% |
| Eastern Europe | 2 | 0.2% |
| Europe | 3 | 0.2% |
| Germany | 1 | 0.1% |
| Latin America | 2 | 0.2% |
| Ukraine | 2 | 0.2% |
| Western Europe | 1 | 0.1% | View All 9 Rows |
Sex and Age in Red Lake Falls
Sex and Age in Red Lake Falls
The most populous age groups in Red Lake Falls are 10 to 14 Years (80 | 12.3%) for men and 50 to 54 Years (63 | 9.9%) for women.
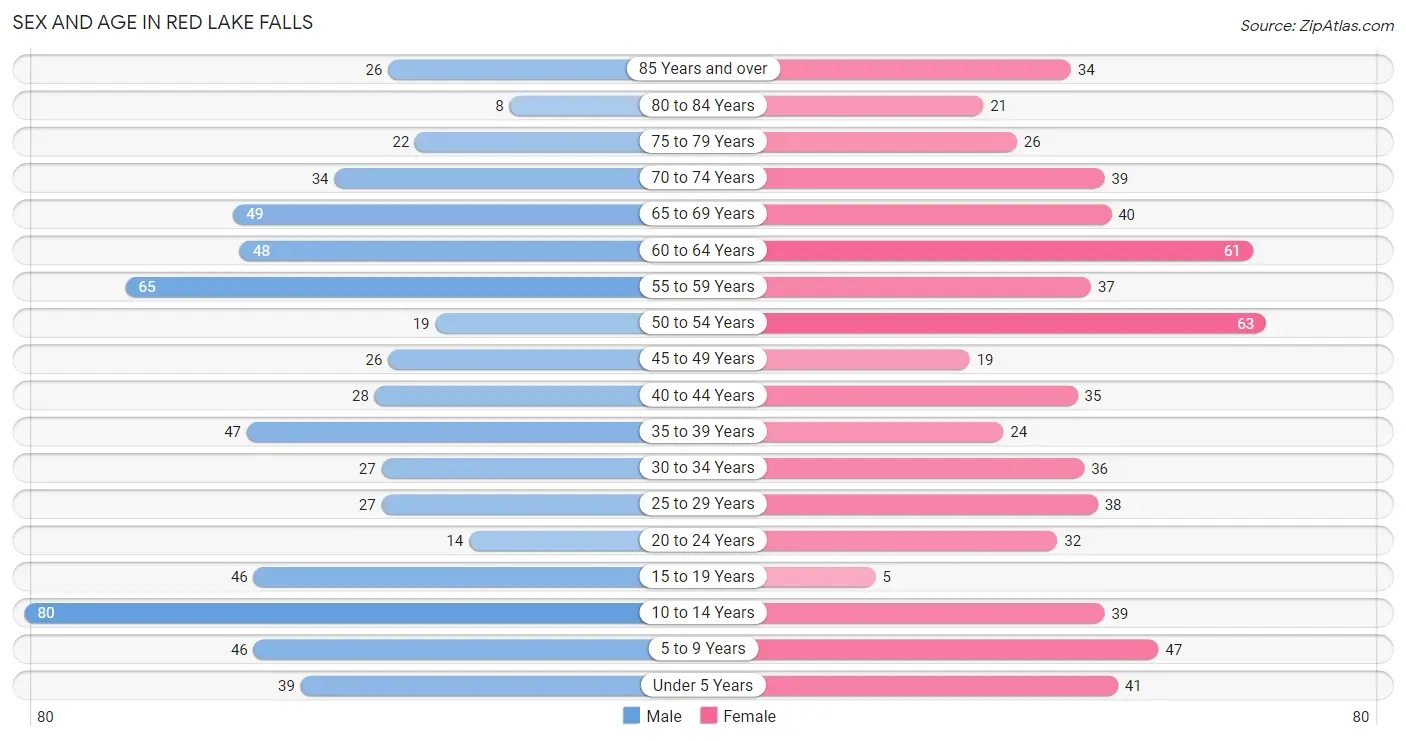
| Age Bracket | Male | Female |
| Under 5 Years | 39 (6.0%) | 41 (6.4%) |
| 5 to 9 Years | 46 (7.1%) | 47 (7.4%) |
| 10 to 14 Years | 80 (12.3%) | 39 (6.1%) |
| 15 to 19 Years | 46 (7.1%) | 5 (0.8%) |
| 20 to 24 Years | 14 (2.1%) | 32 (5.0%) |
| 25 to 29 Years | 27 (4.2%) | 38 (6.0%) |
| 30 to 34 Years | 27 (4.2%) | 36 (5.7%) |
| 35 to 39 Years | 47 (7.2%) | 24 (3.8%) |
| 40 to 44 Years | 28 (4.3%) | 35 (5.5%) |
| 45 to 49 Years | 26 (4.0%) | 19 (3.0%) |
| 50 to 54 Years | 19 (2.9%) | 63 (9.9%) |
| 55 to 59 Years | 65 (10.0%) | 37 (5.8%) |
| 60 to 64 Years | 48 (7.4%) | 61 (9.6%) |
| 65 to 69 Years | 49 (7.5%) | 40 (6.3%) |
| 70 to 74 Years | 34 (5.2%) | 39 (6.1%) |
| 75 to 79 Years | 22 (3.4%) | 26 (4.1%) |
| 80 to 84 Years | 8 (1.2%) | 21 (3.3%) |
| 85 Years and over | 26 (4.0%) | 34 (5.3%) |
| Total | 651 (100.0%) | 637 (100.0%) |
Families and Households in Red Lake Falls
Median Family Size in Red Lake Falls
The median family size in Red Lake Falls is 3.06 persons per family, with single male/father families (15 | 4.8%) accounting for the largest median family size of 4.13 persons per family. On the other hand, married-couple families (249 | 80.1%) represent the smallest median family size with 3.01 persons per family.
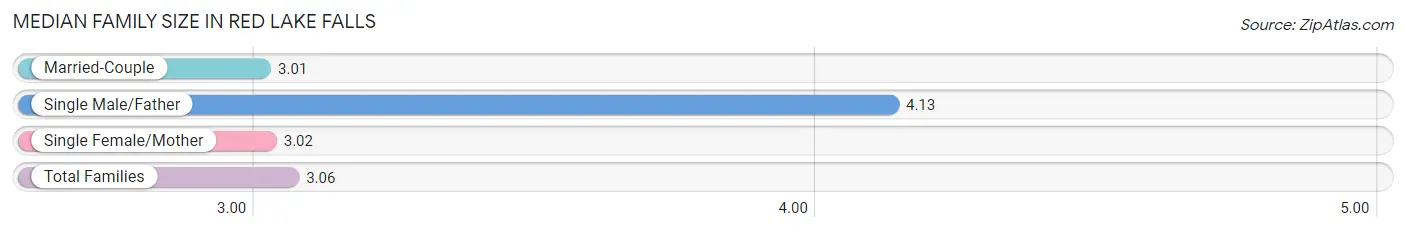
| Family Type | # Families | Family Size |
| Married-Couple | 249 (80.1%) | 3.01 |
| Single Male/Father | 15 (4.8%) | 4.13 |
| Single Female/Mother | 47 (15.1%) | 3.02 |
| Total Families | 311 (100.0%) | 3.06 |
Median Household Size in Red Lake Falls
The median household size in Red Lake Falls is 2.23 persons per household, with single male/father households (15 | 2.7%) accounting for the largest median household size of 4.6 persons per household. non-family households (250 | 44.6%) represent the smallest median household size with 1.02 persons per household.
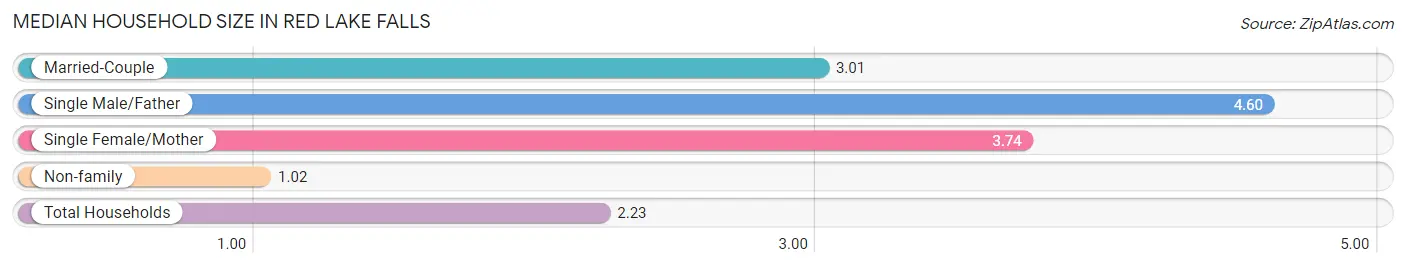
| Household Type | # Households | Household Size |
| Married-Couple | 249 (44.4%) | 3.01 |
| Single Male/Father | 15 (2.7%) | 4.60 |
| Single Female/Mother | 47 (8.4%) | 3.74 |
| Non-family | 250 (44.6%) | 1.02 |
| Total Households | 561 (100.0%) | 2.23 |
Household Size by Marriage Status in Red Lake Falls
Out of a total of 561 households in Red Lake Falls, 311 (55.4%) are family households, while 250 (44.6%) are nonfamily households. The most numerous type of family households are 2-person households, comprising 158, and the most common type of nonfamily households are 1-person households, comprising 245.
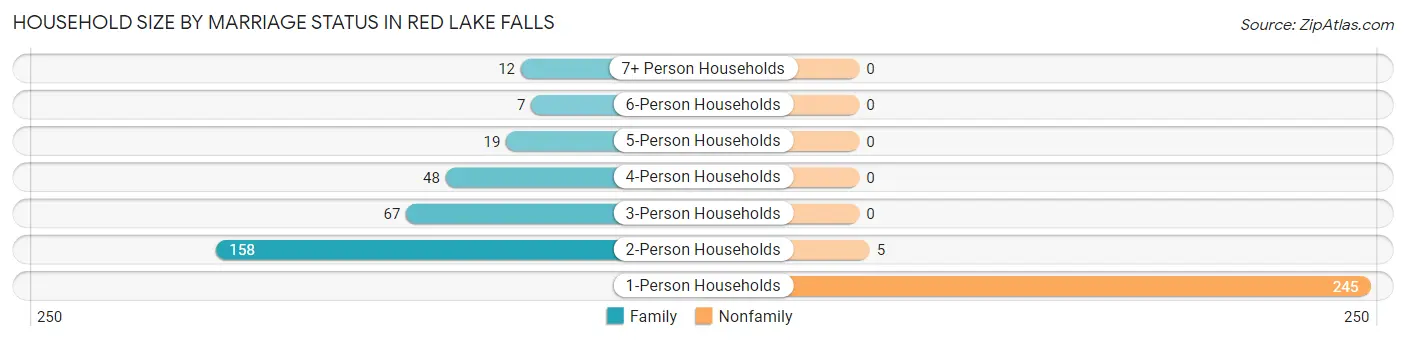
| Household Size | Family Households | Nonfamily Households |
| 1-Person Households | - | 245 (43.7%) |
| 2-Person Households | 158 (28.2%) | 5 (0.9%) |
| 3-Person Households | 67 (11.9%) | 0 (0.0%) |
| 4-Person Households | 48 (8.6%) | 0 (0.0%) |
| 5-Person Households | 19 (3.4%) | 0 (0.0%) |
| 6-Person Households | 7 (1.3%) | 0 (0.0%) |
| 7+ Person Households | 12 (2.1%) | 0 (0.0%) |
| Total | 311 (55.4%) | 250 (44.6%) |
Female Fertility in Red Lake Falls
Fertility by Age in Red Lake Falls
Average fertility rate in Red Lake Falls is 101.0 births per 1,000 women. Women in the age bracket of 20 to 34 years have the highest fertility rate with 151.0 births per 1,000 women. Women in the age bracket of 20 to 34 years acount for 84.2% of all women with births.
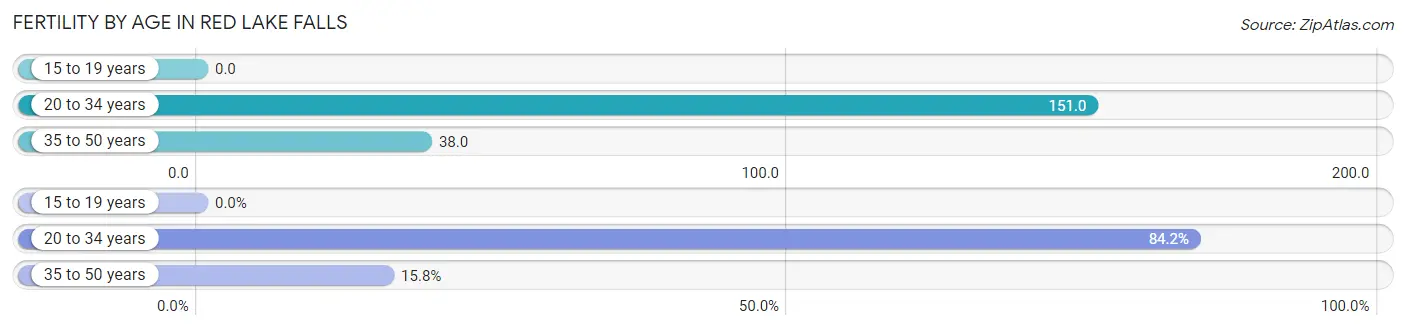
| Age Bracket | Women with Births | Births / 1,000 Women |
| 15 to 19 years | 0 (0.0%) | 0.0 |
| 20 to 34 years | 16 (84.2%) | 151.0 |
| 35 to 50 years | 3 (15.8%) | 38.0 |
| Total | 19 (100.0%) | 101.0 |
Fertility by Age by Marriage Status in Red Lake Falls
63.2% of women with births (19) in Red Lake Falls are married. The highest percentage of unmarried women with births falls into 20 to 34 years age bracket with 43.8% of them unmarried at the time of birth, while the lowest percentage of unmarried women with births belong to 35 to 50 years age bracket with 0.0% of them unmarried.
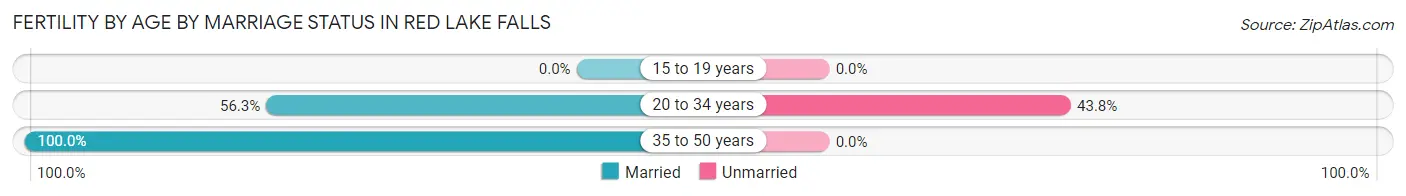
| Age Bracket | Married | Unmarried |
| 15 to 19 years | 0 (0.0%) | 0 (0.0%) |
| 20 to 34 years | 9 (56.2%) | 7 (43.8%) |
| 35 to 50 years | 3 (100.0%) | 0 (0.0%) |
| Total | 12 (63.2%) | 7 (36.8%) |
Fertility by Education in Red Lake Falls
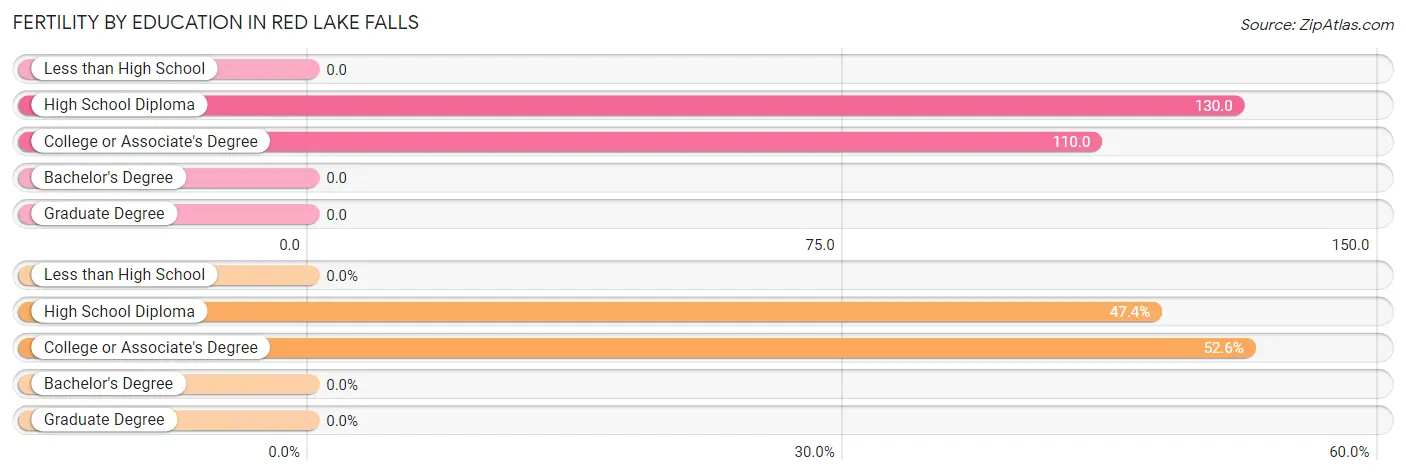
| Educational Attainment | Women with Births | Births / 1,000 Women |
| Less than High School | 0 (0.0%) | 0.0 |
| High School Diploma | 9 (47.4%) | 130.0 |
| College or Associate's Degree | 10 (52.6%) | 110.0 |
| Bachelor's Degree | 0 (0.0%) | 0.0 |
| Graduate Degree | 0 (0.0%) | 0.0 |
| Total | 19 (100.0%) | 101.0 |
Fertility by Education by Marriage Status in Red Lake Falls
36.8% of women with births in Red Lake Falls are unmarried. Women with the educational attainment of high school diploma are most likely to be married with 100.0% of them married at childbirth, while women with the educational attainment of college or associate's degree are least likely to be married with 70.0% of them unmarried at childbirth.
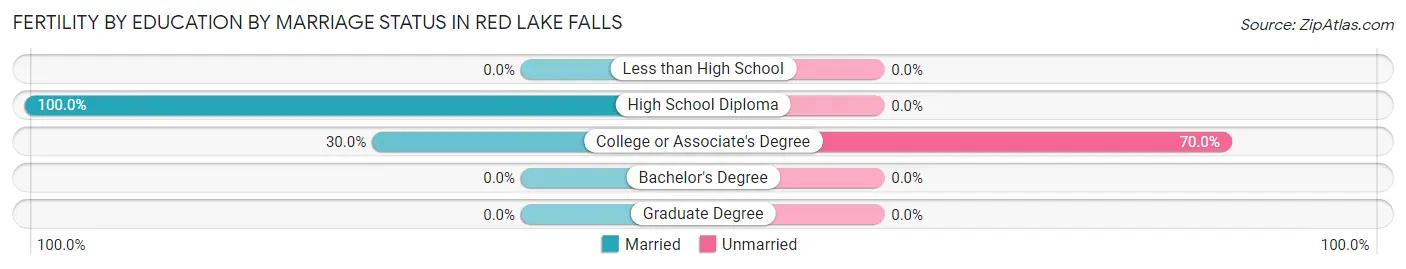
| Educational Attainment | Married | Unmarried |
| Less than High School | 0 (0.0%) | 0 (0.0%) |
| High School Diploma | 9 (100.0%) | 0 (0.0%) |
| College or Associate's Degree | 3 (30.0%) | 7 (70.0%) |
| Bachelor's Degree | 0 (0.0%) | 0 (0.0%) |
| Graduate Degree | 0 (0.0%) | 0 (0.0%) |
| Total | 12 (63.2%) | 7 (36.8%) |
Employment Characteristics in Red Lake Falls
Employment by Class of Employer in Red Lake Falls
Among the 650 employed individuals in Red Lake Falls, private company employees (453 | 69.7%), not-for-profit organizations (74 | 11.4%), and local government employees (68 | 10.5%) make up the most common classes of employment.
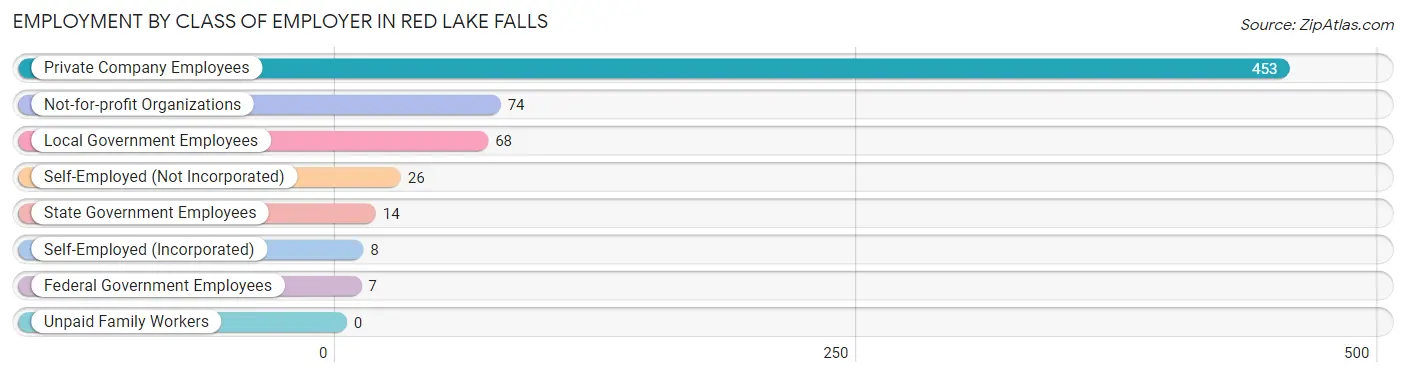
| Employer Class | # Employees | % Employees |
| Private Company Employees | 453 | 69.7% |
| Self-Employed (Incorporated) | 8 | 1.2% |
| Self-Employed (Not Incorporated) | 26 | 4.0% |
| Not-for-profit Organizations | 74 | 11.4% |
| Local Government Employees | 68 | 10.5% |
| State Government Employees | 14 | 2.1% |
| Federal Government Employees | 7 | 1.1% |
| Unpaid Family Workers | 0 | 0.0% |
| Total | 650 | 100.0% |
Employment Status by Age in Red Lake Falls
According to the labor force statistics for Red Lake Falls, out of the total population over 16 years of age (983), 67.0% or 659 individuals are in the labor force, with 0.8% or 5 of them unemployed. The age group with the highest labor force participation rate is 35 to 44 years, with 100.0% or 134 individuals in the labor force. Within the labor force, the 65 to 74 years age range has the highest percentage of unemployed individuals, with 3.5% or 2 of them being unemployed.
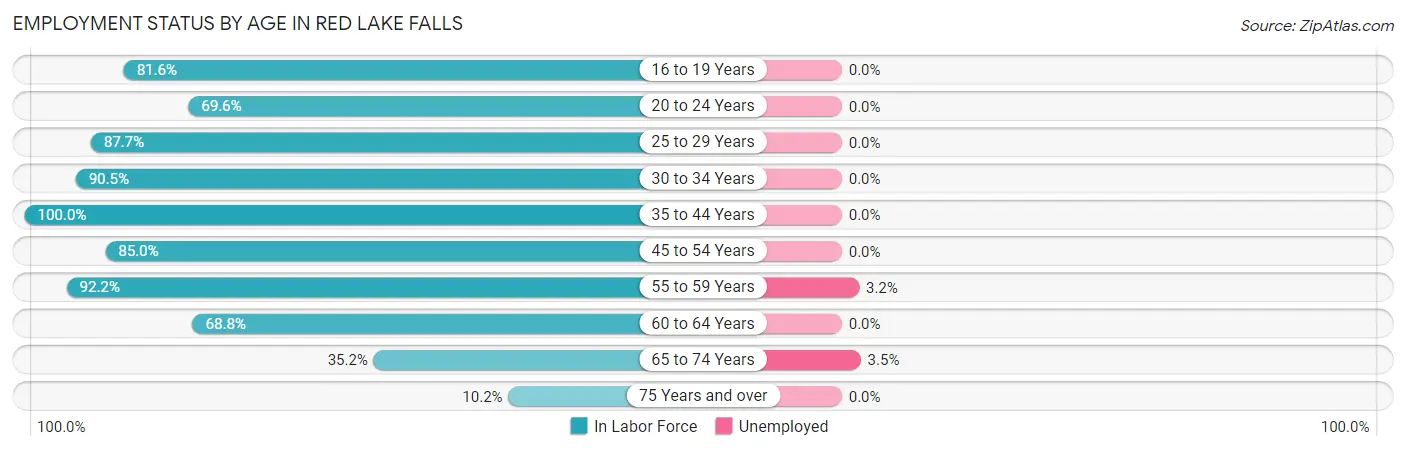
| Age Bracket | In Labor Force | Unemployed |
| 16 to 19 Years | 31 (81.6%) | 0 (0.0%) |
| 20 to 24 Years | 32 (69.6%) | 0 (0.0%) |
| 25 to 29 Years | 57 (87.7%) | 0 (0.0%) |
| 30 to 34 Years | 57 (90.5%) | 0 (0.0%) |
| 35 to 44 Years | 134 (100.0%) | 0 (0.0%) |
| 45 to 54 Years | 108 (85.0%) | 0 (0.0%) |
| 55 to 59 Years | 94 (92.2%) | 3 (3.2%) |
| 60 to 64 Years | 75 (68.8%) | 0 (0.0%) |
| 65 to 74 Years | 57 (35.2%) | 2 (3.5%) |
| 75 Years and over | 14 (10.2%) | 0 (0.0%) |
| Total | 659 (67.0%) | 5 (0.8%) |
Employment Status by Educational Attainment in Red Lake Falls
According to labor force statistics for Red Lake Falls, 87.5% of individuals (525) out of the total population between 25 and 64 years of age (600) are in the labor force, with 0.6% or 3 of them being unemployed. The group with the highest labor force participation rate are those with the educational attainment of college / associate degree, with 91.3% or 241 individuals in the labor force. Within the labor force, individuals with college / associate degree education have the highest percentage of unemployment, with 1.2% or 3 of them being unemployed.
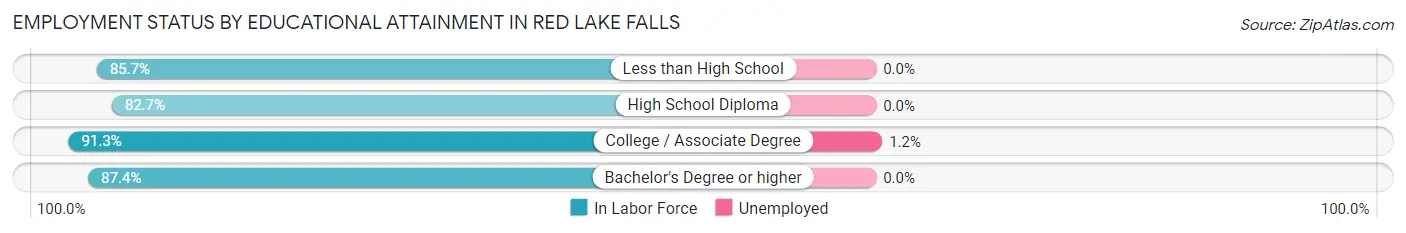
| Educational Attainment | In Labor Force | Unemployed |
| Less than High School | 18 (85.7%) | 0 (0.0%) |
| High School Diploma | 162 (82.7%) | 0 (0.0%) |
| College / Associate Degree | 241 (91.3%) | 3 (1.2%) |
| Bachelor's Degree or higher | 104 (87.4%) | 0 (0.0%) |
| Total | 525 (87.5%) | 4 (0.6%) |
Employment Occupations by Sex in Red Lake Falls
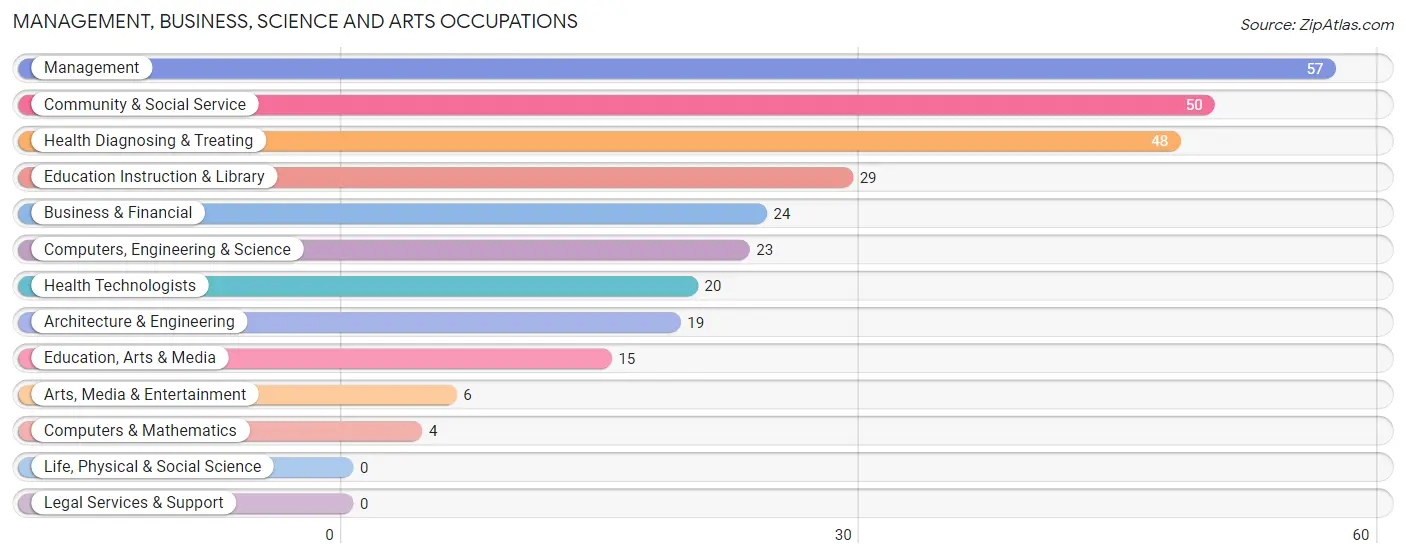
Management, Business, Science and Arts Occupations
The most common Management, Business, Science and Arts occupations in Red Lake Falls are Management (57 | 8.7%), Community & Social Service (50 | 7.6%), Health Diagnosing & Treating (48 | 7.3%), Education Instruction & Library (29 | 4.4%), and Business & Financial (24 | 3.7%).
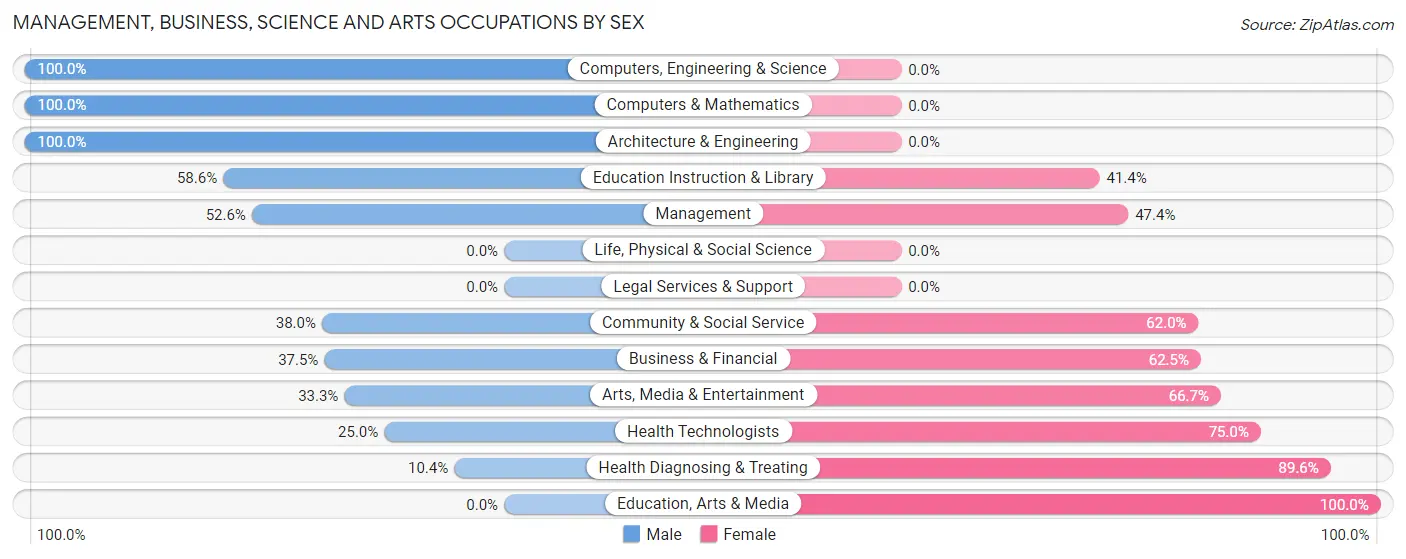
Management, Business, Science and Arts Occupations by Sex
Within the Management, Business, Science and Arts occupations in Red Lake Falls, the most male-oriented occupations are Computers, Engineering & Science (100.0%), Computers & Mathematics (100.0%), and Architecture & Engineering (100.0%), while the most female-oriented occupations are Education, Arts & Media (100.0%), Health Diagnosing & Treating (89.6%), and Health Technologists (75.0%).
| Occupation | Male | Female |
| Management | 30 (52.6%) | 27 (47.4%) |
| Business & Financial | 9 (37.5%) | 15 (62.5%) |
| Computers, Engineering & Science | 23 (100.0%) | 0 (0.0%) |
| Computers & Mathematics | 4 (100.0%) | 0 (0.0%) |
| Architecture & Engineering | 19 (100.0%) | 0 (0.0%) |
| Life, Physical & Social Science | 0 (0.0%) | 0 (0.0%) |
| Community & Social Service | 19 (38.0%) | 31 (62.0%) |
| Education, Arts & Media | 0 (0.0%) | 15 (100.0%) |
| Legal Services & Support | 0 (0.0%) | 0 (0.0%) |
| Education Instruction & Library | 17 (58.6%) | 12 (41.4%) |
| Arts, Media & Entertainment | 2 (33.3%) | 4 (66.7%) |
| Health Diagnosing & Treating | 5 (10.4%) | 43 (89.6%) |
| Health Technologists | 5 (25.0%) | 15 (75.0%) |
| Total (Category) | 86 (42.6%) | 116 (57.4%) |
| Total (Overall) | 315 (48.2%) | 339 (51.8%) |
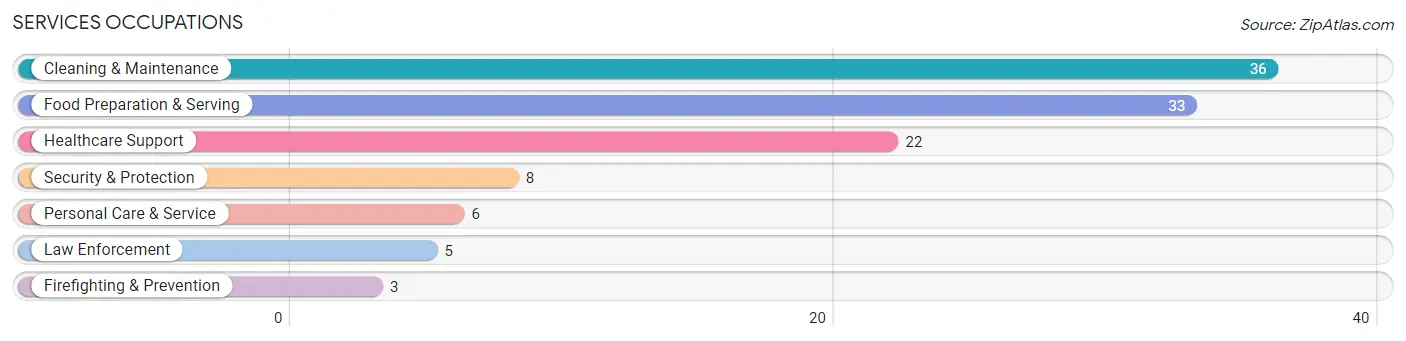
Services Occupations
The most common Services occupations in Red Lake Falls are Cleaning & Maintenance (36 | 5.5%), Food Preparation & Serving (33 | 5.1%), Healthcare Support (22 | 3.4%), Security & Protection (8 | 1.2%), and Personal Care & Service (6 | 0.9%).
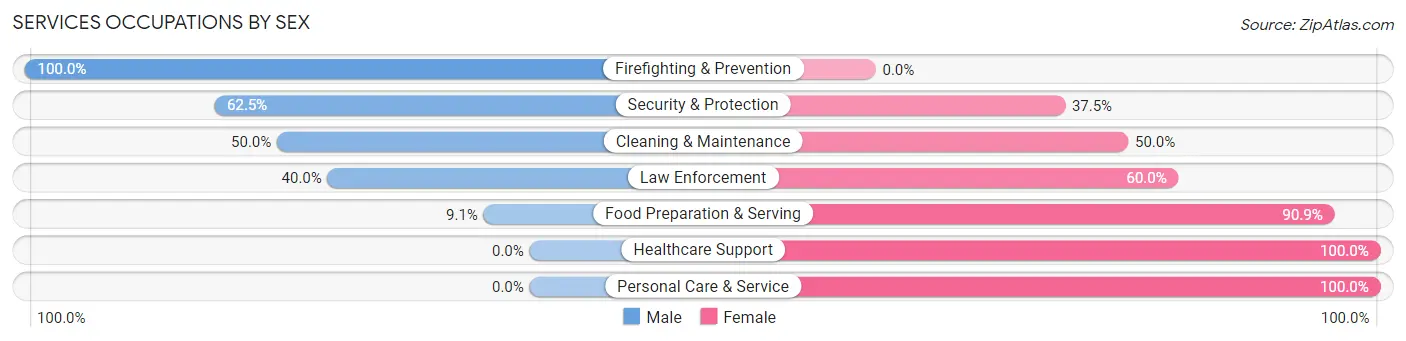
Services Occupations by Sex
Within the Services occupations in Red Lake Falls, the most male-oriented occupations are Firefighting & Prevention (100.0%), Security & Protection (62.5%), and Cleaning & Maintenance (50.0%), while the most female-oriented occupations are Healthcare Support (100.0%), Personal Care & Service (100.0%), and Food Preparation & Serving (90.9%).
| Occupation | Male | Female |
| Healthcare Support | 0 (0.0%) | 22 (100.0%) |
| Security & Protection | 5 (62.5%) | 3 (37.5%) |
| Firefighting & Prevention | 3 (100.0%) | 0 (0.0%) |
| Law Enforcement | 2 (40.0%) | 3 (60.0%) |
| Food Preparation & Serving | 3 (9.1%) | 30 (90.9%) |
| Cleaning & Maintenance | 18 (50.0%) | 18 (50.0%) |
| Personal Care & Service | 0 (0.0%) | 6 (100.0%) |
| Total (Category) | 26 (24.8%) | 79 (75.2%) |
| Total (Overall) | 315 (48.2%) | 339 (51.8%) |
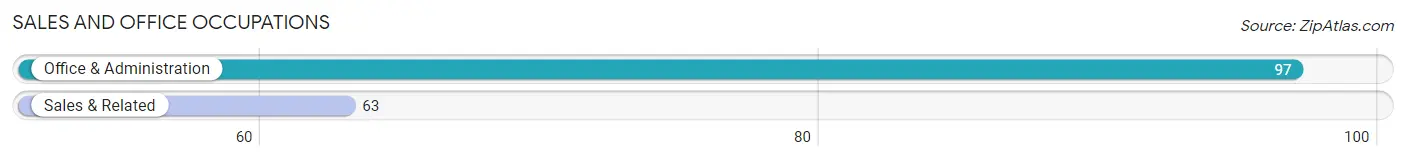
Sales and Office Occupations
The most common Sales and Office occupations in Red Lake Falls are Office & Administration (97 | 14.8%), and Sales & Related (63 | 9.6%).
Sales and Office Occupations by Sex
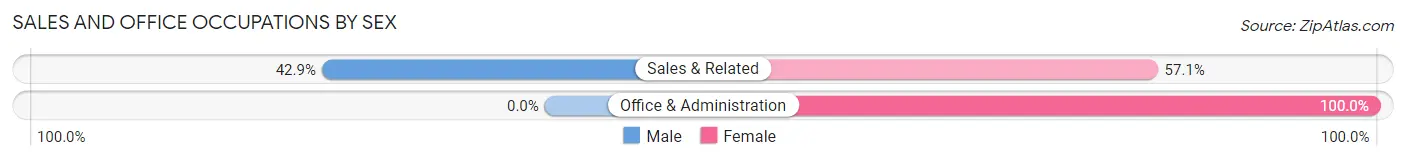
| Occupation | Male | Female |
| Sales & Related | 27 (42.9%) | 36 (57.1%) |
| Office & Administration | 0 (0.0%) | 97 (100.0%) |
| Total (Category) | 27 (16.9%) | 133 (83.1%) |
| Total (Overall) | 315 (48.2%) | 339 (51.8%) |
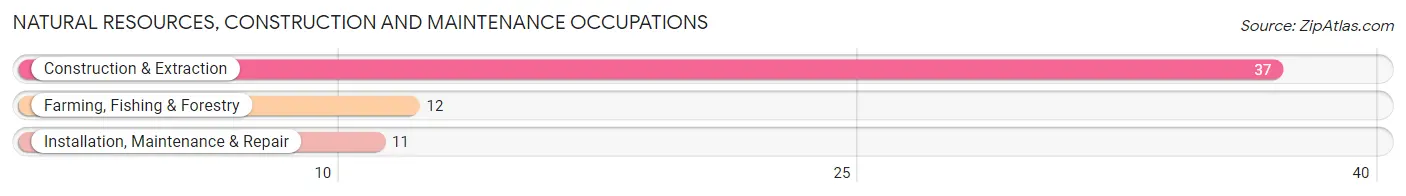
Natural Resources, Construction and Maintenance Occupations
The most common Natural Resources, Construction and Maintenance occupations in Red Lake Falls are Construction & Extraction (37 | 5.7%), Farming, Fishing & Forestry (12 | 1.8%), and Installation, Maintenance & Repair (11 | 1.7%).
Natural Resources, Construction and Maintenance Occupations by Sex
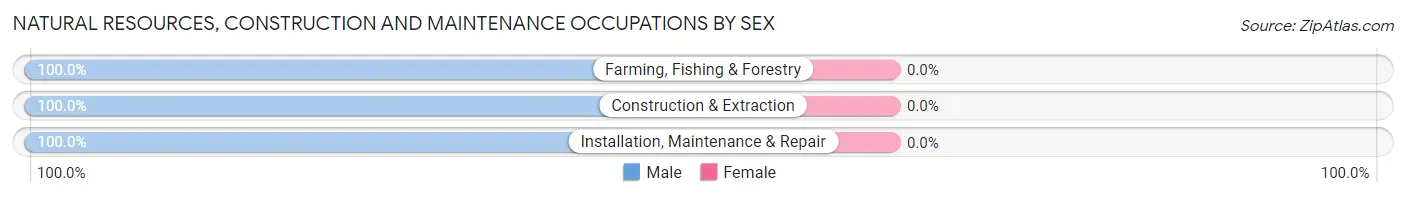
| Occupation | Male | Female |
| Farming, Fishing & Forestry | 12 (100.0%) | 0 (0.0%) |
| Construction & Extraction | 37 (100.0%) | 0 (0.0%) |
| Installation, Maintenance & Repair | 11 (100.0%) | 0 (0.0%) |
| Total (Category) | 60 (100.0%) | 0 (0.0%) |
| Total (Overall) | 315 (48.2%) | 339 (51.8%) |
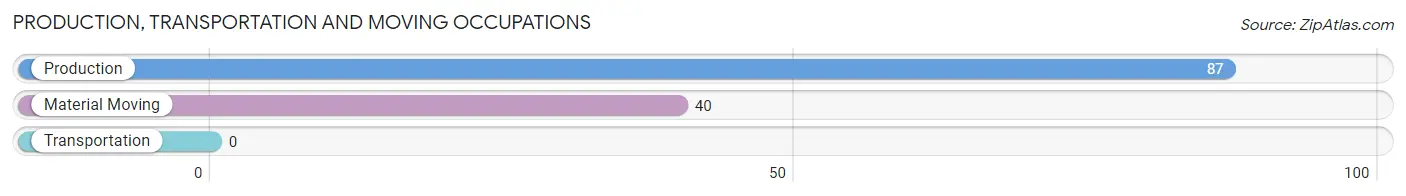
Production, Transportation and Moving Occupations
The most common Production, Transportation and Moving occupations in Red Lake Falls are Production (87 | 13.3%), and Material Moving (40 | 6.1%).
Production, Transportation and Moving Occupations by Sex
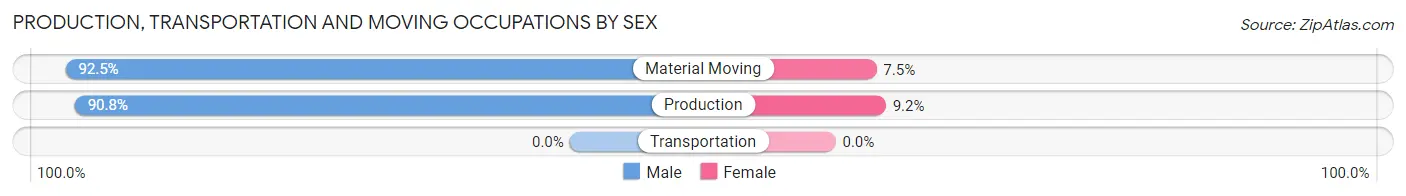
| Occupation | Male | Female |
| Production | 79 (90.8%) | 8 (9.2%) |
| Transportation | 0 (0.0%) | 0 (0.0%) |
| Material Moving | 37 (92.5%) | 3 (7.5%) |
| Total (Category) | 116 (91.3%) | 11 (8.7%) |
| Total (Overall) | 315 (48.2%) | 339 (51.8%) |
Employment Industries by Sex in Red Lake Falls
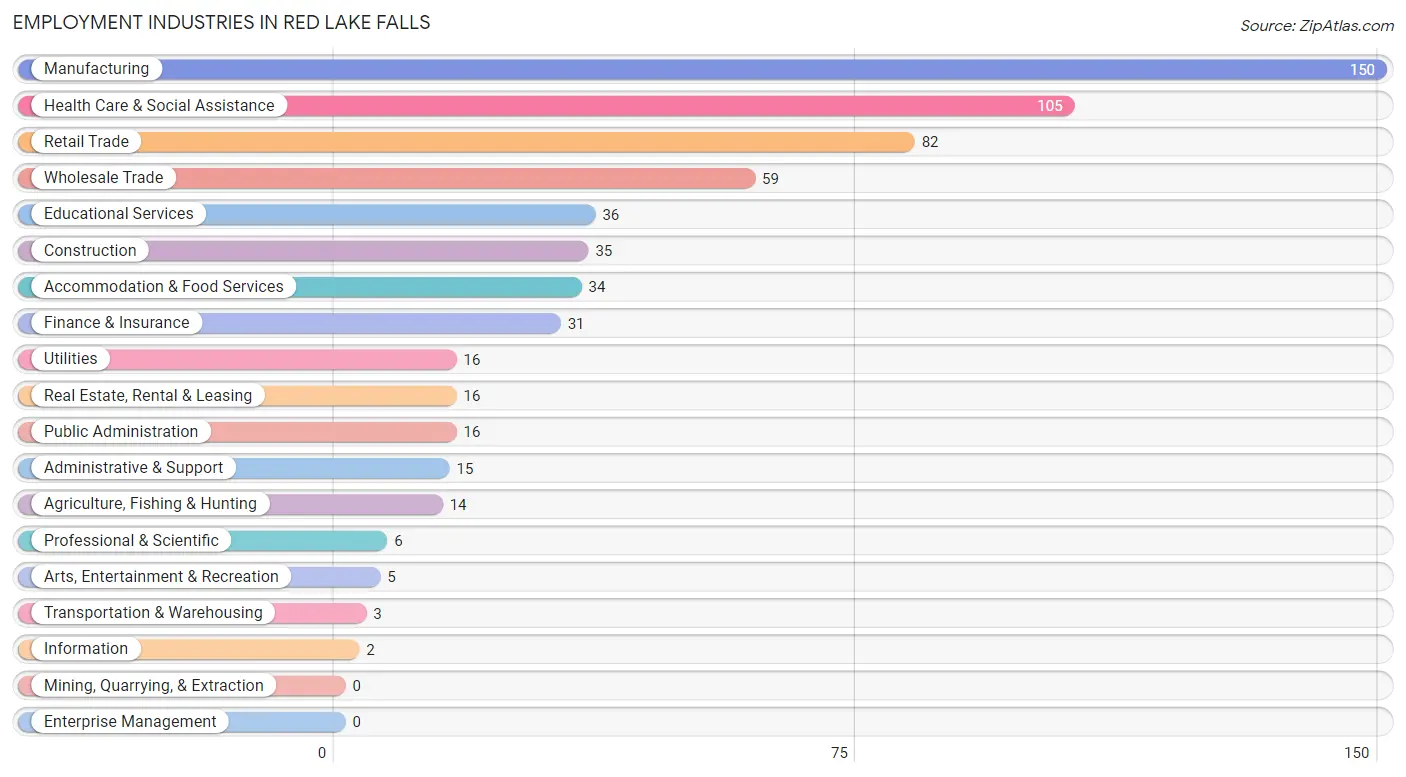
Employment Industries in Red Lake Falls
The major employment industries in Red Lake Falls include Manufacturing (150 | 22.9%), Health Care & Social Assistance (105 | 16.1%), Retail Trade (82 | 12.5%), Wholesale Trade (59 | 9.0%), and Educational Services (36 | 5.5%).
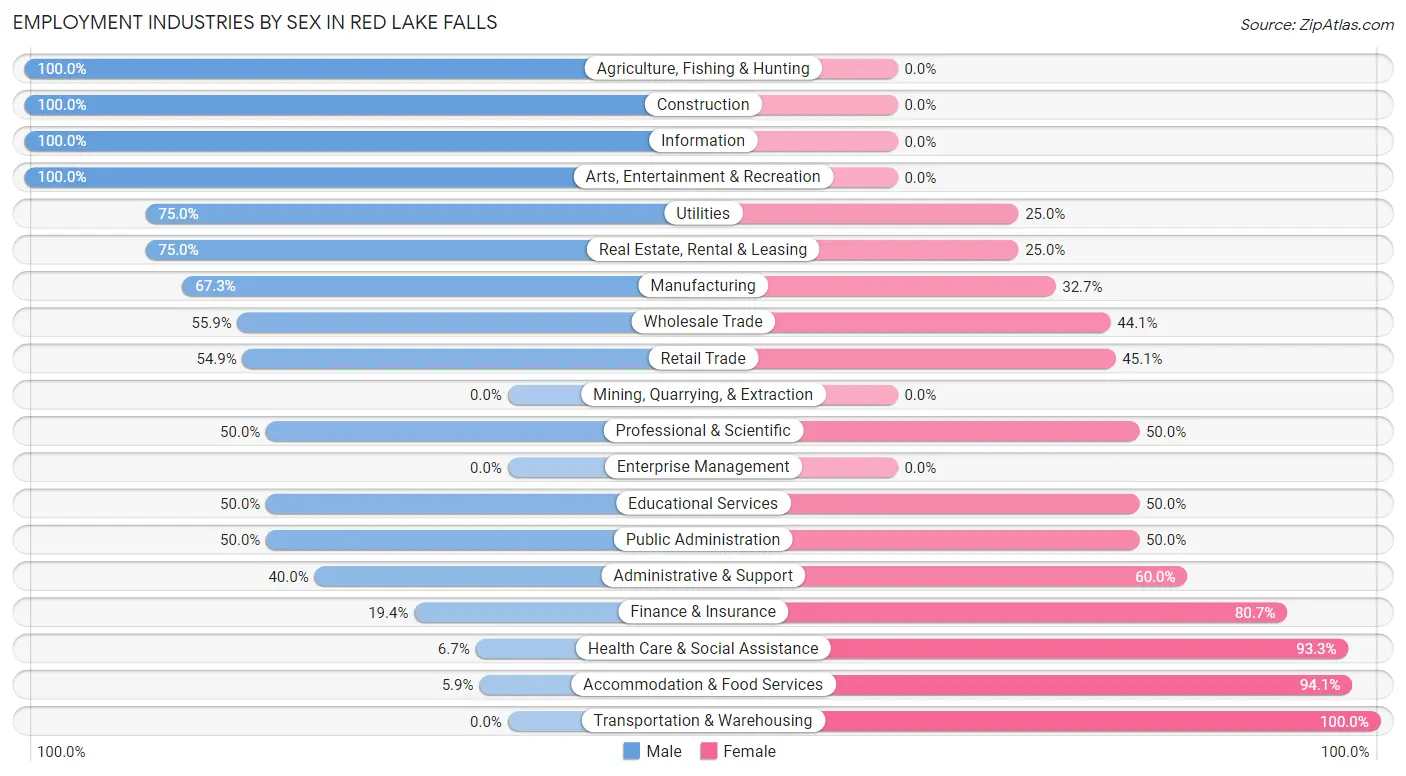
Employment Industries by Sex in Red Lake Falls
The Red Lake Falls industries that see more men than women are Agriculture, Fishing & Hunting (100.0%), Construction (100.0%), and Information (100.0%), whereas the industries that tend to have a higher number of women are Transportation & Warehousing (100.0%), Accommodation & Food Services (94.1%), and Health Care & Social Assistance (93.3%).
| Industry | Male | Female |
| Agriculture, Fishing & Hunting | 14 (100.0%) | 0 (0.0%) |
| Mining, Quarrying, & Extraction | 0 (0.0%) | 0 (0.0%) |
| Construction | 35 (100.0%) | 0 (0.0%) |
| Manufacturing | 101 (67.3%) | 49 (32.7%) |
| Wholesale Trade | 33 (55.9%) | 26 (44.1%) |
| Retail Trade | 45 (54.9%) | 37 (45.1%) |
| Transportation & Warehousing | 0 (0.0%) | 3 (100.0%) |
| Utilities | 12 (75.0%) | 4 (25.0%) |
| Information | 2 (100.0%) | 0 (0.0%) |
| Finance & Insurance | 6 (19.4%) | 25 (80.6%) |
| Real Estate, Rental & Leasing | 12 (75.0%) | 4 (25.0%) |
| Professional & Scientific | 3 (50.0%) | 3 (50.0%) |
| Enterprise Management | 0 (0.0%) | 0 (0.0%) |
| Administrative & Support | 6 (40.0%) | 9 (60.0%) |
| Educational Services | 18 (50.0%) | 18 (50.0%) |
| Health Care & Social Assistance | 7 (6.7%) | 98 (93.3%) |
| Arts, Entertainment & Recreation | 5 (100.0%) | 0 (0.0%) |
| Accommodation & Food Services | 2 (5.9%) | 32 (94.1%) |
| Public Administration | 8 (50.0%) | 8 (50.0%) |
| Total | 315 (48.2%) | 339 (51.8%) |
Education in Red Lake Falls
School Enrollment in Red Lake Falls
The most common levels of schooling among the 283 students in Red Lake Falls are middle school (90 | 31.8%), elementary school (89 | 31.5%), and nursery / preschool (35 | 12.4%).
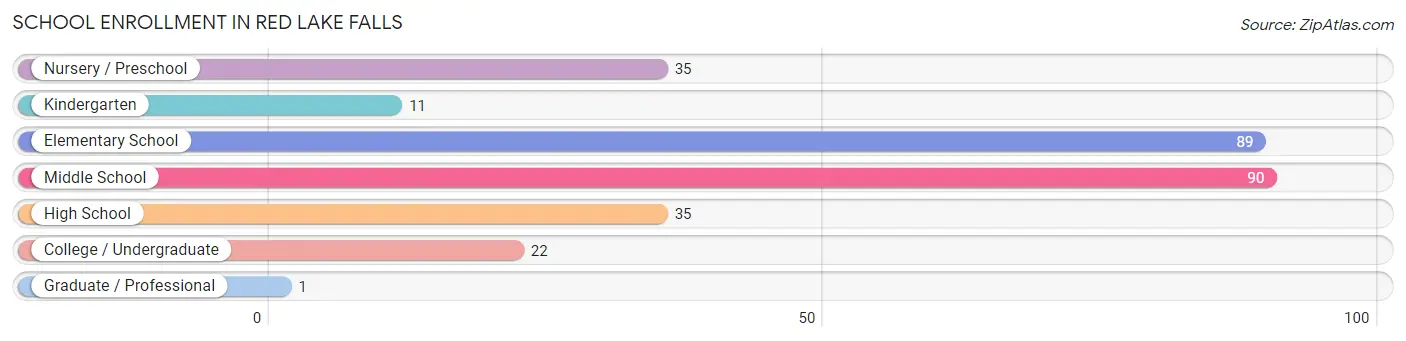
| School Level | # Students | % Students |
| Nursery / Preschool | 35 | 12.4% |
| Kindergarten | 11 | 3.9% |
| Elementary School | 89 | 31.5% |
| Middle School | 90 | 31.8% |
| High School | 35 | 12.4% |
| College / Undergraduate | 22 | 7.8% |
| Graduate / Professional | 1 | 0.4% |
| Total | 283 | 100.0% |
School Enrollment by Age by Funding Source in Red Lake Falls
Out of a total of 283 students who are enrolled in schools in Red Lake Falls, 6 (2.1%) attend a private institution, while the remaining 277 (97.9%) are enrolled in public schools. The age group of 3 to 4 year olds has the highest likelihood of being enrolled in private schools, with 6 (28.6% in the age bracket) enrolled. Conversely, the age group of 5 to 9 year old has the lowest likelihood of being enrolled in a private school, with 93 (100.0% in the age bracket) attending a public institution.
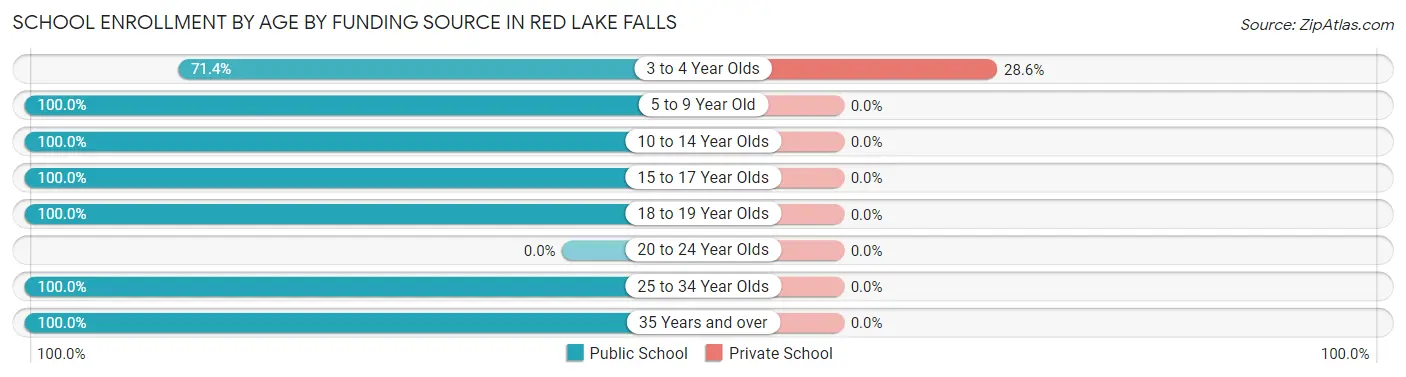
| Age Bracket | Public School | Private School |
| 3 to 4 Year Olds | 15 (71.4%) | 6 (28.6%) |
| 5 to 9 Year Old | 93 (100.0%) | 0 (0.0%) |
| 10 to 14 Year Olds | 119 (100.0%) | 0 (0.0%) |
| 15 to 17 Year Olds | 27 (100.0%) | 0 (0.0%) |
| 18 to 19 Year Olds | 10 (100.0%) | 0 (0.0%) |
| 20 to 24 Year Olds | 0 (0.0%) | 0 (0.0%) |
| 25 to 34 Year Olds | 4 (100.0%) | 0 (0.0%) |
| 35 Years and over | 9 (100.0%) | 0 (0.0%) |
| Total | 277 (97.9%) | 6 (2.1%) |
Educational Attainment by Field of Study in Red Lake Falls
Business (35 | 22.4%), education (25 | 16.0%), engineering (19 | 12.2%), social sciences (16 | 10.3%), and visual & performing arts (16 | 10.3%) are the most common fields of study among 156 individuals in Red Lake Falls who have obtained a bachelor's degree or higher.
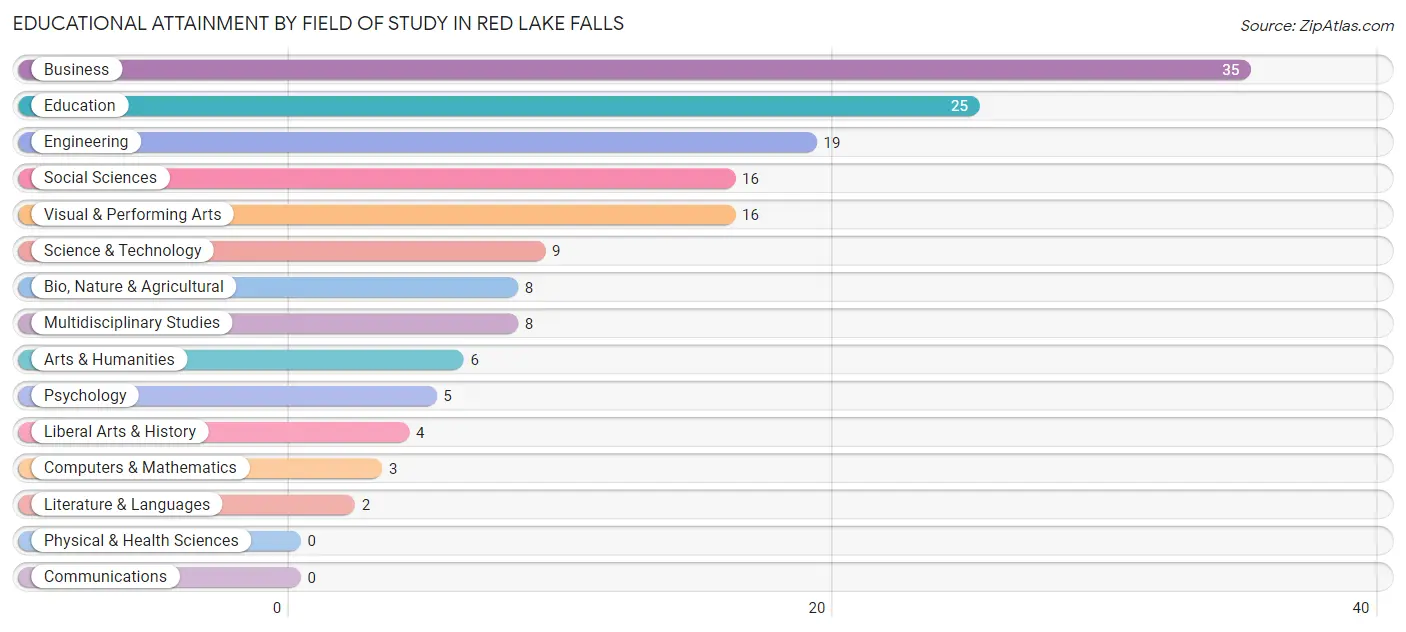
| Field of Study | # Graduates | % Graduates |
| Computers & Mathematics | 3 | 1.9% |
| Bio, Nature & Agricultural | 8 | 5.1% |
| Physical & Health Sciences | 0 | 0.0% |
| Psychology | 5 | 3.2% |
| Social Sciences | 16 | 10.3% |
| Engineering | 19 | 12.2% |
| Multidisciplinary Studies | 8 | 5.1% |
| Science & Technology | 9 | 5.8% |
| Business | 35 | 22.4% |
| Education | 25 | 16.0% |
| Literature & Languages | 2 | 1.3% |
| Liberal Arts & History | 4 | 2.6% |
| Visual & Performing Arts | 16 | 10.3% |
| Communications | 0 | 0.0% |
| Arts & Humanities | 6 | 3.8% |
| Total | 156 | 100.0% |
Transportation & Commute in Red Lake Falls
Vehicle Availability by Sex in Red Lake Falls
The most prevalent vehicle ownership categories in Red Lake Falls are males with 2 vehicles (118, accounting for 37.7%) and females with 2 vehicles (117, making up 35.8%).
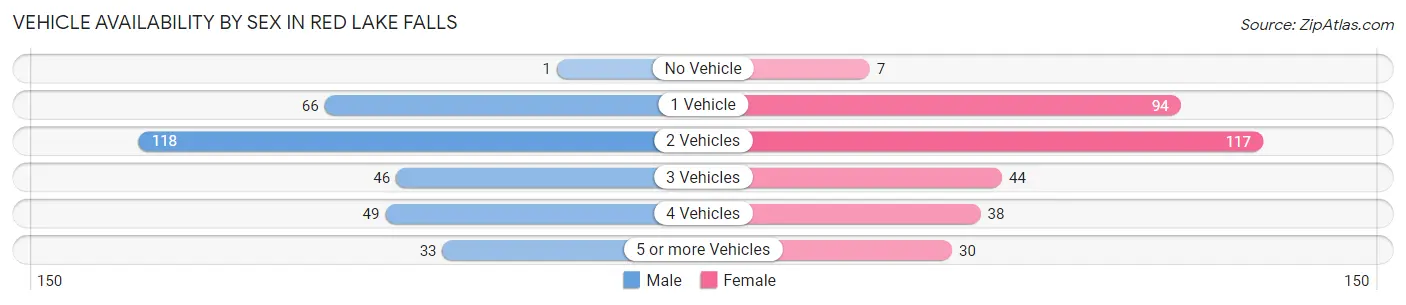
| Vehicles Available | Male | Female |
| No Vehicle | 1 (0.3%) | 7 (2.1%) |
| 1 Vehicle | 66 (21.1%) | 94 (28.5%) |
| 2 Vehicles | 118 (37.7%) | 117 (35.4%) |
| 3 Vehicles | 46 (14.7%) | 44 (13.3%) |
| 4 Vehicles | 49 (15.7%) | 38 (11.5%) |
| 5 or more Vehicles | 33 (10.5%) | 30 (9.1%) |
| Total | 313 (100.0%) | 330 (100.0%) |
Commute Time in Red Lake Falls
The most frequently occuring commute durations in Red Lake Falls are less than 5 minutes (123 commuters, 20.7%), 20 to 24 minutes (106 commuters, 17.8%), and 5 to 9 minutes (95 commuters, 16.0%).
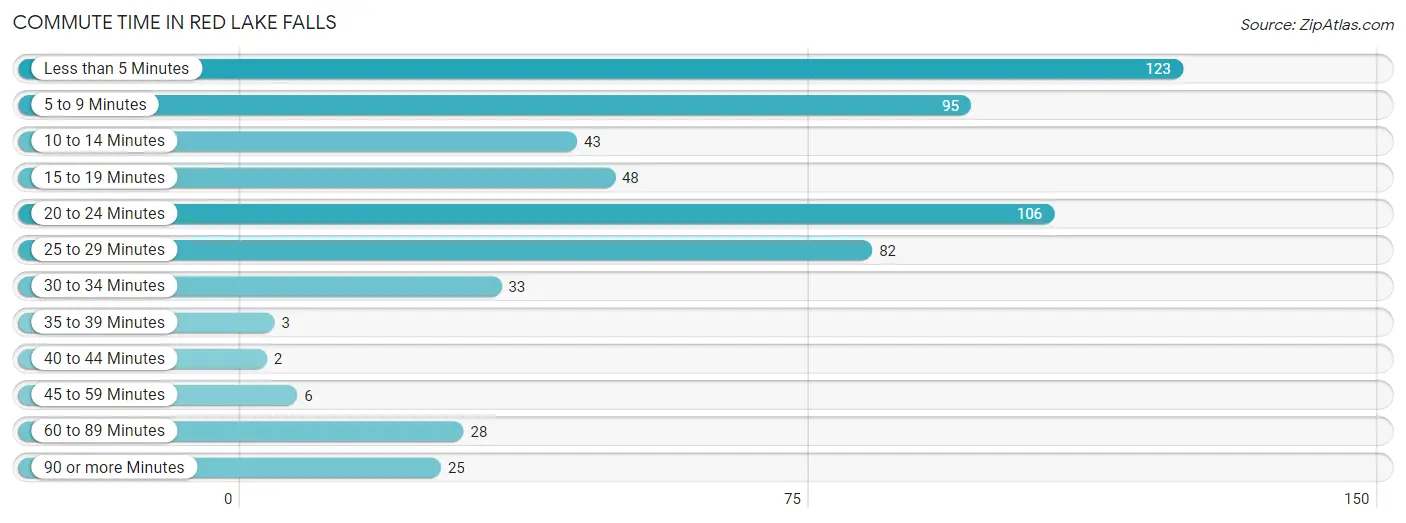
| Commute Time | # Commuters | % Commuters |
| Less than 5 Minutes | 123 | 20.7% |
| 5 to 9 Minutes | 95 | 16.0% |
| 10 to 14 Minutes | 43 | 7.2% |
| 15 to 19 Minutes | 48 | 8.1% |
| 20 to 24 Minutes | 106 | 17.8% |
| 25 to 29 Minutes | 82 | 13.8% |
| 30 to 34 Minutes | 33 | 5.6% |
| 35 to 39 Minutes | 3 | 0.5% |
| 40 to 44 Minutes | 2 | 0.3% |
| 45 to 59 Minutes | 6 | 1.0% |
| 60 to 89 Minutes | 28 | 4.7% |
| 90 or more Minutes | 25 | 4.2% |
Commute Time by Sex in Red Lake Falls
The most common commute times in Red Lake Falls are 20 to 24 minutes (58 commuters, 19.5%) for males and less than 5 minutes (79 commuters, 26.6%) for females.
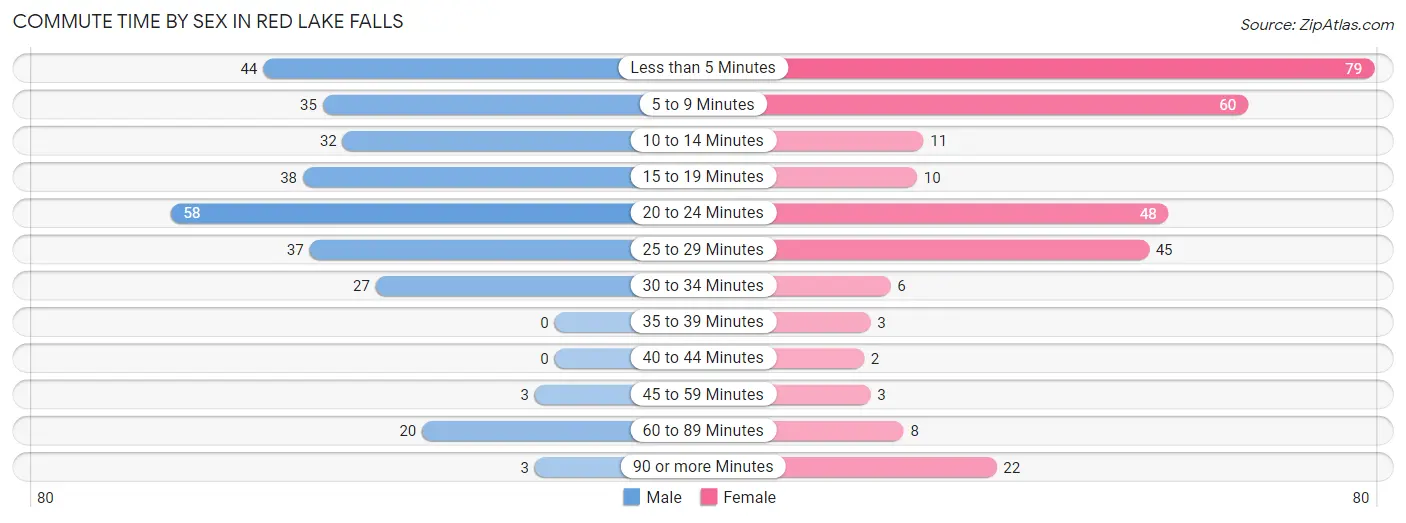
| Commute Time | Male | Female |
| Less than 5 Minutes | 44 (14.8%) | 79 (26.6%) |
| 5 to 9 Minutes | 35 (11.8%) | 60 (20.2%) |
| 10 to 14 Minutes | 32 (10.8%) | 11 (3.7%) |
| 15 to 19 Minutes | 38 (12.8%) | 10 (3.4%) |
| 20 to 24 Minutes | 58 (19.5%) | 48 (16.2%) |
| 25 to 29 Minutes | 37 (12.5%) | 45 (15.1%) |
| 30 to 34 Minutes | 27 (9.1%) | 6 (2.0%) |
| 35 to 39 Minutes | 0 (0.0%) | 3 (1.0%) |
| 40 to 44 Minutes | 0 (0.0%) | 2 (0.7%) |
| 45 to 59 Minutes | 3 (1.0%) | 3 (1.0%) |
| 60 to 89 Minutes | 20 (6.7%) | 8 (2.7%) |
| 90 or more Minutes | 3 (1.0%) | 22 (7.4%) |
Time of Departure to Work by Sex in Red Lake Falls
The most frequent times of departure to work in Red Lake Falls are 6:30 AM to 6:59 AM (71, 23.9%) for males and 7:30 AM to 7:59 AM (68, 22.9%) for females.
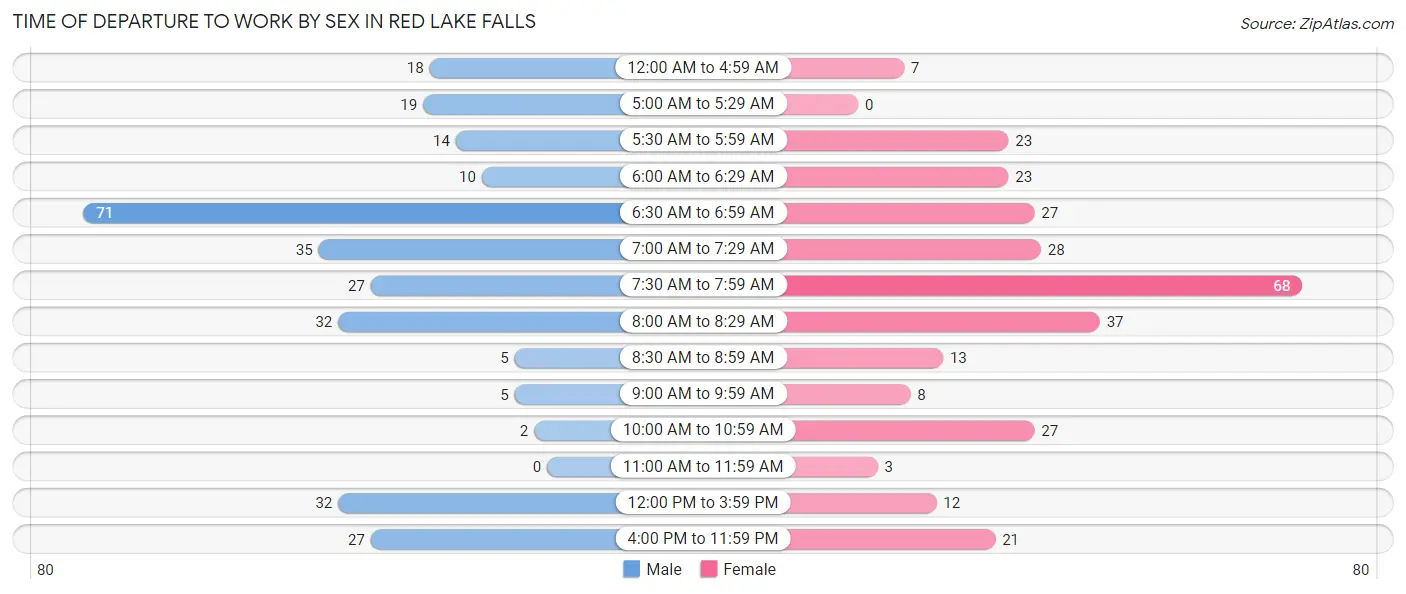
| Time of Departure | Male | Female |
| 12:00 AM to 4:59 AM | 18 (6.1%) | 7 (2.4%) |
| 5:00 AM to 5:29 AM | 19 (6.4%) | 0 (0.0%) |
| 5:30 AM to 5:59 AM | 14 (4.7%) | 23 (7.7%) |
| 6:00 AM to 6:29 AM | 10 (3.4%) | 23 (7.7%) |
| 6:30 AM to 6:59 AM | 71 (23.9%) | 27 (9.1%) |
| 7:00 AM to 7:29 AM | 35 (11.8%) | 28 (9.4%) |
| 7:30 AM to 7:59 AM | 27 (9.1%) | 68 (22.9%) |
| 8:00 AM to 8:29 AM | 32 (10.8%) | 37 (12.5%) |
| 8:30 AM to 8:59 AM | 5 (1.7%) | 13 (4.4%) |
| 9:00 AM to 9:59 AM | 5 (1.7%) | 8 (2.7%) |
| 10:00 AM to 10:59 AM | 2 (0.7%) | 27 (9.1%) |
| 11:00 AM to 11:59 AM | 0 (0.0%) | 3 (1.0%) |
| 12:00 PM to 3:59 PM | 32 (10.8%) | 12 (4.0%) |
| 4:00 PM to 11:59 PM | 27 (9.1%) | 21 (7.1%) |
| Total | 297 (100.0%) | 297 (100.0%) |
Housing Occupancy in Red Lake Falls
Occupancy by Ownership in Red Lake Falls
Of the total 561 dwellings in Red Lake Falls, owner-occupied units account for 432 (77.0%), while renter-occupied units make up 129 (23.0%).
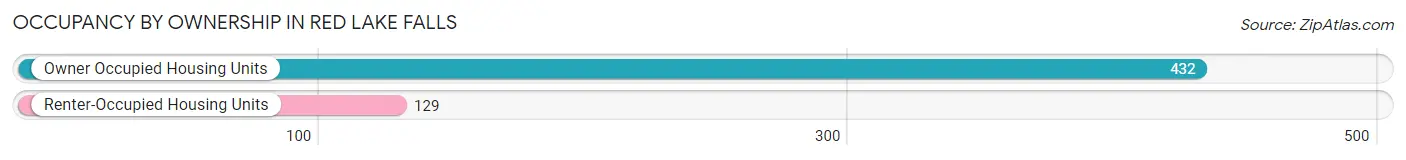
| Occupancy | # Housing Units | % Housing Units |
| Owner Occupied Housing Units | 432 | 77.0% |
| Renter-Occupied Housing Units | 129 | 23.0% |
| Total Occupied Housing Units | 561 | 100.0% |
Occupancy by Household Size in Red Lake Falls
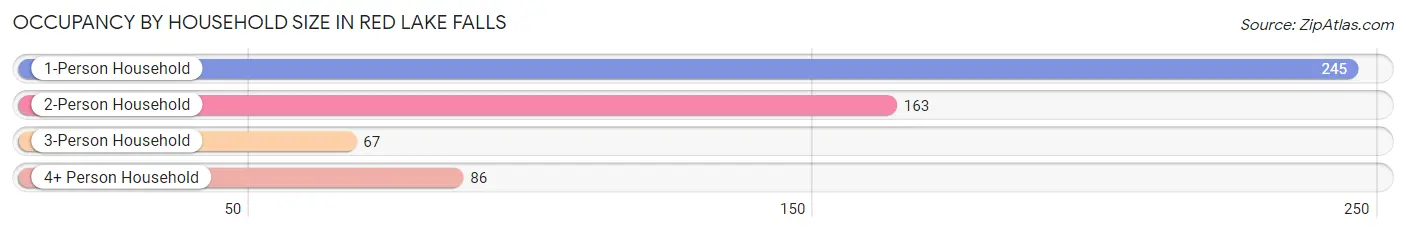
| Household Size | # Housing Units | % Housing Units |
| 1-Person Household | 245 | 43.7% |
| 2-Person Household | 163 | 29.1% |
| 3-Person Household | 67 | 11.9% |
| 4+ Person Household | 86 | 15.3% |
| Total Housing Units | 561 | 100.0% |
Occupancy by Ownership by Household Size in Red Lake Falls
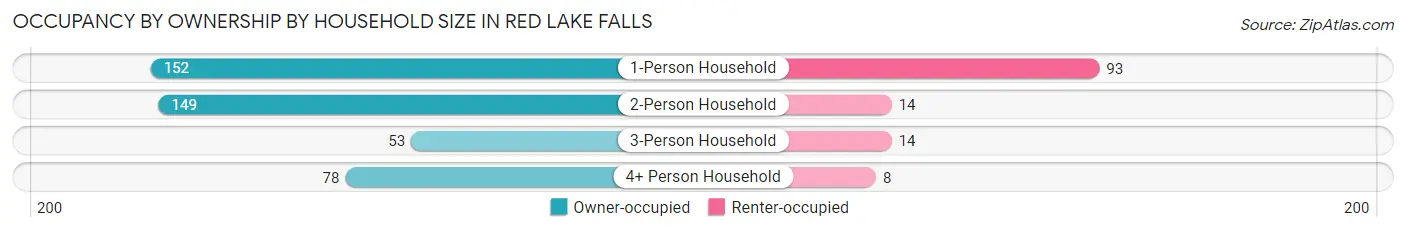
| Household Size | Owner-occupied | Renter-occupied |
| 1-Person Household | 152 (62.0%) | 93 (38.0%) |
| 2-Person Household | 149 (91.4%) | 14 (8.6%) |
| 3-Person Household | 53 (79.1%) | 14 (20.9%) |
| 4+ Person Household | 78 (90.7%) | 8 (9.3%) |
| Total Housing Units | 432 (77.0%) | 129 (23.0%) |
Occupancy by Educational Attainment in Red Lake Falls
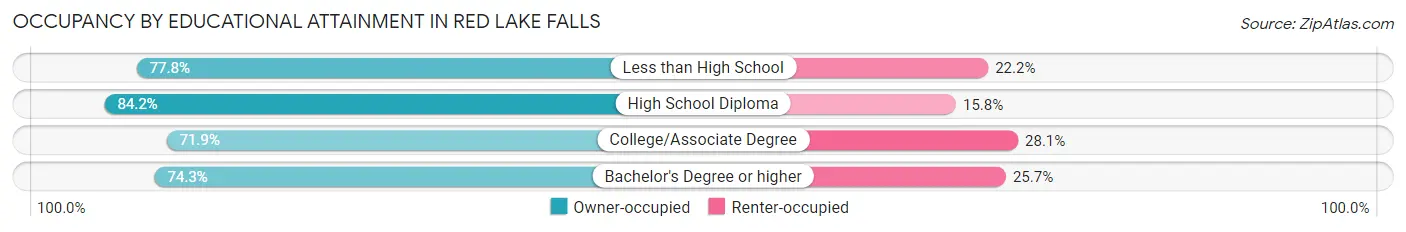
| Household Size | Owner-occupied | Renter-occupied |
| Less than High School | 21 (77.8%) | 6 (22.2%) |
| High School Diploma | 170 (84.2%) | 32 (15.8%) |
| College/Associate Degree | 166 (71.9%) | 65 (28.1%) |
| Bachelor's Degree or higher | 75 (74.3%) | 26 (25.7%) |
Occupancy by Age of Householder in Red Lake Falls
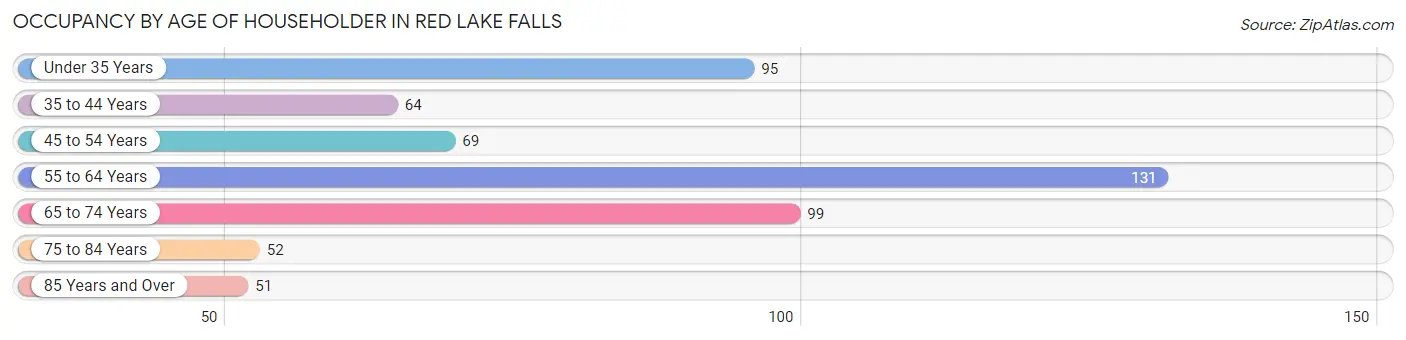
| Age Bracket | # Households | % Households |
| Under 35 Years | 95 | 16.9% |
| 35 to 44 Years | 64 | 11.4% |
| 45 to 54 Years | 69 | 12.3% |
| 55 to 64 Years | 131 | 23.4% |
| 65 to 74 Years | 99 | 17.6% |
| 75 to 84 Years | 52 | 9.3% |
| 85 Years and Over | 51 | 9.1% |
| Total | 561 | 100.0% |
Housing Finances in Red Lake Falls
Median Income by Occupancy in Red Lake Falls
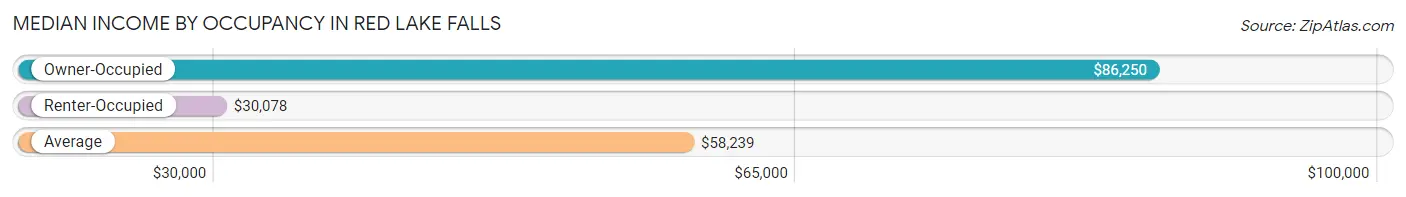
| Occupancy Type | # Households | Median Income |
| Owner-Occupied | 432 (77.0%) | $86,250 |
| Renter-Occupied | 129 (23.0%) | $30,078 |
| Average | 561 (100.0%) | $58,239 |
Occupancy by Householder Income Bracket in Red Lake Falls
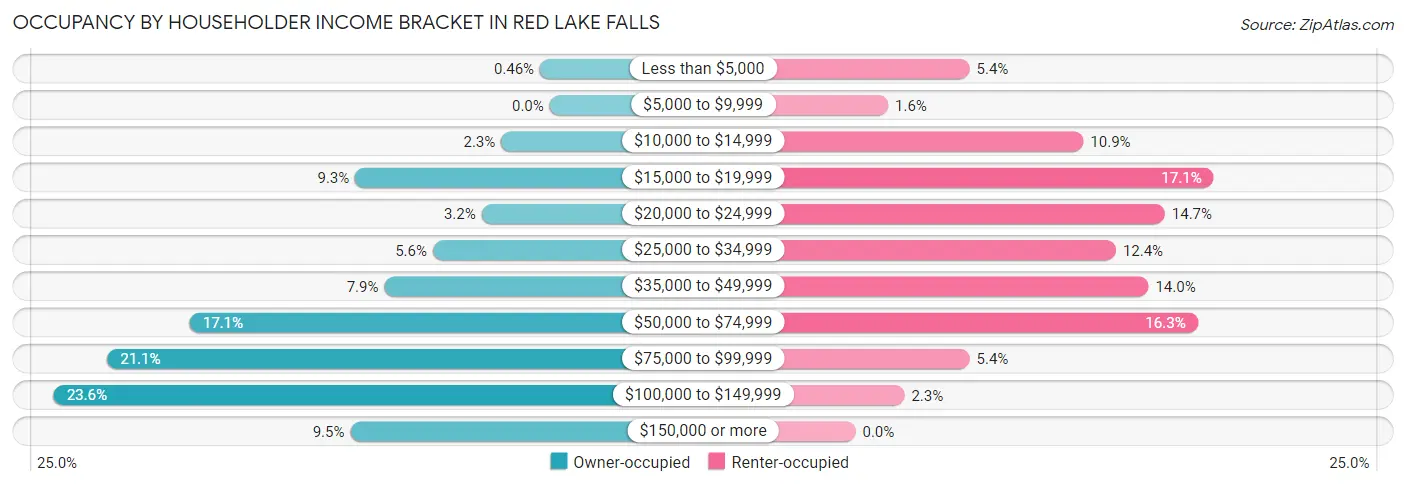
| Income Bracket | Owner-occupied | Renter-occupied |
| Less than $5,000 | 2 (0.5%) | 7 (5.4%) |
| $5,000 to $9,999 | 0 (0.0%) | 2 (1.5%) |
| $10,000 to $14,999 | 10 (2.3%) | 14 (10.8%) |
| $15,000 to $19,999 | 40 (9.3%) | 22 (17.1%) |
| $20,000 to $24,999 | 14 (3.2%) | 19 (14.7%) |
| $25,000 to $34,999 | 24 (5.6%) | 16 (12.4%) |
| $35,000 to $49,999 | 34 (7.9%) | 18 (14.0%) |
| $50,000 to $74,999 | 74 (17.1%) | 21 (16.3%) |
| $75,000 to $99,999 | 91 (21.1%) | 7 (5.4%) |
| $100,000 to $149,999 | 102 (23.6%) | 3 (2.3%) |
| $150,000 or more | 41 (9.5%) | 0 (0.0%) |
| Total | 432 (100.0%) | 129 (100.0%) |
Monthly Housing Cost Tiers in Red Lake Falls
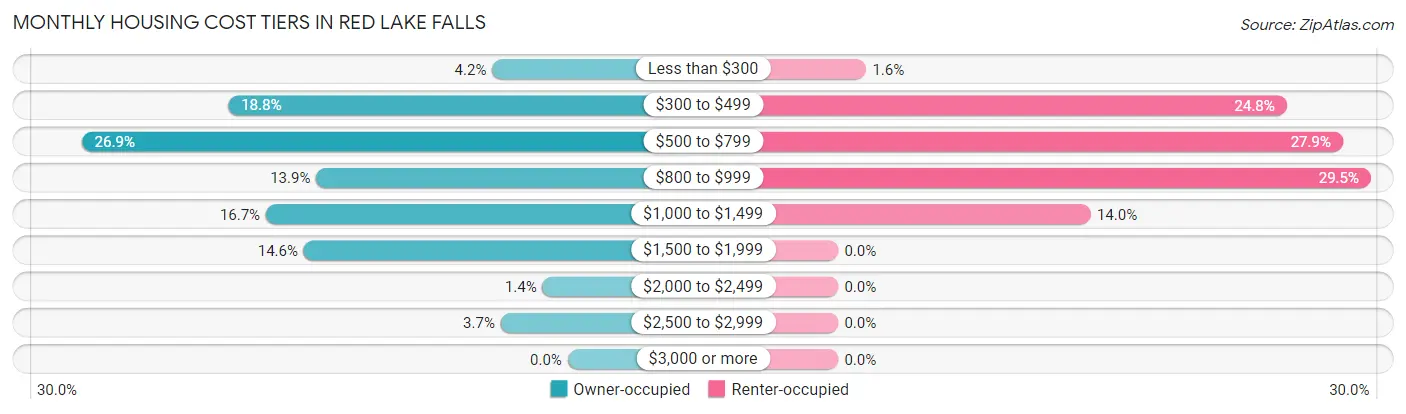
| Monthly Cost | Owner-occupied | Renter-occupied |
| Less than $300 | 18 (4.2%) | 2 (1.5%) |
| $300 to $499 | 81 (18.8%) | 32 (24.8%) |
| $500 to $799 | 116 (26.9%) | 36 (27.9%) |
| $800 to $999 | 60 (13.9%) | 38 (29.5%) |
| $1,000 to $1,499 | 72 (16.7%) | 18 (14.0%) |
| $1,500 to $1,999 | 63 (14.6%) | 0 (0.0%) |
| $2,000 to $2,499 | 6 (1.4%) | 0 (0.0%) |
| $2,500 to $2,999 | 16 (3.7%) | 0 (0.0%) |
| $3,000 or more | 0 (0.0%) | 0 (0.0%) |
| Total | 432 (100.0%) | 129 (100.0%) |
Physical Housing Characteristics in Red Lake Falls
Housing Structures in Red Lake Falls
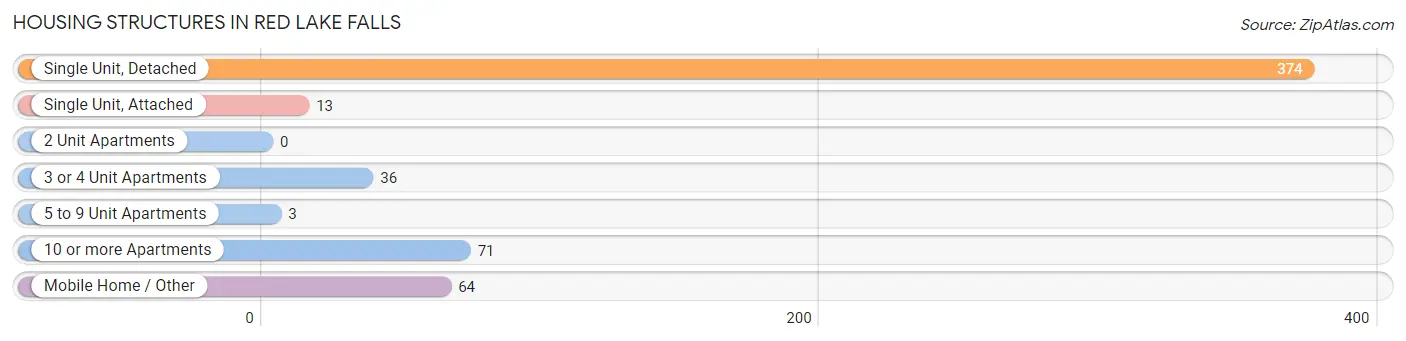
| Structure Type | # Housing Units | % Housing Units |
| Single Unit, Detached | 374 | 66.7% |
| Single Unit, Attached | 13 | 2.3% |
| 2 Unit Apartments | 0 | 0.0% |
| 3 or 4 Unit Apartments | 36 | 6.4% |
| 5 to 9 Unit Apartments | 3 | 0.5% |
| 10 or more Apartments | 71 | 12.7% |
| Mobile Home / Other | 64 | 11.4% |
| Total | 561 | 100.0% |
Housing Structures by Occupancy in Red Lake Falls
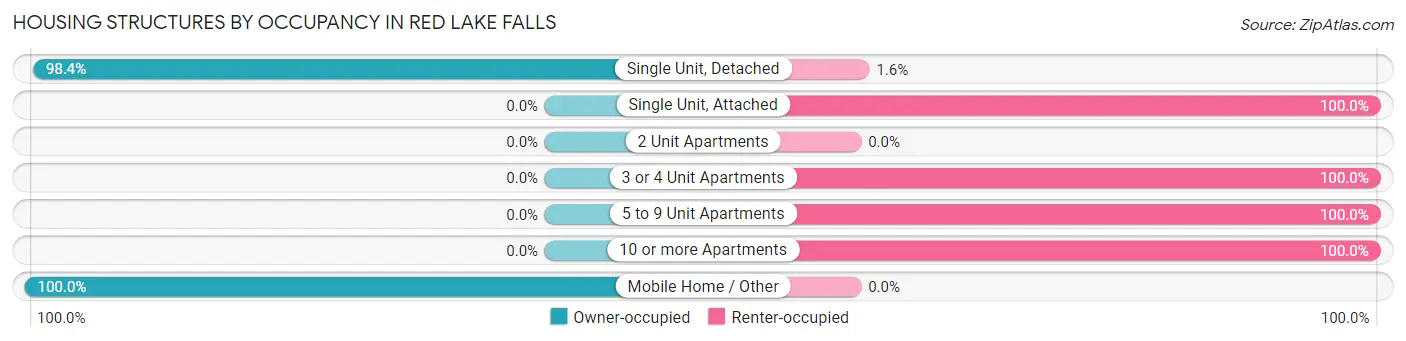
| Structure Type | Owner-occupied | Renter-occupied |
| Single Unit, Detached | 368 (98.4%) | 6 (1.6%) |
| Single Unit, Attached | 0 (0.0%) | 13 (100.0%) |
| 2 Unit Apartments | 0 (0.0%) | 0 (0.0%) |
| 3 or 4 Unit Apartments | 0 (0.0%) | 36 (100.0%) |
| 5 to 9 Unit Apartments | 0 (0.0%) | 3 (100.0%) |
| 10 or more Apartments | 0 (0.0%) | 71 (100.0%) |
| Mobile Home / Other | 64 (100.0%) | 0 (0.0%) |
| Total | 432 (77.0%) | 129 (23.0%) |
Housing Structures by Number of Rooms in Red Lake Falls
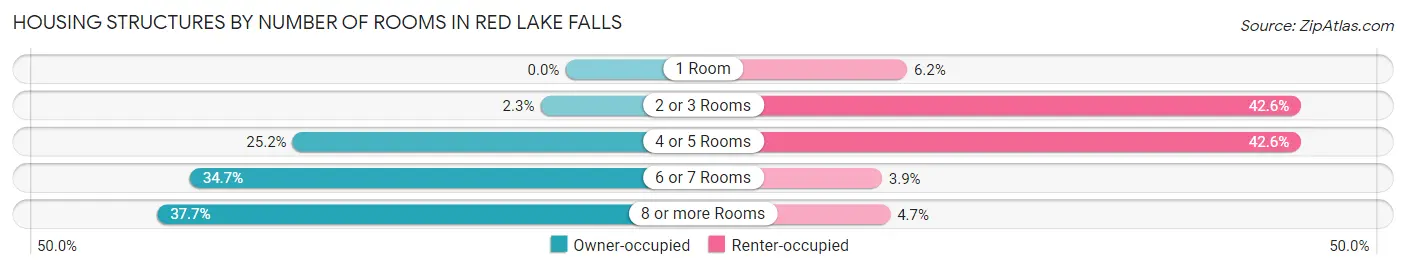
| Number of Rooms | Owner-occupied | Renter-occupied |
| 1 Room | 0 (0.0%) | 8 (6.2%) |
| 2 or 3 Rooms | 10 (2.3%) | 55 (42.6%) |
| 4 or 5 Rooms | 109 (25.2%) | 55 (42.6%) |
| 6 or 7 Rooms | 150 (34.7%) | 5 (3.9%) |
| 8 or more Rooms | 163 (37.7%) | 6 (4.6%) |
| Total | 432 (100.0%) | 129 (100.0%) |
Housing Structure by Heating Type in Red Lake Falls
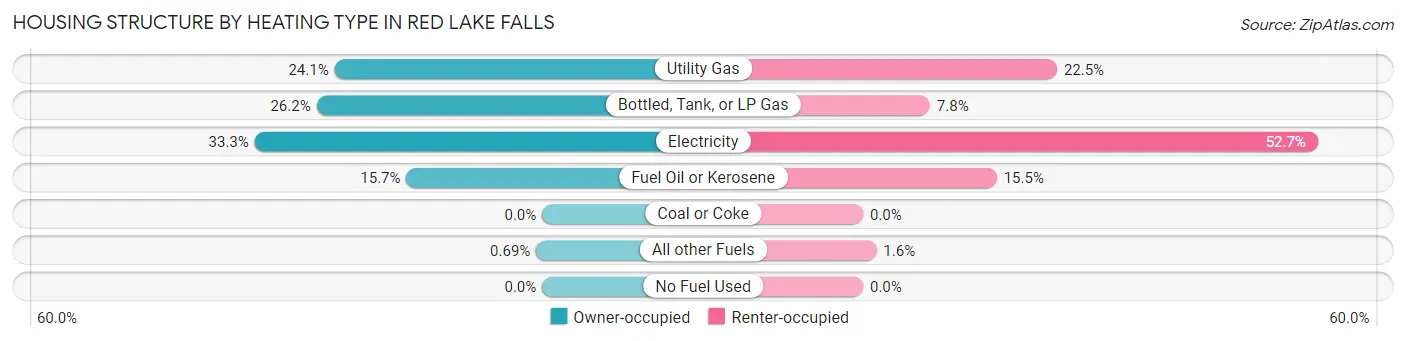
| Heating Type | Owner-occupied | Renter-occupied |
| Utility Gas | 104 (24.1%) | 29 (22.5%) |
| Bottled, Tank, or LP Gas | 113 (26.2%) | 10 (7.7%) |
| Electricity | 144 (33.3%) | 68 (52.7%) |
| Fuel Oil or Kerosene | 68 (15.7%) | 20 (15.5%) |
| Coal or Coke | 0 (0.0%) | 0 (0.0%) |
| All other Fuels | 3 (0.7%) | 2 (1.5%) |
| No Fuel Used | 0 (0.0%) | 0 (0.0%) |
| Total | 432 (100.0%) | 129 (100.0%) |
Household Vehicle Usage in Red Lake Falls
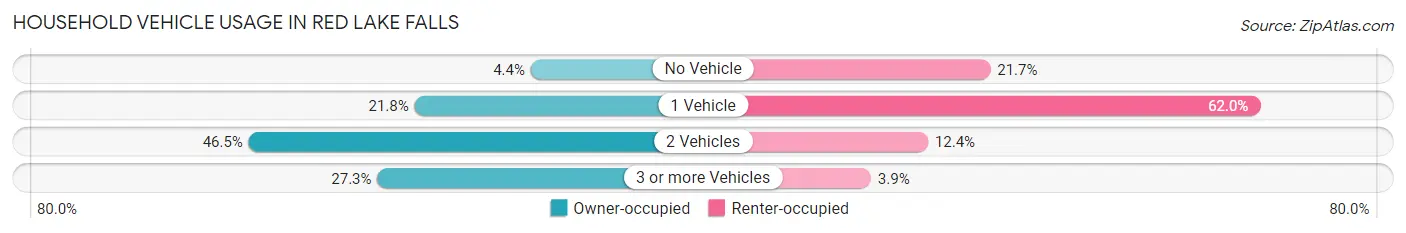
| Vehicles per Household | Owner-occupied | Renter-occupied |
| No Vehicle | 19 (4.4%) | 28 (21.7%) |
| 1 Vehicle | 94 (21.8%) | 80 (62.0%) |
| 2 Vehicles | 201 (46.5%) | 16 (12.4%) |
| 3 or more Vehicles | 118 (27.3%) | 5 (3.9%) |
| Total | 432 (100.0%) | 129 (100.0%) |
Real Estate & Mortgages in Red Lake Falls
Real Estate and Mortgage Overview in Red Lake Falls
| Characteristic | Without Mortgage | With Mortgage |
| Housing Units | 233 | 199 |
| Median Property Value | $109,400 | $128,800 |
| Median Household Income | $55,764 | $22 |
| Monthly Housing Costs | $545 | $0 |
| Real Estate Taxes | $1,891 | $2 |
Property Value by Mortgage Status in Red Lake Falls
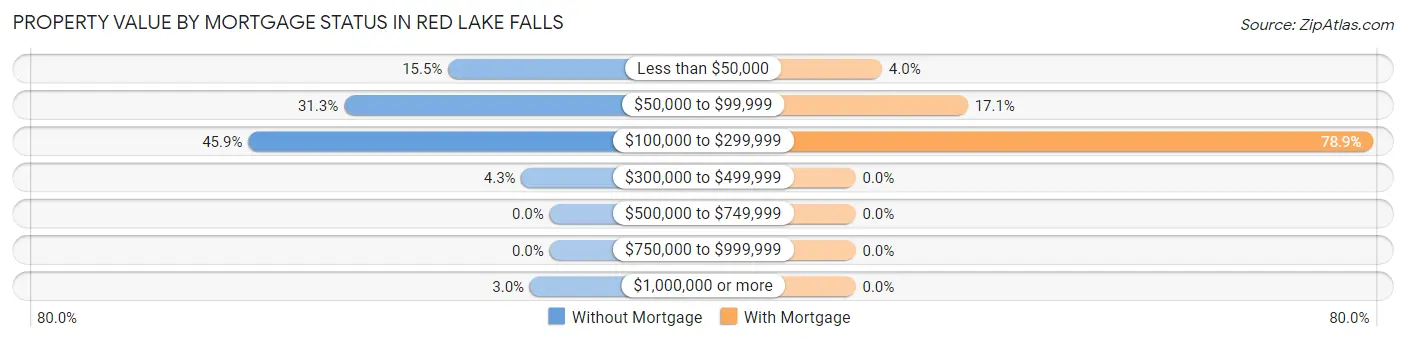
| Property Value | Without Mortgage | With Mortgage |
| Less than $50,000 | 36 (15.4%) | 8 (4.0%) |
| $50,000 to $99,999 | 73 (31.3%) | 34 (17.1%) |
| $100,000 to $299,999 | 107 (45.9%) | 157 (78.9%) |
| $300,000 to $499,999 | 10 (4.3%) | 0 (0.0%) |
| $500,000 to $749,999 | 0 (0.0%) | 0 (0.0%) |
| $750,000 to $999,999 | 0 (0.0%) | 0 (0.0%) |
| $1,000,000 or more | 7 (3.0%) | 0 (0.0%) |
| Total | 233 (100.0%) | 199 (100.0%) |
Household Income by Mortgage Status in Red Lake Falls
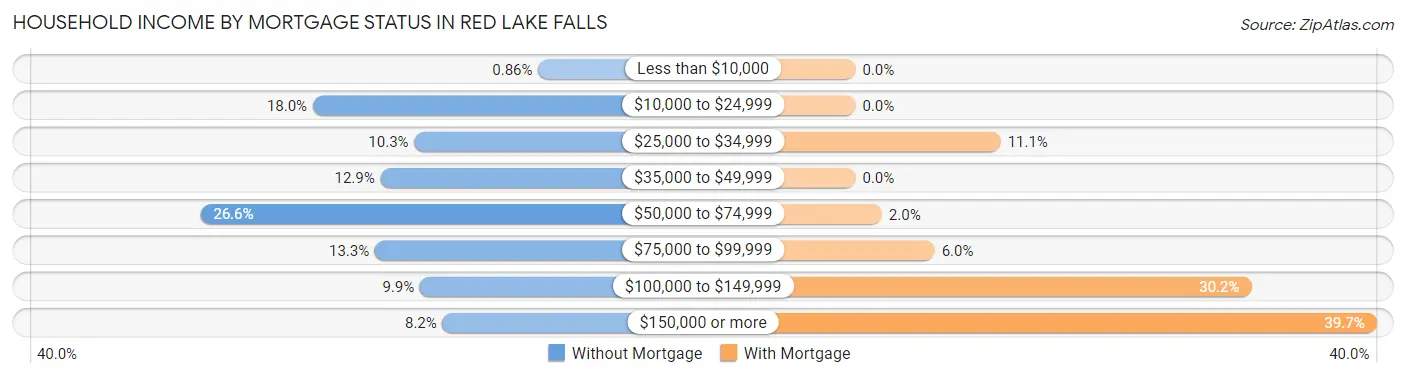
| Household Income | Without Mortgage | With Mortgage |
| Less than $10,000 | 2 (0.9%) | 0 (0.0%) |
| $10,000 to $24,999 | 42 (18.0%) | 0 (0.0%) |
| $25,000 to $34,999 | 24 (10.3%) | 22 (11.1%) |
| $35,000 to $49,999 | 30 (12.9%) | 0 (0.0%) |
| $50,000 to $74,999 | 62 (26.6%) | 4 (2.0%) |
| $75,000 to $99,999 | 31 (13.3%) | 12 (6.0%) |
| $100,000 to $149,999 | 23 (9.9%) | 60 (30.1%) |
| $150,000 or more | 19 (8.2%) | 79 (39.7%) |
| Total | 233 (100.0%) | 199 (100.0%) |
Property Value to Household Income Ratio in Red Lake Falls
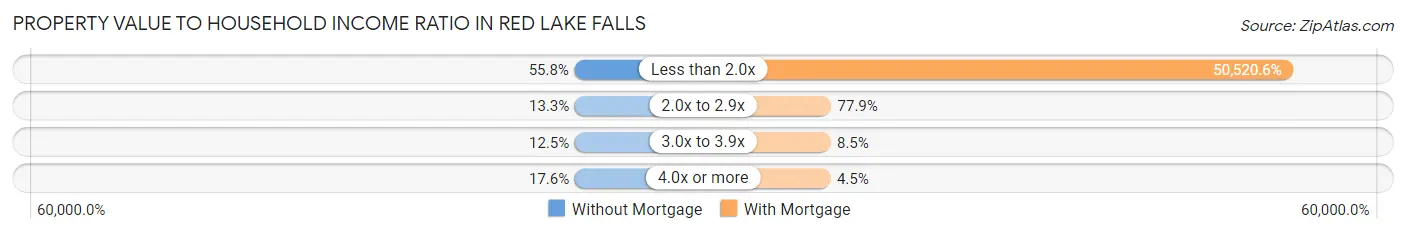
| Value-to-Income Ratio | Without Mortgage | With Mortgage |
| Less than 2.0x | 130 (55.8%) | 100,536 (50,520.6%) |
| 2.0x to 2.9x | 31 (13.3%) | 155 (77.9%) |
| 3.0x to 3.9x | 29 (12.4%) | 17 (8.5%) |
| 4.0x or more | 41 (17.6%) | 9 (4.5%) |
| Total | 233 (100.0%) | 199 (100.0%) |
Real Estate Taxes by Mortgage Status in Red Lake Falls
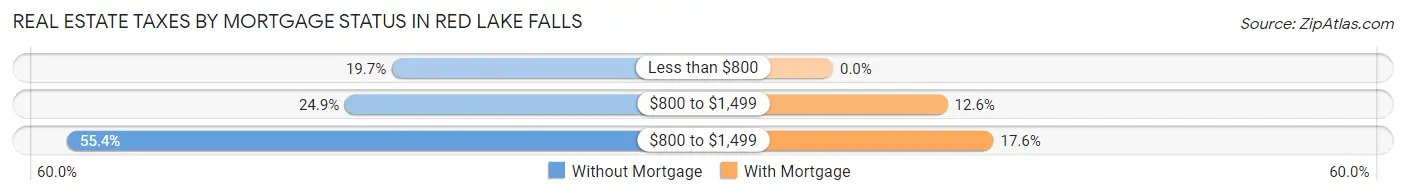
| Property Taxes | Without Mortgage | With Mortgage |
| Less than $800 | 46 (19.7%) | 0 (0.0%) |
| $800 to $1,499 | 58 (24.9%) | 25 (12.6%) |
| $800 to $1,499 | 129 (55.4%) | 35 (17.6%) |
| Total | 233 (100.0%) | 199 (100.0%) |
Health & Disability in Red Lake Falls
Health Insurance Coverage by Age in Red Lake Falls
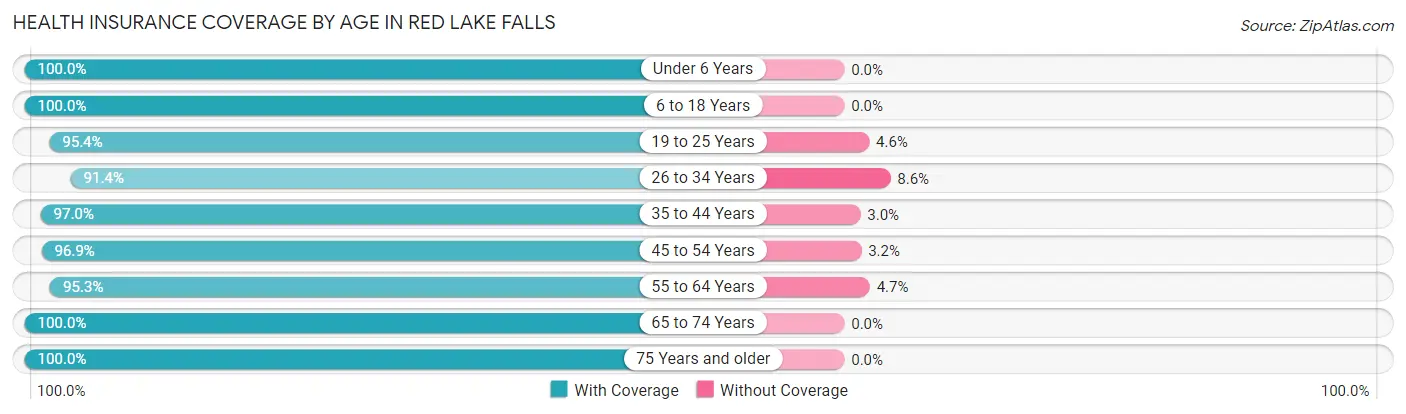
| Age Bracket | With Coverage | Without Coverage |
| Under 6 Years | 94 (100.0%) | 0 (0.0%) |
| 6 to 18 Years | 230 (100.0%) | 0 (0.0%) |
| 19 to 25 Years | 62 (95.4%) | 3 (4.6%) |
| 26 to 34 Years | 117 (91.4%) | 11 (8.6%) |
| 35 to 44 Years | 130 (97.0%) | 4 (3.0%) |
| 45 to 54 Years | 123 (96.9%) | 4 (3.2%) |
| 55 to 64 Years | 201 (95.3%) | 10 (4.7%) |
| 65 to 74 Years | 162 (100.0%) | 0 (0.0%) |
| 75 Years and older | 131 (100.0%) | 0 (0.0%) |
| Total | 1,250 (97.5%) | 32 (2.5%) |
Health Insurance Coverage by Citizenship Status in Red Lake Falls
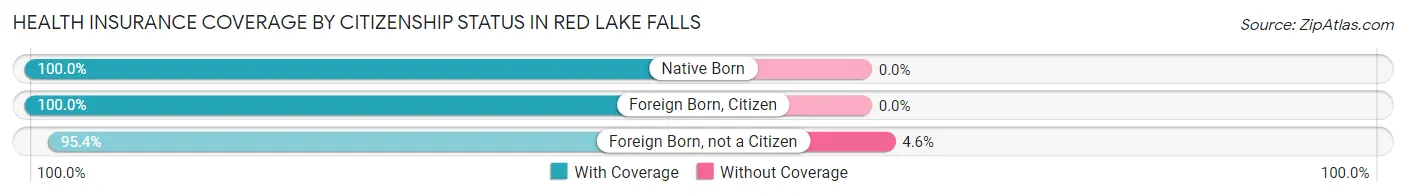
| Citizenship Status | With Coverage | Without Coverage |
| Native Born | 94 (100.0%) | 0 (0.0%) |
| Foreign Born, Citizen | 230 (100.0%) | 0 (0.0%) |
| Foreign Born, not a Citizen | 62 (95.4%) | 3 (4.6%) |
Health Insurance Coverage by Household Income in Red Lake Falls
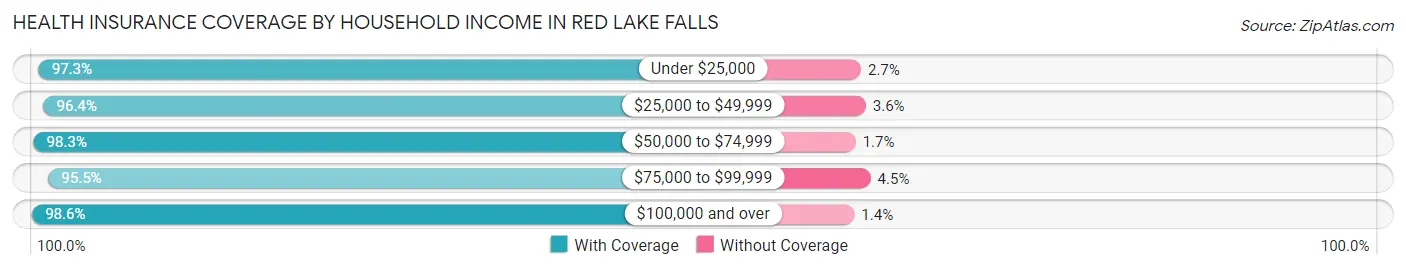
| Household Income | With Coverage | Without Coverage |
| Under $25,000 | 146 (97.3%) | 4 (2.7%) |
| $25,000 to $49,999 | 135 (96.4%) | 5 (3.6%) |
| $50,000 to $74,999 | 177 (98.3%) | 3 (1.7%) |
| $75,000 to $99,999 | 278 (95.5%) | 13 (4.5%) |
| $100,000 and over | 481 (98.6%) | 7 (1.4%) |
Public vs Private Health Insurance Coverage by Age in Red Lake Falls
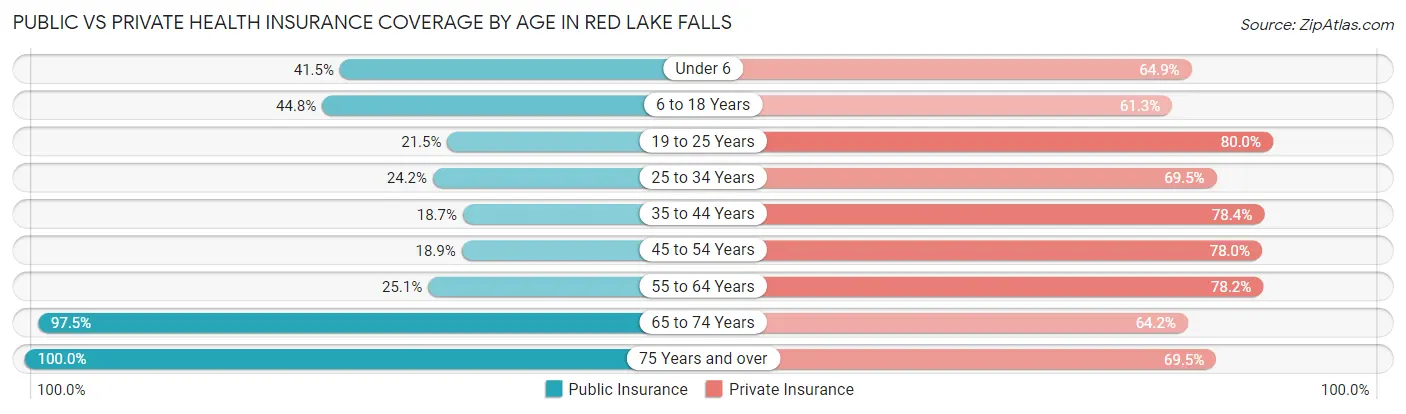
| Age Bracket | Public Insurance | Private Insurance |
| Under 6 | 39 (41.5%) | 61 (64.9%) |
| 6 to 18 Years | 103 (44.8%) | 141 (61.3%) |
| 19 to 25 Years | 14 (21.5%) | 52 (80.0%) |
| 25 to 34 Years | 31 (24.2%) | 89 (69.5%) |
| 35 to 44 Years | 25 (18.7%) | 105 (78.4%) |
| 45 to 54 Years | 24 (18.9%) | 99 (77.9%) |
| 55 to 64 Years | 53 (25.1%) | 165 (78.2%) |
| 65 to 74 Years | 158 (97.5%) | 104 (64.2%) |
| 75 Years and over | 131 (100.0%) | 91 (69.5%) |
| Total | 578 (45.1%) | 907 (70.8%) |
Disability Status by Sex by Age in Red Lake Falls
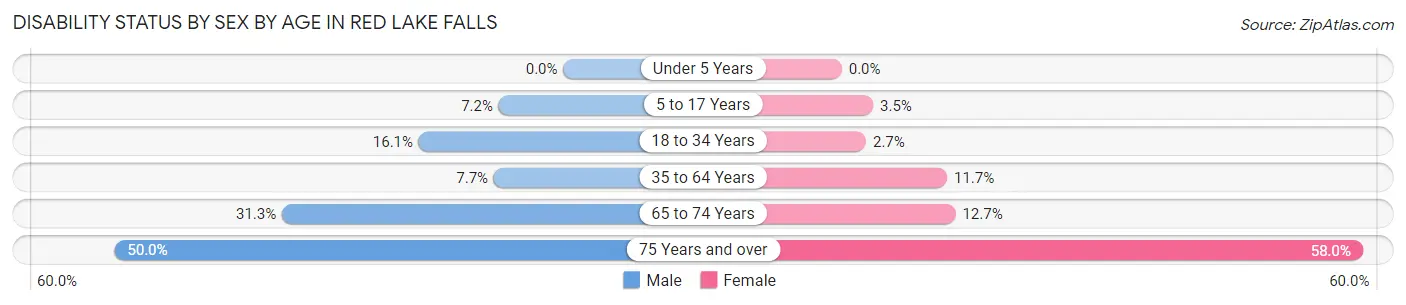
| Age Bracket | Male | Female |
| Under 5 Years | 0 (0.0%) | 0 (0.0%) |
| 5 to 17 Years | 11 (7.2%) | 3 (3.5%) |
| 18 to 34 Years | 14 (16.1%) | 3 (2.7%) |
| 35 to 64 Years | 18 (7.7%) | 28 (11.7%) |
| 65 to 74 Years | 26 (31.3%) | 10 (12.7%) |
| 75 Years and over | 25 (50.0%) | 47 (58.0%) |
Disability Class by Sex by Age in Red Lake Falls
Disability Class: Hearing Difficulty
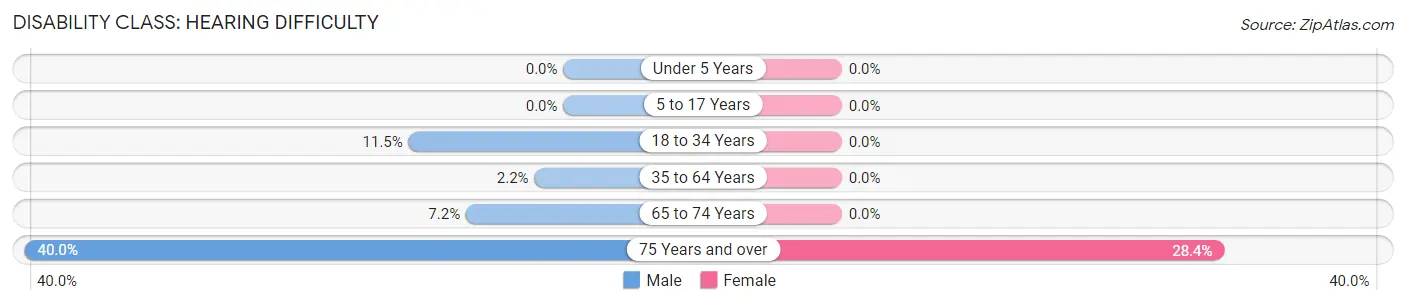
| Age Bracket | Male | Female |
| Under 5 Years | 0 (0.0%) | 0 (0.0%) |
| 5 to 17 Years | 0 (0.0%) | 0 (0.0%) |
| 18 to 34 Years | 10 (11.5%) | 0 (0.0%) |
| 35 to 64 Years | 5 (2.1%) | 0 (0.0%) |
| 65 to 74 Years | 6 (7.2%) | 0 (0.0%) |
| 75 Years and over | 20 (40.0%) | 23 (28.4%) |
Disability Class: Vision Difficulty
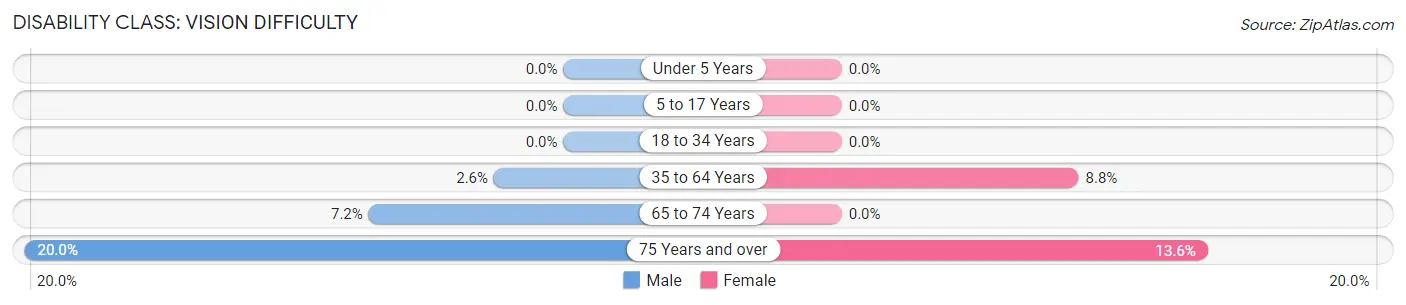
| Age Bracket | Male | Female |
| Under 5 Years | 0 (0.0%) | 0 (0.0%) |
| 5 to 17 Years | 0 (0.0%) | 0 (0.0%) |
| 18 to 34 Years | 0 (0.0%) | 0 (0.0%) |
| 35 to 64 Years | 6 (2.6%) | 21 (8.8%) |
| 65 to 74 Years | 6 (7.2%) | 0 (0.0%) |
| 75 Years and over | 10 (20.0%) | 11 (13.6%) |
Disability Class: Cognitive Difficulty
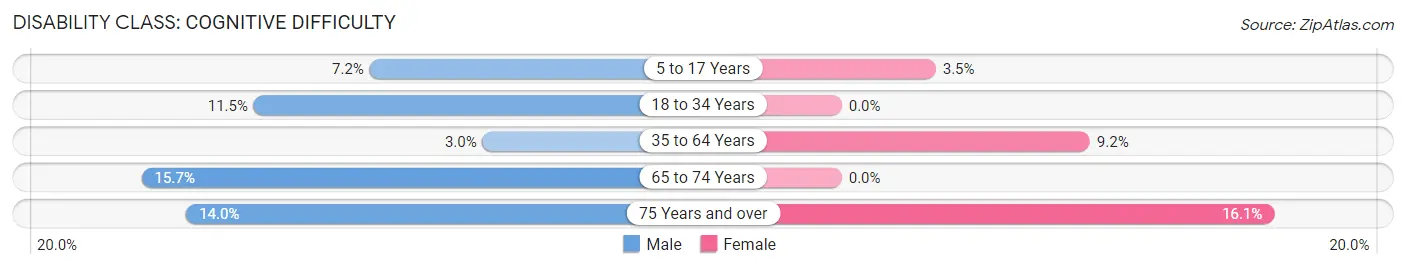
| Age Bracket | Male | Female |
| 5 to 17 Years | 11 (7.2%) | 3 (3.5%) |
| 18 to 34 Years | 10 (11.5%) | 0 (0.0%) |
| 35 to 64 Years | 7 (3.0%) | 22 (9.2%) |
| 65 to 74 Years | 13 (15.7%) | 0 (0.0%) |
| 75 Years and over | 7 (14.0%) | 13 (16.1%) |
Disability Class: Ambulatory Difficulty
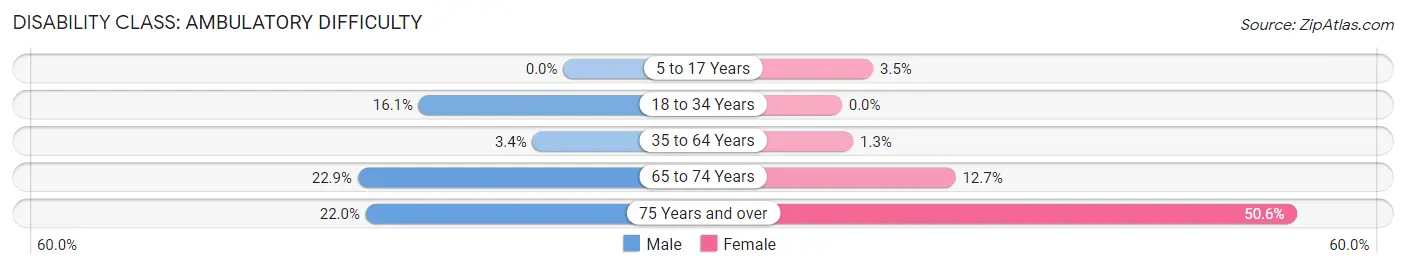
| Age Bracket | Male | Female |
| 5 to 17 Years | 0 (0.0%) | 3 (3.5%) |
| 18 to 34 Years | 14 (16.1%) | 0 (0.0%) |
| 35 to 64 Years | 8 (3.4%) | 3 (1.3%) |
| 65 to 74 Years | 19 (22.9%) | 10 (12.7%) |
| 75 Years and over | 11 (22.0%) | 41 (50.6%) |
Disability Class: Self-Care Difficulty
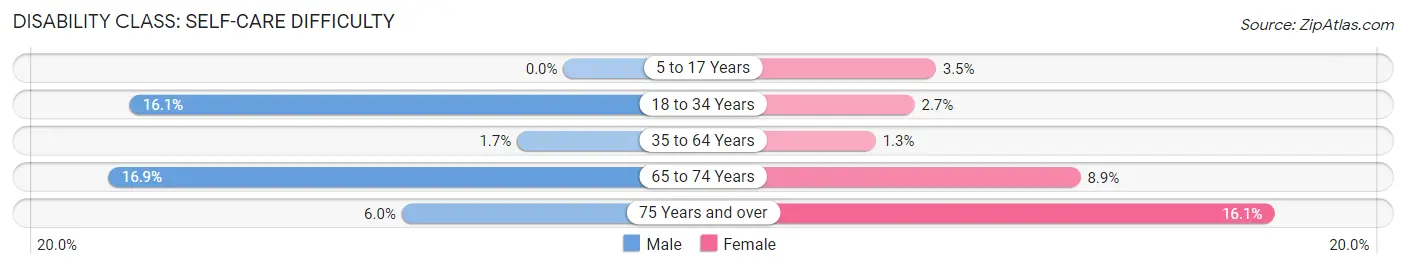
| Age Bracket | Male | Female |
| 5 to 17 Years | 0 (0.0%) | 3 (3.5%) |
| 18 to 34 Years | 14 (16.1%) | 3 (2.7%) |
| 35 to 64 Years | 4 (1.7%) | 3 (1.3%) |
| 65 to 74 Years | 14 (16.9%) | 7 (8.9%) |
| 75 Years and over | 3 (6.0%) | 13 (16.1%) |
Technology Access in Red Lake Falls
Computing Device Access in Red Lake Falls
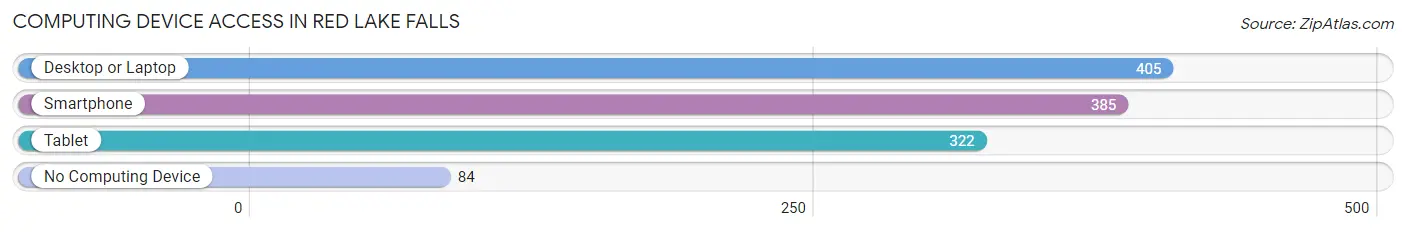
| Device Type | # Households | % Households |
| Desktop or Laptop | 405 | 72.2% |
| Smartphone | 385 | 68.6% |
| Tablet | 322 | 57.4% |
| No Computing Device | 84 | 15.0% |
| Total | 561 | 100.0% |
Internet Access in Red Lake Falls
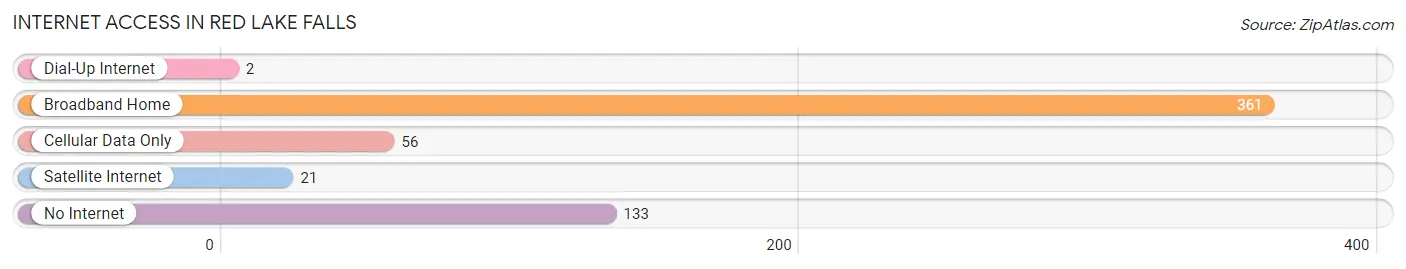
| Internet Type | # Households | % Households |
| Dial-Up Internet | 2 | 0.4% |
| Broadband Home | 361 | 64.3% |
| Cellular Data Only | 56 | 10.0% |
| Satellite Internet | 21 | 3.7% |
| No Internet | 133 | 23.7% |
| Total | 561 | 100.0% |
Red Lake Falls Summary
Red Lake Falls is a city located in northwestern Minnesota, United States. It is the county seat of Red Lake County and is situated along the Red Lake River. The city is located in the Red River Valley, a region of the Great Plains. As of the 2010 census, the population of Red Lake Falls was 1,427.
History
The area around Red Lake Falls was first settled in the late 1800s by European immigrants. The first settlers were mostly of German and Scandinavian descent. The city was officially incorporated in 1887.
The city was named after the nearby Red Lake River, which was named for the red clay found along its banks. The river was an important transportation route for the early settlers, who used it to transport goods and supplies.
The city grew rapidly in the late 19th and early 20th centuries, due to its location along the Great Northern Railway. The railway connected Red Lake Falls to other cities in the region, and allowed for the transportation of goods and supplies.
Geography
Red Lake Falls is located in northwestern Minnesota, in the Red River Valley. The city is situated along the Red Lake River, which flows through the city. The city is located in Red Lake County, and is bordered by the cities of Crookston, Thief River Falls, and East Grand Forks.
The city has a total area of 2.2 square miles, all of which is land. The city is located at an elevation of 1,072 feet above sea level.
Climate
Red Lake Falls has a humid continental climate, with cold winters and warm summers. The average temperature in the city is 34°F in January, and 73°F in July. The average annual precipitation is 22 inches.
Demographics
As of the 2010 census, the population of Red Lake Falls was 1,427. The racial makeup of the city was 97.3% White, 0.7% African American, 0.3% Native American, 0.2% Asian, 0.1% Pacific Islander, 0.3% from other races, and 1.2% from two or more races. Hispanic or Latino of any race were 1.2% of the population.
The median income for a household in the city was $37,917, and the median income for a family was $45,000. The per capita income for the city was $18,945. About 11.2% of families and 14.2% of the population were below the poverty line, including 19.2% of those under age 18 and 8.3% of those age 65 or over.
Economy
Red Lake Falls is a small city with a limited economy. The city is home to several small businesses, including a grocery store, a hardware store, and a few restaurants. The city is also home to a few manufacturing companies, including a wood products company and a plastics company.
The city is also home to a few agricultural businesses, including a dairy farm and a grain elevator. The city is also home to a few small farms, which produce corn, soybeans, and other crops.
The city is served by the Red Lake Falls Municipal Airport, which provides general aviation services. The city is also served by the Red Lake Falls Public Library, which provides access to books, magazines, and other media.
Common Questions
What is Per Capita Income in Red Lake Falls?
Per Capita income in Red Lake Falls is $33,521.
What is the Median Family Income in Red Lake Falls?
Median Family Income in Red Lake Falls is $92,054.
What is the Median Household income in Red Lake Falls?
Median Household Income in Red Lake Falls is $58,239.
What is Income or Wage Gap in Red Lake Falls?
Income or Wage Gap in Red Lake Falls is 19.7%.
Women in Red Lake Falls earn 80.3 cents for every dollar earned by a man.
What is Inequality or Gini Index in Red Lake Falls?
Inequality or Gini Index in Red Lake Falls is 0.39.
What is the Total Population of Red Lake Falls?
Total Population of Red Lake Falls is 1,288.
What is the Total Male Population of Red Lake Falls?
Total Male Population of Red Lake Falls is 651.
What is the Total Female Population of Red Lake Falls?
Total Female Population of Red Lake Falls is 637.
What is the Ratio of Males per 100 Females in Red Lake Falls?
There are 102.20 Males per 100 Females in Red Lake Falls.
What is the Ratio of Females per 100 Males in Red Lake Falls?
There are 97.85 Females per 100 Males in Red Lake Falls.
What is the Median Population Age in Red Lake Falls?
Median Population Age in Red Lake Falls is 44.1 Years.
What is the Average Family Size in Red Lake Falls
Average Family Size in Red Lake Falls is 3.1 People.
What is the Average Household Size in Red Lake Falls
Average Household Size in Red Lake Falls is 2.2 People.
How Large is the Labor Force in Red Lake Falls?
There are 659 People in the Labor Forcein in Red Lake Falls.
What is the Percentage of People in the Labor Force in Red Lake Falls?
67.0% of People are in the Labor Force in Red Lake Falls.
What is the Unemployment Rate in Red Lake Falls?
Unemployment Rate in Red Lake Falls is 0.8%.