Pine City, MN Map & Demographics
Pine City Map
Pine City Overview
$32,142
PER CAPITA INCOME
$74,958
AVG FAMILY INCOME
$49,336
AVG HOUSEHOLD INCOME
43.3%
WAGE / INCOME GAP [ % ]
56.7¢/ $1
WAGE / INCOME GAP [ $ ]
0.45
INEQUALITY / GINI INDEX
3,205
TOTAL POPULATION
1,525
MALE POPULATION
1,680
FEMALE POPULATION
90.77
MALES / 100 FEMALES
110.16
FEMALES / 100 MALES
42.8
MEDIAN AGE
3.0
AVG FAMILY SIZE
2.1
AVG HOUSEHOLD SIZE
1,486
LABOR FORCE [ PEOPLE ]
56.4%
PERCENT IN LABOR FORCE
4.9%
UNEMPLOYMENT RATE
Pine City Zip Codes
Pine City Area Codes
Income in Pine City
Income Overview in Pine City
Per Capita Income in Pine City is $32,142, while median incomes of families and households are $74,958 and $49,336 respectively.
| Characteristic | Number | Measure |
| Per Capita Income | 3,205 | $32,142 |
| Median Family Income | 733 | $74,958 |
| Mean Family Income | 733 | $91,883 |
| Median Household Income | 1,479 | $49,336 |
| Mean Household Income | 1,479 | $66,394 |
| Income Deficit | 733 | $0 |
| Wage / Income Gap (%) | 3,205 | 43.29% |
| Wage / Income Gap ($) | 3,205 | 56.71¢ per $1 |
| Gini / Inequality Index | 3,205 | 0.45 |
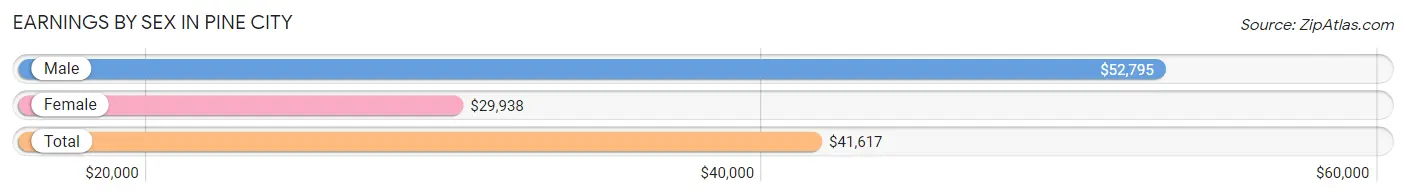
Earnings by Sex in Pine City
Average Earnings in Pine City are $41,617, $52,795 for men and $29,938 for women, a difference of 43.3%.
| Sex | Number | Average Earnings |
| Male | 723 (46.9%) | $52,795 |
| Female | 818 (53.1%) | $29,938 |
| Total | 1,541 (100.0%) | $41,617 |
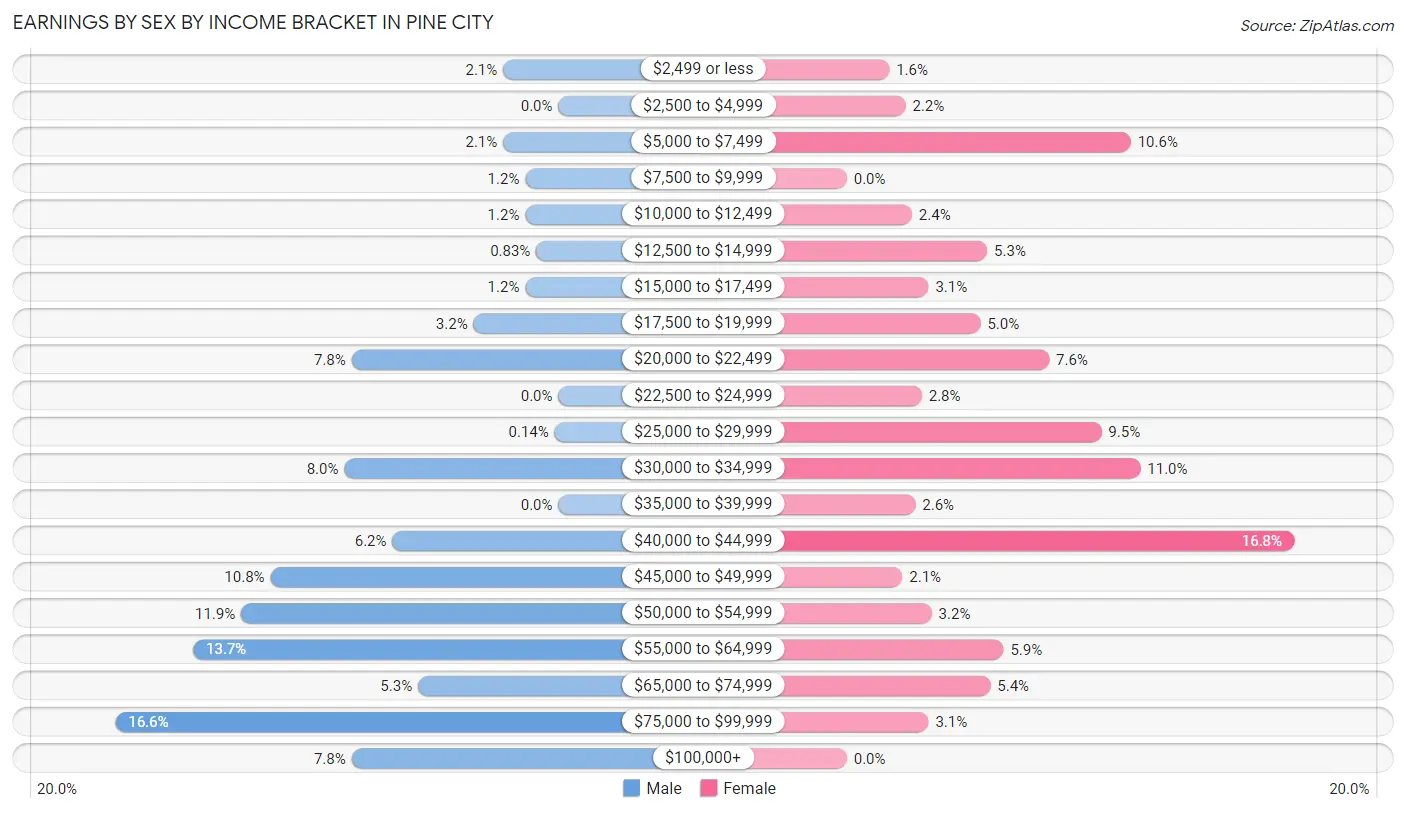
Earnings by Sex by Income Bracket in Pine City
The most common earnings brackets in Pine City are $75,000 to $99,999 for men (120 | 16.6%) and $40,000 to $44,999 for women (137 | 16.8%).
| Income | Male | Female |
| $2,499 or less | 15 (2.1%) | 13 (1.6%) |
| $2,500 to $4,999 | 0 (0.0%) | 18 (2.2%) |
| $5,000 to $7,499 | 15 (2.1%) | 87 (10.6%) |
| $7,500 to $9,999 | 9 (1.2%) | 0 (0.0%) |
| $10,000 to $12,499 | 9 (1.2%) | 20 (2.4%) |
| $12,500 to $14,999 | 6 (0.8%) | 43 (5.3%) |
| $15,000 to $17,499 | 9 (1.2%) | 25 (3.1%) |
| $17,500 to $19,999 | 23 (3.2%) | 41 (5.0%) |
| $20,000 to $22,499 | 56 (7.7%) | 62 (7.6%) |
| $22,500 to $24,999 | 0 (0.0%) | 23 (2.8%) |
| $25,000 to $29,999 | 1 (0.1%) | 78 (9.5%) |
| $30,000 to $34,999 | 58 (8.0%) | 90 (11.0%) |
| $35,000 to $39,999 | 0 (0.0%) | 21 (2.6%) |
| $40,000 to $44,999 | 45 (6.2%) | 137 (16.8%) |
| $45,000 to $49,999 | 78 (10.8%) | 17 (2.1%) |
| $50,000 to $54,999 | 86 (11.9%) | 26 (3.2%) |
| $55,000 to $64,999 | 99 (13.7%) | 48 (5.9%) |
| $65,000 to $74,999 | 38 (5.3%) | 44 (5.4%) |
| $75,000 to $99,999 | 120 (16.6%) | 25 (3.1%) |
| $100,000+ | 56 (7.7%) | 0 (0.0%) |
| Total | 723 (100.0%) | 818 (100.0%) |
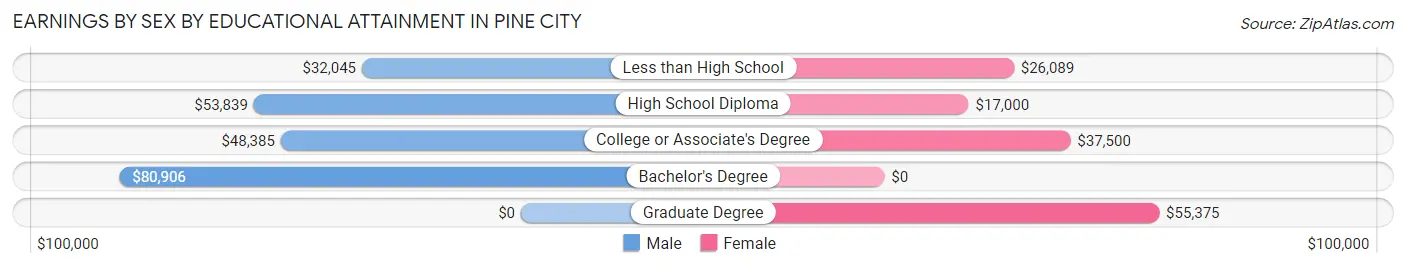
Earnings by Sex by Educational Attainment in Pine City
Average earnings in Pine City are $52,536 for men and $31,798 for women, a difference of 39.5%. Men with an educational attainment of bachelor's degree enjoy the highest average annual earnings of $80,906, while those with less than high school education earn the least with $32,045. Women with an educational attainment of graduate degree earn the most with the average annual earnings of $55,375, while those with high school diploma education have the smallest earnings of $17,000.
| Educational Attainment | Male Income | Female Income |
| Less than High School | $32,045 | $26,089 |
| High School Diploma | $53,839 | $17,000 |
| College or Associate's Degree | $48,385 | $37,500 |
| Bachelor's Degree | $80,906 | $0 |
| Graduate Degree | - | - |
| Total | $52,536 | $31,798 |
Family Income in Pine City
Family Income Brackets in Pine City
According to the Pine City family income data, there are 159 families falling into the $50,000 to $74,999 income range, which is the most common income bracket and makes up 21.7% of all families.
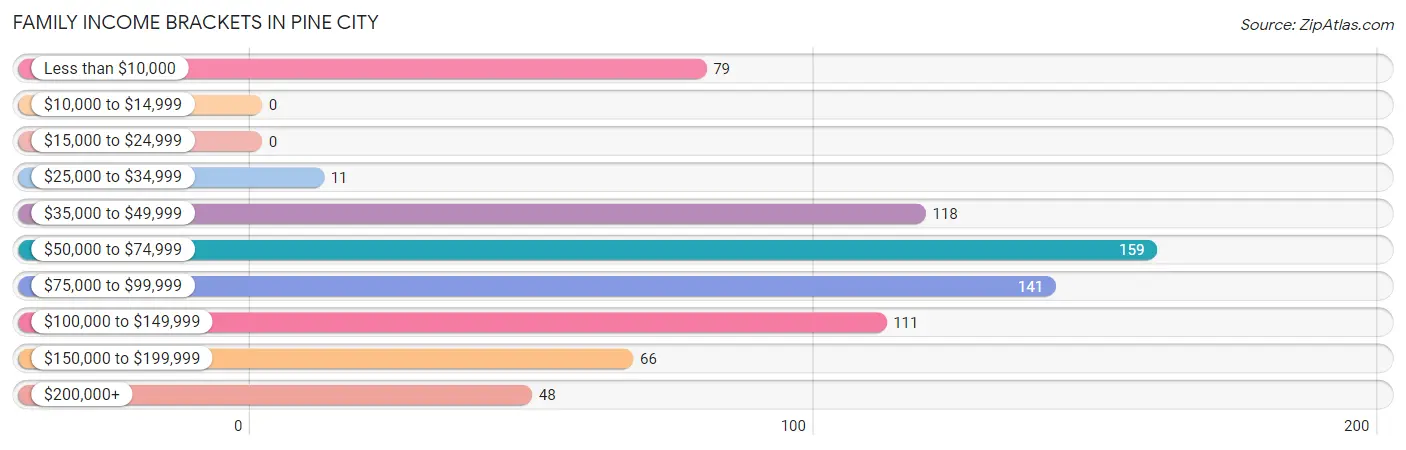
| Income Bracket | # Families | % Families |
| Less than $10,000 | 79 | 10.8% |
| $10,000 to $14,999 | 0 | 0.0% |
| $15,000 to $24,999 | 0 | 0.0% |
| $25,000 to $34,999 | 11 | 1.5% |
| $35,000 to $49,999 | 118 | 16.1% |
| $50,000 to $74,999 | 159 | 21.7% |
| $75,000 to $99,999 | 141 | 19.2% |
| $100,000 to $149,999 | 111 | 15.1% |
| $150,000 to $199,999 | 66 | 9.0% |
| $200,000+ | 48 | 6.5% |
Family Income by Famaliy Size in Pine City
3-person families (51 | 7.0%) account for the highest median family income in Pine City with $115,417 per family, while 3-person families (51 | 7.0%) have the highest median income of $38,472 per family member.
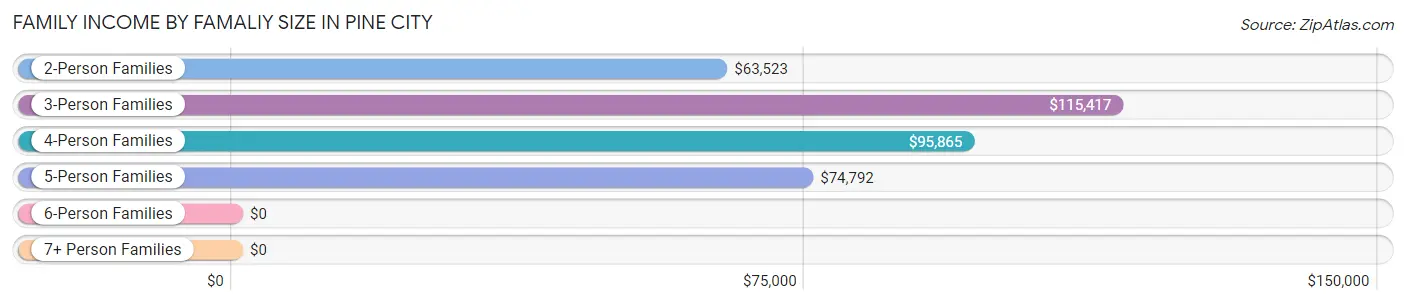
| Income Bracket | # Families | Median Income |
| 2-Person Families | 453 (61.8%) | $63,523 |
| 3-Person Families | 51 (7.0%) | $115,417 |
| 4-Person Families | 157 (21.4%) | $95,865 |
| 5-Person Families | 55 (7.5%) | $74,792 |
| 6-Person Families | 17 (2.3%) | $0 |
| 7+ Person Families | 0 (0.0%) | $0 |
| Total | 733 (100.0%) | $74,958 |
Family Income by Number of Earners in Pine City
The median family income in Pine City is $74,958, with families comprising 3+ earners (47) having the highest median family income of $121,208, while families with no earners (223) have the lowest median family income of $39,844, accounting for 6.4% and 30.4% of families, respectively.
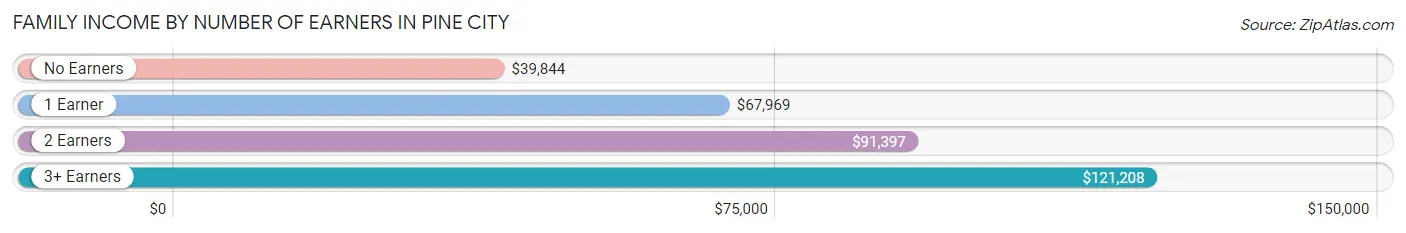
| Number of Earners | # Families | Median Income |
| No Earners | 223 (30.4%) | $39,844 |
| 1 Earner | 138 (18.8%) | $67,969 |
| 2 Earners | 325 (44.3%) | $91,397 |
| 3+ Earners | 47 (6.4%) | $121,208 |
| Total | 733 (100.0%) | $74,958 |
Household Income in Pine City
Household Income Brackets in Pine City
With 256 households falling in the category, the $35,000 to $49,999 income range is the most frequent in Pine City, accounting for 17.3% of all households. In contrast, only 47 households (3.2%) fall into the $200,000+ income bracket, making it the least populous group.
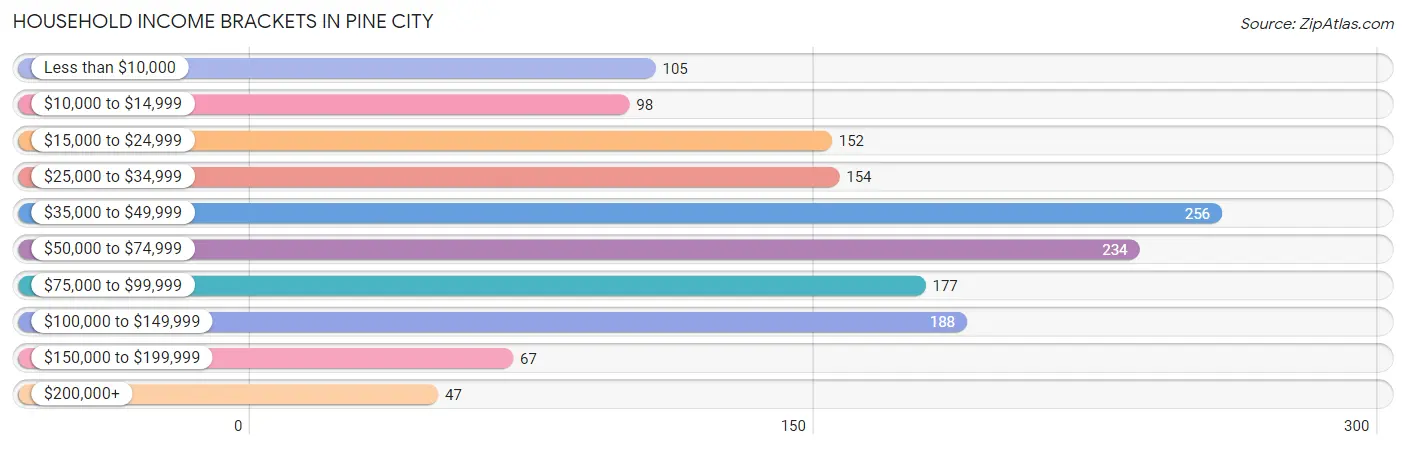
| Income Bracket | # Households | % Households |
| Less than $10,000 | 105 | 7.1% |
| $10,000 to $14,999 | 98 | 6.6% |
| $15,000 to $24,999 | 152 | 10.3% |
| $25,000 to $34,999 | 154 | 10.4% |
| $35,000 to $49,999 | 256 | 17.3% |
| $50,000 to $74,999 | 234 | 15.8% |
| $75,000 to $99,999 | 177 | 12.0% |
| $100,000 to $149,999 | 188 | 12.7% |
| $150,000 to $199,999 | 67 | 4.5% |
| $200,000+ | 47 | 3.2% |
Household Income by Householder Age in Pine City
The median household income in Pine City is $49,336, with the highest median household income of $72,958 found in the 25 to 44 years age bracket for the primary householder. A total of 459 households (31.0%) fall into this category. Meanwhile, the 15 to 24 years age bracket for the primary householder has the lowest median household income of $0, with 65 households (4.4%) in this group.
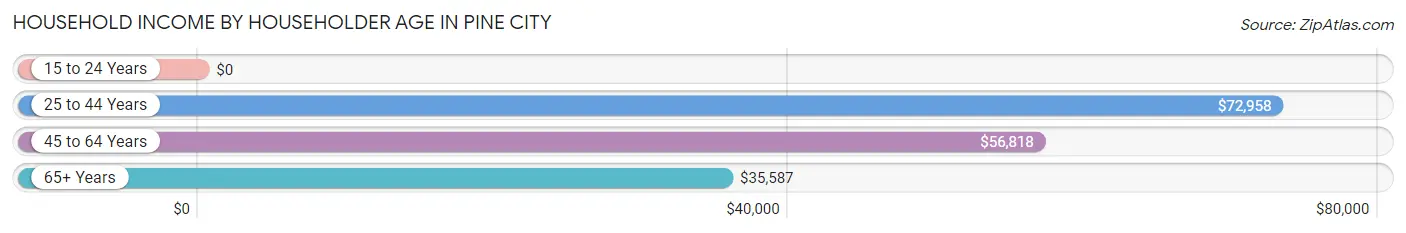
| Income Bracket | # Households | Median Income |
| 15 to 24 Years | 65 (4.4%) | $0 |
| 25 to 44 Years | 459 (31.0%) | $72,958 |
| 45 to 64 Years | 428 (28.9%) | $56,818 |
| 65+ Years | 527 (35.6%) | $35,587 |
| Total | 1,479 (100.0%) | $49,336 |
Poverty in Pine City
Income Below Poverty by Sex and Age in Pine City
With 7.6% poverty level for males and 15.9% for females among the residents of Pine City, 6 to 11 year old males and 25 to 34 year old females are the most vulnerable to poverty, with 60 males (26.6%) and 76 females (41.3%) in their respective age groups living below the poverty level.
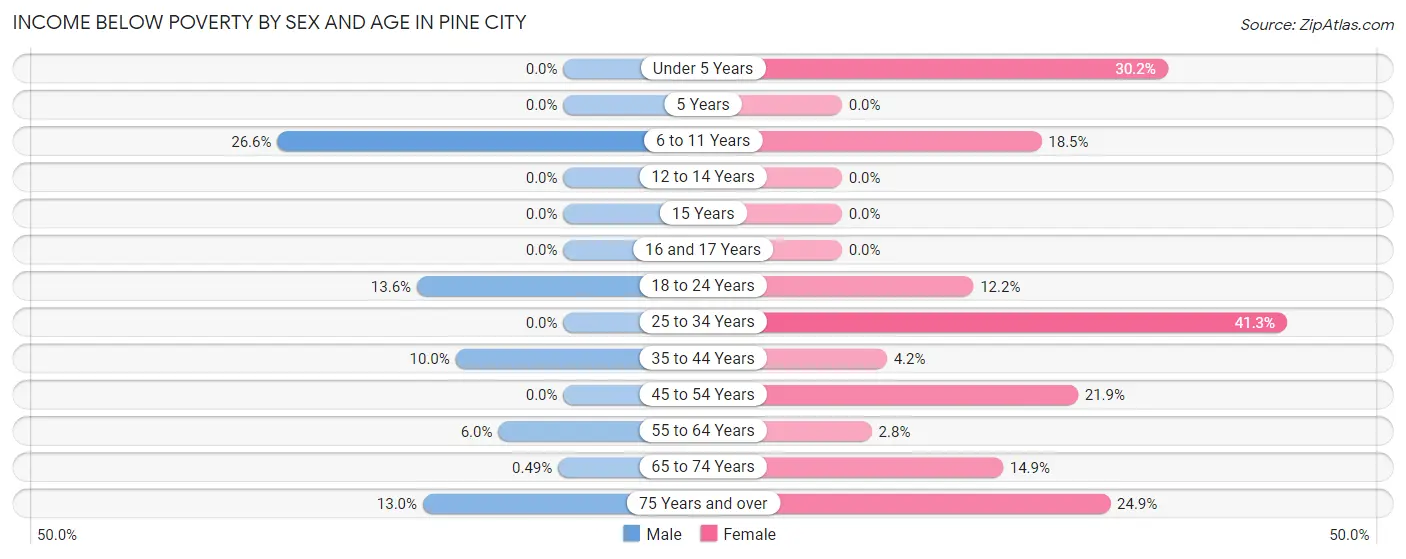
| Age Bracket | Male | Female |
| Under 5 Years | 0 (0.0%) | 13 (30.2%) |
| 5 Years | 0 (0.0%) | 0 (0.0%) |
| 6 to 11 Years | 60 (26.6%) | 10 (18.5%) |
| 12 to 14 Years | 0 (0.0%) | 0 (0.0%) |
| 15 Years | 0 (0.0%) | 0 (0.0%) |
| 16 and 17 Years | 0 (0.0%) | 0 (0.0%) |
| 18 to 24 Years | 14 (13.6%) | 20 (12.2%) |
| 25 to 34 Years | 0 (0.0%) | 76 (41.3%) |
| 35 to 44 Years | 11 (10.0%) | 10 (4.2%) |
| 45 to 54 Years | 0 (0.0%) | 30 (21.9%) |
| 55 to 64 Years | 11 (6.0%) | 8 (2.8%) |
| 65 to 74 Years | 1 (0.5%) | 23 (14.9%) |
| 75 Years and over | 15 (13.0%) | 64 (24.9%) |
| Total | 112 (7.6%) | 254 (15.9%) |
Income Above Poverty by Sex and Age in Pine City
According to the poverty statistics in Pine City, males aged under 5 years and females aged 5 years are the age groups that are most secure financially, with 100.0% of males and 100.0% of females in these age groups living above the poverty line.
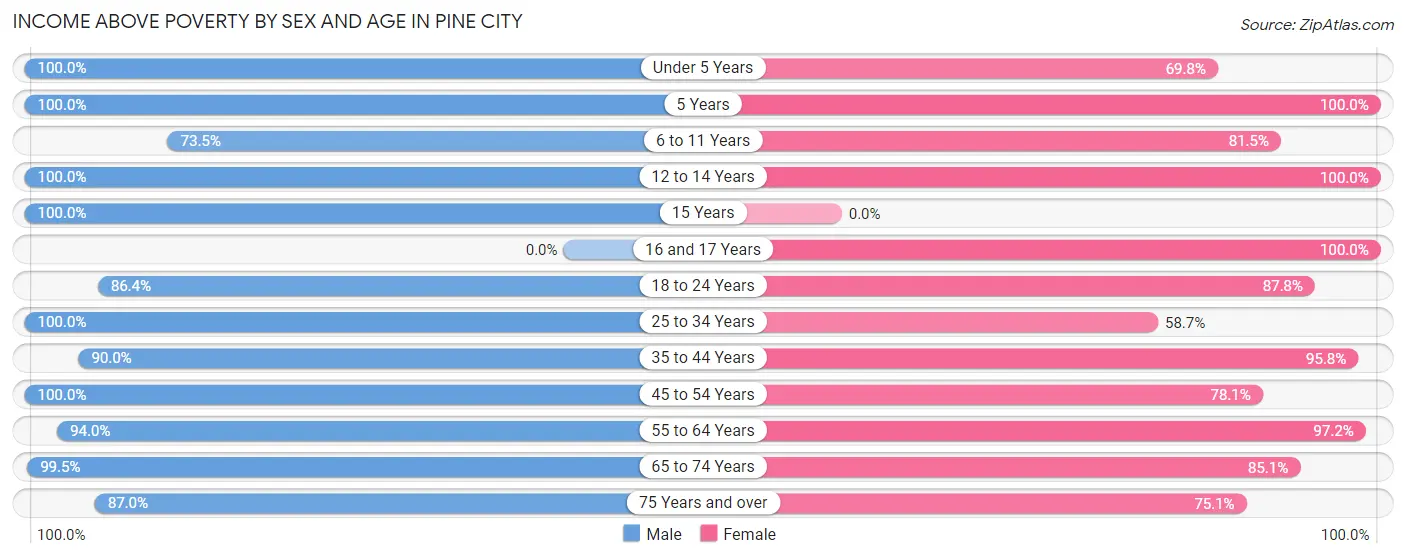
| Age Bracket | Male | Female |
| Under 5 Years | 87 (100.0%) | 30 (69.8%) |
| 5 Years | 12 (100.0%) | 25 (100.0%) |
| 6 to 11 Years | 166 (73.5%) | 44 (81.5%) |
| 12 to 14 Years | 47 (100.0%) | 31 (100.0%) |
| 15 Years | 17 (100.0%) | 0 (0.0%) |
| 16 and 17 Years | 0 (0.0%) | 17 (100.0%) |
| 18 to 24 Years | 89 (86.4%) | 144 (87.8%) |
| 25 to 34 Years | 241 (100.0%) | 108 (58.7%) |
| 35 to 44 Years | 99 (90.0%) | 230 (95.8%) |
| 45 to 54 Years | 135 (100.0%) | 107 (78.1%) |
| 55 to 64 Years | 171 (94.0%) | 281 (97.2%) |
| 65 to 74 Years | 202 (99.5%) | 131 (85.1%) |
| 75 Years and over | 100 (87.0%) | 193 (75.1%) |
| Total | 1,366 (92.4%) | 1,341 (84.1%) |
Income Below Poverty Among Married-Couple Families in Pine City
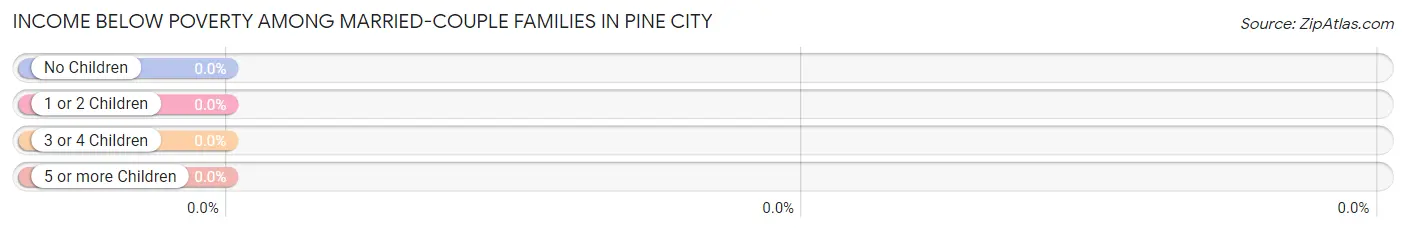
| Children | Above Poverty | Below Poverty |
| No Children | 339 (100.0%) | 0 (0.0%) |
| 1 or 2 Children | 113 (100.0%) | 0 (0.0%) |
| 3 or 4 Children | 61 (100.0%) | 0 (0.0%) |
| 5 or more Children | 0 (0.0%) | 0 (0.0%) |
| Total | 513 (100.0%) | 0 (0.0%) |
Income Below Poverty Among Single-Parent Households in Pine City
According to the poverty data in Pine City, 73.1% or 19 single-father households and 30.9% or 60 single-mother households are living below the poverty line. Among single-father households, those with no children have the highest poverty rate, with 8 households (100.0%) experiencing poverty. Likewise, among single-mother households, those with 1 or 2 children have the highest poverty rate, with 50 households (48.5%) falling below the poverty line.
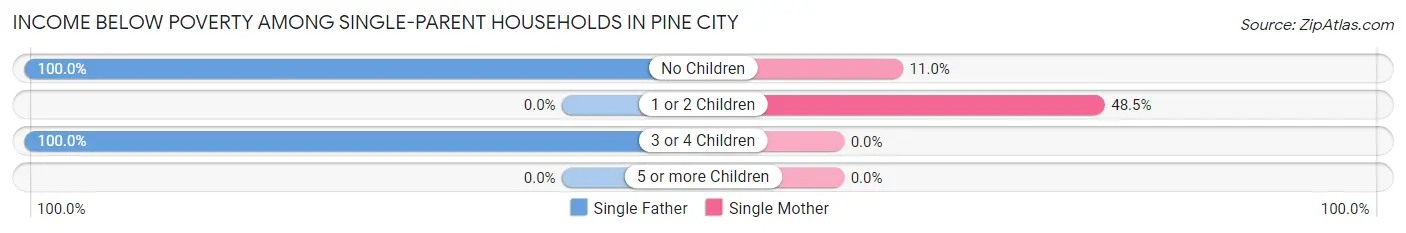
| Children | Single Father | Single Mother |
| No Children | 8 (100.0%) | 10 (11.0%) |
| 1 or 2 Children | 0 (0.0%) | 50 (48.5%) |
| 3 or 4 Children | 11 (100.0%) | 0 (0.0%) |
| 5 or more Children | 0 (0.0%) | 0 (0.0%) |
| Total | 19 (73.1%) | 60 (30.9%) |
Income Below Poverty Among Married-Couple vs Single-Parent Households in Pine City
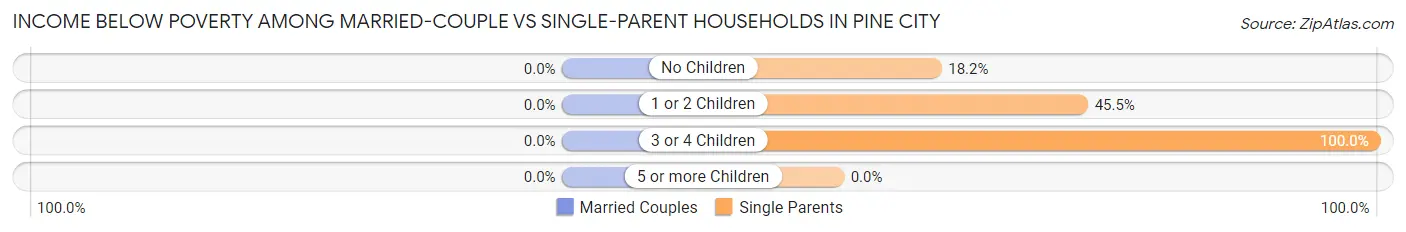
| Children | Married-Couple Families | Single-Parent Households |
| No Children | 0 (0.0%) | 18 (18.2%) |
| 1 or 2 Children | 0 (0.0%) | 50 (45.5%) |
| 3 or 4 Children | 0 (0.0%) | 11 (100.0%) |
| 5 or more Children | 0 (0.0%) | 0 (0.0%) |
| Total | 0 (0.0%) | 79 (35.9%) |
Race in Pine City
The most populous races in Pine City are White / Caucasian (3,096 | 96.6%), Two or more Races (72 | 2.2%), and Hispanic or Latino (70 | 2.2%).
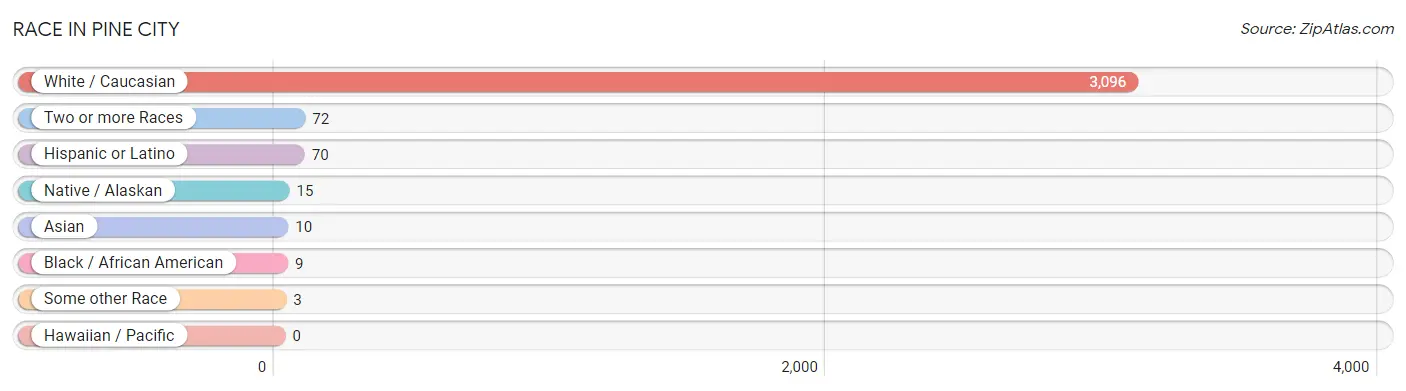
| Race | # Population | % Population |
| Asian | 10 | 0.3% |
| Black / African American | 9 | 0.3% |
| Hawaiian / Pacific | 0 | 0.0% |
| Hispanic or Latino | 70 | 2.2% |
| Native / Alaskan | 15 | 0.5% |
| White / Caucasian | 3,096 | 96.6% |
| Two or more Races | 72 | 2.2% |
| Some other Race | 3 | 0.1% |
| Total | 3,205 | 100.0% |
Ancestry in Pine City
The most populous ancestries reported in Pine City are German (1,115 | 34.8%), Swedish (614 | 19.2%), Irish (426 | 13.3%), Norwegian (330 | 10.3%), and English (204 | 6.4%), together accounting for 83.9% of all Pine City residents.
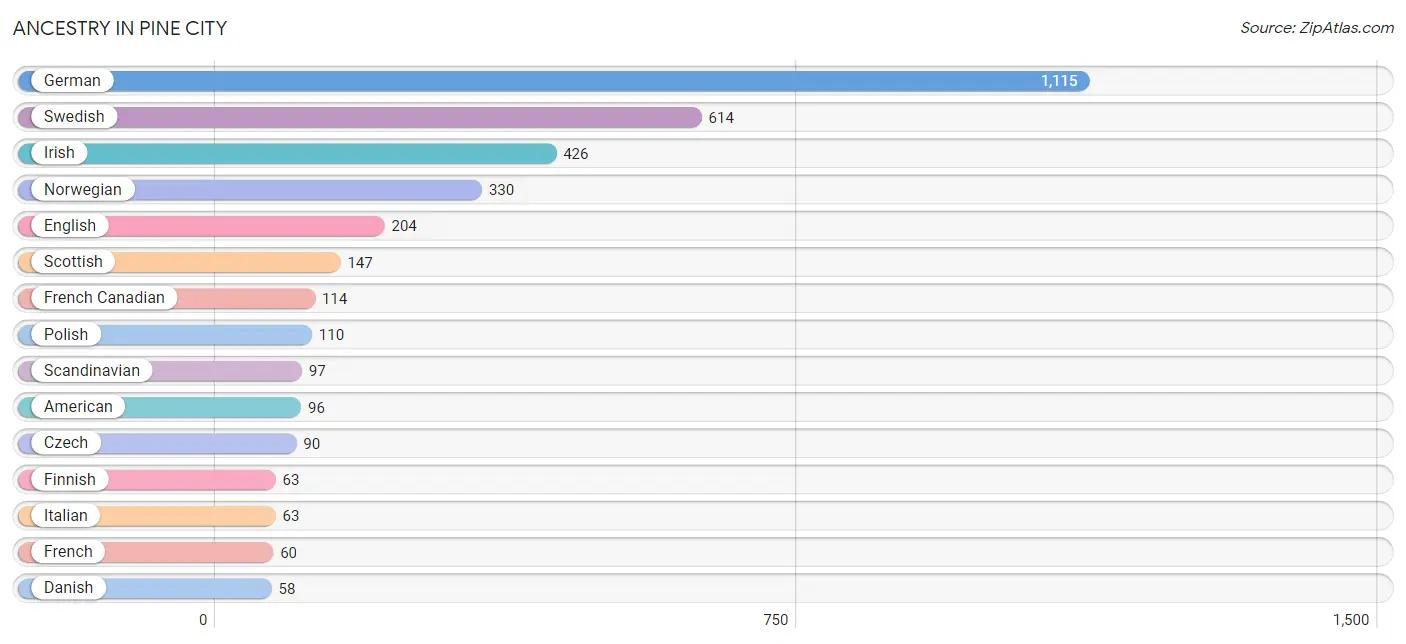
| Ancestry | # Population | % Population |
| African | 3 | 0.1% |
| American | 96 | 3.0% |
| Argentinean | 23 | 0.7% |
| British | 9 | 0.3% |
| Canadian | 10 | 0.3% |
| Chippewa | 20 | 0.6% |
| Croatian | 10 | 0.3% |
| Czech | 90 | 2.8% |
| Czechoslovakian | 10 | 0.3% |
| Danish | 58 | 1.8% |
| Dutch | 42 | 1.3% |
| English | 204 | 6.4% |
| European | 12 | 0.4% |
| Finnish | 63 | 2.0% |
| French | 60 | 1.9% |
| French Canadian | 114 | 3.6% |
| German | 1,115 | 34.8% |
| Haitian | 10 | 0.3% |
| Irish | 426 | 13.3% |
| Italian | 63 | 2.0% |
| Korean | 10 | 0.3% |
| Mexican | 12 | 0.4% |
| Norwegian | 330 | 10.3% |
| Polish | 110 | 3.4% |
| Russian | 10 | 0.3% |
| Scandinavian | 97 | 3.0% |
| Scotch-Irish | 11 | 0.3% |
| Scottish | 147 | 4.6% |
| Sioux | 3 | 0.1% |
| South American | 23 | 0.7% |
| Spaniard | 35 | 1.1% |
| Subsaharan African | 3 | 0.1% |
| Swedish | 614 | 19.2% |
| Welsh | 20 | 0.6% |
| Yaqui | 40 | 1.3% |
| Yugoslavian | 1 | 0.0% | View All 36 Rows |
Immigrants in Pine City
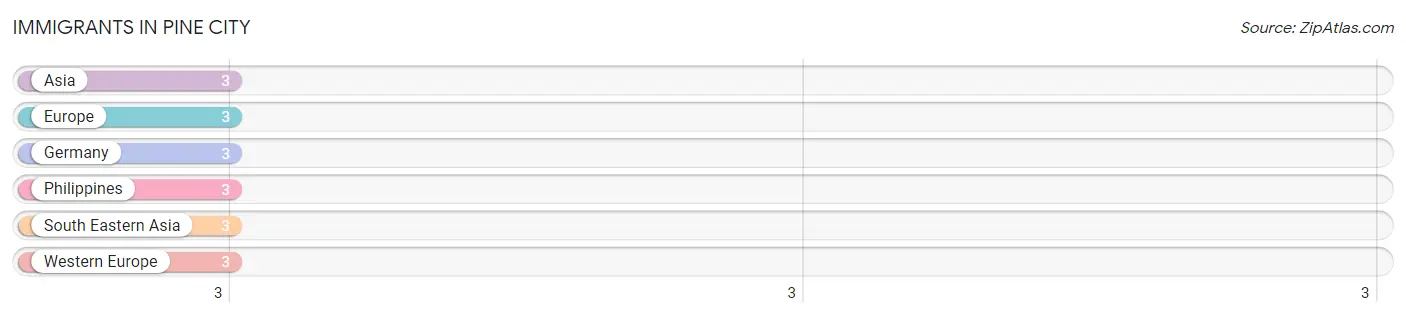
The most numerous immigrant groups reported in Pine City came from Asia (3 | 0.1%), Europe (3 | 0.1%), Germany (3 | 0.1%), Philippines (3 | 0.1%), and South Eastern Asia (3 | 0.1%), together accounting for 0.4% of all Pine City residents.
| Immigration Origin | # Population | % Population |
| Asia | 3 | 0.1% |
| Europe | 3 | 0.1% |
| Germany | 3 | 0.1% |
| Philippines | 3 | 0.1% |
| South Eastern Asia | 3 | 0.1% |
| Western Europe | 3 | 0.1% | View All 6 Rows |
Sex and Age in Pine City
Sex and Age in Pine City
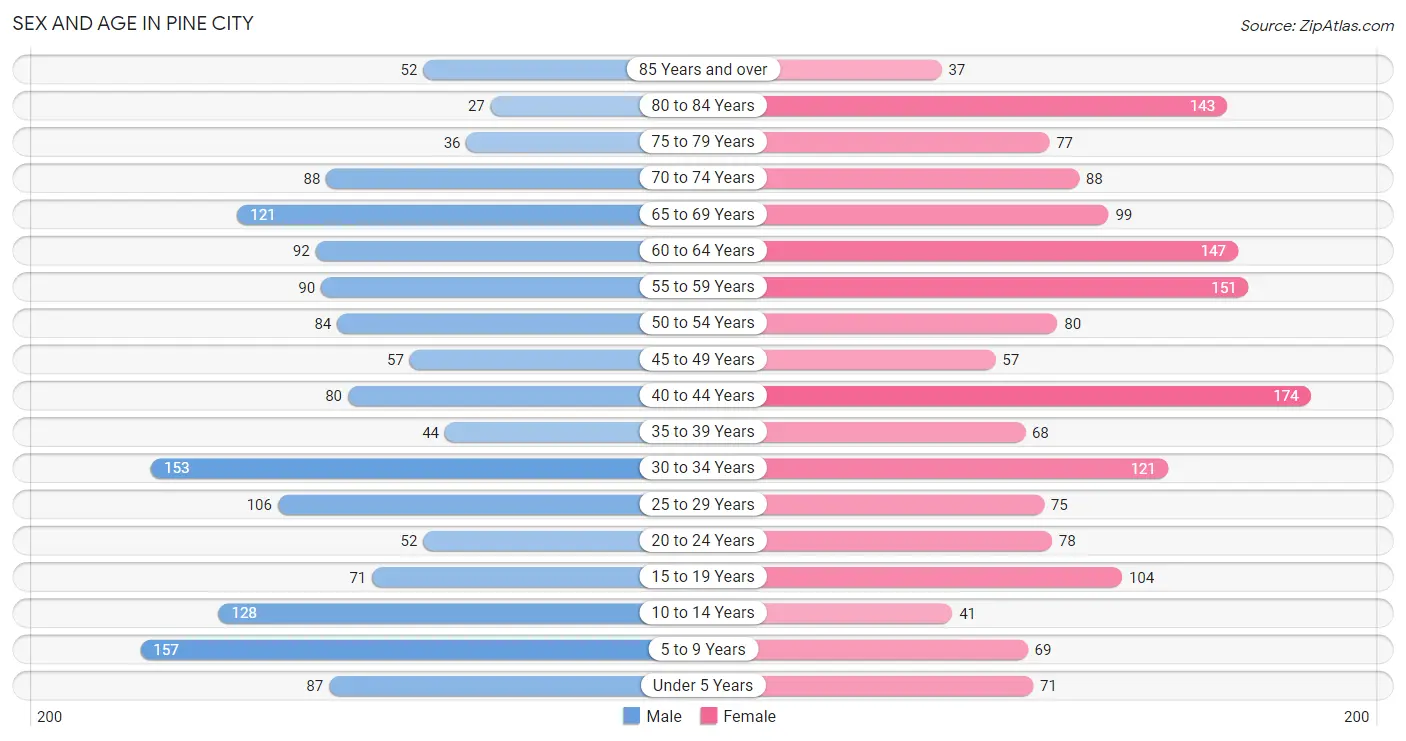
The most populous age groups in Pine City are 5 to 9 Years (157 | 10.3%) for men and 40 to 44 Years (174 | 10.4%) for women.
| Age Bracket | Male | Female |
| Under 5 Years | 87 (5.7%) | 71 (4.2%) |
| 5 to 9 Years | 157 (10.3%) | 69 (4.1%) |
| 10 to 14 Years | 128 (8.4%) | 41 (2.4%) |
| 15 to 19 Years | 71 (4.7%) | 104 (6.2%) |
| 20 to 24 Years | 52 (3.4%) | 78 (4.6%) |
| 25 to 29 Years | 106 (7.0%) | 75 (4.5%) |
| 30 to 34 Years | 153 (10.0%) | 121 (7.2%) |
| 35 to 39 Years | 44 (2.9%) | 68 (4.1%) |
| 40 to 44 Years | 80 (5.2%) | 174 (10.4%) |
| 45 to 49 Years | 57 (3.7%) | 57 (3.4%) |
| 50 to 54 Years | 84 (5.5%) | 80 (4.8%) |
| 55 to 59 Years | 90 (5.9%) | 151 (9.0%) |
| 60 to 64 Years | 92 (6.0%) | 147 (8.7%) |
| 65 to 69 Years | 121 (7.9%) | 99 (5.9%) |
| 70 to 74 Years | 88 (5.8%) | 88 (5.2%) |
| 75 to 79 Years | 36 (2.4%) | 77 (4.6%) |
| 80 to 84 Years | 27 (1.8%) | 143 (8.5%) |
| 85 Years and over | 52 (3.4%) | 37 (2.2%) |
| Total | 1,525 (100.0%) | 1,680 (100.0%) |
Families and Households in Pine City
Median Family Size in Pine City
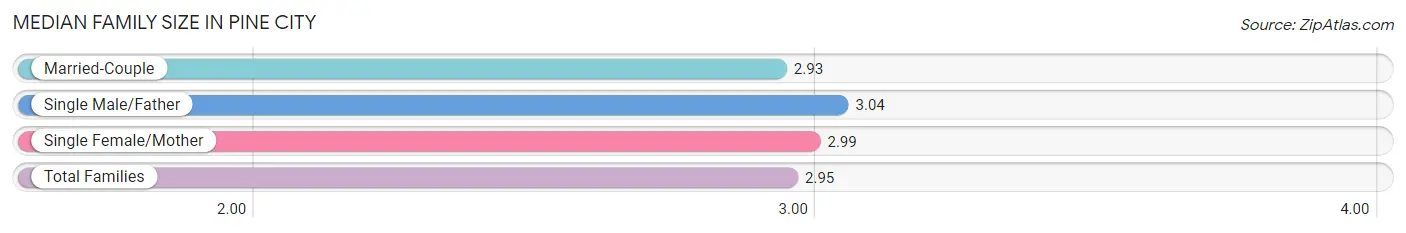
The median family size in Pine City is 2.95 persons per family, with single male/father families (26 | 3.5%) accounting for the largest median family size of 3.04 persons per family. On the other hand, married-couple families (513 | 70.0%) represent the smallest median family size with 2.93 persons per family.
| Family Type | # Families | Family Size |
| Married-Couple | 513 (70.0%) | 2.93 |
| Single Male/Father | 26 (3.5%) | 3.04 |
| Single Female/Mother | 194 (26.5%) | 2.99 |
| Total Families | 733 (100.0%) | 2.95 |
Median Household Size in Pine City
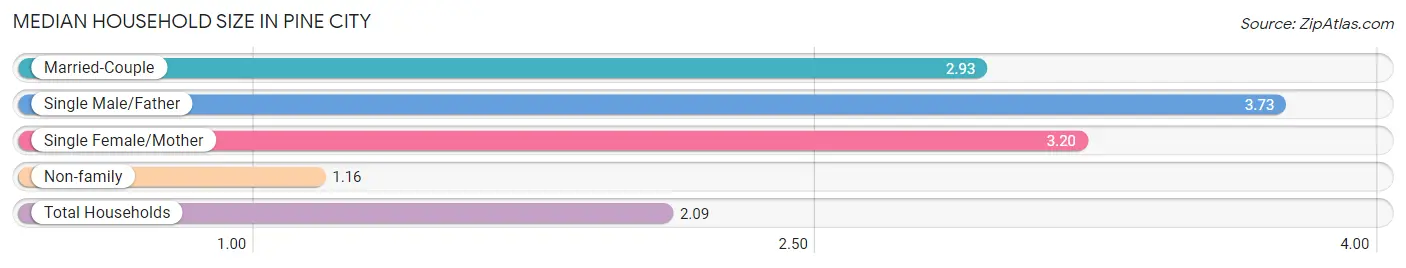
The median household size in Pine City is 2.09 persons per household, with single male/father households (26 | 1.8%) accounting for the largest median household size of 3.73 persons per household. non-family households (746 | 50.4%) represent the smallest median household size with 1.16 persons per household.
| Household Type | # Households | Household Size |
| Married-Couple | 513 (34.7%) | 2.93 |
| Single Male/Father | 26 (1.8%) | 3.73 |
| Single Female/Mother | 194 (13.1%) | 3.20 |
| Non-family | 746 (50.4%) | 1.16 |
| Total Households | 1,479 (100.0%) | 2.09 |
Household Size by Marriage Status in Pine City
Out of a total of 1,479 households in Pine City, 733 (49.6%) are family households, while 746 (50.4%) are nonfamily households. The most numerous type of family households are 2-person households, comprising 429, and the most common type of nonfamily households are 1-person households, comprising 640.
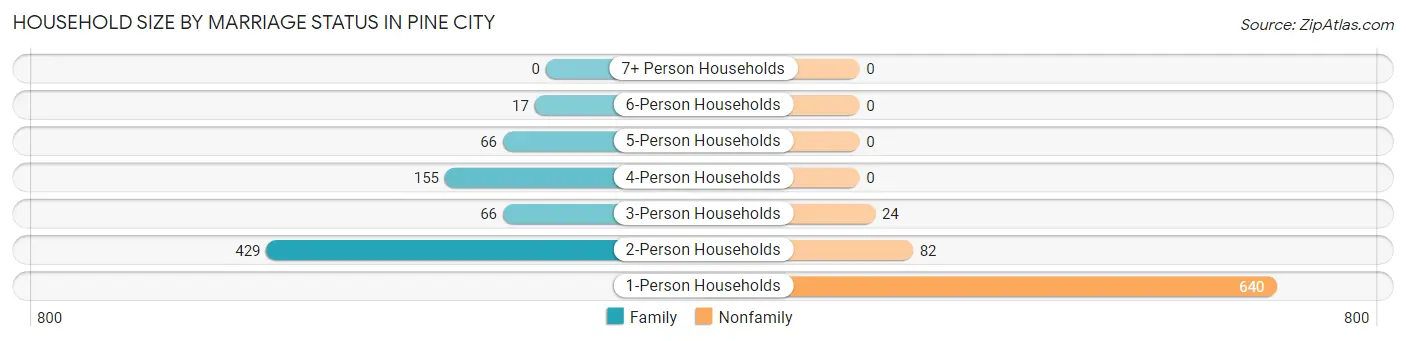
| Household Size | Family Households | Nonfamily Households |
| 1-Person Households | - | 640 (43.3%) |
| 2-Person Households | 429 (29.0%) | 82 (5.5%) |
| 3-Person Households | 66 (4.5%) | 24 (1.6%) |
| 4-Person Households | 155 (10.5%) | 0 (0.0%) |
| 5-Person Households | 66 (4.5%) | 0 (0.0%) |
| 6-Person Households | 17 (1.1%) | 0 (0.0%) |
| 7+ Person Households | 0 (0.0%) | 0 (0.0%) |
| Total | 733 (49.6%) | 746 (50.4%) |
Female Fertility in Pine City
Fertility by Age in Pine City
Average fertility rate in Pine City is 65.0 births per 1,000 women. Women in the age bracket of 20 to 34 years have the highest fertility rate with 102.0 births per 1,000 women. Women in the age bracket of 20 to 34 years acount for 62.2% of all women with births.
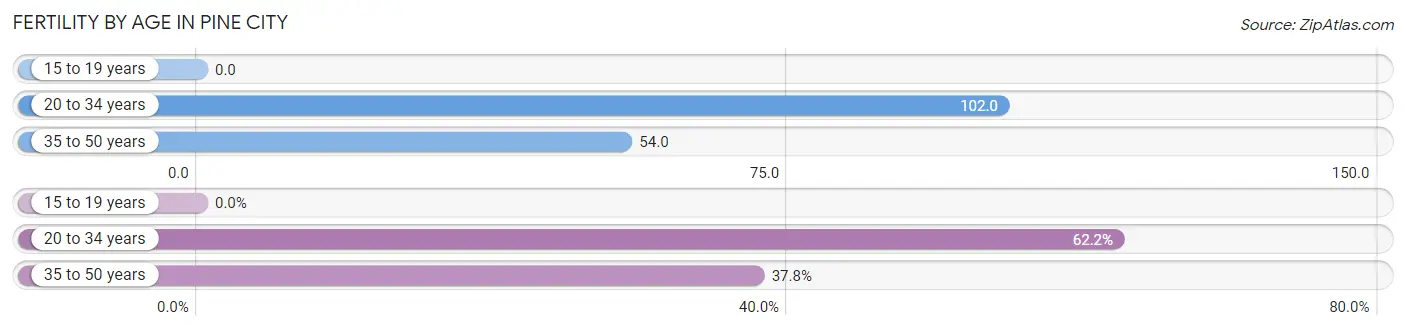
| Age Bracket | Women with Births | Births / 1,000 Women |
| 15 to 19 years | 0 (0.0%) | 0.0 |
| 20 to 34 years | 28 (62.2%) | 102.0 |
| 35 to 50 years | 17 (37.8%) | 54.0 |
| Total | 45 (100.0%) | 65.0 |
Fertility by Age by Marriage Status in Pine City
62.2% of women with births (45) in Pine City are married. The highest percentage of unmarried women with births falls into 35 to 50 years age bracket with 100.0% of them unmarried at the time of birth, while the lowest percentage of unmarried women with births belong to 20 to 34 years age bracket with 0.0% of them unmarried.
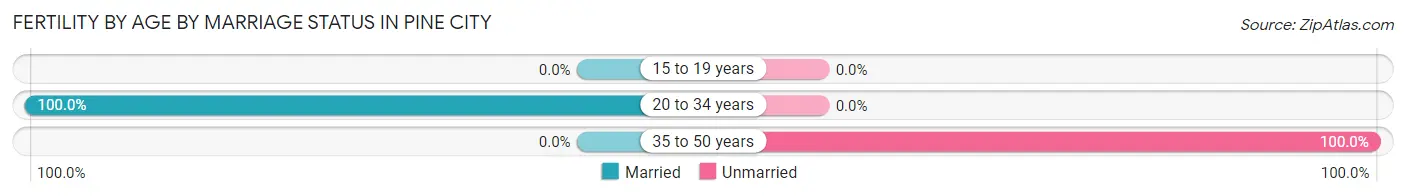
| Age Bracket | Married | Unmarried |
| 15 to 19 years | 0 (0.0%) | 0 (0.0%) |
| 20 to 34 years | 28 (100.0%) | 0 (0.0%) |
| 35 to 50 years | 0 (0.0%) | 17 (100.0%) |
| Total | 28 (62.2%) | 17 (37.8%) |
Fertility by Education in Pine City
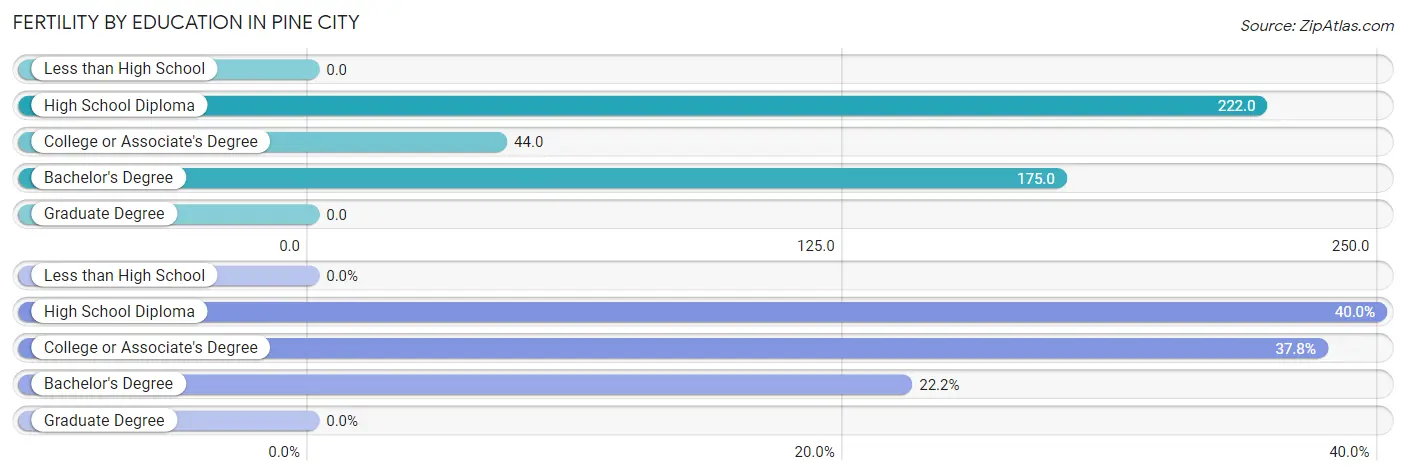
| Educational Attainment | Women with Births | Births / 1,000 Women |
| Less than High School | 0 (0.0%) | 0.0 |
| High School Diploma | 18 (40.0%) | 222.0 |
| College or Associate's Degree | 17 (37.8%) | 44.0 |
| Bachelor's Degree | 10 (22.2%) | 175.0 |
| Graduate Degree | 0 (0.0%) | 0.0 |
| Total | 45 (100.0%) | 65.0 |
Fertility by Education by Marriage Status in Pine City
37.8% of women with births in Pine City are unmarried. Women with the educational attainment of high school diploma are most likely to be married with 100.0% of them married at childbirth, while women with the educational attainment of college or associate's degree are least likely to be married with 100.0% of them unmarried at childbirth.
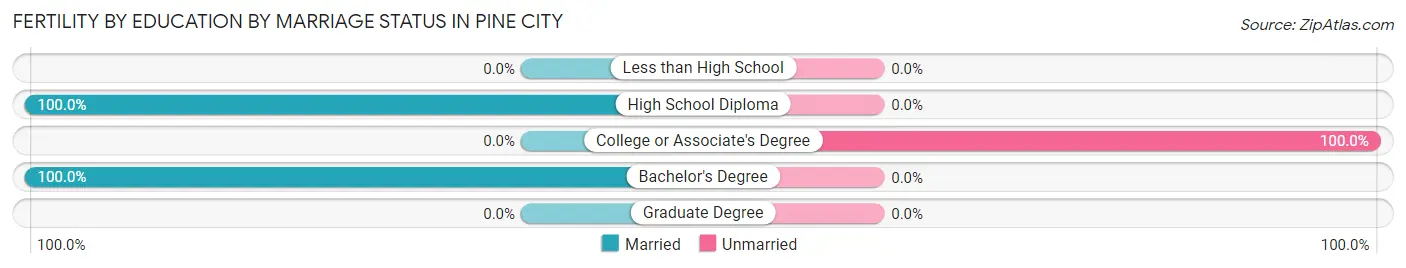
| Educational Attainment | Married | Unmarried |
| Less than High School | 0 (0.0%) | 0 (0.0%) |
| High School Diploma | 18 (100.0%) | 0 (0.0%) |
| College or Associate's Degree | 0 (0.0%) | 17 (100.0%) |
| Bachelor's Degree | 10 (100.0%) | 0 (0.0%) |
| Graduate Degree | 0 (0.0%) | 0 (0.0%) |
| Total | 28 (62.2%) | 17 (37.8%) |
Employment Characteristics in Pine City
Employment by Class of Employer in Pine City
Among the 1,377 employed individuals in Pine City, private company employees (886 | 64.3%), local government employees (187 | 13.6%), and not-for-profit organizations (124 | 9.0%) make up the most common classes of employment.
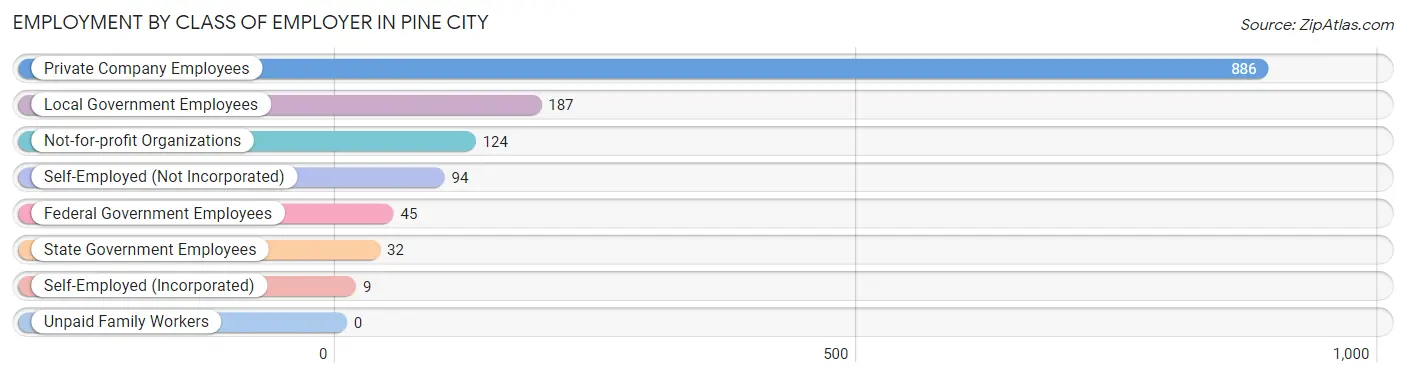
| Employer Class | # Employees | % Employees |
| Private Company Employees | 886 | 64.3% |
| Self-Employed (Incorporated) | 9 | 0.6% |
| Self-Employed (Not Incorporated) | 94 | 6.8% |
| Not-for-profit Organizations | 124 | 9.0% |
| Local Government Employees | 187 | 13.6% |
| State Government Employees | 32 | 2.3% |
| Federal Government Employees | 45 | 3.3% |
| Unpaid Family Workers | 0 | 0.0% |
| Total | 1,377 | 100.0% |
Employment Status by Age in Pine City
According to the labor force statistics for Pine City, out of the total population over 16 years of age (2,635), 56.4% or 1,486 individuals are in the labor force, with 4.9% or 73 of them unemployed. The age group with the highest labor force participation rate is 25 to 29 years, with 91.7% or 166 individuals in the labor force. Within the labor force, the 30 to 34 years age range has the highest percentage of unemployed individuals, with 26.7% or 65 of them being unemployed.
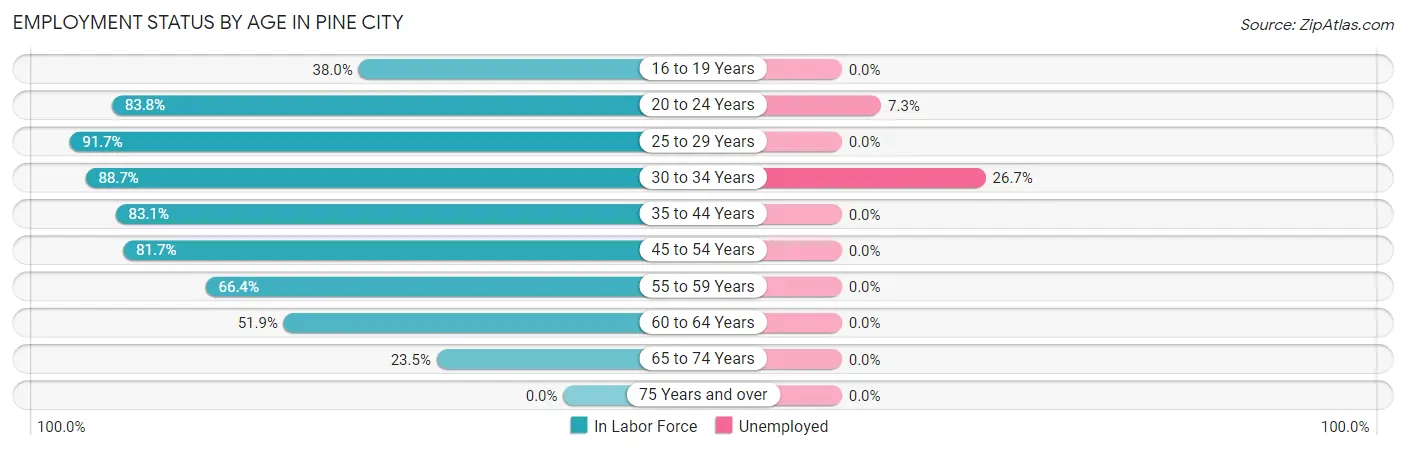
| Age Bracket | In Labor Force | Unemployed |
| 16 to 19 Years | 60 (38.0%) | 0 (0.0%) |
| 20 to 24 Years | 109 (83.8%) | 8 (7.3%) |
| 25 to 29 Years | 166 (91.7%) | 0 (0.0%) |
| 30 to 34 Years | 243 (88.7%) | 65 (26.7%) |
| 35 to 44 Years | 304 (83.1%) | 0 (0.0%) |
| 45 to 54 Years | 227 (81.7%) | 0 (0.0%) |
| 55 to 59 Years | 160 (66.4%) | 0 (0.0%) |
| 60 to 64 Years | 124 (51.9%) | 0 (0.0%) |
| 65 to 74 Years | 93 (23.5%) | 0 (0.0%) |
| 75 Years and over | 0 (0.0%) | 0 (0.0%) |
| Total | 1,486 (56.4%) | 73 (4.9%) |
Employment Status by Educational Attainment in Pine City
According to labor force statistics for Pine City, 77.5% of individuals (1,224) out of the total population between 25 and 64 years of age (1,579) are in the labor force, with 5.3% or 65 of them being unemployed. The group with the highest labor force participation rate are those with the educational attainment of college / associate degree, with 87.4% or 644 individuals in the labor force. Within the labor force, individuals with college / associate degree education have the highest percentage of unemployment, with 10.1% or 65 of them being unemployed.
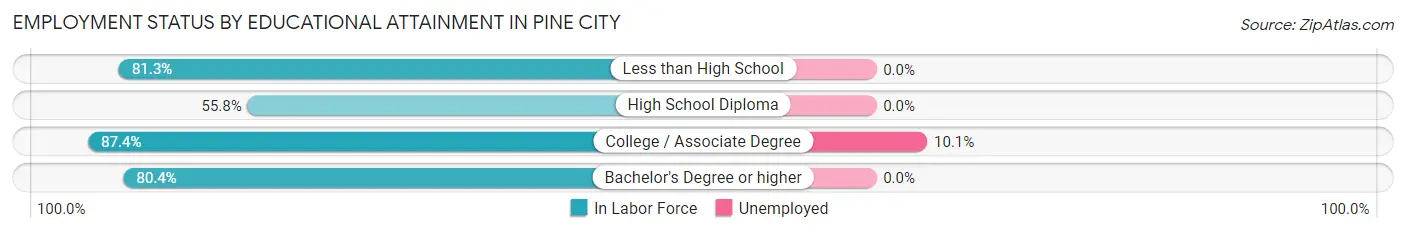
| Educational Attainment | In Labor Force | Unemployed |
| Less than High School | 139 (81.3%) | 0 (0.0%) |
| High School Diploma | 223 (55.8%) | 0 (0.0%) |
| College / Associate Degree | 644 (87.4%) | 74 (10.1%) |
| Bachelor's Degree or higher | 218 (80.4%) | 0 (0.0%) |
| Total | 1,224 (77.5%) | 84 (5.3%) |
Employment Occupations by Sex in Pine City
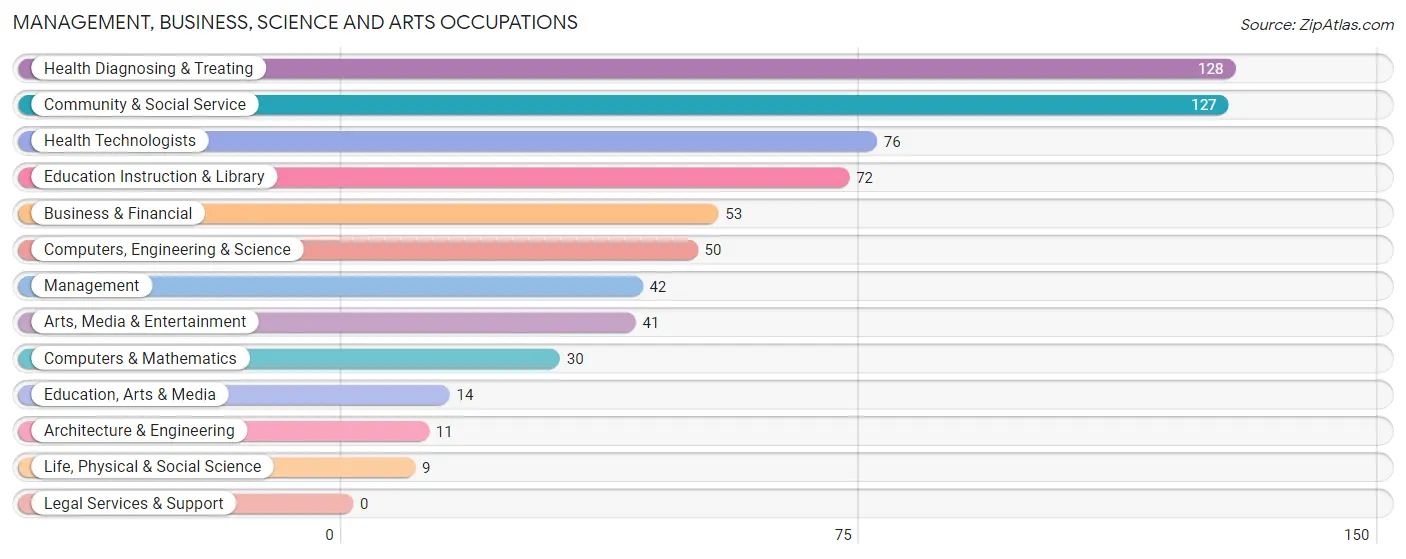
Management, Business, Science and Arts Occupations
The most common Management, Business, Science and Arts occupations in Pine City are Health Diagnosing & Treating (128 | 9.1%), Community & Social Service (127 | 9.0%), Health Technologists (76 | 5.4%), Education Instruction & Library (72 | 5.1%), and Business & Financial (53 | 3.7%).
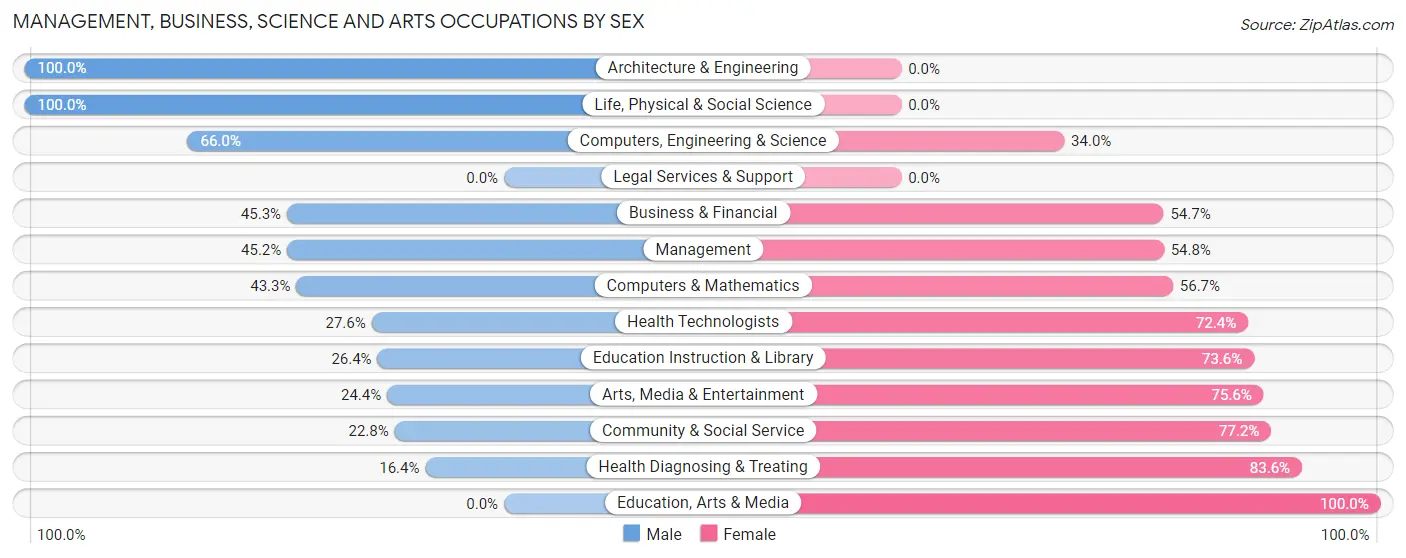
Management, Business, Science and Arts Occupations by Sex
Within the Management, Business, Science and Arts occupations in Pine City, the most male-oriented occupations are Architecture & Engineering (100.0%), Life, Physical & Social Science (100.0%), and Computers, Engineering & Science (66.0%), while the most female-oriented occupations are Education, Arts & Media (100.0%), Health Diagnosing & Treating (83.6%), and Community & Social Service (77.2%).
| Occupation | Male | Female |
| Management | 19 (45.2%) | 23 (54.8%) |
| Business & Financial | 24 (45.3%) | 29 (54.7%) |
| Computers, Engineering & Science | 33 (66.0%) | 17 (34.0%) |
| Computers & Mathematics | 13 (43.3%) | 17 (56.7%) |
| Architecture & Engineering | 11 (100.0%) | 0 (0.0%) |
| Life, Physical & Social Science | 9 (100.0%) | 0 (0.0%) |
| Community & Social Service | 29 (22.8%) | 98 (77.2%) |
| Education, Arts & Media | 0 (0.0%) | 14 (100.0%) |
| Legal Services & Support | 0 (0.0%) | 0 (0.0%) |
| Education Instruction & Library | 19 (26.4%) | 53 (73.6%) |
| Arts, Media & Entertainment | 10 (24.4%) | 31 (75.6%) |
| Health Diagnosing & Treating | 21 (16.4%) | 107 (83.6%) |
| Health Technologists | 21 (27.6%) | 55 (72.4%) |
| Total (Category) | 126 (31.5%) | 274 (68.5%) |
| Total (Overall) | 694 (49.1%) | 719 (50.9%) |
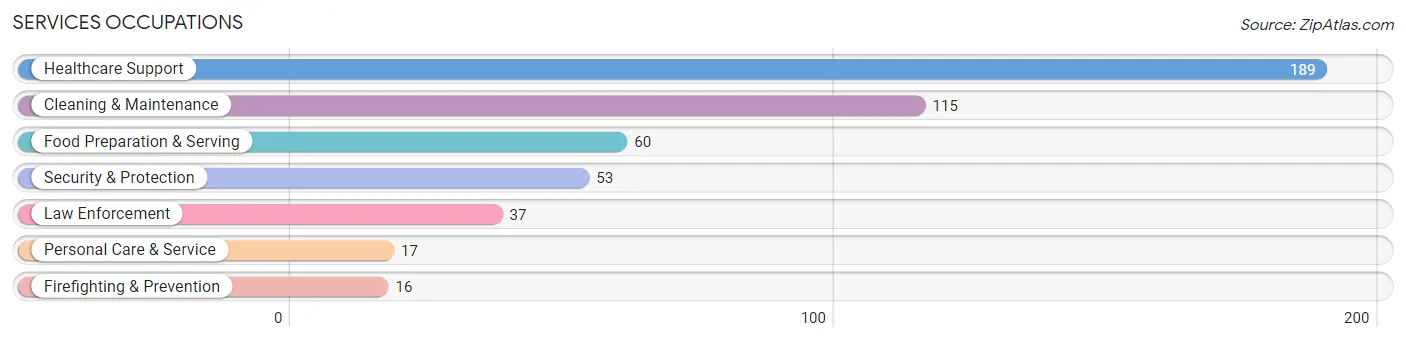
Services Occupations
The most common Services occupations in Pine City are Healthcare Support (189 | 13.4%), Cleaning & Maintenance (115 | 8.1%), Food Preparation & Serving (60 | 4.3%), Security & Protection (53 | 3.7%), and Law Enforcement (37 | 2.6%).
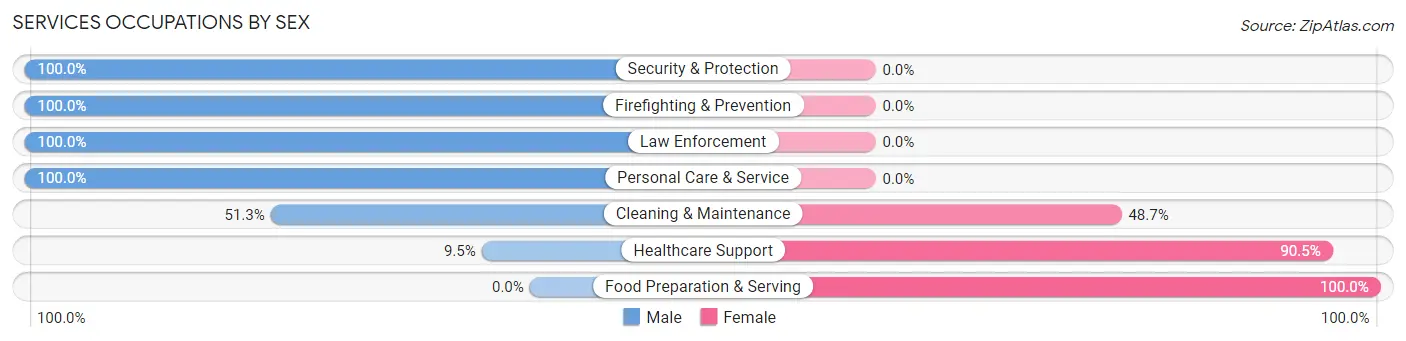
Services Occupations by Sex
Within the Services occupations in Pine City, the most male-oriented occupations are Security & Protection (100.0%), Firefighting & Prevention (100.0%), and Law Enforcement (100.0%), while the most female-oriented occupations are Food Preparation & Serving (100.0%), Healthcare Support (90.5%), and Cleaning & Maintenance (48.7%).
| Occupation | Male | Female |
| Healthcare Support | 18 (9.5%) | 171 (90.5%) |
| Security & Protection | 53 (100.0%) | 0 (0.0%) |
| Firefighting & Prevention | 16 (100.0%) | 0 (0.0%) |
| Law Enforcement | 37 (100.0%) | 0 (0.0%) |
| Food Preparation & Serving | 0 (0.0%) | 60 (100.0%) |
| Cleaning & Maintenance | 59 (51.3%) | 56 (48.7%) |
| Personal Care & Service | 17 (100.0%) | 0 (0.0%) |
| Total (Category) | 147 (33.9%) | 287 (66.1%) |
| Total (Overall) | 694 (49.1%) | 719 (50.9%) |
Sales and Office Occupations
The most common Sales and Office occupations in Pine City are Sales & Related (157 | 11.1%), and Office & Administration (141 | 10.0%).
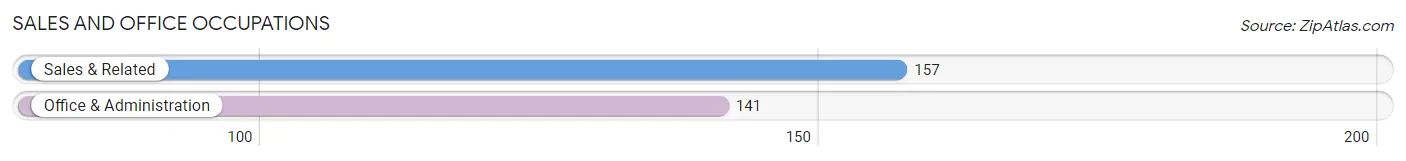
Sales and Office Occupations by Sex
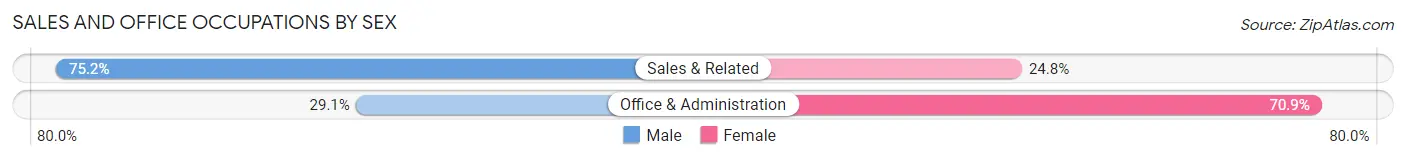
| Occupation | Male | Female |
| Sales & Related | 118 (75.2%) | 39 (24.8%) |
| Office & Administration | 41 (29.1%) | 100 (70.9%) |
| Total (Category) | 159 (53.4%) | 139 (46.6%) |
| Total (Overall) | 694 (49.1%) | 719 (50.9%) |
Natural Resources, Construction and Maintenance Occupations
The most common Natural Resources, Construction and Maintenance occupations in Pine City are Construction & Extraction (104 | 7.4%), Installation, Maintenance & Repair (32 | 2.3%), and Farming, Fishing & Forestry (11 | 0.8%).
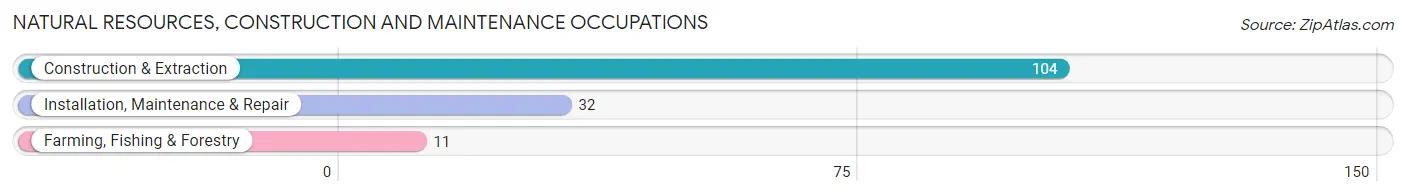
Natural Resources, Construction and Maintenance Occupations by Sex
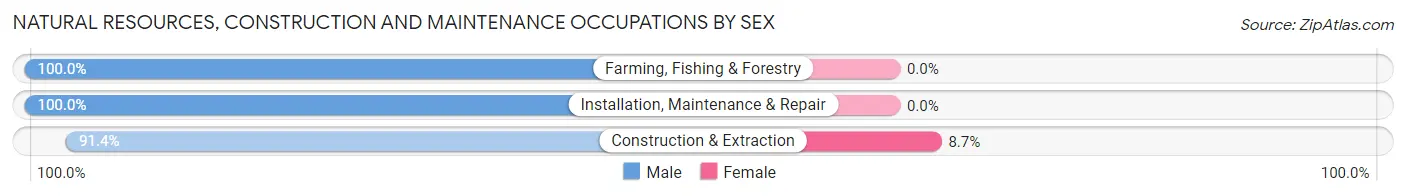
| Occupation | Male | Female |
| Farming, Fishing & Forestry | 11 (100.0%) | 0 (0.0%) |
| Construction & Extraction | 95 (91.3%) | 9 (8.6%) |
| Installation, Maintenance & Repair | 32 (100.0%) | 0 (0.0%) |
| Total (Category) | 138 (93.9%) | 9 (6.1%) |
| Total (Overall) | 694 (49.1%) | 719 (50.9%) |
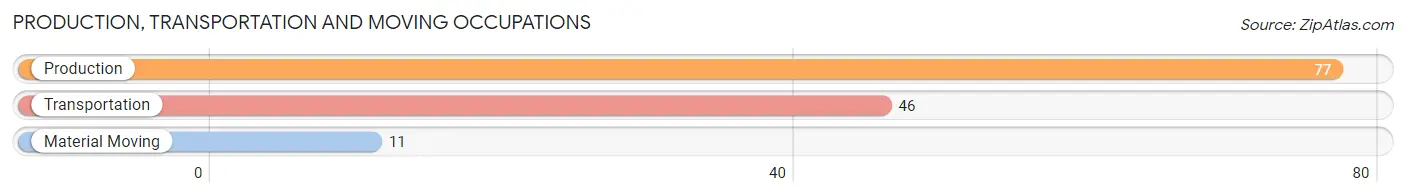
Production, Transportation and Moving Occupations
The most common Production, Transportation and Moving occupations in Pine City are Production (77 | 5.4%), Transportation (46 | 3.3%), and Material Moving (11 | 0.8%).
Production, Transportation and Moving Occupations by Sex
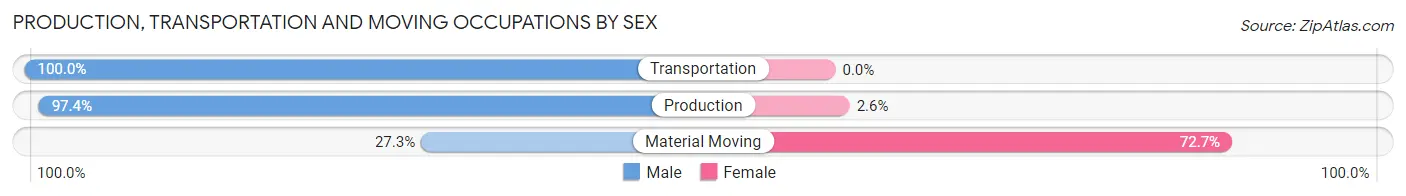
| Occupation | Male | Female |
| Production | 75 (97.4%) | 2 (2.6%) |
| Transportation | 46 (100.0%) | 0 (0.0%) |
| Material Moving | 3 (27.3%) | 8 (72.7%) |
| Total (Category) | 124 (92.5%) | 10 (7.5%) |
| Total (Overall) | 694 (49.1%) | 719 (50.9%) |
Employment Industries by Sex in Pine City
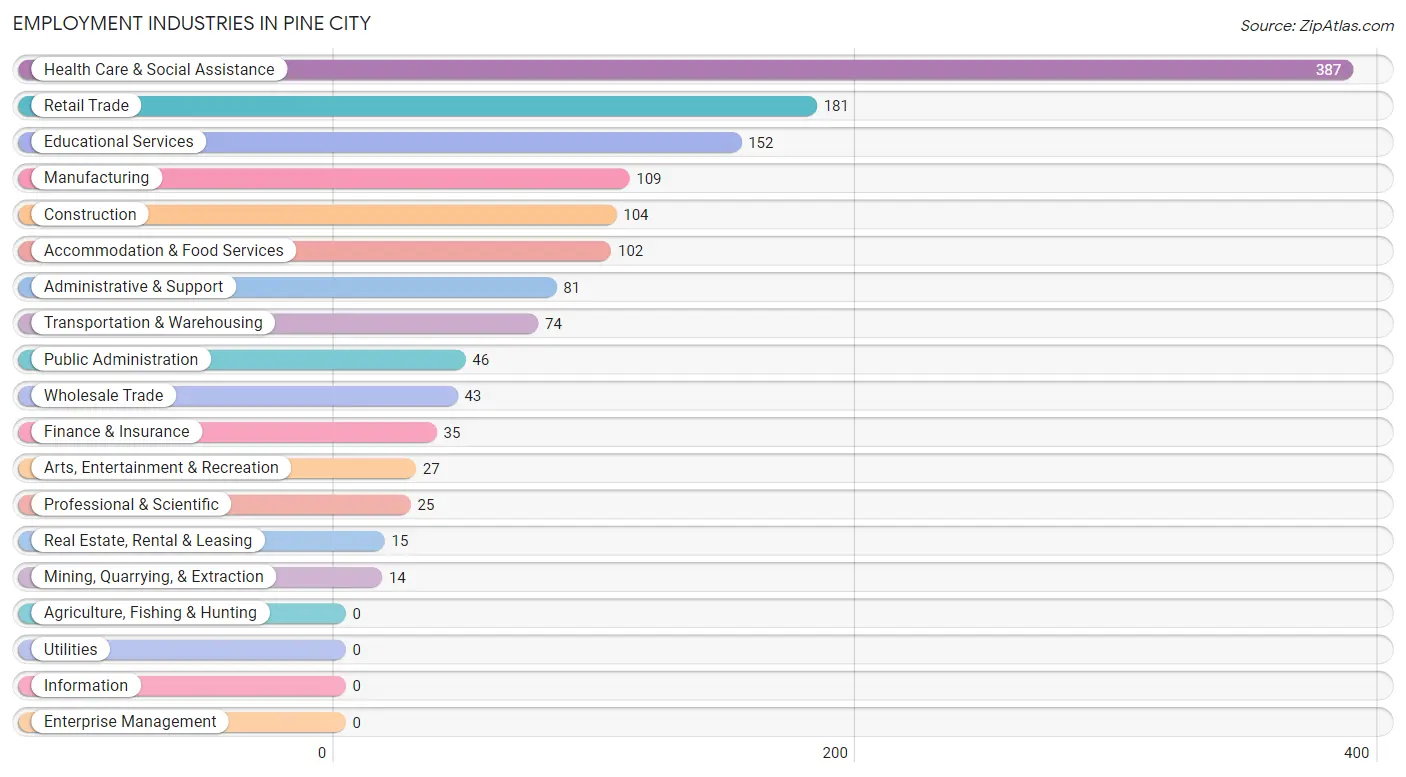
Employment Industries in Pine City
The major employment industries in Pine City include Health Care & Social Assistance (387 | 27.4%), Retail Trade (181 | 12.8%), Educational Services (152 | 10.8%), Manufacturing (109 | 7.7%), and Construction (104 | 7.4%).
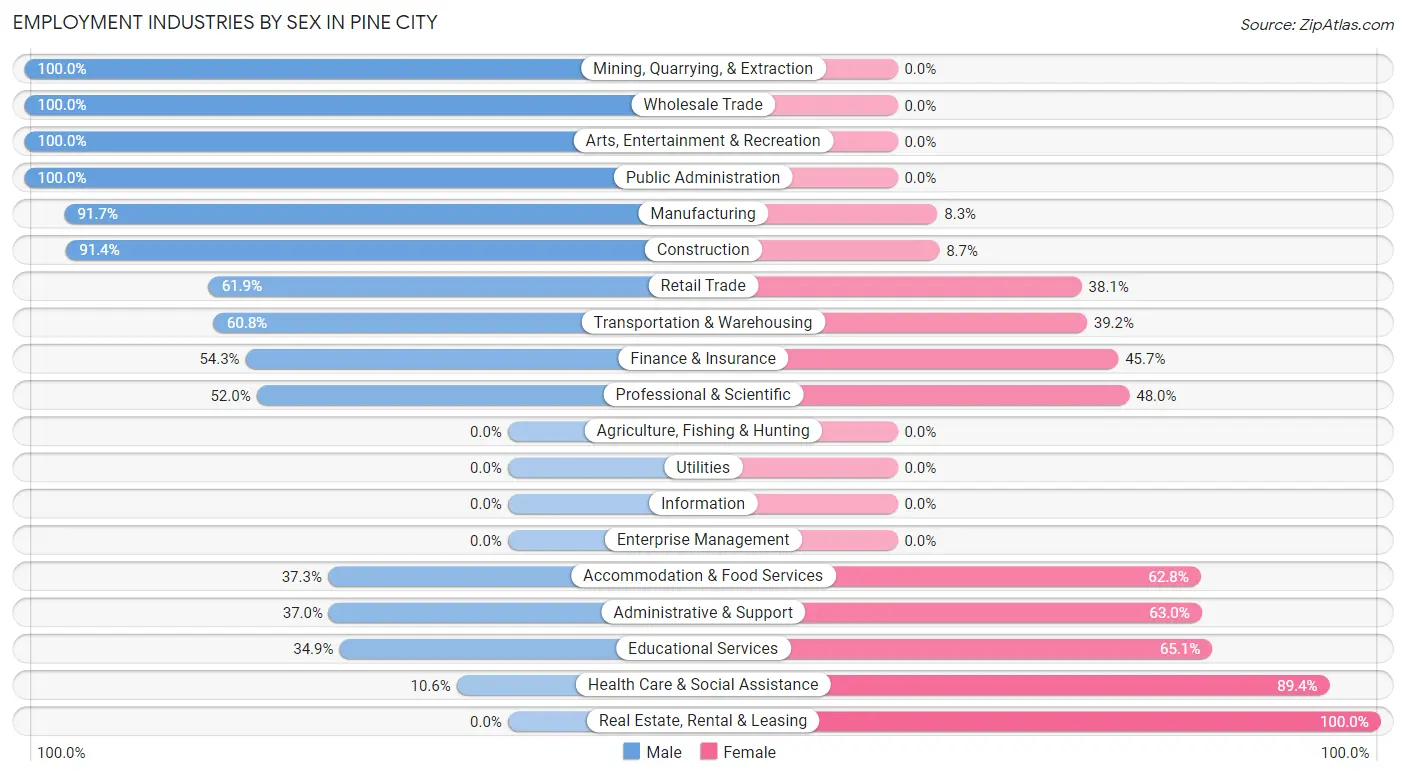
Employment Industries by Sex in Pine City
The Pine City industries that see more men than women are Mining, Quarrying, & Extraction (100.0%), Wholesale Trade (100.0%), and Arts, Entertainment & Recreation (100.0%), whereas the industries that tend to have a higher number of women are Real Estate, Rental & Leasing (100.0%), Health Care & Social Assistance (89.4%), and Educational Services (65.1%).
| Industry | Male | Female |
| Agriculture, Fishing & Hunting | 0 (0.0%) | 0 (0.0%) |
| Mining, Quarrying, & Extraction | 14 (100.0%) | 0 (0.0%) |
| Construction | 95 (91.3%) | 9 (8.6%) |
| Manufacturing | 100 (91.7%) | 9 (8.3%) |
| Wholesale Trade | 43 (100.0%) | 0 (0.0%) |
| Retail Trade | 112 (61.9%) | 69 (38.1%) |
| Transportation & Warehousing | 45 (60.8%) | 29 (39.2%) |
| Utilities | 0 (0.0%) | 0 (0.0%) |
| Information | 0 (0.0%) | 0 (0.0%) |
| Finance & Insurance | 19 (54.3%) | 16 (45.7%) |
| Real Estate, Rental & Leasing | 0 (0.0%) | 15 (100.0%) |
| Professional & Scientific | 13 (52.0%) | 12 (48.0%) |
| Enterprise Management | 0 (0.0%) | 0 (0.0%) |
| Administrative & Support | 30 (37.0%) | 51 (63.0%) |
| Educational Services | 53 (34.9%) | 99 (65.1%) |
| Health Care & Social Assistance | 41 (10.6%) | 346 (89.4%) |
| Arts, Entertainment & Recreation | 27 (100.0%) | 0 (0.0%) |
| Accommodation & Food Services | 38 (37.2%) | 64 (62.7%) |
| Public Administration | 46 (100.0%) | 0 (0.0%) |
| Total | 694 (49.1%) | 719 (50.9%) |
Education in Pine City
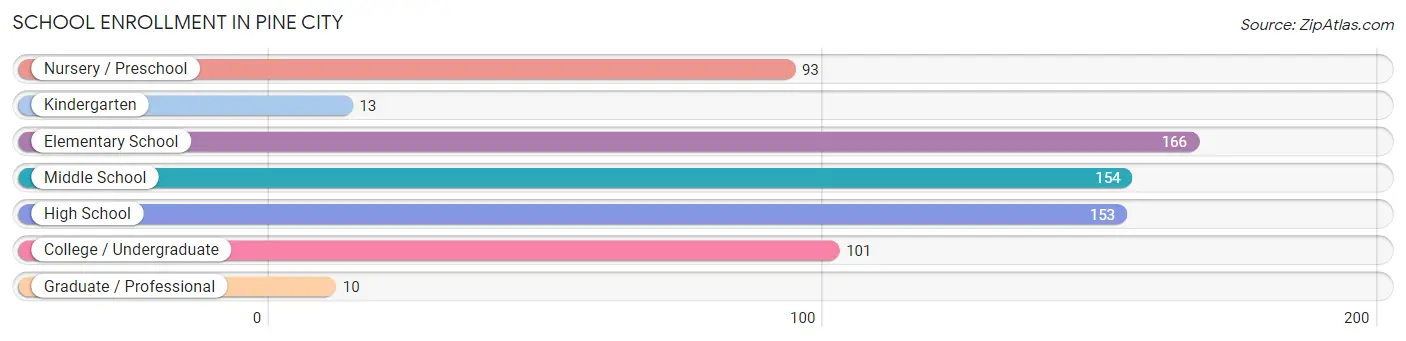
School Enrollment in Pine City
The most common levels of schooling among the 690 students in Pine City are elementary school (166 | 24.1%), middle school (154 | 22.3%), and high school (153 | 22.2%).
| School Level | # Students | % Students |
| Nursery / Preschool | 93 | 13.5% |
| Kindergarten | 13 | 1.9% |
| Elementary School | 166 | 24.1% |
| Middle School | 154 | 22.3% |
| High School | 153 | 22.2% |
| College / Undergraduate | 101 | 14.6% |
| Graduate / Professional | 10 | 1.5% |
| Total | 690 | 100.0% |
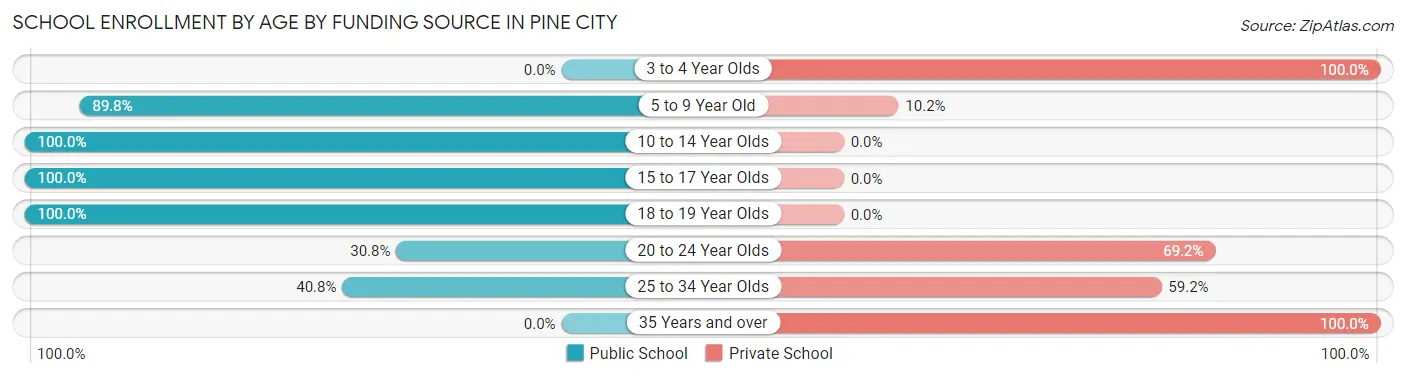
School Enrollment by Age by Funding Source in Pine City
Out of a total of 690 students who are enrolled in schools in Pine City, 151 (21.9%) attend a private institution, while the remaining 539 (78.1%) are enrolled in public schools. The age group of 3 to 4 year olds has the highest likelihood of being enrolled in private schools, with 56 (100.0% in the age bracket) enrolled. Conversely, the age group of 10 to 14 year olds has the lowest likelihood of being enrolled in a private school, with 169 (100.0% in the age bracket) attending a public institution.
| Age Bracket | Public School | Private School |
| 3 to 4 Year Olds | 0 (0.0%) | 56 (100.0%) |
| 5 to 9 Year Old | 194 (89.8%) | 22 (10.2%) |
| 10 to 14 Year Olds | 169 (100.0%) | 0 (0.0%) |
| 15 to 17 Year Olds | 34 (100.0%) | 0 (0.0%) |
| 18 to 19 Year Olds | 110 (100.0%) | 0 (0.0%) |
| 20 to 24 Year Olds | 12 (30.8%) | 27 (69.2%) |
| 25 to 34 Year Olds | 20 (40.8%) | 29 (59.2%) |
| 35 Years and over | 0 (0.0%) | 17 (100.0%) |
| Total | 539 (78.1%) | 151 (21.9%) |
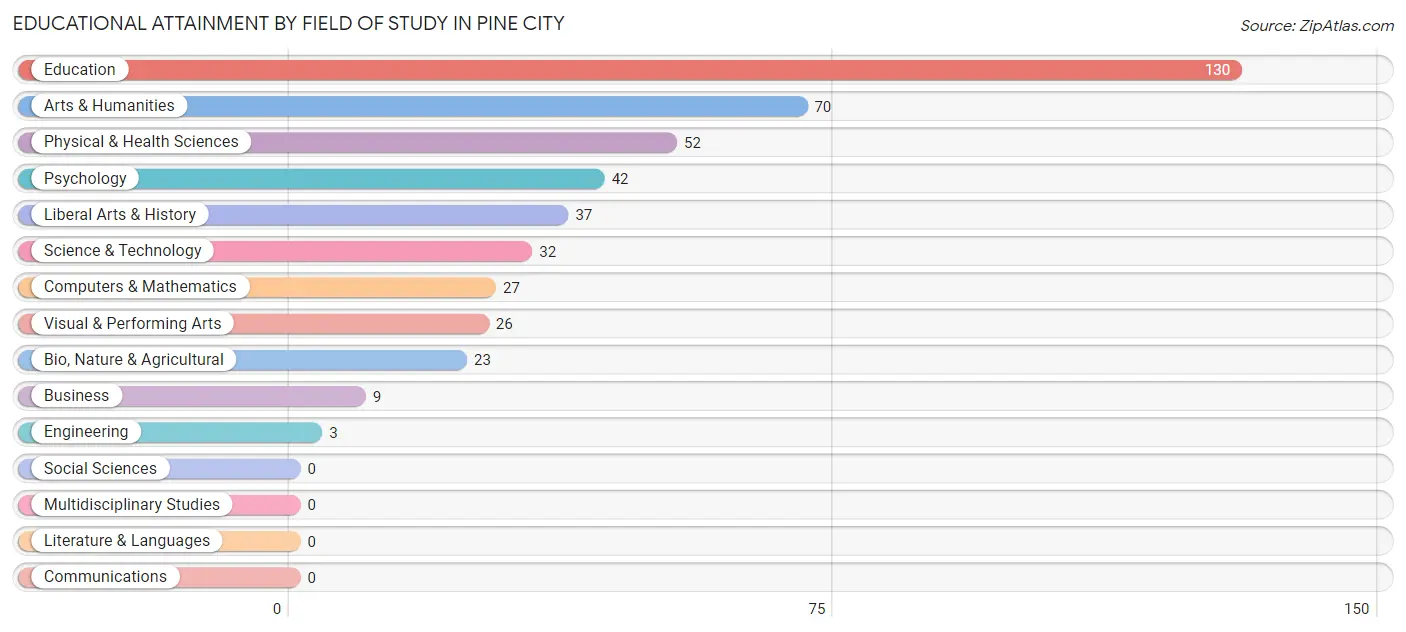
Educational Attainment by Field of Study in Pine City
Education (130 | 28.8%), arts & humanities (70 | 15.5%), physical & health sciences (52 | 11.5%), psychology (42 | 9.3%), and liberal arts & history (37 | 8.2%) are the most common fields of study among 451 individuals in Pine City who have obtained a bachelor's degree or higher.
| Field of Study | # Graduates | % Graduates |
| Computers & Mathematics | 27 | 6.0% |
| Bio, Nature & Agricultural | 23 | 5.1% |
| Physical & Health Sciences | 52 | 11.5% |
| Psychology | 42 | 9.3% |
| Social Sciences | 0 | 0.0% |
| Engineering | 3 | 0.7% |
| Multidisciplinary Studies | 0 | 0.0% |
| Science & Technology | 32 | 7.1% |
| Business | 9 | 2.0% |
| Education | 130 | 28.8% |
| Literature & Languages | 0 | 0.0% |
| Liberal Arts & History | 37 | 8.2% |
| Visual & Performing Arts | 26 | 5.8% |
| Communications | 0 | 0.0% |
| Arts & Humanities | 70 | 15.5% |
| Total | 451 | 100.0% |
Transportation & Commute in Pine City
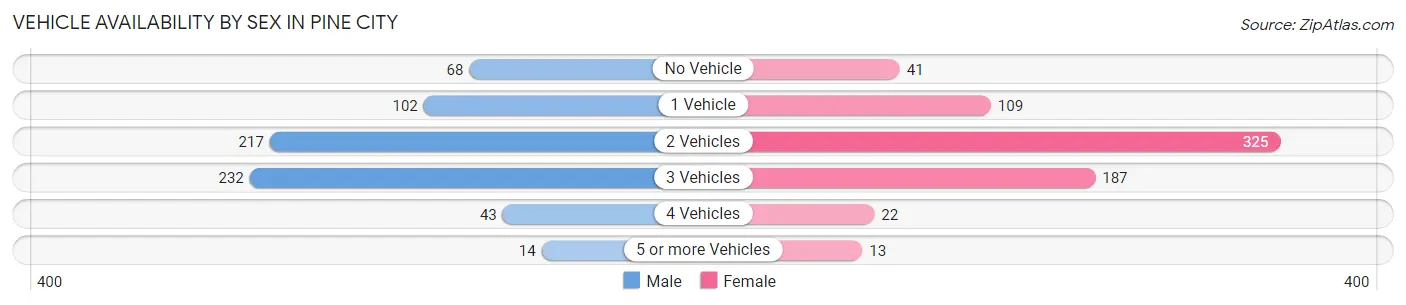
Vehicle Availability by Sex in Pine City
The most prevalent vehicle ownership categories in Pine City are males with 3 vehicles (232, accounting for 34.3%) and females with 3 vehicles (187, making up 33.3%).
| Vehicles Available | Male | Female |
| No Vehicle | 68 (10.1%) | 41 (5.9%) |
| 1 Vehicle | 102 (15.1%) | 109 (15.6%) |
| 2 Vehicles | 217 (32.1%) | 325 (46.6%) |
| 3 Vehicles | 232 (34.3%) | 187 (26.8%) |
| 4 Vehicles | 43 (6.4%) | 22 (3.2%) |
| 5 or more Vehicles | 14 (2.1%) | 13 (1.9%) |
| Total | 676 (100.0%) | 697 (100.0%) |
Commute Time in Pine City
The most frequently occuring commute durations in Pine City are 5 to 9 minutes (256 commuters, 19.4%), 45 to 59 minutes (173 commuters, 13.1%), and 60 to 89 minutes (169 commuters, 12.8%).
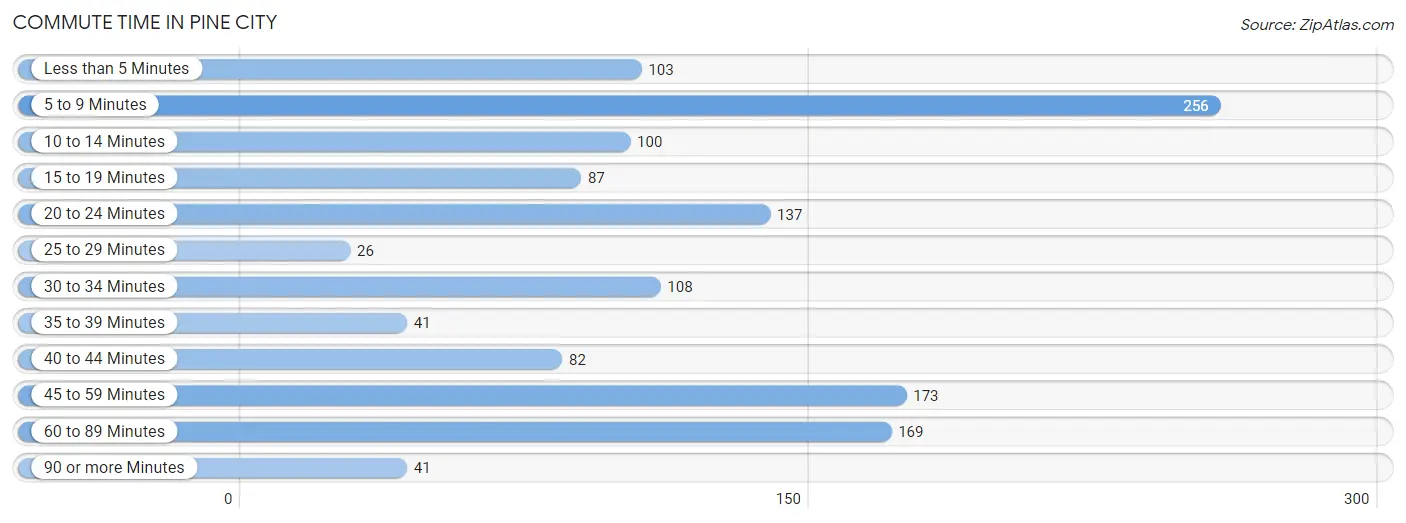
| Commute Time | # Commuters | % Commuters |
| Less than 5 Minutes | 103 | 7.8% |
| 5 to 9 Minutes | 256 | 19.4% |
| 10 to 14 Minutes | 100 | 7.6% |
| 15 to 19 Minutes | 87 | 6.6% |
| 20 to 24 Minutes | 137 | 10.4% |
| 25 to 29 Minutes | 26 | 2.0% |
| 30 to 34 Minutes | 108 | 8.2% |
| 35 to 39 Minutes | 41 | 3.1% |
| 40 to 44 Minutes | 82 | 6.2% |
| 45 to 59 Minutes | 173 | 13.1% |
| 60 to 89 Minutes | 169 | 12.8% |
| 90 or more Minutes | 41 | 3.1% |
Commute Time by Sex in Pine City
The most common commute times in Pine City are 5 to 9 minutes (143 commuters, 21.4%) for males and 60 to 89 minutes (115 commuters, 17.6%) for females.
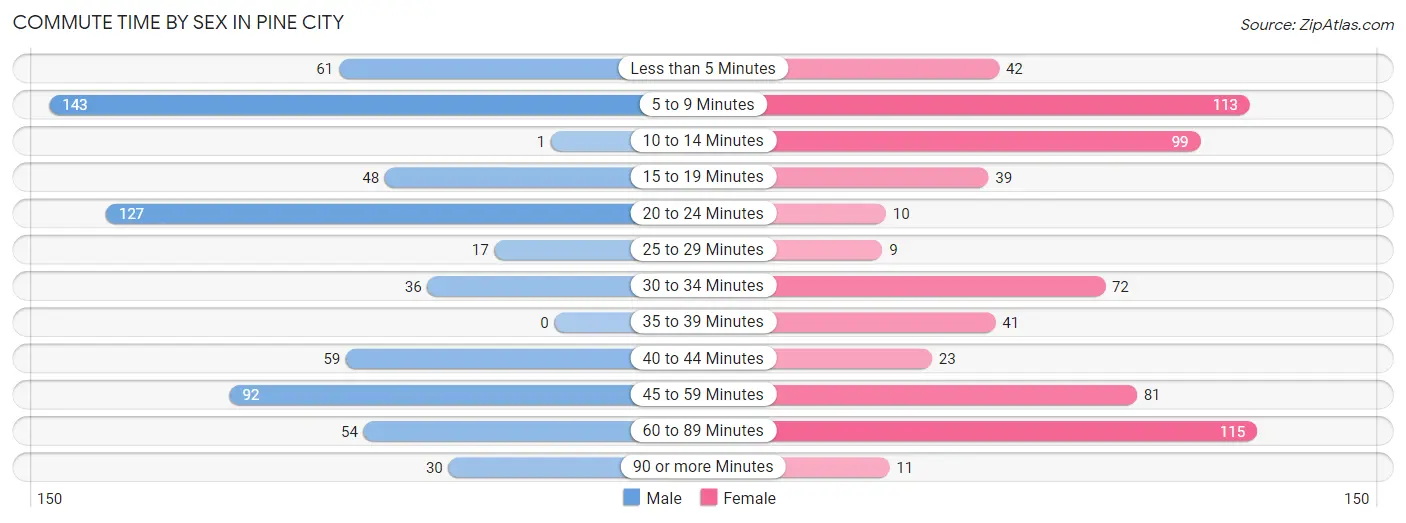
| Commute Time | Male | Female |
| Less than 5 Minutes | 61 (9.1%) | 42 (6.4%) |
| 5 to 9 Minutes | 143 (21.4%) | 113 (17.2%) |
| 10 to 14 Minutes | 1 (0.2%) | 99 (15.1%) |
| 15 to 19 Minutes | 48 (7.2%) | 39 (5.9%) |
| 20 to 24 Minutes | 127 (19.0%) | 10 (1.5%) |
| 25 to 29 Minutes | 17 (2.5%) | 9 (1.4%) |
| 30 to 34 Minutes | 36 (5.4%) | 72 (11.0%) |
| 35 to 39 Minutes | 0 (0.0%) | 41 (6.3%) |
| 40 to 44 Minutes | 59 (8.8%) | 23 (3.5%) |
| 45 to 59 Minutes | 92 (13.8%) | 81 (12.4%) |
| 60 to 89 Minutes | 54 (8.1%) | 115 (17.6%) |
| 90 or more Minutes | 30 (4.5%) | 11 (1.7%) |
Time of Departure to Work by Sex in Pine City
The most frequent times of departure to work in Pine City are 6:00 AM to 6:29 AM (94, 14.1%) for males and 12:00 PM to 3:59 PM (142, 21.7%) for females.
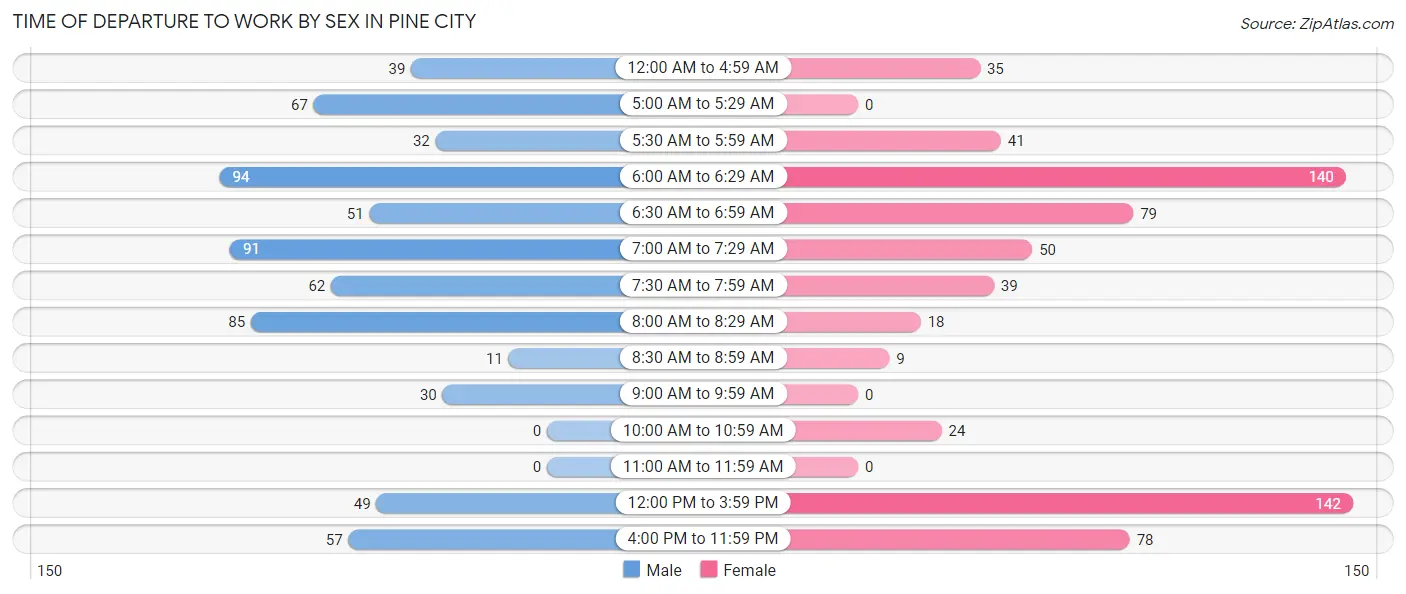
| Time of Departure | Male | Female |
| 12:00 AM to 4:59 AM | 39 (5.8%) | 35 (5.3%) |
| 5:00 AM to 5:29 AM | 67 (10.0%) | 0 (0.0%) |
| 5:30 AM to 5:59 AM | 32 (4.8%) | 41 (6.3%) |
| 6:00 AM to 6:29 AM | 94 (14.1%) | 140 (21.4%) |
| 6:30 AM to 6:59 AM | 51 (7.6%) | 79 (12.1%) |
| 7:00 AM to 7:29 AM | 91 (13.6%) | 50 (7.6%) |
| 7:30 AM to 7:59 AM | 62 (9.3%) | 39 (5.9%) |
| 8:00 AM to 8:29 AM | 85 (12.7%) | 18 (2.8%) |
| 8:30 AM to 8:59 AM | 11 (1.7%) | 9 (1.4%) |
| 9:00 AM to 9:59 AM | 30 (4.5%) | 0 (0.0%) |
| 10:00 AM to 10:59 AM | 0 (0.0%) | 24 (3.7%) |
| 11:00 AM to 11:59 AM | 0 (0.0%) | 0 (0.0%) |
| 12:00 PM to 3:59 PM | 49 (7.3%) | 142 (21.7%) |
| 4:00 PM to 11:59 PM | 57 (8.5%) | 78 (11.9%) |
| Total | 668 (100.0%) | 655 (100.0%) |
Housing Occupancy in Pine City
Occupancy by Ownership in Pine City
Of the total 1,479 dwellings in Pine City, owner-occupied units account for 973 (65.8%), while renter-occupied units make up 506 (34.2%).
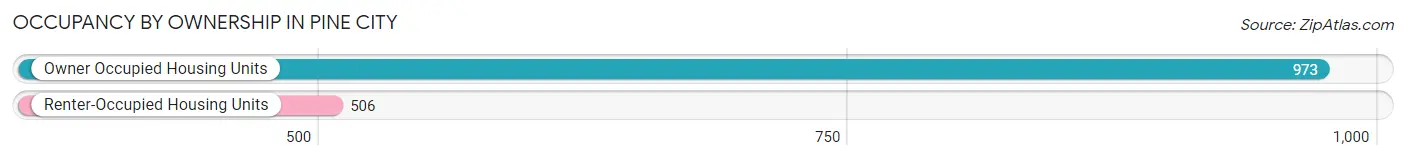
| Occupancy | # Housing Units | % Housing Units |
| Owner Occupied Housing Units | 973 | 65.8% |
| Renter-Occupied Housing Units | 506 | 34.2% |
| Total Occupied Housing Units | 1,479 | 100.0% |
Occupancy by Household Size in Pine City
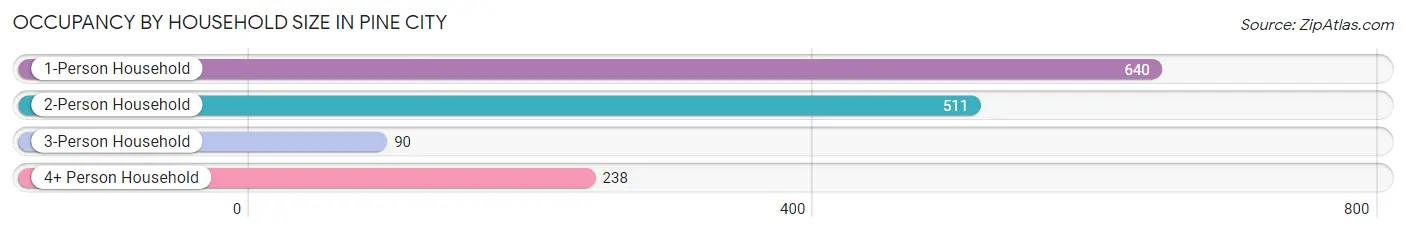
| Household Size | # Housing Units | % Housing Units |
| 1-Person Household | 640 | 43.3% |
| 2-Person Household | 511 | 34.5% |
| 3-Person Household | 90 | 6.1% |
| 4+ Person Household | 238 | 16.1% |
| Total Housing Units | 1,479 | 100.0% |
Occupancy by Ownership by Household Size in Pine City
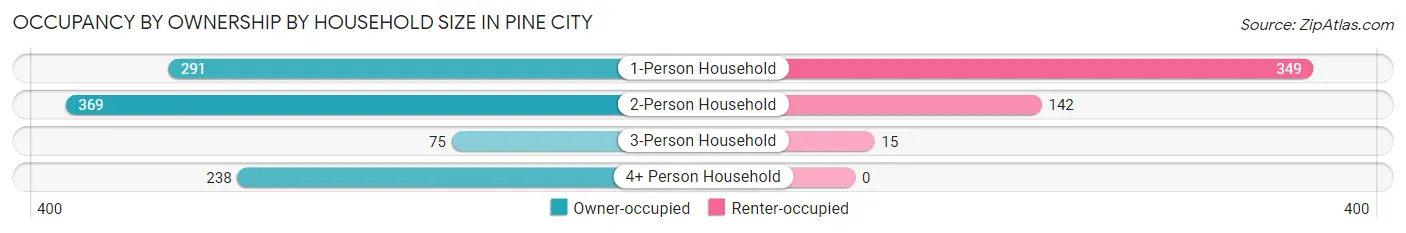
| Household Size | Owner-occupied | Renter-occupied |
| 1-Person Household | 291 (45.5%) | 349 (54.5%) |
| 2-Person Household | 369 (72.2%) | 142 (27.8%) |
| 3-Person Household | 75 (83.3%) | 15 (16.7%) |
| 4+ Person Household | 238 (100.0%) | 0 (0.0%) |
| Total Housing Units | 973 (65.8%) | 506 (34.2%) |
Occupancy by Educational Attainment in Pine City
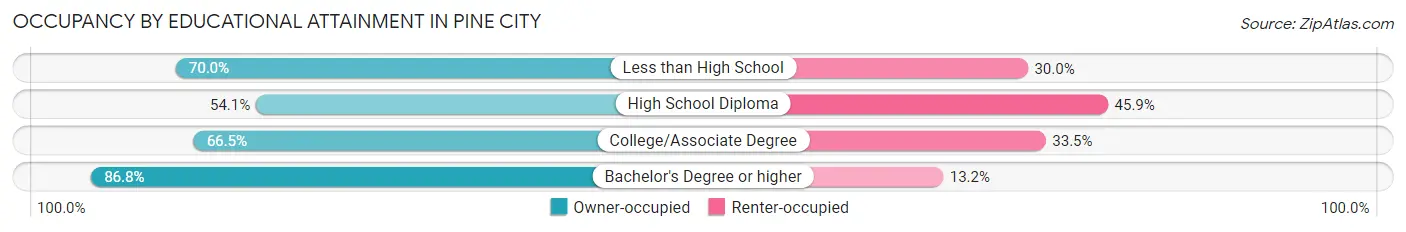
| Household Size | Owner-occupied | Renter-occupied |
| Less than High School | 112 (70.0%) | 48 (30.0%) |
| High School Diploma | 257 (54.1%) | 218 (45.9%) |
| College/Associate Degree | 420 (66.5%) | 212 (33.5%) |
| Bachelor's Degree or higher | 184 (86.8%) | 28 (13.2%) |
Occupancy by Age of Householder in Pine City
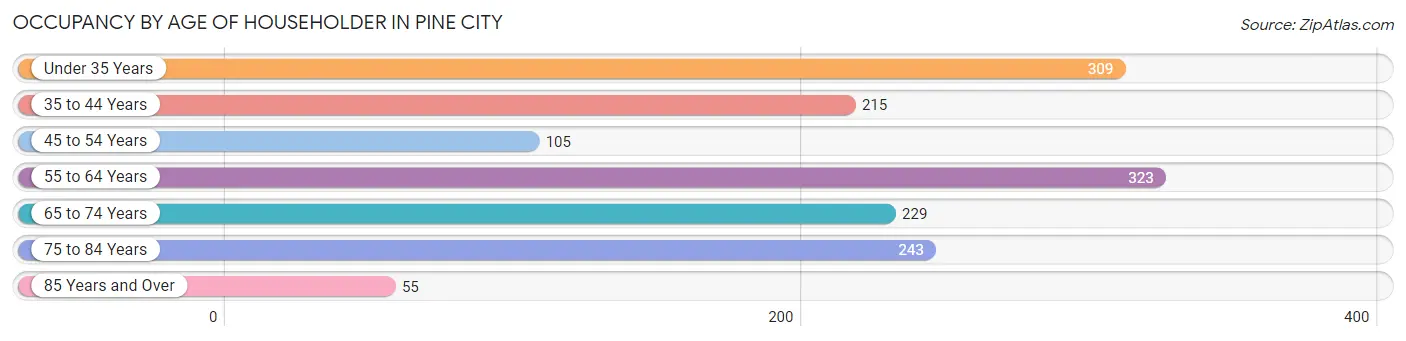
| Age Bracket | # Households | % Households |
| Under 35 Years | 309 | 20.9% |
| 35 to 44 Years | 215 | 14.5% |
| 45 to 54 Years | 105 | 7.1% |
| 55 to 64 Years | 323 | 21.8% |
| 65 to 74 Years | 229 | 15.5% |
| 75 to 84 Years | 243 | 16.4% |
| 85 Years and Over | 55 | 3.7% |
| Total | 1,479 | 100.0% |
Housing Finances in Pine City
Median Income by Occupancy in Pine City
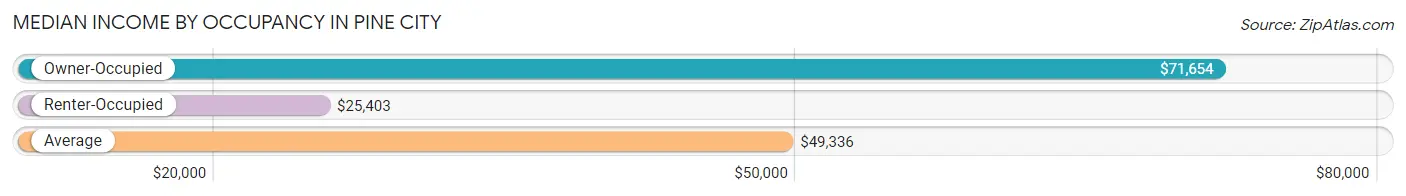
| Occupancy Type | # Households | Median Income |
| Owner-Occupied | 973 (65.8%) | $71,654 |
| Renter-Occupied | 506 (34.2%) | $25,403 |
| Average | 1,479 (100.0%) | $49,336 |
Occupancy by Householder Income Bracket in Pine City
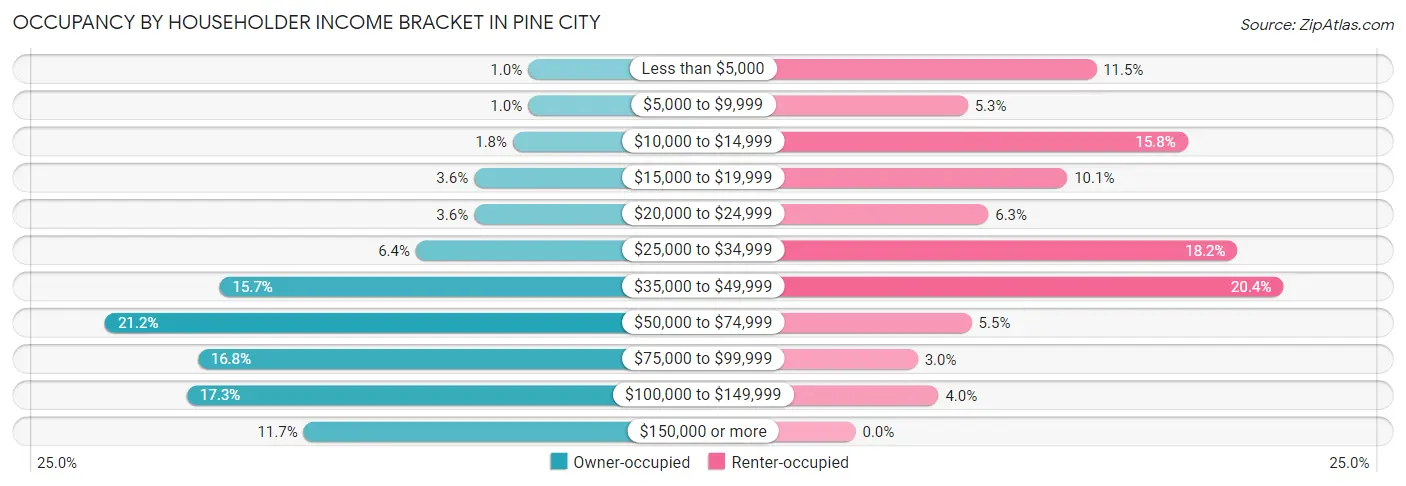
| Income Bracket | Owner-occupied | Renter-occupied |
| Less than $5,000 | 10 (1.0%) | 58 (11.5%) |
| $5,000 to $9,999 | 10 (1.0%) | 27 (5.3%) |
| $10,000 to $14,999 | 17 (1.8%) | 80 (15.8%) |
| $15,000 to $19,999 | 35 (3.6%) | 51 (10.1%) |
| $20,000 to $24,999 | 35 (3.6%) | 32 (6.3%) |
| $25,000 to $34,999 | 62 (6.4%) | 92 (18.2%) |
| $35,000 to $49,999 | 153 (15.7%) | 103 (20.4%) |
| $50,000 to $74,999 | 206 (21.2%) | 28 (5.5%) |
| $75,000 to $99,999 | 163 (16.8%) | 15 (3.0%) |
| $100,000 to $149,999 | 168 (17.3%) | 20 (4.0%) |
| $150,000 or more | 114 (11.7%) | 0 (0.0%) |
| Total | 973 (100.0%) | 506 (100.0%) |
Monthly Housing Cost Tiers in Pine City
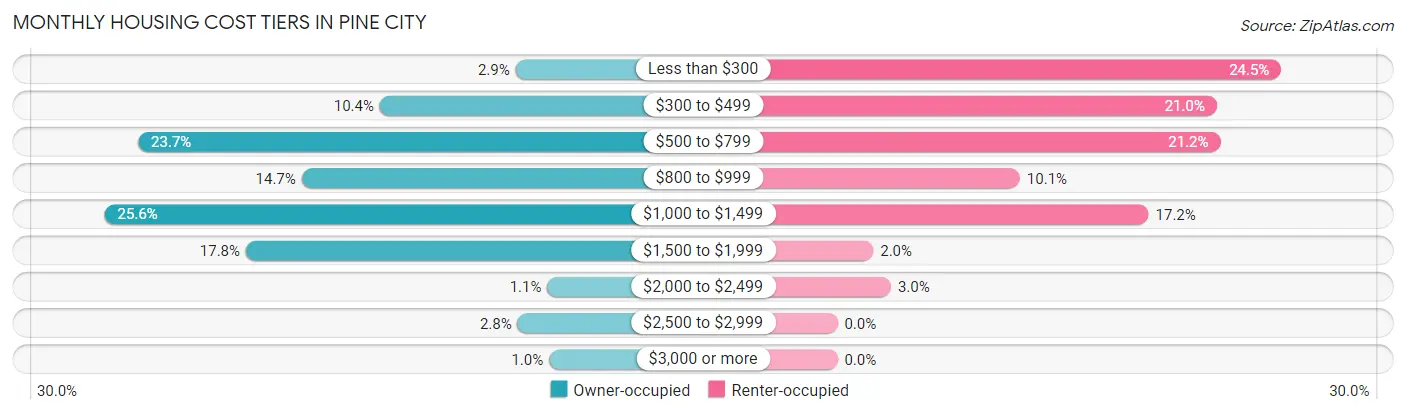
| Monthly Cost | Owner-occupied | Renter-occupied |
| Less than $300 | 28 (2.9%) | 124 (24.5%) |
| $300 to $499 | 101 (10.4%) | 106 (20.9%) |
| $500 to $799 | 231 (23.7%) | 107 (21.1%) |
| $800 to $999 | 143 (14.7%) | 51 (10.1%) |
| $1,000 to $1,499 | 249 (25.6%) | 87 (17.2%) |
| $1,500 to $1,999 | 173 (17.8%) | 10 (2.0%) |
| $2,000 to $2,499 | 11 (1.1%) | 15 (3.0%) |
| $2,500 to $2,999 | 27 (2.8%) | 0 (0.0%) |
| $3,000 or more | 10 (1.0%) | 0 (0.0%) |
| Total | 973 (100.0%) | 506 (100.0%) |
Physical Housing Characteristics in Pine City
Housing Structures in Pine City
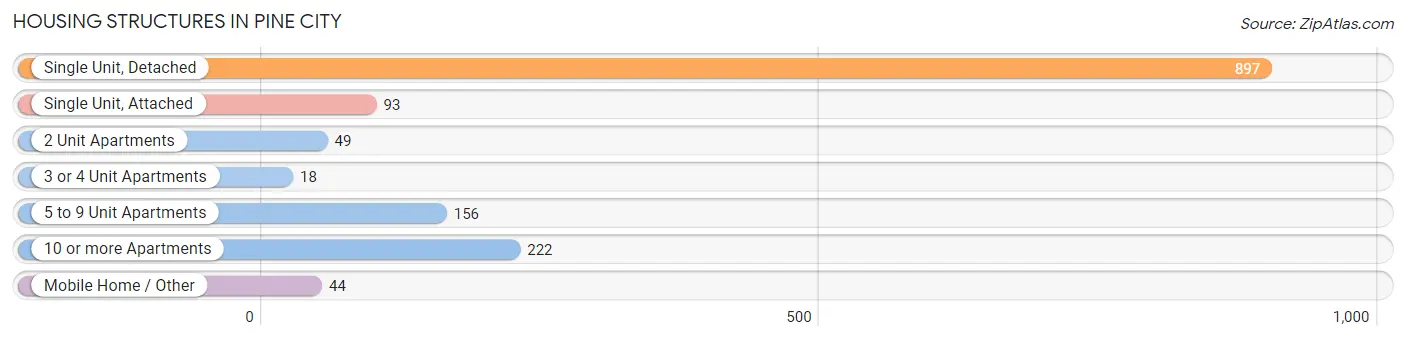
| Structure Type | # Housing Units | % Housing Units |
| Single Unit, Detached | 897 | 60.7% |
| Single Unit, Attached | 93 | 6.3% |
| 2 Unit Apartments | 49 | 3.3% |
| 3 or 4 Unit Apartments | 18 | 1.2% |
| 5 to 9 Unit Apartments | 156 | 10.5% |
| 10 or more Apartments | 222 | 15.0% |
| Mobile Home / Other | 44 | 3.0% |
| Total | 1,479 | 100.0% |
Housing Structures by Occupancy in Pine City
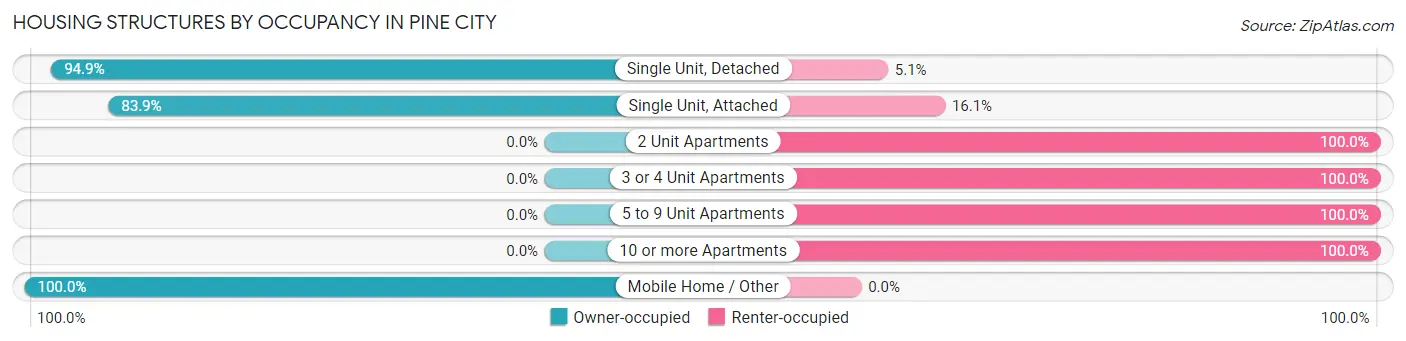
| Structure Type | Owner-occupied | Renter-occupied |
| Single Unit, Detached | 851 (94.9%) | 46 (5.1%) |
| Single Unit, Attached | 78 (83.9%) | 15 (16.1%) |
| 2 Unit Apartments | 0 (0.0%) | 49 (100.0%) |
| 3 or 4 Unit Apartments | 0 (0.0%) | 18 (100.0%) |
| 5 to 9 Unit Apartments | 0 (0.0%) | 156 (100.0%) |
| 10 or more Apartments | 0 (0.0%) | 222 (100.0%) |
| Mobile Home / Other | 44 (100.0%) | 0 (0.0%) |
| Total | 973 (65.8%) | 506 (34.2%) |
Housing Structures by Number of Rooms in Pine City
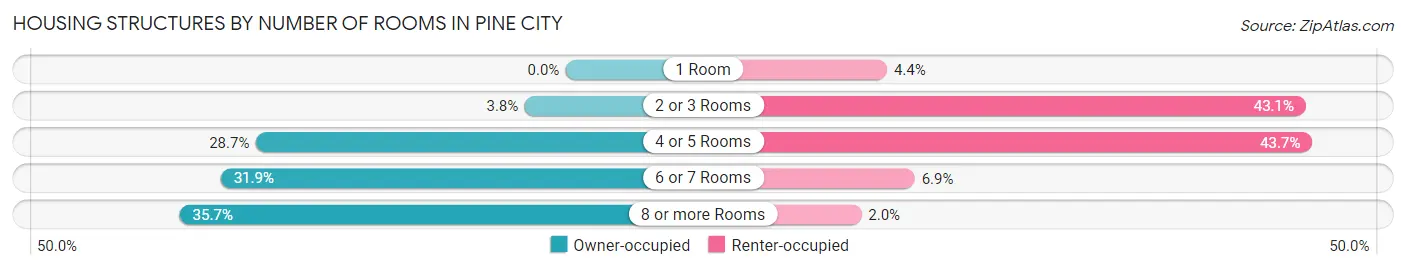
| Number of Rooms | Owner-occupied | Renter-occupied |
| 1 Room | 0 (0.0%) | 22 (4.3%) |
| 2 or 3 Rooms | 37 (3.8%) | 218 (43.1%) |
| 4 or 5 Rooms | 279 (28.7%) | 221 (43.7%) |
| 6 or 7 Rooms | 310 (31.9%) | 35 (6.9%) |
| 8 or more Rooms | 347 (35.7%) | 10 (2.0%) |
| Total | 973 (100.0%) | 506 (100.0%) |
Housing Structure by Heating Type in Pine City
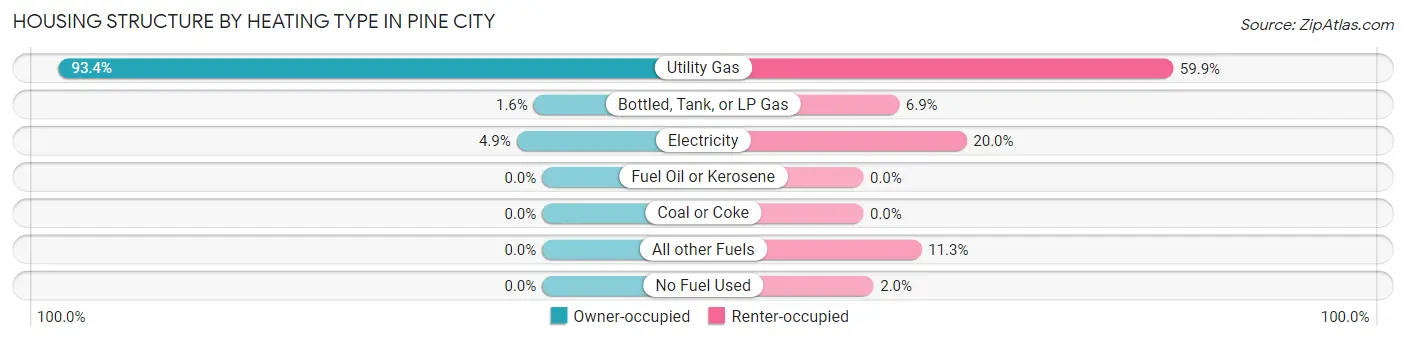
| Heating Type | Owner-occupied | Renter-occupied |
| Utility Gas | 909 (93.4%) | 303 (59.9%) |
| Bottled, Tank, or LP Gas | 16 (1.6%) | 35 (6.9%) |
| Electricity | 48 (4.9%) | 101 (20.0%) |
| Fuel Oil or Kerosene | 0 (0.0%) | 0 (0.0%) |
| Coal or Coke | 0 (0.0%) | 0 (0.0%) |
| All other Fuels | 0 (0.0%) | 57 (11.3%) |
| No Fuel Used | 0 (0.0%) | 10 (2.0%) |
| Total | 973 (100.0%) | 506 (100.0%) |
Household Vehicle Usage in Pine City
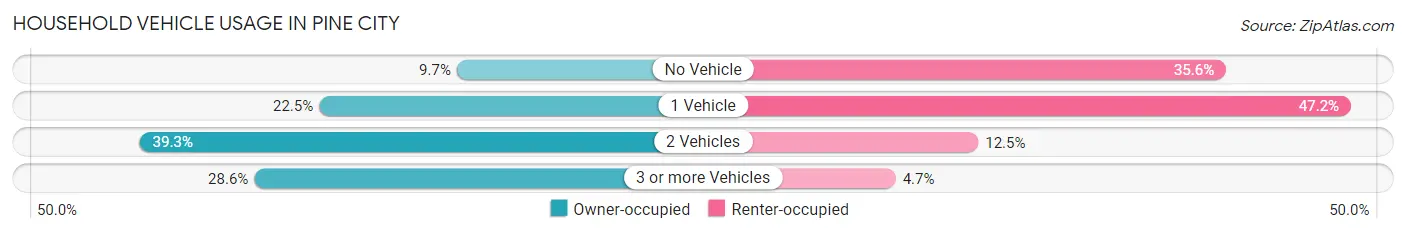
| Vehicles per Household | Owner-occupied | Renter-occupied |
| No Vehicle | 94 (9.7%) | 180 (35.6%) |
| 1 Vehicle | 219 (22.5%) | 239 (47.2%) |
| 2 Vehicles | 382 (39.3%) | 63 (12.4%) |
| 3 or more Vehicles | 278 (28.6%) | 24 (4.7%) |
| Total | 973 (100.0%) | 506 (100.0%) |
Real Estate & Mortgages in Pine City
Real Estate and Mortgage Overview in Pine City
| Characteristic | Without Mortgage | With Mortgage |
| Housing Units | 385 | 588 |
| Median Property Value | $160,800 | $179,800 |
| Median Household Income | $67,634 | $63 |
| Monthly Housing Costs | $557 | $10 |
| Real Estate Taxes | $2,350 | $0 |
Property Value by Mortgage Status in Pine City
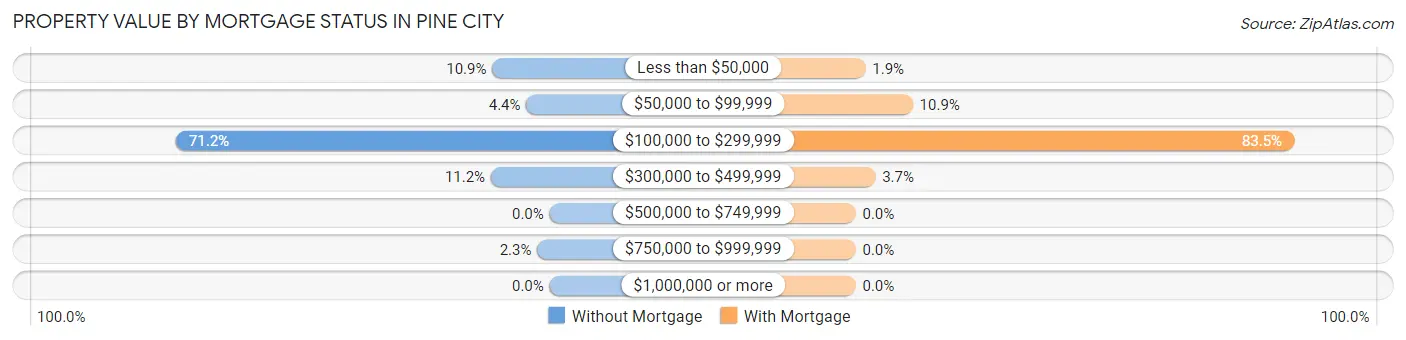
| Property Value | Without Mortgage | With Mortgage |
| Less than $50,000 | 42 (10.9%) | 11 (1.9%) |
| $50,000 to $99,999 | 17 (4.4%) | 64 (10.9%) |
| $100,000 to $299,999 | 274 (71.2%) | 491 (83.5%) |
| $300,000 to $499,999 | 43 (11.2%) | 22 (3.7%) |
| $500,000 to $749,999 | 0 (0.0%) | 0 (0.0%) |
| $750,000 to $999,999 | 9 (2.3%) | 0 (0.0%) |
| $1,000,000 or more | 0 (0.0%) | 0 (0.0%) |
| Total | 385 (100.0%) | 588 (100.0%) |
Household Income by Mortgage Status in Pine City
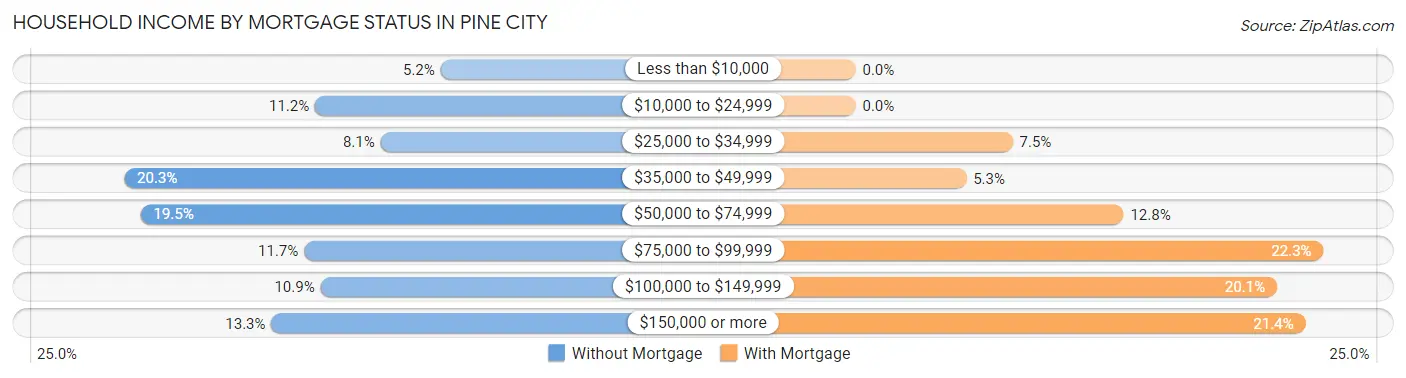
| Household Income | Without Mortgage | With Mortgage |
| Less than $10,000 | 20 (5.2%) | 0 (0.0%) |
| $10,000 to $24,999 | 43 (11.2%) | 0 (0.0%) |
| $25,000 to $34,999 | 31 (8.1%) | 44 (7.5%) |
| $35,000 to $49,999 | 78 (20.3%) | 31 (5.3%) |
| $50,000 to $74,999 | 75 (19.5%) | 75 (12.8%) |
| $75,000 to $99,999 | 45 (11.7%) | 131 (22.3%) |
| $100,000 to $149,999 | 42 (10.9%) | 118 (20.1%) |
| $150,000 or more | 51 (13.3%) | 126 (21.4%) |
| Total | 385 (100.0%) | 588 (100.0%) |
Property Value to Household Income Ratio in Pine City
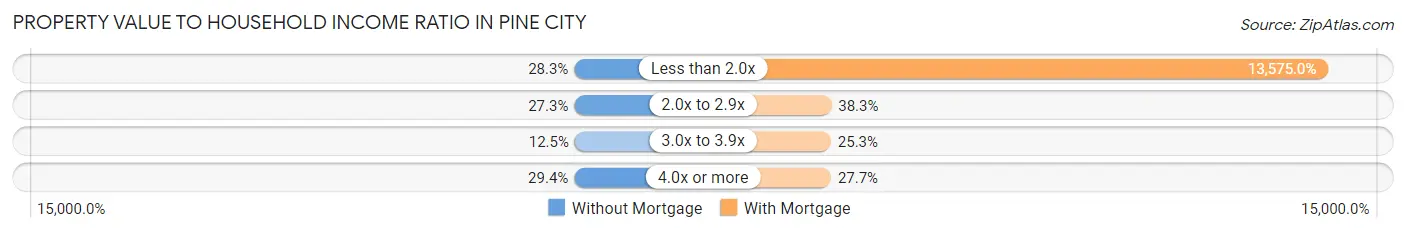
| Value-to-Income Ratio | Without Mortgage | With Mortgage |
| Less than 2.0x | 109 (28.3%) | 79,821 (13,575.0%) |
| 2.0x to 2.9x | 105 (27.3%) | 225 (38.3%) |
| 3.0x to 3.9x | 48 (12.5%) | 149 (25.3%) |
| 4.0x or more | 113 (29.3%) | 163 (27.7%) |
| Total | 385 (100.0%) | 588 (100.0%) |
Real Estate Taxes by Mortgage Status in Pine City
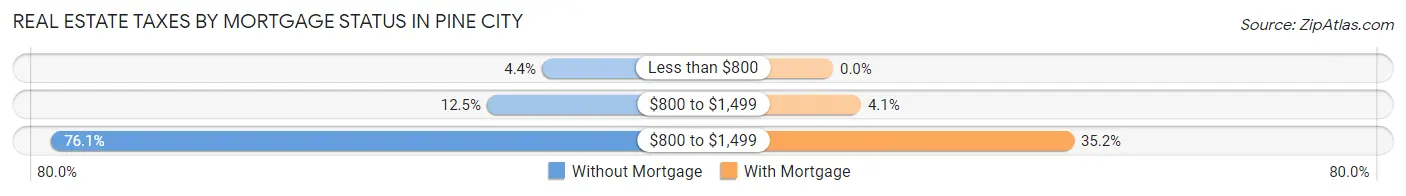
| Property Taxes | Without Mortgage | With Mortgage |
| Less than $800 | 17 (4.4%) | 0 (0.0%) |
| $800 to $1,499 | 48 (12.5%) | 24 (4.1%) |
| $800 to $1,499 | 293 (76.1%) | 207 (35.2%) |
| Total | 385 (100.0%) | 588 (100.0%) |
Health & Disability in Pine City
Health Insurance Coverage by Age in Pine City
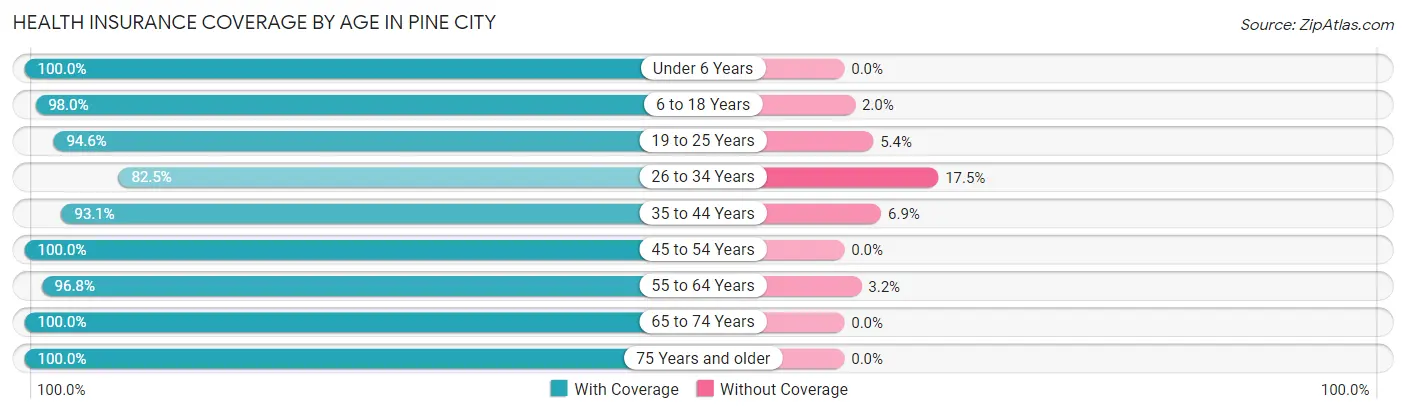
| Age Bracket | With Coverage | Without Coverage |
| Under 6 Years | 195 (100.0%) | 0 (0.0%) |
| 6 to 18 Years | 493 (98.0%) | 10 (2.0%) |
| 19 to 25 Years | 193 (94.6%) | 11 (5.4%) |
| 26 to 34 Years | 311 (82.5%) | 66 (17.5%) |
| 35 to 44 Years | 326 (93.1%) | 24 (6.9%) |
| 45 to 54 Years | 272 (100.0%) | 0 (0.0%) |
| 55 to 64 Years | 456 (96.8%) | 15 (3.2%) |
| 65 to 74 Years | 357 (100.0%) | 0 (0.0%) |
| 75 Years and older | 372 (100.0%) | 0 (0.0%) |
| Total | 2,975 (95.9%) | 126 (4.1%) |
Health Insurance Coverage by Citizenship Status in Pine City
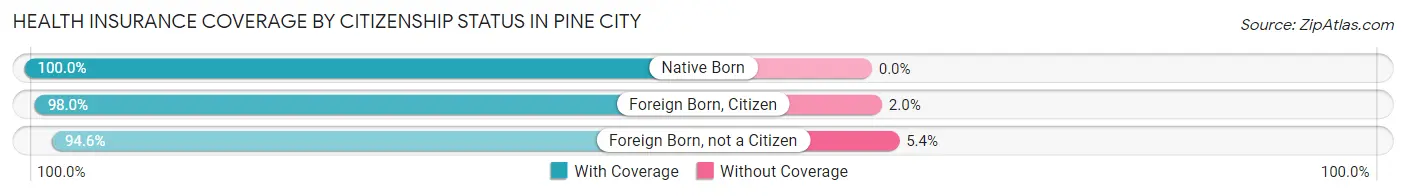
| Citizenship Status | With Coverage | Without Coverage |
| Native Born | 195 (100.0%) | 0 (0.0%) |
| Foreign Born, Citizen | 493 (98.0%) | 10 (2.0%) |
| Foreign Born, not a Citizen | 193 (94.6%) | 11 (5.4%) |
Health Insurance Coverage by Household Income in Pine City
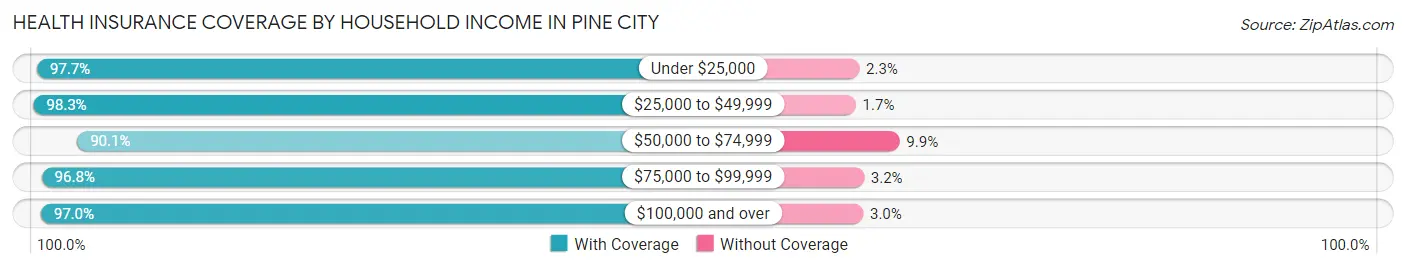
| Household Income | With Coverage | Without Coverage |
| Under $25,000 | 423 (97.7%) | 10 (2.3%) |
| $25,000 to $49,999 | 593 (98.3%) | 10 (1.7%) |
| $50,000 to $74,999 | 567 (90.1%) | 62 (9.9%) |
| $75,000 to $99,999 | 454 (96.8%) | 15 (3.2%) |
| $100,000 and over | 924 (97.0%) | 29 (3.0%) |
Public vs Private Health Insurance Coverage by Age in Pine City
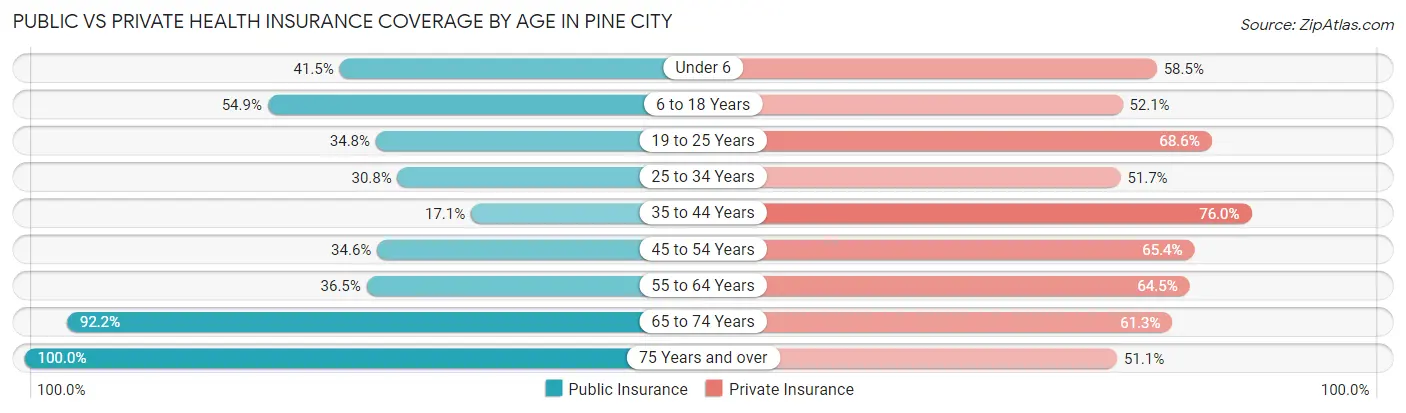
| Age Bracket | Public Insurance | Private Insurance |
| Under 6 | 81 (41.5%) | 114 (58.5%) |
| 6 to 18 Years | 276 (54.9%) | 262 (52.1%) |
| 19 to 25 Years | 71 (34.8%) | 140 (68.6%) |
| 25 to 34 Years | 116 (30.8%) | 195 (51.7%) |
| 35 to 44 Years | 60 (17.1%) | 266 (76.0%) |
| 45 to 54 Years | 94 (34.6%) | 178 (65.4%) |
| 55 to 64 Years | 172 (36.5%) | 304 (64.5%) |
| 65 to 74 Years | 329 (92.2%) | 219 (61.3%) |
| 75 Years and over | 372 (100.0%) | 190 (51.1%) |
| Total | 1,571 (50.7%) | 1,868 (60.2%) |
Disability Status by Sex by Age in Pine City
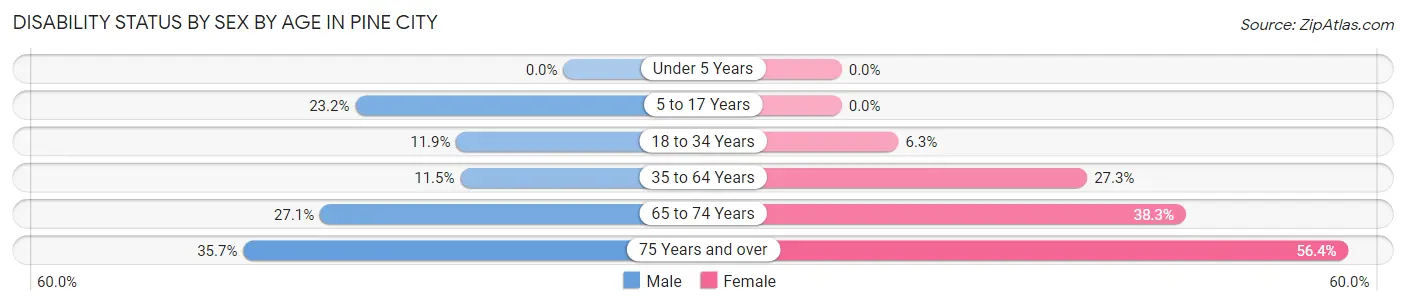
| Age Bracket | Male | Female |
| Under 5 Years | 0 (0.0%) | 0 (0.0%) |
| 5 to 17 Years | 70 (23.2%) | 0 (0.0%) |
| 18 to 34 Years | 41 (11.9%) | 22 (6.3%) |
| 35 to 64 Years | 49 (11.5%) | 182 (27.3%) |
| 65 to 74 Years | 55 (27.1%) | 59 (38.3%) |
| 75 Years and over | 41 (35.6%) | 145 (56.4%) |
Disability Class by Sex by Age in Pine City
Disability Class: Hearing Difficulty
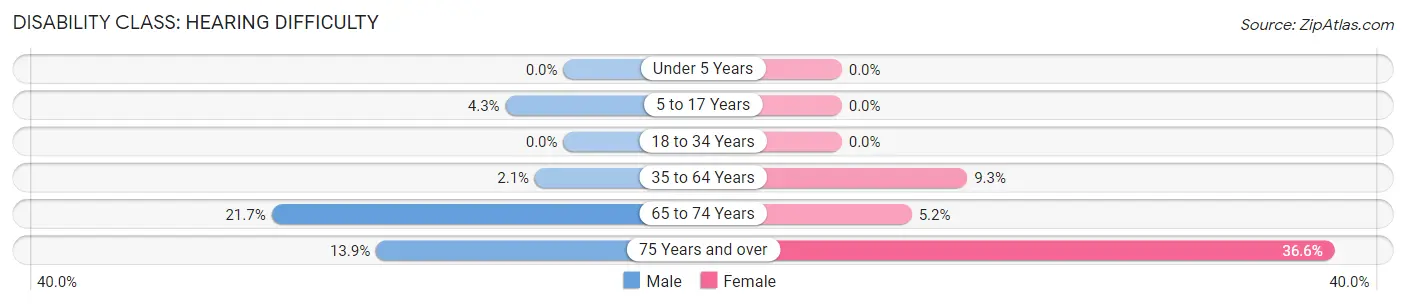
| Age Bracket | Male | Female |
| Under 5 Years | 0 (0.0%) | 0 (0.0%) |
| 5 to 17 Years | 13 (4.3%) | 0 (0.0%) |
| 18 to 34 Years | 0 (0.0%) | 0 (0.0%) |
| 35 to 64 Years | 9 (2.1%) | 62 (9.3%) |
| 65 to 74 Years | 44 (21.7%) | 8 (5.2%) |
| 75 Years and over | 16 (13.9%) | 94 (36.6%) |
Disability Class: Vision Difficulty
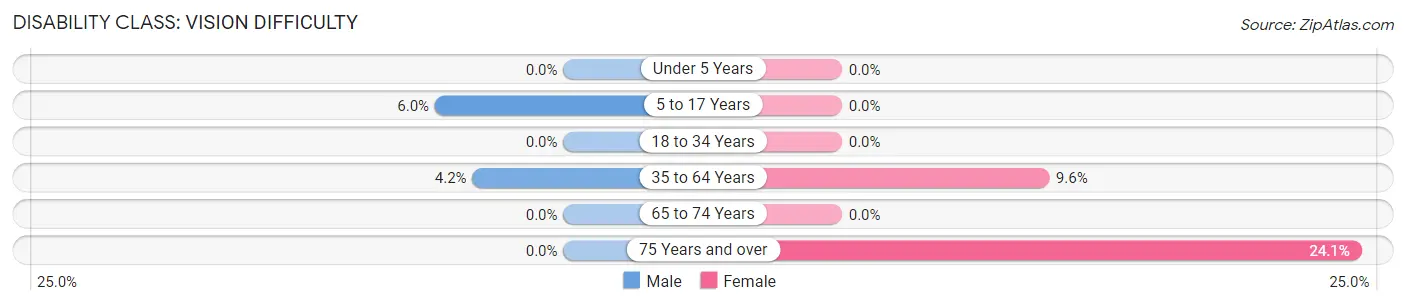
| Age Bracket | Male | Female |
| Under 5 Years | 0 (0.0%) | 0 (0.0%) |
| 5 to 17 Years | 18 (6.0%) | 0 (0.0%) |
| 18 to 34 Years | 0 (0.0%) | 0 (0.0%) |
| 35 to 64 Years | 18 (4.2%) | 64 (9.6%) |
| 65 to 74 Years | 0 (0.0%) | 0 (0.0%) |
| 75 Years and over | 0 (0.0%) | 62 (24.1%) |
Disability Class: Cognitive Difficulty
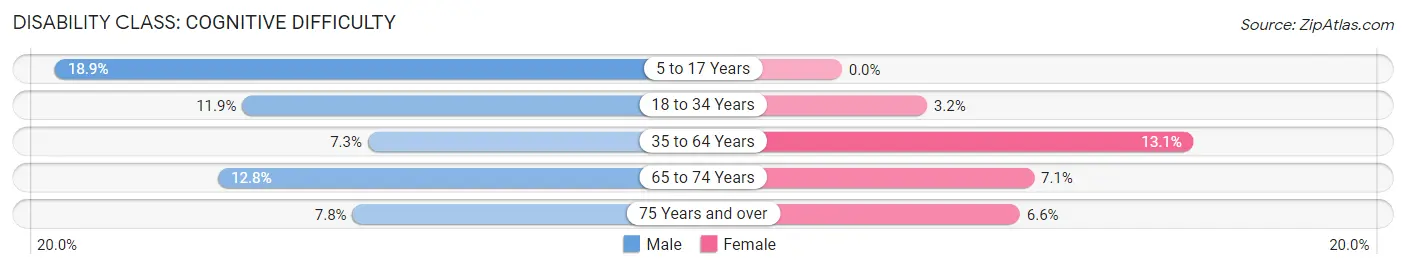
| Age Bracket | Male | Female |
| 5 to 17 Years | 57 (18.9%) | 0 (0.0%) |
| 18 to 34 Years | 41 (11.9%) | 11 (3.2%) |
| 35 to 64 Years | 31 (7.3%) | 87 (13.1%) |
| 65 to 74 Years | 26 (12.8%) | 11 (7.1%) |
| 75 Years and over | 9 (7.8%) | 17 (6.6%) |
Disability Class: Ambulatory Difficulty
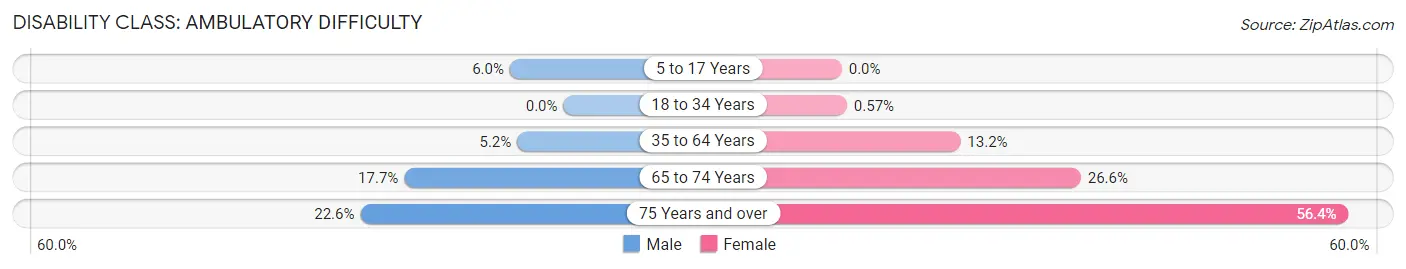
| Age Bracket | Male | Female |
| 5 to 17 Years | 18 (6.0%) | 0 (0.0%) |
| 18 to 34 Years | 0 (0.0%) | 2 (0.6%) |
| 35 to 64 Years | 22 (5.1%) | 88 (13.2%) |
| 65 to 74 Years | 36 (17.7%) | 41 (26.6%) |
| 75 Years and over | 26 (22.6%) | 145 (56.4%) |
Disability Class: Self-Care Difficulty
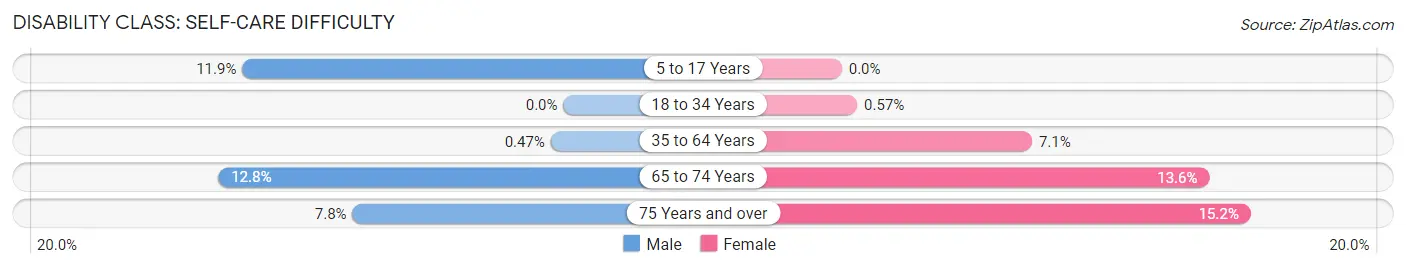
| Age Bracket | Male | Female |
| 5 to 17 Years | 36 (11.9%) | 0 (0.0%) |
| 18 to 34 Years | 0 (0.0%) | 2 (0.6%) |
| 35 to 64 Years | 2 (0.5%) | 47 (7.1%) |
| 65 to 74 Years | 26 (12.8%) | 21 (13.6%) |
| 75 Years and over | 9 (7.8%) | 39 (15.2%) |
Technology Access in Pine City
Computing Device Access in Pine City
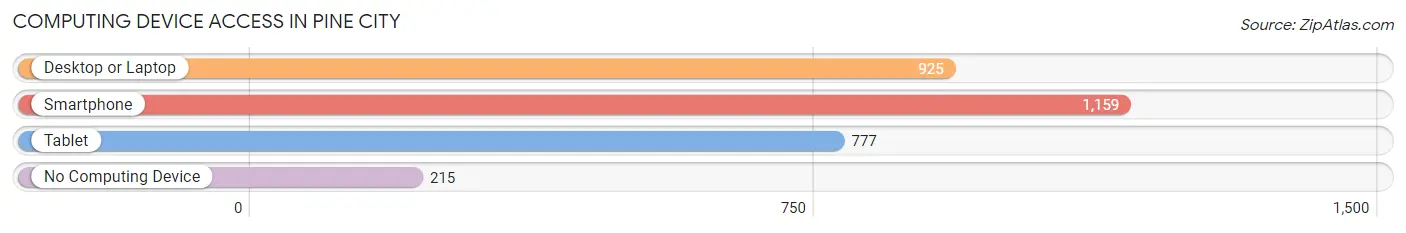
| Device Type | # Households | % Households |
| Desktop or Laptop | 925 | 62.5% |
| Smartphone | 1,159 | 78.4% |
| Tablet | 777 | 52.5% |
| No Computing Device | 215 | 14.5% |
| Total | 1,479 | 100.0% |
Internet Access in Pine City
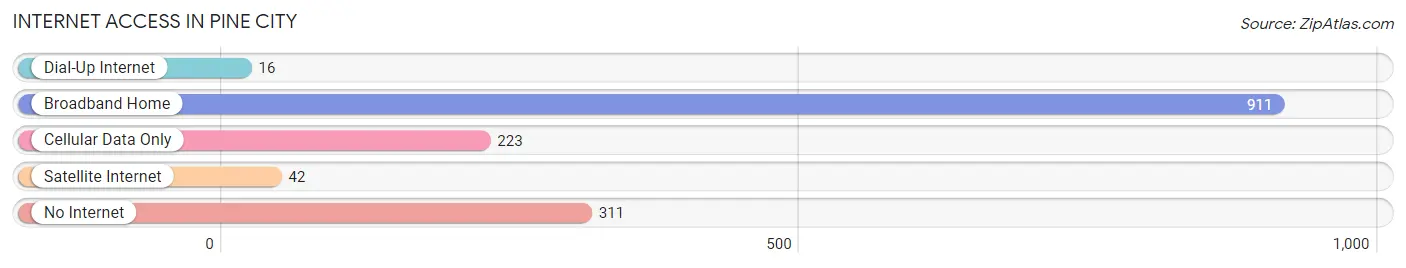
| Internet Type | # Households | % Households |
| Dial-Up Internet | 16 | 1.1% |
| Broadband Home | 911 | 61.6% |
| Cellular Data Only | 223 | 15.1% |
| Satellite Internet | 42 | 2.8% |
| No Internet | 311 | 21.0% |
| Total | 1,479 | 100.0% |
Pine City Summary
Pine City, Minnesota is a small city located in east-central Minnesota, about an hour north of the Twin Cities. It is the county seat of Pine County and has a population of about 3,000 people. The city is situated on the banks of the Snake River and is surrounded by rolling hills and forests.
History
Pine City was founded in 1856 by a group of settlers from Wisconsin. The city was named for the abundance of pine trees in the area. The settlers built a sawmill and a gristmill, and the city quickly grew. By the late 1800s, Pine City had become a thriving lumber town, with several sawmills and a thriving lumber industry.
In the early 1900s, the city began to diversify its economy. The first bank was established in 1906, and the first hospital was built in 1910. The city also became a popular tourist destination, with several resorts and hotels being built in the area.
In the 1950s, the city began to experience a decline in its lumber industry. The sawmills began to close, and the city's economy shifted to tourism and other industries. In the 1970s, the city began to experience a resurgence in its economy, with the opening of several new businesses and industries.
Geography
Pine City is located in east-central Minnesota, about an hour north of the Twin Cities. The city is situated on the banks of the Snake River and is surrounded by rolling hills and forests. The city is located in the St. Croix River Valley, which is known for its scenic beauty.
The city has a total area of 4.2 square miles, of which 4.1 square miles is land and 0.1 square miles is water. The city is located at an elevation of 1,068 feet above sea level.
Economy
Pine City's economy is largely based on tourism and services. The city is home to several resorts and hotels, as well as a variety of restaurants and shops. The city also has a thriving retail sector, with several stores and shopping centers.
The city is also home to several manufacturing and industrial businesses, including a paper mill, a printing company, and a plastics factory. The city is also home to several healthcare facilities, including a hospital and several clinics.
Demographics
As of the 2010 census, Pine City had a population of 3,127 people. The racial makeup of the city was 94.3% White, 0.7% African American, 0.3% Native American, 0.3% Asian, 0.1% Pacific Islander, 2.2% from other races, and 2.3% from two or more races. Hispanic or Latino of any race were 4.2% of the population.
The median household income in Pine City was $41,944, and the median family income was $50,917. The per capita income for the city was $20,945. About 11.3% of families and 14.2% of the population were below the poverty line, including 19.2% of those under age 18 and 8.2% of those age 65 or over.
Common Questions
What is Per Capita Income in Pine City?
Per Capita income in Pine City is $32,142.
What is the Median Family Income in Pine City?
Median Family Income in Pine City is $74,958.
What is the Median Household income in Pine City?
Median Household Income in Pine City is $49,336.
What is Income or Wage Gap in Pine City?
Income or Wage Gap in Pine City is 43.3%.
Women in Pine City earn 56.7 cents for every dollar earned by a man.
What is Inequality or Gini Index in Pine City?
Inequality or Gini Index in Pine City is 0.45.
What is the Total Population of Pine City?
Total Population of Pine City is 3,205.
What is the Total Male Population of Pine City?
Total Male Population of Pine City is 1,525.
What is the Total Female Population of Pine City?
Total Female Population of Pine City is 1,680.
What is the Ratio of Males per 100 Females in Pine City?
There are 90.77 Males per 100 Females in Pine City.
What is the Ratio of Females per 100 Males in Pine City?
There are 110.16 Females per 100 Males in Pine City.
What is the Median Population Age in Pine City?
Median Population Age in Pine City is 42.8 Years.
What is the Average Family Size in Pine City
Average Family Size in Pine City is 3.0 People.
What is the Average Household Size in Pine City
Average Household Size in Pine City is 2.1 People.
How Large is the Labor Force in Pine City?
There are 1,486 People in the Labor Forcein in Pine City.
What is the Percentage of People in the Labor Force in Pine City?
56.4% of People are in the Labor Force in Pine City.
What is the Unemployment Rate in Pine City?
Unemployment Rate in Pine City is 4.9%.