Oslo, MN Map & Demographics
Oslo Map
Oslo Overview
$32,609
PER CAPITA INCOME
$86,250
AVG FAMILY INCOME
$72,000
AVG HOUSEHOLD INCOME
39.0%
WAGE / INCOME GAP [ % ]
61.0¢/ $1
WAGE / INCOME GAP [ $ ]
0.35
INEQUALITY / GINI INDEX
327
TOTAL POPULATION
176
MALE POPULATION
151
FEMALE POPULATION
116.56
MALES / 100 FEMALES
85.80
FEMALES / 100 MALES
30.6
MEDIAN AGE
3.7
AVG FAMILY SIZE
2.7
AVG HOUSEHOLD SIZE
139
LABOR FORCE [ PEOPLE ]
57.9%
PERCENT IN LABOR FORCE
2.2%
UNEMPLOYMENT RATE
Oslo Zip Codes
Oslo Area Codes
Income in Oslo
Income Overview in Oslo
Per Capita Income in Oslo is $32,609, while median incomes of families and households are $86,250 and $72,000 respectively.
| Characteristic | Number | Measure |
| Per Capita Income | 327 | $32,609 |
| Median Family Income | 72 | $86,250 |
| Mean Family Income | 72 | $105,469 |
| Median Household Income | 120 | $72,000 |
| Mean Household Income | 120 | $89,989 |
| Income Deficit | 72 | $0 |
| Wage / Income Gap (%) | 327 | 39.02% |
| Wage / Income Gap ($) | 327 | 60.98¢ per $1 |
| Gini / Inequality Index | 327 | 0.35 |
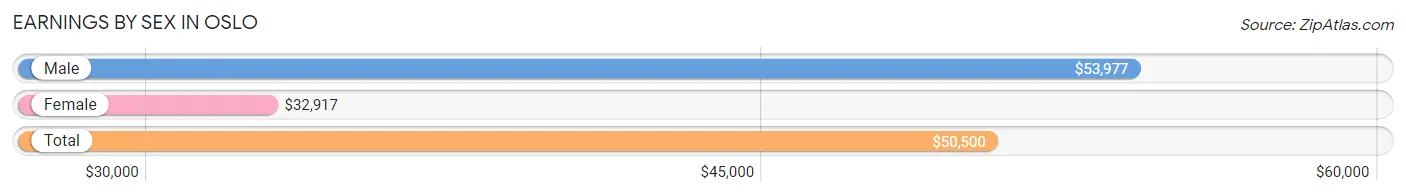
Earnings by Sex in Oslo
Average Earnings in Oslo are $50,500, $53,977 for men and $32,917 for women, a difference of 39.0%.
| Sex | Number | Average Earnings |
| Male | 102 (62.2%) | $53,977 |
| Female | 62 (37.8%) | $32,917 |
| Total | 164 (100.0%) | $50,500 |
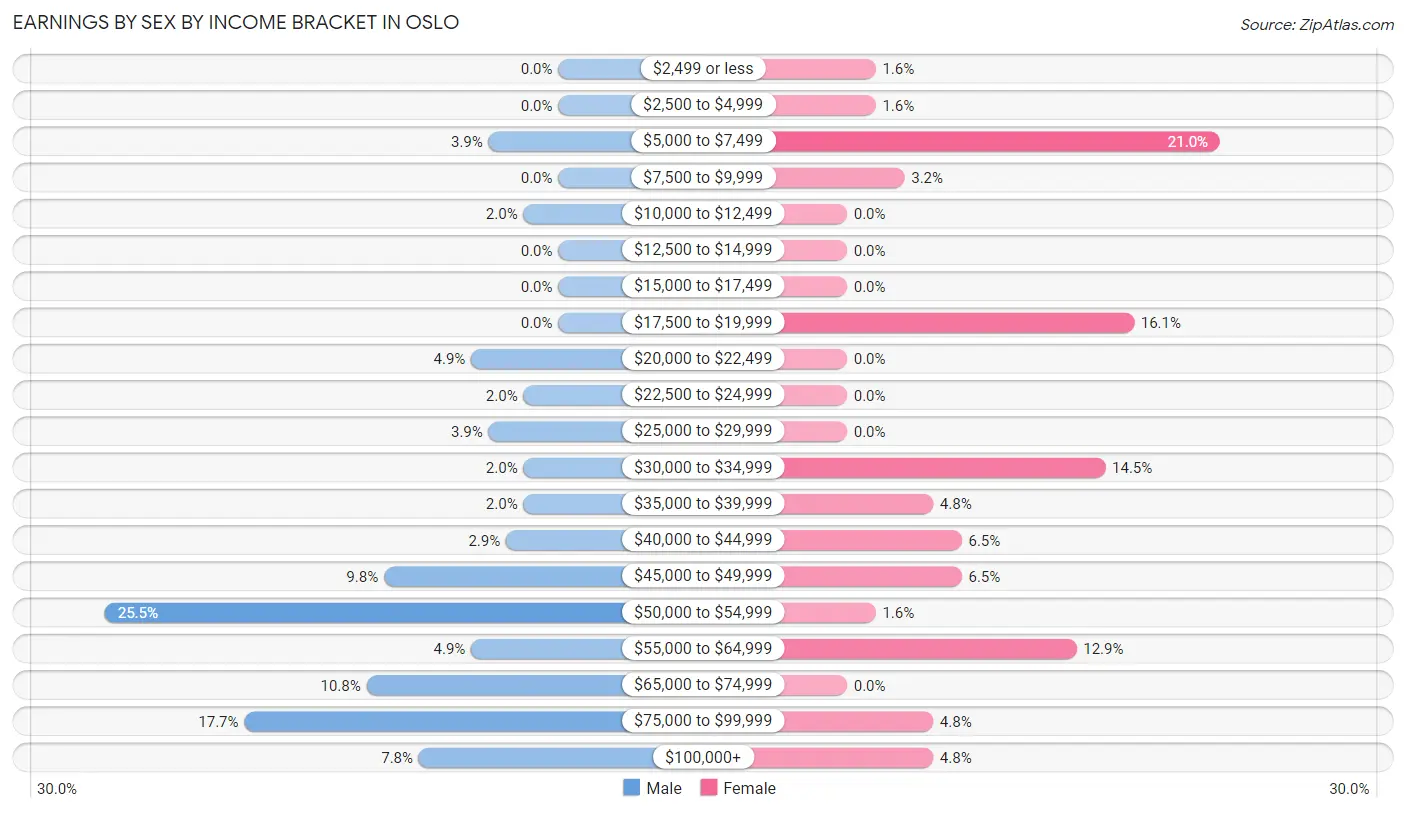
Earnings by Sex by Income Bracket in Oslo
The most common earnings brackets in Oslo are $50,000 to $54,999 for men (26 | 25.5%) and $5,000 to $7,499 for women (13 | 21.0%).
| Income | Male | Female |
| $2,499 or less | 0 (0.0%) | 1 (1.6%) |
| $2,500 to $4,999 | 0 (0.0%) | 1 (1.6%) |
| $5,000 to $7,499 | 4 (3.9%) | 13 (21.0%) |
| $7,500 to $9,999 | 0 (0.0%) | 2 (3.2%) |
| $10,000 to $12,499 | 2 (2.0%) | 0 (0.0%) |
| $12,500 to $14,999 | 0 (0.0%) | 0 (0.0%) |
| $15,000 to $17,499 | 0 (0.0%) | 0 (0.0%) |
| $17,500 to $19,999 | 0 (0.0%) | 10 (16.1%) |
| $20,000 to $22,499 | 5 (4.9%) | 0 (0.0%) |
| $22,500 to $24,999 | 2 (2.0%) | 0 (0.0%) |
| $25,000 to $29,999 | 4 (3.9%) | 0 (0.0%) |
| $30,000 to $34,999 | 2 (2.0%) | 9 (14.5%) |
| $35,000 to $39,999 | 2 (2.0%) | 3 (4.8%) |
| $40,000 to $44,999 | 3 (2.9%) | 4 (6.5%) |
| $45,000 to $49,999 | 10 (9.8%) | 4 (6.5%) |
| $50,000 to $54,999 | 26 (25.5%) | 1 (1.6%) |
| $55,000 to $64,999 | 5 (4.9%) | 8 (12.9%) |
| $65,000 to $74,999 | 11 (10.8%) | 0 (0.0%) |
| $75,000 to $99,999 | 18 (17.6%) | 3 (4.8%) |
| $100,000+ | 8 (7.8%) | 3 (4.8%) |
| Total | 102 (100.0%) | 62 (100.0%) |
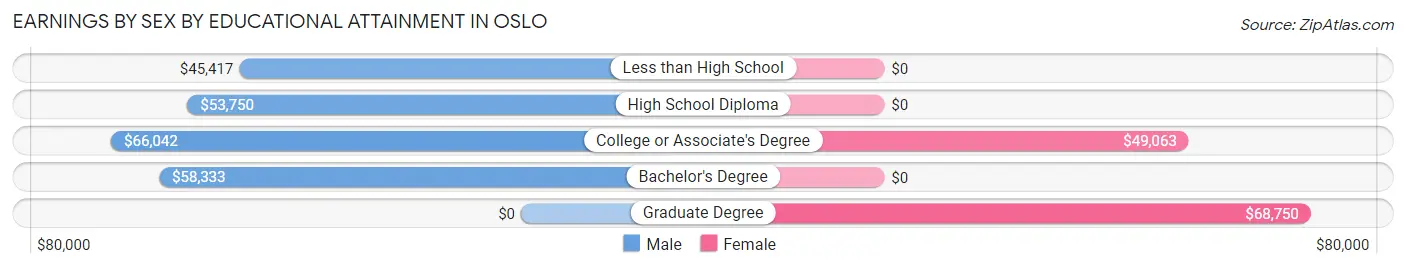
Earnings by Sex by Educational Attainment in Oslo
Average earnings in Oslo are $53,977 for men and $35,625 for women, a difference of 34.0%. Men with an educational attainment of college or associate's degree enjoy the highest average annual earnings of $66,042, while those with less than high school education earn the least with $45,417. Women with an educational attainment of graduate degree earn the most with the average annual earnings of $68,750, while those with college or associate's degree education have the smallest earnings of $49,063.
| Educational Attainment | Male Income | Female Income |
| Less than High School | $45,417 | $0 |
| High School Diploma | $53,750 | $0 |
| College or Associate's Degree | $66,042 | $49,063 |
| Bachelor's Degree | $58,333 | $0 |
| Graduate Degree | - | - |
| Total | $53,977 | $35,625 |
Family Income in Oslo
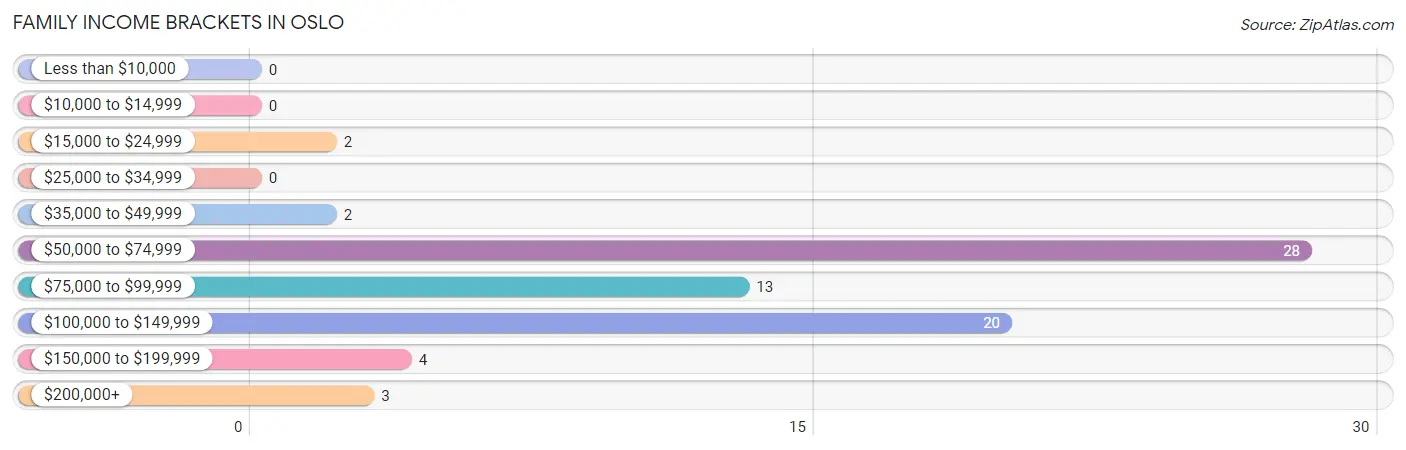
Family Income Brackets in Oslo
According to the Oslo family income data, there are 28 families falling into the $50,000 to $74,999 income range, which is the most common income bracket and makes up 38.9% of all families.
| Income Bracket | # Families | % Families |
| Less than $10,000 | 0 | 0.0% |
| $10,000 to $14,999 | 0 | 0.0% |
| $15,000 to $24,999 | 2 | 2.8% |
| $25,000 to $34,999 | 0 | 0.0% |
| $35,000 to $49,999 | 2 | 2.8% |
| $50,000 to $74,999 | 28 | 38.9% |
| $75,000 to $99,999 | 13 | 18.1% |
| $100,000 to $149,999 | 20 | 27.8% |
| $150,000 to $199,999 | 4 | 5.6% |
| $200,000+ | 3 | 4.2% |
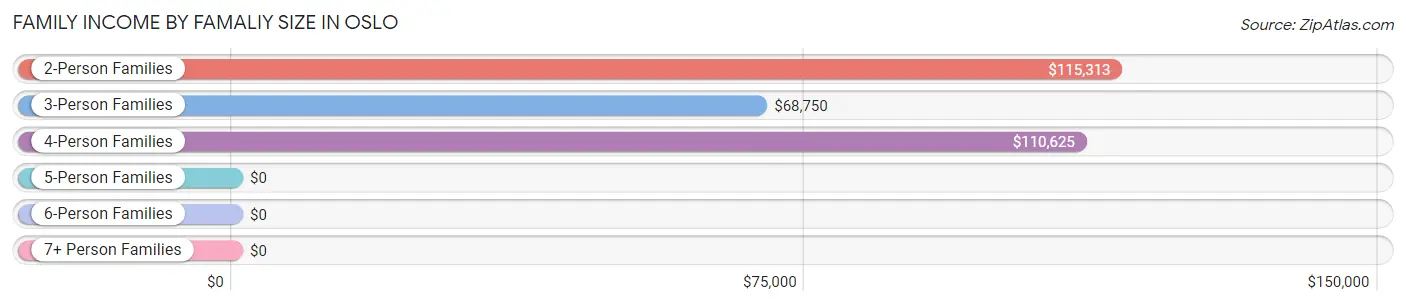
Family Income by Famaliy Size in Oslo
2-person families (25 | 34.7%) account for the highest median family income in Oslo with $115,313 per family, while 2-person families (25 | 34.7%) have the highest median income of $57,656 per family member.
| Income Bracket | # Families | Median Income |
| 2-Person Families | 25 (34.7%) | $115,313 |
| 3-Person Families | 14 (19.4%) | $68,750 |
| 4-Person Families | 12 (16.7%) | $110,625 |
| 5-Person Families | 4 (5.6%) | $0 |
| 6-Person Families | 17 (23.6%) | $0 |
| 7+ Person Families | 0 (0.0%) | $0 |
| Total | 72 (100.0%) | $86,250 |
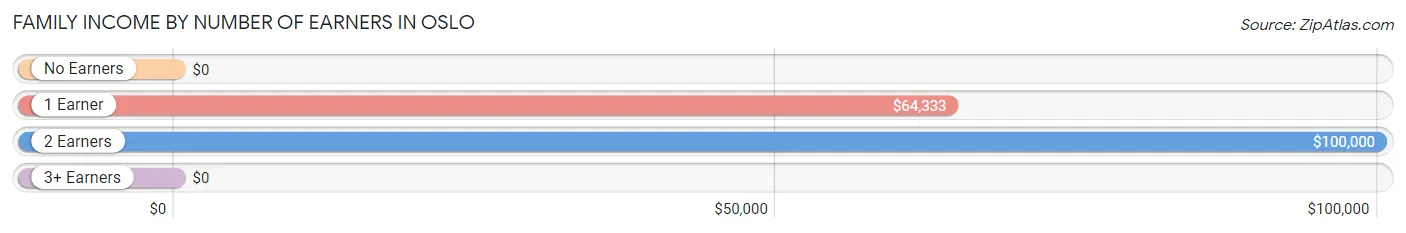
Family Income by Number of Earners in Oslo
| Number of Earners | # Families | Median Income |
| No Earners | 4 (5.6%) | $0 |
| 1 Earner | 28 (38.9%) | $64,333 |
| 2 Earners | 40 (55.6%) | $100,000 |
| 3+ Earners | 0 (0.0%) | $0 |
| Total | 72 (100.0%) | $86,250 |
Household Income in Oslo
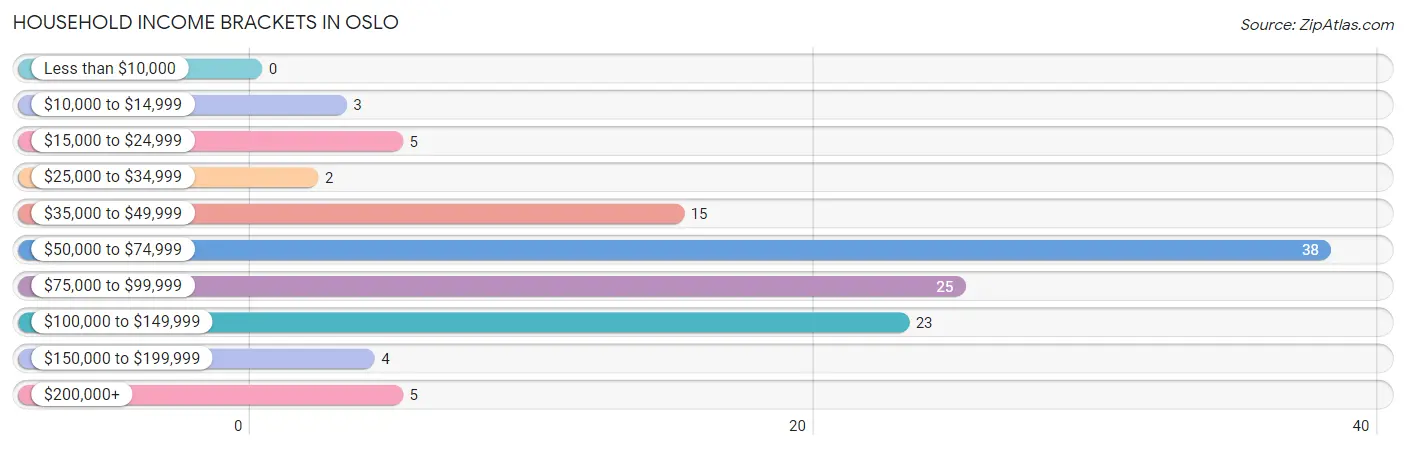
Household Income Brackets in Oslo
With 38 households falling in the category, the $50,000 to $74,999 income range is the most frequent in Oslo, accounting for 31.7% of all households.
| Income Bracket | # Households | % Households |
| Less than $10,000 | 0 | 0.0% |
| $10,000 to $14,999 | 3 | 2.5% |
| $15,000 to $24,999 | 5 | 4.2% |
| $25,000 to $34,999 | 2 | 1.7% |
| $35,000 to $49,999 | 15 | 12.5% |
| $50,000 to $74,999 | 38 | 31.7% |
| $75,000 to $99,999 | 25 | 20.8% |
| $100,000 to $149,999 | 23 | 19.2% |
| $150,000 to $199,999 | 4 | 3.3% |
| $200,000+ | 5 | 4.2% |
Household Income by Householder Age in Oslo
The median household income in Oslo is $72,000, with the highest median household income of $86,250 found in the 65+ years age bracket for the primary householder. A total of 15 households (12.5%) fall into this category. Meanwhile, the 15 to 24 years age bracket for the primary householder has the lowest median household income of $0, with 8 households (6.7%) in this group.
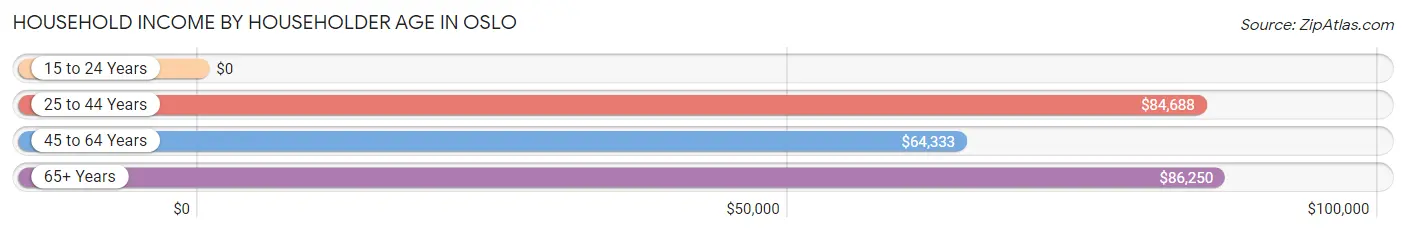
| Income Bracket | # Households | Median Income |
| 15 to 24 Years | 8 (6.7%) | $0 |
| 25 to 44 Years | 49 (40.8%) | $84,688 |
| 45 to 64 Years | 48 (40.0%) | $64,333 |
| 65+ Years | 15 (12.5%) | $86,250 |
| Total | 120 (100.0%) | $72,000 |
Poverty in Oslo
Income Below Poverty by Sex and Age in Oslo
With 1.1% poverty level for males and 0.7% for females among the residents of Oslo, 55 to 64 year old males and 75 year old and over females are the most vulnerable to poverty, with 2 males (11.1%) and 1 females (12.5%) in their respective age groups living below the poverty level.
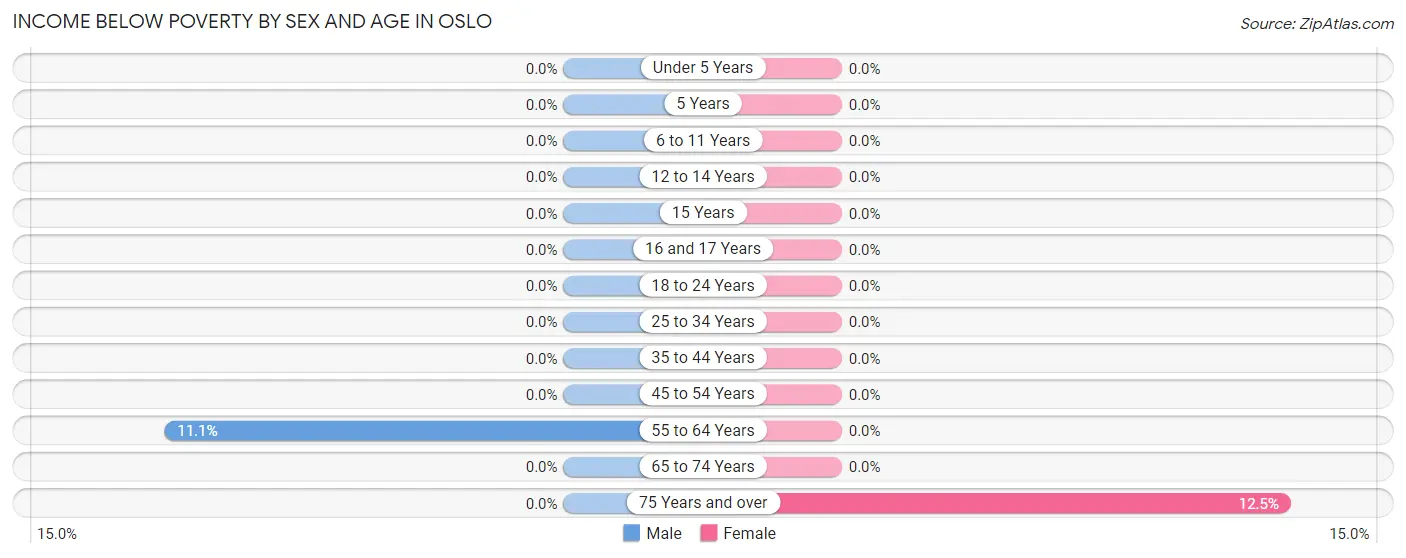
| Age Bracket | Male | Female |
| Under 5 Years | 0 (0.0%) | 0 (0.0%) |
| 5 Years | 0 (0.0%) | 0 (0.0%) |
| 6 to 11 Years | 0 (0.0%) | 0 (0.0%) |
| 12 to 14 Years | 0 (0.0%) | 0 (0.0%) |
| 15 Years | 0 (0.0%) | 0 (0.0%) |
| 16 and 17 Years | 0 (0.0%) | 0 (0.0%) |
| 18 to 24 Years | 0 (0.0%) | 0 (0.0%) |
| 25 to 34 Years | 0 (0.0%) | 0 (0.0%) |
| 35 to 44 Years | 0 (0.0%) | 0 (0.0%) |
| 45 to 54 Years | 0 (0.0%) | 0 (0.0%) |
| 55 to 64 Years | 2 (11.1%) | 0 (0.0%) |
| 65 to 74 Years | 0 (0.0%) | 0 (0.0%) |
| 75 Years and over | 0 (0.0%) | 1 (12.5%) |
| Total | 2 (1.1%) | 1 (0.7%) |
Income Above Poverty by Sex and Age in Oslo
According to the poverty statistics in Oslo, males aged under 5 years and females aged under 5 years are the age groups that are most secure financially, with 100.0% of males and 100.0% of females in these age groups living above the poverty line.
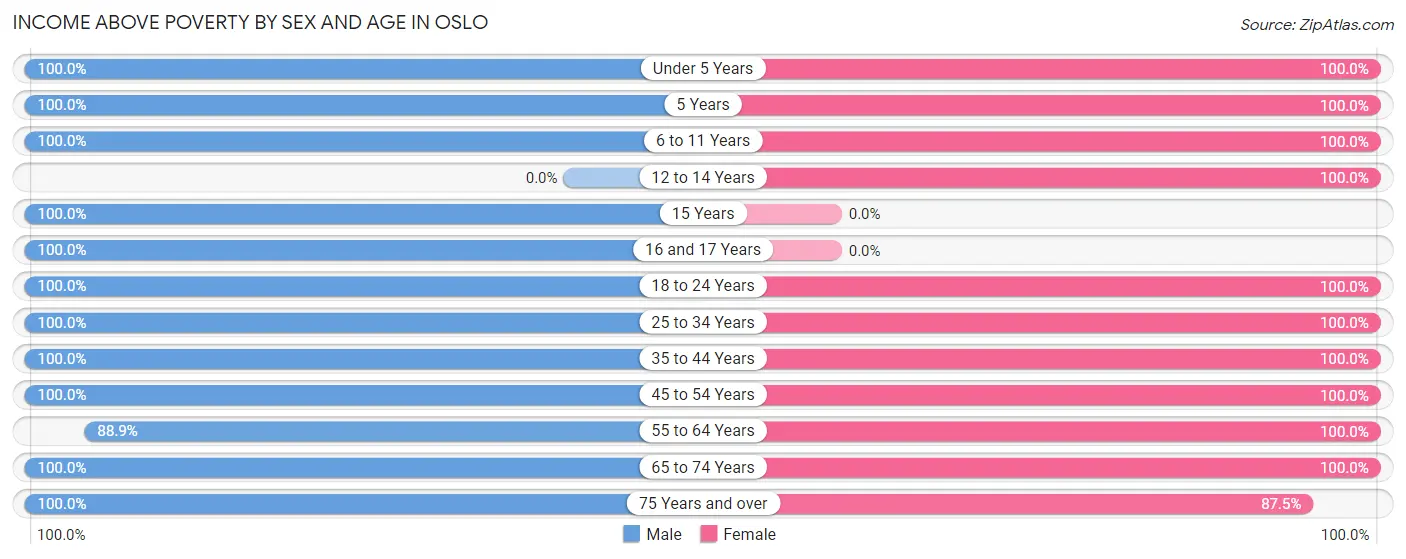
| Age Bracket | Male | Female |
| Under 5 Years | 9 (100.0%) | 9 (100.0%) |
| 5 Years | 7 (100.0%) | 16 (100.0%) |
| 6 to 11 Years | 8 (100.0%) | 18 (100.0%) |
| 12 to 14 Years | 0 (0.0%) | 18 (100.0%) |
| 15 Years | 2 (100.0%) | 0 (0.0%) |
| 16 and 17 Years | 15 (100.0%) | 0 (0.0%) |
| 18 to 24 Years | 18 (100.0%) | 11 (100.0%) |
| 25 to 34 Years | 41 (100.0%) | 31 (100.0%) |
| 35 to 44 Years | 16 (100.0%) | 4 (100.0%) |
| 45 to 54 Years | 27 (100.0%) | 21 (100.0%) |
| 55 to 64 Years | 16 (88.9%) | 10 (100.0%) |
| 65 to 74 Years | 7 (100.0%) | 5 (100.0%) |
| 75 Years and over | 8 (100.0%) | 7 (87.5%) |
| Total | 174 (98.9%) | 150 (99.3%) |
Income Below Poverty Among Married-Couple Families in Oslo
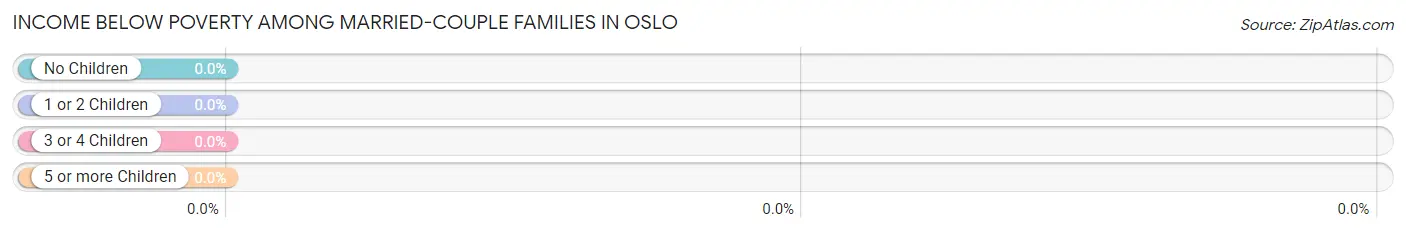
| Children | Above Poverty | Below Poverty |
| No Children | 26 (100.0%) | 0 (0.0%) |
| 1 or 2 Children | 35 (100.0%) | 0 (0.0%) |
| 3 or 4 Children | 6 (100.0%) | 0 (0.0%) |
| 5 or more Children | 0 (0.0%) | 0 (0.0%) |
| Total | 67 (100.0%) | 0 (0.0%) |
Income Below Poverty Among Single-Parent Households in Oslo
| Children | Single Father | Single Mother |
| No Children | 0 (0.0%) | 0 (0.0%) |
| 1 or 2 Children | 0 (0.0%) | 0 (0.0%) |
| 3 or 4 Children | 0 (0.0%) | 0 (0.0%) |
| 5 or more Children | 0 (0.0%) | 0 (0.0%) |
| Total | 0 (0.0%) | 0 (0.0%) |
Income Below Poverty Among Married-Couple vs Single-Parent Households in Oslo
| Children | Married-Couple Families | Single-Parent Households |
| No Children | 0 (0.0%) | 0 (0.0%) |
| 1 or 2 Children | 0 (0.0%) | 0 (0.0%) |
| 3 or 4 Children | 0 (0.0%) | 0 (0.0%) |
| 5 or more Children | 0 (0.0%) | 0 (0.0%) |
| Total | 0 (0.0%) | 0 (0.0%) |
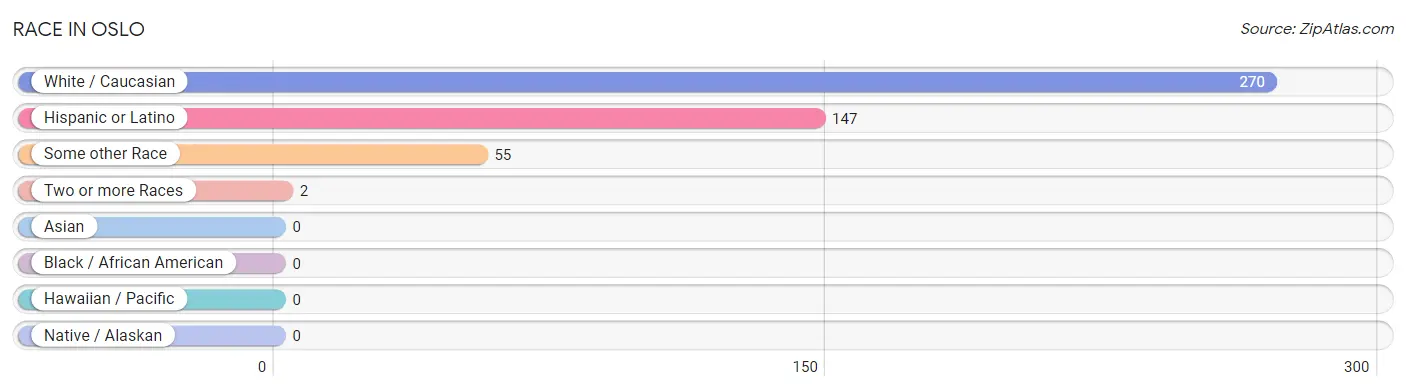
Race in Oslo
The most populous races in Oslo are White / Caucasian (270 | 82.6%), Hispanic or Latino (147 | 45.0%), and Some other Race (55 | 16.8%).
| Race | # Population | % Population |
| Asian | 0 | 0.0% |
| Black / African American | 0 | 0.0% |
| Hawaiian / Pacific | 0 | 0.0% |
| Hispanic or Latino | 147 | 45.0% |
| Native / Alaskan | 0 | 0.0% |
| White / Caucasian | 270 | 82.6% |
| Two or more Races | 2 | 0.6% |
| Some other Race | 55 | 16.8% |
| Total | 327 | 100.0% |
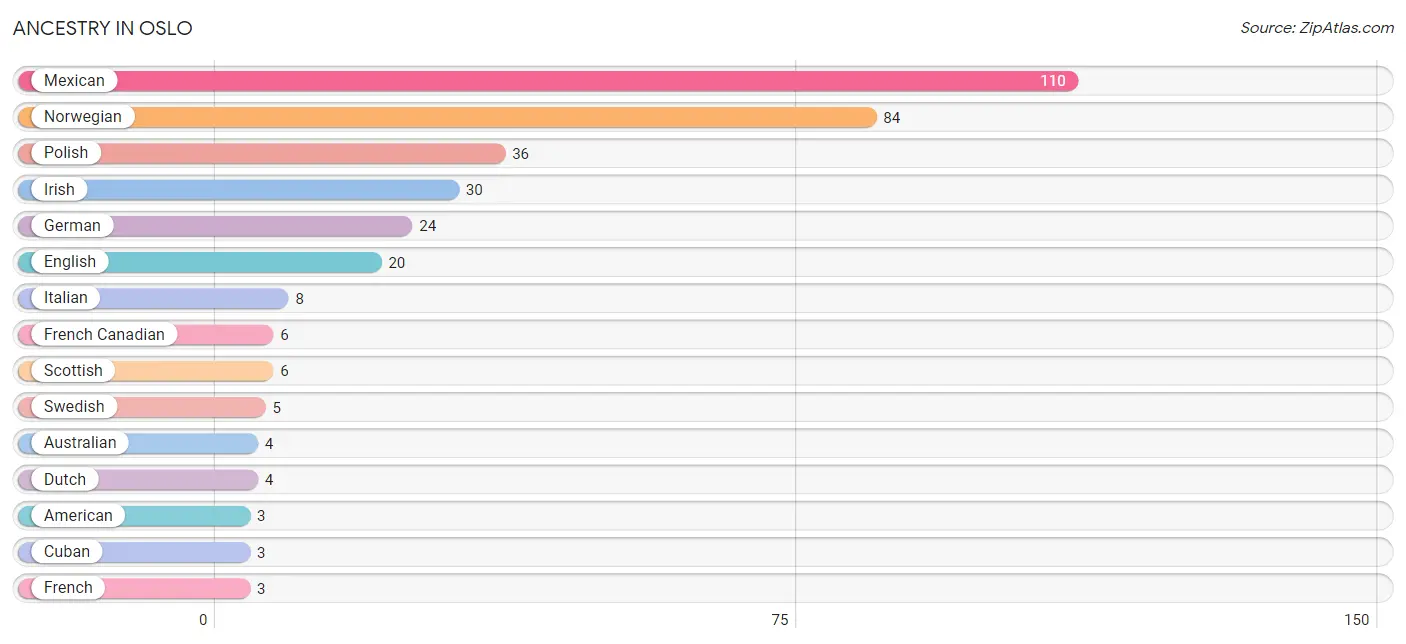
Ancestry in Oslo
The most populous ancestries reported in Oslo are Mexican (110 | 33.6%), Norwegian (84 | 25.7%), Polish (36 | 11.0%), Irish (30 | 9.2%), and German (24 | 7.3%), together accounting for 86.8% of all Oslo residents.
| Ancestry | # Population | % Population |
| American | 3 | 0.9% |
| Australian | 4 | 1.2% |
| Central American | 2 | 0.6% |
| Central American Indian | 2 | 0.6% |
| Cuban | 3 | 0.9% |
| Czech | 2 | 0.6% |
| Dutch | 4 | 1.2% |
| English | 20 | 6.1% |
| French | 3 | 0.9% |
| French Canadian | 6 | 1.8% |
| German | 24 | 7.3% |
| Irish | 30 | 9.2% |
| Italian | 8 | 2.5% |
| Luxembourger | 1 | 0.3% |
| Mexican | 110 | 33.6% |
| Nicaraguan | 2 | 0.6% |
| Norwegian | 84 | 25.7% |
| Polish | 36 | 11.0% |
| Scandinavian | 3 | 0.9% |
| Scotch-Irish | 1 | 0.3% |
| Scottish | 6 | 1.8% |
| Swedish | 5 | 1.5% | View All 22 Rows |
Immigrants in Oslo
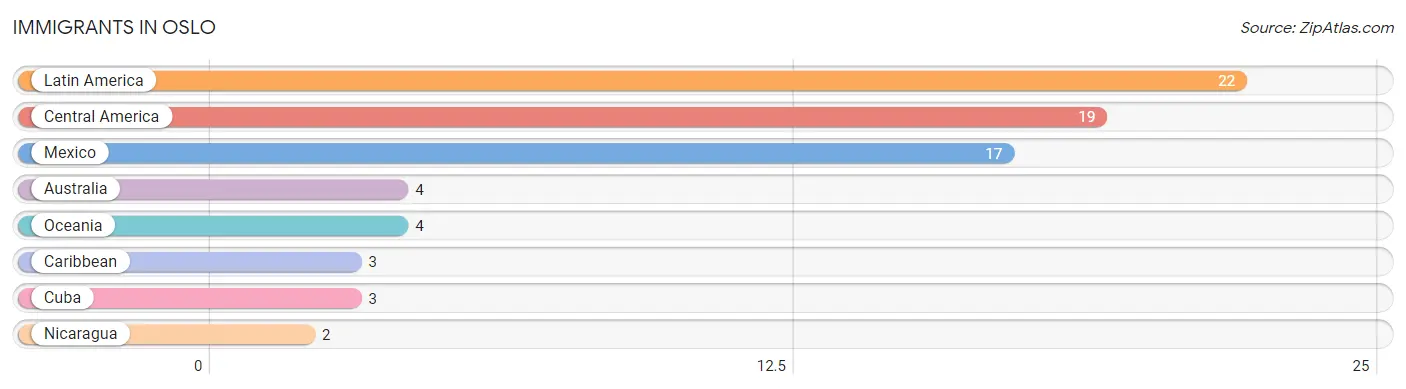
The most numerous immigrant groups reported in Oslo came from Latin America (22 | 6.7%), Central America (19 | 5.8%), Mexico (17 | 5.2%), Australia (4 | 1.2%), and Oceania (4 | 1.2%), together accounting for 20.2% of all Oslo residents.
| Immigration Origin | # Population | % Population |
| Australia | 4 | 1.2% |
| Caribbean | 3 | 0.9% |
| Central America | 19 | 5.8% |
| Cuba | 3 | 0.9% |
| Latin America | 22 | 6.7% |
| Mexico | 17 | 5.2% |
| Nicaragua | 2 | 0.6% |
| Oceania | 4 | 1.2% | View All 8 Rows |
Sex and Age in Oslo
Sex and Age in Oslo
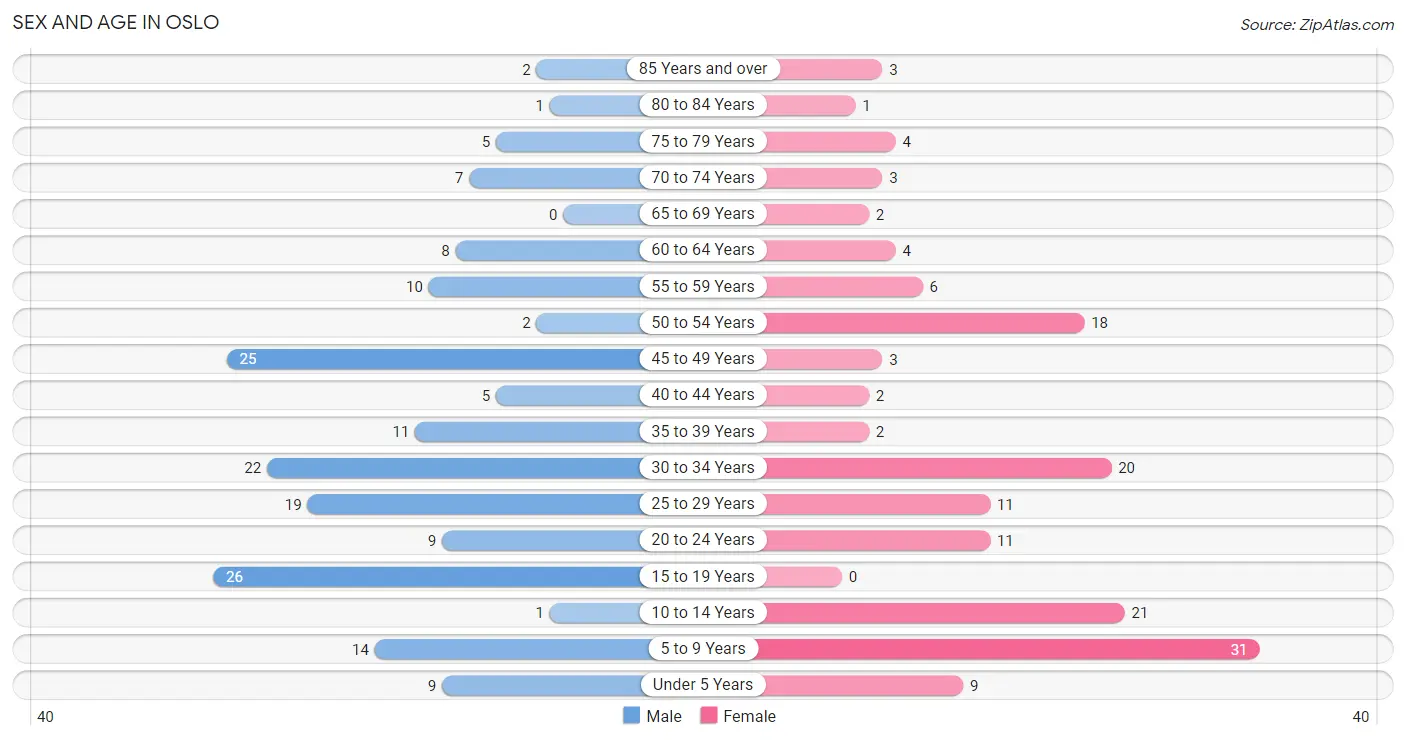
The most populous age groups in Oslo are 15 to 19 Years (26 | 14.8%) for men and 5 to 9 Years (31 | 20.5%) for women.
| Age Bracket | Male | Female |
| Under 5 Years | 9 (5.1%) | 9 (6.0%) |
| 5 to 9 Years | 14 (8.0%) | 31 (20.5%) |
| 10 to 14 Years | 1 (0.6%) | 21 (13.9%) |
| 15 to 19 Years | 26 (14.8%) | 0 (0.0%) |
| 20 to 24 Years | 9 (5.1%) | 11 (7.3%) |
| 25 to 29 Years | 19 (10.8%) | 11 (7.3%) |
| 30 to 34 Years | 22 (12.5%) | 20 (13.3%) |
| 35 to 39 Years | 11 (6.2%) | 2 (1.3%) |
| 40 to 44 Years | 5 (2.8%) | 2 (1.3%) |
| 45 to 49 Years | 25 (14.2%) | 3 (2.0%) |
| 50 to 54 Years | 2 (1.1%) | 18 (11.9%) |
| 55 to 59 Years | 10 (5.7%) | 6 (4.0%) |
| 60 to 64 Years | 8 (4.5%) | 4 (2.6%) |
| 65 to 69 Years | 0 (0.0%) | 2 (1.3%) |
| 70 to 74 Years | 7 (4.0%) | 3 (2.0%) |
| 75 to 79 Years | 5 (2.8%) | 4 (2.6%) |
| 80 to 84 Years | 1 (0.6%) | 1 (0.7%) |
| 85 Years and over | 2 (1.1%) | 3 (2.0%) |
| Total | 176 (100.0%) | 151 (100.0%) |
Families and Households in Oslo
Median Family Size in Oslo
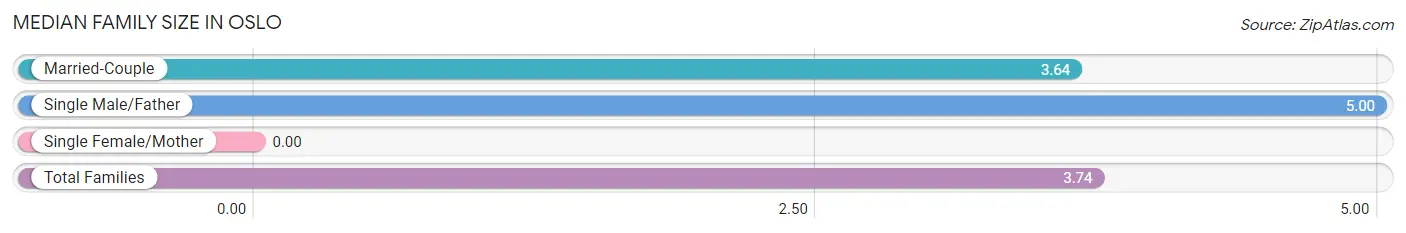
| Family Type | # Families | Family Size |
| Married-Couple | 67 (93.1%) | 3.64 |
| Single Male/Father | 5 (6.9%) | 5.00 |
| Single Female/Mother | 0 (0.0%) | - |
| Total Families | 72 (100.0%) | 3.74 |
Median Household Size in Oslo
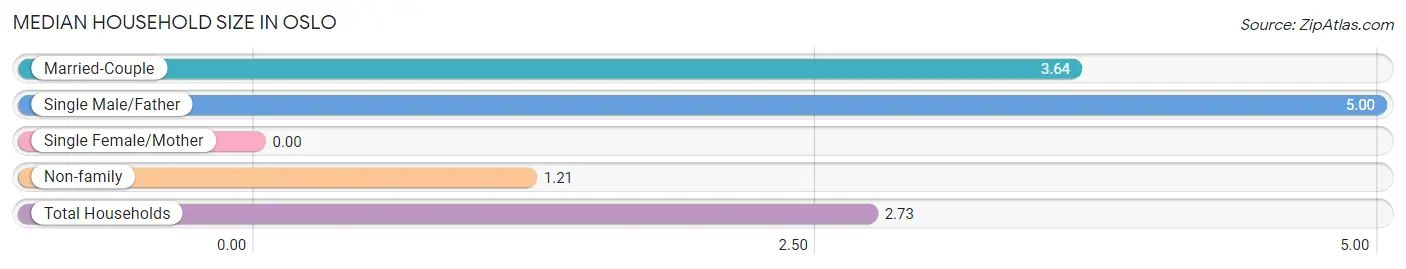
| Household Type | # Households | Household Size |
| Married-Couple | 67 (55.8%) | 3.64 |
| Single Male/Father | 5 (4.2%) | 5.00 |
| Single Female/Mother | 0 (0.0%) | - |
| Non-family | 48 (40.0%) | 1.21 |
| Total Households | 120 (100.0%) | 2.73 |
Household Size by Marriage Status in Oslo
Out of a total of 120 households in Oslo, 72 (60.0%) are family households, while 48 (40.0%) are nonfamily households. The most numerous type of family households are 2-person households, comprising 25, and the most common type of nonfamily households are 1-person households, comprising 36.
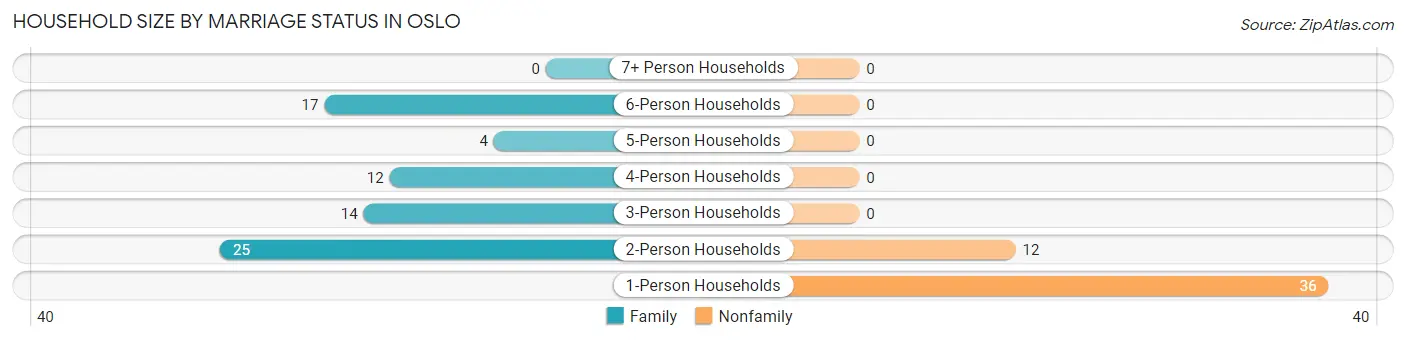
| Household Size | Family Households | Nonfamily Households |
| 1-Person Households | - | 36 (30.0%) |
| 2-Person Households | 25 (20.8%) | 12 (10.0%) |
| 3-Person Households | 14 (11.7%) | 0 (0.0%) |
| 4-Person Households | 12 (10.0%) | 0 (0.0%) |
| 5-Person Households | 4 (3.3%) | 0 (0.0%) |
| 6-Person Households | 17 (14.2%) | 0 (0.0%) |
| 7+ Person Households | 0 (0.0%) | 0 (0.0%) |
| Total | 72 (60.0%) | 48 (40.0%) |
Female Fertility in Oslo
Fertility by Age in Oslo
| Age Bracket | Women with Births | Births / 1,000 Women |
| 15 to 19 years | 0 (0.0%) | 0.0 |
| 20 to 34 years | 0 (0.0%) | 0.0 |
| 35 to 50 years | 0 (0.0%) | 0.0 |
| Total | 0 (0.0%) | 0.0 |
Fertility by Age by Marriage Status in Oslo
| Age Bracket | Married | Unmarried |
| 15 to 19 years | 0 (0.0%) | 0 (0.0%) |
| 20 to 34 years | 0 (0.0%) | 0 (0.0%) |
| 35 to 50 years | 0 (0.0%) | 0 (0.0%) |
| Total | 0 (0.0%) | 0 (0.0%) |
Fertility by Education in Oslo
| Educational Attainment | Women with Births | Births / 1,000 Women |
| Less than High School | 0 (0.0%) | 0.0 |
| High School Diploma | 0 (0.0%) | 0.0 |
| College or Associate's Degree | 0 (0.0%) | 0.0 |
| Bachelor's Degree | 0 (0.0%) | 0.0 |
| Graduate Degree | 0 (0.0%) | 0.0 |
| Total | 0 (0.0%) | 0.0 |
Fertility by Education by Marriage Status in Oslo
| Educational Attainment | Married | Unmarried |
| Less than High School | 0 (0.0%) | 0 (0.0%) |
| High School Diploma | 0 (0.0%) | 0 (0.0%) |
| College or Associate's Degree | 0 (0.0%) | 0 (0.0%) |
| Bachelor's Degree | 0 (0.0%) | 0 (0.0%) |
| Graduate Degree | 0 (0.0%) | 0 (0.0%) |
| Total | 0 (0.0%) | 0 (0.0%) |
Employment Characteristics in Oslo
Employment by Class of Employer in Oslo
Among the 135 employed individuals in Oslo, private company employees (88 | 65.2%), self-employed (not incorporated) (16 | 11.8%), and not-for-profit organizations (11 | 8.2%) make up the most common classes of employment.
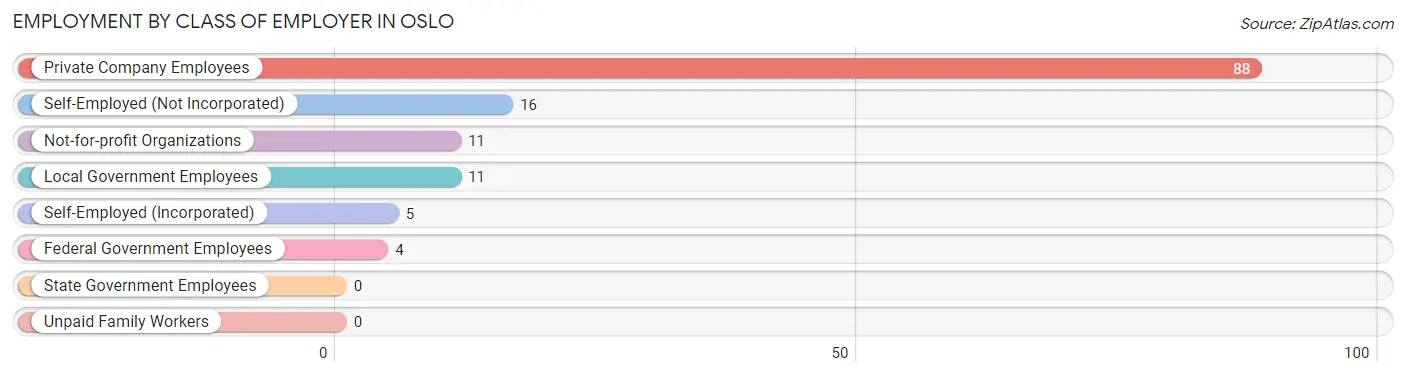
| Employer Class | # Employees | % Employees |
| Private Company Employees | 88 | 65.2% |
| Self-Employed (Incorporated) | 5 | 3.7% |
| Self-Employed (Not Incorporated) | 16 | 11.8% |
| Not-for-profit Organizations | 11 | 8.2% |
| Local Government Employees | 11 | 8.2% |
| State Government Employees | 0 | 0.0% |
| Federal Government Employees | 4 | 3.0% |
| Unpaid Family Workers | 0 | 0.0% |
| Total | 135 | 100.0% |
Employment Status by Age in Oslo
According to the labor force statistics for Oslo, out of the total population over 16 years of age (240), 57.9% or 139 individuals are in the labor force, with 2.2% or 3 of them unemployed. The age group with the highest labor force participation rate is 30 to 34 years, with 100.0% or 42 individuals in the labor force. Within the labor force, the 25 to 29 years age range has the highest percentage of unemployed individuals, with 10.7% or 3 of them being unemployed.
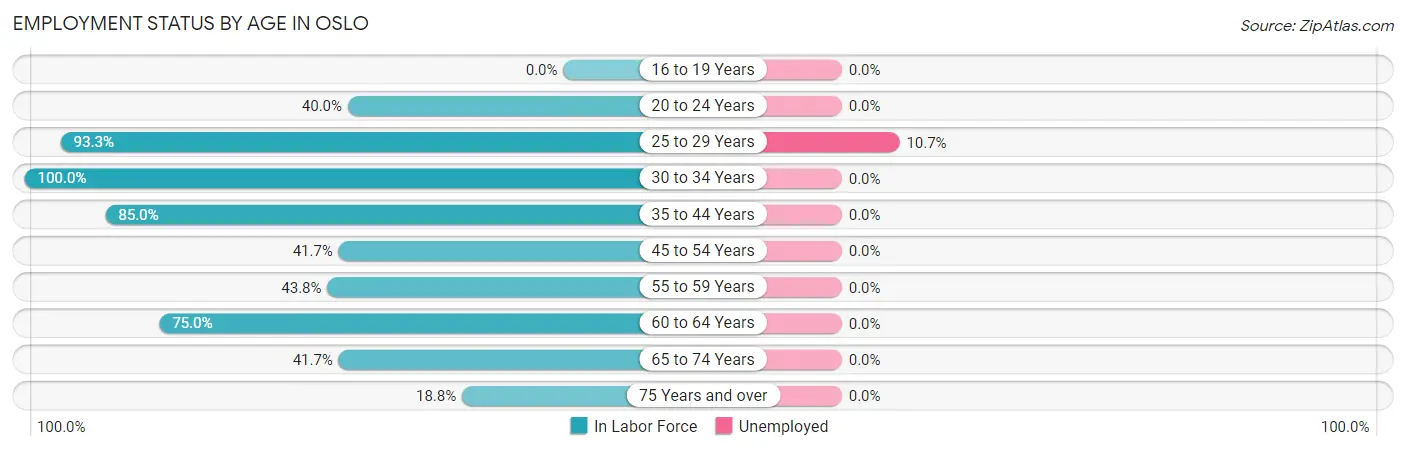
| Age Bracket | In Labor Force | Unemployed |
| 16 to 19 Years | 0 (0.0%) | 0 (0.0%) |
| 20 to 24 Years | 8 (40.0%) | 0 (0.0%) |
| 25 to 29 Years | 28 (93.3%) | 3 (10.7%) |
| 30 to 34 Years | 42 (100.0%) | 0 (0.0%) |
| 35 to 44 Years | 17 (85.0%) | 0 (0.0%) |
| 45 to 54 Years | 20 (41.7%) | 0 (0.0%) |
| 55 to 59 Years | 7 (43.8%) | 0 (0.0%) |
| 60 to 64 Years | 9 (75.0%) | 0 (0.0%) |
| 65 to 74 Years | 5 (41.7%) | 0 (0.0%) |
| 75 Years and over | 3 (18.8%) | 0 (0.0%) |
| Total | 139 (57.9%) | 3 (2.2%) |
Employment Status by Educational Attainment in Oslo
According to labor force statistics for Oslo, 73.2% of individuals (123) out of the total population between 25 and 64 years of age (168) are in the labor force, with 2.4% or 3 of them being unemployed. The group with the highest labor force participation rate are those with the educational attainment of college / associate degree, with 77.0% or 47 individuals in the labor force. Within the labor force, individuals with college / associate degree education have the highest percentage of unemployment, with 6.4% or 3 of them being unemployed.
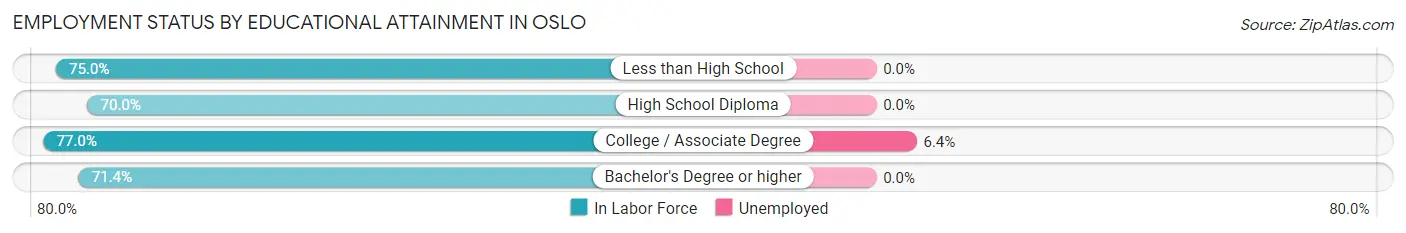
| Educational Attainment | In Labor Force | Unemployed |
| Less than High School | 12 (75.0%) | 0 (0.0%) |
| High School Diploma | 49 (70.0%) | 0 (0.0%) |
| College / Associate Degree | 47 (77.0%) | 4 (6.4%) |
| Bachelor's Degree or higher | 15 (71.4%) | 0 (0.0%) |
| Total | 123 (73.2%) | 4 (2.4%) |
Employment Occupations by Sex in Oslo
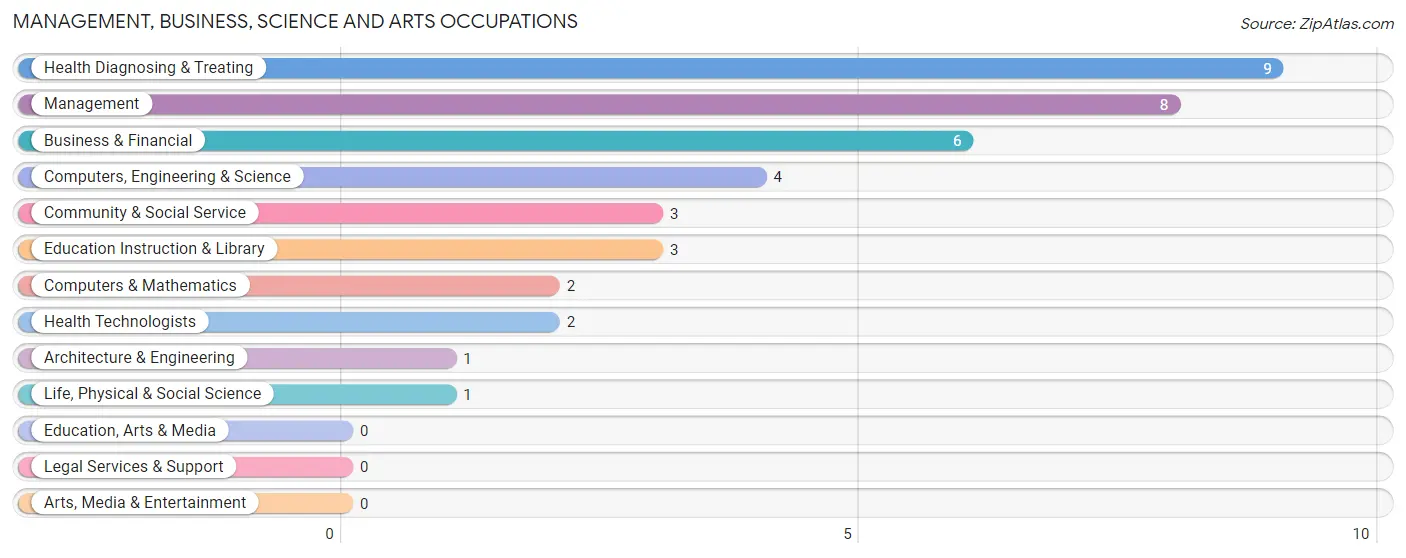
Management, Business, Science and Arts Occupations
The most common Management, Business, Science and Arts occupations in Oslo are Health Diagnosing & Treating (9 | 6.6%), Management (8 | 5.9%), Business & Financial (6 | 4.4%), Computers, Engineering & Science (4 | 2.9%), and Community & Social Service (3 | 2.2%).
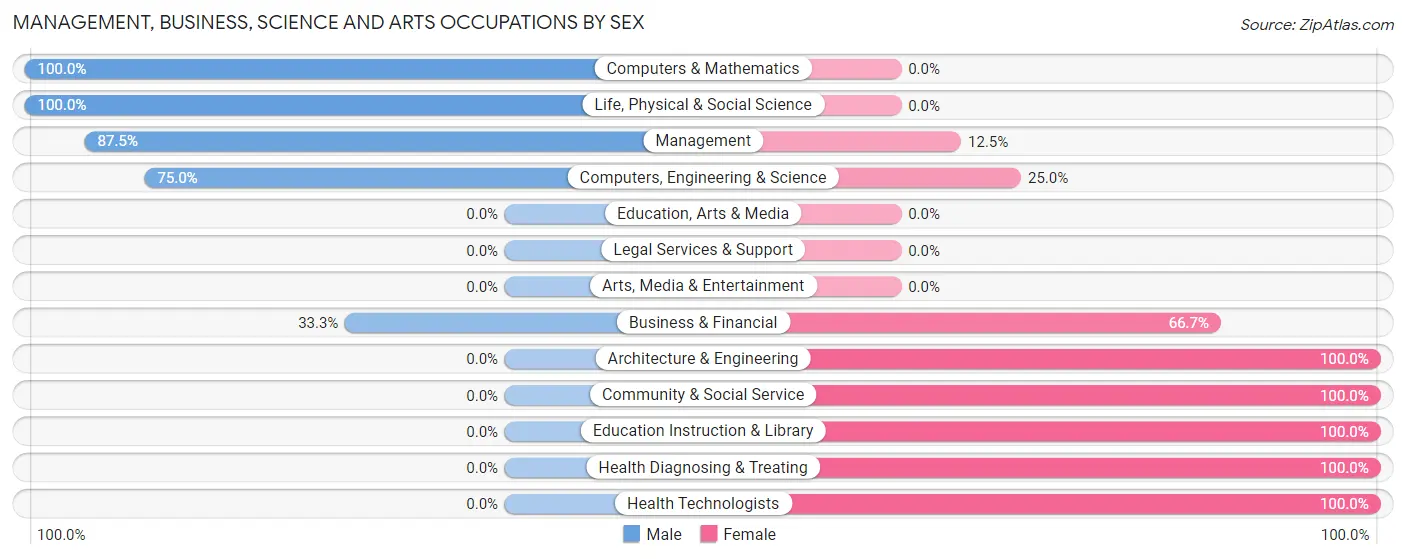
Management, Business, Science and Arts Occupations by Sex
Within the Management, Business, Science and Arts occupations in Oslo, the most male-oriented occupations are Computers & Mathematics (100.0%), Life, Physical & Social Science (100.0%), and Management (87.5%), while the most female-oriented occupations are Architecture & Engineering (100.0%), Community & Social Service (100.0%), and Education Instruction & Library (100.0%).
| Occupation | Male | Female |
| Management | 7 (87.5%) | 1 (12.5%) |
| Business & Financial | 2 (33.3%) | 4 (66.7%) |
| Computers, Engineering & Science | 3 (75.0%) | 1 (25.0%) |
| Computers & Mathematics | 2 (100.0%) | 0 (0.0%) |
| Architecture & Engineering | 0 (0.0%) | 1 (100.0%) |
| Life, Physical & Social Science | 1 (100.0%) | 0 (0.0%) |
| Community & Social Service | 0 (0.0%) | 3 (100.0%) |
| Education, Arts & Media | 0 (0.0%) | 0 (0.0%) |
| Legal Services & Support | 0 (0.0%) | 0 (0.0%) |
| Education Instruction & Library | 0 (0.0%) | 3 (100.0%) |
| Arts, Media & Entertainment | 0 (0.0%) | 0 (0.0%) |
| Health Diagnosing & Treating | 0 (0.0%) | 9 (100.0%) |
| Health Technologists | 0 (0.0%) | 2 (100.0%) |
| Total (Category) | 12 (40.0%) | 18 (60.0%) |
| Total (Overall) | 79 (58.1%) | 57 (41.9%) |
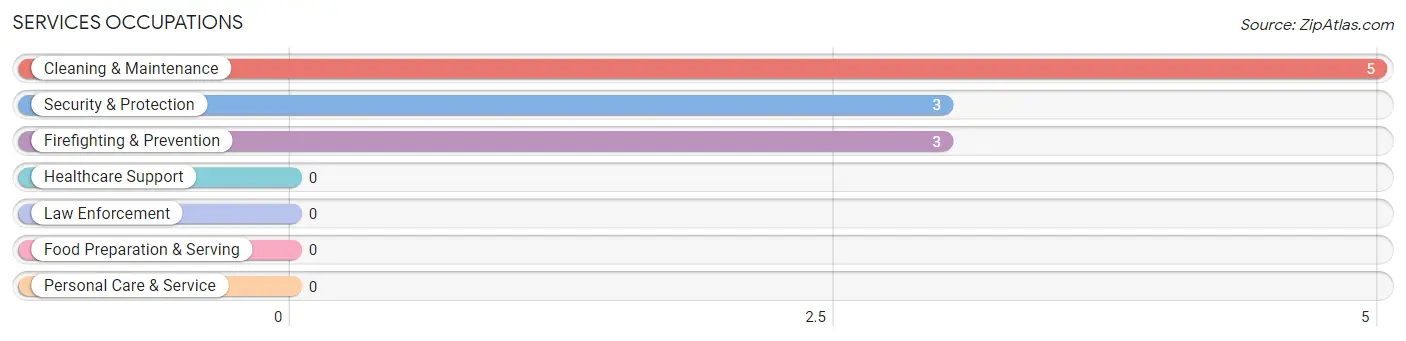
Services Occupations
The most common Services occupations in Oslo are Cleaning & Maintenance (5 | 3.7%), Security & Protection (3 | 2.2%), and Firefighting & Prevention (3 | 2.2%).
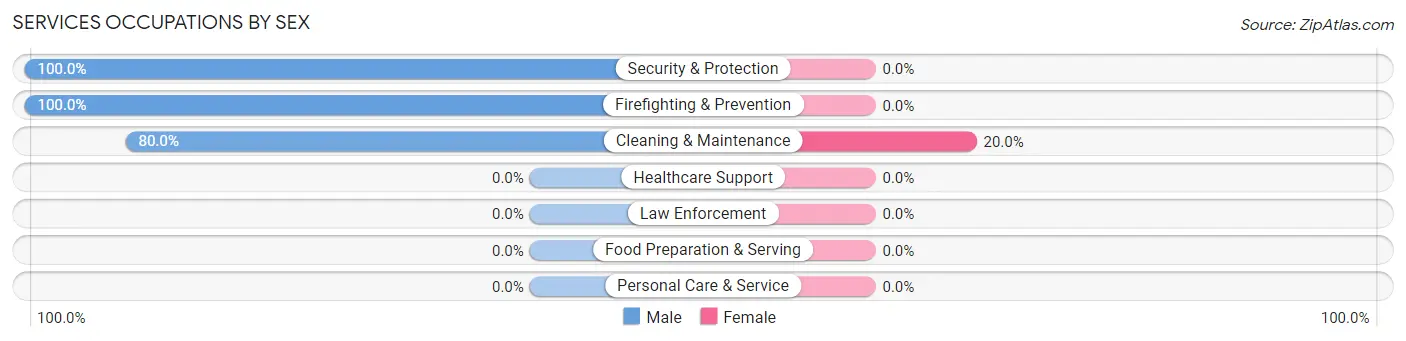
Services Occupations by Sex
| Occupation | Male | Female |
| Healthcare Support | 0 (0.0%) | 0 (0.0%) |
| Security & Protection | 3 (100.0%) | 0 (0.0%) |
| Firefighting & Prevention | 3 (100.0%) | 0 (0.0%) |
| Law Enforcement | 0 (0.0%) | 0 (0.0%) |
| Food Preparation & Serving | 0 (0.0%) | 0 (0.0%) |
| Cleaning & Maintenance | 4 (80.0%) | 1 (20.0%) |
| Personal Care & Service | 0 (0.0%) | 0 (0.0%) |
| Total (Category) | 7 (87.5%) | 1 (12.5%) |
| Total (Overall) | 79 (58.1%) | 57 (41.9%) |
Sales and Office Occupations
The most common Sales and Office occupations in Oslo are Office & Administration (20 | 14.7%), and Sales & Related (10 | 7.3%).
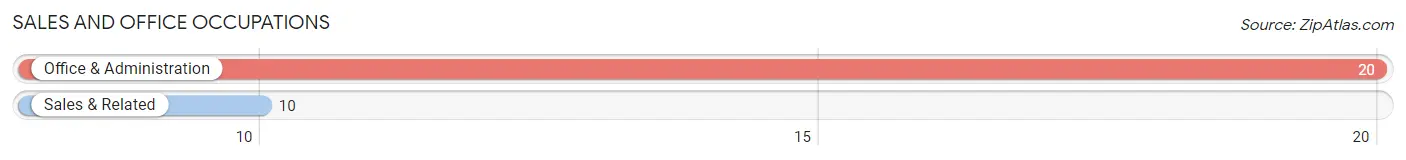
Sales and Office Occupations by Sex

| Occupation | Male | Female |
| Sales & Related | 9 (90.0%) | 1 (10.0%) |
| Office & Administration | 2 (10.0%) | 18 (90.0%) |
| Total (Category) | 11 (36.7%) | 19 (63.3%) |
| Total (Overall) | 79 (58.1%) | 57 (41.9%) |
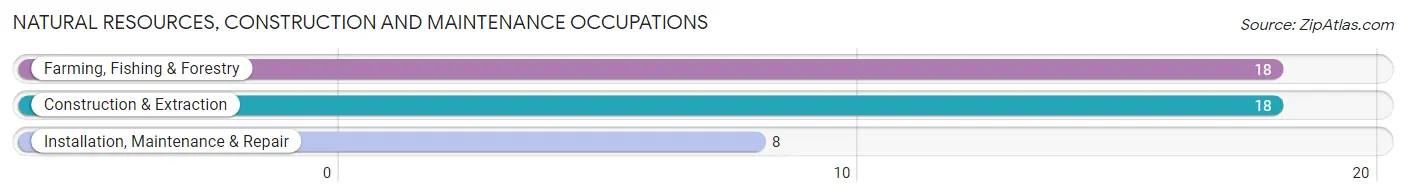
Natural Resources, Construction and Maintenance Occupations
The most common Natural Resources, Construction and Maintenance occupations in Oslo are Farming, Fishing & Forestry (18 | 13.2%), Construction & Extraction (18 | 13.2%), and Installation, Maintenance & Repair (8 | 5.9%).
Natural Resources, Construction and Maintenance Occupations by Sex
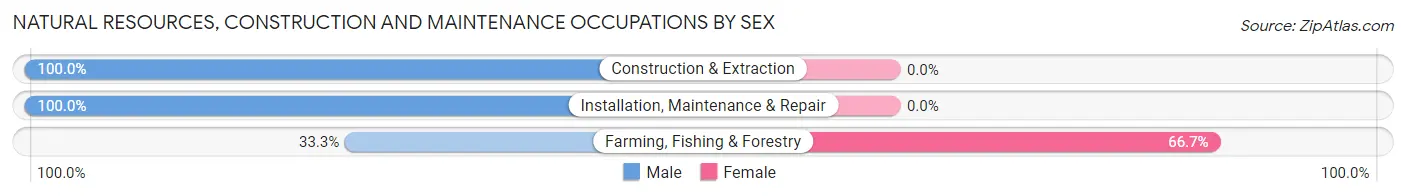
| Occupation | Male | Female |
| Farming, Fishing & Forestry | 6 (33.3%) | 12 (66.7%) |
| Construction & Extraction | 18 (100.0%) | 0 (0.0%) |
| Installation, Maintenance & Repair | 8 (100.0%) | 0 (0.0%) |
| Total (Category) | 32 (72.7%) | 12 (27.3%) |
| Total (Overall) | 79 (58.1%) | 57 (41.9%) |
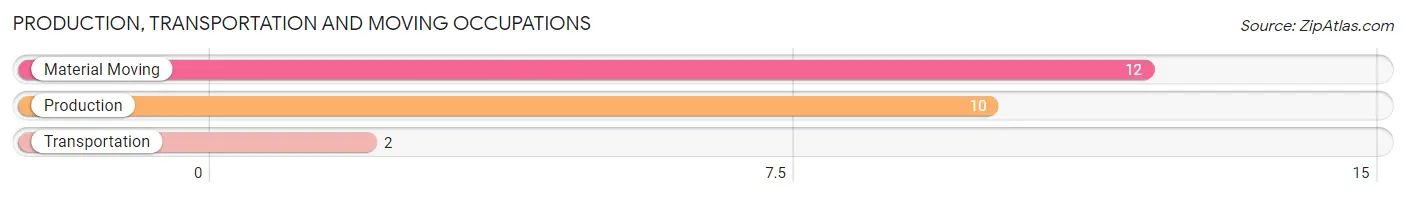
Production, Transportation and Moving Occupations
The most common Production, Transportation and Moving occupations in Oslo are Material Moving (12 | 8.8%), Production (10 | 7.3%), and Transportation (2 | 1.5%).
Production, Transportation and Moving Occupations by Sex
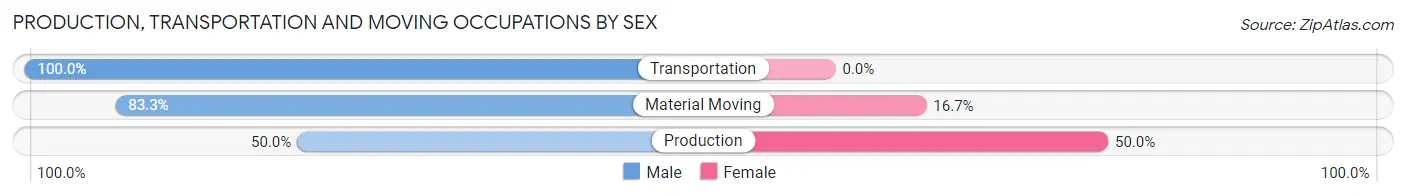
| Occupation | Male | Female |
| Production | 5 (50.0%) | 5 (50.0%) |
| Transportation | 2 (100.0%) | 0 (0.0%) |
| Material Moving | 10 (83.3%) | 2 (16.7%) |
| Total (Category) | 17 (70.8%) | 7 (29.2%) |
| Total (Overall) | 79 (58.1%) | 57 (41.9%) |
Employment Industries by Sex in Oslo
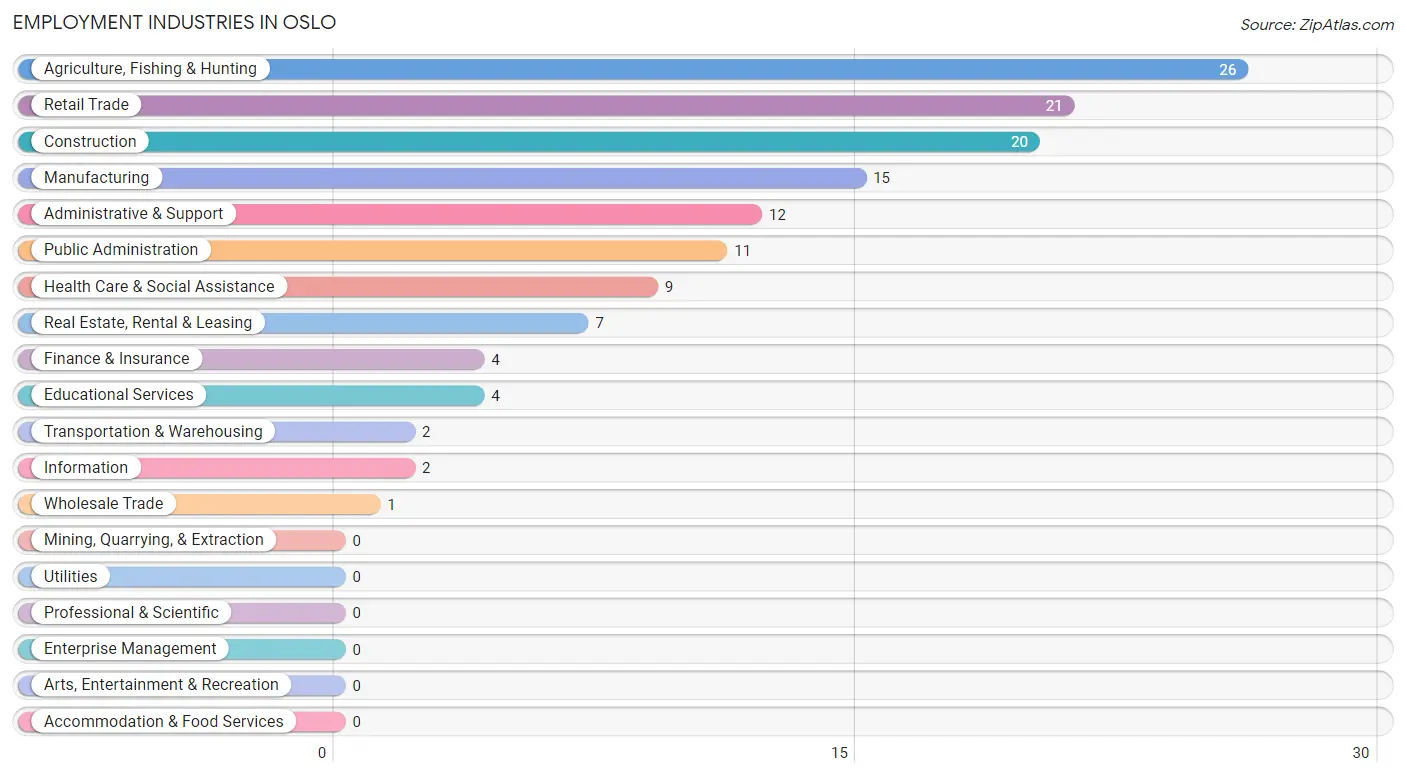
Employment Industries in Oslo
The major employment industries in Oslo include Agriculture, Fishing & Hunting (26 | 19.1%), Retail Trade (21 | 15.4%), Construction (20 | 14.7%), Manufacturing (15 | 11.0%), and Administrative & Support (12 | 8.8%).
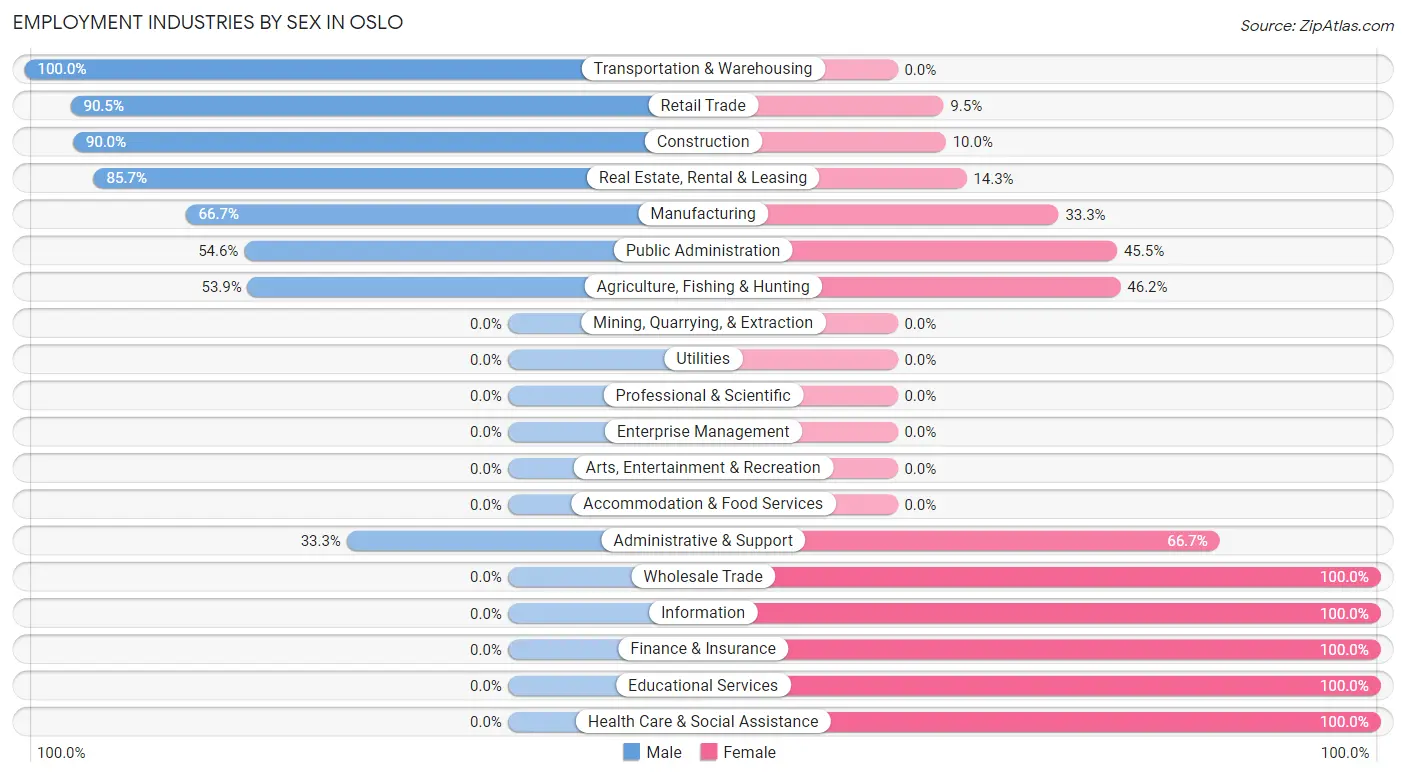
Employment Industries by Sex in Oslo
The Oslo industries that see more men than women are Transportation & Warehousing (100.0%), Retail Trade (90.5%), and Construction (90.0%), whereas the industries that tend to have a higher number of women are Wholesale Trade (100.0%), Information (100.0%), and Finance & Insurance (100.0%).
| Industry | Male | Female |
| Agriculture, Fishing & Hunting | 14 (53.8%) | 12 (46.2%) |
| Mining, Quarrying, & Extraction | 0 (0.0%) | 0 (0.0%) |
| Construction | 18 (90.0%) | 2 (10.0%) |
| Manufacturing | 10 (66.7%) | 5 (33.3%) |
| Wholesale Trade | 0 (0.0%) | 1 (100.0%) |
| Retail Trade | 19 (90.5%) | 2 (9.5%) |
| Transportation & Warehousing | 2 (100.0%) | 0 (0.0%) |
| Utilities | 0 (0.0%) | 0 (0.0%) |
| Information | 0 (0.0%) | 2 (100.0%) |
| Finance & Insurance | 0 (0.0%) | 4 (100.0%) |
| Real Estate, Rental & Leasing | 6 (85.7%) | 1 (14.3%) |
| Professional & Scientific | 0 (0.0%) | 0 (0.0%) |
| Enterprise Management | 0 (0.0%) | 0 (0.0%) |
| Administrative & Support | 4 (33.3%) | 8 (66.7%) |
| Educational Services | 0 (0.0%) | 4 (100.0%) |
| Health Care & Social Assistance | 0 (0.0%) | 9 (100.0%) |
| Arts, Entertainment & Recreation | 0 (0.0%) | 0 (0.0%) |
| Accommodation & Food Services | 0 (0.0%) | 0 (0.0%) |
| Public Administration | 6 (54.5%) | 5 (45.5%) |
| Total | 79 (58.1%) | 57 (41.9%) |
Education in Oslo
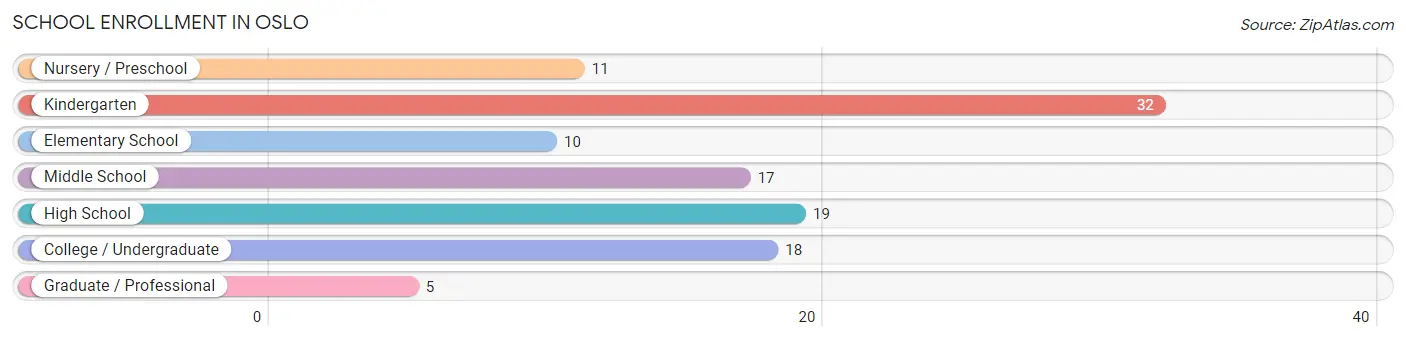
School Enrollment in Oslo
The most common levels of schooling among the 112 students in Oslo are kindergarten (32 | 28.6%), high school (19 | 17.0%), and college / undergraduate (18 | 16.1%).
| School Level | # Students | % Students |
| Nursery / Preschool | 11 | 9.8% |
| Kindergarten | 32 | 28.6% |
| Elementary School | 10 | 8.9% |
| Middle School | 17 | 15.2% |
| High School | 19 | 17.0% |
| College / Undergraduate | 18 | 16.1% |
| Graduate / Professional | 5 | 4.5% |
| Total | 112 | 100.0% |
School Enrollment by Age by Funding Source in Oslo
Out of a total of 112 students who are enrolled in schools in Oslo, 1 (0.9%) attend a private institution, while the remaining 111 (99.1%) are enrolled in public schools. The age group of 10 to 14 year olds has the highest likelihood of being enrolled in private schools, with 1 (4.5% in the age bracket) enrolled. Conversely, the age group of 3 to 4 year olds has the lowest likelihood of being enrolled in a private school, with 5 (100.0% in the age bracket) attending a public institution.
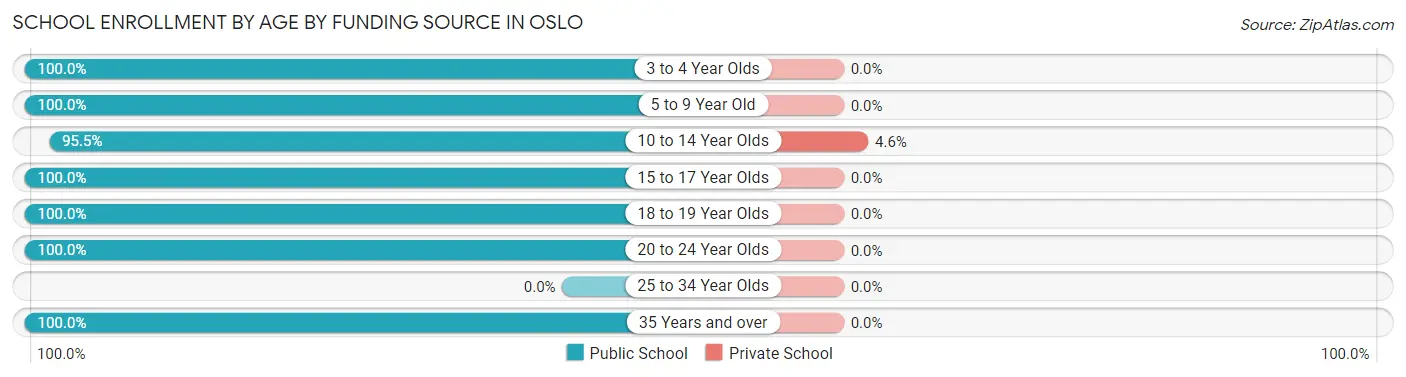
| Age Bracket | Public School | Private School |
| 3 to 4 Year Olds | 5 (100.0%) | 0 (0.0%) |
| 5 to 9 Year Old | 45 (100.0%) | 0 (0.0%) |
| 10 to 14 Year Olds | 21 (95.5%) | 1 (4.5%) |
| 15 to 17 Year Olds | 17 (100.0%) | 0 (0.0%) |
| 18 to 19 Year Olds | 9 (100.0%) | 0 (0.0%) |
| 20 to 24 Year Olds | 12 (100.0%) | 0 (0.0%) |
| 25 to 34 Year Olds | 0 (0.0%) | 0 (0.0%) |
| 35 Years and over | 2 (100.0%) | 0 (0.0%) |
| Total | 111 (99.1%) | 1 (0.9%) |
Educational Attainment by Field of Study in Oslo
Business (9 | 32.1%), bio, nature & agricultural (4 | 14.3%), education (4 | 14.3%), psychology (2 | 7.1%), and social sciences (2 | 7.1%) are the most common fields of study among 28 individuals in Oslo who have obtained a bachelor's degree or higher.
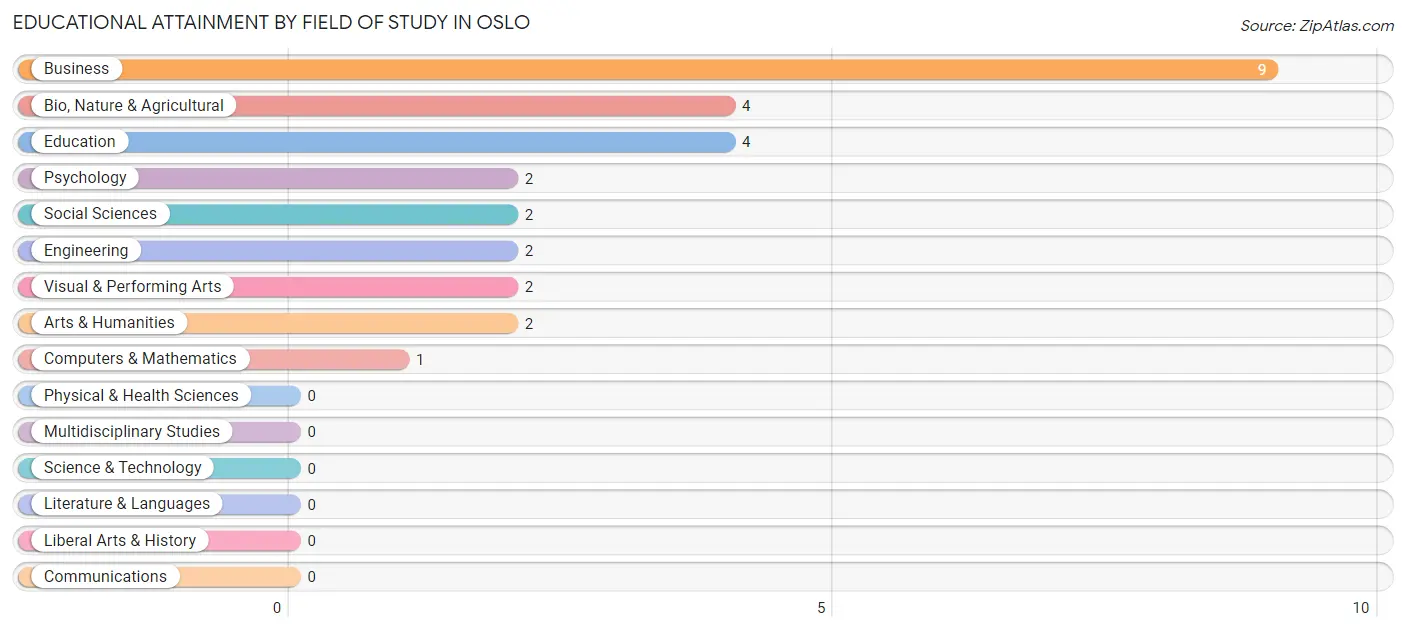
| Field of Study | # Graduates | % Graduates |
| Computers & Mathematics | 1 | 3.6% |
| Bio, Nature & Agricultural | 4 | 14.3% |
| Physical & Health Sciences | 0 | 0.0% |
| Psychology | 2 | 7.1% |
| Social Sciences | 2 | 7.1% |
| Engineering | 2 | 7.1% |
| Multidisciplinary Studies | 0 | 0.0% |
| Science & Technology | 0 | 0.0% |
| Business | 9 | 32.1% |
| Education | 4 | 14.3% |
| Literature & Languages | 0 | 0.0% |
| Liberal Arts & History | 0 | 0.0% |
| Visual & Performing Arts | 2 | 7.1% |
| Communications | 0 | 0.0% |
| Arts & Humanities | 2 | 7.1% |
| Total | 28 | 100.0% |
Transportation & Commute in Oslo
Vehicle Availability by Sex in Oslo
The most prevalent vehicle ownership categories in Oslo are males with 2 vehicles (32, accounting for 41.0%) and females with 2 vehicles (24, making up 56.1%).
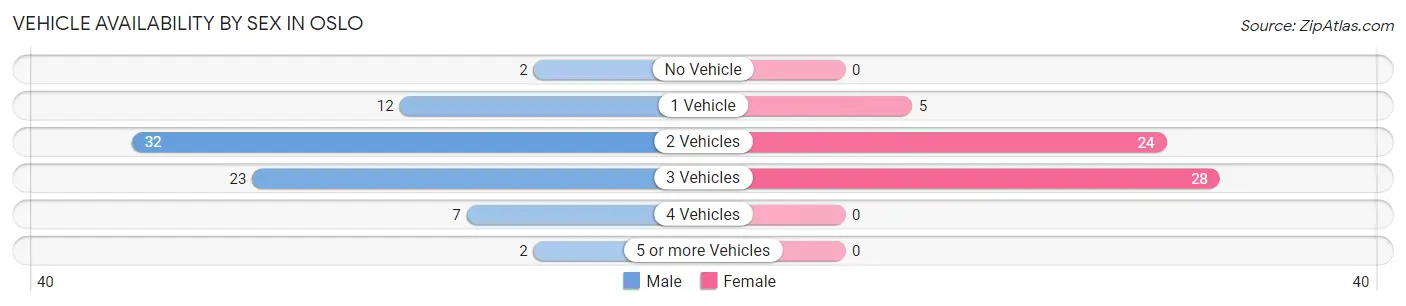
| Vehicles Available | Male | Female |
| No Vehicle | 2 (2.6%) | 0 (0.0%) |
| 1 Vehicle | 12 (15.4%) | 5 (8.8%) |
| 2 Vehicles | 32 (41.0%) | 24 (42.1%) |
| 3 Vehicles | 23 (29.5%) | 28 (49.1%) |
| 4 Vehicles | 7 (9.0%) | 0 (0.0%) |
| 5 or more Vehicles | 2 (2.6%) | 0 (0.0%) |
| Total | 78 (100.0%) | 57 (100.0%) |
Commute Time in Oslo
The most frequently occuring commute durations in Oslo are 35 to 39 minutes (31 commuters, 23.7%), less than 5 minutes (23 commuters, 17.6%), and 30 to 34 minutes (20 commuters, 15.3%).
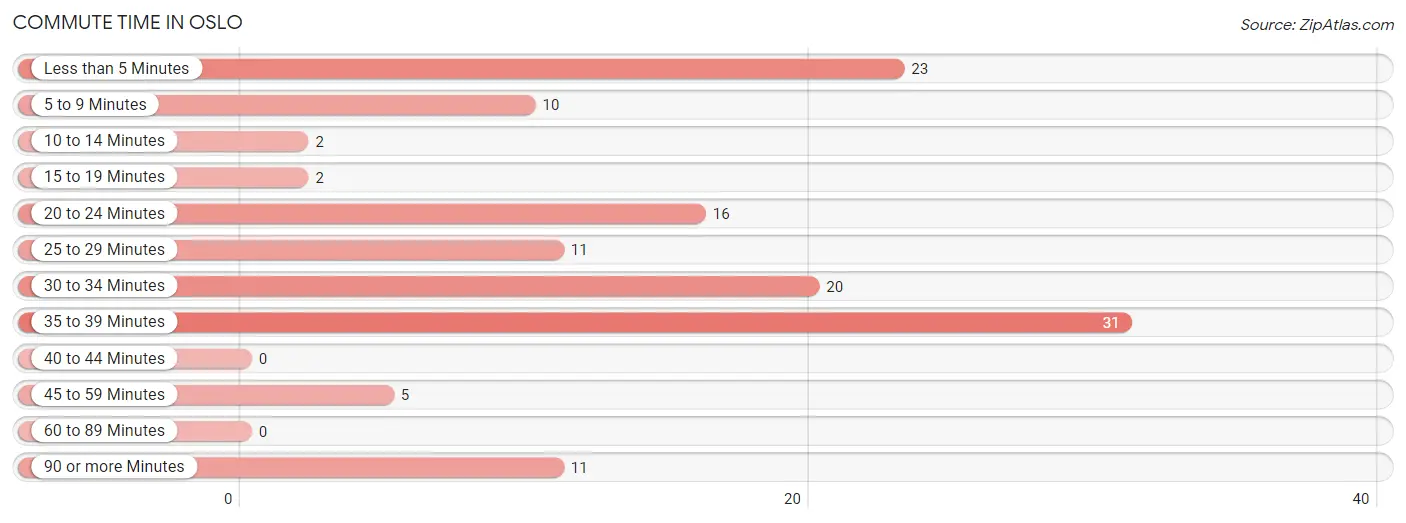
| Commute Time | # Commuters | % Commuters |
| Less than 5 Minutes | 23 | 17.6% |
| 5 to 9 Minutes | 10 | 7.6% |
| 10 to 14 Minutes | 2 | 1.5% |
| 15 to 19 Minutes | 2 | 1.5% |
| 20 to 24 Minutes | 16 | 12.2% |
| 25 to 29 Minutes | 11 | 8.4% |
| 30 to 34 Minutes | 20 | 15.3% |
| 35 to 39 Minutes | 31 | 23.7% |
| 40 to 44 Minutes | 0 | 0.0% |
| 45 to 59 Minutes | 5 | 3.8% |
| 60 to 89 Minutes | 0 | 0.0% |
| 90 or more Minutes | 11 | 8.4% |
Commute Time by Sex in Oslo
The most common commute times in Oslo are 30 to 34 minutes (15 commuters, 19.2%) for males and 35 to 39 minutes (21 commuters, 39.6%) for females.
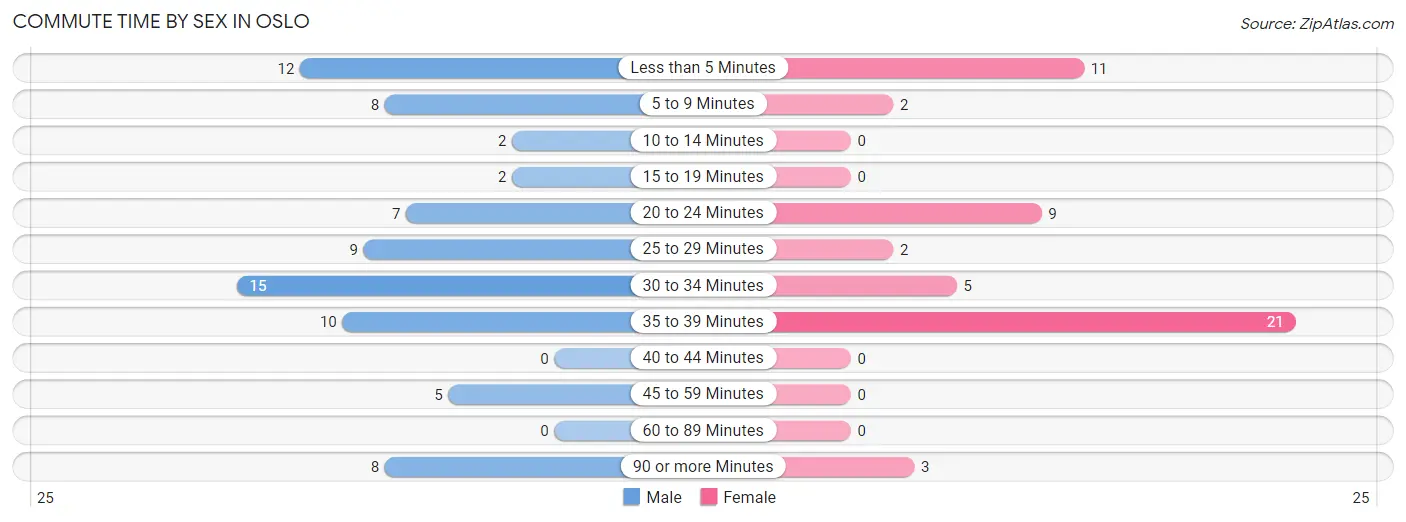
| Commute Time | Male | Female |
| Less than 5 Minutes | 12 (15.4%) | 11 (20.7%) |
| 5 to 9 Minutes | 8 (10.3%) | 2 (3.8%) |
| 10 to 14 Minutes | 2 (2.6%) | 0 (0.0%) |
| 15 to 19 Minutes | 2 (2.6%) | 0 (0.0%) |
| 20 to 24 Minutes | 7 (9.0%) | 9 (17.0%) |
| 25 to 29 Minutes | 9 (11.5%) | 2 (3.8%) |
| 30 to 34 Minutes | 15 (19.2%) | 5 (9.4%) |
| 35 to 39 Minutes | 10 (12.8%) | 21 (39.6%) |
| 40 to 44 Minutes | 0 (0.0%) | 0 (0.0%) |
| 45 to 59 Minutes | 5 (6.4%) | 0 (0.0%) |
| 60 to 89 Minutes | 0 (0.0%) | 0 (0.0%) |
| 90 or more Minutes | 8 (10.3%) | 3 (5.7%) |
Time of Departure to Work by Sex in Oslo
The most frequent times of departure to work in Oslo are 6:00 AM to 6:29 AM (29, 37.2%) for males and 7:00 AM to 7:29 AM (26, 49.1%) for females.
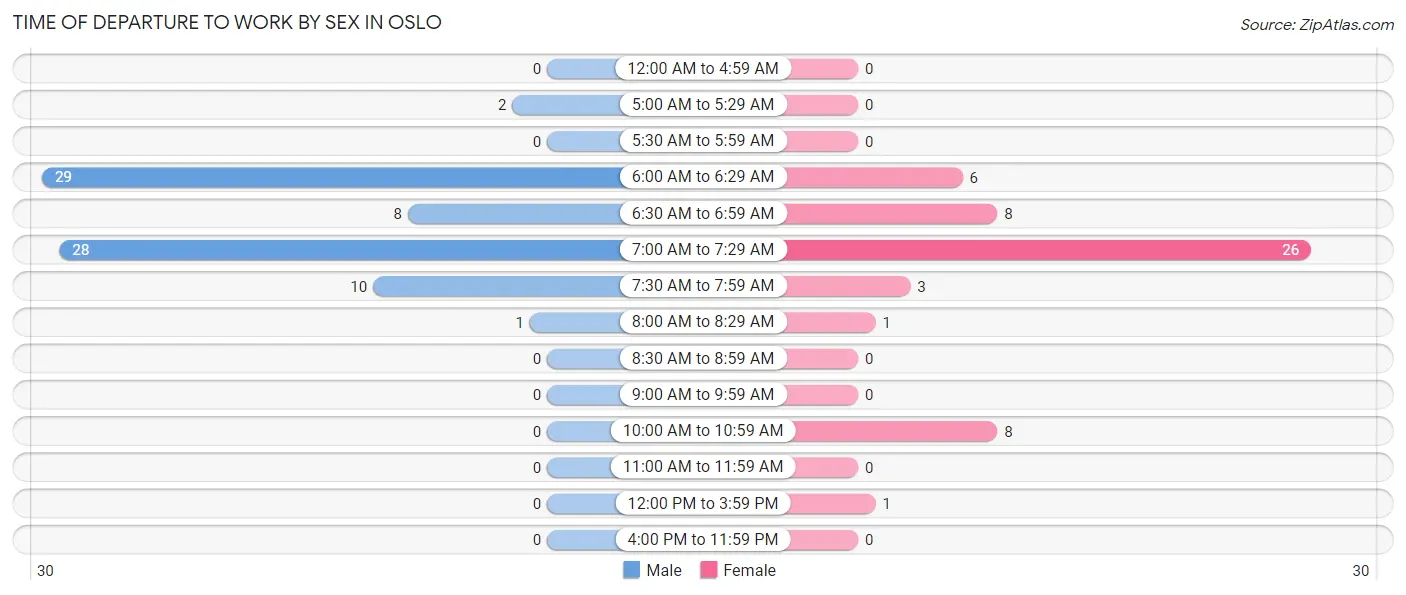
| Time of Departure | Male | Female |
| 12:00 AM to 4:59 AM | 0 (0.0%) | 0 (0.0%) |
| 5:00 AM to 5:29 AM | 2 (2.6%) | 0 (0.0%) |
| 5:30 AM to 5:59 AM | 0 (0.0%) | 0 (0.0%) |
| 6:00 AM to 6:29 AM | 29 (37.2%) | 6 (11.3%) |
| 6:30 AM to 6:59 AM | 8 (10.3%) | 8 (15.1%) |
| 7:00 AM to 7:29 AM | 28 (35.9%) | 26 (49.1%) |
| 7:30 AM to 7:59 AM | 10 (12.8%) | 3 (5.7%) |
| 8:00 AM to 8:29 AM | 1 (1.3%) | 1 (1.9%) |
| 8:30 AM to 8:59 AM | 0 (0.0%) | 0 (0.0%) |
| 9:00 AM to 9:59 AM | 0 (0.0%) | 0 (0.0%) |
| 10:00 AM to 10:59 AM | 0 (0.0%) | 8 (15.1%) |
| 11:00 AM to 11:59 AM | 0 (0.0%) | 0 (0.0%) |
| 12:00 PM to 3:59 PM | 0 (0.0%) | 1 (1.9%) |
| 4:00 PM to 11:59 PM | 0 (0.0%) | 0 (0.0%) |
| Total | 78 (100.0%) | 53 (100.0%) |
Housing Occupancy in Oslo
Occupancy by Ownership in Oslo
Of the total 120 dwellings in Oslo, owner-occupied units account for 106 (88.3%), while renter-occupied units make up 14 (11.7%).
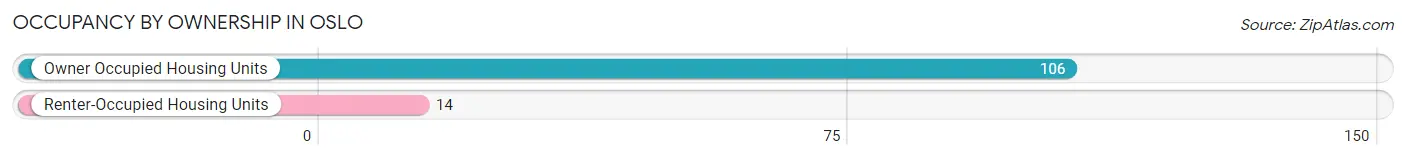
| Occupancy | # Housing Units | % Housing Units |
| Owner Occupied Housing Units | 106 | 88.3% |
| Renter-Occupied Housing Units | 14 | 11.7% |
| Total Occupied Housing Units | 120 | 100.0% |
Occupancy by Household Size in Oslo
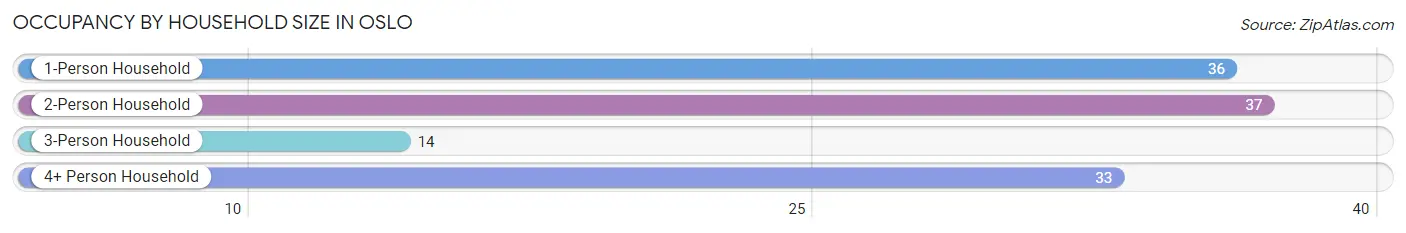
| Household Size | # Housing Units | % Housing Units |
| 1-Person Household | 36 | 30.0% |
| 2-Person Household | 37 | 30.8% |
| 3-Person Household | 14 | 11.7% |
| 4+ Person Household | 33 | 27.5% |
| Total Housing Units | 120 | 100.0% |
Occupancy by Ownership by Household Size in Oslo
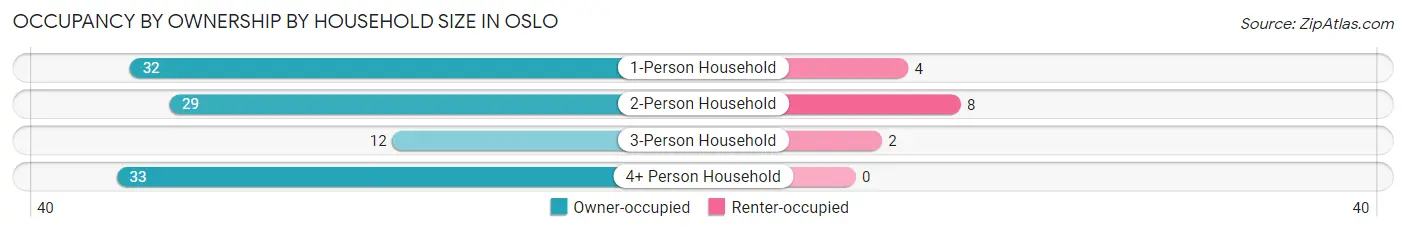
| Household Size | Owner-occupied | Renter-occupied |
| 1-Person Household | 32 (88.9%) | 4 (11.1%) |
| 2-Person Household | 29 (78.4%) | 8 (21.6%) |
| 3-Person Household | 12 (85.7%) | 2 (14.3%) |
| 4+ Person Household | 33 (100.0%) | 0 (0.0%) |
| Total Housing Units | 106 (88.3%) | 14 (11.7%) |
Occupancy by Educational Attainment in Oslo
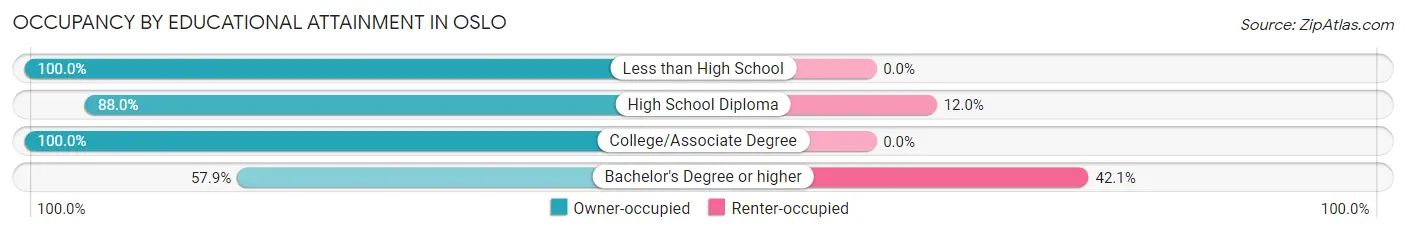
| Household Size | Owner-occupied | Renter-occupied |
| Less than High School | 16 (100.0%) | 0 (0.0%) |
| High School Diploma | 44 (88.0%) | 6 (12.0%) |
| College/Associate Degree | 35 (100.0%) | 0 (0.0%) |
| Bachelor's Degree or higher | 11 (57.9%) | 8 (42.1%) |
Occupancy by Age of Householder in Oslo
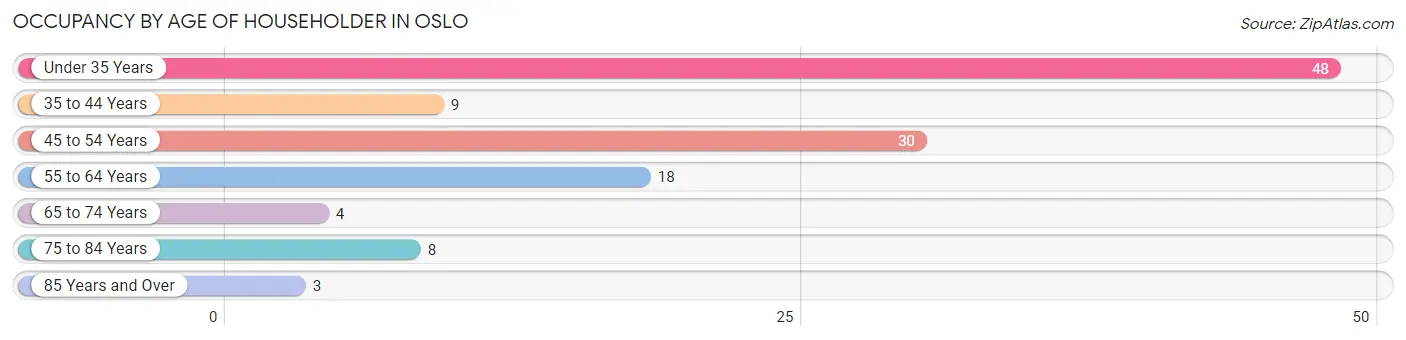
| Age Bracket | # Households | % Households |
| Under 35 Years | 48 | 40.0% |
| 35 to 44 Years | 9 | 7.5% |
| 45 to 54 Years | 30 | 25.0% |
| 55 to 64 Years | 18 | 15.0% |
| 65 to 74 Years | 4 | 3.3% |
| 75 to 84 Years | 8 | 6.7% |
| 85 Years and Over | 3 | 2.5% |
| Total | 120 | 100.0% |
Housing Finances in Oslo
Median Income by Occupancy in Oslo
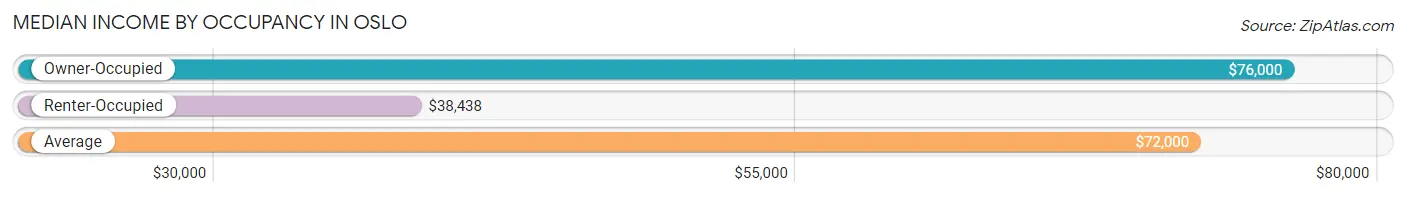
| Occupancy Type | # Households | Median Income |
| Owner-Occupied | 106 (88.3%) | $76,000 |
| Renter-Occupied | 14 (11.7%) | $38,438 |
| Average | 120 (100.0%) | $72,000 |
Occupancy by Householder Income Bracket in Oslo
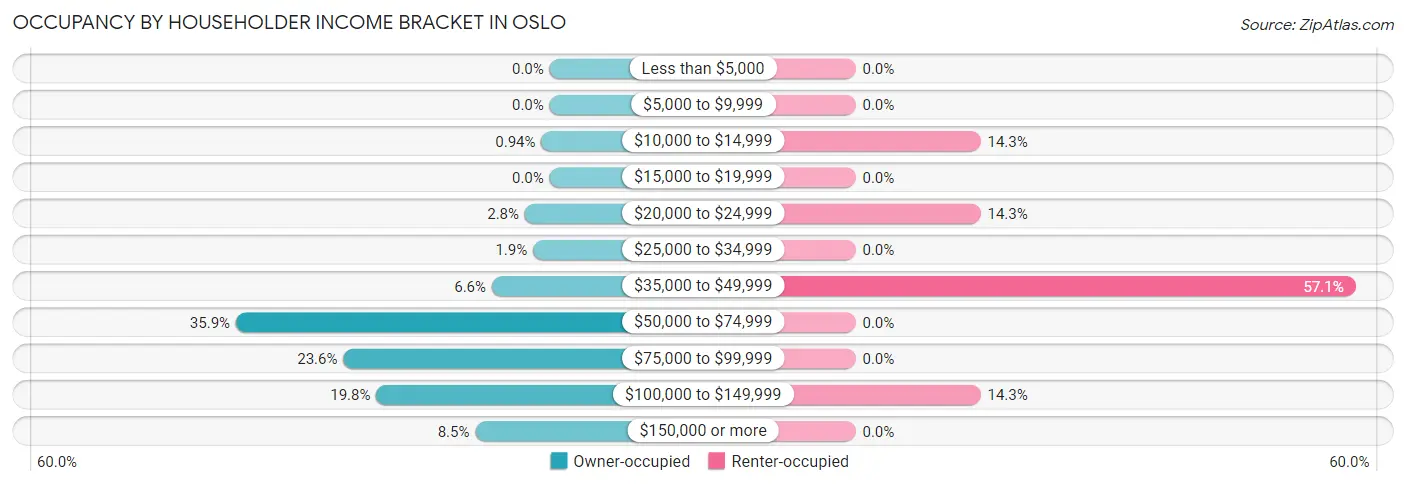
| Income Bracket | Owner-occupied | Renter-occupied |
| Less than $5,000 | 0 (0.0%) | 0 (0.0%) |
| $5,000 to $9,999 | 0 (0.0%) | 0 (0.0%) |
| $10,000 to $14,999 | 1 (0.9%) | 2 (14.3%) |
| $15,000 to $19,999 | 0 (0.0%) | 0 (0.0%) |
| $20,000 to $24,999 | 3 (2.8%) | 2 (14.3%) |
| $25,000 to $34,999 | 2 (1.9%) | 0 (0.0%) |
| $35,000 to $49,999 | 7 (6.6%) | 8 (57.1%) |
| $50,000 to $74,999 | 38 (35.8%) | 0 (0.0%) |
| $75,000 to $99,999 | 25 (23.6%) | 0 (0.0%) |
| $100,000 to $149,999 | 21 (19.8%) | 2 (14.3%) |
| $150,000 or more | 9 (8.5%) | 0 (0.0%) |
| Total | 106 (100.0%) | 14 (100.0%) |
Monthly Housing Cost Tiers in Oslo
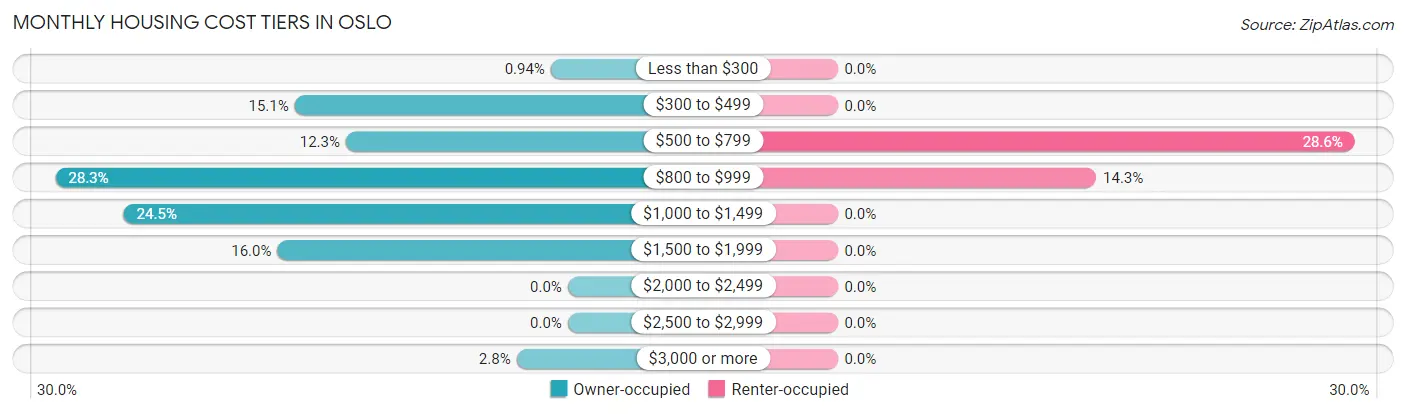
| Monthly Cost | Owner-occupied | Renter-occupied |
| Less than $300 | 1 (0.9%) | 0 (0.0%) |
| $300 to $499 | 16 (15.1%) | 0 (0.0%) |
| $500 to $799 | 13 (12.3%) | 4 (28.6%) |
| $800 to $999 | 30 (28.3%) | 2 (14.3%) |
| $1,000 to $1,499 | 26 (24.5%) | 0 (0.0%) |
| $1,500 to $1,999 | 17 (16.0%) | 0 (0.0%) |
| $2,000 to $2,499 | 0 (0.0%) | 0 (0.0%) |
| $2,500 to $2,999 | 0 (0.0%) | 0 (0.0%) |
| $3,000 or more | 3 (2.8%) | 0 (0.0%) |
| Total | 106 (100.0%) | 14 (100.0%) |
Physical Housing Characteristics in Oslo
Housing Structures in Oslo
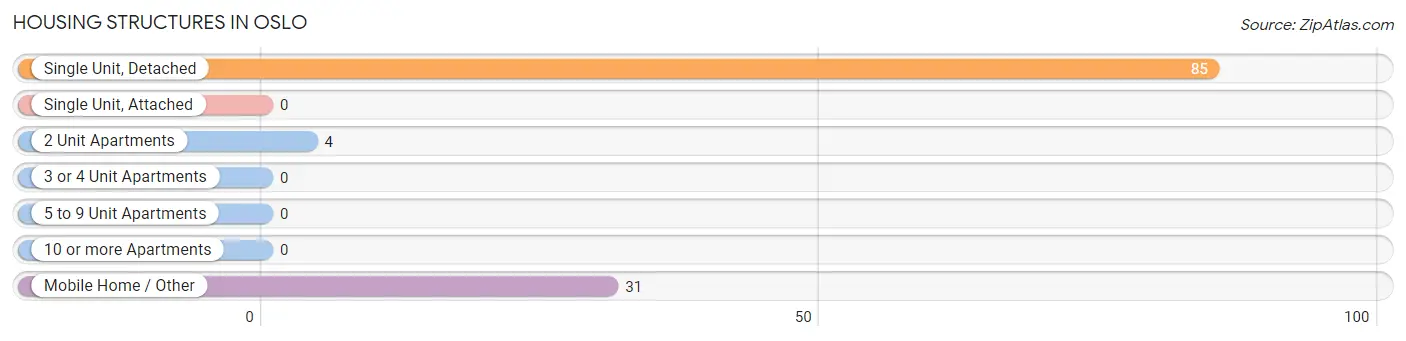
| Structure Type | # Housing Units | % Housing Units |
| Single Unit, Detached | 85 | 70.8% |
| Single Unit, Attached | 0 | 0.0% |
| 2 Unit Apartments | 4 | 3.3% |
| 3 or 4 Unit Apartments | 0 | 0.0% |
| 5 to 9 Unit Apartments | 0 | 0.0% |
| 10 or more Apartments | 0 | 0.0% |
| Mobile Home / Other | 31 | 25.8% |
| Total | 120 | 100.0% |
Housing Structures by Occupancy in Oslo
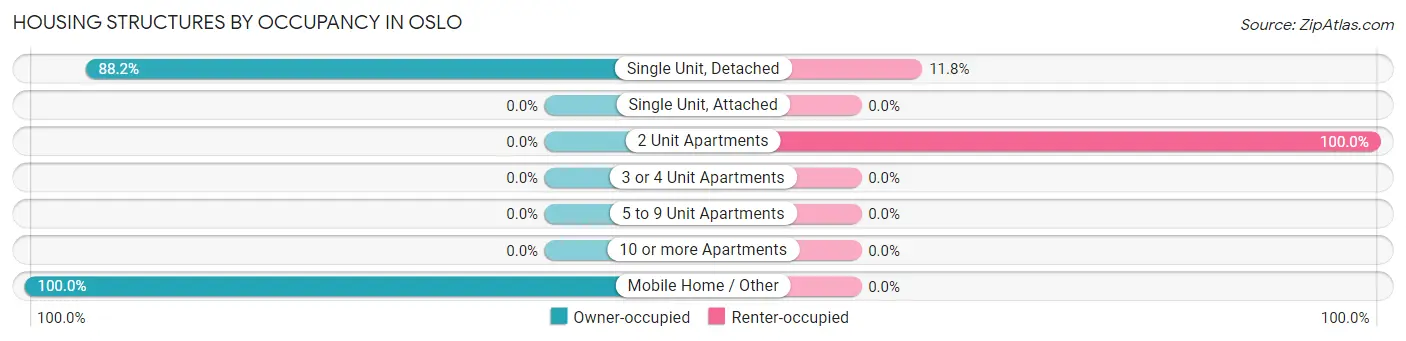
| Structure Type | Owner-occupied | Renter-occupied |
| Single Unit, Detached | 75 (88.2%) | 10 (11.8%) |
| Single Unit, Attached | 0 (0.0%) | 0 (0.0%) |
| 2 Unit Apartments | 0 (0.0%) | 4 (100.0%) |
| 3 or 4 Unit Apartments | 0 (0.0%) | 0 (0.0%) |
| 5 to 9 Unit Apartments | 0 (0.0%) | 0 (0.0%) |
| 10 or more Apartments | 0 (0.0%) | 0 (0.0%) |
| Mobile Home / Other | 31 (100.0%) | 0 (0.0%) |
| Total | 106 (88.3%) | 14 (11.7%) |
Housing Structures by Number of Rooms in Oslo
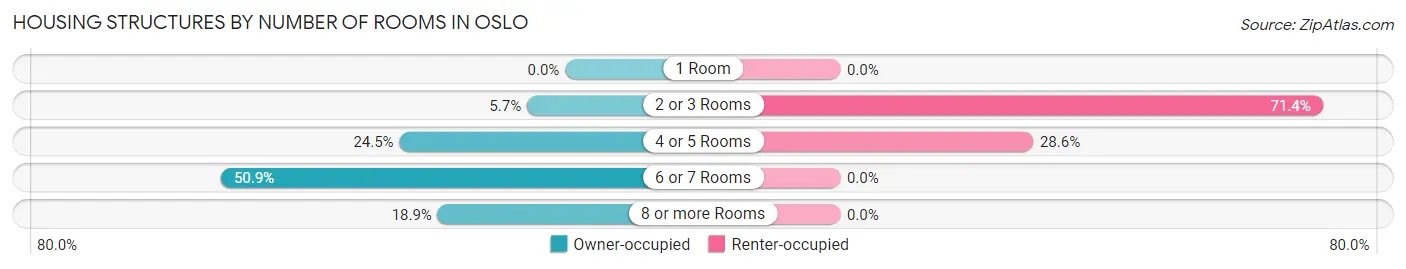
| Number of Rooms | Owner-occupied | Renter-occupied |
| 1 Room | 0 (0.0%) | 0 (0.0%) |
| 2 or 3 Rooms | 6 (5.7%) | 10 (71.4%) |
| 4 or 5 Rooms | 26 (24.5%) | 4 (28.6%) |
| 6 or 7 Rooms | 54 (50.9%) | 0 (0.0%) |
| 8 or more Rooms | 20 (18.9%) | 0 (0.0%) |
| Total | 106 (100.0%) | 14 (100.0%) |
Housing Structure by Heating Type in Oslo
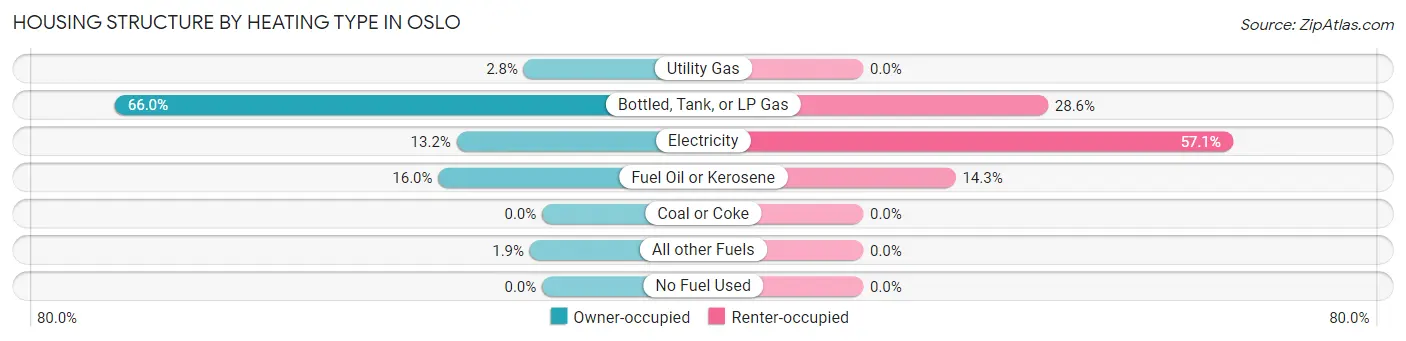
| Heating Type | Owner-occupied | Renter-occupied |
| Utility Gas | 3 (2.8%) | 0 (0.0%) |
| Bottled, Tank, or LP Gas | 70 (66.0%) | 4 (28.6%) |
| Electricity | 14 (13.2%) | 8 (57.1%) |
| Fuel Oil or Kerosene | 17 (16.0%) | 2 (14.3%) |
| Coal or Coke | 0 (0.0%) | 0 (0.0%) |
| All other Fuels | 2 (1.9%) | 0 (0.0%) |
| No Fuel Used | 0 (0.0%) | 0 (0.0%) |
| Total | 106 (100.0%) | 14 (100.0%) |
Household Vehicle Usage in Oslo
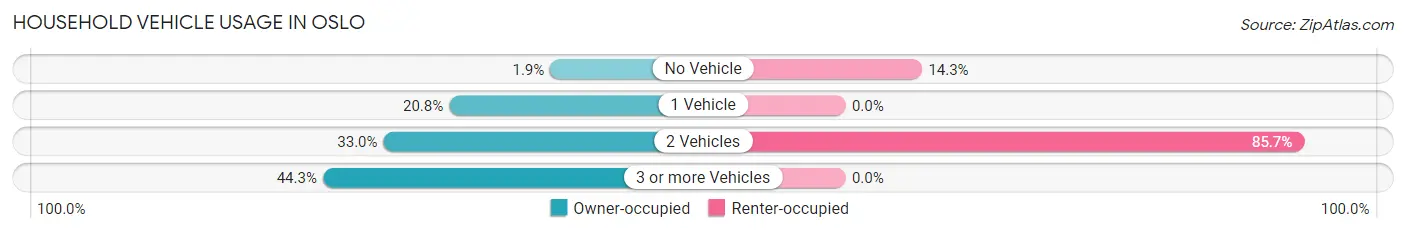
| Vehicles per Household | Owner-occupied | Renter-occupied |
| No Vehicle | 2 (1.9%) | 2 (14.3%) |
| 1 Vehicle | 22 (20.7%) | 0 (0.0%) |
| 2 Vehicles | 35 (33.0%) | 12 (85.7%) |
| 3 or more Vehicles | 47 (44.3%) | 0 (0.0%) |
| Total | 106 (100.0%) | 14 (100.0%) |
Real Estate & Mortgages in Oslo
Real Estate and Mortgage Overview in Oslo
| Characteristic | Without Mortgage | With Mortgage |
| Housing Units | 51 | 55 |
| Median Property Value | $56,100 | $146,300 |
| Median Household Income | $64,250 | $5 |
| Monthly Housing Costs | $683 | $3 |
| Real Estate Taxes | $911 | $1 |
Property Value by Mortgage Status in Oslo
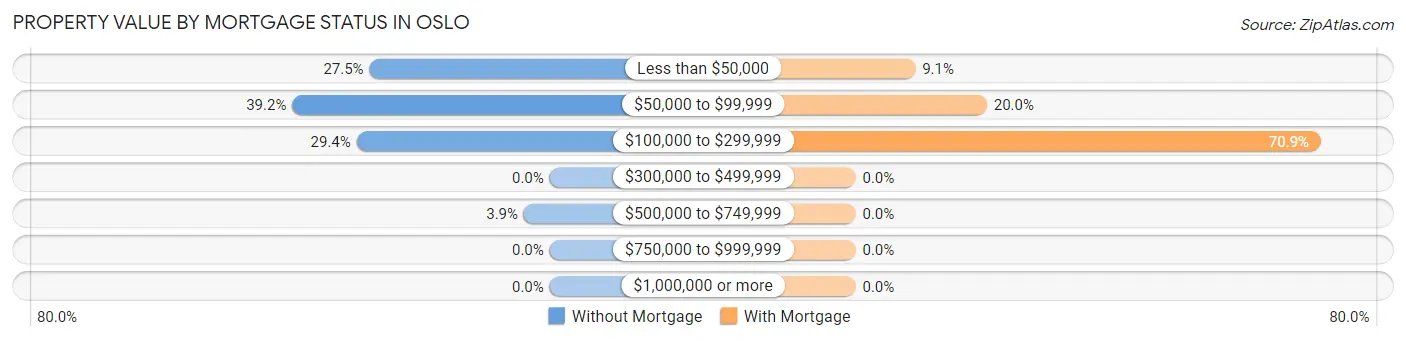
| Property Value | Without Mortgage | With Mortgage |
| Less than $50,000 | 14 (27.5%) | 5 (9.1%) |
| $50,000 to $99,999 | 20 (39.2%) | 11 (20.0%) |
| $100,000 to $299,999 | 15 (29.4%) | 39 (70.9%) |
| $300,000 to $499,999 | 0 (0.0%) | 0 (0.0%) |
| $500,000 to $749,999 | 2 (3.9%) | 0 (0.0%) |
| $750,000 to $999,999 | 0 (0.0%) | 0 (0.0%) |
| $1,000,000 or more | 0 (0.0%) | 0 (0.0%) |
| Total | 51 (100.0%) | 55 (100.0%) |
Household Income by Mortgage Status in Oslo
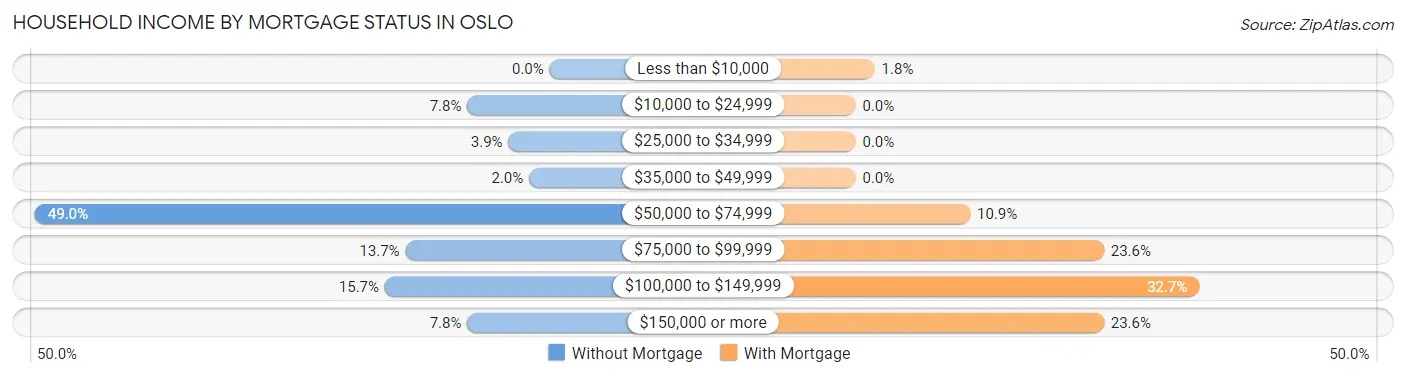
| Household Income | Without Mortgage | With Mortgage |
| Less than $10,000 | 0 (0.0%) | 1 (1.8%) |
| $10,000 to $24,999 | 4 (7.8%) | 0 (0.0%) |
| $25,000 to $34,999 | 2 (3.9%) | 0 (0.0%) |
| $35,000 to $49,999 | 1 (2.0%) | 0 (0.0%) |
| $50,000 to $74,999 | 25 (49.0%) | 6 (10.9%) |
| $75,000 to $99,999 | 7 (13.7%) | 13 (23.6%) |
| $100,000 to $149,999 | 8 (15.7%) | 18 (32.7%) |
| $150,000 or more | 4 (7.8%) | 13 (23.6%) |
| Total | 51 (100.0%) | 55 (100.0%) |
Property Value to Household Income Ratio in Oslo
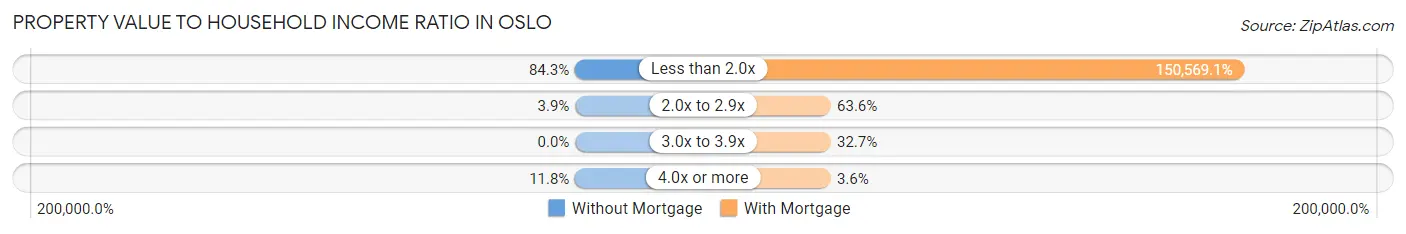
| Value-to-Income Ratio | Without Mortgage | With Mortgage |
| Less than 2.0x | 43 (84.3%) | 82,813 (150,569.1%) |
| 2.0x to 2.9x | 2 (3.9%) | 35 (63.6%) |
| 3.0x to 3.9x | 0 (0.0%) | 18 (32.7%) |
| 4.0x or more | 6 (11.8%) | 2 (3.6%) |
| Total | 51 (100.0%) | 55 (100.0%) |
Real Estate Taxes by Mortgage Status in Oslo
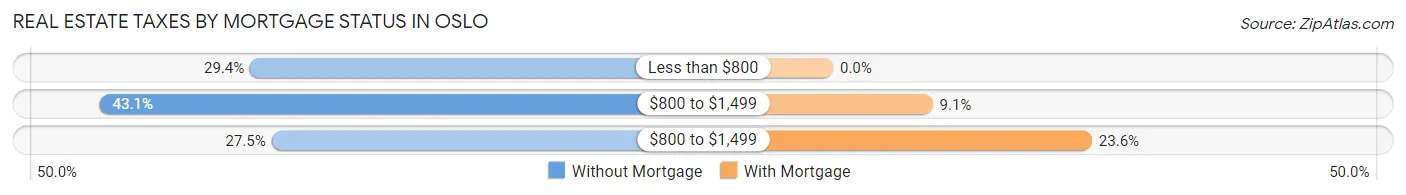
| Property Taxes | Without Mortgage | With Mortgage |
| Less than $800 | 15 (29.4%) | 0 (0.0%) |
| $800 to $1,499 | 22 (43.1%) | 5 (9.1%) |
| $800 to $1,499 | 14 (27.5%) | 13 (23.6%) |
| Total | 51 (100.0%) | 55 (100.0%) |
Health & Disability in Oslo
Health Insurance Coverage by Age in Oslo
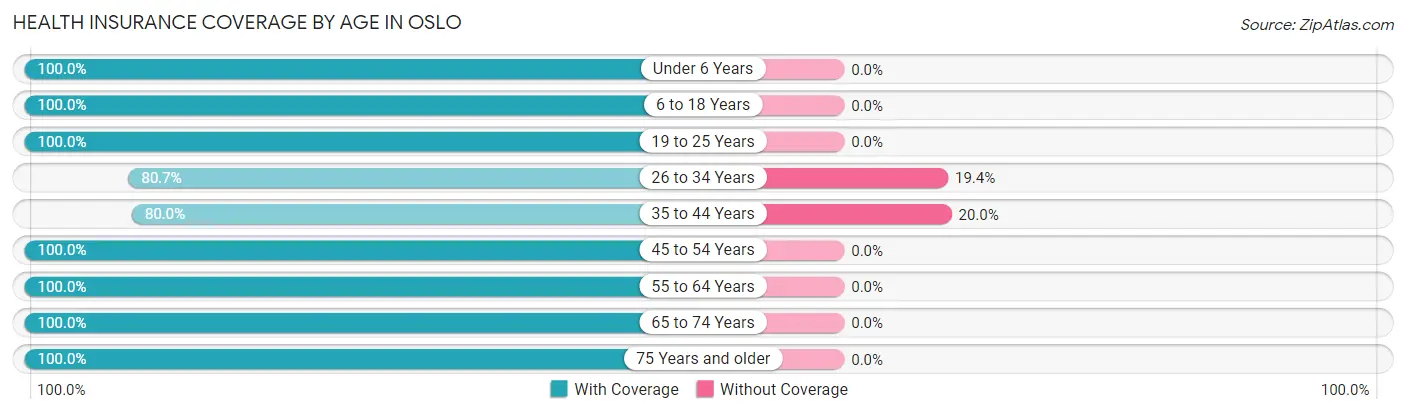
| Age Bracket | With Coverage | Without Coverage |
| Under 6 Years | 41 (100.0%) | 0 (0.0%) |
| 6 to 18 Years | 61 (100.0%) | 0 (0.0%) |
| 19 to 25 Years | 39 (100.0%) | 0 (0.0%) |
| 26 to 34 Years | 50 (80.6%) | 12 (19.4%) |
| 35 to 44 Years | 16 (80.0%) | 4 (20.0%) |
| 45 to 54 Years | 48 (100.0%) | 0 (0.0%) |
| 55 to 64 Years | 28 (100.0%) | 0 (0.0%) |
| 65 to 74 Years | 12 (100.0%) | 0 (0.0%) |
| 75 Years and older | 16 (100.0%) | 0 (0.0%) |
| Total | 311 (95.1%) | 16 (4.9%) |
Health Insurance Coverage by Citizenship Status in Oslo
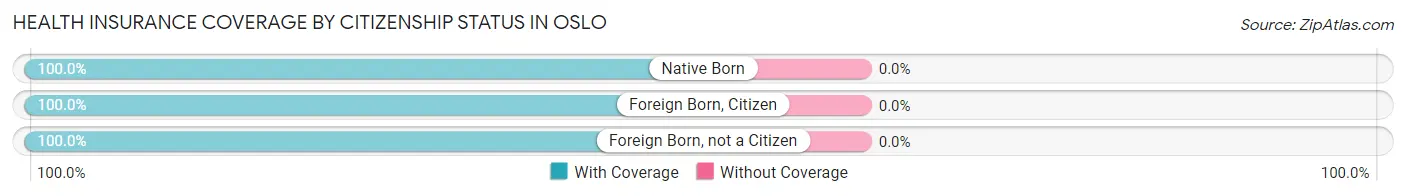
| Citizenship Status | With Coverage | Without Coverage |
| Native Born | 41 (100.0%) | 0 (0.0%) |
| Foreign Born, Citizen | 61 (100.0%) | 0 (0.0%) |
| Foreign Born, not a Citizen | 39 (100.0%) | 0 (0.0%) |
Health Insurance Coverage by Household Income in Oslo
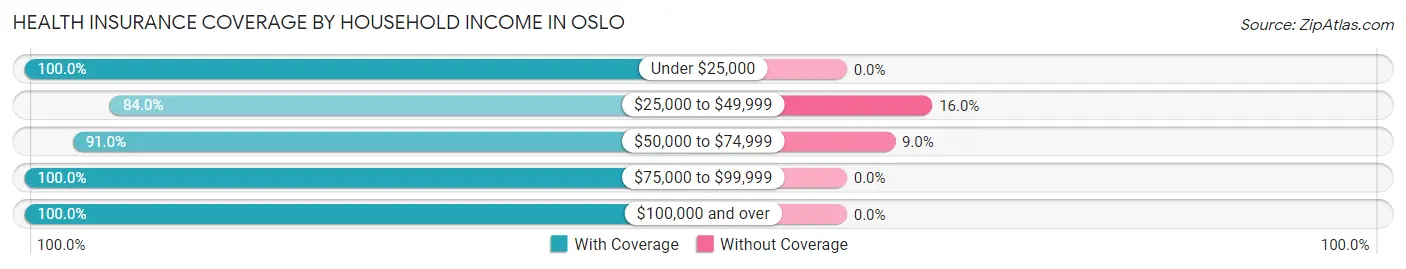
| Household Income | With Coverage | Without Coverage |
| Under $25,000 | 11 (100.0%) | 0 (0.0%) |
| $25,000 to $49,999 | 21 (84.0%) | 4 (16.0%) |
| $50,000 to $74,999 | 121 (91.0%) | 12 (9.0%) |
| $75,000 to $99,999 | 64 (100.0%) | 0 (0.0%) |
| $100,000 and over | 94 (100.0%) | 0 (0.0%) |
Public vs Private Health Insurance Coverage by Age in Oslo
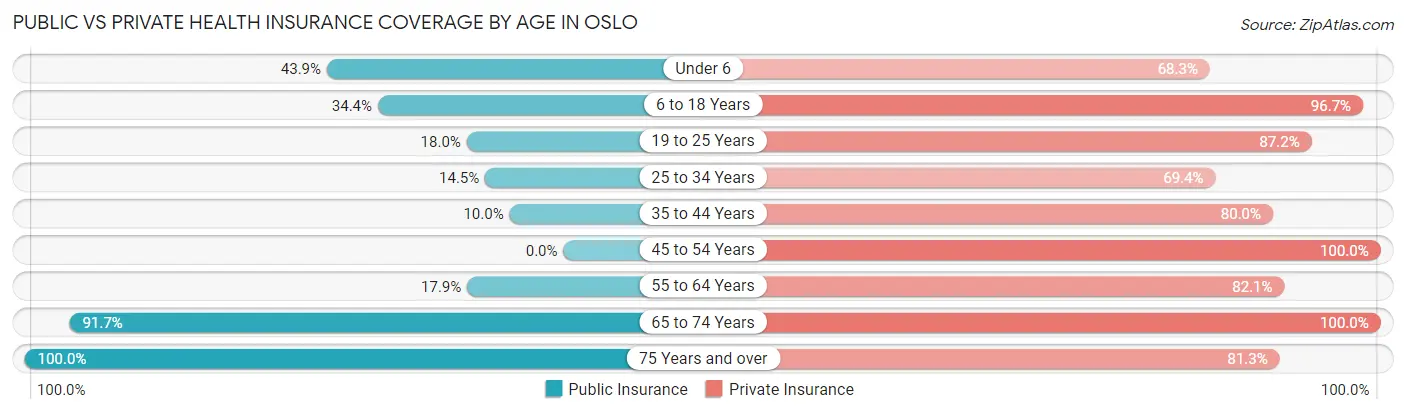
| Age Bracket | Public Insurance | Private Insurance |
| Under 6 | 18 (43.9%) | 28 (68.3%) |
| 6 to 18 Years | 21 (34.4%) | 59 (96.7%) |
| 19 to 25 Years | 7 (17.9%) | 34 (87.2%) |
| 25 to 34 Years | 9 (14.5%) | 43 (69.4%) |
| 35 to 44 Years | 2 (10.0%) | 16 (80.0%) |
| 45 to 54 Years | 0 (0.0%) | 48 (100.0%) |
| 55 to 64 Years | 5 (17.9%) | 23 (82.1%) |
| 65 to 74 Years | 11 (91.7%) | 12 (100.0%) |
| 75 Years and over | 16 (100.0%) | 13 (81.2%) |
| Total | 89 (27.2%) | 276 (84.4%) |
Disability Status by Sex by Age in Oslo
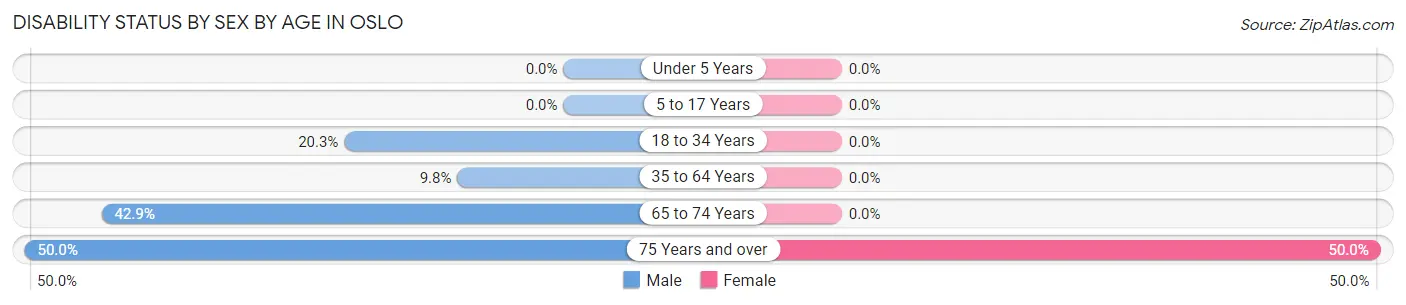
| Age Bracket | Male | Female |
| Under 5 Years | 0 (0.0%) | 0 (0.0%) |
| 5 to 17 Years | 0 (0.0%) | 0 (0.0%) |
| 18 to 34 Years | 12 (20.3%) | 0 (0.0%) |
| 35 to 64 Years | 6 (9.8%) | 0 (0.0%) |
| 65 to 74 Years | 3 (42.9%) | 0 (0.0%) |
| 75 Years and over | 4 (50.0%) | 4 (50.0%) |
Disability Class by Sex by Age in Oslo
Disability Class: Hearing Difficulty
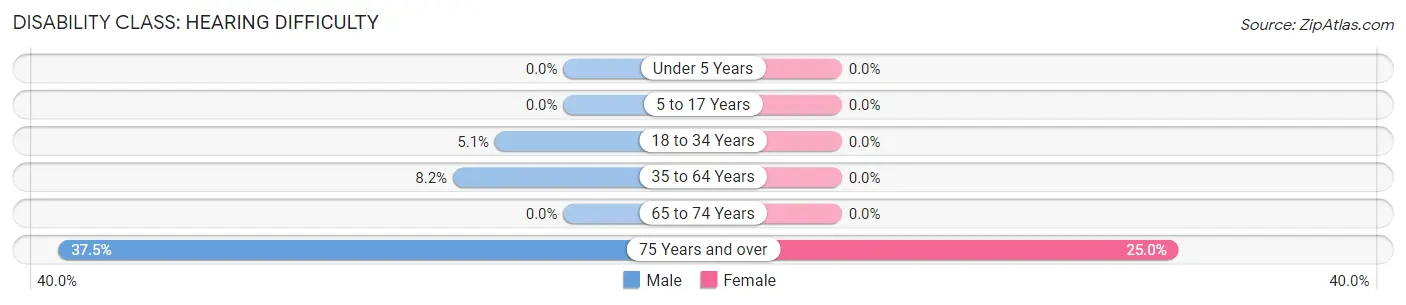
| Age Bracket | Male | Female |
| Under 5 Years | 0 (0.0%) | 0 (0.0%) |
| 5 to 17 Years | 0 (0.0%) | 0 (0.0%) |
| 18 to 34 Years | 3 (5.1%) | 0 (0.0%) |
| 35 to 64 Years | 5 (8.2%) | 0 (0.0%) |
| 65 to 74 Years | 0 (0.0%) | 0 (0.0%) |
| 75 Years and over | 3 (37.5%) | 2 (25.0%) |
Disability Class: Vision Difficulty
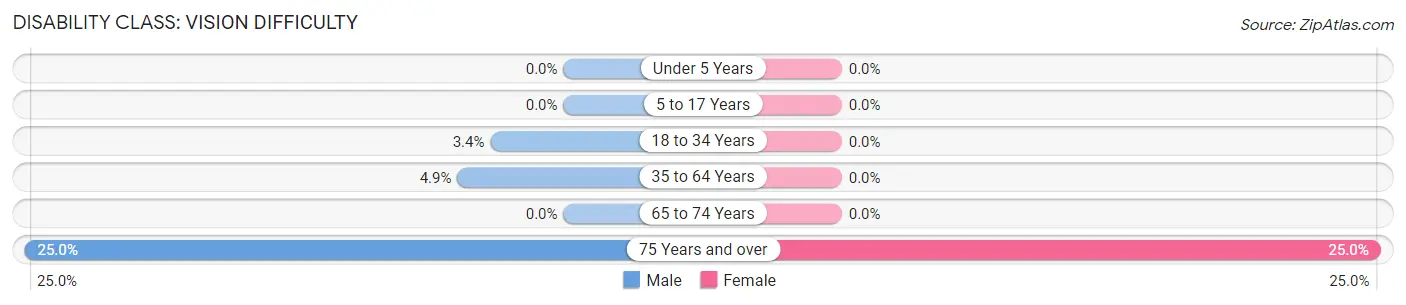
| Age Bracket | Male | Female |
| Under 5 Years | 0 (0.0%) | 0 (0.0%) |
| 5 to 17 Years | 0 (0.0%) | 0 (0.0%) |
| 18 to 34 Years | 2 (3.4%) | 0 (0.0%) |
| 35 to 64 Years | 3 (4.9%) | 0 (0.0%) |
| 65 to 74 Years | 0 (0.0%) | 0 (0.0%) |
| 75 Years and over | 2 (25.0%) | 2 (25.0%) |
Disability Class: Cognitive Difficulty
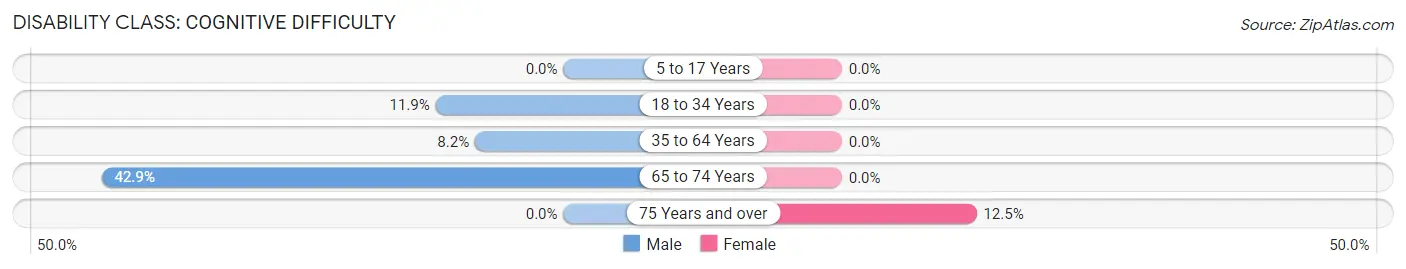
| Age Bracket | Male | Female |
| 5 to 17 Years | 0 (0.0%) | 0 (0.0%) |
| 18 to 34 Years | 7 (11.9%) | 0 (0.0%) |
| 35 to 64 Years | 5 (8.2%) | 0 (0.0%) |
| 65 to 74 Years | 3 (42.9%) | 0 (0.0%) |
| 75 Years and over | 0 (0.0%) | 1 (12.5%) |
Disability Class: Ambulatory Difficulty
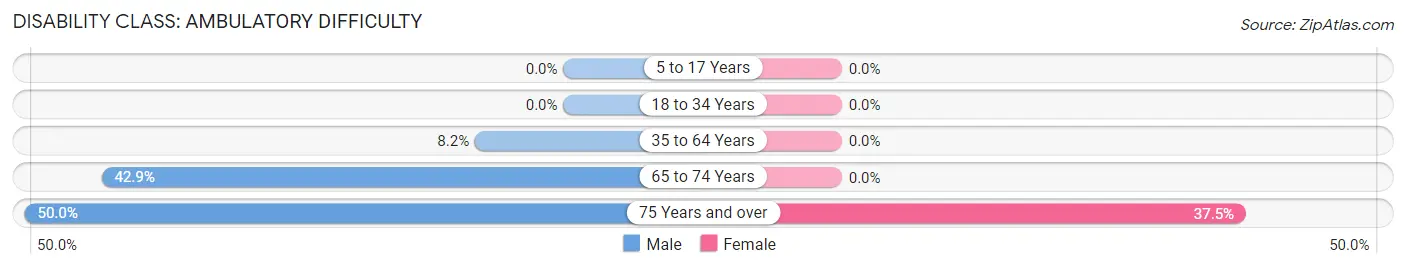
| Age Bracket | Male | Female |
| 5 to 17 Years | 0 (0.0%) | 0 (0.0%) |
| 18 to 34 Years | 0 (0.0%) | 0 (0.0%) |
| 35 to 64 Years | 5 (8.2%) | 0 (0.0%) |
| 65 to 74 Years | 3 (42.9%) | 0 (0.0%) |
| 75 Years and over | 4 (50.0%) | 3 (37.5%) |
Disability Class: Self-Care Difficulty
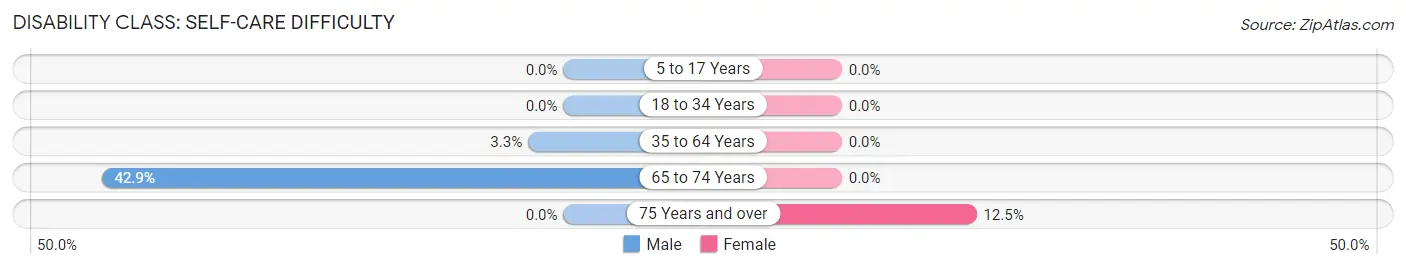
| Age Bracket | Male | Female |
| 5 to 17 Years | 0 (0.0%) | 0 (0.0%) |
| 18 to 34 Years | 0 (0.0%) | 0 (0.0%) |
| 35 to 64 Years | 2 (3.3%) | 0 (0.0%) |
| 65 to 74 Years | 3 (42.9%) | 0 (0.0%) |
| 75 Years and over | 0 (0.0%) | 1 (12.5%) |
Technology Access in Oslo
Computing Device Access in Oslo
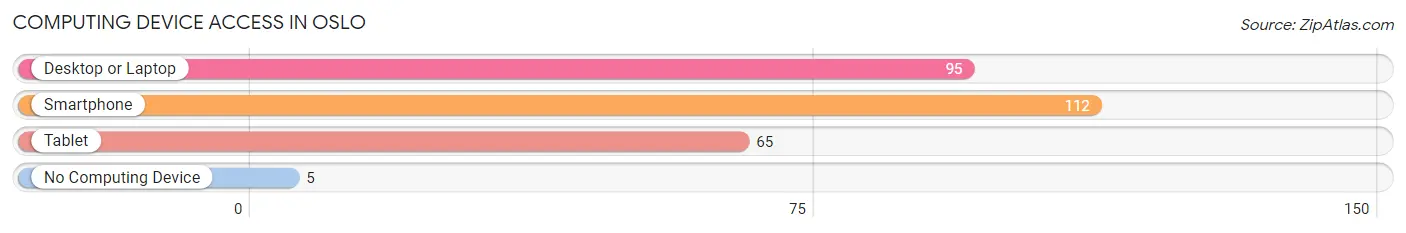
| Device Type | # Households | % Households |
| Desktop or Laptop | 95 | 79.2% |
| Smartphone | 112 | 93.3% |
| Tablet | 65 | 54.2% |
| No Computing Device | 5 | 4.2% |
| Total | 120 | 100.0% |
Internet Access in Oslo
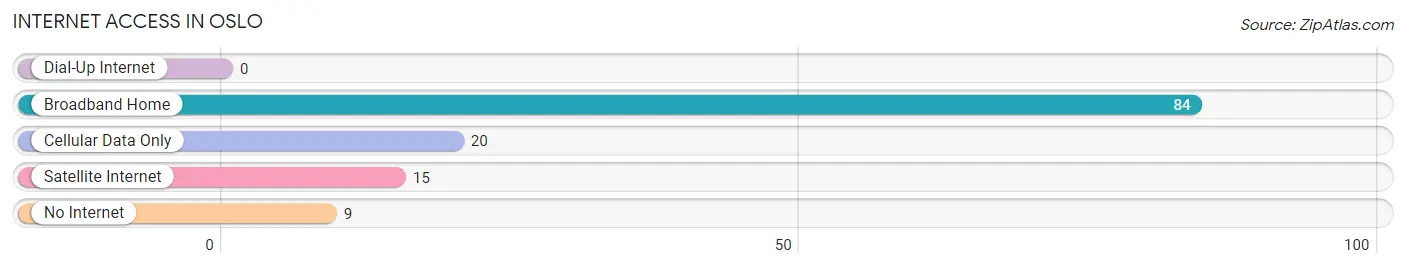
| Internet Type | # Households | % Households |
| Dial-Up Internet | 0 | 0.0% |
| Broadband Home | 84 | 70.0% |
| Cellular Data Only | 20 | 16.7% |
| Satellite Internet | 15 | 12.5% |
| No Internet | 9 | 7.5% |
| Total | 120 | 100.0% |
Oslo Summary
Oslo, Minnesota is a small city located in the northwestern corner of the state, near the border of North Dakota. It is part of the Red River Valley region, and is the county seat of Marshall County. Oslo has a population of just over 1,000 people, and is known for its rural charm and friendly atmosphere.
History
Oslo was founded in 1881 by Norwegian immigrants who were looking for a place to settle and start a new life. The city was named after the capital of Norway, and the settlers brought with them many of the traditions and customs of their homeland. The first settlers were mostly farmers, and the city quickly grew as more people moved to the area.
In the early 1900s, the city began to expand and develop. The railroad came to town in 1906, and the city was incorporated in 1908. The city was a major hub for the agricultural industry, and it was also home to several businesses, including a flour mill, a creamery, and a lumber yard.
Geography
Oslo is located in the northwestern corner of Minnesota, near the border of North Dakota. It is part of the Red River Valley region, and is situated on the banks of the Red River. The city is surrounded by rolling hills and farmland, and is known for its beautiful scenery.
The climate in Oslo is typical of the Midwest, with cold winters and hot summers. The average temperature in the winter is around 20 degrees Fahrenheit, and in the summer it is around 70 degrees Fahrenheit. The city receives an average of 30 inches of snow each year.
Economy
Oslo’s economy is largely based on agriculture and tourism. The city is home to several farms, and the surrounding area is known for its fertile soil and abundant crops. The city is also home to several businesses, including a flour mill, a creamery, and a lumber yard.
Tourism is also an important part of the city’s economy. The city is home to several attractions, including the Marshall County Historical Museum, the Oslo Opera House, and the Oslo Golf Course. The city also hosts several festivals throughout the year, including the Oslo Summer Festival and the Oslo Winter Festival.
Demographics
As of the 2010 census, the population of Oslo was 1,037. The city is predominantly white, with 92.3% of the population identifying as such. The median household income is $41,250, and the median age is 43.
Oslo is a small city with a friendly atmosphere and a rich history. It is a great place to live, work, and raise a family. The city is home to several businesses, and the surrounding area is known for its fertile soil and abundant crops. The city is also home to several attractions, and hosts several festivals throughout the year. Oslo is a great place to call home.
Common Questions
What is Per Capita Income in Oslo?
Per Capita income in Oslo is $32,609.
What is the Median Family Income in Oslo?
Median Family Income in Oslo is $86,250.
What is the Median Household income in Oslo?
Median Household Income in Oslo is $72,000.
What is Income or Wage Gap in Oslo?
Income or Wage Gap in Oslo is 39.0%.
Women in Oslo earn 61.0 cents for every dollar earned by a man.
What is Inequality or Gini Index in Oslo?
Inequality or Gini Index in Oslo is 0.35.
What is the Total Population of Oslo?
Total Population of Oslo is 327.
What is the Total Male Population of Oslo?
Total Male Population of Oslo is 176.
What is the Total Female Population of Oslo?
Total Female Population of Oslo is 151.
What is the Ratio of Males per 100 Females in Oslo?
There are 116.56 Males per 100 Females in Oslo.
What is the Ratio of Females per 100 Males in Oslo?
There are 85.80 Females per 100 Males in Oslo.
What is the Median Population Age in Oslo?
Median Population Age in Oslo is 30.6 Years.
What is the Average Family Size in Oslo
Average Family Size in Oslo is 3.7 People.
What is the Average Household Size in Oslo
Average Household Size in Oslo is 2.7 People.
How Large is the Labor Force in Oslo?
There are 139 People in the Labor Forcein in Oslo.
What is the Percentage of People in the Labor Force in Oslo?
57.9% of People are in the Labor Force in Oslo.
What is the Unemployment Rate in Oslo?
Unemployment Rate in Oslo is 2.2%.