Ortonville, MN Map & Demographics
Ortonville Map
Ortonville Overview
$31,481
PER CAPITA INCOME
$67,308
AVG FAMILY INCOME
$53,516
AVG HOUSEHOLD INCOME
42.4%
WAGE / INCOME GAP [ % ]
57.6¢/ $1
WAGE / INCOME GAP [ $ ]
0.42
INEQUALITY / GINI INDEX
2,081
TOTAL POPULATION
1,033
MALE POPULATION
1,048
FEMALE POPULATION
98.57
MALES / 100 FEMALES
101.45
FEMALES / 100 MALES
45.8
MEDIAN AGE
2.8
AVG FAMILY SIZE
2.0
AVG HOUSEHOLD SIZE
926
LABOR FORCE [ PEOPLE ]
53.6%
PERCENT IN LABOR FORCE
2.7%
UNEMPLOYMENT RATE
Ortonville Zip Codes
Ortonville Area Codes
Income in Ortonville
Income Overview in Ortonville
Per Capita Income in Ortonville is $31,481, while median incomes of families and households are $67,308 and $53,516 respectively.
| Characteristic | Number | Measure |
| Per Capita Income | 2,081 | $31,481 |
| Median Family Income | 500 | $67,308 |
| Mean Family Income | 500 | $88,672 |
| Median Household Income | 967 | $53,516 |
| Mean Household Income | 967 | $65,464 |
| Income Deficit | 500 | $0 |
| Wage / Income Gap (%) | 2,081 | 42.41% |
| Wage / Income Gap ($) | 2,081 | 57.59¢ per $1 |
| Gini / Inequality Index | 2,081 | 0.42 |
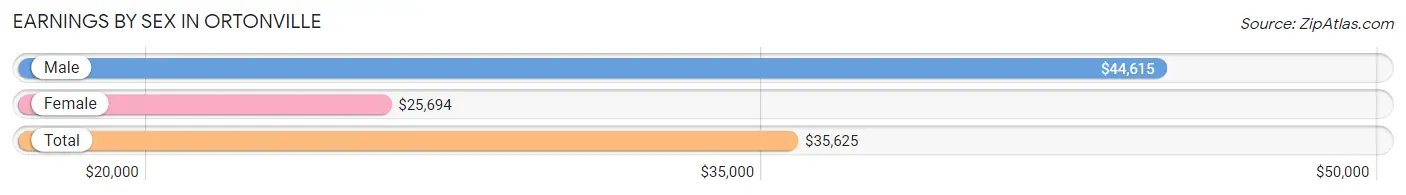
Earnings by Sex in Ortonville
Average Earnings in Ortonville are $35,625, $44,615 for men and $25,694 for women, a difference of 42.4%.
| Sex | Number | Average Earnings |
| Male | 534 (52.7%) | $44,615 |
| Female | 480 (47.3%) | $25,694 |
| Total | 1,014 (100.0%) | $35,625 |
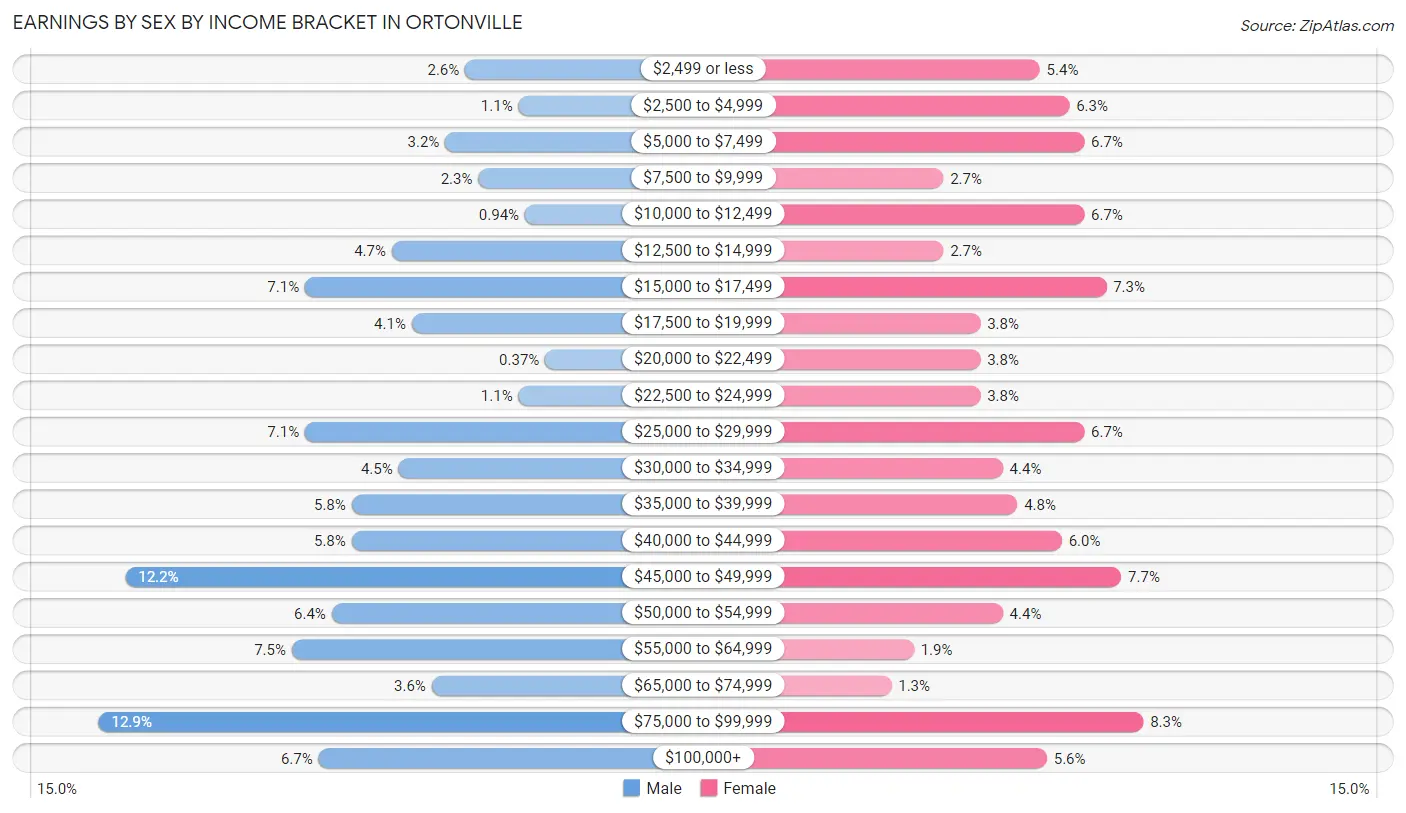
Earnings by Sex by Income Bracket in Ortonville
The most common earnings brackets in Ortonville are $75,000 to $99,999 for men (69 | 12.9%) and $75,000 to $99,999 for women (40 | 8.3%).
| Income | Male | Female |
| $2,499 or less | 14 (2.6%) | 26 (5.4%) |
| $2,500 to $4,999 | 6 (1.1%) | 30 (6.2%) |
| $5,000 to $7,499 | 17 (3.2%) | 32 (6.7%) |
| $7,500 to $9,999 | 12 (2.2%) | 13 (2.7%) |
| $10,000 to $12,499 | 5 (0.9%) | 32 (6.7%) |
| $12,500 to $14,999 | 25 (4.7%) | 13 (2.7%) |
| $15,000 to $17,499 | 38 (7.1%) | 35 (7.3%) |
| $17,500 to $19,999 | 22 (4.1%) | 18 (3.7%) |
| $20,000 to $22,499 | 2 (0.4%) | 18 (3.7%) |
| $22,500 to $24,999 | 6 (1.1%) | 18 (3.7%) |
| $25,000 to $29,999 | 38 (7.1%) | 32 (6.7%) |
| $30,000 to $34,999 | 24 (4.5%) | 21 (4.4%) |
| $35,000 to $39,999 | 31 (5.8%) | 23 (4.8%) |
| $40,000 to $44,999 | 31 (5.8%) | 29 (6.0%) |
| $45,000 to $49,999 | 65 (12.2%) | 37 (7.7%) |
| $50,000 to $54,999 | 34 (6.4%) | 21 (4.4%) |
| $55,000 to $64,999 | 40 (7.5%) | 9 (1.9%) |
| $65,000 to $74,999 | 19 (3.6%) | 6 (1.3%) |
| $75,000 to $99,999 | 69 (12.9%) | 40 (8.3%) |
| $100,000+ | 36 (6.7%) | 27 (5.6%) |
| Total | 534 (100.0%) | 480 (100.0%) |
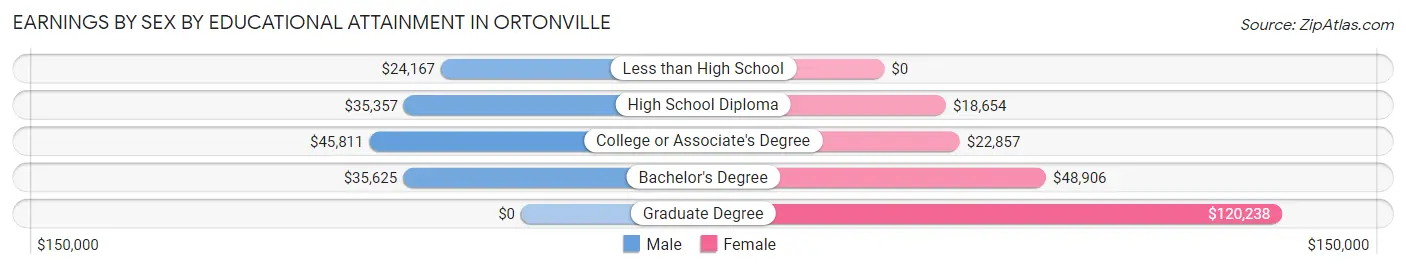
Earnings by Sex by Educational Attainment in Ortonville
Average earnings in Ortonville are $45,472 for men and $25,486 for women, a difference of 44.0%. Men with an educational attainment of college or associate's degree enjoy the highest average annual earnings of $45,811, while those with less than high school education earn the least with $24,167. Women with an educational attainment of graduate degree earn the most with the average annual earnings of $120,238, while those with high school diploma education have the smallest earnings of $18,654.
| Educational Attainment | Male Income | Female Income |
| Less than High School | $24,167 | $0 |
| High School Diploma | $35,357 | $18,654 |
| College or Associate's Degree | $45,811 | $22,857 |
| Bachelor's Degree | $35,625 | $48,906 |
| Graduate Degree | - | - |
| Total | $45,472 | $25,486 |
Family Income in Ortonville
Family Income Brackets in Ortonville
According to the Ortonville family income data, there are 133 families falling into the $50,000 to $74,999 income range, which is the most common income bracket and makes up 26.6% of all families.
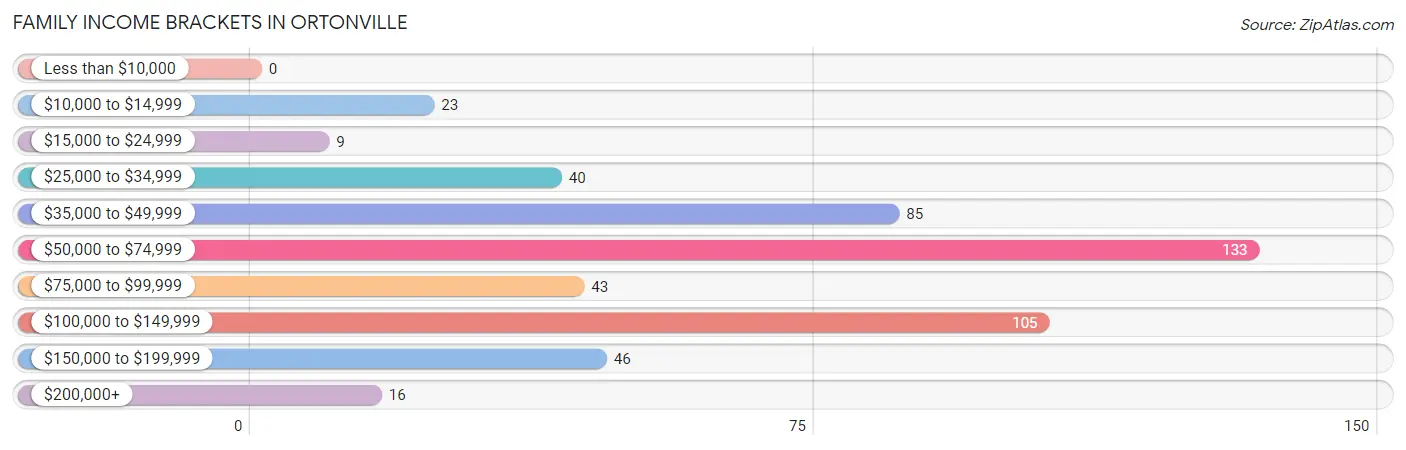
| Income Bracket | # Families | % Families |
| Less than $10,000 | 0 | 0.0% |
| $10,000 to $14,999 | 23 | 4.6% |
| $15,000 to $24,999 | 9 | 1.8% |
| $25,000 to $34,999 | 40 | 8.0% |
| $35,000 to $49,999 | 85 | 17.0% |
| $50,000 to $74,999 | 133 | 26.6% |
| $75,000 to $99,999 | 43 | 8.6% |
| $100,000 to $149,999 | 105 | 21.0% |
| $150,000 to $199,999 | 46 | 9.2% |
| $200,000+ | 16 | 3.2% |
Family Income by Famaliy Size in Ortonville
5-person families (40 | 8.0%) account for the highest median family income in Ortonville with $131,000 per family, while 3-person families (114 | 22.8%) have the highest median income of $40,644 per family member.
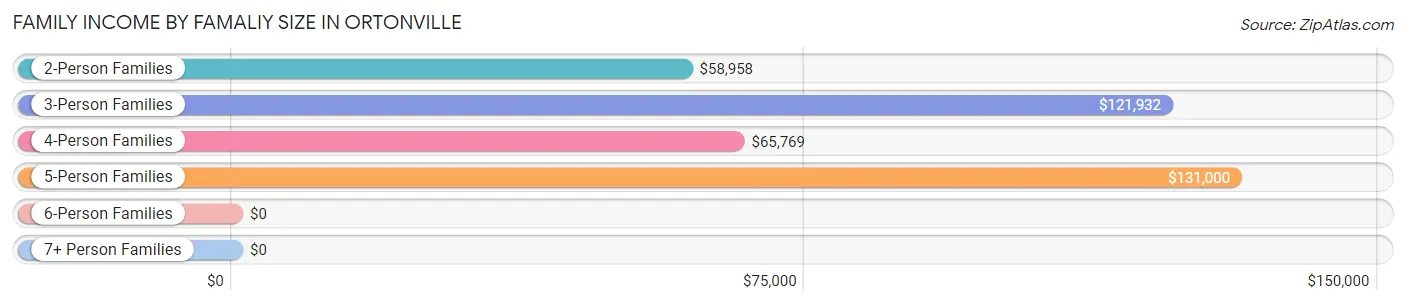
| Income Bracket | # Families | Median Income |
| 2-Person Families | 285 (57.0%) | $58,958 |
| 3-Person Families | 114 (22.8%) | $121,932 |
| 4-Person Families | 48 (9.6%) | $65,769 |
| 5-Person Families | 40 (8.0%) | $131,000 |
| 6-Person Families | 13 (2.6%) | $0 |
| 7+ Person Families | 0 (0.0%) | $0 |
| Total | 500 (100.0%) | $67,308 |
Family Income by Number of Earners in Ortonville
The median family income in Ortonville is $67,308, with families comprising 3+ earners (61) having the highest median family income of $137,917, while families with no earners (135) have the lowest median family income of $39,583, accounting for 12.2% and 27.0% of families, respectively.
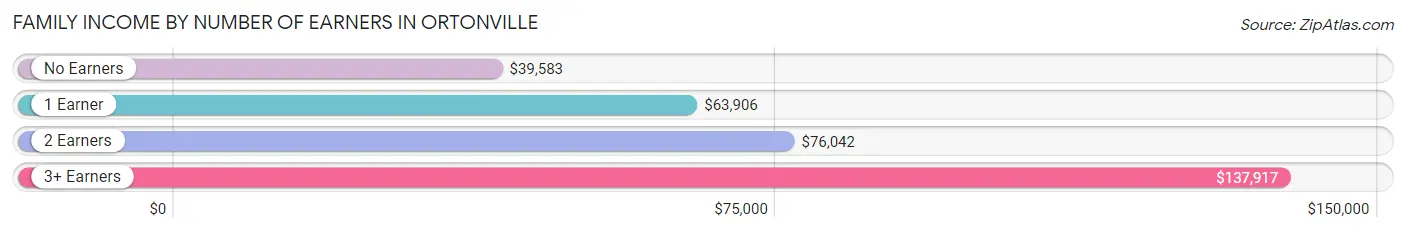
| Number of Earners | # Families | Median Income |
| No Earners | 135 (27.0%) | $39,583 |
| 1 Earner | 95 (19.0%) | $63,906 |
| 2 Earners | 209 (41.8%) | $76,042 |
| 3+ Earners | 61 (12.2%) | $137,917 |
| Total | 500 (100.0%) | $67,308 |
Household Income in Ortonville
Household Income Brackets in Ortonville
With 203 households falling in the category, the $50,000 to $74,999 income range is the most frequent in Ortonville, accounting for 21.0% of all households. In contrast, only 16 households (1.7%) fall into the $200,000+ income bracket, making it the least populous group.
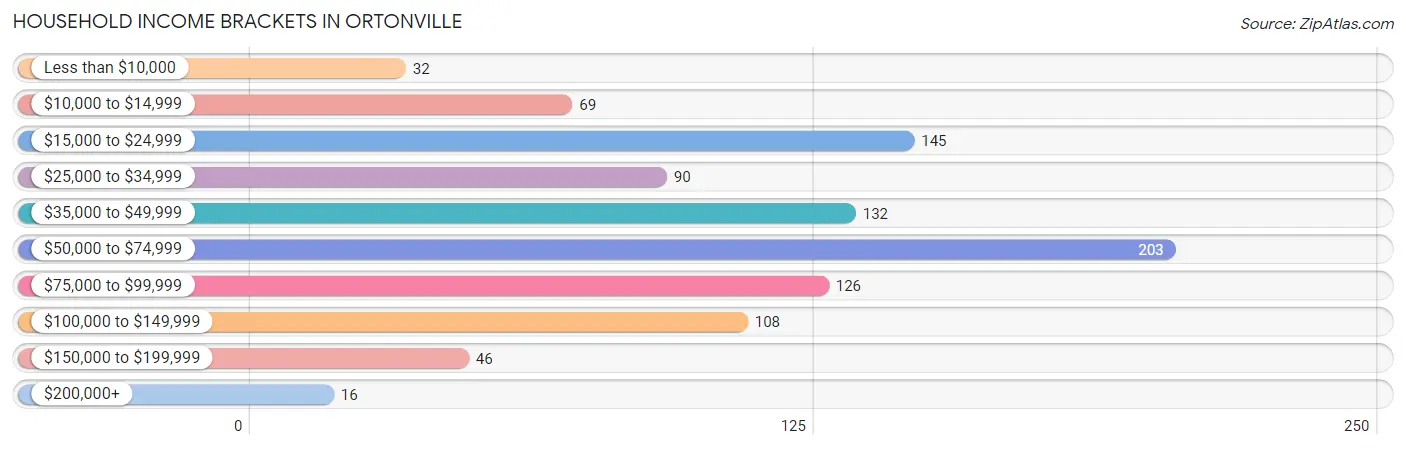
| Income Bracket | # Households | % Households |
| Less than $10,000 | 32 | 3.3% |
| $10,000 to $14,999 | 69 | 7.1% |
| $15,000 to $24,999 | 145 | 15.0% |
| $25,000 to $34,999 | 90 | 9.3% |
| $35,000 to $49,999 | 132 | 13.7% |
| $50,000 to $74,999 | 203 | 21.0% |
| $75,000 to $99,999 | 126 | 13.0% |
| $100,000 to $149,999 | 108 | 11.2% |
| $150,000 to $199,999 | 46 | 4.8% |
| $200,000+ | 16 | 1.7% |
Household Income by Householder Age in Ortonville
The median household income in Ortonville is $53,516, with the highest median household income of $88,333 found in the 15 to 24 years age bracket for the primary householder. A total of 58 households (6.0%) fall into this category. Meanwhile, the 65+ years age bracket for the primary householder has the lowest median household income of $32,604, with 367 households (38.0%) in this group.
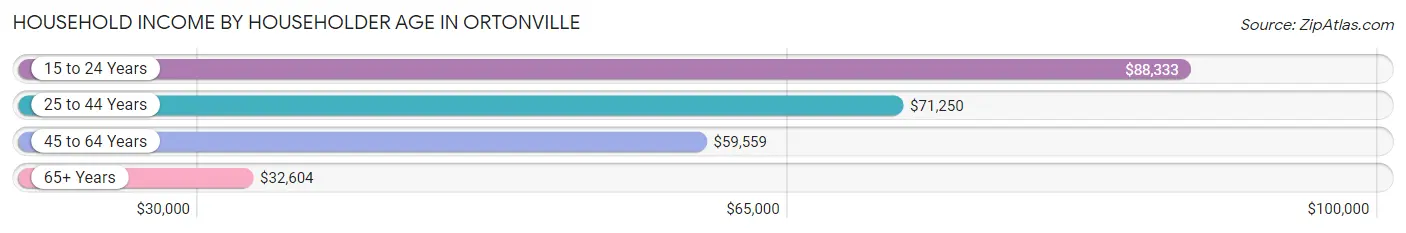
| Income Bracket | # Households | Median Income |
| 15 to 24 Years | 58 (6.0%) | $88,333 |
| 25 to 44 Years | 254 (26.3%) | $71,250 |
| 45 to 64 Years | 288 (29.8%) | $59,559 |
| 65+ Years | 367 (38.0%) | $32,604 |
| Total | 967 (100.0%) | $53,516 |
Poverty in Ortonville
Income Below Poverty by Sex and Age in Ortonville
With 7.7% poverty level for males and 6.4% for females among the residents of Ortonville, 45 to 54 year old males and 18 to 24 year old females are the most vulnerable to poverty, with 25 males (20.3%) and 14 females (26.4%) in their respective age groups living below the poverty level.
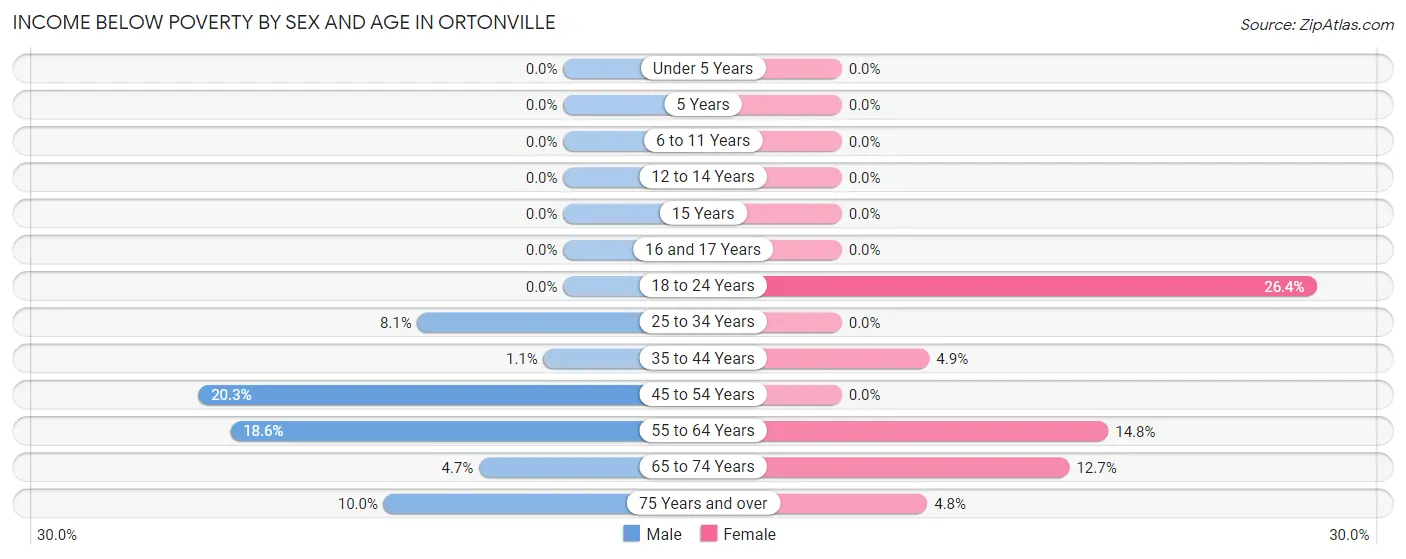
| Age Bracket | Male | Female |
| Under 5 Years | 0 (0.0%) | 0 (0.0%) |
| 5 Years | 0 (0.0%) | 0 (0.0%) |
| 6 to 11 Years | 0 (0.0%) | 0 (0.0%) |
| 12 to 14 Years | 0 (0.0%) | 0 (0.0%) |
| 15 Years | 0 (0.0%) | 0 (0.0%) |
| 16 and 17 Years | 0 (0.0%) | 0 (0.0%) |
| 18 to 24 Years | 0 (0.0%) | 14 (26.4%) |
| 25 to 34 Years | 13 (8.1%) | 0 (0.0%) |
| 35 to 44 Years | 1 (1.1%) | 6 (4.9%) |
| 45 to 54 Years | 25 (20.3%) | 0 (0.0%) |
| 55 to 64 Years | 23 (18.5%) | 19 (14.8%) |
| 65 to 74 Years | 6 (4.7%) | 18 (12.7%) |
| 75 Years and over | 10 (10.0%) | 6 (4.8%) |
| Total | 78 (7.7%) | 63 (6.4%) |
Income Above Poverty by Sex and Age in Ortonville
According to the poverty statistics in Ortonville, males aged under 5 years and females aged under 5 years are the age groups that are most secure financially, with 100.0% of males and 100.0% of females in these age groups living above the poverty line.
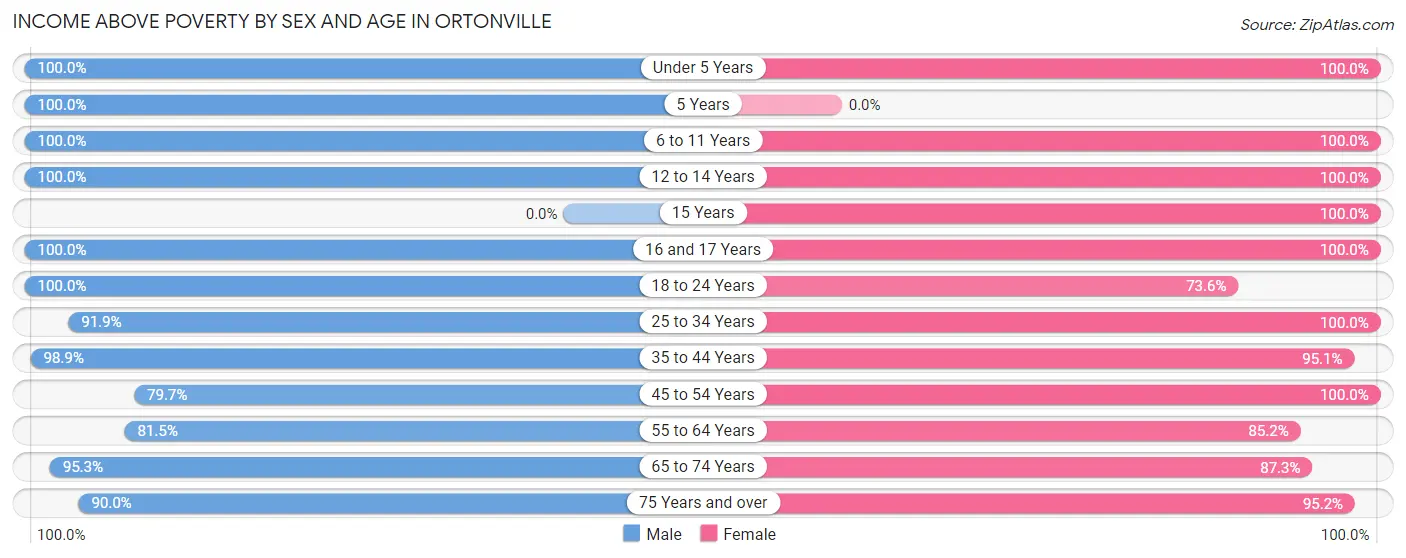
| Age Bracket | Male | Female |
| Under 5 Years | 67 (100.0%) | 42 (100.0%) |
| 5 Years | 11 (100.0%) | 0 (0.0%) |
| 6 to 11 Years | 91 (100.0%) | 80 (100.0%) |
| 12 to 14 Years | 30 (100.0%) | 25 (100.0%) |
| 15 Years | 0 (0.0%) | 7 (100.0%) |
| 16 and 17 Years | 9 (100.0%) | 22 (100.0%) |
| 18 to 24 Years | 81 (100.0%) | 39 (73.6%) |
| 25 to 34 Years | 147 (91.9%) | 118 (100.0%) |
| 35 to 44 Years | 90 (98.9%) | 117 (95.1%) |
| 45 to 54 Years | 98 (79.7%) | 113 (100.0%) |
| 55 to 64 Years | 101 (81.5%) | 109 (85.2%) |
| 65 to 74 Years | 122 (95.3%) | 124 (87.3%) |
| 75 Years and over | 90 (90.0%) | 120 (95.2%) |
| Total | 937 (92.3%) | 916 (93.6%) |
Income Below Poverty Among Married-Couple Families in Ortonville
The poverty statistics for married-couple families in Ortonville show that 5.2% or 24 of the total 463 families live below the poverty line. Families with no children have the highest poverty rate of 7.5%, comprising of 24 families. On the other hand, families with 1 or 2 children have the lowest poverty rate of 0.0%, which includes 0 families.
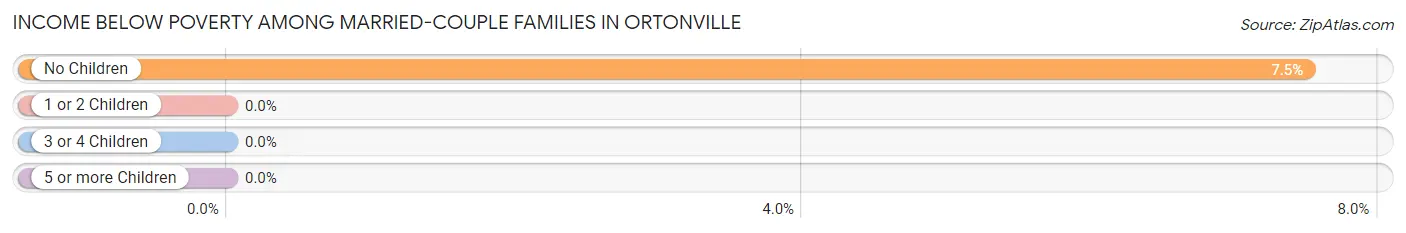
| Children | Above Poverty | Below Poverty |
| No Children | 296 (92.5%) | 24 (7.5%) |
| 1 or 2 Children | 108 (100.0%) | 0 (0.0%) |
| 3 or 4 Children | 35 (100.0%) | 0 (0.0%) |
| 5 or more Children | 0 (0.0%) | 0 (0.0%) |
| Total | 439 (94.8%) | 24 (5.2%) |
Income Below Poverty Among Single-Parent Households in Ortonville
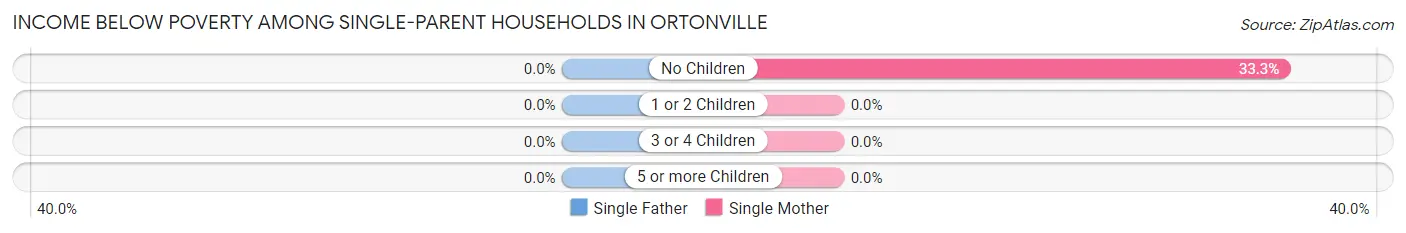
| Children | Single Father | Single Mother |
| No Children | 0 (0.0%) | 3 (33.3%) |
| 1 or 2 Children | 0 (0.0%) | 0 (0.0%) |
| 3 or 4 Children | 0 (0.0%) | 0 (0.0%) |
| 5 or more Children | 0 (0.0%) | 0 (0.0%) |
| Total | 0 (0.0%) | 3 (9.7%) |
Income Below Poverty Among Married-Couple vs Single-Parent Households in Ortonville
The poverty data for Ortonville shows that 24 of the married-couple family households (5.2%) and 3 of the single-parent households (8.1%) are living below the poverty level. Within the married-couple family households, those with no children have the highest poverty rate, with 24 households (7.5%) falling below the poverty line. Among the single-parent households, those with no children have the highest poverty rate, with 3 household (33.3%) living below poverty.
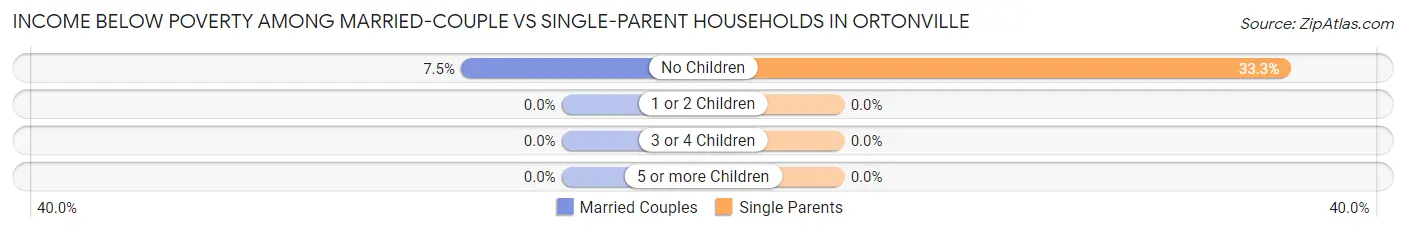
| Children | Married-Couple Families | Single-Parent Households |
| No Children | 24 (7.5%) | 3 (33.3%) |
| 1 or 2 Children | 0 (0.0%) | 0 (0.0%) |
| 3 or 4 Children | 0 (0.0%) | 0 (0.0%) |
| 5 or more Children | 0 (0.0%) | 0 (0.0%) |
| Total | 24 (5.2%) | 3 (8.1%) |
Race in Ortonville
The most populous races in Ortonville are White / Caucasian (1,996 | 95.9%), Two or more Races (53 | 2.5%), and Hispanic or Latino (26 | 1.3%).
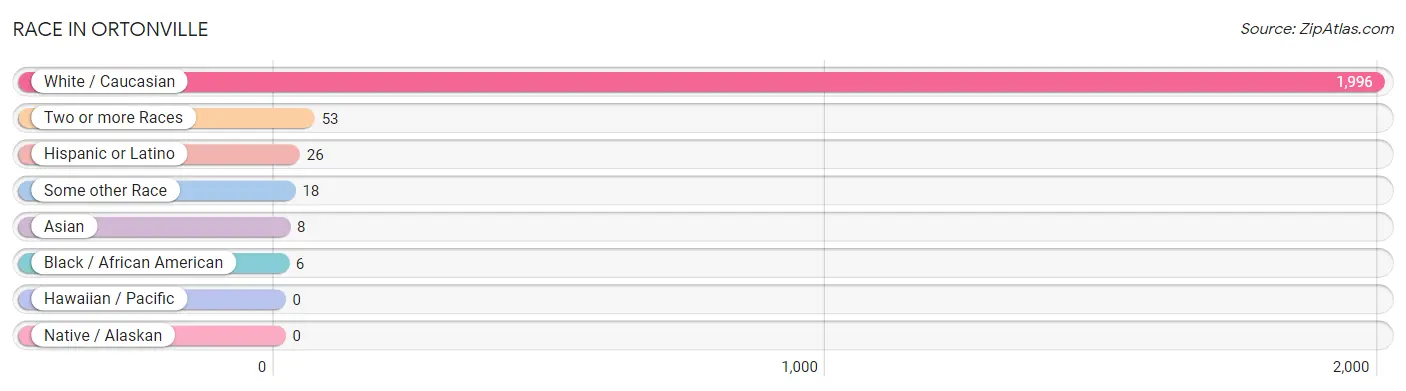
| Race | # Population | % Population |
| Asian | 8 | 0.4% |
| Black / African American | 6 | 0.3% |
| Hawaiian / Pacific | 0 | 0.0% |
| Hispanic or Latino | 26 | 1.3% |
| Native / Alaskan | 0 | 0.0% |
| White / Caucasian | 1,996 | 95.9% |
| Two or more Races | 53 | 2.5% |
| Some other Race | 18 | 0.9% |
| Total | 2,081 | 100.0% |
Ancestry in Ortonville
The most populous ancestries reported in Ortonville are German (1,043 | 50.1%), Norwegian (487 | 23.4%), Irish (277 | 13.3%), Swedish (233 | 11.2%), and English (105 | 5.1%), together accounting for 103.1% of all Ortonville residents.
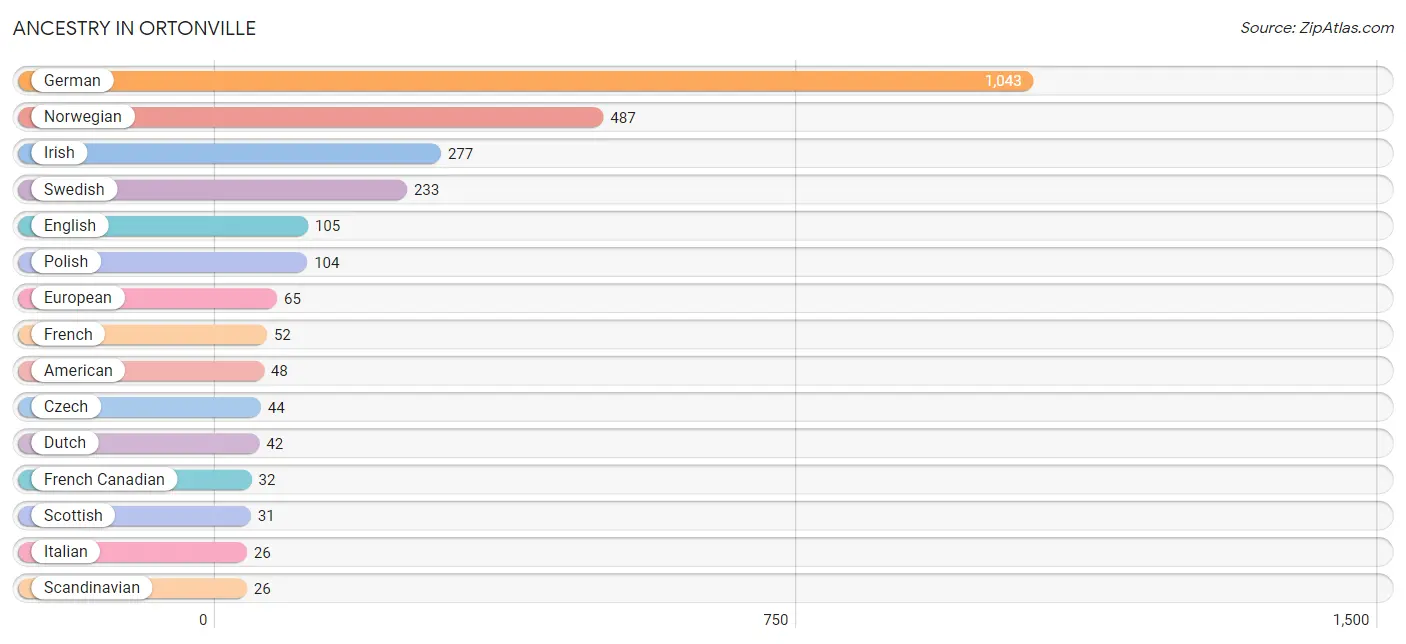
| Ancestry | # Population | % Population |
| American | 48 | 2.3% |
| Austrian | 21 | 1.0% |
| Belgian | 3 | 0.1% |
| Cuban | 8 | 0.4% |
| Czech | 44 | 2.1% |
| Danish | 14 | 0.7% |
| Dutch | 42 | 2.0% |
| English | 105 | 5.1% |
| European | 65 | 3.1% |
| Finnish | 9 | 0.4% |
| French | 52 | 2.5% |
| French Canadian | 32 | 1.5% |
| German | 1,043 | 50.1% |
| Hungarian | 7 | 0.3% |
| Irish | 277 | 13.3% |
| Italian | 26 | 1.3% |
| Mexican | 18 | 0.9% |
| Norwegian | 487 | 23.4% |
| Polish | 104 | 5.0% |
| Russian | 6 | 0.3% |
| Scandinavian | 26 | 1.3% |
| Scotch-Irish | 2 | 0.1% |
| Scottish | 31 | 1.5% |
| Swedish | 233 | 11.2% |
| Thai | 8 | 0.4% |
| Welsh | 12 | 0.6% |
| Yugoslavian | 5 | 0.2% | View All 27 Rows |
Immigrants in Ortonville
The most numerous immigrant groups reported in Ortonville came from Central America (18 | 0.9%), Latin America (18 | 0.9%), Mexico (18 | 0.9%), Canada (9 | 0.4%), and Asia (8 | 0.4%), together accounting for 3.4% of all Ortonville residents.
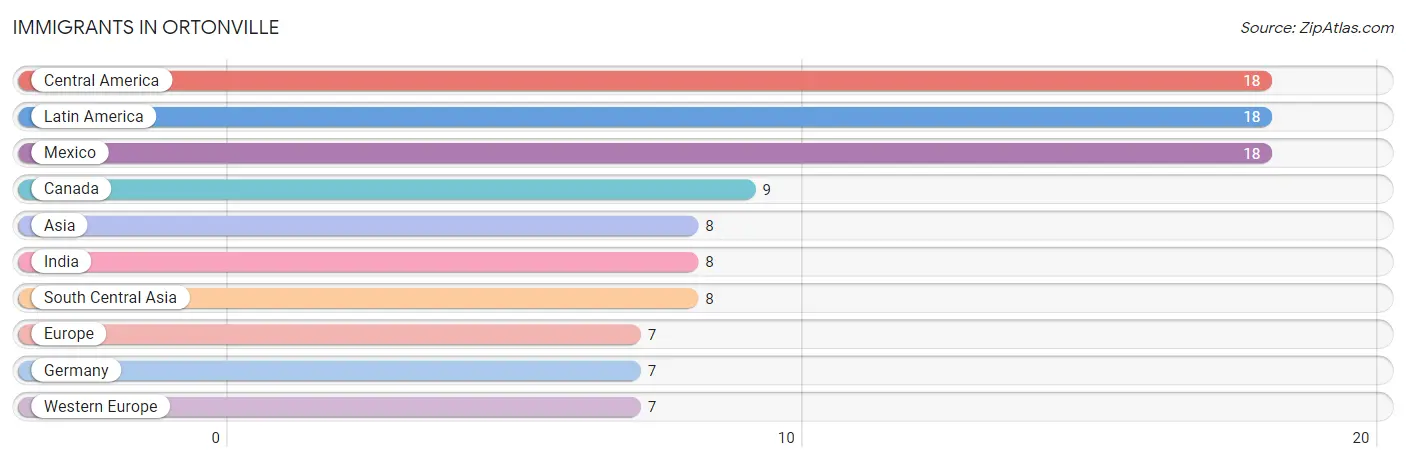
| Immigration Origin | # Population | % Population |
| Asia | 8 | 0.4% |
| Canada | 9 | 0.4% |
| Central America | 18 | 0.9% |
| Europe | 7 | 0.3% |
| Germany | 7 | 0.3% |
| India | 8 | 0.4% |
| Latin America | 18 | 0.9% |
| Mexico | 18 | 0.9% |
| South Central Asia | 8 | 0.4% |
| Western Europe | 7 | 0.3% | View All 10 Rows |
Sex and Age in Ortonville
Sex and Age in Ortonville
The most populous age groups in Ortonville are 5 to 9 Years (86 | 8.3%) for men and 85 Years and over (116 | 11.1%) for women.
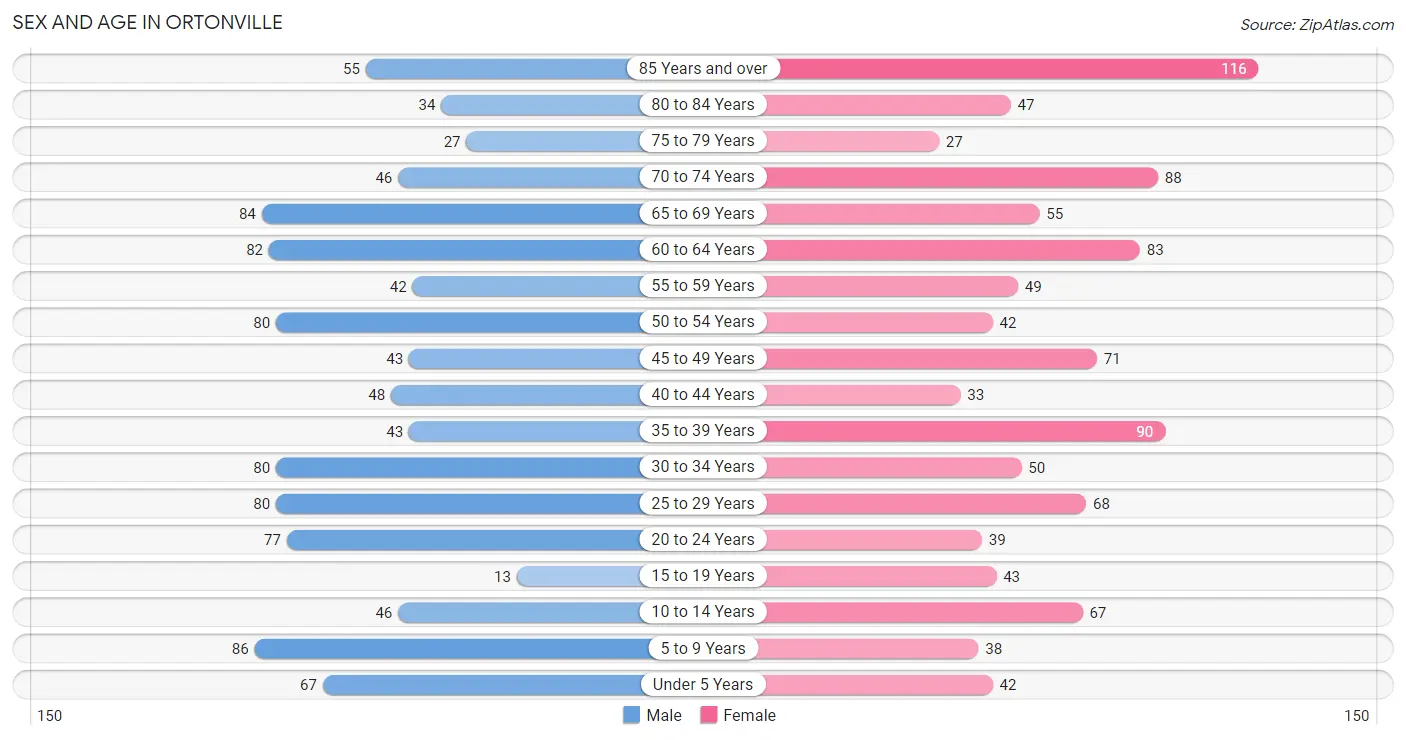
| Age Bracket | Male | Female |
| Under 5 Years | 67 (6.5%) | 42 (4.0%) |
| 5 to 9 Years | 86 (8.3%) | 38 (3.6%) |
| 10 to 14 Years | 46 (4.4%) | 67 (6.4%) |
| 15 to 19 Years | 13 (1.3%) | 43 (4.1%) |
| 20 to 24 Years | 77 (7.4%) | 39 (3.7%) |
| 25 to 29 Years | 80 (7.7%) | 68 (6.5%) |
| 30 to 34 Years | 80 (7.7%) | 50 (4.8%) |
| 35 to 39 Years | 43 (4.2%) | 90 (8.6%) |
| 40 to 44 Years | 48 (4.6%) | 33 (3.2%) |
| 45 to 49 Years | 43 (4.2%) | 71 (6.8%) |
| 50 to 54 Years | 80 (7.7%) | 42 (4.0%) |
| 55 to 59 Years | 42 (4.1%) | 49 (4.7%) |
| 60 to 64 Years | 82 (7.9%) | 83 (7.9%) |
| 65 to 69 Years | 84 (8.1%) | 55 (5.2%) |
| 70 to 74 Years | 46 (4.4%) | 88 (8.4%) |
| 75 to 79 Years | 27 (2.6%) | 27 (2.6%) |
| 80 to 84 Years | 34 (3.3%) | 47 (4.5%) |
| 85 Years and over | 55 (5.3%) | 116 (11.1%) |
| Total | 1,033 (100.0%) | 1,048 (100.0%) |
Families and Households in Ortonville
Median Family Size in Ortonville
The median family size in Ortonville is 2.84 persons per family, with married-couple families (463 | 92.6%) accounting for the largest median family size of 2.9 persons per family. On the other hand, single female/mother families (31 | 6.2%) represent the smallest median family size with 1.90 persons per family.
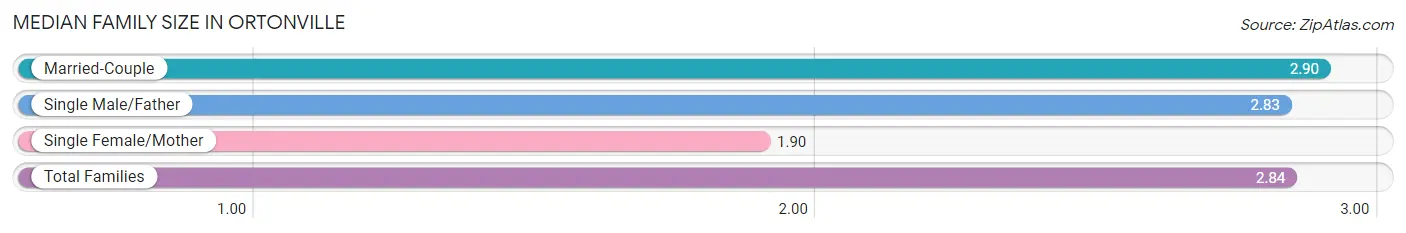
| Family Type | # Families | Family Size |
| Married-Couple | 463 (92.6%) | 2.90 |
| Single Male/Father | 6 (1.2%) | 2.83 |
| Single Female/Mother | 31 (6.2%) | 1.90 |
| Total Families | 500 (100.0%) | 2.84 |
Median Household Size in Ortonville
The median household size in Ortonville is 2.04 persons per household, with married-couple households (463 | 47.9%) accounting for the largest median household size of 2.9 persons per household. non-family households (467 | 48.3%) represent the smallest median household size with 1.11 persons per household.
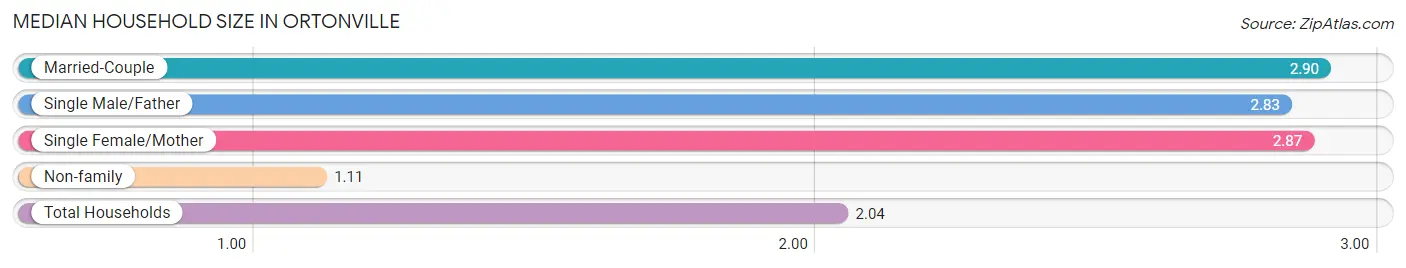
| Household Type | # Households | Household Size |
| Married-Couple | 463 (47.9%) | 2.90 |
| Single Male/Father | 6 (0.6%) | 2.83 |
| Single Female/Mother | 31 (3.2%) | 2.87 |
| Non-family | 467 (48.3%) | 1.11 |
| Total Households | 967 (100.0%) | 2.04 |
Household Size by Marriage Status in Ortonville
Out of a total of 967 households in Ortonville, 500 (51.7%) are family households, while 467 (48.3%) are nonfamily households. The most numerous type of family households are 2-person households, comprising 263, and the most common type of nonfamily households are 1-person households, comprising 416.
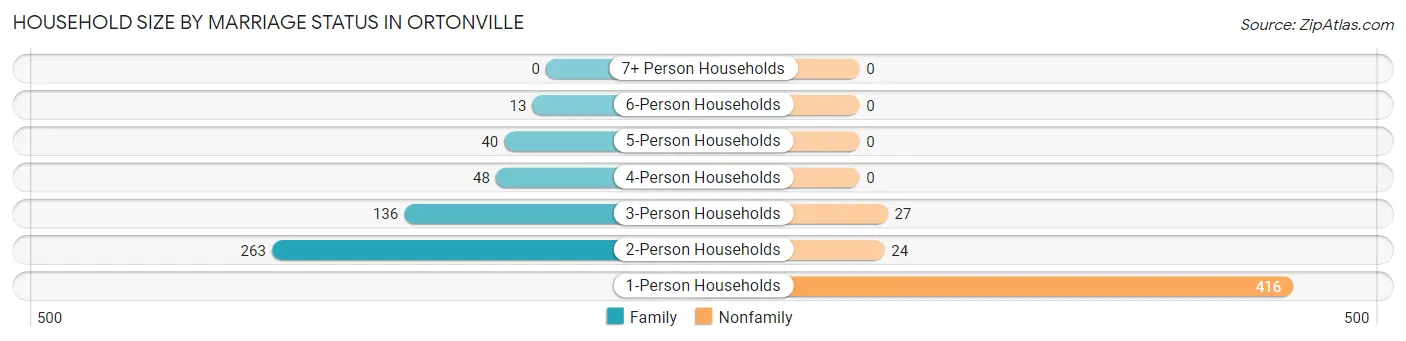
| Household Size | Family Households | Nonfamily Households |
| 1-Person Households | - | 416 (43.0%) |
| 2-Person Households | 263 (27.2%) | 24 (2.5%) |
| 3-Person Households | 136 (14.1%) | 27 (2.8%) |
| 4-Person Households | 48 (5.0%) | 0 (0.0%) |
| 5-Person Households | 40 (4.1%) | 0 (0.0%) |
| 6-Person Households | 13 (1.3%) | 0 (0.0%) |
| 7+ Person Households | 0 (0.0%) | 0 (0.0%) |
| Total | 500 (51.7%) | 467 (48.3%) |
Female Fertility in Ortonville
Fertility by Age in Ortonville
Average fertility rate in Ortonville is 90.0 births per 1,000 women. Women in the age bracket of 20 to 34 years have the highest fertility rate with 140.0 births per 1,000 women. Women in the age bracket of 20 to 34 years acount for 59.5% of all women with births.
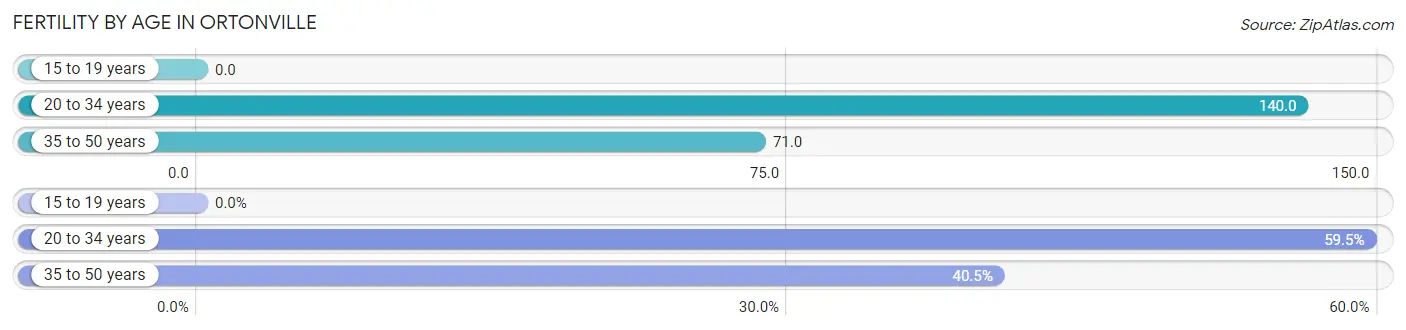
| Age Bracket | Women with Births | Births / 1,000 Women |
| 15 to 19 years | 0 (0.0%) | 0.0 |
| 20 to 34 years | 22 (59.5%) | 140.0 |
| 35 to 50 years | 15 (40.5%) | 71.0 |
| Total | 37 (100.0%) | 90.0 |
Fertility by Age by Marriage Status in Ortonville
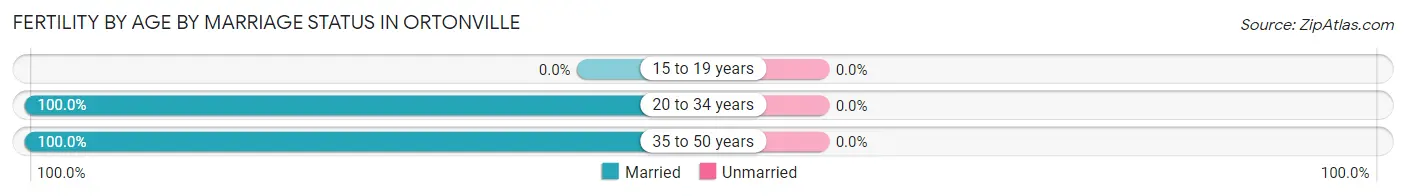
| Age Bracket | Married | Unmarried |
| 15 to 19 years | 0 (0.0%) | 0 (0.0%) |
| 20 to 34 years | 22 (100.0%) | 0 (0.0%) |
| 35 to 50 years | 15 (100.0%) | 0 (0.0%) |
| Total | 37 (100.0%) | 0 (0.0%) |
Fertility by Education in Ortonville
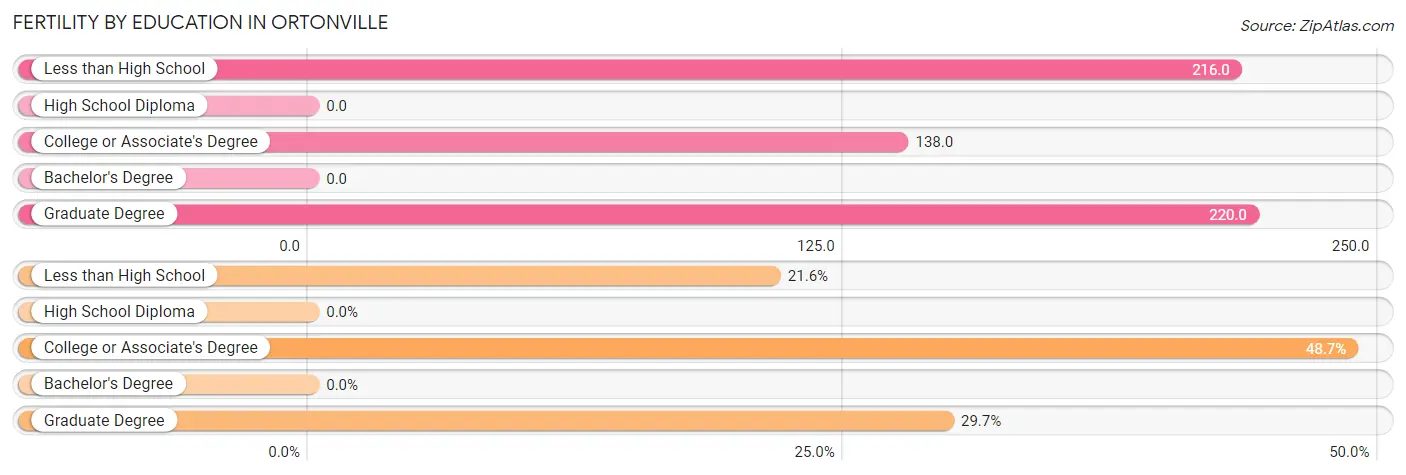
| Educational Attainment | Women with Births | Births / 1,000 Women |
| Less than High School | 8 (21.6%) | 216.0 |
| High School Diploma | 0 (0.0%) | 0.0 |
| College or Associate's Degree | 18 (48.6%) | 138.0 |
| Bachelor's Degree | 0 (0.0%) | 0.0 |
| Graduate Degree | 11 (29.7%) | 220.0 |
| Total | 37 (100.0%) | 90.0 |
Fertility by Education by Marriage Status in Ortonville
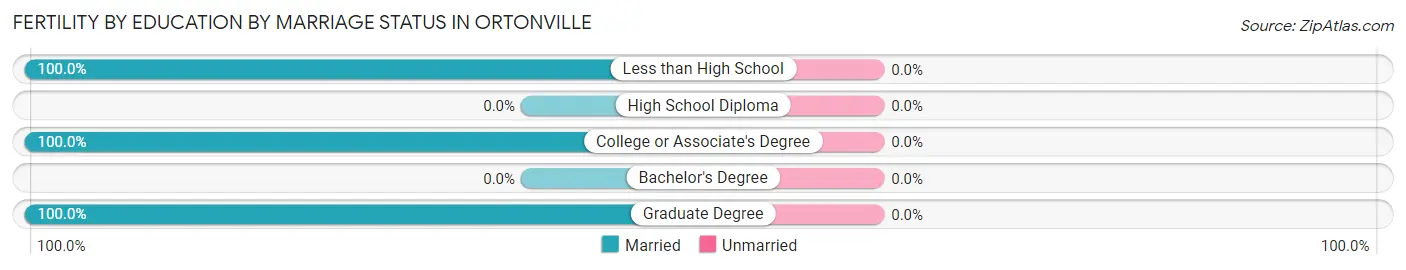
| Educational Attainment | Married | Unmarried |
| Less than High School | 8 (100.0%) | 0 (0.0%) |
| High School Diploma | 0 (0.0%) | 0 (0.0%) |
| College or Associate's Degree | 18 (100.0%) | 0 (0.0%) |
| Bachelor's Degree | 0 (0.0%) | 0 (0.0%) |
| Graduate Degree | 11 (100.0%) | 0 (0.0%) |
| Total | 37 (100.0%) | 0 (0.0%) |
Employment Characteristics in Ortonville
Employment by Class of Employer in Ortonville
Among the 855 employed individuals in Ortonville, private company employees (598 | 69.9%), not-for-profit organizations (94 | 11.0%), and local government employees (75 | 8.8%) make up the most common classes of employment.
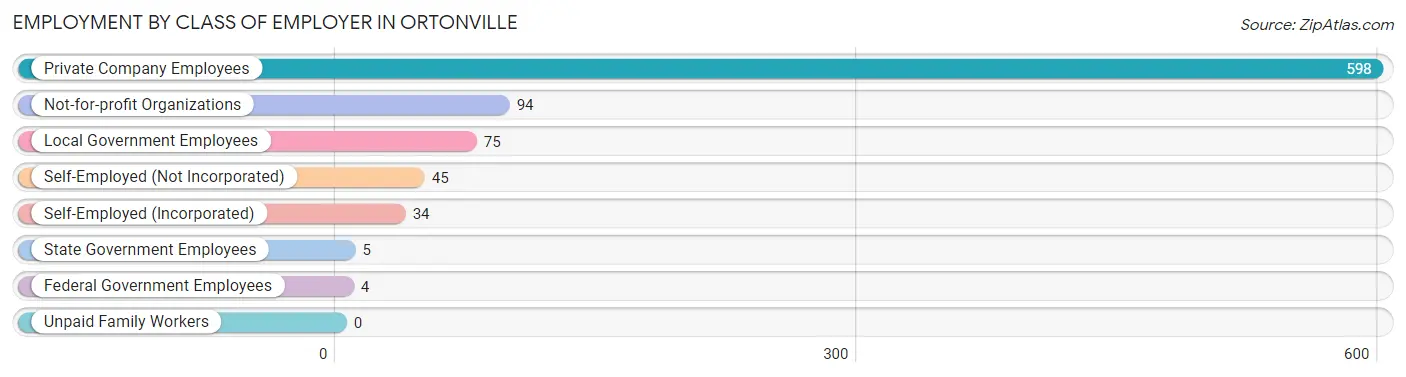
| Employer Class | # Employees | % Employees |
| Private Company Employees | 598 | 69.9% |
| Self-Employed (Incorporated) | 34 | 4.0% |
| Self-Employed (Not Incorporated) | 45 | 5.3% |
| Not-for-profit Organizations | 94 | 11.0% |
| Local Government Employees | 75 | 8.8% |
| State Government Employees | 5 | 0.6% |
| Federal Government Employees | 4 | 0.5% |
| Unpaid Family Workers | 0 | 0.0% |
| Total | 855 | 100.0% |
Employment Status by Age in Ortonville
According to the labor force statistics for Ortonville, out of the total population over 16 years of age (1,728), 53.6% or 926 individuals are in the labor force, with 2.7% or 25 of them unemployed. The age group with the highest labor force participation rate is 20 to 24 years, with 92.2% or 107 individuals in the labor force. Within the labor force, the 25 to 29 years age range has the highest percentage of unemployed individuals, with 7.6% or 10 of them being unemployed.
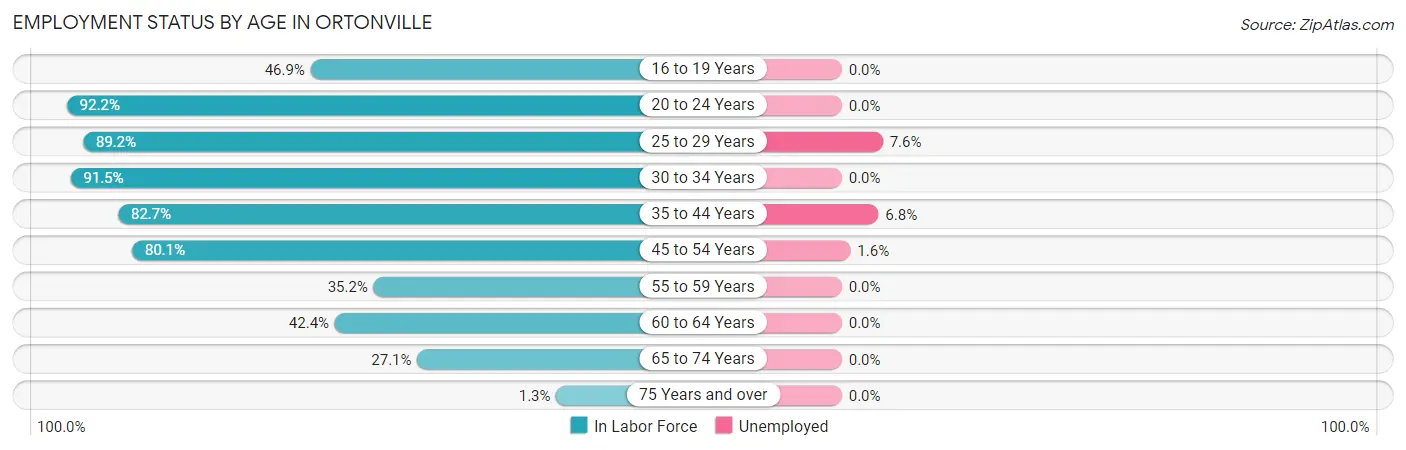
| Age Bracket | In Labor Force | Unemployed |
| 16 to 19 Years | 23 (46.9%) | 0 (0.0%) |
| 20 to 24 Years | 107 (92.2%) | 0 (0.0%) |
| 25 to 29 Years | 132 (89.2%) | 10 (7.6%) |
| 30 to 34 Years | 119 (91.5%) | 0 (0.0%) |
| 35 to 44 Years | 177 (82.7%) | 12 (6.8%) |
| 45 to 54 Years | 189 (80.1%) | 3 (1.6%) |
| 55 to 59 Years | 32 (35.2%) | 0 (0.0%) |
| 60 to 64 Years | 70 (42.4%) | 0 (0.0%) |
| 65 to 74 Years | 74 (27.1%) | 0 (0.0%) |
| 75 Years and over | 4 (1.3%) | 0 (0.0%) |
| Total | 926 (53.6%) | 25 (2.7%) |
Employment Status by Educational Attainment in Ortonville
According to labor force statistics for Ortonville, 73.1% of individuals (719) out of the total population between 25 and 64 years of age (984) are in the labor force, with 3.5% or 25 of them being unemployed. The group with the highest labor force participation rate are those with the educational attainment of bachelor's degree or higher, with 87.8% or 194 individuals in the labor force. Within the labor force, individuals with high school diploma education have the highest percentage of unemployment, with 7.2% or 11 of them being unemployed.
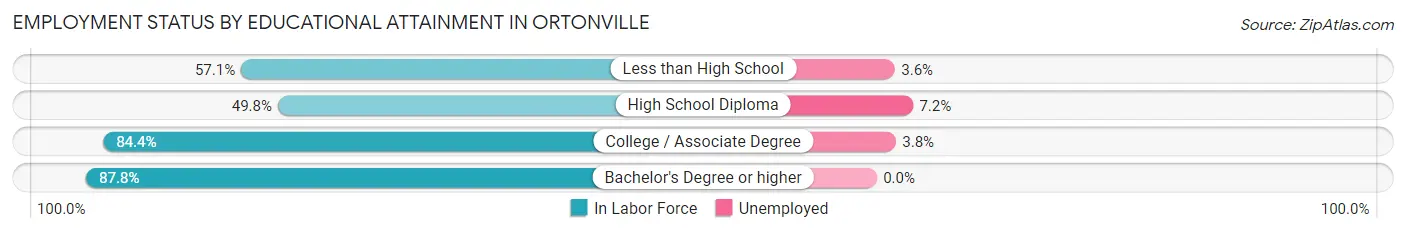
| Educational Attainment | In Labor Force | Unemployed |
| Less than High School | 28 (57.1%) | 2 (3.6%) |
| High School Diploma | 152 (49.8%) | 22 (7.2%) |
| College / Associate Degree | 345 (84.4%) | 16 (3.8%) |
| Bachelor's Degree or higher | 194 (87.8%) | 0 (0.0%) |
| Total | 719 (73.1%) | 34 (3.5%) |
Employment Occupations by Sex in Ortonville
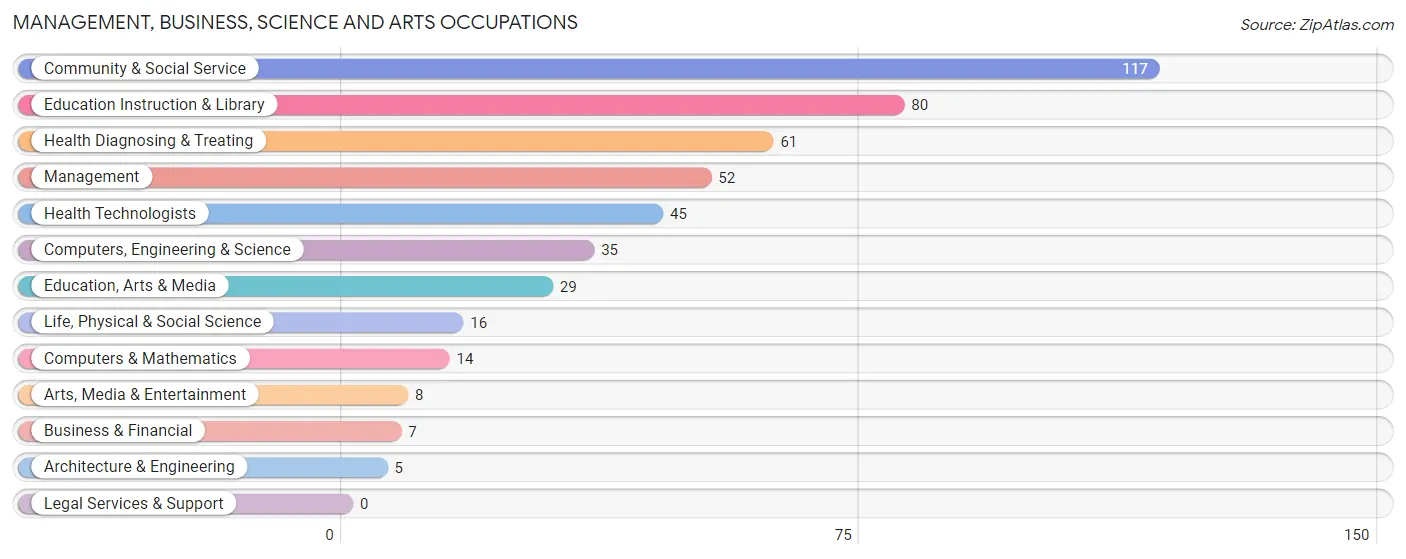
Management, Business, Science and Arts Occupations
The most common Management, Business, Science and Arts occupations in Ortonville are Community & Social Service (117 | 13.0%), Education Instruction & Library (80 | 8.9%), Health Diagnosing & Treating (61 | 6.8%), Management (52 | 5.8%), and Health Technologists (45 | 5.0%).
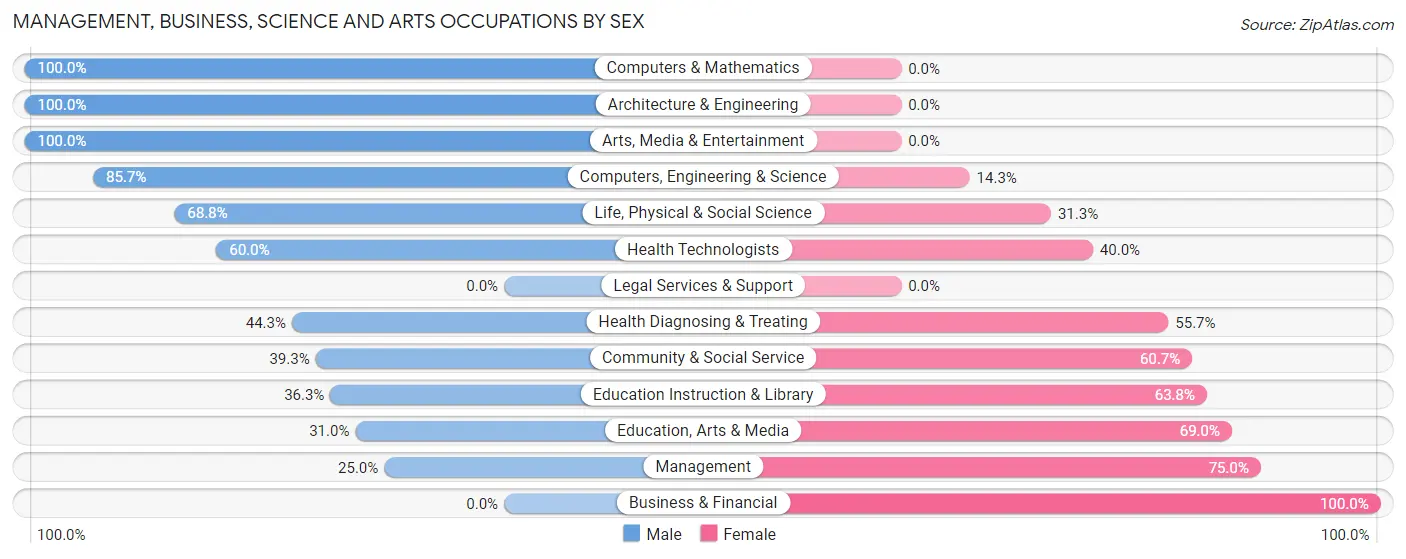
Management, Business, Science and Arts Occupations by Sex
Within the Management, Business, Science and Arts occupations in Ortonville, the most male-oriented occupations are Computers & Mathematics (100.0%), Architecture & Engineering (100.0%), and Arts, Media & Entertainment (100.0%), while the most female-oriented occupations are Business & Financial (100.0%), Management (75.0%), and Education, Arts & Media (69.0%).
| Occupation | Male | Female |
| Management | 13 (25.0%) | 39 (75.0%) |
| Business & Financial | 0 (0.0%) | 7 (100.0%) |
| Computers, Engineering & Science | 30 (85.7%) | 5 (14.3%) |
| Computers & Mathematics | 14 (100.0%) | 0 (0.0%) |
| Architecture & Engineering | 5 (100.0%) | 0 (0.0%) |
| Life, Physical & Social Science | 11 (68.8%) | 5 (31.2%) |
| Community & Social Service | 46 (39.3%) | 71 (60.7%) |
| Education, Arts & Media | 9 (31.0%) | 20 (69.0%) |
| Legal Services & Support | 0 (0.0%) | 0 (0.0%) |
| Education Instruction & Library | 29 (36.2%) | 51 (63.7%) |
| Arts, Media & Entertainment | 8 (100.0%) | 0 (0.0%) |
| Health Diagnosing & Treating | 27 (44.3%) | 34 (55.7%) |
| Health Technologists | 27 (60.0%) | 18 (40.0%) |
| Total (Category) | 116 (42.6%) | 156 (57.4%) |
| Total (Overall) | 484 (53.7%) | 418 (46.3%) |
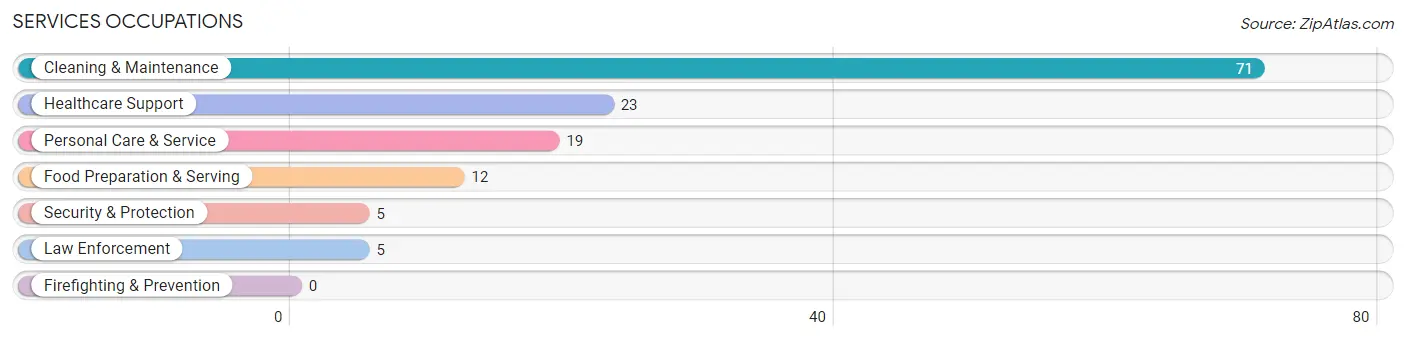
Services Occupations
The most common Services occupations in Ortonville are Cleaning & Maintenance (71 | 7.9%), Healthcare Support (23 | 2.5%), Personal Care & Service (19 | 2.1%), Food Preparation & Serving (12 | 1.3%), and Security & Protection (5 | 0.5%).
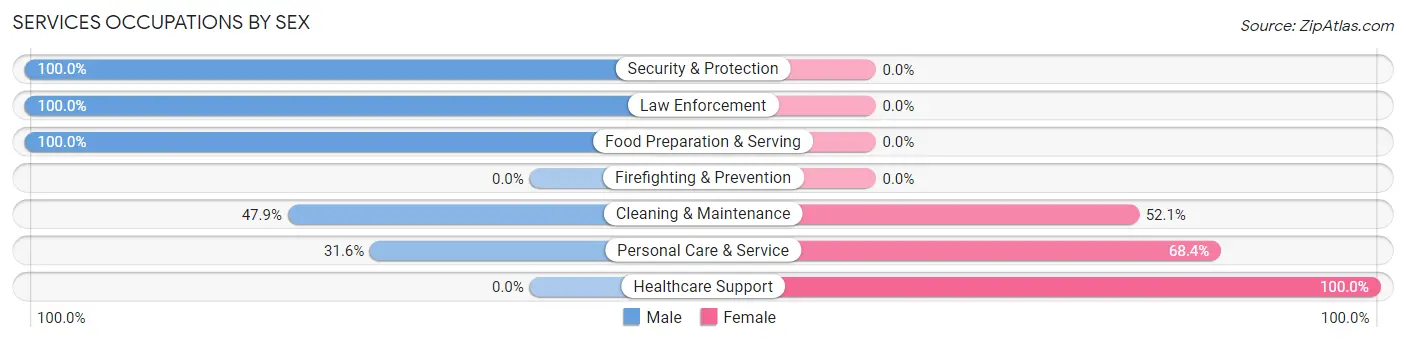
Services Occupations by Sex
Within the Services occupations in Ortonville, the most male-oriented occupations are Security & Protection (100.0%), Law Enforcement (100.0%), and Food Preparation & Serving (100.0%), while the most female-oriented occupations are Healthcare Support (100.0%), Personal Care & Service (68.4%), and Cleaning & Maintenance (52.1%).
| Occupation | Male | Female |
| Healthcare Support | 0 (0.0%) | 23 (100.0%) |
| Security & Protection | 5 (100.0%) | 0 (0.0%) |
| Firefighting & Prevention | 0 (0.0%) | 0 (0.0%) |
| Law Enforcement | 5 (100.0%) | 0 (0.0%) |
| Food Preparation & Serving | 12 (100.0%) | 0 (0.0%) |
| Cleaning & Maintenance | 34 (47.9%) | 37 (52.1%) |
| Personal Care & Service | 6 (31.6%) | 13 (68.4%) |
| Total (Category) | 57 (43.9%) | 73 (56.1%) |
| Total (Overall) | 484 (53.7%) | 418 (46.3%) |
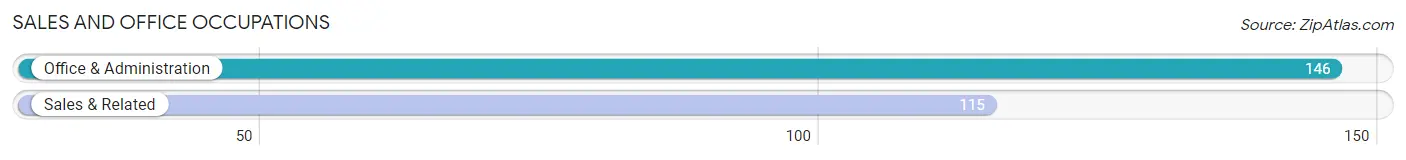
Sales and Office Occupations
The most common Sales and Office occupations in Ortonville are Office & Administration (146 | 16.2%), and Sales & Related (115 | 12.8%).
Sales and Office Occupations by Sex
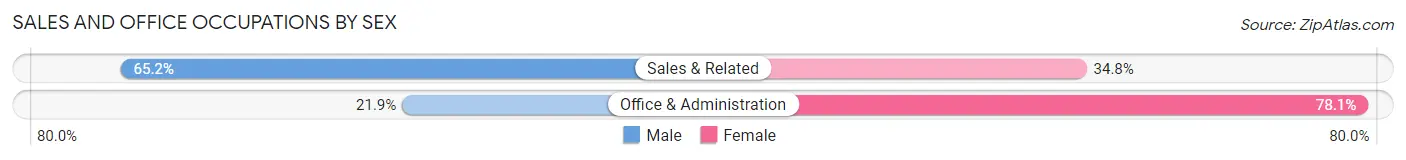
| Occupation | Male | Female |
| Sales & Related | 75 (65.2%) | 40 (34.8%) |
| Office & Administration | 32 (21.9%) | 114 (78.1%) |
| Total (Category) | 107 (41.0%) | 154 (59.0%) |
| Total (Overall) | 484 (53.7%) | 418 (46.3%) |
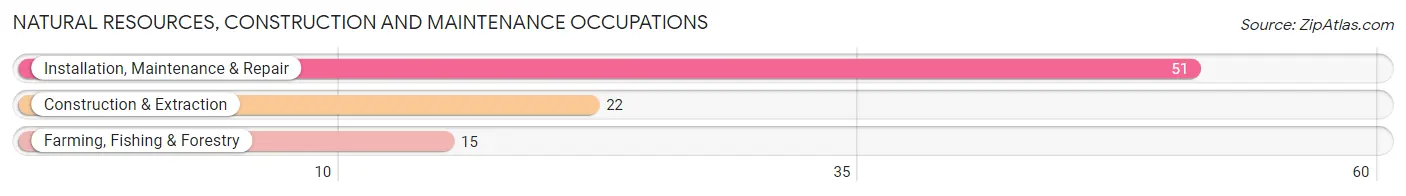
Natural Resources, Construction and Maintenance Occupations
The most common Natural Resources, Construction and Maintenance occupations in Ortonville are Installation, Maintenance & Repair (51 | 5.7%), Construction & Extraction (22 | 2.4%), and Farming, Fishing & Forestry (15 | 1.7%).
Natural Resources, Construction and Maintenance Occupations by Sex
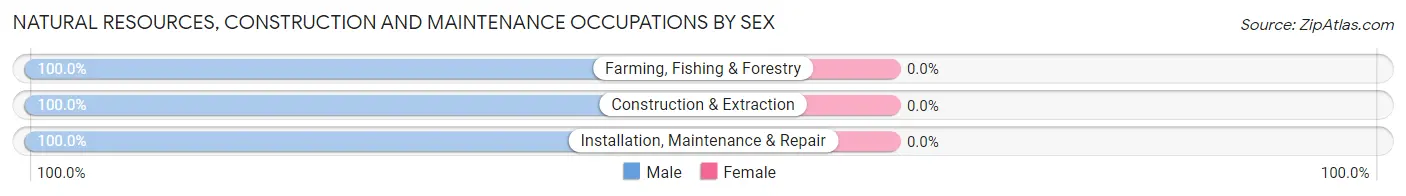
| Occupation | Male | Female |
| Farming, Fishing & Forestry | 15 (100.0%) | 0 (0.0%) |
| Construction & Extraction | 22 (100.0%) | 0 (0.0%) |
| Installation, Maintenance & Repair | 51 (100.0%) | 0 (0.0%) |
| Total (Category) | 88 (100.0%) | 0 (0.0%) |
| Total (Overall) | 484 (53.7%) | 418 (46.3%) |
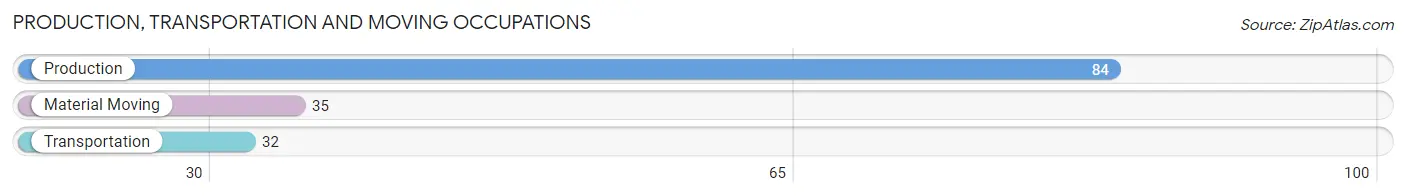
Production, Transportation and Moving Occupations
The most common Production, Transportation and Moving occupations in Ortonville are Production (84 | 9.3%), Material Moving (35 | 3.9%), and Transportation (32 | 3.5%).
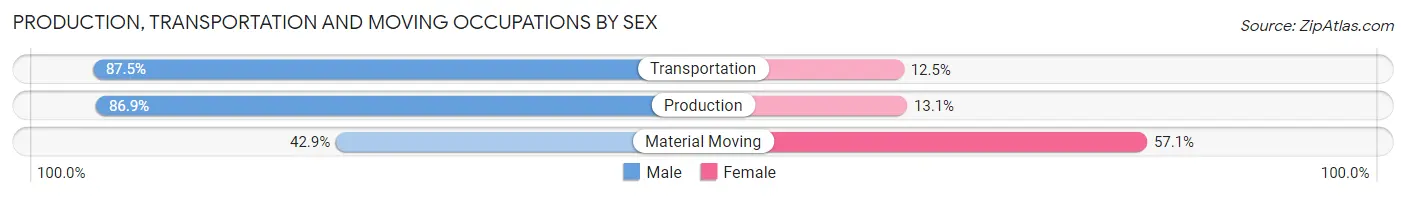
Production, Transportation and Moving Occupations by Sex
| Occupation | Male | Female |
| Production | 73 (86.9%) | 11 (13.1%) |
| Transportation | 28 (87.5%) | 4 (12.5%) |
| Material Moving | 15 (42.9%) | 20 (57.1%) |
| Total (Category) | 116 (76.8%) | 35 (23.2%) |
| Total (Overall) | 484 (53.7%) | 418 (46.3%) |
Employment Industries by Sex in Ortonville
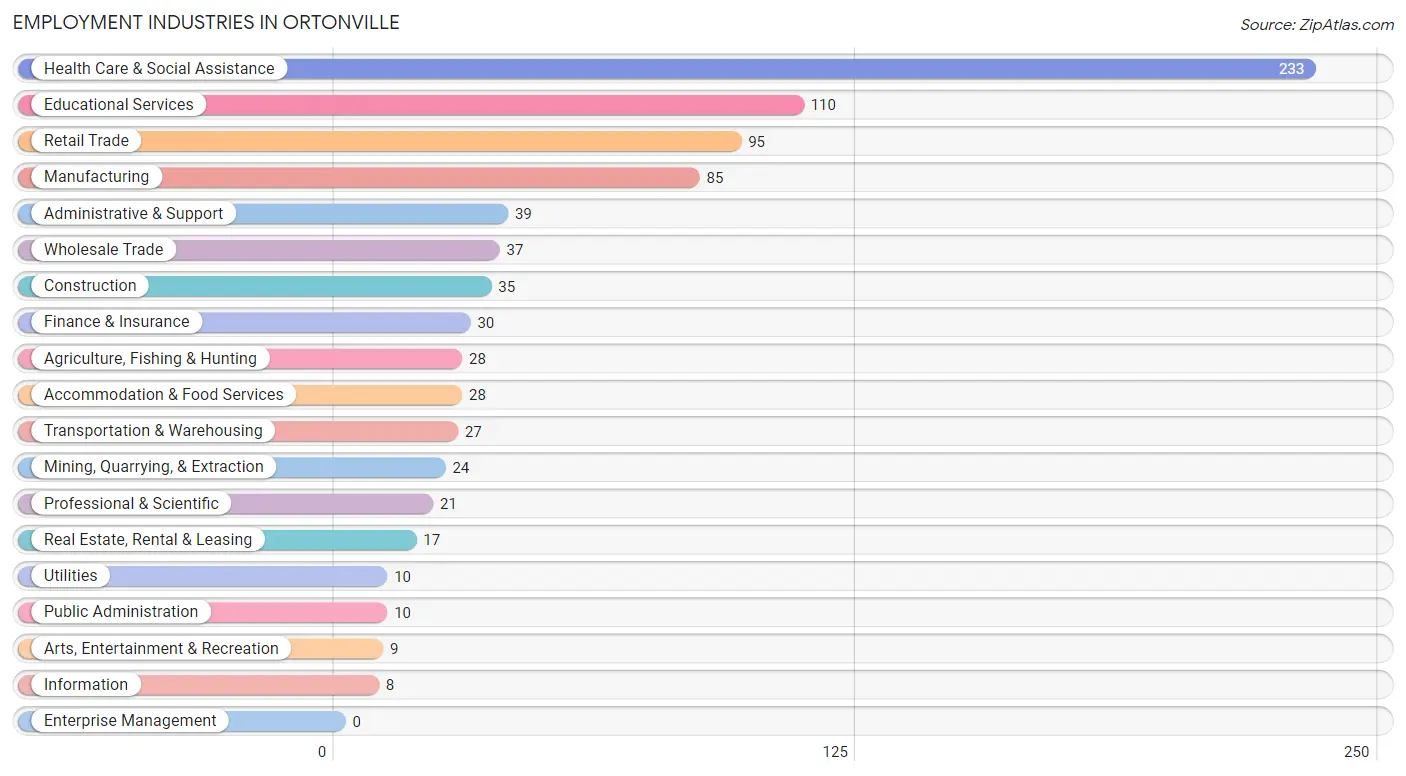
Employment Industries in Ortonville
The major employment industries in Ortonville include Health Care & Social Assistance (233 | 25.8%), Educational Services (110 | 12.2%), Retail Trade (95 | 10.5%), Manufacturing (85 | 9.4%), and Administrative & Support (39 | 4.3%).
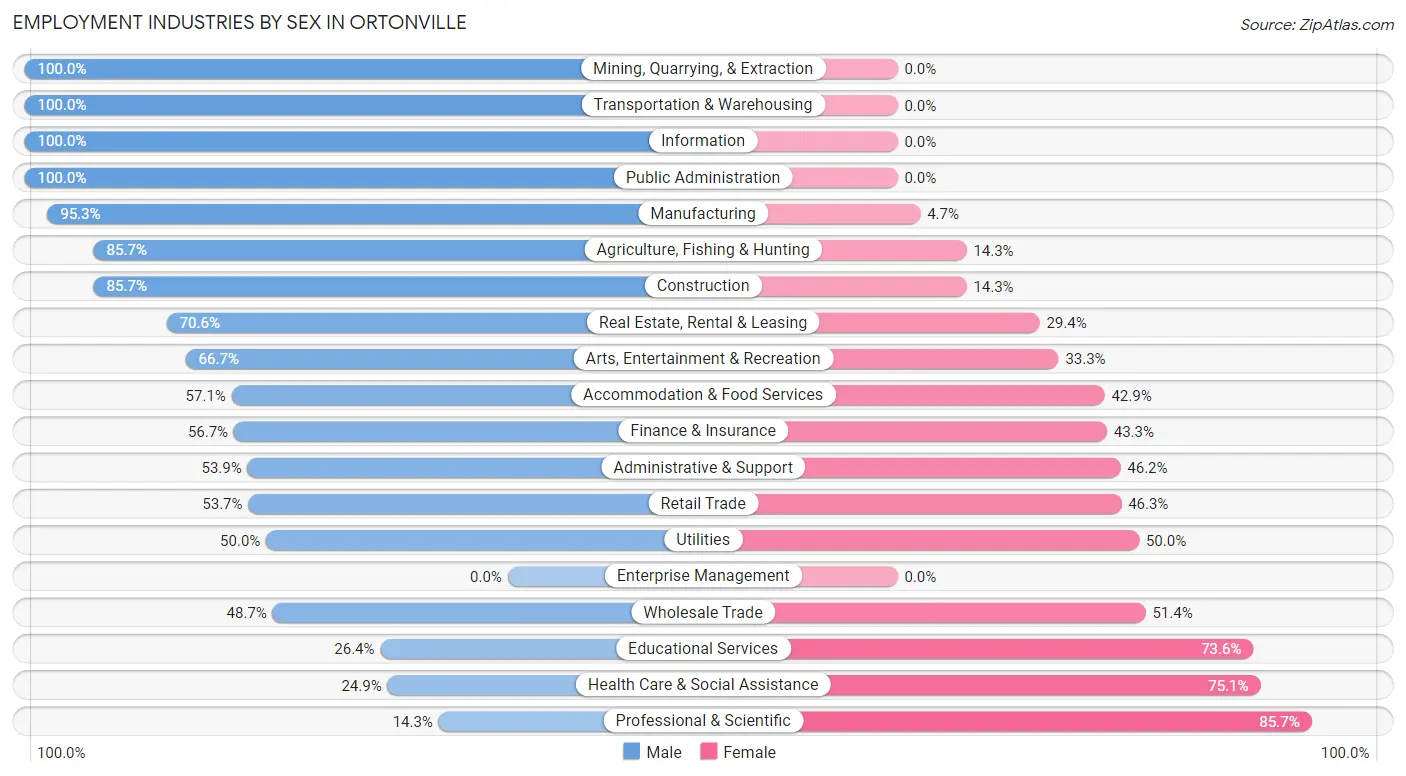
Employment Industries by Sex in Ortonville
The Ortonville industries that see more men than women are Mining, Quarrying, & Extraction (100.0%), Transportation & Warehousing (100.0%), and Information (100.0%), whereas the industries that tend to have a higher number of women are Professional & Scientific (85.7%), Health Care & Social Assistance (75.1%), and Educational Services (73.6%).
| Industry | Male | Female |
| Agriculture, Fishing & Hunting | 24 (85.7%) | 4 (14.3%) |
| Mining, Quarrying, & Extraction | 24 (100.0%) | 0 (0.0%) |
| Construction | 30 (85.7%) | 5 (14.3%) |
| Manufacturing | 81 (95.3%) | 4 (4.7%) |
| Wholesale Trade | 18 (48.6%) | 19 (51.3%) |
| Retail Trade | 51 (53.7%) | 44 (46.3%) |
| Transportation & Warehousing | 27 (100.0%) | 0 (0.0%) |
| Utilities | 5 (50.0%) | 5 (50.0%) |
| Information | 8 (100.0%) | 0 (0.0%) |
| Finance & Insurance | 17 (56.7%) | 13 (43.3%) |
| Real Estate, Rental & Leasing | 12 (70.6%) | 5 (29.4%) |
| Professional & Scientific | 3 (14.3%) | 18 (85.7%) |
| Enterprise Management | 0 (0.0%) | 0 (0.0%) |
| Administrative & Support | 21 (53.8%) | 18 (46.2%) |
| Educational Services | 29 (26.4%) | 81 (73.6%) |
| Health Care & Social Assistance | 58 (24.9%) | 175 (75.1%) |
| Arts, Entertainment & Recreation | 6 (66.7%) | 3 (33.3%) |
| Accommodation & Food Services | 16 (57.1%) | 12 (42.9%) |
| Public Administration | 10 (100.0%) | 0 (0.0%) |
| Total | 484 (53.7%) | 418 (46.3%) |
Education in Ortonville
School Enrollment in Ortonville
The most common levels of schooling among the 339 students in Ortonville are middle school (107 | 31.6%), elementary school (72 | 21.2%), and kindergarten (52 | 15.3%).
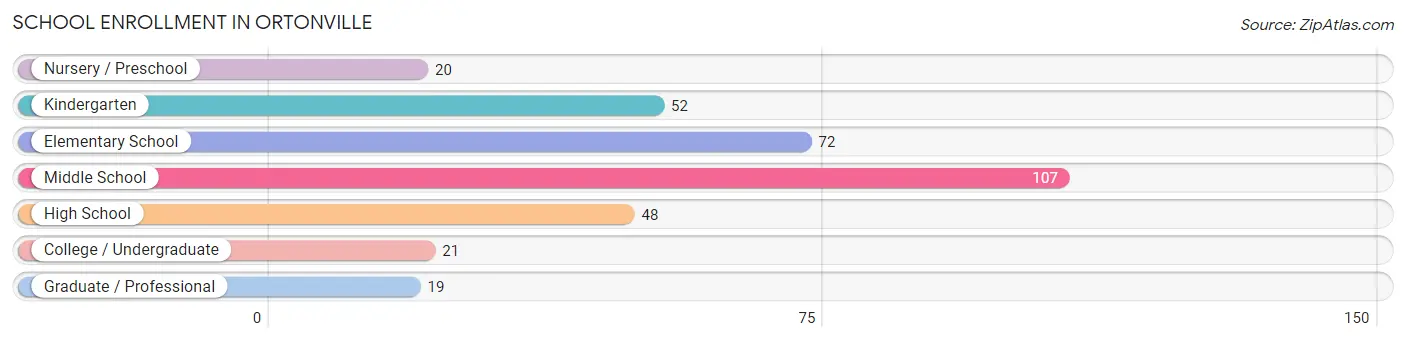
| School Level | # Students | % Students |
| Nursery / Preschool | 20 | 5.9% |
| Kindergarten | 52 | 15.3% |
| Elementary School | 72 | 21.2% |
| Middle School | 107 | 31.6% |
| High School | 48 | 14.2% |
| College / Undergraduate | 21 | 6.2% |
| Graduate / Professional | 19 | 5.6% |
| Total | 339 | 100.0% |
School Enrollment by Age by Funding Source in Ortonville
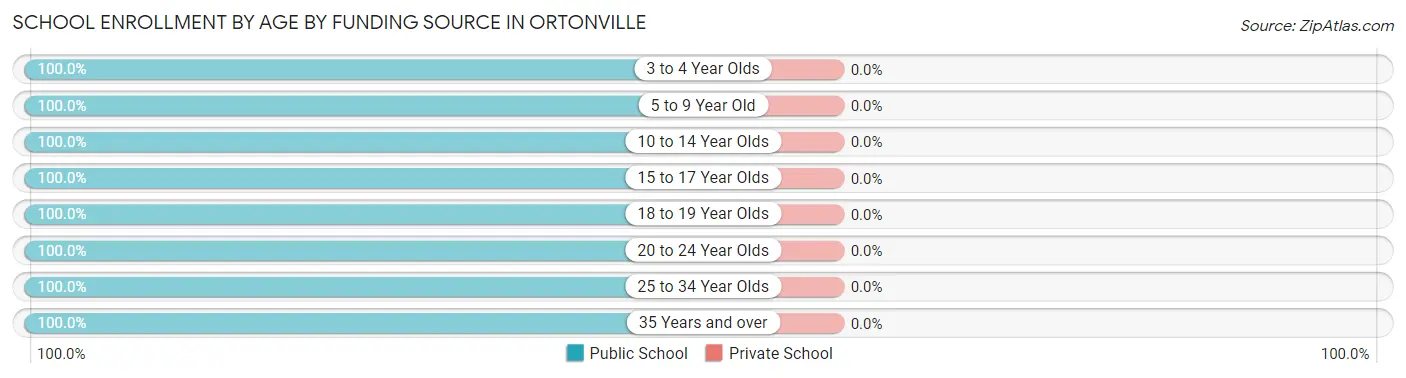
| Age Bracket | Public School | Private School |
| 3 to 4 Year Olds | 20 (100.0%) | 0 (0.0%) |
| 5 to 9 Year Old | 124 (100.0%) | 0 (0.0%) |
| 10 to 14 Year Olds | 113 (100.0%) | 0 (0.0%) |
| 15 to 17 Year Olds | 38 (100.0%) | 0 (0.0%) |
| 18 to 19 Year Olds | 4 (100.0%) | 0 (0.0%) |
| 20 to 24 Year Olds | 24 (100.0%) | 0 (0.0%) |
| 25 to 34 Year Olds | 6 (100.0%) | 0 (0.0%) |
| 35 Years and over | 10 (100.0%) | 0 (0.0%) |
| Total | 339 (100.0%) | 0 (0.0%) |
Educational Attainment by Field of Study in Ortonville
Education (72 | 22.6%), business (47 | 14.8%), bio, nature & agricultural (46 | 14.5%), psychology (37 | 11.6%), and literature & languages (32 | 10.1%) are the most common fields of study among 318 individuals in Ortonville who have obtained a bachelor's degree or higher.
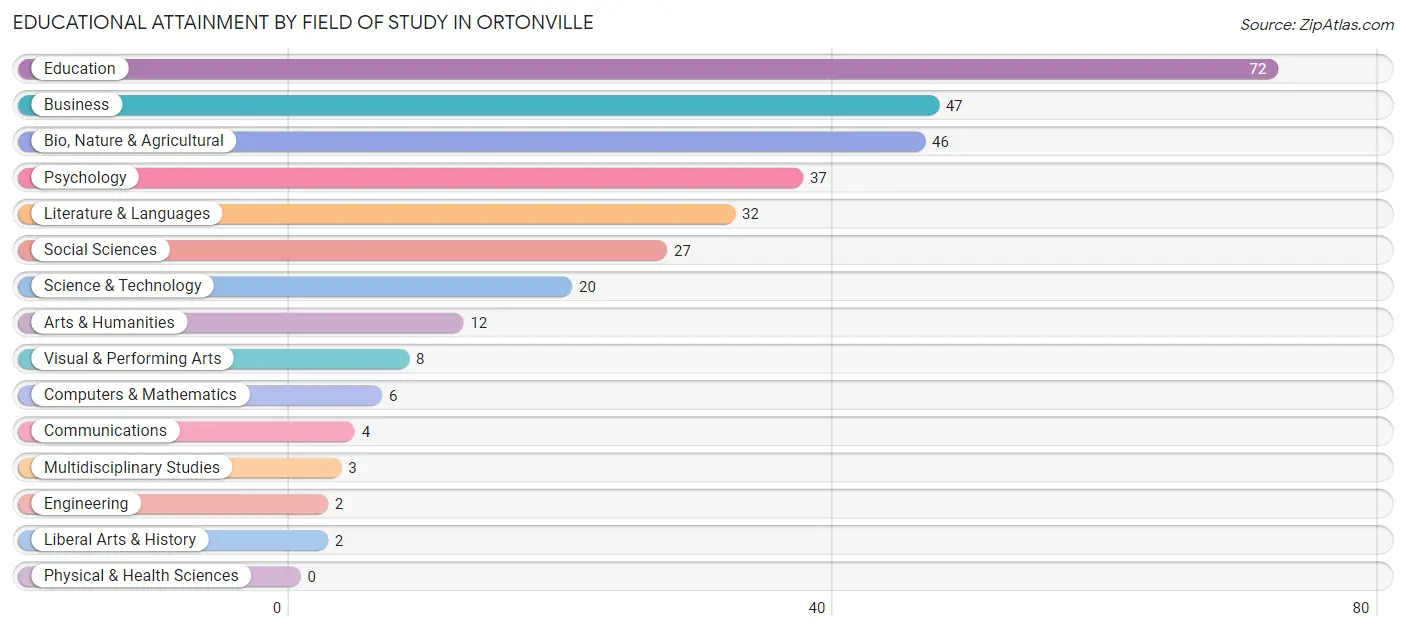
| Field of Study | # Graduates | % Graduates |
| Computers & Mathematics | 6 | 1.9% |
| Bio, Nature & Agricultural | 46 | 14.5% |
| Physical & Health Sciences | 0 | 0.0% |
| Psychology | 37 | 11.6% |
| Social Sciences | 27 | 8.5% |
| Engineering | 2 | 0.6% |
| Multidisciplinary Studies | 3 | 0.9% |
| Science & Technology | 20 | 6.3% |
| Business | 47 | 14.8% |
| Education | 72 | 22.6% |
| Literature & Languages | 32 | 10.1% |
| Liberal Arts & History | 2 | 0.6% |
| Visual & Performing Arts | 8 | 2.5% |
| Communications | 4 | 1.3% |
| Arts & Humanities | 12 | 3.8% |
| Total | 318 | 100.0% |
Transportation & Commute in Ortonville
Vehicle Availability by Sex in Ortonville
The most prevalent vehicle ownership categories in Ortonville are males with 2 vehicles (180, accounting for 39.6%) and females with 2 vehicles (183, making up 47.0%).
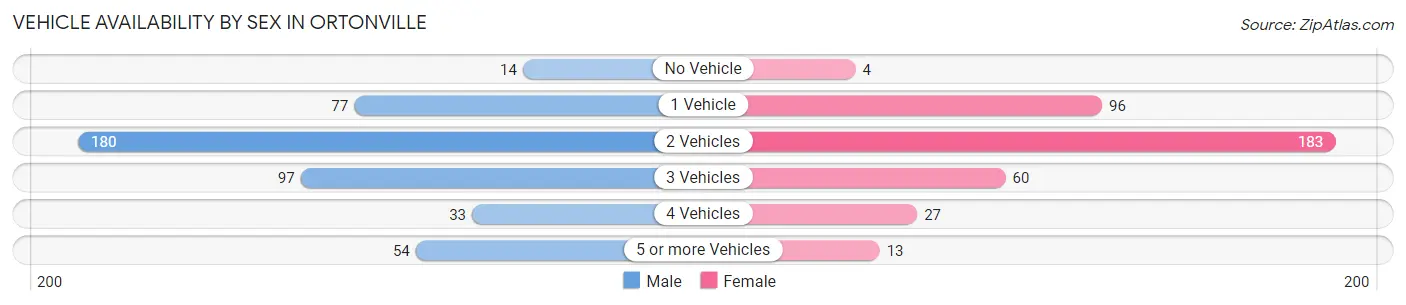
| Vehicles Available | Male | Female |
| No Vehicle | 14 (3.1%) | 4 (1.0%) |
| 1 Vehicle | 77 (16.9%) | 96 (25.1%) |
| 2 Vehicles | 180 (39.6%) | 183 (47.8%) |
| 3 Vehicles | 97 (21.3%) | 60 (15.7%) |
| 4 Vehicles | 33 (7.2%) | 27 (7.0%) |
| 5 or more Vehicles | 54 (11.9%) | 13 (3.4%) |
| Total | 455 (100.0%) | 383 (100.0%) |
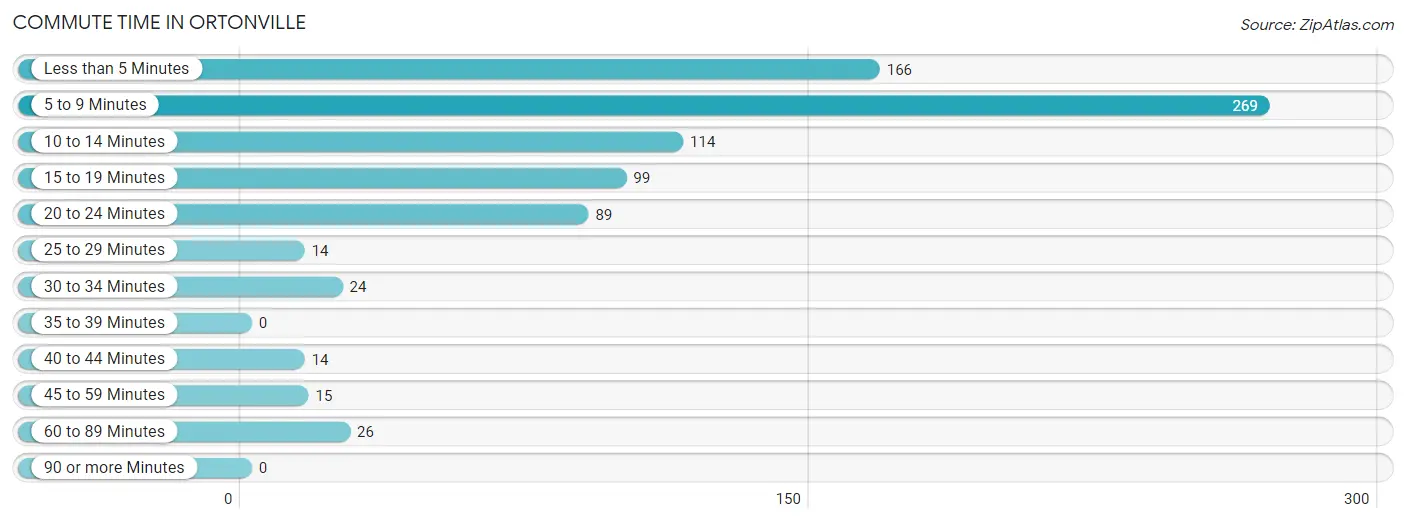
Commute Time in Ortonville
The most frequently occuring commute durations in Ortonville are 5 to 9 minutes (269 commuters, 32.4%), less than 5 minutes (166 commuters, 20.0%), and 10 to 14 minutes (114 commuters, 13.7%).
| Commute Time | # Commuters | % Commuters |
| Less than 5 Minutes | 166 | 20.0% |
| 5 to 9 Minutes | 269 | 32.4% |
| 10 to 14 Minutes | 114 | 13.7% |
| 15 to 19 Minutes | 99 | 11.9% |
| 20 to 24 Minutes | 89 | 10.7% |
| 25 to 29 Minutes | 14 | 1.7% |
| 30 to 34 Minutes | 24 | 2.9% |
| 35 to 39 Minutes | 0 | 0.0% |
| 40 to 44 Minutes | 14 | 1.7% |
| 45 to 59 Minutes | 15 | 1.8% |
| 60 to 89 Minutes | 26 | 3.1% |
| 90 or more Minutes | 0 | 0.0% |
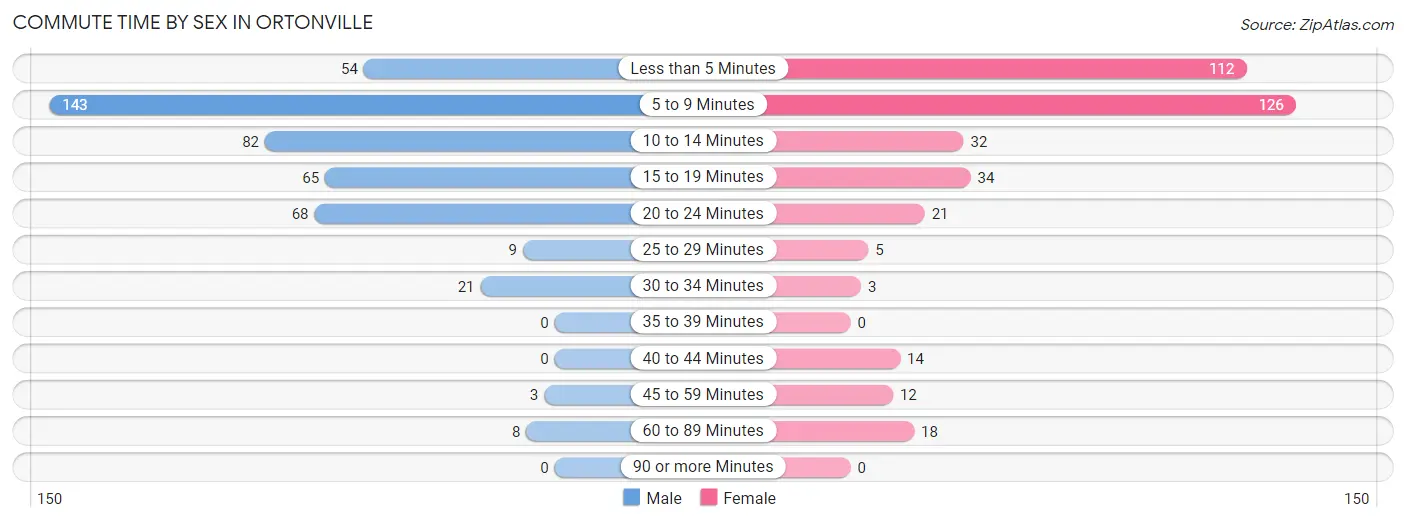
Commute Time by Sex in Ortonville
The most common commute times in Ortonville are 5 to 9 minutes (143 commuters, 31.6%) for males and 5 to 9 minutes (126 commuters, 33.4%) for females.
| Commute Time | Male | Female |
| Less than 5 Minutes | 54 (11.9%) | 112 (29.7%) |
| 5 to 9 Minutes | 143 (31.6%) | 126 (33.4%) |
| 10 to 14 Minutes | 82 (18.1%) | 32 (8.5%) |
| 15 to 19 Minutes | 65 (14.3%) | 34 (9.0%) |
| 20 to 24 Minutes | 68 (15.0%) | 21 (5.6%) |
| 25 to 29 Minutes | 9 (2.0%) | 5 (1.3%) |
| 30 to 34 Minutes | 21 (4.6%) | 3 (0.8%) |
| 35 to 39 Minutes | 0 (0.0%) | 0 (0.0%) |
| 40 to 44 Minutes | 0 (0.0%) | 14 (3.7%) |
| 45 to 59 Minutes | 3 (0.7%) | 12 (3.2%) |
| 60 to 89 Minutes | 8 (1.8%) | 18 (4.8%) |
| 90 or more Minutes | 0 (0.0%) | 0 (0.0%) |
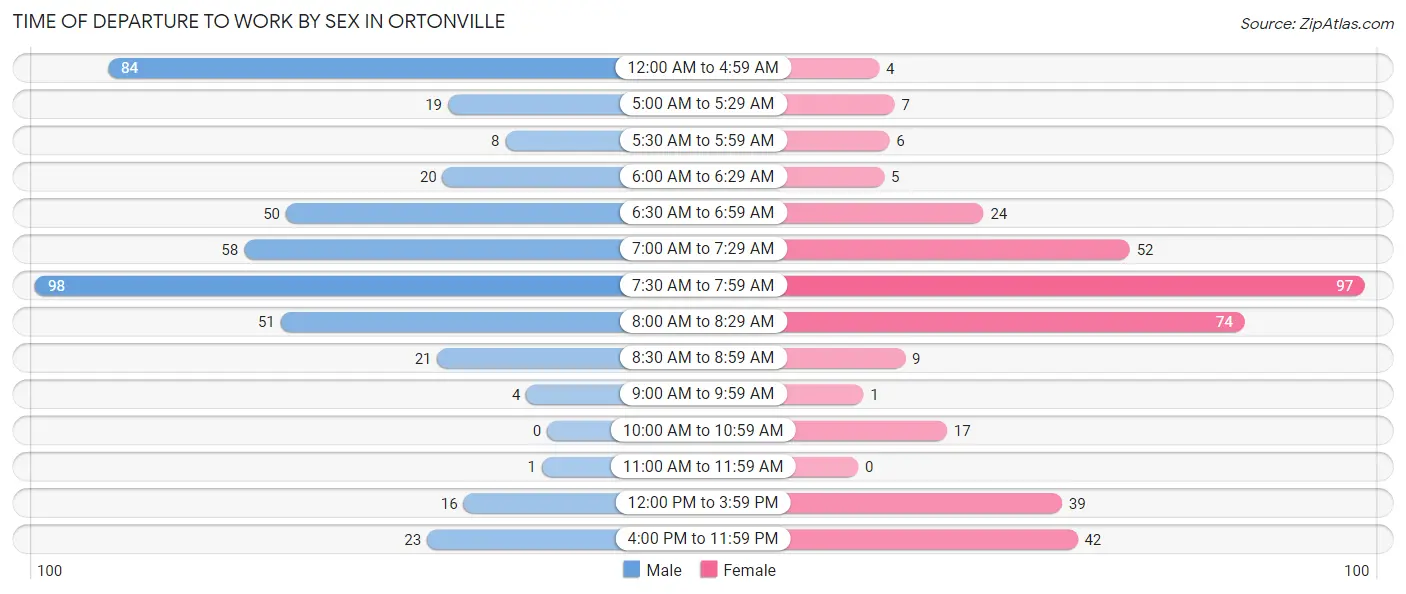
Time of Departure to Work by Sex in Ortonville
The most frequent times of departure to work in Ortonville are 7:30 AM to 7:59 AM (98, 21.6%) for males and 7:30 AM to 7:59 AM (97, 25.7%) for females.
| Time of Departure | Male | Female |
| 12:00 AM to 4:59 AM | 84 (18.5%) | 4 (1.1%) |
| 5:00 AM to 5:29 AM | 19 (4.2%) | 7 (1.9%) |
| 5:30 AM to 5:59 AM | 8 (1.8%) | 6 (1.6%) |
| 6:00 AM to 6:29 AM | 20 (4.4%) | 5 (1.3%) |
| 6:30 AM to 6:59 AM | 50 (11.0%) | 24 (6.4%) |
| 7:00 AM to 7:29 AM | 58 (12.8%) | 52 (13.8%) |
| 7:30 AM to 7:59 AM | 98 (21.6%) | 97 (25.7%) |
| 8:00 AM to 8:29 AM | 51 (11.3%) | 74 (19.6%) |
| 8:30 AM to 8:59 AM | 21 (4.6%) | 9 (2.4%) |
| 9:00 AM to 9:59 AM | 4 (0.9%) | 1 (0.3%) |
| 10:00 AM to 10:59 AM | 0 (0.0%) | 17 (4.5%) |
| 11:00 AM to 11:59 AM | 1 (0.2%) | 0 (0.0%) |
| 12:00 PM to 3:59 PM | 16 (3.5%) | 39 (10.3%) |
| 4:00 PM to 11:59 PM | 23 (5.1%) | 42 (11.1%) |
| Total | 453 (100.0%) | 377 (100.0%) |
Housing Occupancy in Ortonville
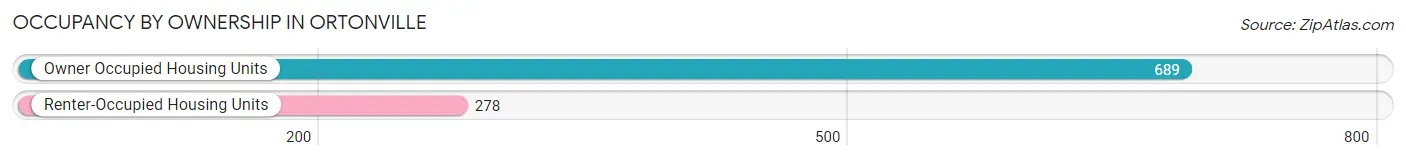
Occupancy by Ownership in Ortonville
Of the total 967 dwellings in Ortonville, owner-occupied units account for 689 (71.3%), while renter-occupied units make up 278 (28.7%).
| Occupancy | # Housing Units | % Housing Units |
| Owner Occupied Housing Units | 689 | 71.3% |
| Renter-Occupied Housing Units | 278 | 28.7% |
| Total Occupied Housing Units | 967 | 100.0% |
Occupancy by Household Size in Ortonville
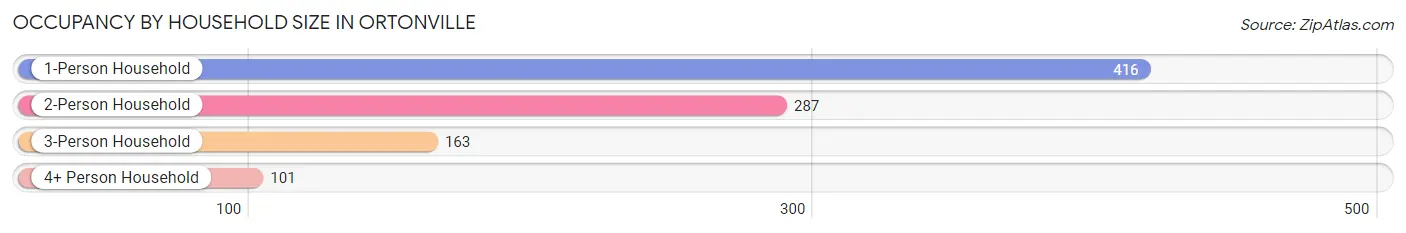
| Household Size | # Housing Units | % Housing Units |
| 1-Person Household | 416 | 43.0% |
| 2-Person Household | 287 | 29.7% |
| 3-Person Household | 163 | 16.9% |
| 4+ Person Household | 101 | 10.4% |
| Total Housing Units | 967 | 100.0% |
Occupancy by Ownership by Household Size in Ortonville
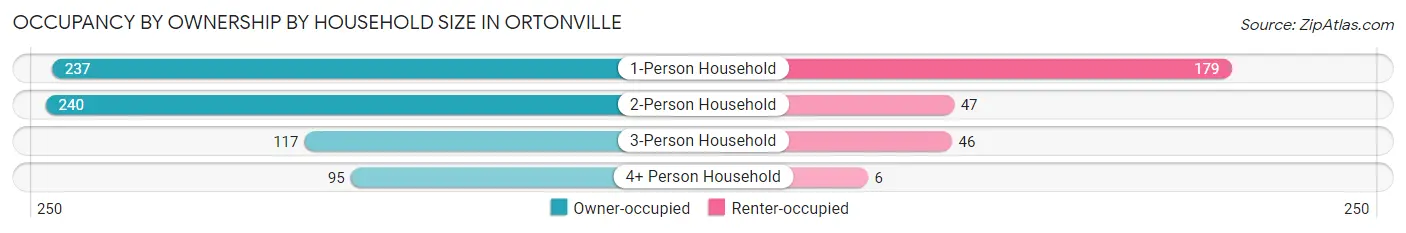
| Household Size | Owner-occupied | Renter-occupied |
| 1-Person Household | 237 (57.0%) | 179 (43.0%) |
| 2-Person Household | 240 (83.6%) | 47 (16.4%) |
| 3-Person Household | 117 (71.8%) | 46 (28.2%) |
| 4+ Person Household | 95 (94.1%) | 6 (5.9%) |
| Total Housing Units | 689 (71.3%) | 278 (28.7%) |
Occupancy by Educational Attainment in Ortonville
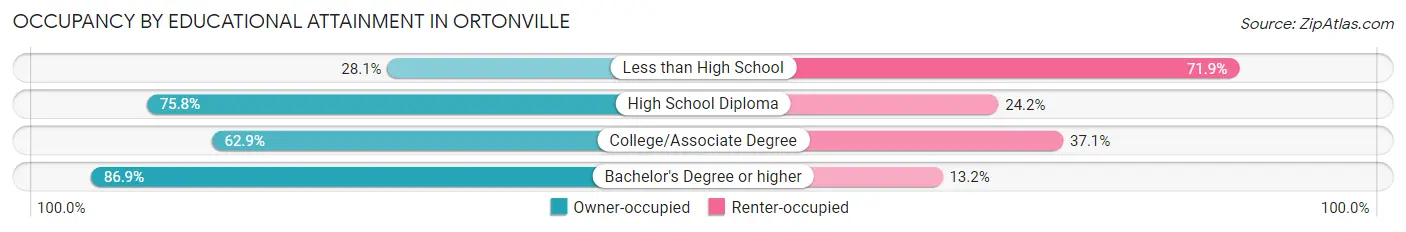
| Household Size | Owner-occupied | Renter-occupied |
| Less than High School | 16 (28.1%) | 41 (71.9%) |
| High School Diploma | 291 (75.8%) | 93 (24.2%) |
| College/Associate Degree | 197 (62.9%) | 116 (37.1%) |
| Bachelor's Degree or higher | 185 (86.9%) | 28 (13.2%) |
Occupancy by Age of Householder in Ortonville
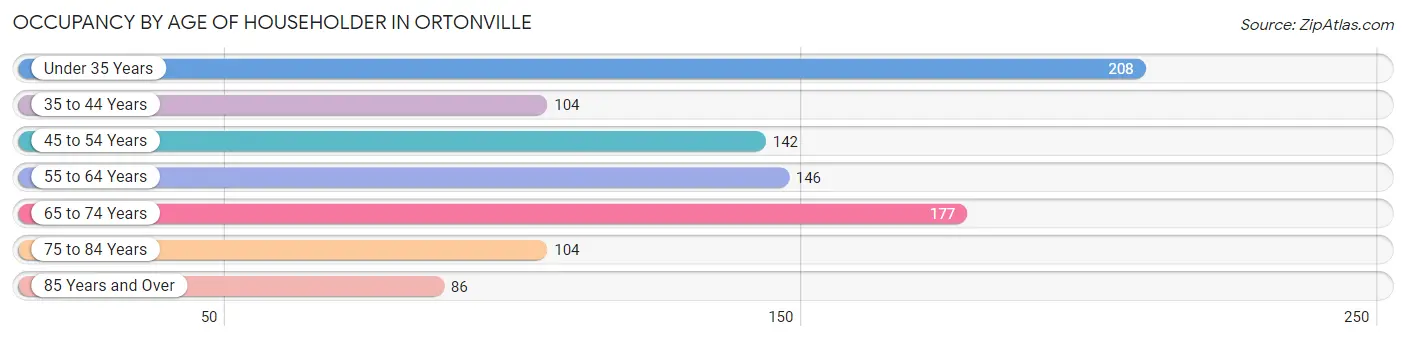
| Age Bracket | # Households | % Households |
| Under 35 Years | 208 | 21.5% |
| 35 to 44 Years | 104 | 10.7% |
| 45 to 54 Years | 142 | 14.7% |
| 55 to 64 Years | 146 | 15.1% |
| 65 to 74 Years | 177 | 18.3% |
| 75 to 84 Years | 104 | 10.7% |
| 85 Years and Over | 86 | 8.9% |
| Total | 967 | 100.0% |
Housing Finances in Ortonville
Median Income by Occupancy in Ortonville
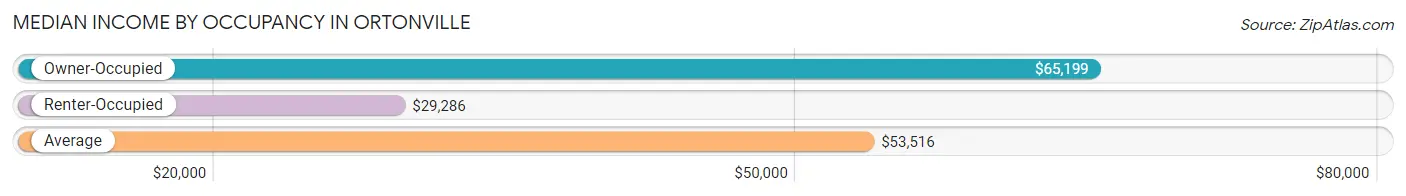
| Occupancy Type | # Households | Median Income |
| Owner-Occupied | 689 (71.3%) | $65,199 |
| Renter-Occupied | 278 (28.7%) | $29,286 |
| Average | 967 (100.0%) | $53,516 |
Occupancy by Householder Income Bracket in Ortonville
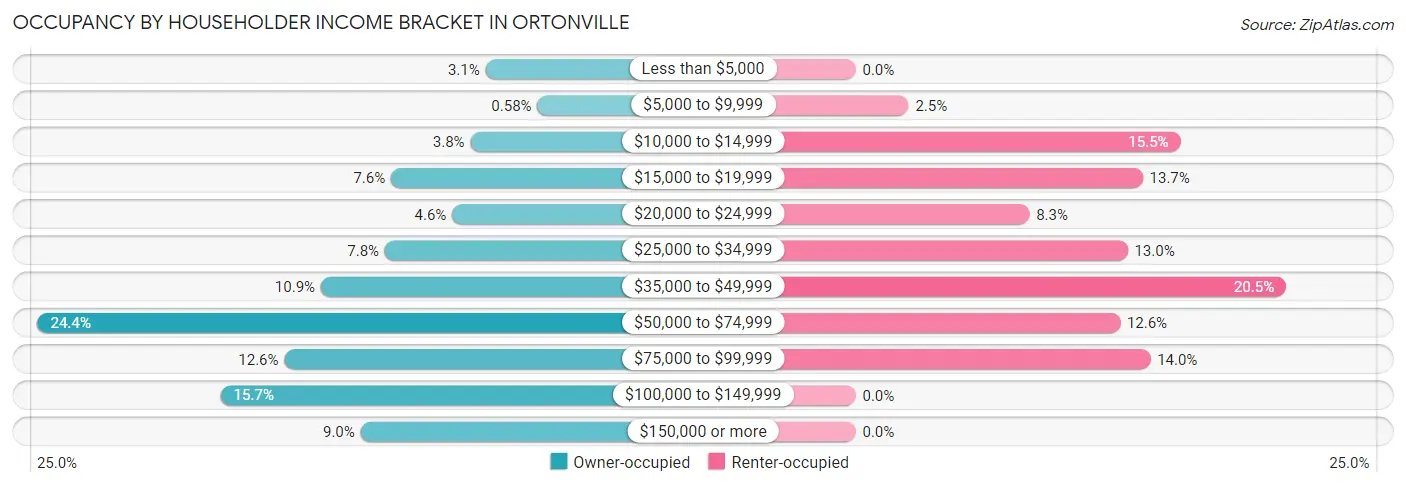
| Income Bracket | Owner-occupied | Renter-occupied |
| Less than $5,000 | 21 (3.0%) | 0 (0.0%) |
| $5,000 to $9,999 | 4 (0.6%) | 7 (2.5%) |
| $10,000 to $14,999 | 26 (3.8%) | 43 (15.5%) |
| $15,000 to $19,999 | 52 (7.5%) | 38 (13.7%) |
| $20,000 to $24,999 | 32 (4.6%) | 23 (8.3%) |
| $25,000 to $34,999 | 54 (7.8%) | 36 (13.0%) |
| $35,000 to $49,999 | 75 (10.9%) | 57 (20.5%) |
| $50,000 to $74,999 | 168 (24.4%) | 35 (12.6%) |
| $75,000 to $99,999 | 87 (12.6%) | 39 (14.0%) |
| $100,000 to $149,999 | 108 (15.7%) | 0 (0.0%) |
| $150,000 or more | 62 (9.0%) | 0 (0.0%) |
| Total | 689 (100.0%) | 278 (100.0%) |
Monthly Housing Cost Tiers in Ortonville
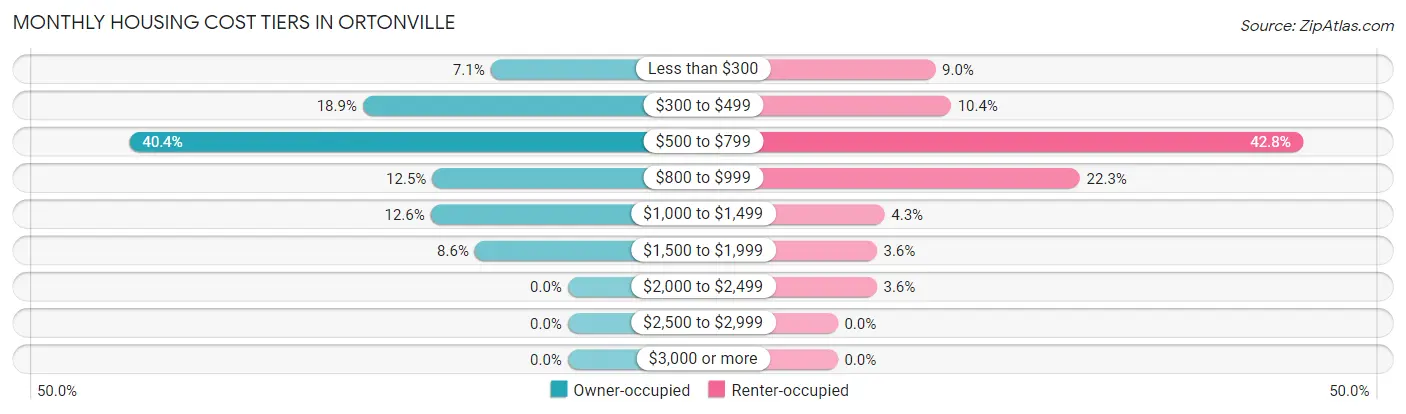
| Monthly Cost | Owner-occupied | Renter-occupied |
| Less than $300 | 49 (7.1%) | 25 (9.0%) |
| $300 to $499 | 130 (18.9%) | 29 (10.4%) |
| $500 to $799 | 278 (40.4%) | 119 (42.8%) |
| $800 to $999 | 86 (12.5%) | 62 (22.3%) |
| $1,000 to $1,499 | 87 (12.6%) | 12 (4.3%) |
| $1,500 to $1,999 | 59 (8.6%) | 10 (3.6%) |
| $2,000 to $2,499 | 0 (0.0%) | 10 (3.6%) |
| $2,500 to $2,999 | 0 (0.0%) | 0 (0.0%) |
| $3,000 or more | 0 (0.0%) | 0 (0.0%) |
| Total | 689 (100.0%) | 278 (100.0%) |
Physical Housing Characteristics in Ortonville
Housing Structures in Ortonville
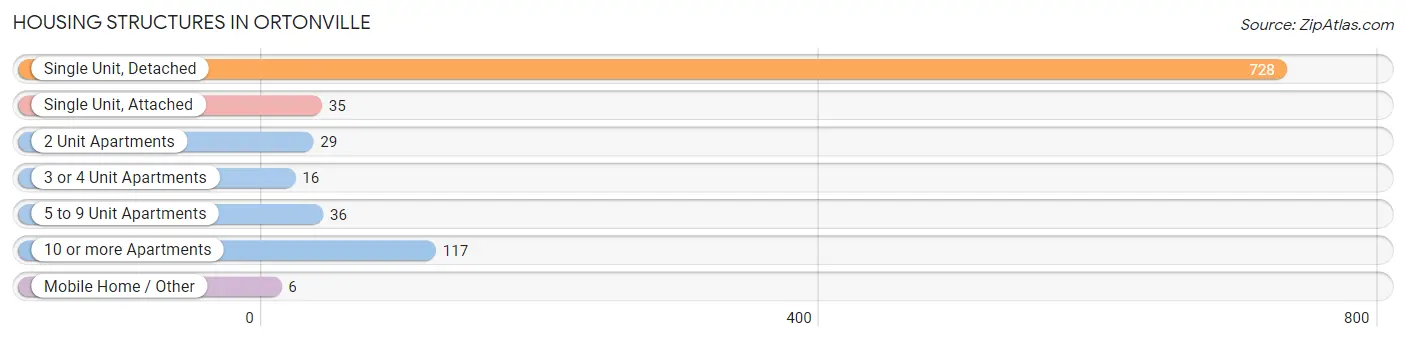
| Structure Type | # Housing Units | % Housing Units |
| Single Unit, Detached | 728 | 75.3% |
| Single Unit, Attached | 35 | 3.6% |
| 2 Unit Apartments | 29 | 3.0% |
| 3 or 4 Unit Apartments | 16 | 1.7% |
| 5 to 9 Unit Apartments | 36 | 3.7% |
| 10 or more Apartments | 117 | 12.1% |
| Mobile Home / Other | 6 | 0.6% |
| Total | 967 | 100.0% |
Housing Structures by Occupancy in Ortonville
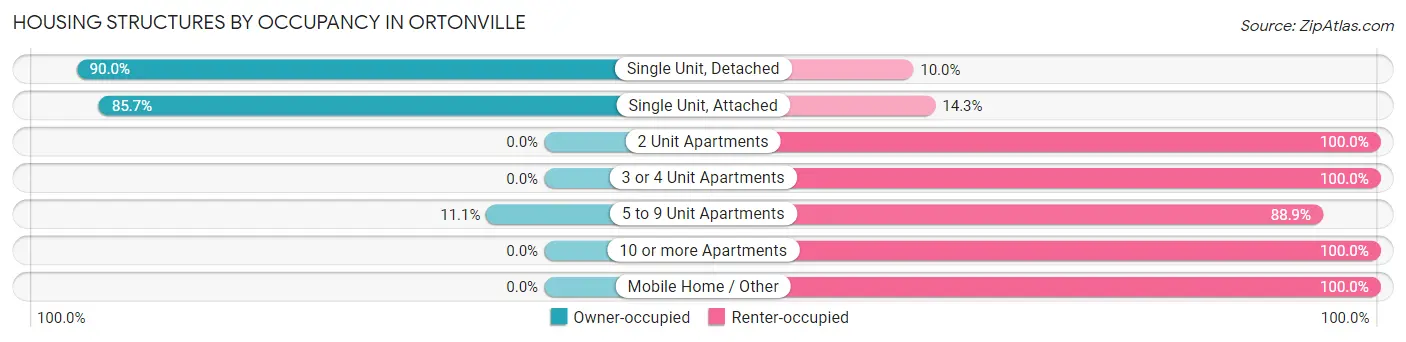
| Structure Type | Owner-occupied | Renter-occupied |
| Single Unit, Detached | 655 (90.0%) | 73 (10.0%) |
| Single Unit, Attached | 30 (85.7%) | 5 (14.3%) |
| 2 Unit Apartments | 0 (0.0%) | 29 (100.0%) |
| 3 or 4 Unit Apartments | 0 (0.0%) | 16 (100.0%) |
| 5 to 9 Unit Apartments | 4 (11.1%) | 32 (88.9%) |
| 10 or more Apartments | 0 (0.0%) | 117 (100.0%) |
| Mobile Home / Other | 0 (0.0%) | 6 (100.0%) |
| Total | 689 (71.3%) | 278 (28.7%) |
Housing Structures by Number of Rooms in Ortonville
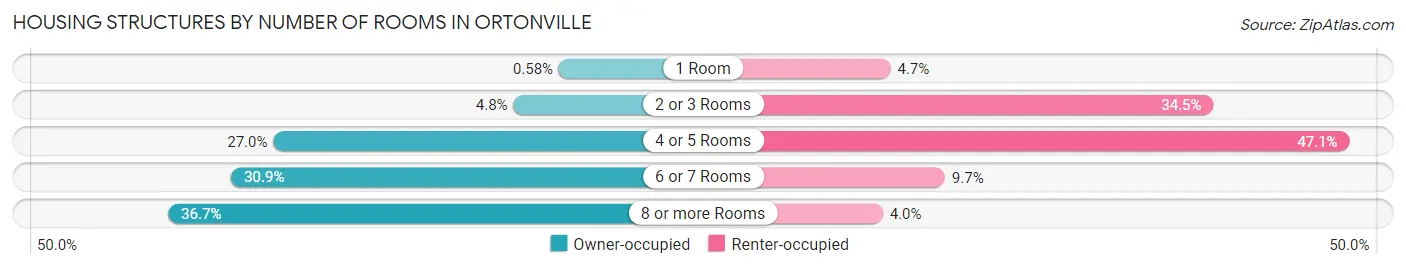
| Number of Rooms | Owner-occupied | Renter-occupied |
| 1 Room | 4 (0.6%) | 13 (4.7%) |
| 2 or 3 Rooms | 33 (4.8%) | 96 (34.5%) |
| 4 or 5 Rooms | 186 (27.0%) | 131 (47.1%) |
| 6 or 7 Rooms | 213 (30.9%) | 27 (9.7%) |
| 8 or more Rooms | 253 (36.7%) | 11 (4.0%) |
| Total | 689 (100.0%) | 278 (100.0%) |
Housing Structure by Heating Type in Ortonville
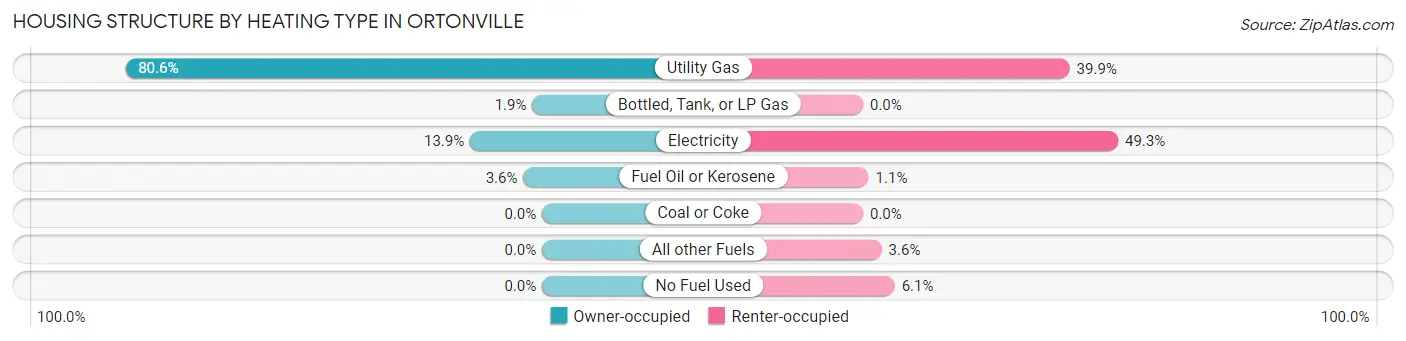
| Heating Type | Owner-occupied | Renter-occupied |
| Utility Gas | 555 (80.5%) | 111 (39.9%) |
| Bottled, Tank, or LP Gas | 13 (1.9%) | 0 (0.0%) |
| Electricity | 96 (13.9%) | 137 (49.3%) |
| Fuel Oil or Kerosene | 25 (3.6%) | 3 (1.1%) |
| Coal or Coke | 0 (0.0%) | 0 (0.0%) |
| All other Fuels | 0 (0.0%) | 10 (3.6%) |
| No Fuel Used | 0 (0.0%) | 17 (6.1%) |
| Total | 689 (100.0%) | 278 (100.0%) |
Household Vehicle Usage in Ortonville
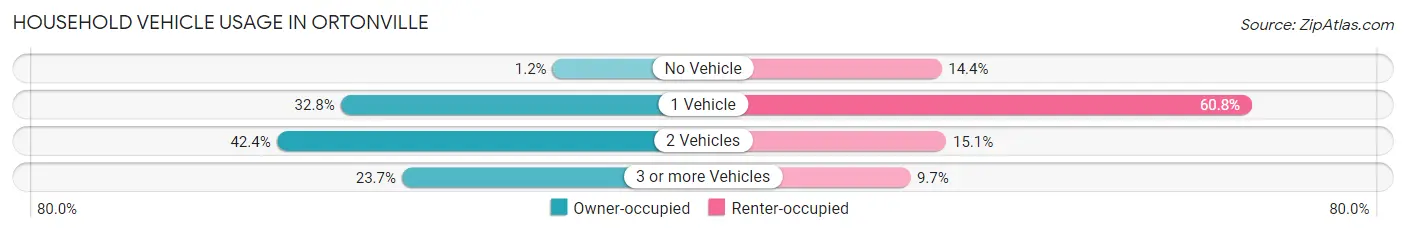
| Vehicles per Household | Owner-occupied | Renter-occupied |
| No Vehicle | 8 (1.2%) | 40 (14.4%) |
| 1 Vehicle | 226 (32.8%) | 169 (60.8%) |
| 2 Vehicles | 292 (42.4%) | 42 (15.1%) |
| 3 or more Vehicles | 163 (23.7%) | 27 (9.7%) |
| Total | 689 (100.0%) | 278 (100.0%) |
Real Estate & Mortgages in Ortonville
Real Estate and Mortgage Overview in Ortonville
| Characteristic | Without Mortgage | With Mortgage |
| Housing Units | 318 | 371 |
| Median Property Value | $108,300 | $95,700 |
| Median Household Income | $44,444 | $18 |
| Monthly Housing Costs | $497 | $0 |
| Real Estate Taxes | $1,345 | $0 |
Property Value by Mortgage Status in Ortonville
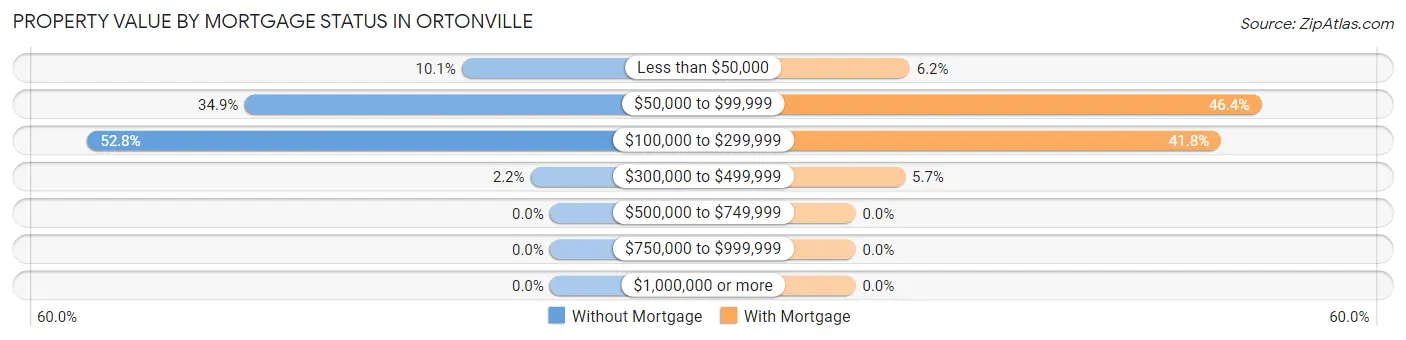
| Property Value | Without Mortgage | With Mortgage |
| Less than $50,000 | 32 (10.1%) | 23 (6.2%) |
| $50,000 to $99,999 | 111 (34.9%) | 172 (46.4%) |
| $100,000 to $299,999 | 168 (52.8%) | 155 (41.8%) |
| $300,000 to $499,999 | 7 (2.2%) | 21 (5.7%) |
| $500,000 to $749,999 | 0 (0.0%) | 0 (0.0%) |
| $750,000 to $999,999 | 0 (0.0%) | 0 (0.0%) |
| $1,000,000 or more | 0 (0.0%) | 0 (0.0%) |
| Total | 318 (100.0%) | 371 (100.0%) |
Household Income by Mortgage Status in Ortonville
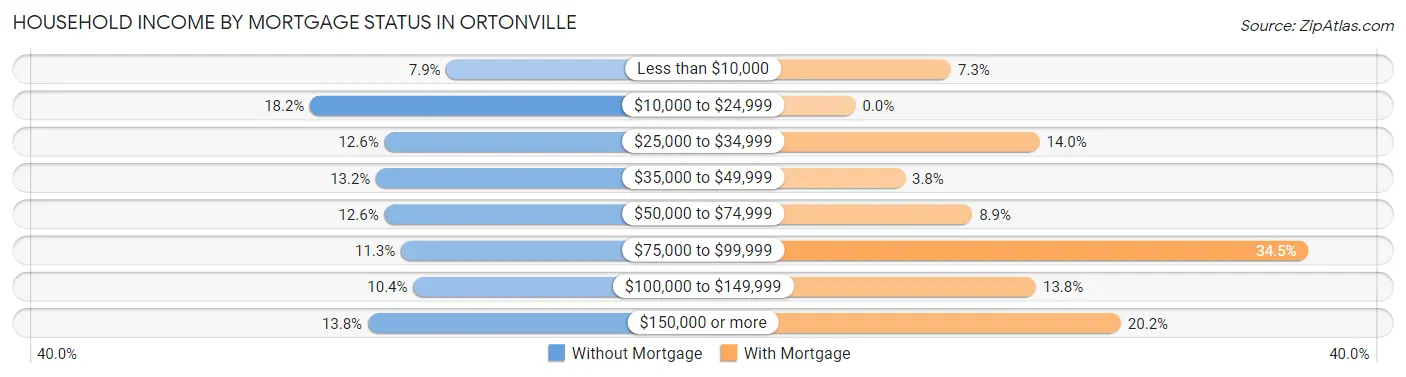
| Household Income | Without Mortgage | With Mortgage |
| Less than $10,000 | 25 (7.9%) | 27 (7.3%) |
| $10,000 to $24,999 | 58 (18.2%) | 0 (0.0%) |
| $25,000 to $34,999 | 40 (12.6%) | 52 (14.0%) |
| $35,000 to $49,999 | 42 (13.2%) | 14 (3.8%) |
| $50,000 to $74,999 | 40 (12.6%) | 33 (8.9%) |
| $75,000 to $99,999 | 36 (11.3%) | 128 (34.5%) |
| $100,000 to $149,999 | 33 (10.4%) | 51 (13.8%) |
| $150,000 or more | 44 (13.8%) | 75 (20.2%) |
| Total | 318 (100.0%) | 371 (100.0%) |
Property Value to Household Income Ratio in Ortonville
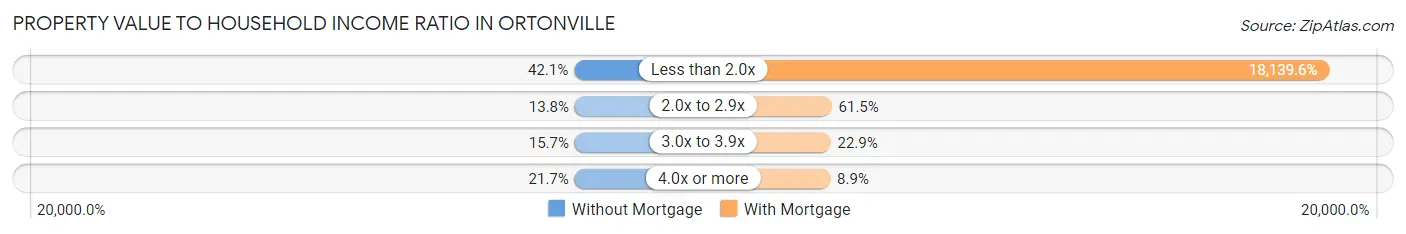
| Value-to-Income Ratio | Without Mortgage | With Mortgage |
| Less than 2.0x | 134 (42.1%) | 67,298 (18,139.6%) |
| 2.0x to 2.9x | 44 (13.8%) | 228 (61.5%) |
| 3.0x to 3.9x | 50 (15.7%) | 85 (22.9%) |
| 4.0x or more | 69 (21.7%) | 33 (8.9%) |
| Total | 318 (100.0%) | 371 (100.0%) |
Real Estate Taxes by Mortgage Status in Ortonville
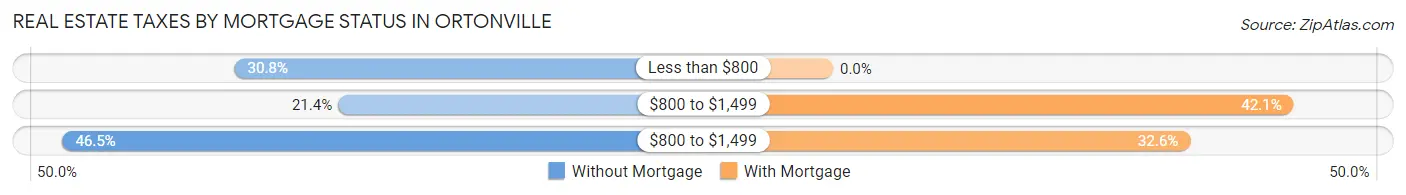
| Property Taxes | Without Mortgage | With Mortgage |
| Less than $800 | 98 (30.8%) | 0 (0.0%) |
| $800 to $1,499 | 68 (21.4%) | 156 (42.0%) |
| $800 to $1,499 | 148 (46.5%) | 121 (32.6%) |
| Total | 318 (100.0%) | 371 (100.0%) |
Health & Disability in Ortonville
Health Insurance Coverage by Age in Ortonville
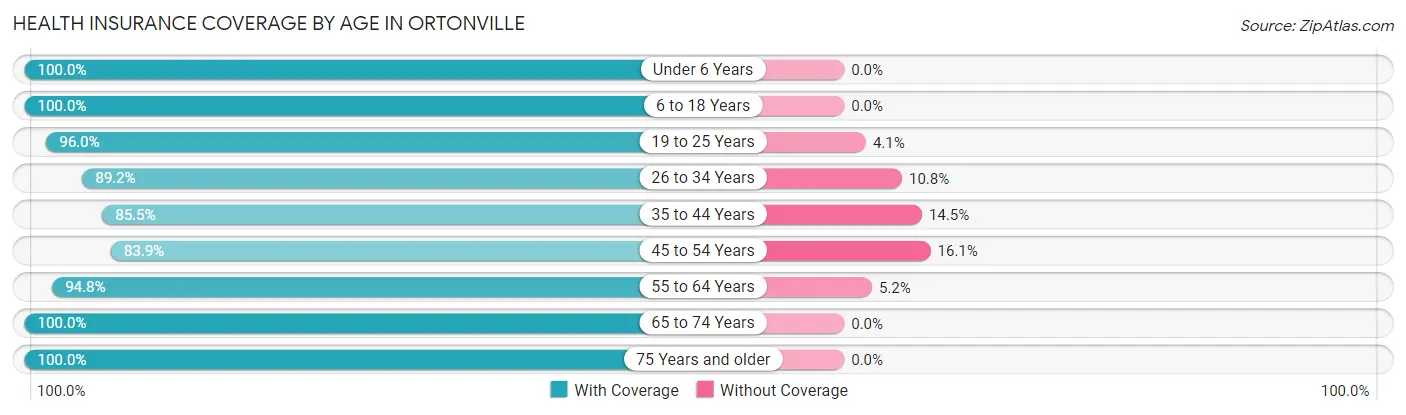
| Age Bracket | With Coverage | Without Coverage |
| Under 6 Years | 120 (100.0%) | 0 (0.0%) |
| 6 to 18 Years | 268 (100.0%) | 0 (0.0%) |
| 19 to 25 Years | 142 (96.0%) | 6 (4.1%) |
| 26 to 34 Years | 232 (89.2%) | 28 (10.8%) |
| 35 to 44 Years | 183 (85.5%) | 31 (14.5%) |
| 45 to 54 Years | 198 (83.9%) | 38 (16.1%) |
| 55 to 64 Years | 239 (94.8%) | 13 (5.2%) |
| 65 to 74 Years | 270 (100.0%) | 0 (0.0%) |
| 75 Years and older | 226 (100.0%) | 0 (0.0%) |
| Total | 1,878 (94.2%) | 116 (5.8%) |
Health Insurance Coverage by Citizenship Status in Ortonville
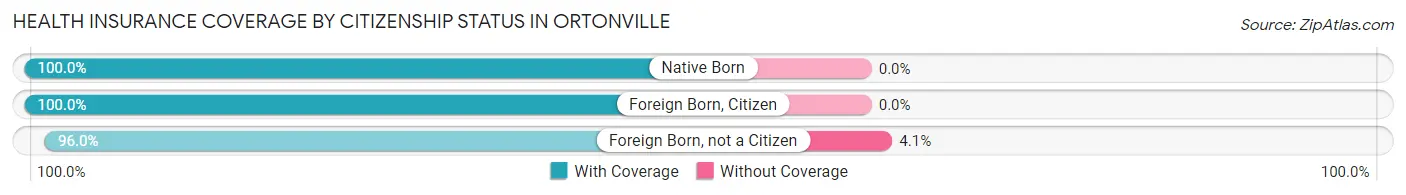
| Citizenship Status | With Coverage | Without Coverage |
| Native Born | 120 (100.0%) | 0 (0.0%) |
| Foreign Born, Citizen | 268 (100.0%) | 0 (0.0%) |
| Foreign Born, not a Citizen | 142 (96.0%) | 6 (4.1%) |
Health Insurance Coverage by Household Income in Ortonville
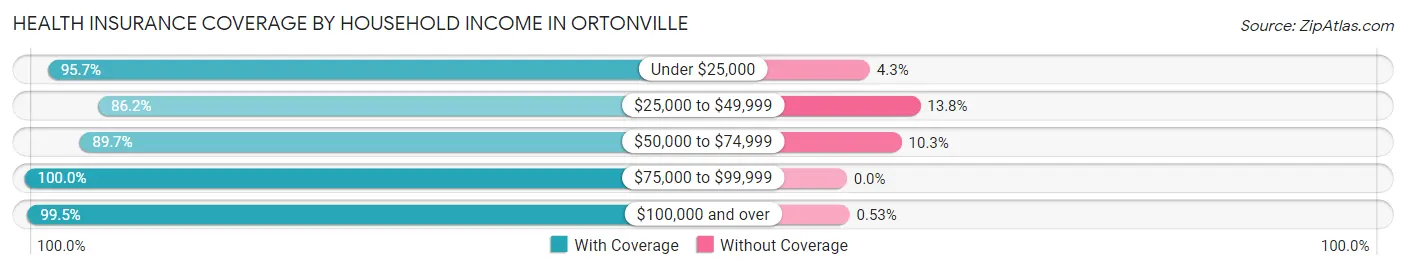
| Household Income | With Coverage | Without Coverage |
| Under $25,000 | 265 (95.7%) | 12 (4.3%) |
| $25,000 to $49,999 | 319 (86.2%) | 51 (13.8%) |
| $50,000 to $74,999 | 437 (89.7%) | 50 (10.3%) |
| $75,000 to $99,999 | 275 (100.0%) | 0 (0.0%) |
| $100,000 and over | 558 (99.5%) | 3 (0.5%) |
Public vs Private Health Insurance Coverage by Age in Ortonville
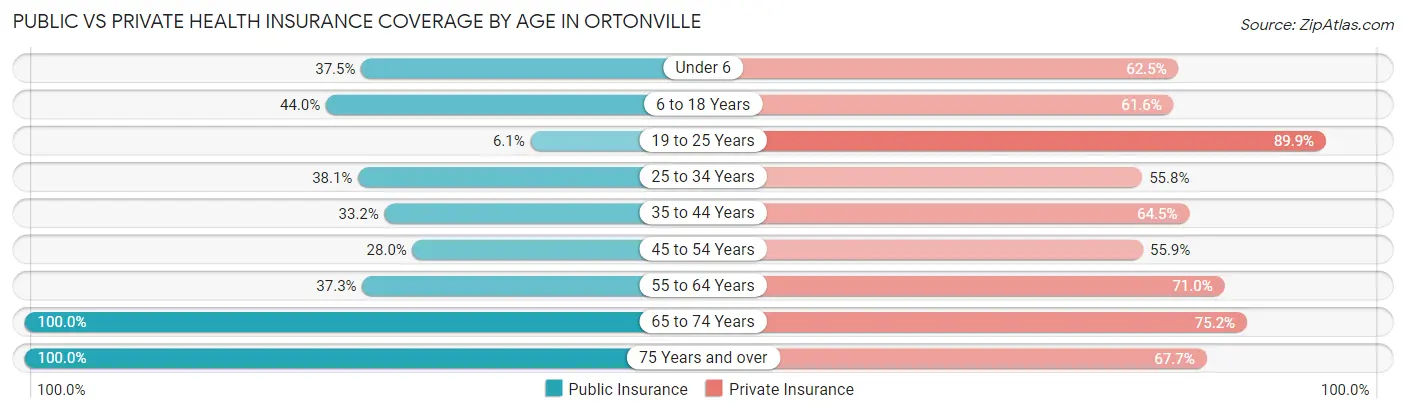
| Age Bracket | Public Insurance | Private Insurance |
| Under 6 | 45 (37.5%) | 75 (62.5%) |
| 6 to 18 Years | 118 (44.0%) | 165 (61.6%) |
| 19 to 25 Years | 9 (6.1%) | 133 (89.9%) |
| 25 to 34 Years | 99 (38.1%) | 145 (55.8%) |
| 35 to 44 Years | 71 (33.2%) | 138 (64.5%) |
| 45 to 54 Years | 66 (28.0%) | 132 (55.9%) |
| 55 to 64 Years | 94 (37.3%) | 179 (71.0%) |
| 65 to 74 Years | 270 (100.0%) | 203 (75.2%) |
| 75 Years and over | 226 (100.0%) | 153 (67.7%) |
| Total | 998 (50.0%) | 1,323 (66.3%) |
Disability Status by Sex by Age in Ortonville
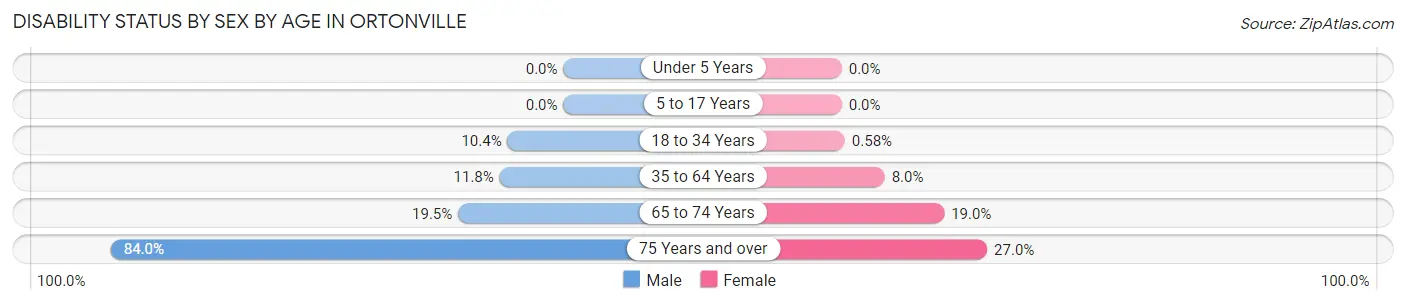
| Age Bracket | Male | Female |
| Under 5 Years | 0 (0.0%) | 0 (0.0%) |
| 5 to 17 Years | 0 (0.0%) | 0 (0.0%) |
| 18 to 34 Years | 25 (10.4%) | 1 (0.6%) |
| 35 to 64 Years | 40 (11.8%) | 29 (8.0%) |
| 65 to 74 Years | 25 (19.5%) | 27 (19.0%) |
| 75 Years and over | 84 (84.0%) | 34 (27.0%) |
Disability Class by Sex by Age in Ortonville
Disability Class: Hearing Difficulty
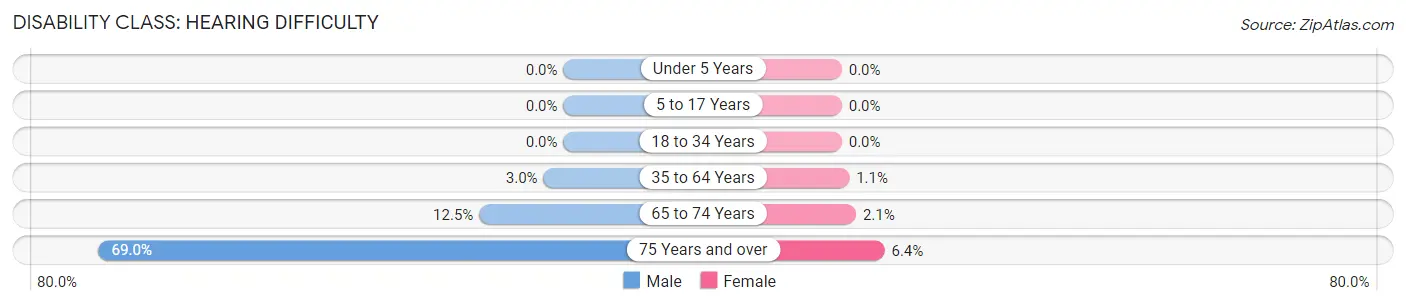
| Age Bracket | Male | Female |
| Under 5 Years | 0 (0.0%) | 0 (0.0%) |
| 5 to 17 Years | 0 (0.0%) | 0 (0.0%) |
| 18 to 34 Years | 0 (0.0%) | 0 (0.0%) |
| 35 to 64 Years | 10 (3.0%) | 4 (1.1%) |
| 65 to 74 Years | 16 (12.5%) | 3 (2.1%) |
| 75 Years and over | 69 (69.0%) | 8 (6.4%) |
Disability Class: Vision Difficulty
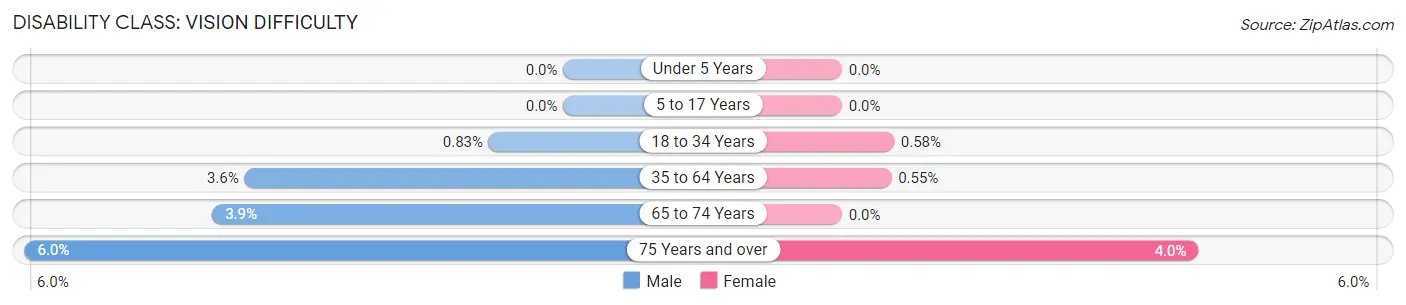
| Age Bracket | Male | Female |
| Under 5 Years | 0 (0.0%) | 0 (0.0%) |
| 5 to 17 Years | 0 (0.0%) | 0 (0.0%) |
| 18 to 34 Years | 2 (0.8%) | 1 (0.6%) |
| 35 to 64 Years | 12 (3.5%) | 2 (0.5%) |
| 65 to 74 Years | 5 (3.9%) | 0 (0.0%) |
| 75 Years and over | 6 (6.0%) | 5 (4.0%) |
Disability Class: Cognitive Difficulty
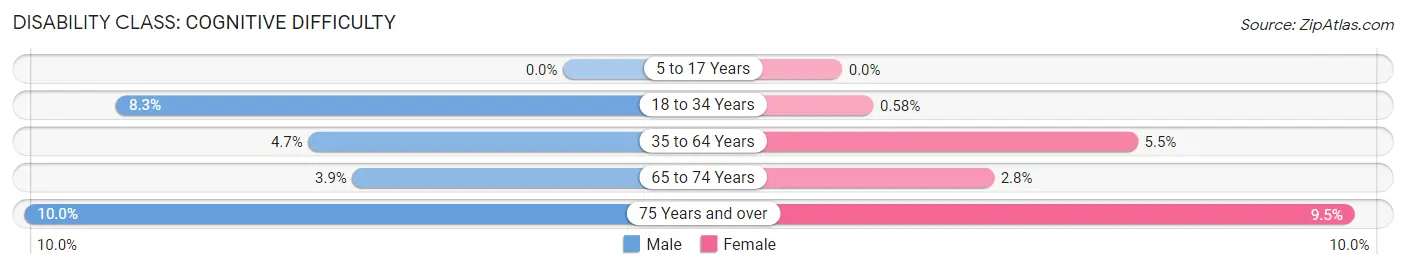
| Age Bracket | Male | Female |
| 5 to 17 Years | 0 (0.0%) | 0 (0.0%) |
| 18 to 34 Years | 20 (8.3%) | 1 (0.6%) |
| 35 to 64 Years | 16 (4.7%) | 20 (5.5%) |
| 65 to 74 Years | 5 (3.9%) | 4 (2.8%) |
| 75 Years and over | 10 (10.0%) | 12 (9.5%) |
Disability Class: Ambulatory Difficulty
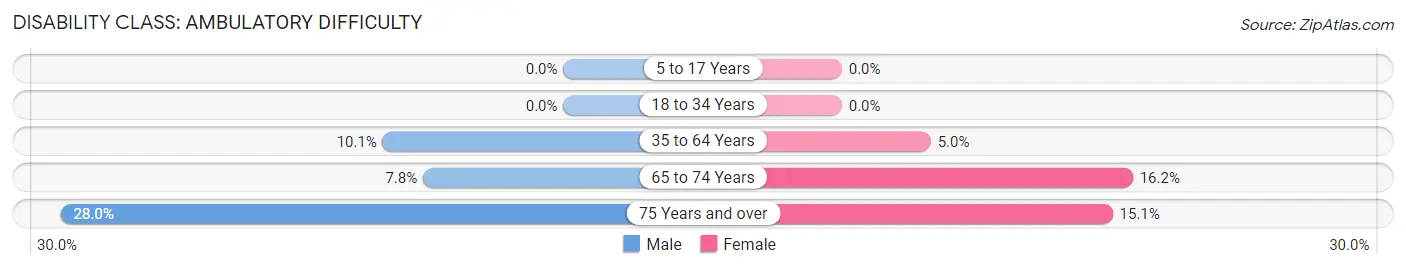
| Age Bracket | Male | Female |
| 5 to 17 Years | 0 (0.0%) | 0 (0.0%) |
| 18 to 34 Years | 0 (0.0%) | 0 (0.0%) |
| 35 to 64 Years | 34 (10.1%) | 18 (5.0%) |
| 65 to 74 Years | 10 (7.8%) | 23 (16.2%) |
| 75 Years and over | 28 (28.0%) | 19 (15.1%) |
Disability Class: Self-Care Difficulty
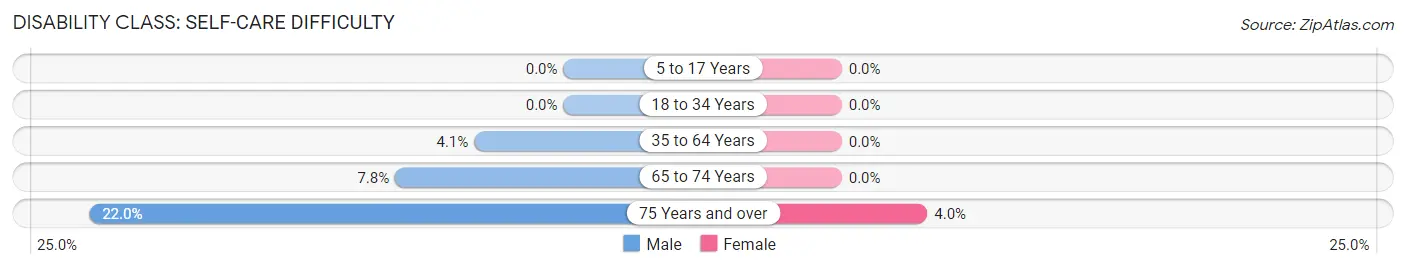
| Age Bracket | Male | Female |
| 5 to 17 Years | 0 (0.0%) | 0 (0.0%) |
| 18 to 34 Years | 0 (0.0%) | 0 (0.0%) |
| 35 to 64 Years | 14 (4.1%) | 0 (0.0%) |
| 65 to 74 Years | 10 (7.8%) | 0 (0.0%) |
| 75 Years and over | 22 (22.0%) | 5 (4.0%) |
Technology Access in Ortonville
Computing Device Access in Ortonville
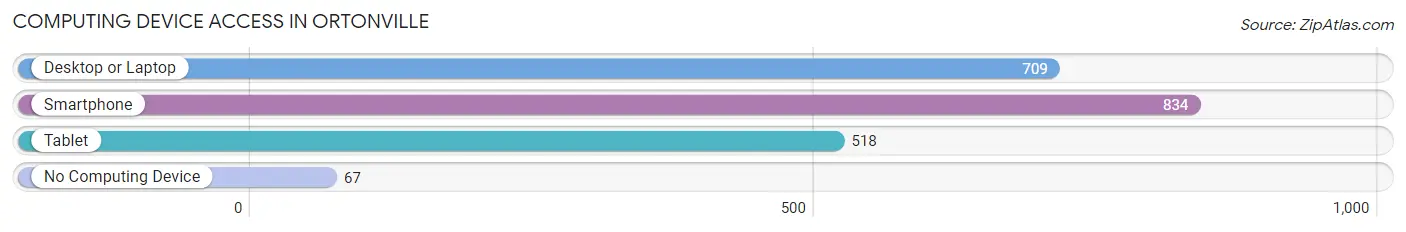
| Device Type | # Households | % Households |
| Desktop or Laptop | 709 | 73.3% |
| Smartphone | 834 | 86.3% |
| Tablet | 518 | 53.6% |
| No Computing Device | 67 | 6.9% |
| Total | 967 | 100.0% |
Internet Access in Ortonville
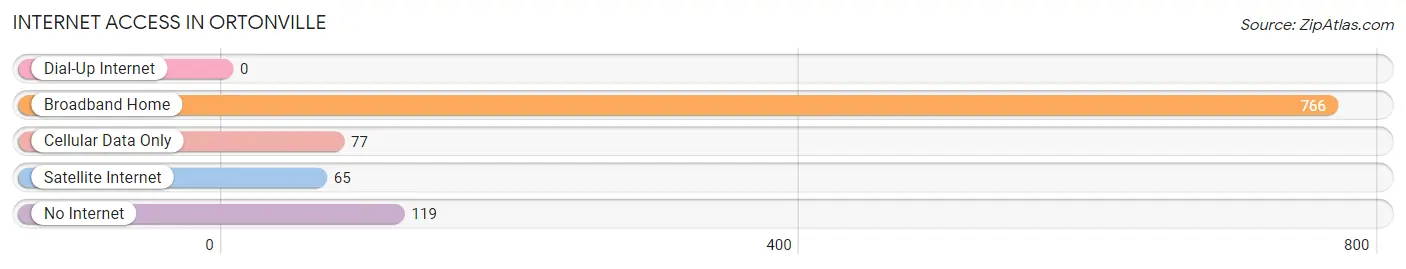
| Internet Type | # Households | % Households |
| Dial-Up Internet | 0 | 0.0% |
| Broadband Home | 766 | 79.2% |
| Cellular Data Only | 77 | 8.0% |
| Satellite Internet | 65 | 6.7% |
| No Internet | 119 | 12.3% |
| Total | 967 | 100.0% |
Ortonville Summary
Ortonville, Minnesota is a small city located in Big Stone County, in the western part of the state. It is situated on the banks of the Big Stone Lake, near the South Dakota border. The city has a population of 1,521 people, according to the 2010 census.
History
The area around Ortonville was first settled in the late 1800s by Scandinavian immigrants. The city was officially incorporated in 1881, and was named after the first postmaster, William Orton. The city was originally a farming community, but it soon became a popular tourist destination due to its proximity to Big Stone Lake.
In the early 1900s, the city was home to a number of businesses, including a hotel, a bank, a lumberyard, and a creamery. The city also had a number of churches, including the First Presbyterian Church, which was founded in 1883.
In the 1950s, the city began to experience a population decline as people moved away to larger cities. However, in recent years, the city has seen a resurgence in population, as people have moved back to the area to take advantage of the city’s natural beauty and recreational opportunities.
Geography
Ortonville is located in western Minnesota, in Big Stone County. It is situated on the banks of the Big Stone Lake, near the South Dakota border. The city is located at the intersection of Minnesota State Highways 7 and 75.
The city has a total area of 1.3 square miles, all of which is land. The city is located in a flat, open area, with no major hills or mountains. The city is located in the Central Plains region of Minnesota, and is part of the Prairie Coteau region.
Economy
The economy of Ortonville is largely based on tourism and agriculture. The city is home to a number of tourist attractions, including the Big Stone Lake State Park, which offers camping, fishing, and other recreational activities. The city is also home to a number of small businesses, including restaurants, retail stores, and service providers.
Agriculture is also an important part of the local economy. The city is home to a number of farms, which produce a variety of crops, including corn, soybeans, and wheat.
Demographics
According to the 2010 census, the population of Ortonville was 1,521 people. The racial makeup of the city was 95.2% White, 0.7% African American, 0.3% Native American, 0.2% Asian, 0.1% Pacific Islander, and 3.5% from other races. The median household income was $37,917, and the median family income was $45,625.
Conclusion
Ortonville, Minnesota is a small city located in Big Stone County, in the western part of the state. It is situated on the banks of the Big Stone Lake, near the South Dakota border. The city has a population of 1,521 people, according to the 2010 census. The economy of Ortonville is largely based on tourism and agriculture, and the city is home to a number of tourist attractions and small businesses. The racial makeup of the city is predominantly White, with a small percentage of African American, Native American, Asian, and Pacific Islander residents.
Common Questions
What is Per Capita Income in Ortonville?
Per Capita income in Ortonville is $31,481.
What is the Median Family Income in Ortonville?
Median Family Income in Ortonville is $67,308.
What is the Median Household income in Ortonville?
Median Household Income in Ortonville is $53,516.
What is Income or Wage Gap in Ortonville?
Income or Wage Gap in Ortonville is 42.4%.
Women in Ortonville earn 57.6 cents for every dollar earned by a man.
What is Inequality or Gini Index in Ortonville?
Inequality or Gini Index in Ortonville is 0.42.
What is the Total Population of Ortonville?
Total Population of Ortonville is 2,081.
What is the Total Male Population of Ortonville?
Total Male Population of Ortonville is 1,033.
What is the Total Female Population of Ortonville?
Total Female Population of Ortonville is 1,048.
What is the Ratio of Males per 100 Females in Ortonville?
There are 98.57 Males per 100 Females in Ortonville.
What is the Ratio of Females per 100 Males in Ortonville?
There are 101.45 Females per 100 Males in Ortonville.
What is the Median Population Age in Ortonville?
Median Population Age in Ortonville is 45.8 Years.
What is the Average Family Size in Ortonville
Average Family Size in Ortonville is 2.8 People.
What is the Average Household Size in Ortonville
Average Household Size in Ortonville is 2.0 People.
How Large is the Labor Force in Ortonville?
There are 926 People in the Labor Forcein in Ortonville.
What is the Percentage of People in the Labor Force in Ortonville?
53.6% of People are in the Labor Force in Ortonville.
What is the Unemployment Rate in Ortonville?
Unemployment Rate in Ortonville is 2.7%.