Orr, MN Map & Demographics
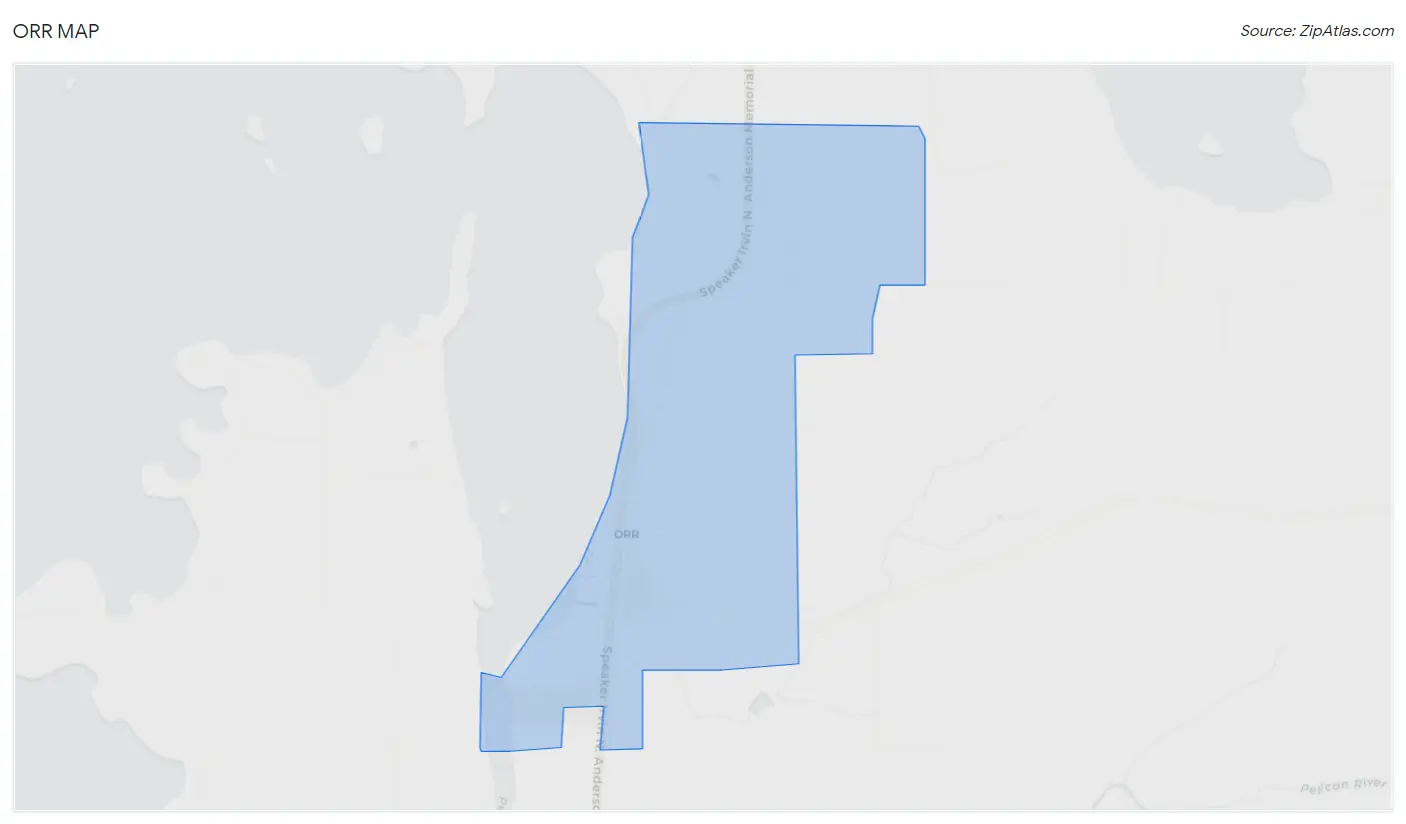
Orr Map
Orr Overview
$25,764
PER CAPITA INCOME
$77,188
AVG HOUSEHOLD INCOME
0.28
INEQUALITY / GINI INDEX
393
TOTAL POPULATION
194
MALE POPULATION
199
FEMALE POPULATION
97.49
MALES / 100 FEMALES
102.58
FEMALES / 100 MALES
25.7
MEDIAN AGE
2.7
AVG FAMILY SIZE
3.4
AVG HOUSEHOLD SIZE
243
LABOR FORCE [ PEOPLE ]
80.5%
PERCENT IN LABOR FORCE
Orr Zip Codes
Orr Area Codes
Income in Orr
Income Overview in Orr
| Characteristic | Number | Measure |
| Per Capita Income | 393 | $25,764 |
| Median Family Income | 79 | $0 |
| Mean Family Income | 79 | $60,620 |
| Median Household Income | 115 | $77,188 |
| Mean Household Income | 115 | $77,463 |
| Income Deficit | 79 | $0 |
| Wage / Income Gap (%) | 393 | 0.00% |
| Wage / Income Gap ($) | 393 | 100.00¢ per $1 |
| Gini / Inequality Index | 393 | 0.28 |
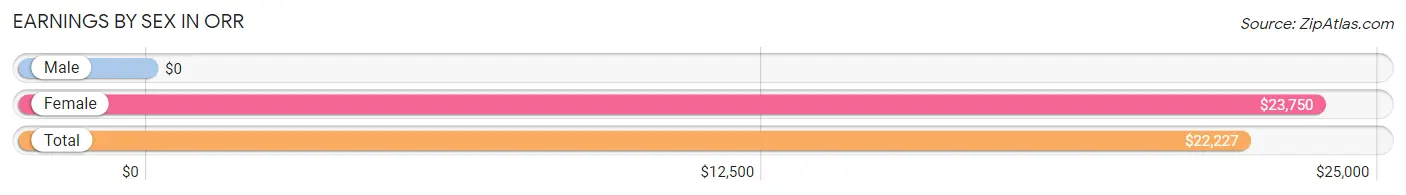
Earnings by Sex in Orr
| Sex | Number | Average Earnings |
| Male | 108 (43.5%) | $0 |
| Female | 140 (56.5%) | $23,750 |
| Total | 248 (100.0%) | $22,227 |
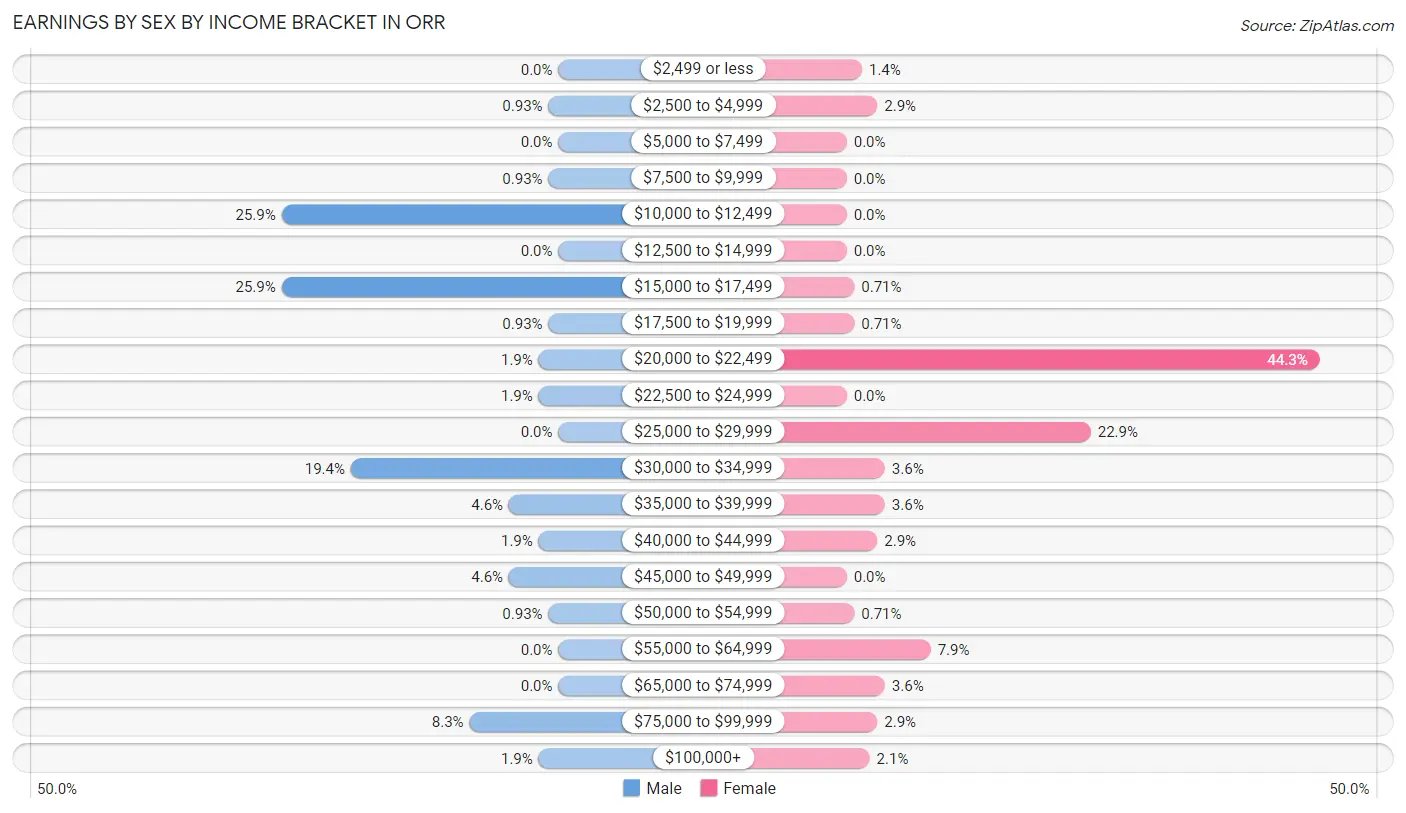
Earnings by Sex by Income Bracket in Orr
The most common earnings brackets in Orr are $10,000 to $12,499 for men (28 | 25.9%) and $20,000 to $22,499 for women (62 | 44.3%).
| Income | Male | Female |
| $2,499 or less | 0 (0.0%) | 2 (1.4%) |
| $2,500 to $4,999 | 1 (0.9%) | 4 (2.9%) |
| $5,000 to $7,499 | 0 (0.0%) | 0 (0.0%) |
| $7,500 to $9,999 | 1 (0.9%) | 0 (0.0%) |
| $10,000 to $12,499 | 28 (25.9%) | 0 (0.0%) |
| $12,500 to $14,999 | 0 (0.0%) | 0 (0.0%) |
| $15,000 to $17,499 | 28 (25.9%) | 1 (0.7%) |
| $17,500 to $19,999 | 1 (0.9%) | 1 (0.7%) |
| $20,000 to $22,499 | 2 (1.8%) | 62 (44.3%) |
| $22,500 to $24,999 | 2 (1.8%) | 0 (0.0%) |
| $25,000 to $29,999 | 0 (0.0%) | 32 (22.9%) |
| $30,000 to $34,999 | 21 (19.4%) | 5 (3.6%) |
| $35,000 to $39,999 | 5 (4.6%) | 5 (3.6%) |
| $40,000 to $44,999 | 2 (1.8%) | 4 (2.9%) |
| $45,000 to $49,999 | 5 (4.6%) | 0 (0.0%) |
| $50,000 to $54,999 | 1 (0.9%) | 1 (0.7%) |
| $55,000 to $64,999 | 0 (0.0%) | 11 (7.9%) |
| $65,000 to $74,999 | 0 (0.0%) | 5 (3.6%) |
| $75,000 to $99,999 | 9 (8.3%) | 4 (2.9%) |
| $100,000+ | 2 (1.8%) | 3 (2.1%) |
| Total | 108 (100.0%) | 140 (100.0%) |
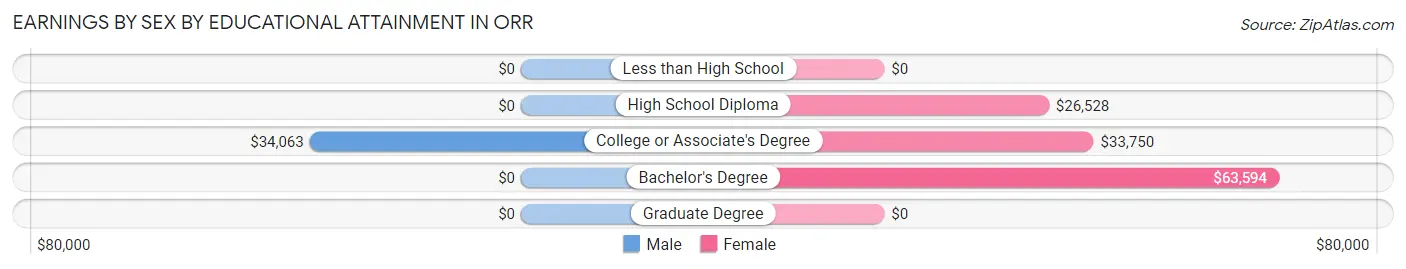
Earnings by Sex by Educational Attainment in Orr
Average earnings in Orr are $31,042 for men and $27,500 for women, a difference of 11.4%. Men with an educational attainment of college or associate's degree enjoy the highest average annual earnings of $34,063, while those with college or associate's degree education earn the least with $34,063. Women with an educational attainment of bachelor's degree earn the most with the average annual earnings of $63,594, while those with high school diploma education have the smallest earnings of $26,528.
| Educational Attainment | Male Income | Female Income |
| Less than High School | - | - |
| High School Diploma | - | - |
| College or Associate's Degree | $34,063 | $33,750 |
| Bachelor's Degree | - | - |
| Graduate Degree | - | - |
| Total | $31,042 | $27,500 |
Family Income in Orr
Family Income Brackets in Orr
According to the Orr family income data, there are 34 families falling into the $25,000 to $34,999 income range, which is the most common income bracket and makes up 43.0% of all families.
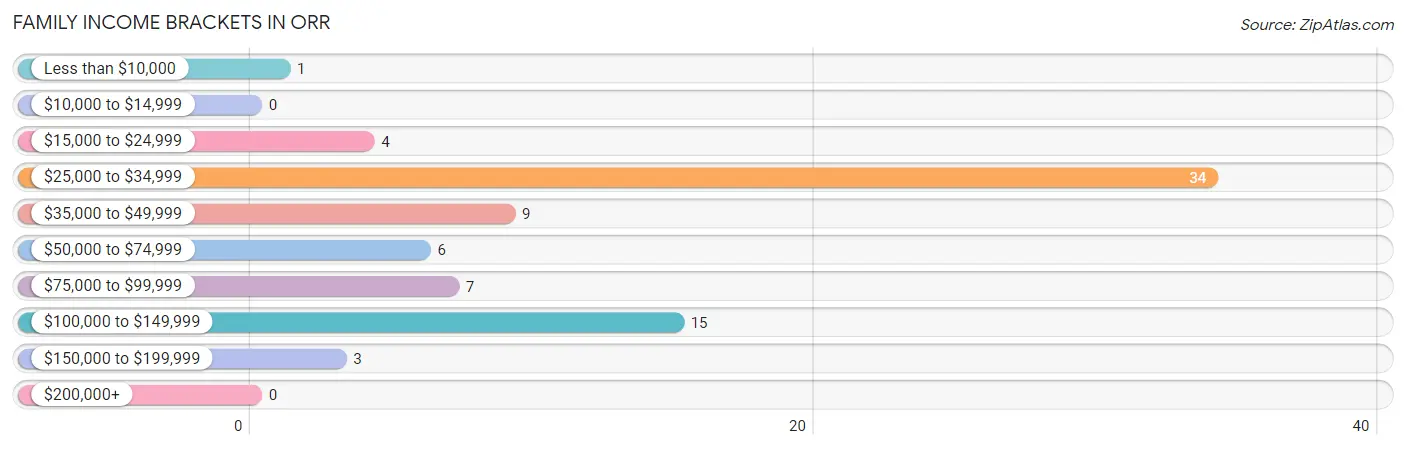
| Income Bracket | # Families | % Families |
| Less than $10,000 | 1 | 1.3% |
| $10,000 to $14,999 | 0 | 0.0% |
| $15,000 to $24,999 | 4 | 5.1% |
| $25,000 to $34,999 | 34 | 43.0% |
| $35,000 to $49,999 | 9 | 11.4% |
| $50,000 to $74,999 | 6 | 7.6% |
| $75,000 to $99,999 | 7 | 8.9% |
| $100,000 to $149,999 | 15 | 19.0% |
| $150,000 to $199,999 | 3 | 3.8% |
| $200,000+ | 0 | 0.0% |
Family Income by Famaliy Size in Orr
4-person families (12 | 15.2%) account for the highest median family income in Orr with $111,250 per family, while 4-person families (12 | 15.2%) have the highest median income of $27,812 per family member.
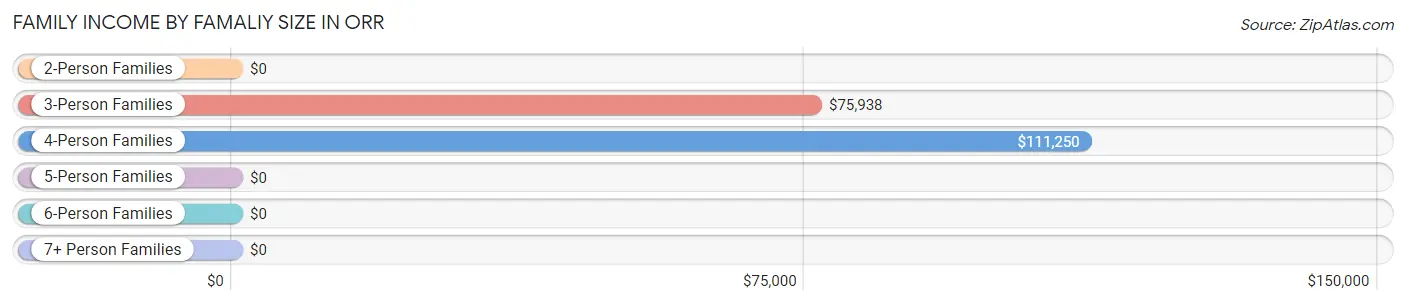
| Income Bracket | # Families | Median Income |
| 2-Person Families | 57 (72.2%) | $0 |
| 3-Person Families | 9 (11.4%) | $75,938 |
| 4-Person Families | 12 (15.2%) | $111,250 |
| 5-Person Families | 0 (0.0%) | $0 |
| 6-Person Families | 0 (0.0%) | $0 |
| 7+ Person Families | 1 (1.3%) | $0 |
| Total | 79 (100.0%) | $0 |
Family Income by Number of Earners in Orr
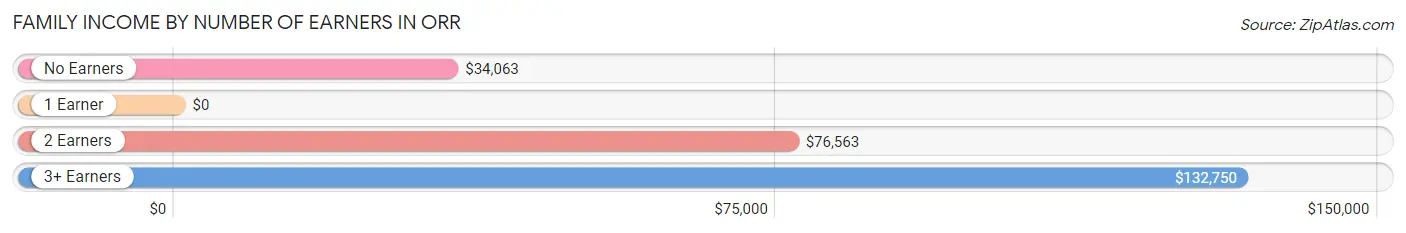
| Number of Earners | # Families | Median Income |
| No Earners | 7 (8.9%) | $34,063 |
| 1 Earner | 48 (60.8%) | $0 |
| 2 Earners | 15 (19.0%) | $76,563 |
| 3+ Earners | 9 (11.4%) | $132,750 |
| Total | 79 (100.0%) | $0 |
Household Income in Orr
Household Income Brackets in Orr
With 38 households falling in the category, the $75,000 to $99,999 income range is the most frequent in Orr, accounting for 33.0% of all households. In contrast, only 1 households (0.9%) fall into the less than $10,000 income bracket, making it the least populous group.
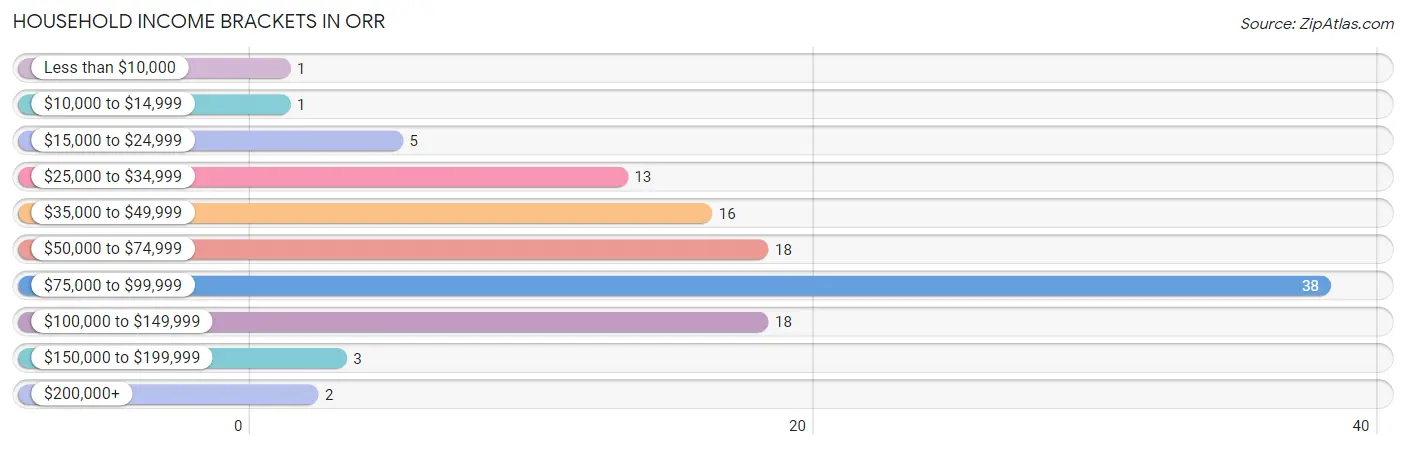
| Income Bracket | # Households | % Households |
| Less than $10,000 | 1 | 0.9% |
| $10,000 to $14,999 | 1 | 0.9% |
| $15,000 to $24,999 | 5 | 4.3% |
| $25,000 to $34,999 | 13 | 11.3% |
| $35,000 to $49,999 | 16 | 13.9% |
| $50,000 to $74,999 | 18 | 15.7% |
| $75,000 to $99,999 | 38 | 33.0% |
| $100,000 to $149,999 | 18 | 15.7% |
| $150,000 to $199,999 | 3 | 2.6% |
| $200,000+ | 2 | 1.7% |
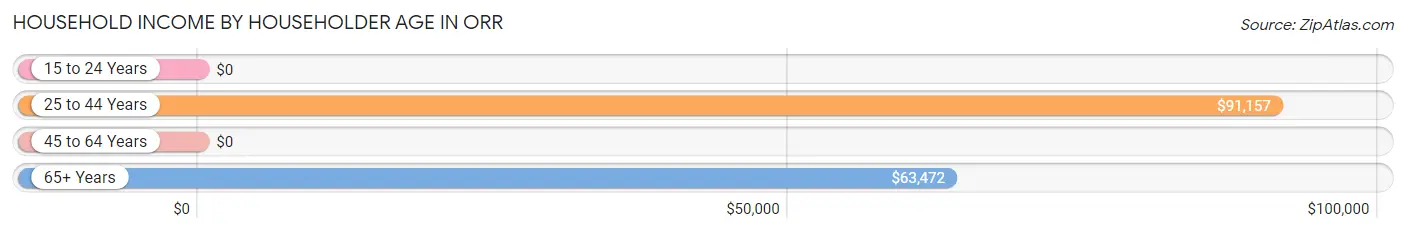
Household Income by Householder Age in Orr
The median household income in Orr is $77,188, with the highest median household income of $91,157 found in the 25 to 44 years age bracket for the primary householder. A total of 45 households (39.1%) fall into this category.
| Income Bracket | # Households | Median Income |
| 15 to 24 Years | 0 (0.0%) | $0 |
| 25 to 44 Years | 45 (39.1%) | $91,157 |
| 45 to 64 Years | 39 (33.9%) | $0 |
| 65+ Years | 31 (27.0%) | $63,472 |
| Total | 115 (100.0%) | $77,188 |
Poverty in Orr
Income Below Poverty by Sex and Age in Orr
With 18.8% poverty level for males and 18.3% for females among the residents of Orr, 6 to 11 year old males and under 5 year old females are the most vulnerable to poverty, with 6 males (100.0%) and 2 females (100.0%) in their respective age groups living below the poverty level.
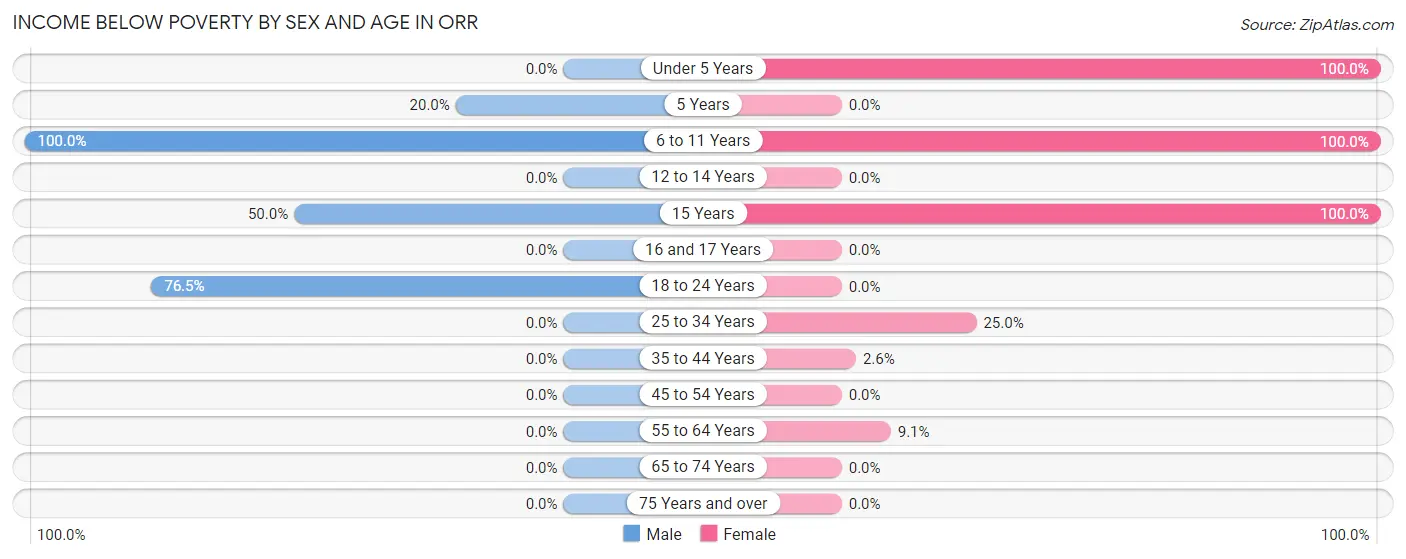
| Age Bracket | Male | Female |
| Under 5 Years | 0 (0.0%) | 2 (100.0%) |
| 5 Years | 2 (20.0%) | 0 (0.0%) |
| 6 to 11 Years | 6 (100.0%) | 3 (100.0%) |
| 12 to 14 Years | 0 (0.0%) | 0 (0.0%) |
| 15 Years | 2 (50.0%) | 27 (100.0%) |
| 16 and 17 Years | 0 (0.0%) | 0 (0.0%) |
| 18 to 24 Years | 26 (76.5%) | 0 (0.0%) |
| 25 to 34 Years | 0 (0.0%) | 2 (25.0%) |
| 35 to 44 Years | 0 (0.0%) | 1 (2.6%) |
| 45 to 54 Years | 0 (0.0%) | 0 (0.0%) |
| 55 to 64 Years | 0 (0.0%) | 1 (9.1%) |
| 65 to 74 Years | 0 (0.0%) | 0 (0.0%) |
| 75 Years and over | 0 (0.0%) | 0 (0.0%) |
| Total | 36 (18.8%) | 36 (18.3%) |
Income Above Poverty by Sex and Age in Orr
According to the poverty statistics in Orr, males aged 12 to 14 years and females aged 5 years are the age groups that are most secure financially, with 100.0% of males and 100.0% of females in these age groups living above the poverty line.
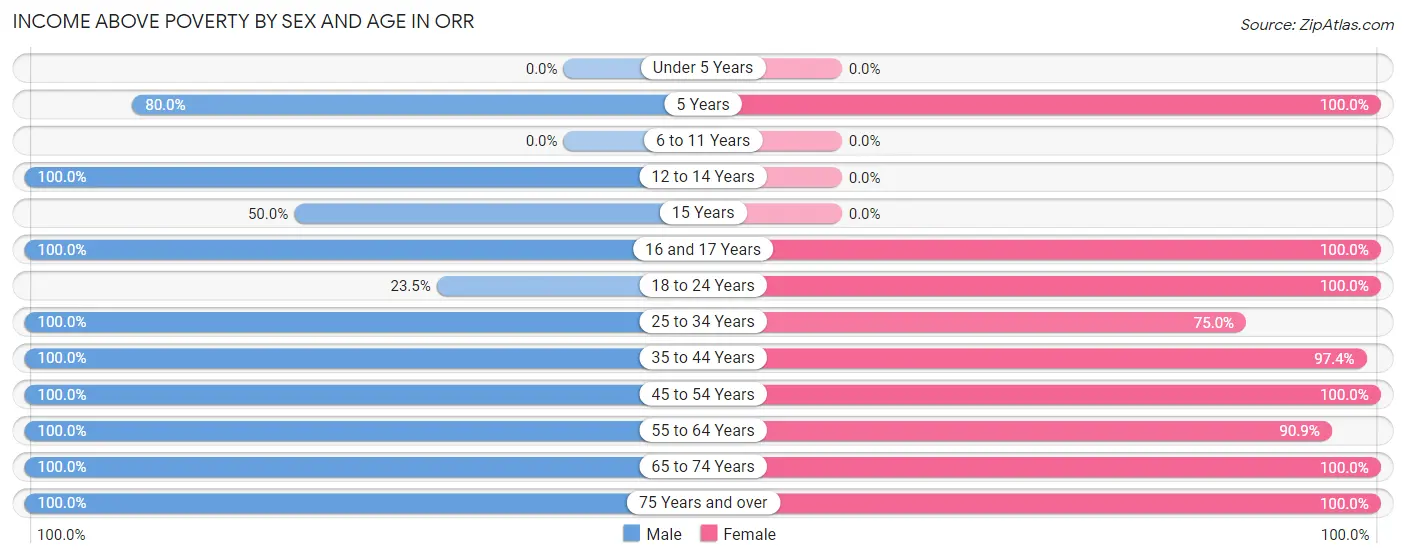
| Age Bracket | Male | Female |
| Under 5 Years | 0 (0.0%) | 0 (0.0%) |
| 5 Years | 8 (80.0%) | 6 (100.0%) |
| 6 to 11 Years | 0 (0.0%) | 0 (0.0%) |
| 12 to 14 Years | 31 (100.0%) | 0 (0.0%) |
| 15 Years | 2 (50.0%) | 0 (0.0%) |
| 16 and 17 Years | 5 (100.0%) | 3 (100.0%) |
| 18 to 24 Years | 8 (23.5%) | 58 (100.0%) |
| 25 to 34 Years | 10 (100.0%) | 6 (75.0%) |
| 35 to 44 Years | 40 (100.0%) | 37 (97.4%) |
| 45 to 54 Years | 17 (100.0%) | 16 (100.0%) |
| 55 to 64 Years | 14 (100.0%) | 10 (90.9%) |
| 65 to 74 Years | 11 (100.0%) | 17 (100.0%) |
| 75 Years and over | 10 (100.0%) | 8 (100.0%) |
| Total | 156 (81.2%) | 161 (81.7%) |
Income Below Poverty Among Married-Couple Families in Orr
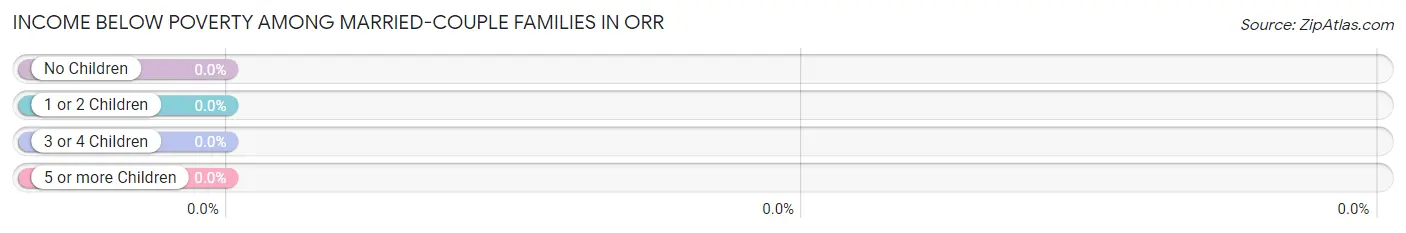
| Children | Above Poverty | Below Poverty |
| No Children | 22 (100.0%) | 0 (0.0%) |
| 1 or 2 Children | 18 (100.0%) | 0 (0.0%) |
| 3 or 4 Children | 0 (0.0%) | 0 (0.0%) |
| 5 or more Children | 0 (0.0%) | 0 (0.0%) |
| Total | 40 (100.0%) | 0 (0.0%) |
Income Below Poverty Among Single-Parent Households in Orr
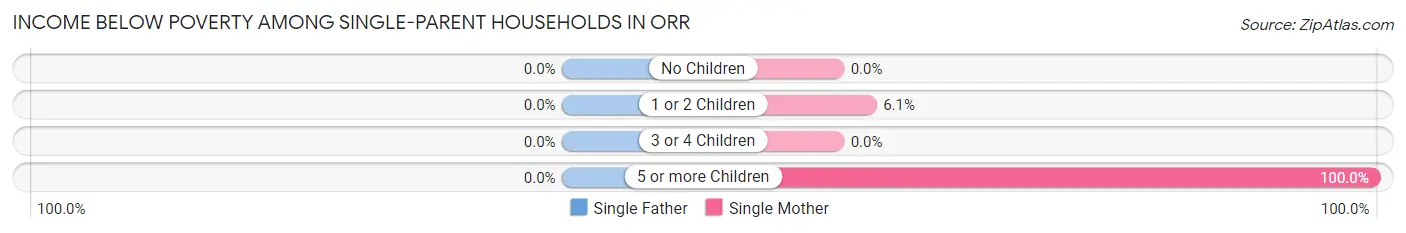
| Children | Single Father | Single Mother |
| No Children | 0 (0.0%) | 0 (0.0%) |
| 1 or 2 Children | 0 (0.0%) | 2 (6.1%) |
| 3 or 4 Children | 0 (0.0%) | 0 (0.0%) |
| 5 or more Children | 0 (0.0%) | 1 (100.0%) |
| Total | 0 (0.0%) | 3 (7.9%) |
Income Below Poverty Among Married-Couple vs Single-Parent Households in Orr
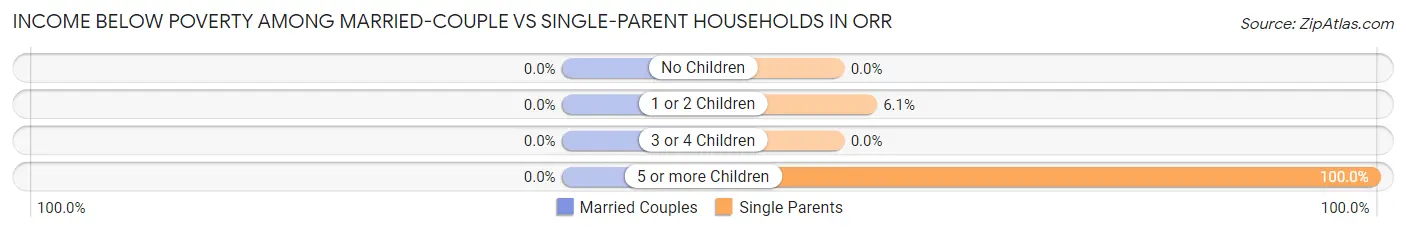
| Children | Married-Couple Families | Single-Parent Households |
| No Children | 0 (0.0%) | 0 (0.0%) |
| 1 or 2 Children | 0 (0.0%) | 2 (6.1%) |
| 3 or 4 Children | 0 (0.0%) | 0 (0.0%) |
| 5 or more Children | 0 (0.0%) | 1 (100.0%) |
| Total | 0 (0.0%) | 3 (7.7%) |
Race in Orr
The most populous races in Orr are White / Caucasian (316 | 80.4%), Two or more Races (51 | 13.0%), and Hispanic or Latino (20 | 5.1%).
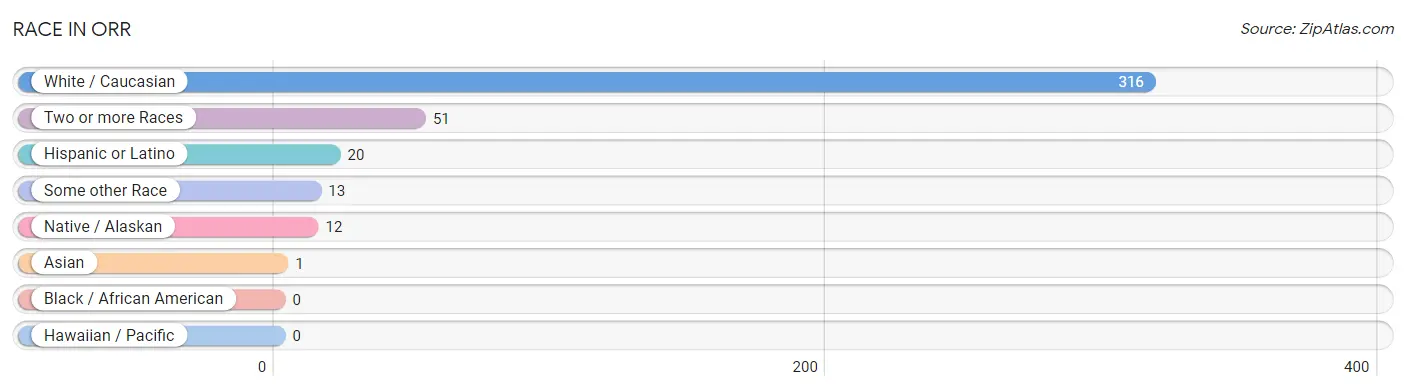
| Race | # Population | % Population |
| Asian | 1 | 0.3% |
| Black / African American | 0 | 0.0% |
| Hawaiian / Pacific | 0 | 0.0% |
| Hispanic or Latino | 20 | 5.1% |
| Native / Alaskan | 12 | 3.0% |
| White / Caucasian | 316 | 80.4% |
| Two or more Races | 51 | 13.0% |
| Some other Race | 13 | 3.3% |
| Total | 393 | 100.0% |
Ancestry in Orr
The most populous ancestries reported in Orr are German (234 | 59.5%), Swedish (159 | 40.5%), Irish (69 | 17.6%), Norwegian (38 | 9.7%), and Finnish (31 | 7.9%), together accounting for 135.1% of all Orr residents.
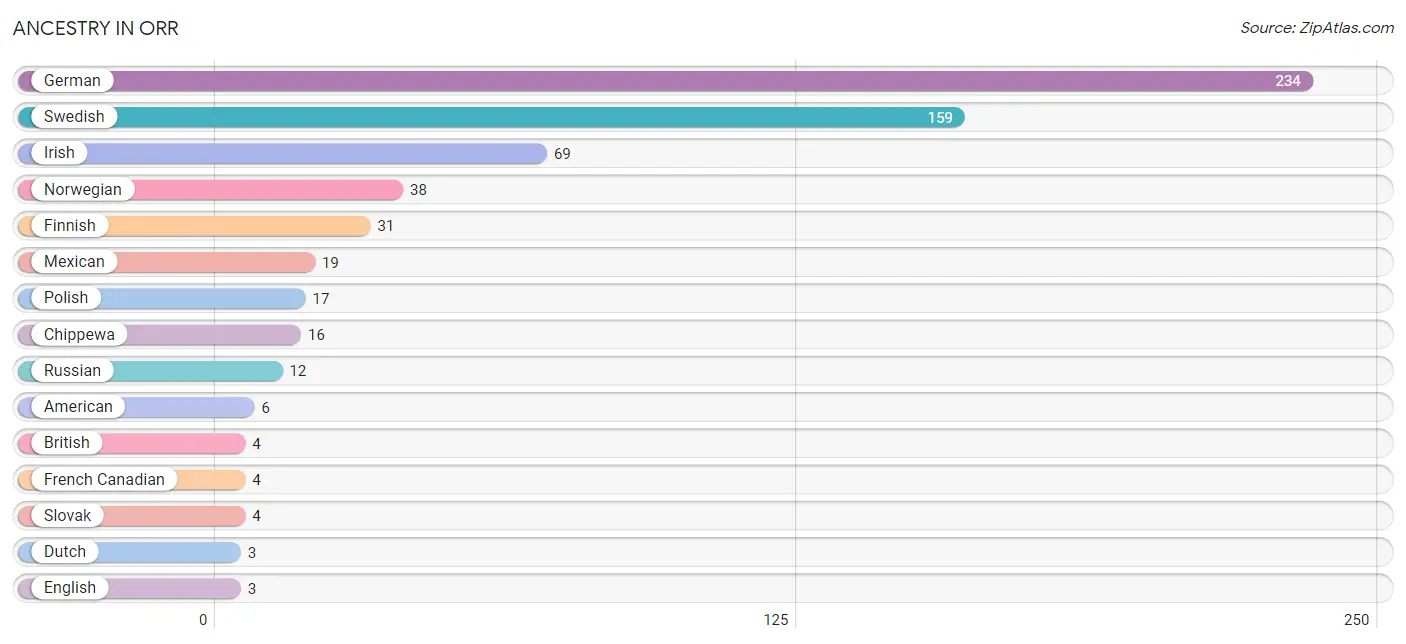
| Ancestry | # Population | % Population |
| American | 6 | 1.5% |
| British | 4 | 1.0% |
| Burmese | 1 | 0.3% |
| Cherokee | 1 | 0.3% |
| Chippewa | 16 | 4.1% |
| Czech | 2 | 0.5% |
| Danish | 1 | 0.3% |
| Delaware | 1 | 0.3% |
| Dutch | 3 | 0.8% |
| English | 3 | 0.8% |
| Finnish | 31 | 7.9% |
| French | 3 | 0.8% |
| French Canadian | 4 | 1.0% |
| German | 234 | 59.5% |
| Irish | 69 | 17.6% |
| Mexican | 19 | 4.8% |
| Norwegian | 38 | 9.7% |
| Polish | 17 | 4.3% |
| Russian | 12 | 3.0% |
| Scandinavian | 2 | 0.5% |
| Scottish | 1 | 0.3% |
| Slovak | 4 | 1.0% |
| Slovene | 1 | 0.3% |
| Spaniard | 1 | 0.3% |
| Swedish | 159 | 40.5% |
| Ukrainian | 1 | 0.3% | View All 26 Rows |
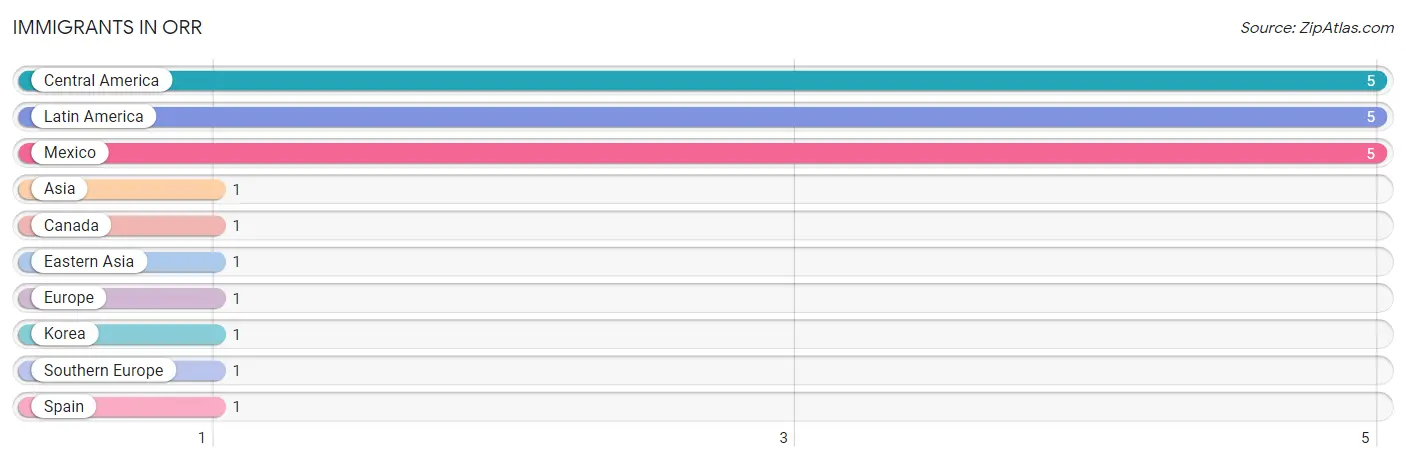
Immigrants in Orr
The most numerous immigrant groups reported in Orr came from Central America (5 | 1.3%), Latin America (5 | 1.3%), Mexico (5 | 1.3%), Asia (1 | 0.3%), and Canada (1 | 0.3%), together accounting for 4.3% of all Orr residents.
| Immigration Origin | # Population | % Population |
| Asia | 1 | 0.3% |
| Canada | 1 | 0.3% |
| Central America | 5 | 1.3% |
| Eastern Asia | 1 | 0.3% |
| Europe | 1 | 0.3% |
| Korea | 1 | 0.3% |
| Latin America | 5 | 1.3% |
| Mexico | 5 | 1.3% |
| Southern Europe | 1 | 0.3% |
| Spain | 1 | 0.3% | View All 10 Rows |
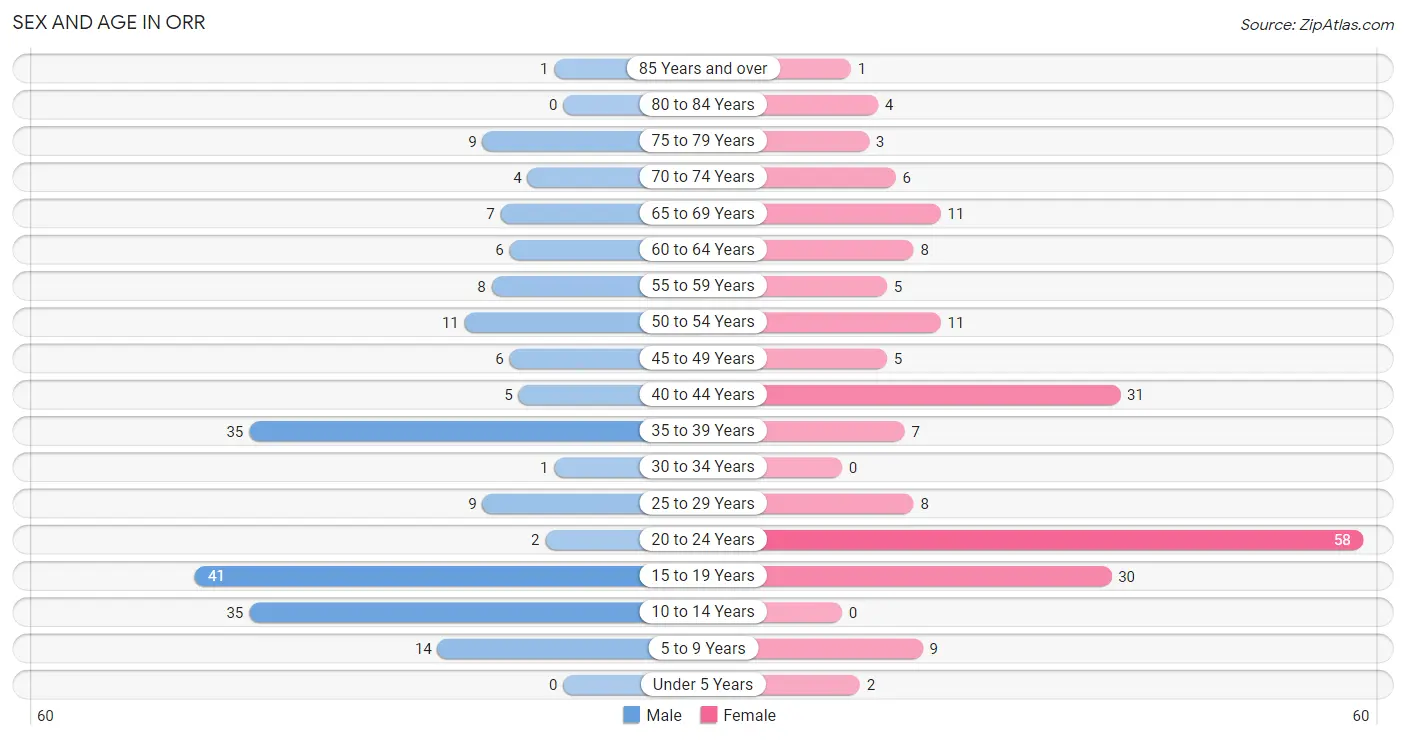
Sex and Age in Orr
Sex and Age in Orr
The most populous age groups in Orr are 15 to 19 Years (41 | 21.1%) for men and 20 to 24 Years (58 | 29.1%) for women.
| Age Bracket | Male | Female |
| Under 5 Years | 0 (0.0%) | 2 (1.0%) |
| 5 to 9 Years | 14 (7.2%) | 9 (4.5%) |
| 10 to 14 Years | 35 (18.0%) | 0 (0.0%) |
| 15 to 19 Years | 41 (21.1%) | 30 (15.1%) |
| 20 to 24 Years | 2 (1.0%) | 58 (29.1%) |
| 25 to 29 Years | 9 (4.6%) | 8 (4.0%) |
| 30 to 34 Years | 1 (0.5%) | 0 (0.0%) |
| 35 to 39 Years | 35 (18.0%) | 7 (3.5%) |
| 40 to 44 Years | 5 (2.6%) | 31 (15.6%) |
| 45 to 49 Years | 6 (3.1%) | 5 (2.5%) |
| 50 to 54 Years | 11 (5.7%) | 11 (5.5%) |
| 55 to 59 Years | 8 (4.1%) | 5 (2.5%) |
| 60 to 64 Years | 6 (3.1%) | 8 (4.0%) |
| 65 to 69 Years | 7 (3.6%) | 11 (5.5%) |
| 70 to 74 Years | 4 (2.1%) | 6 (3.0%) |
| 75 to 79 Years | 9 (4.6%) | 3 (1.5%) |
| 80 to 84 Years | 0 (0.0%) | 4 (2.0%) |
| 85 Years and over | 1 (0.5%) | 1 (0.5%) |
| Total | 194 (100.0%) | 199 (100.0%) |
Families and Households in Orr
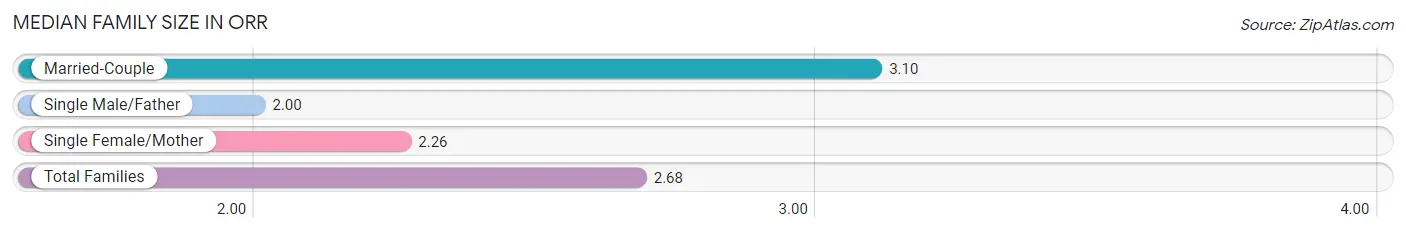
Median Family Size in Orr
The median family size in Orr is 2.68 persons per family, with married-couple families (40 | 50.6%) accounting for the largest median family size of 3.1 persons per family. On the other hand, single male/father families (1 | 1.3%) represent the smallest median family size with 2.00 persons per family.
| Family Type | # Families | Family Size |
| Married-Couple | 40 (50.6%) | 3.10 |
| Single Male/Father | 1 (1.3%) | 2.00 |
| Single Female/Mother | 38 (48.1%) | 2.26 |
| Total Families | 79 (100.0%) | 2.68 |
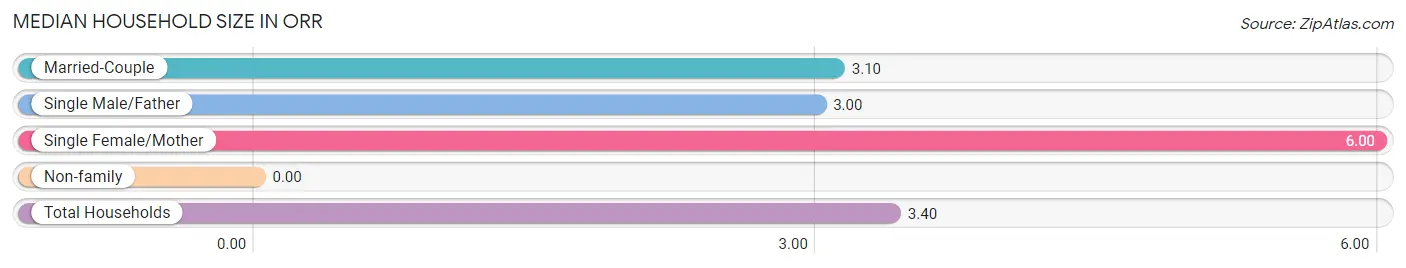
Median Household Size in Orr
| Household Type | # Households | Household Size |
| Married-Couple | 40 (34.8%) | 3.10 |
| Single Male/Father | 1 (0.9%) | 3.00 |
| Single Female/Mother | 38 (33.0%) | 6.00 |
| Non-family | 36 (31.3%) | - |
| Total Households | 115 (100.0%) | 3.40 |
Household Size by Marriage Status in Orr
Out of a total of 115 households in Orr, 79 (68.7%) are family households, while 36 (31.3%) are nonfamily households. The most numerous type of family households are 2-person households, comprising 27, and the most common type of nonfamily households are 1-person households, comprising 36.
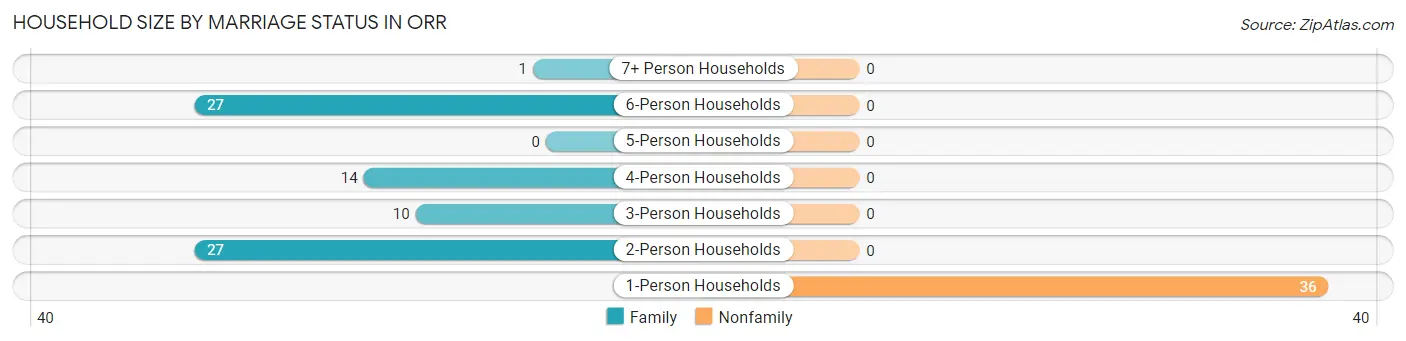
| Household Size | Family Households | Nonfamily Households |
| 1-Person Households | - | 36 (31.3%) |
| 2-Person Households | 27 (23.5%) | 0 (0.0%) |
| 3-Person Households | 10 (8.7%) | 0 (0.0%) |
| 4-Person Households | 14 (12.2%) | 0 (0.0%) |
| 5-Person Households | 0 (0.0%) | 0 (0.0%) |
| 6-Person Households | 27 (23.5%) | 0 (0.0%) |
| 7+ Person Households | 1 (0.9%) | 0 (0.0%) |
| Total | 79 (68.7%) | 36 (31.3%) |
Female Fertility in Orr
Fertility by Age in Orr
| Age Bracket | Women with Births | Births / 1,000 Women |
| 15 to 19 years | 0 (0.0%) | 0.0 |
| 20 to 34 years | 0 (0.0%) | 0.0 |
| 35 to 50 years | 0 (0.0%) | 0.0 |
| Total | 0 (0.0%) | 0.0 |
Fertility by Age by Marriage Status in Orr
| Age Bracket | Married | Unmarried |
| 15 to 19 years | 0 (0.0%) | 0 (0.0%) |
| 20 to 34 years | 0 (0.0%) | 0 (0.0%) |
| 35 to 50 years | 0 (0.0%) | 0 (0.0%) |
| Total | 0 (0.0%) | 0 (0.0%) |
Fertility by Education in Orr
| Educational Attainment | Women with Births | Births / 1,000 Women |
| Less than High School | 0 (0.0%) | 0.0 |
| High School Diploma | 0 (0.0%) | 0.0 |
| College or Associate's Degree | 0 (0.0%) | 0.0 |
| Bachelor's Degree | 0 (0.0%) | 0.0 |
| Graduate Degree | 0 (0.0%) | 0.0 |
| Total | 0 (0.0%) | 0.0 |
Fertility by Education by Marriage Status in Orr
| Educational Attainment | Married | Unmarried |
| Less than High School | 0 (0.0%) | 0 (0.0%) |
| High School Diploma | 0 (0.0%) | 0 (0.0%) |
| College or Associate's Degree | 0 (0.0%) | 0 (0.0%) |
| Bachelor's Degree | 0 (0.0%) | 0 (0.0%) |
| Graduate Degree | 0 (0.0%) | 0 (0.0%) |
| Total | 0 (0.0%) | 0 (0.0%) |
Employment Characteristics in Orr
Employment by Class of Employer in Orr
Among the 184 employed individuals in Orr, private company employees (93 | 50.5%), local government employees (44 | 23.9%), and self-employed (not incorporated) (19 | 10.3%) make up the most common classes of employment.
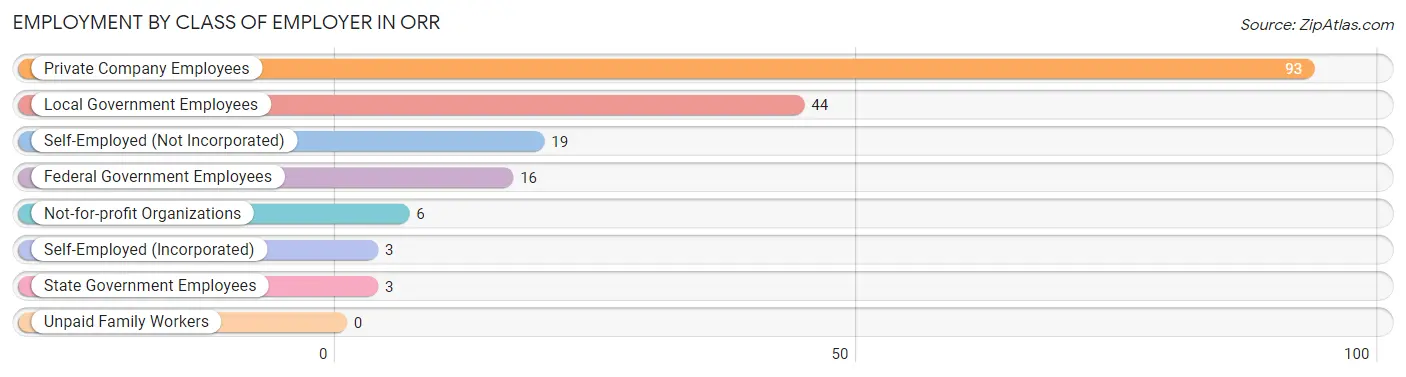
| Employer Class | # Employees | % Employees |
| Private Company Employees | 93 | 50.5% |
| Self-Employed (Incorporated) | 3 | 1.6% |
| Self-Employed (Not Incorporated) | 19 | 10.3% |
| Not-for-profit Organizations | 6 | 3.3% |
| Local Government Employees | 44 | 23.9% |
| State Government Employees | 3 | 1.6% |
| Federal Government Employees | 16 | 8.7% |
| Unpaid Family Workers | 0 | 0.0% |
| Total | 184 | 100.0% |
Employment Status by Age in Orr
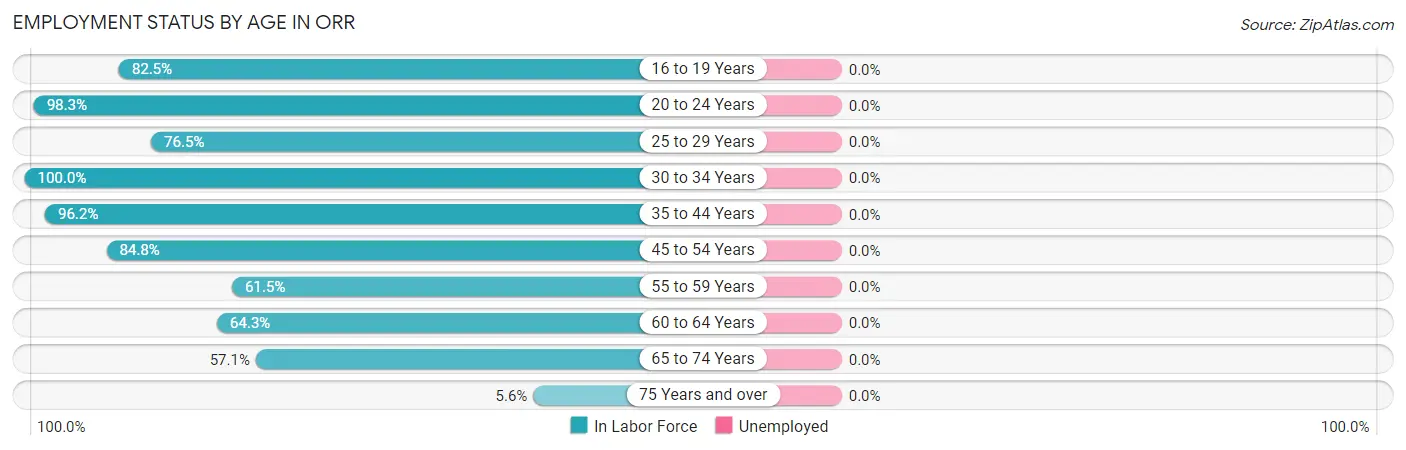
| Age Bracket | In Labor Force | Unemployed |
| 16 to 19 Years | 33 (82.5%) | 0 (0.0%) |
| 20 to 24 Years | 59 (98.3%) | 0 (0.0%) |
| 25 to 29 Years | 13 (76.5%) | 0 (0.0%) |
| 30 to 34 Years | 1 (100.0%) | 0 (0.0%) |
| 35 to 44 Years | 75 (96.2%) | 0 (0.0%) |
| 45 to 54 Years | 28 (84.8%) | 0 (0.0%) |
| 55 to 59 Years | 8 (61.5%) | 0 (0.0%) |
| 60 to 64 Years | 9 (64.3%) | 0 (0.0%) |
| 65 to 74 Years | 16 (57.1%) | 0 (0.0%) |
| 75 Years and over | 1 (5.6%) | 0 (0.0%) |
| Total | 243 (80.5%) | 0 (0.0%) |
Employment Status by Educational Attainment in Orr
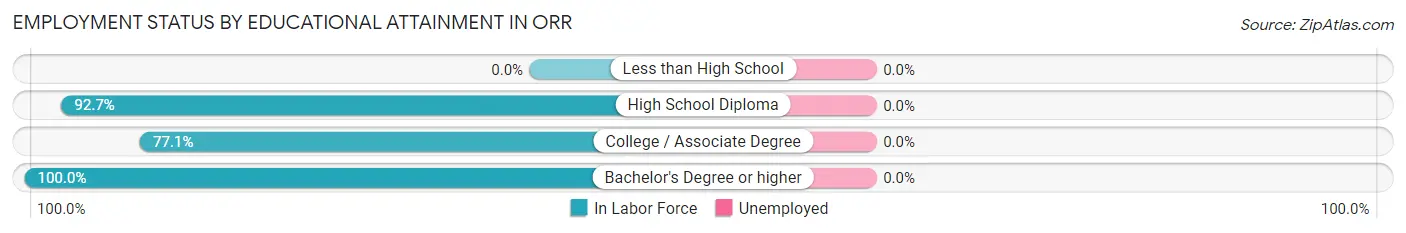
| Educational Attainment | In Labor Force | Unemployed |
| Less than High School | 0 (0.0%) | 0 (0.0%) |
| High School Diploma | 89 (92.7%) | 0 (0.0%) |
| College / Associate Degree | 27 (77.1%) | 0 (0.0%) |
| Bachelor's Degree or higher | 18 (100.0%) | 0 (0.0%) |
| Total | 134 (85.9%) | 0 (0.0%) |
Employment Occupations by Sex in Orr
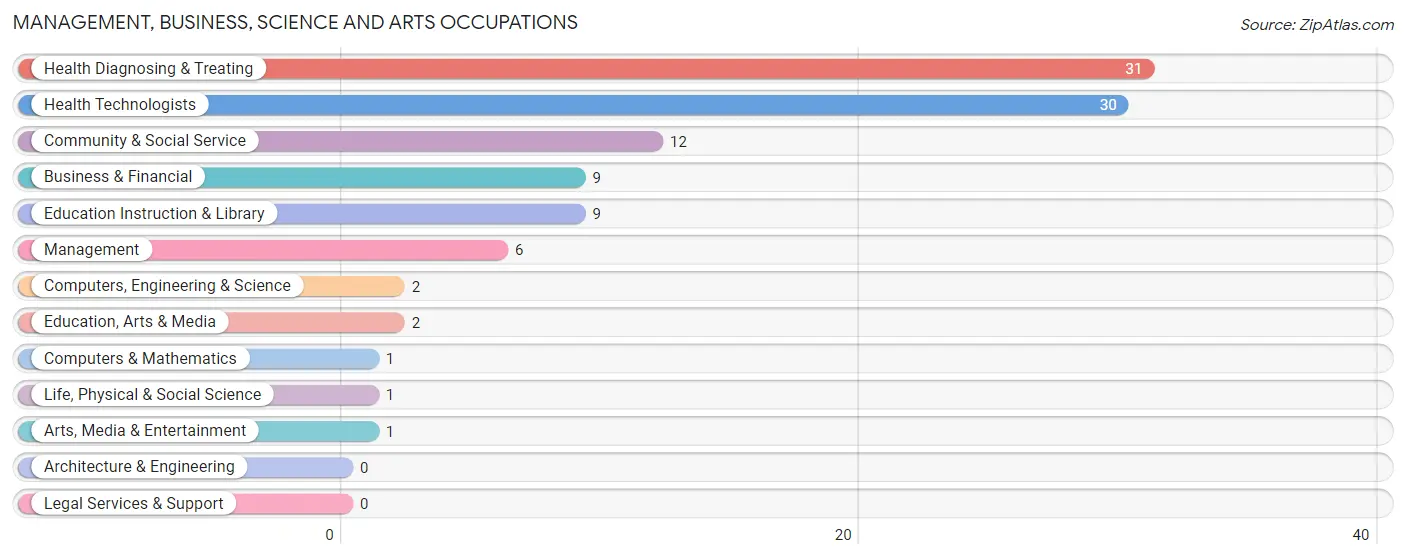
Management, Business, Science and Arts Occupations
The most common Management, Business, Science and Arts occupations in Orr are Health Diagnosing & Treating (31 | 12.8%), Health Technologists (30 | 12.3%), Community & Social Service (12 | 4.9%), Business & Financial (9 | 3.7%), and Education Instruction & Library (9 | 3.7%).
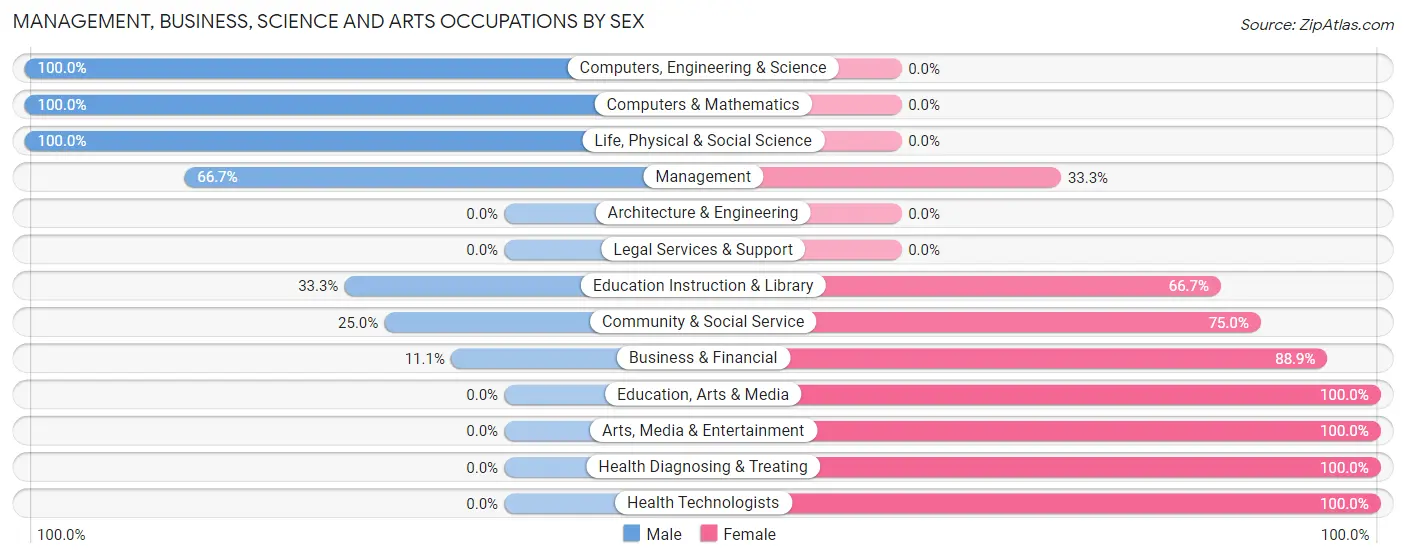
Management, Business, Science and Arts Occupations by Sex
Within the Management, Business, Science and Arts occupations in Orr, the most male-oriented occupations are Computers, Engineering & Science (100.0%), Computers & Mathematics (100.0%), and Life, Physical & Social Science (100.0%), while the most female-oriented occupations are Education, Arts & Media (100.0%), Arts, Media & Entertainment (100.0%), and Health Diagnosing & Treating (100.0%).
| Occupation | Male | Female |
| Management | 4 (66.7%) | 2 (33.3%) |
| Business & Financial | 1 (11.1%) | 8 (88.9%) |
| Computers, Engineering & Science | 2 (100.0%) | 0 (0.0%) |
| Computers & Mathematics | 1 (100.0%) | 0 (0.0%) |
| Architecture & Engineering | 0 (0.0%) | 0 (0.0%) |
| Life, Physical & Social Science | 1 (100.0%) | 0 (0.0%) |
| Community & Social Service | 3 (25.0%) | 9 (75.0%) |
| Education, Arts & Media | 0 (0.0%) | 2 (100.0%) |
| Legal Services & Support | 0 (0.0%) | 0 (0.0%) |
| Education Instruction & Library | 3 (33.3%) | 6 (66.7%) |
| Arts, Media & Entertainment | 0 (0.0%) | 1 (100.0%) |
| Health Diagnosing & Treating | 0 (0.0%) | 31 (100.0%) |
| Health Technologists | 0 (0.0%) | 30 (100.0%) |
| Total (Category) | 10 (16.7%) | 50 (83.3%) |
| Total (Overall) | 107 (44.0%) | 136 (56.0%) |
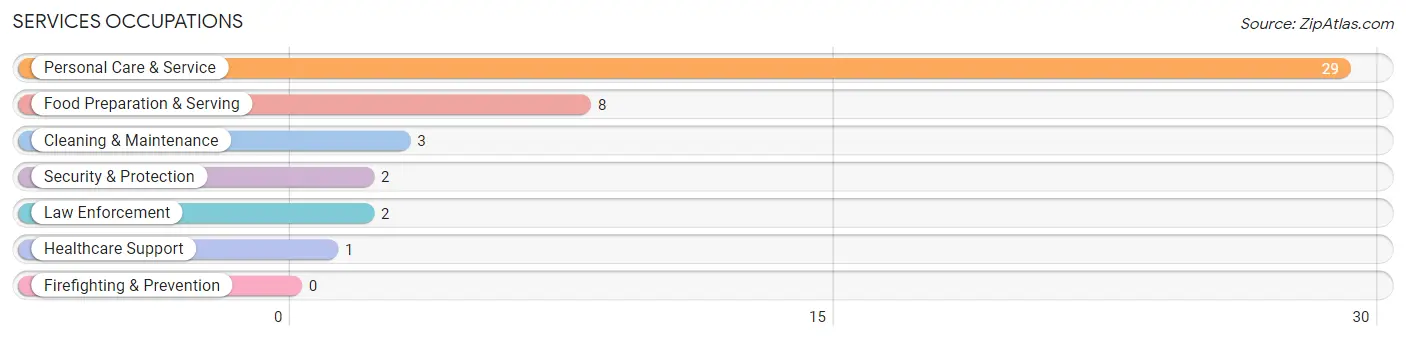
Services Occupations
The most common Services occupations in Orr are Personal Care & Service (29 | 11.9%), Food Preparation & Serving (8 | 3.3%), Cleaning & Maintenance (3 | 1.2%), Security & Protection (2 | 0.8%), and Law Enforcement (2 | 0.8%).
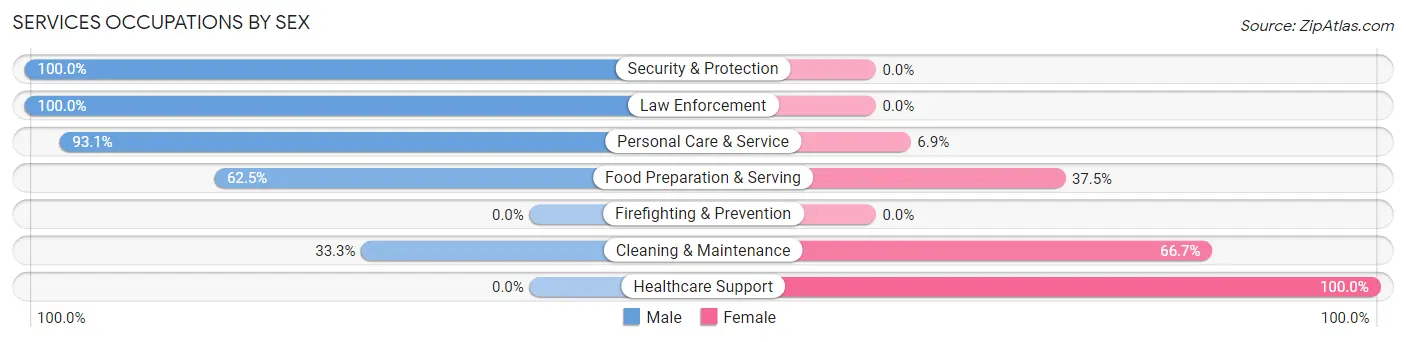
Services Occupations by Sex
Within the Services occupations in Orr, the most male-oriented occupations are Security & Protection (100.0%), Law Enforcement (100.0%), and Personal Care & Service (93.1%), while the most female-oriented occupations are Healthcare Support (100.0%), Cleaning & Maintenance (66.7%), and Food Preparation & Serving (37.5%).
| Occupation | Male | Female |
| Healthcare Support | 0 (0.0%) | 1 (100.0%) |
| Security & Protection | 2 (100.0%) | 0 (0.0%) |
| Firefighting & Prevention | 0 (0.0%) | 0 (0.0%) |
| Law Enforcement | 2 (100.0%) | 0 (0.0%) |
| Food Preparation & Serving | 5 (62.5%) | 3 (37.5%) |
| Cleaning & Maintenance | 1 (33.3%) | 2 (66.7%) |
| Personal Care & Service | 27 (93.1%) | 2 (6.9%) |
| Total (Category) | 35 (81.4%) | 8 (18.6%) |
| Total (Overall) | 107 (44.0%) | 136 (56.0%) |
Sales and Office Occupations
The most common Sales and Office occupations in Orr are Office & Administration (11 | 4.5%), and Sales & Related (2 | 0.8%).
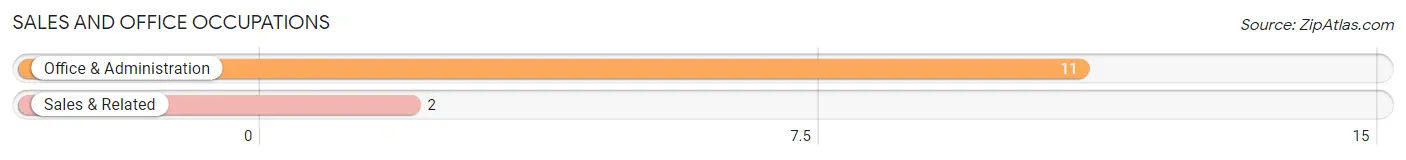
Sales and Office Occupations by Sex

| Occupation | Male | Female |
| Sales & Related | 0 (0.0%) | 2 (100.0%) |
| Office & Administration | 0 (0.0%) | 11 (100.0%) |
| Total (Category) | 0 (0.0%) | 13 (100.0%) |
| Total (Overall) | 107 (44.0%) | 136 (56.0%) |
Natural Resources, Construction and Maintenance Occupations
The most common Natural Resources, Construction and Maintenance occupations in Orr are Installation, Maintenance & Repair (31 | 12.8%), and Construction & Extraction (20 | 8.2%).
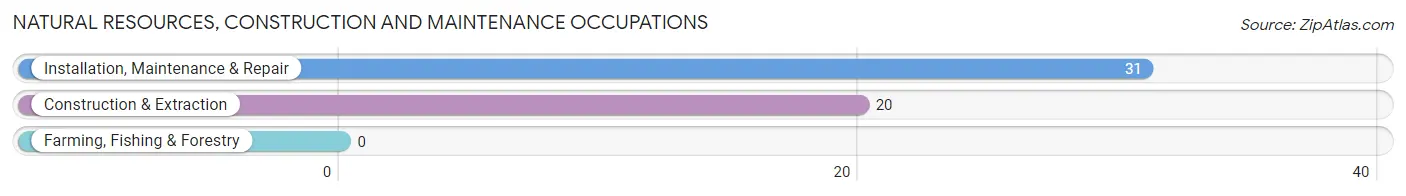
Natural Resources, Construction and Maintenance Occupations by Sex
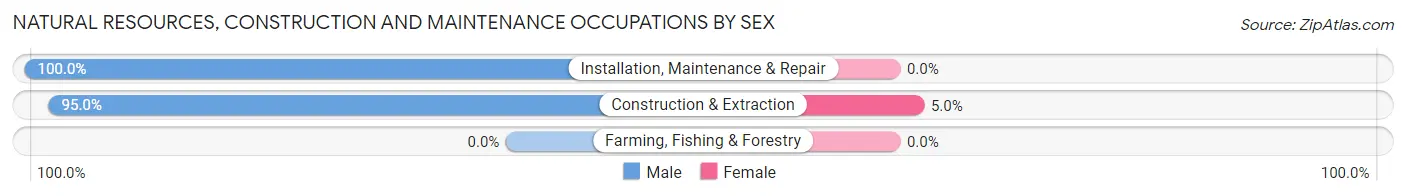
| Occupation | Male | Female |
| Farming, Fishing & Forestry | 0 (0.0%) | 0 (0.0%) |
| Construction & Extraction | 19 (95.0%) | 1 (5.0%) |
| Installation, Maintenance & Repair | 31 (100.0%) | 0 (0.0%) |
| Total (Category) | 50 (98.0%) | 1 (2.0%) |
| Total (Overall) | 107 (44.0%) | 136 (56.0%) |
Production, Transportation and Moving Occupations
The most common Production, Transportation and Moving occupations in Orr are Production (70 | 28.8%), Material Moving (5 | 2.1%), and Transportation (1 | 0.4%).
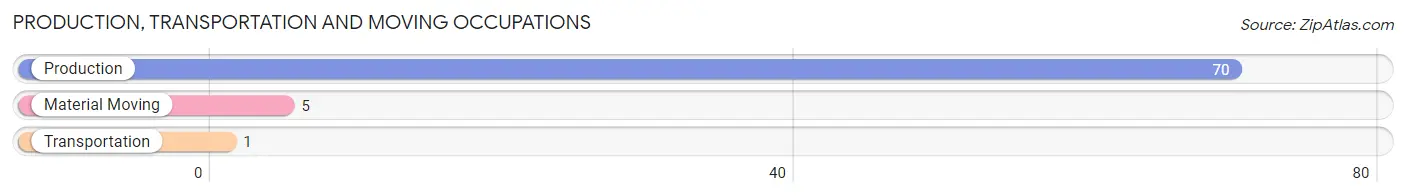
Production, Transportation and Moving Occupations by Sex
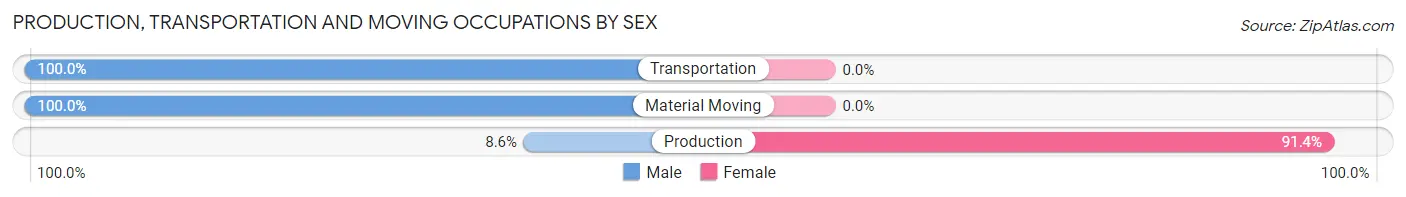
| Occupation | Male | Female |
| Production | 6 (8.6%) | 64 (91.4%) |
| Transportation | 1 (100.0%) | 0 (0.0%) |
| Material Moving | 5 (100.0%) | 0 (0.0%) |
| Total (Category) | 12 (15.8%) | 64 (84.2%) |
| Total (Overall) | 107 (44.0%) | 136 (56.0%) |
Employment Industries by Sex in Orr
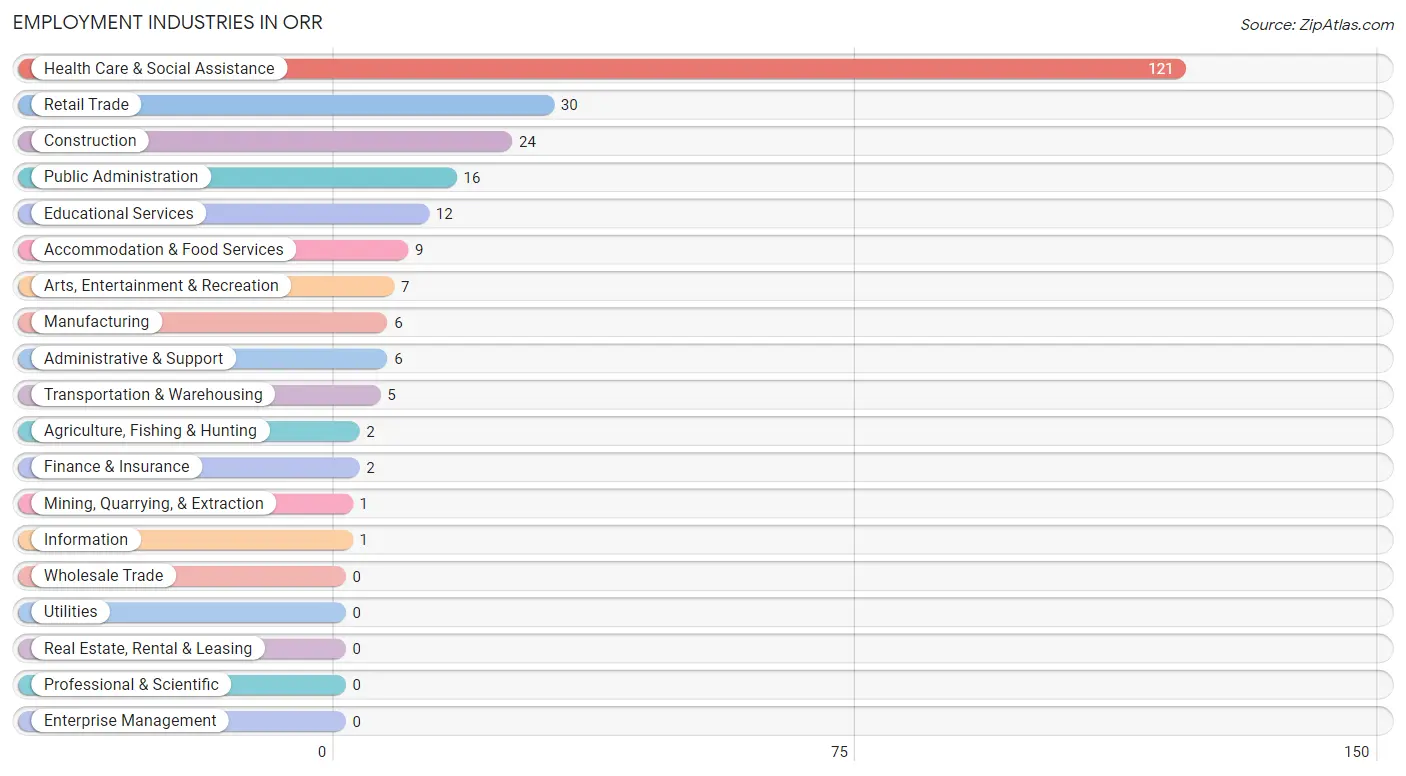
Employment Industries in Orr
The major employment industries in Orr include Health Care & Social Assistance (121 | 49.8%), Retail Trade (30 | 12.3%), Construction (24 | 9.9%), Public Administration (16 | 6.6%), and Educational Services (12 | 4.9%).
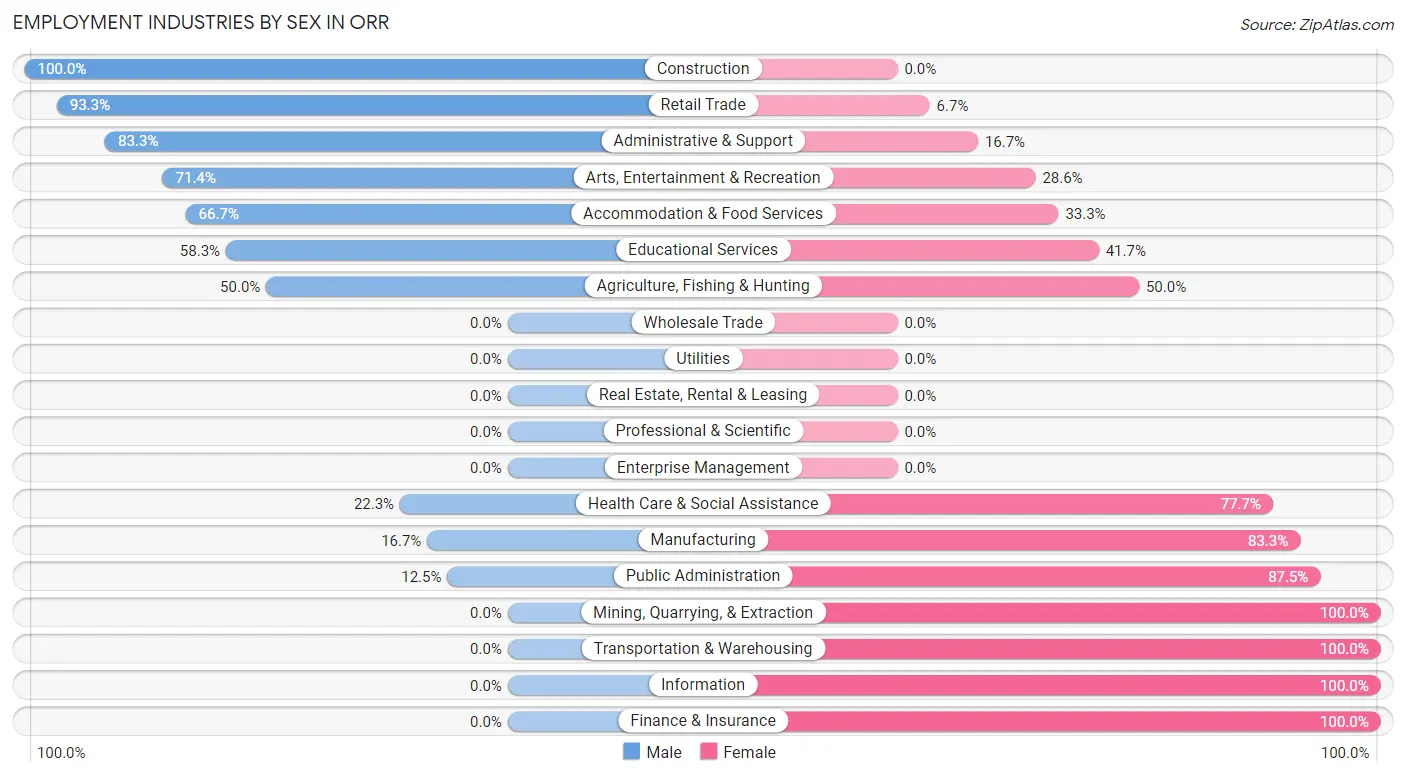
Employment Industries by Sex in Orr
The Orr industries that see more men than women are Construction (100.0%), Retail Trade (93.3%), and Administrative & Support (83.3%), whereas the industries that tend to have a higher number of women are Mining, Quarrying, & Extraction (100.0%), Transportation & Warehousing (100.0%), and Information (100.0%).
| Industry | Male | Female |
| Agriculture, Fishing & Hunting | 1 (50.0%) | 1 (50.0%) |
| Mining, Quarrying, & Extraction | 0 (0.0%) | 1 (100.0%) |
| Construction | 24 (100.0%) | 0 (0.0%) |
| Manufacturing | 1 (16.7%) | 5 (83.3%) |
| Wholesale Trade | 0 (0.0%) | 0 (0.0%) |
| Retail Trade | 28 (93.3%) | 2 (6.7%) |
| Transportation & Warehousing | 0 (0.0%) | 5 (100.0%) |
| Utilities | 0 (0.0%) | 0 (0.0%) |
| Information | 0 (0.0%) | 1 (100.0%) |
| Finance & Insurance | 0 (0.0%) | 2 (100.0%) |
| Real Estate, Rental & Leasing | 0 (0.0%) | 0 (0.0%) |
| Professional & Scientific | 0 (0.0%) | 0 (0.0%) |
| Enterprise Management | 0 (0.0%) | 0 (0.0%) |
| Administrative & Support | 5 (83.3%) | 1 (16.7%) |
| Educational Services | 7 (58.3%) | 5 (41.7%) |
| Health Care & Social Assistance | 27 (22.3%) | 94 (77.7%) |
| Arts, Entertainment & Recreation | 5 (71.4%) | 2 (28.6%) |
| Accommodation & Food Services | 6 (66.7%) | 3 (33.3%) |
| Public Administration | 2 (12.5%) | 14 (87.5%) |
| Total | 107 (44.0%) | 136 (56.0%) |
Education in Orr
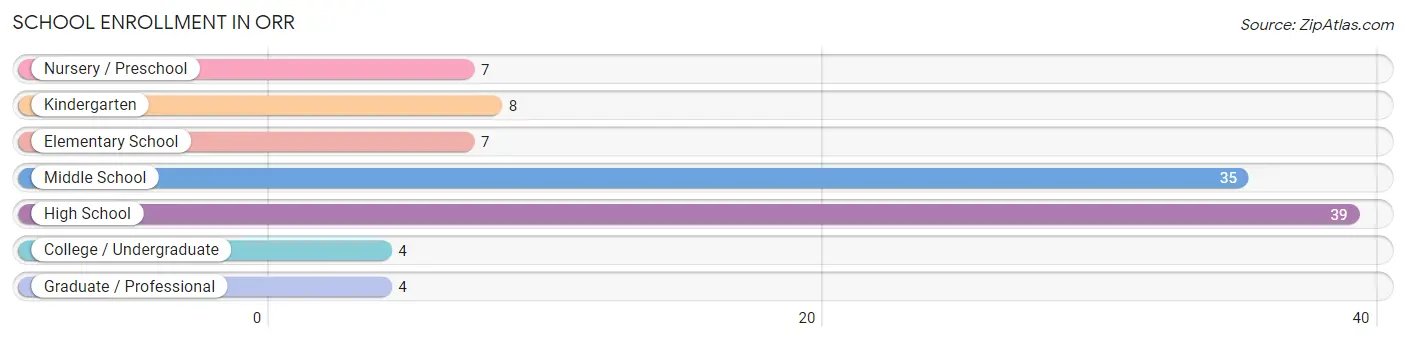
School Enrollment in Orr
The most common levels of schooling among the 104 students in Orr are high school (39 | 37.5%), middle school (35 | 33.7%), and kindergarten (8 | 7.7%).
| School Level | # Students | % Students |
| Nursery / Preschool | 7 | 6.7% |
| Kindergarten | 8 | 7.7% |
| Elementary School | 7 | 6.7% |
| Middle School | 35 | 33.7% |
| High School | 39 | 37.5% |
| College / Undergraduate | 4 | 3.8% |
| Graduate / Professional | 4 | 3.8% |
| Total | 104 | 100.0% |
School Enrollment by Age by Funding Source in Orr
Out of a total of 104 students who are enrolled in schools in Orr, 6 (5.8%) attend a private institution, while the remaining 98 (94.2%) are enrolled in public schools. The age group of 25 to 34 year olds has the highest likelihood of being enrolled in private schools, with 1 (100.0% in the age bracket) enrolled. Conversely, the age group of 5 to 9 year old has the lowest likelihood of being enrolled in a private school, with 22 (100.0% in the age bracket) attending a public institution.
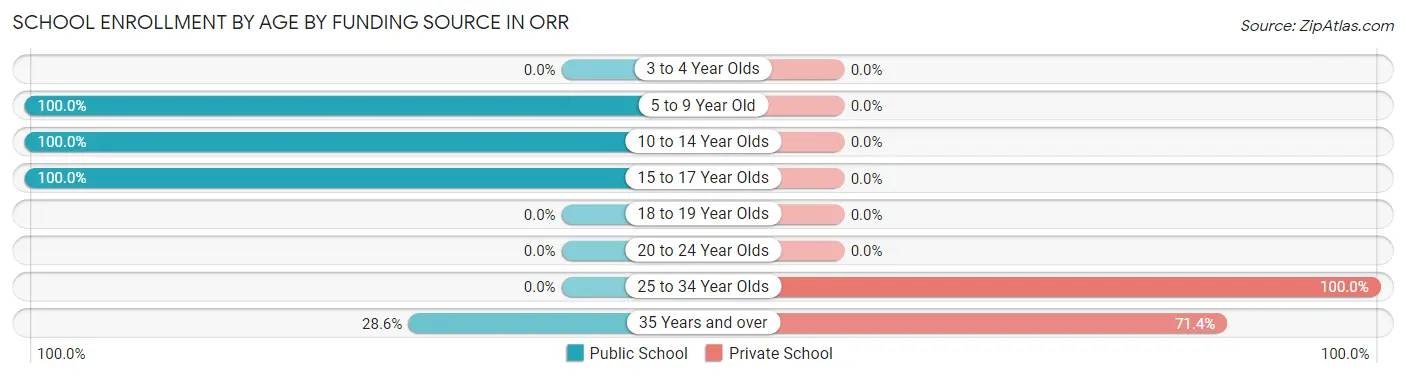
| Age Bracket | Public School | Private School |
| 3 to 4 Year Olds | 0 (0.0%) | 0 (0.0%) |
| 5 to 9 Year Old | 22 (100.0%) | 0 (0.0%) |
| 10 to 14 Year Olds | 35 (100.0%) | 0 (0.0%) |
| 15 to 17 Year Olds | 39 (100.0%) | 0 (0.0%) |
| 18 to 19 Year Olds | 0 (0.0%) | 0 (0.0%) |
| 20 to 24 Year Olds | 0 (0.0%) | 0 (0.0%) |
| 25 to 34 Year Olds | 0 (0.0%) | 1 (100.0%) |
| 35 Years and over | 2 (28.6%) | 5 (71.4%) |
| Total | 98 (94.2%) | 6 (5.8%) |
Educational Attainment by Field of Study in Orr
Business (11 | 34.4%), education (8 | 25.0%), psychology (6 | 18.8%), science & technology (3 | 9.4%), and bio, nature & agricultural (2 | 6.2%) are the most common fields of study among 32 individuals in Orr who have obtained a bachelor's degree or higher.
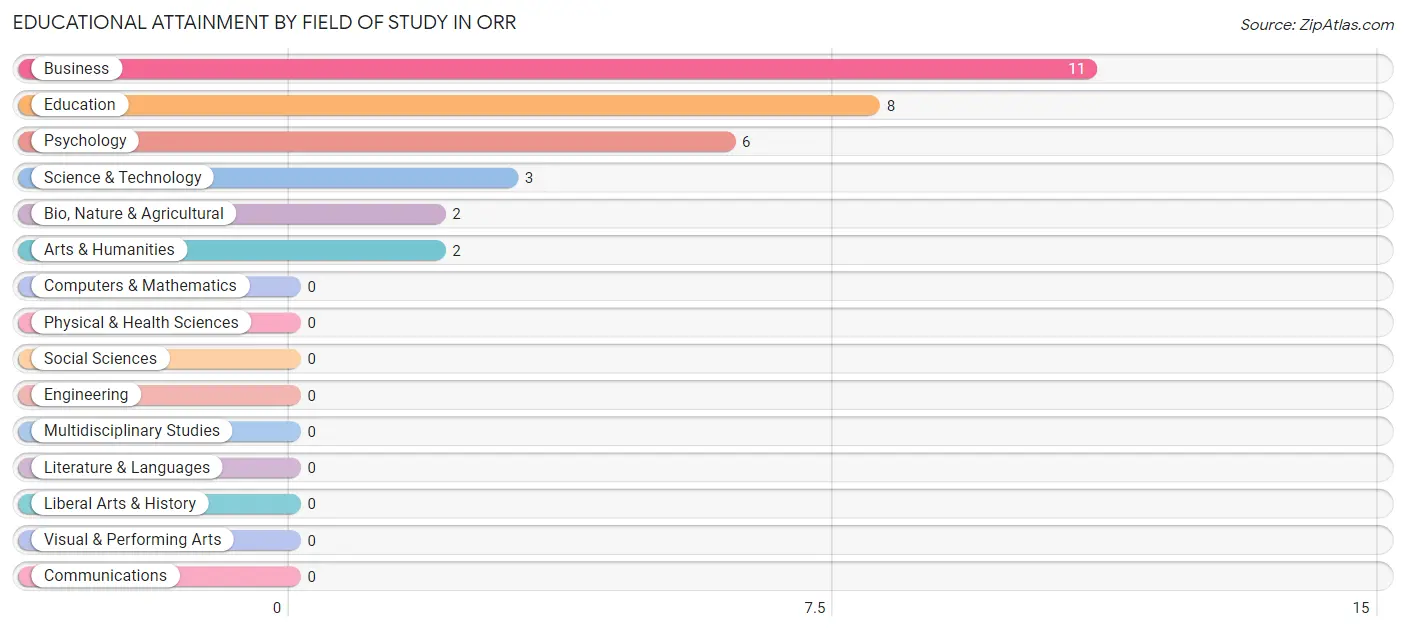
| Field of Study | # Graduates | % Graduates |
| Computers & Mathematics | 0 | 0.0% |
| Bio, Nature & Agricultural | 2 | 6.2% |
| Physical & Health Sciences | 0 | 0.0% |
| Psychology | 6 | 18.8% |
| Social Sciences | 0 | 0.0% |
| Engineering | 0 | 0.0% |
| Multidisciplinary Studies | 0 | 0.0% |
| Science & Technology | 3 | 9.4% |
| Business | 11 | 34.4% |
| Education | 8 | 25.0% |
| Literature & Languages | 0 | 0.0% |
| Liberal Arts & History | 0 | 0.0% |
| Visual & Performing Arts | 0 | 0.0% |
| Communications | 0 | 0.0% |
| Arts & Humanities | 2 | 6.2% |
| Total | 32 | 100.0% |
Transportation & Commute in Orr
Vehicle Availability by Sex in Orr
The most prevalent vehicle ownership categories in Orr are males with 4 vehicles (31, accounting for 40.8%) and females with 4 vehicles (64, making up 28.7%).
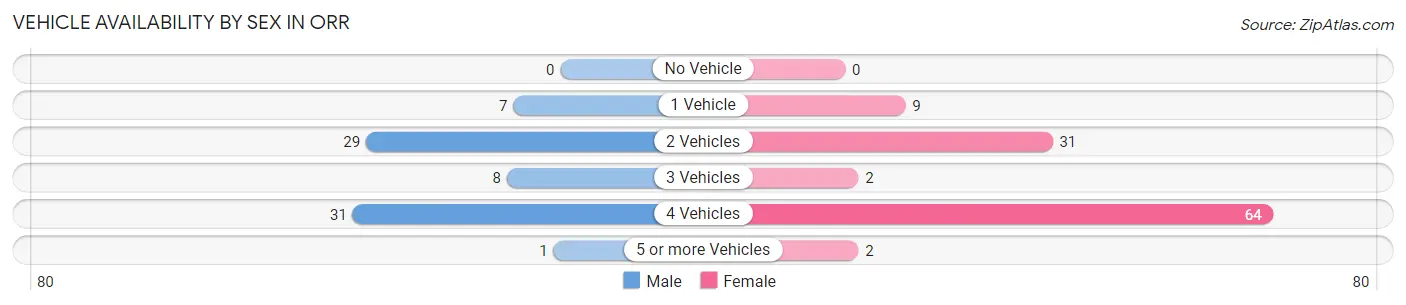
| Vehicles Available | Male | Female |
| No Vehicle | 0 (0.0%) | 0 (0.0%) |
| 1 Vehicle | 7 (9.2%) | 9 (8.3%) |
| 2 Vehicles | 29 (38.2%) | 31 (28.7%) |
| 3 Vehicles | 8 (10.5%) | 2 (1.8%) |
| 4 Vehicles | 31 (40.8%) | 64 (59.3%) |
| 5 or more Vehicles | 1 (1.3%) | 2 (1.8%) |
| Total | 76 (100.0%) | 108 (100.0%) |
Commute Time in Orr
The most frequently occuring commute durations in Orr are 10 to 14 minutes (62 commuters, 34.4%), 90 or more minutes (27 commuters, 15.0%), and 60 to 89 minutes (22 commuters, 12.2%).
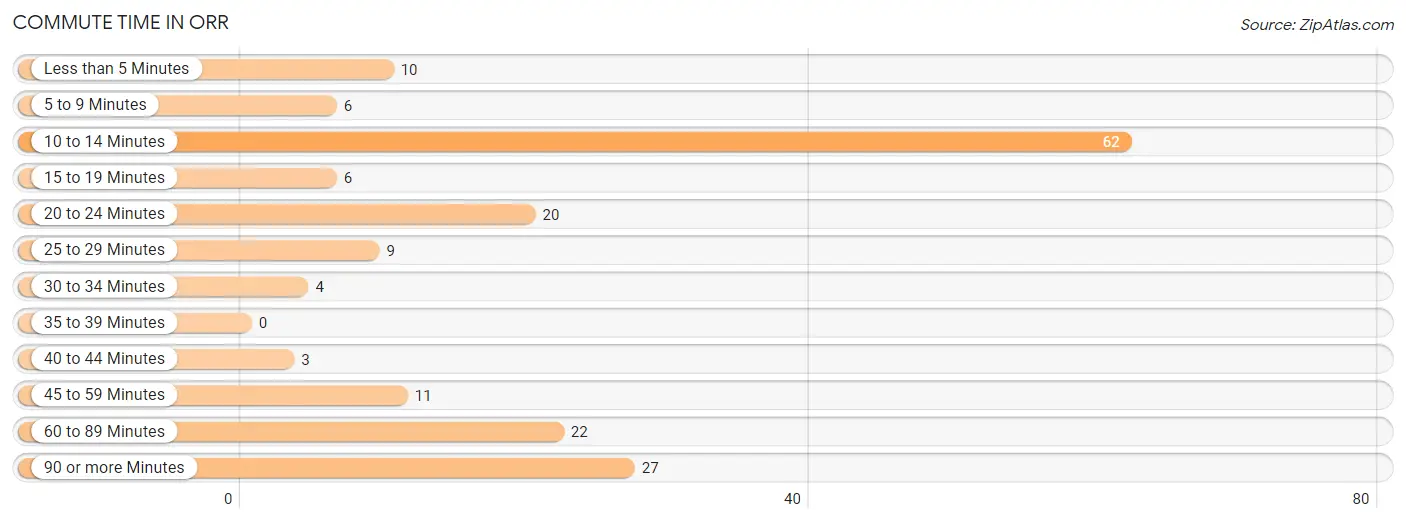
| Commute Time | # Commuters | % Commuters |
| Less than 5 Minutes | 10 | 5.6% |
| 5 to 9 Minutes | 6 | 3.3% |
| 10 to 14 Minutes | 62 | 34.4% |
| 15 to 19 Minutes | 6 | 3.3% |
| 20 to 24 Minutes | 20 | 11.1% |
| 25 to 29 Minutes | 9 | 5.0% |
| 30 to 34 Minutes | 4 | 2.2% |
| 35 to 39 Minutes | 0 | 0.0% |
| 40 to 44 Minutes | 3 | 1.7% |
| 45 to 59 Minutes | 11 | 6.1% |
| 60 to 89 Minutes | 22 | 12.2% |
| 90 or more Minutes | 27 | 15.0% |
Commute Time by Sex in Orr
The most common commute times in Orr are 90 or more minutes (27 commuters, 35.5%) for males and 10 to 14 minutes (61 commuters, 58.7%) for females.
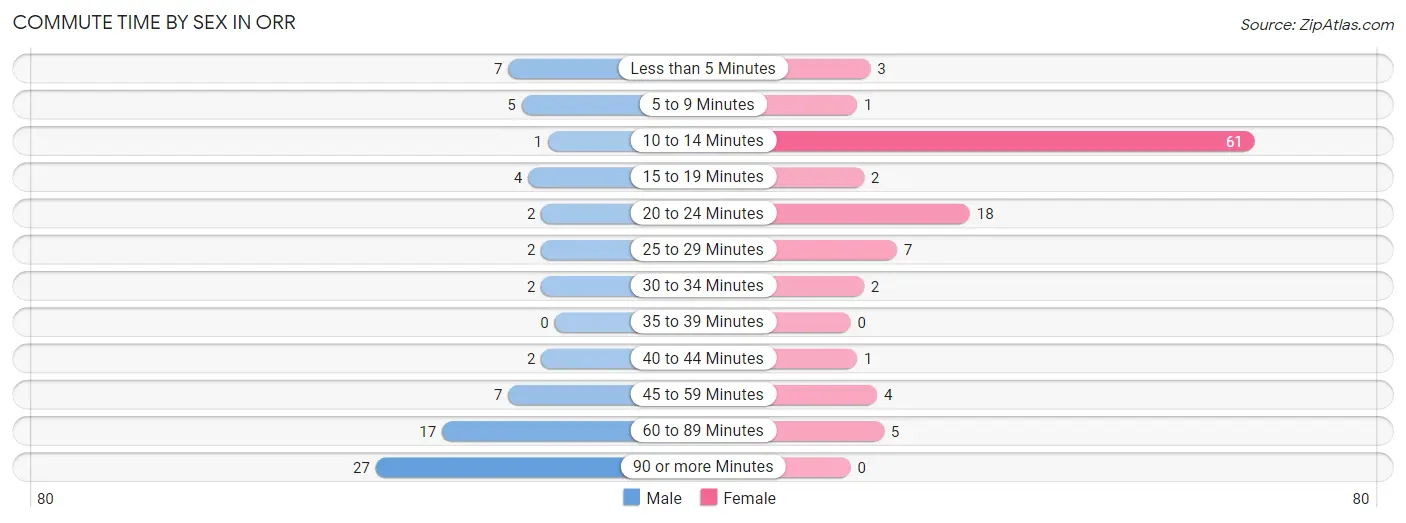
| Commute Time | Male | Female |
| Less than 5 Minutes | 7 (9.2%) | 3 (2.9%) |
| 5 to 9 Minutes | 5 (6.6%) | 1 (1.0%) |
| 10 to 14 Minutes | 1 (1.3%) | 61 (58.7%) |
| 15 to 19 Minutes | 4 (5.3%) | 2 (1.9%) |
| 20 to 24 Minutes | 2 (2.6%) | 18 (17.3%) |
| 25 to 29 Minutes | 2 (2.6%) | 7 (6.7%) |
| 30 to 34 Minutes | 2 (2.6%) | 2 (1.9%) |
| 35 to 39 Minutes | 0 (0.0%) | 0 (0.0%) |
| 40 to 44 Minutes | 2 (2.6%) | 1 (1.0%) |
| 45 to 59 Minutes | 7 (9.2%) | 4 (3.8%) |
| 60 to 89 Minutes | 17 (22.4%) | 5 (4.8%) |
| 90 or more Minutes | 27 (35.5%) | 0 (0.0%) |
Time of Departure to Work by Sex in Orr
The most frequent times of departure to work in Orr are 12:00 AM to 4:59 AM (27, 35.5%) for males and 8:00 AM to 8:29 AM (69, 66.3%) for females.
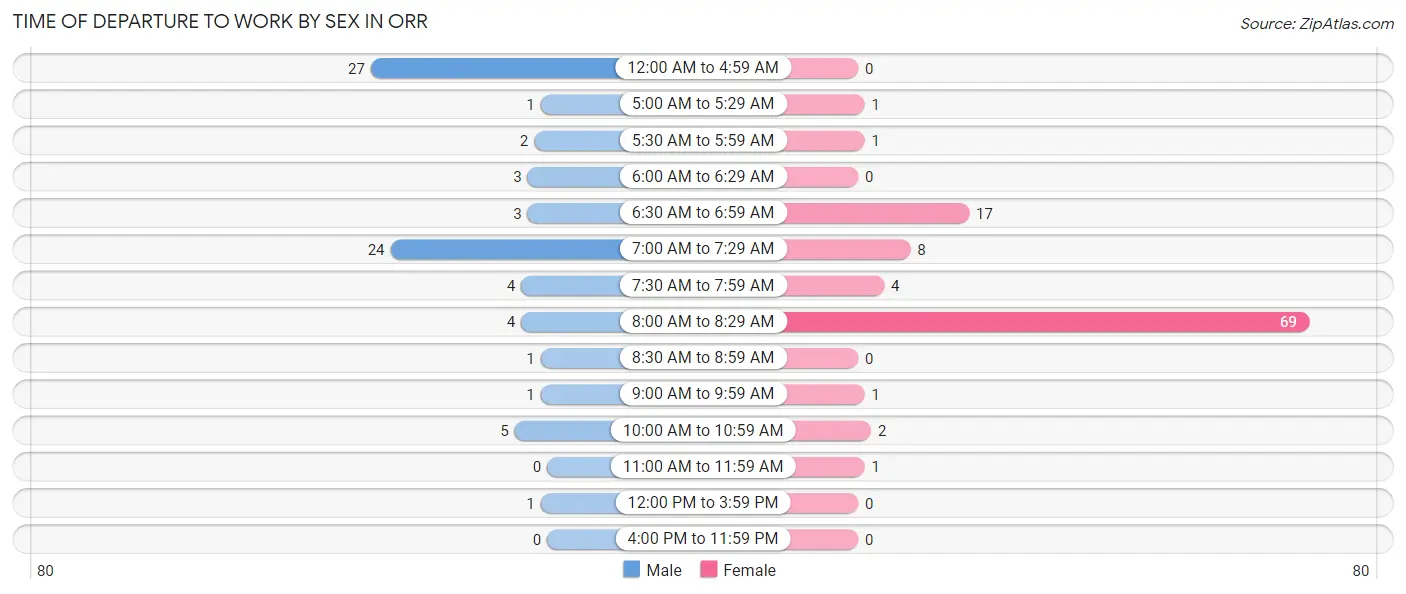
| Time of Departure | Male | Female |
| 12:00 AM to 4:59 AM | 27 (35.5%) | 0 (0.0%) |
| 5:00 AM to 5:29 AM | 1 (1.3%) | 1 (1.0%) |
| 5:30 AM to 5:59 AM | 2 (2.6%) | 1 (1.0%) |
| 6:00 AM to 6:29 AM | 3 (4.0%) | 0 (0.0%) |
| 6:30 AM to 6:59 AM | 3 (4.0%) | 17 (16.4%) |
| 7:00 AM to 7:29 AM | 24 (31.6%) | 8 (7.7%) |
| 7:30 AM to 7:59 AM | 4 (5.3%) | 4 (3.8%) |
| 8:00 AM to 8:29 AM | 4 (5.3%) | 69 (66.3%) |
| 8:30 AM to 8:59 AM | 1 (1.3%) | 0 (0.0%) |
| 9:00 AM to 9:59 AM | 1 (1.3%) | 1 (1.0%) |
| 10:00 AM to 10:59 AM | 5 (6.6%) | 2 (1.9%) |
| 11:00 AM to 11:59 AM | 0 (0.0%) | 1 (1.0%) |
| 12:00 PM to 3:59 PM | 1 (1.3%) | 0 (0.0%) |
| 4:00 PM to 11:59 PM | 0 (0.0%) | 0 (0.0%) |
| Total | 76 (100.0%) | 104 (100.0%) |
Housing Occupancy in Orr
Occupancy by Ownership in Orr
Of the total 115 dwellings in Orr, owner-occupied units account for 89 (77.4%), while renter-occupied units make up 26 (22.6%).
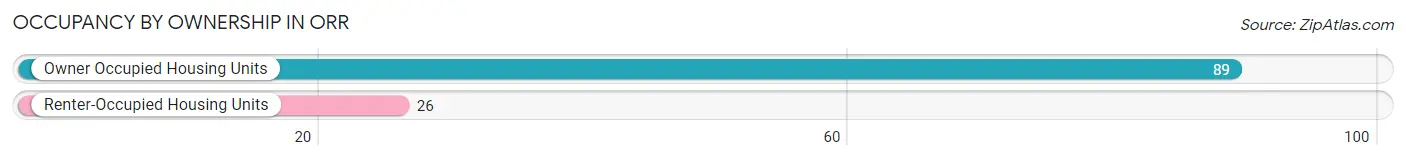
| Occupancy | # Housing Units | % Housing Units |
| Owner Occupied Housing Units | 89 | 77.4% |
| Renter-Occupied Housing Units | 26 | 22.6% |
| Total Occupied Housing Units | 115 | 100.0% |
Occupancy by Household Size in Orr
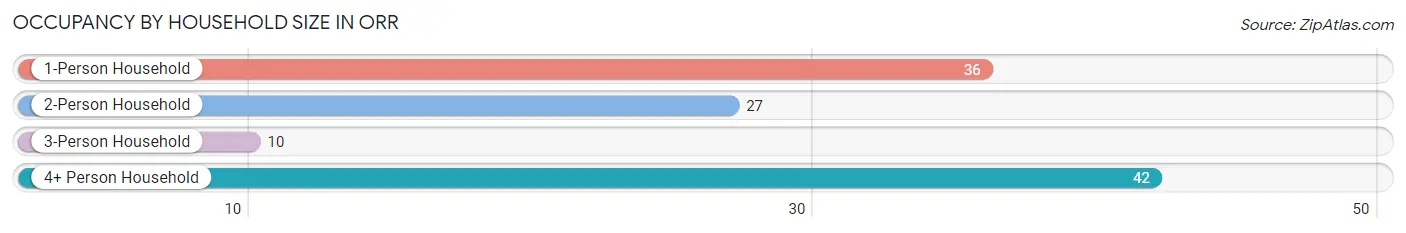
| Household Size | # Housing Units | % Housing Units |
| 1-Person Household | 36 | 31.3% |
| 2-Person Household | 27 | 23.5% |
| 3-Person Household | 10 | 8.7% |
| 4+ Person Household | 42 | 36.5% |
| Total Housing Units | 115 | 100.0% |
Occupancy by Ownership by Household Size in Orr
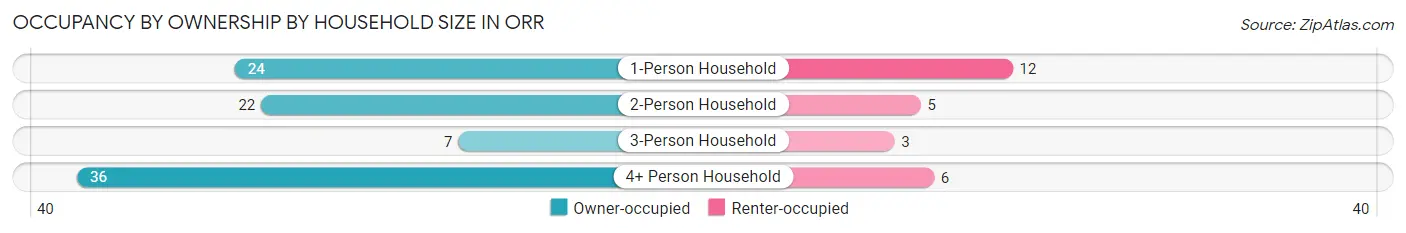
| Household Size | Owner-occupied | Renter-occupied |
| 1-Person Household | 24 (66.7%) | 12 (33.3%) |
| 2-Person Household | 22 (81.5%) | 5 (18.5%) |
| 3-Person Household | 7 (70.0%) | 3 (30.0%) |
| 4+ Person Household | 36 (85.7%) | 6 (14.3%) |
| Total Housing Units | 89 (77.4%) | 26 (22.6%) |
Occupancy by Educational Attainment in Orr
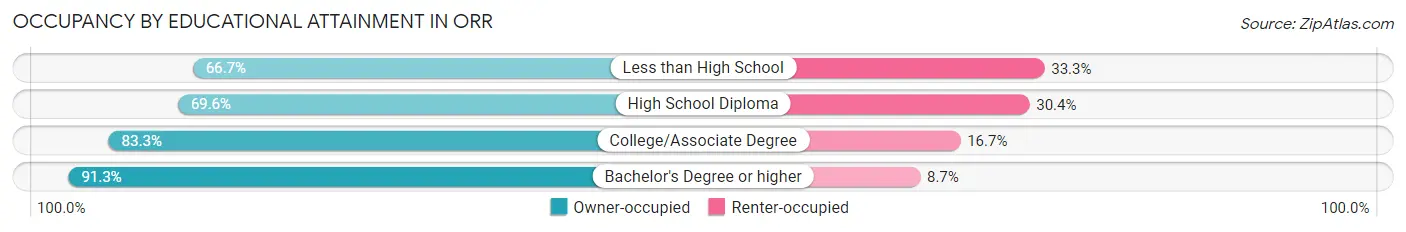
| Household Size | Owner-occupied | Renter-occupied |
| Less than High School | 4 (66.7%) | 2 (33.3%) |
| High School Diploma | 39 (69.6%) | 17 (30.4%) |
| College/Associate Degree | 25 (83.3%) | 5 (16.7%) |
| Bachelor's Degree or higher | 21 (91.3%) | 2 (8.7%) |
Occupancy by Age of Householder in Orr
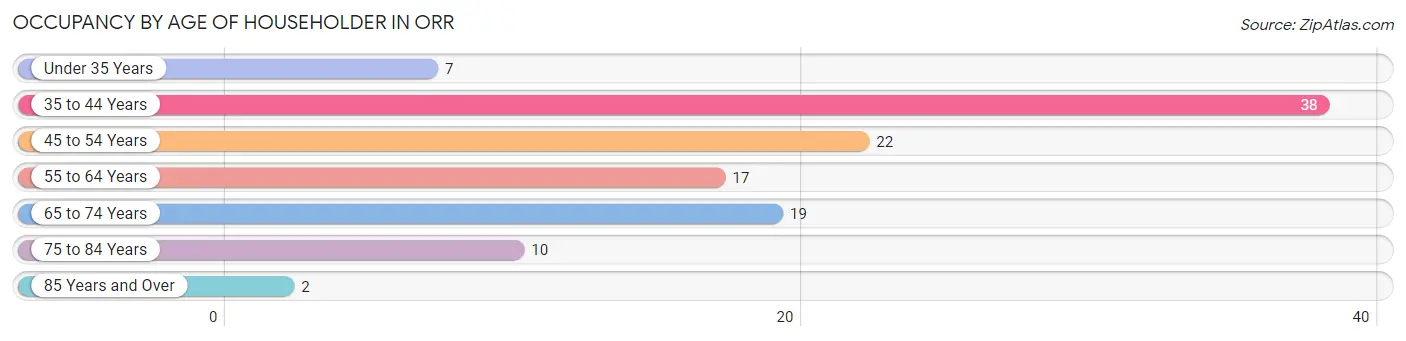
| Age Bracket | # Households | % Households |
| Under 35 Years | 7 | 6.1% |
| 35 to 44 Years | 38 | 33.0% |
| 45 to 54 Years | 22 | 19.1% |
| 55 to 64 Years | 17 | 14.8% |
| 65 to 74 Years | 19 | 16.5% |
| 75 to 84 Years | 10 | 8.7% |
| 85 Years and Over | 2 | 1.7% |
| Total | 115 | 100.0% |
Housing Finances in Orr
Median Income by Occupancy in Orr
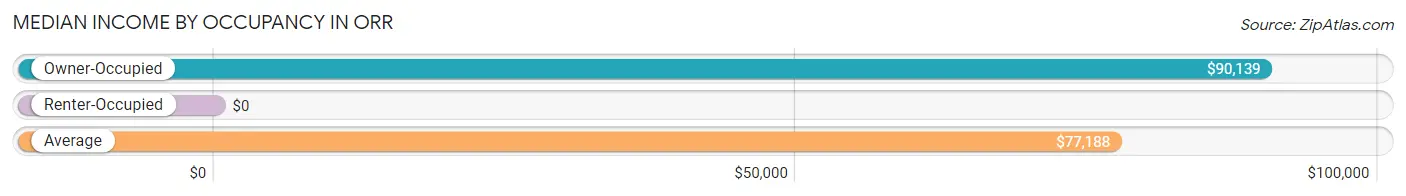
| Occupancy Type | # Households | Median Income |
| Owner-Occupied | 89 (77.4%) | $90,139 |
| Renter-Occupied | 26 (22.6%) | $0 |
| Average | 115 (100.0%) | $77,188 |
Occupancy by Householder Income Bracket in Orr
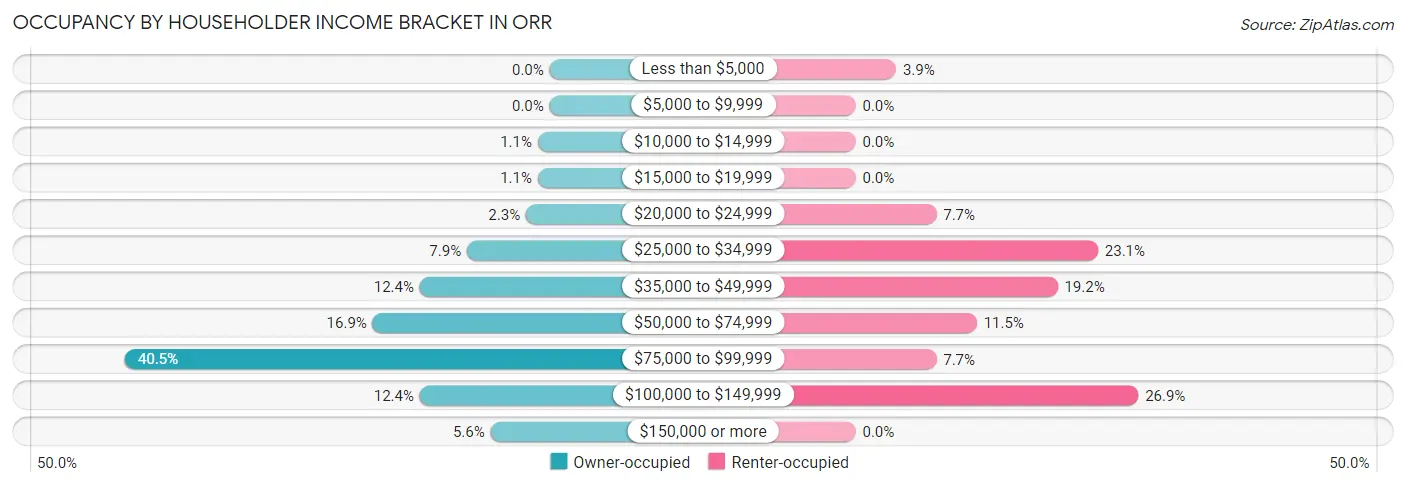
| Income Bracket | Owner-occupied | Renter-occupied |
| Less than $5,000 | 0 (0.0%) | 1 (3.8%) |
| $5,000 to $9,999 | 0 (0.0%) | 0 (0.0%) |
| $10,000 to $14,999 | 1 (1.1%) | 0 (0.0%) |
| $15,000 to $19,999 | 1 (1.1%) | 0 (0.0%) |
| $20,000 to $24,999 | 2 (2.2%) | 2 (7.7%) |
| $25,000 to $34,999 | 7 (7.9%) | 6 (23.1%) |
| $35,000 to $49,999 | 11 (12.4%) | 5 (19.2%) |
| $50,000 to $74,999 | 15 (16.9%) | 3 (11.5%) |
| $75,000 to $99,999 | 36 (40.5%) | 2 (7.7%) |
| $100,000 to $149,999 | 11 (12.4%) | 7 (26.9%) |
| $150,000 or more | 5 (5.6%) | 0 (0.0%) |
| Total | 89 (100.0%) | 26 (100.0%) |
Monthly Housing Cost Tiers in Orr
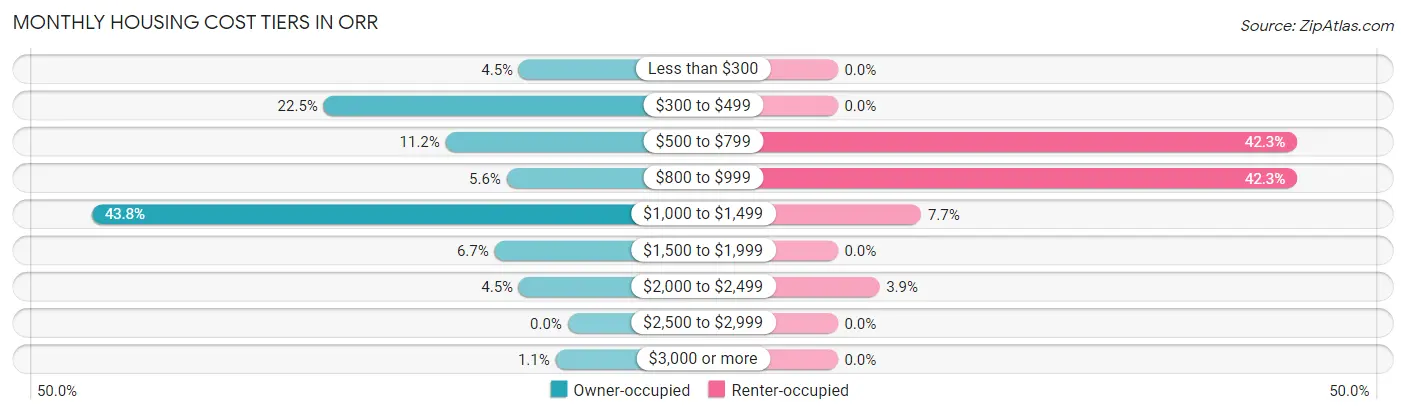
| Monthly Cost | Owner-occupied | Renter-occupied |
| Less than $300 | 4 (4.5%) | 0 (0.0%) |
| $300 to $499 | 20 (22.5%) | 0 (0.0%) |
| $500 to $799 | 10 (11.2%) | 11 (42.3%) |
| $800 to $999 | 5 (5.6%) | 11 (42.3%) |
| $1,000 to $1,499 | 39 (43.8%) | 2 (7.7%) |
| $1,500 to $1,999 | 6 (6.7%) | 0 (0.0%) |
| $2,000 to $2,499 | 4 (4.5%) | 1 (3.8%) |
| $2,500 to $2,999 | 0 (0.0%) | 0 (0.0%) |
| $3,000 or more | 1 (1.1%) | 0 (0.0%) |
| Total | 89 (100.0%) | 26 (100.0%) |
Physical Housing Characteristics in Orr
Housing Structures in Orr
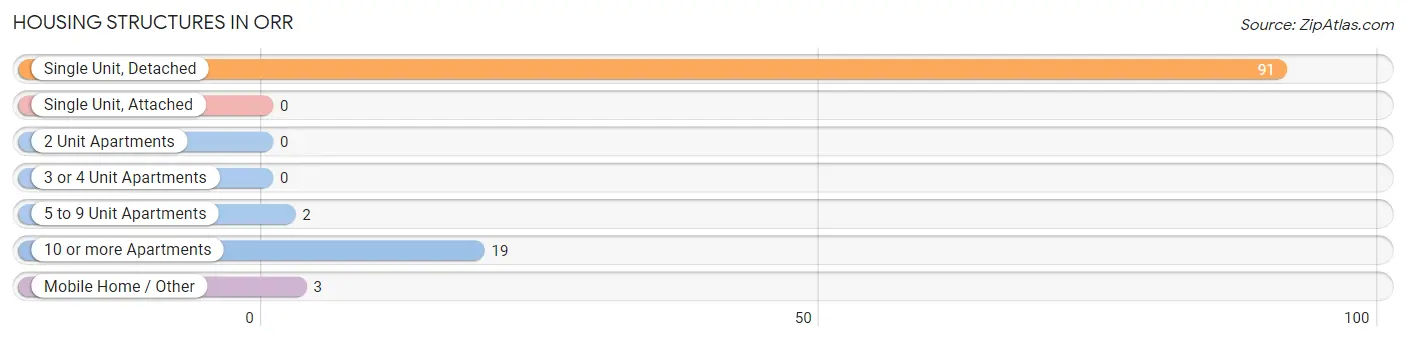
| Structure Type | # Housing Units | % Housing Units |
| Single Unit, Detached | 91 | 79.1% |
| Single Unit, Attached | 0 | 0.0% |
| 2 Unit Apartments | 0 | 0.0% |
| 3 or 4 Unit Apartments | 0 | 0.0% |
| 5 to 9 Unit Apartments | 2 | 1.7% |
| 10 or more Apartments | 19 | 16.5% |
| Mobile Home / Other | 3 | 2.6% |
| Total | 115 | 100.0% |
Housing Structures by Occupancy in Orr
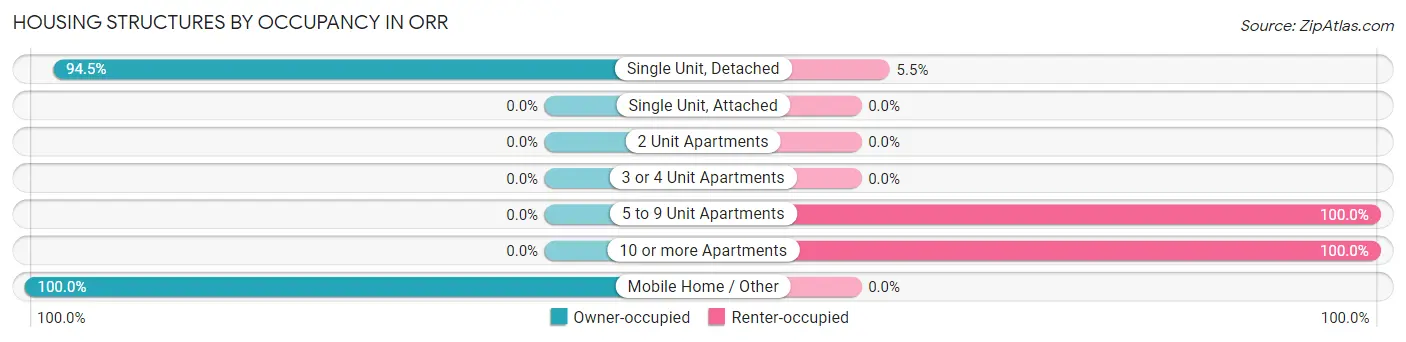
| Structure Type | Owner-occupied | Renter-occupied |
| Single Unit, Detached | 86 (94.5%) | 5 (5.5%) |
| Single Unit, Attached | 0 (0.0%) | 0 (0.0%) |
| 2 Unit Apartments | 0 (0.0%) | 0 (0.0%) |
| 3 or 4 Unit Apartments | 0 (0.0%) | 0 (0.0%) |
| 5 to 9 Unit Apartments | 0 (0.0%) | 2 (100.0%) |
| 10 or more Apartments | 0 (0.0%) | 19 (100.0%) |
| Mobile Home / Other | 3 (100.0%) | 0 (0.0%) |
| Total | 89 (77.4%) | 26 (22.6%) |
Housing Structures by Number of Rooms in Orr
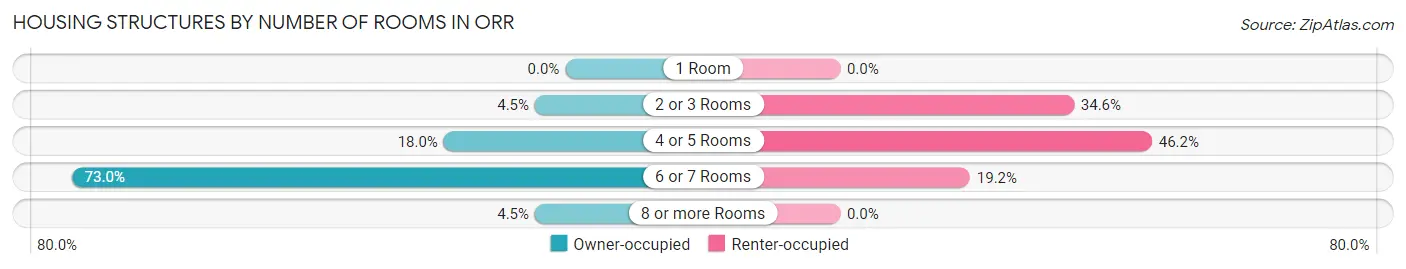
| Number of Rooms | Owner-occupied | Renter-occupied |
| 1 Room | 0 (0.0%) | 0 (0.0%) |
| 2 or 3 Rooms | 4 (4.5%) | 9 (34.6%) |
| 4 or 5 Rooms | 16 (18.0%) | 12 (46.2%) |
| 6 or 7 Rooms | 65 (73.0%) | 5 (19.2%) |
| 8 or more Rooms | 4 (4.5%) | 0 (0.0%) |
| Total | 89 (100.0%) | 26 (100.0%) |
Housing Structure by Heating Type in Orr
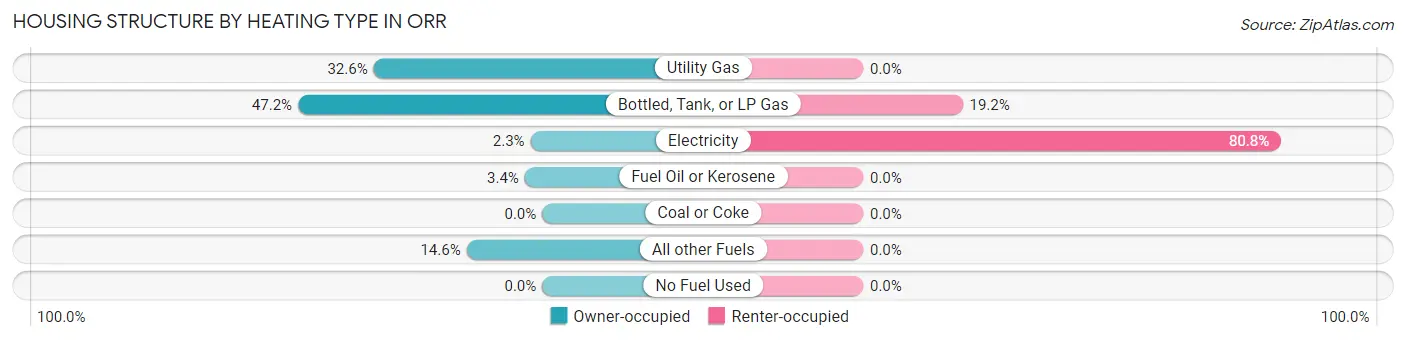
| Heating Type | Owner-occupied | Renter-occupied |
| Utility Gas | 29 (32.6%) | 0 (0.0%) |
| Bottled, Tank, or LP Gas | 42 (47.2%) | 5 (19.2%) |
| Electricity | 2 (2.2%) | 21 (80.8%) |
| Fuel Oil or Kerosene | 3 (3.4%) | 0 (0.0%) |
| Coal or Coke | 0 (0.0%) | 0 (0.0%) |
| All other Fuels | 13 (14.6%) | 0 (0.0%) |
| No Fuel Used | 0 (0.0%) | 0 (0.0%) |
| Total | 89 (100.0%) | 26 (100.0%) |
Household Vehicle Usage in Orr
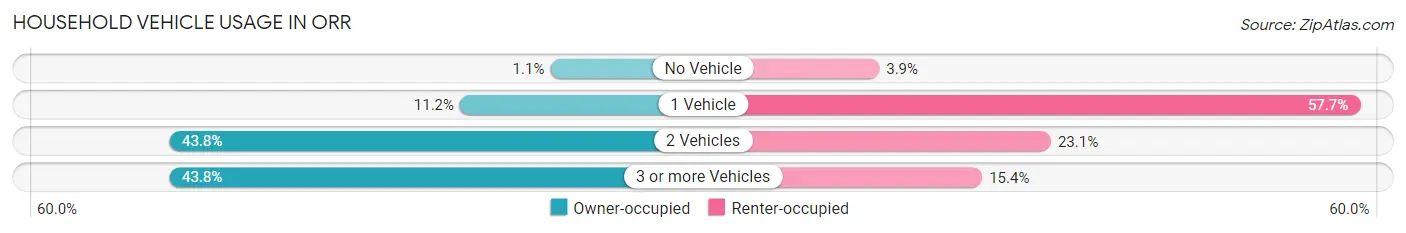
| Vehicles per Household | Owner-occupied | Renter-occupied |
| No Vehicle | 1 (1.1%) | 1 (3.8%) |
| 1 Vehicle | 10 (11.2%) | 15 (57.7%) |
| 2 Vehicles | 39 (43.8%) | 6 (23.1%) |
| 3 or more Vehicles | 39 (43.8%) | 4 (15.4%) |
| Total | 89 (100.0%) | 26 (100.0%) |
Real Estate & Mortgages in Orr
Real Estate and Mortgage Overview in Orr
| Characteristic | Without Mortgage | With Mortgage |
| Housing Units | 32 | 57 |
| Median Property Value | $95,000 | $0 |
| Median Household Income | $63,333 | $2 |
| Monthly Housing Costs | $443 | $1 |
| Real Estate Taxes | $767 | $1 |
Property Value by Mortgage Status in Orr
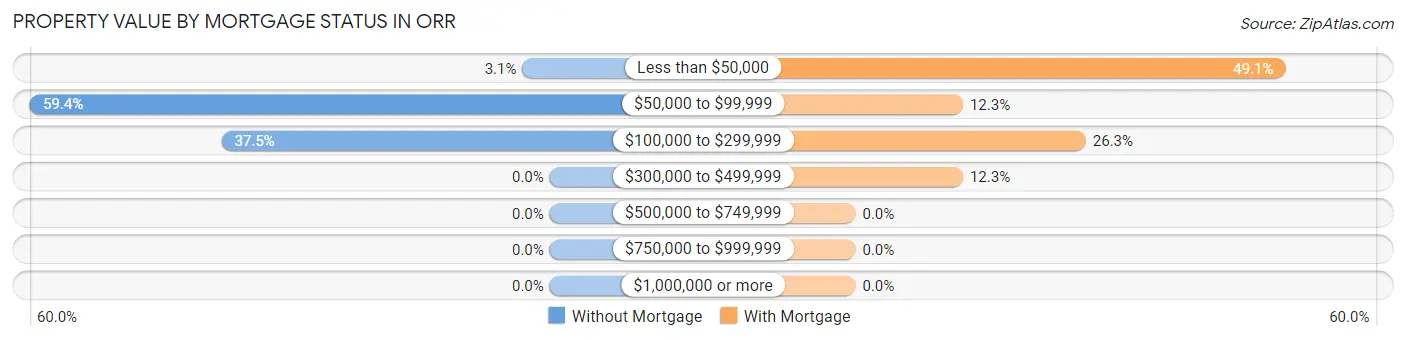
| Property Value | Without Mortgage | With Mortgage |
| Less than $50,000 | 1 (3.1%) | 28 (49.1%) |
| $50,000 to $99,999 | 19 (59.4%) | 7 (12.3%) |
| $100,000 to $299,999 | 12 (37.5%) | 15 (26.3%) |
| $300,000 to $499,999 | 0 (0.0%) | 7 (12.3%) |
| $500,000 to $749,999 | 0 (0.0%) | 0 (0.0%) |
| $750,000 to $999,999 | 0 (0.0%) | 0 (0.0%) |
| $1,000,000 or more | 0 (0.0%) | 0 (0.0%) |
| Total | 32 (100.0%) | 57 (100.0%) |
Household Income by Mortgage Status in Orr
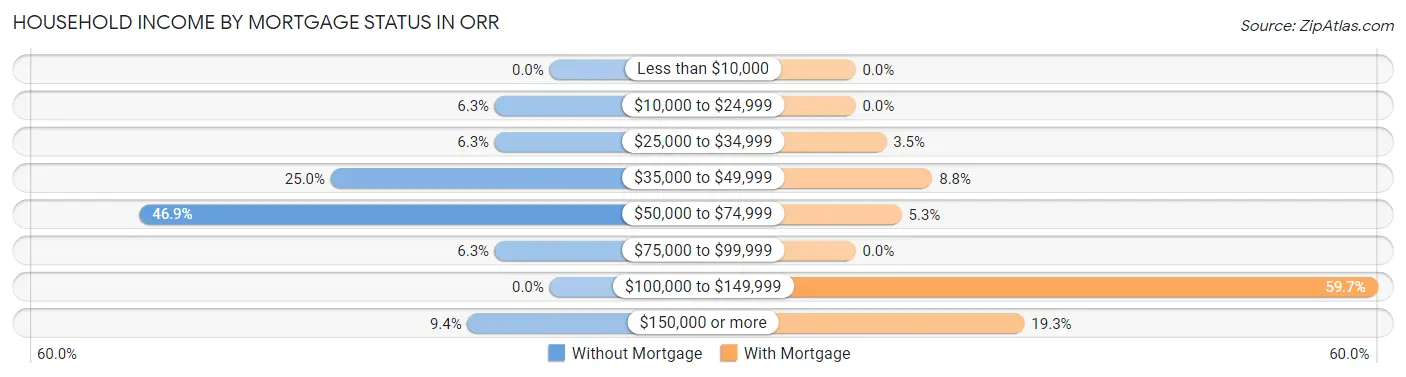
| Household Income | Without Mortgage | With Mortgage |
| Less than $10,000 | 0 (0.0%) | 0 (0.0%) |
| $10,000 to $24,999 | 2 (6.2%) | 0 (0.0%) |
| $25,000 to $34,999 | 2 (6.2%) | 2 (3.5%) |
| $35,000 to $49,999 | 8 (25.0%) | 5 (8.8%) |
| $50,000 to $74,999 | 15 (46.9%) | 3 (5.3%) |
| $75,000 to $99,999 | 2 (6.2%) | 0 (0.0%) |
| $100,000 to $149,999 | 0 (0.0%) | 34 (59.7%) |
| $150,000 or more | 3 (9.4%) | 11 (19.3%) |
| Total | 32 (100.0%) | 57 (100.0%) |
Property Value to Household Income Ratio in Orr
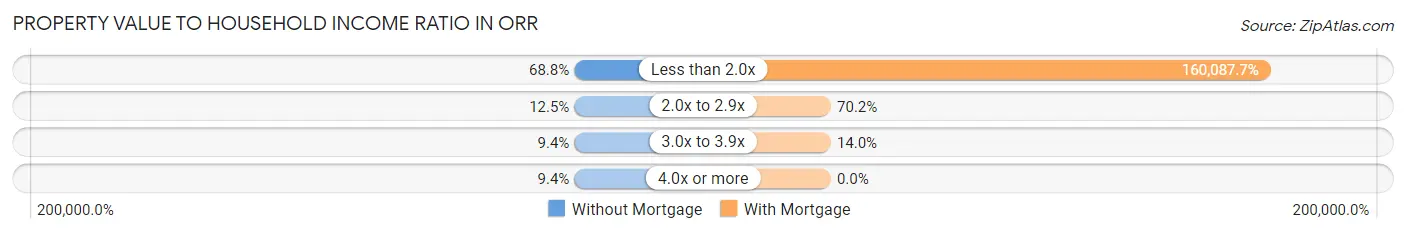
| Value-to-Income Ratio | Without Mortgage | With Mortgage |
| Less than 2.0x | 22 (68.8%) | 91,250 (160,087.7%) |
| 2.0x to 2.9x | 4 (12.5%) | 40 (70.2%) |
| 3.0x to 3.9x | 3 (9.4%) | 8 (14.0%) |
| 4.0x or more | 3 (9.4%) | 0 (0.0%) |
| Total | 32 (100.0%) | 57 (100.0%) |
Real Estate Taxes by Mortgage Status in Orr
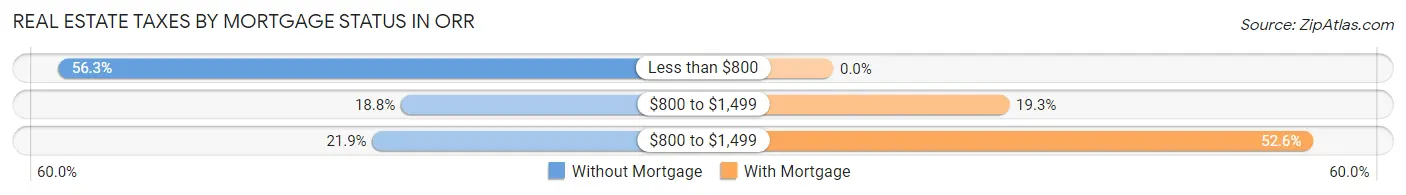
| Property Taxes | Without Mortgage | With Mortgage |
| Less than $800 | 18 (56.2%) | 0 (0.0%) |
| $800 to $1,499 | 6 (18.8%) | 11 (19.3%) |
| $800 to $1,499 | 7 (21.9%) | 30 (52.6%) |
| Total | 32 (100.0%) | 57 (100.0%) |
Health & Disability in Orr
Health Insurance Coverage by Age in Orr
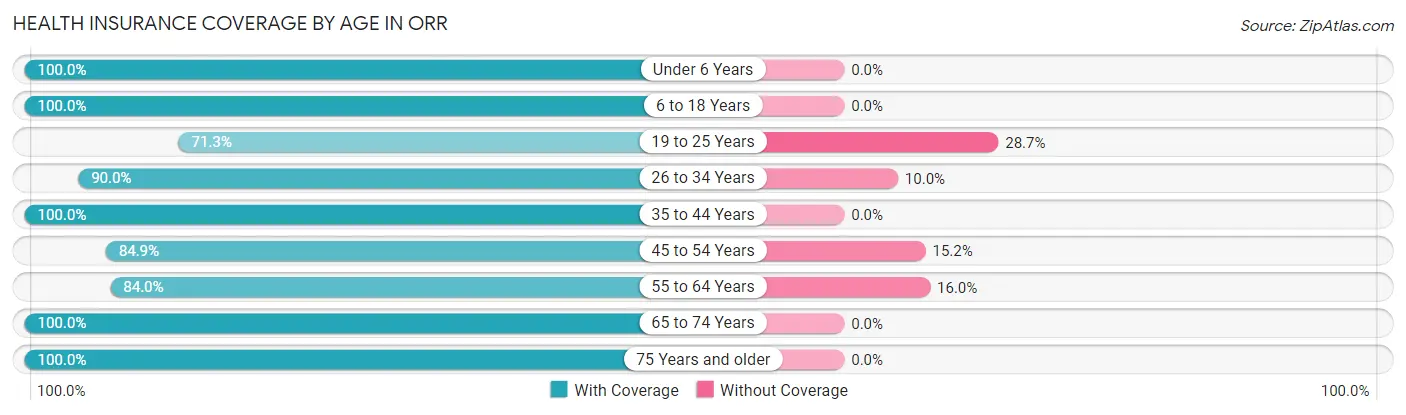
| Age Bracket | With Coverage | Without Coverage |
| Under 6 Years | 18 (100.0%) | 0 (0.0%) |
| 6 to 18 Years | 87 (100.0%) | 0 (0.0%) |
| 19 to 25 Years | 67 (71.3%) | 27 (28.7%) |
| 26 to 34 Years | 9 (90.0%) | 1 (10.0%) |
| 35 to 44 Years | 78 (100.0%) | 0 (0.0%) |
| 45 to 54 Years | 28 (84.9%) | 5 (15.1%) |
| 55 to 64 Years | 21 (84.0%) | 4 (16.0%) |
| 65 to 74 Years | 28 (100.0%) | 0 (0.0%) |
| 75 Years and older | 18 (100.0%) | 0 (0.0%) |
| Total | 354 (90.5%) | 37 (9.5%) |
Health Insurance Coverage by Citizenship Status in Orr
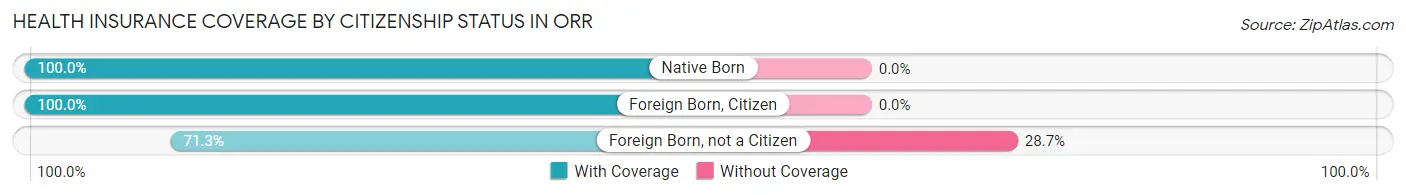
| Citizenship Status | With Coverage | Without Coverage |
| Native Born | 18 (100.0%) | 0 (0.0%) |
| Foreign Born, Citizen | 87 (100.0%) | 0 (0.0%) |
| Foreign Born, not a Citizen | 67 (71.3%) | 27 (28.7%) |
Health Insurance Coverage by Household Income in Orr
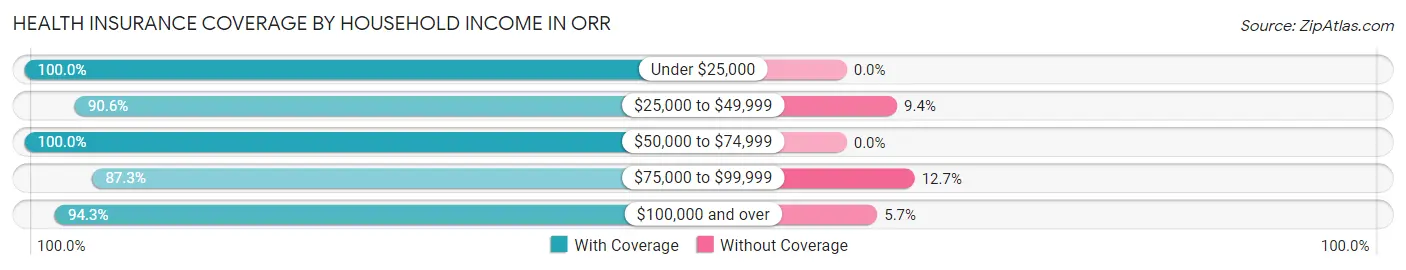
| Household Income | With Coverage | Without Coverage |
| Under $25,000 | 24 (100.0%) | 0 (0.0%) |
| $25,000 to $49,999 | 48 (90.6%) | 5 (9.4%) |
| $50,000 to $74,999 | 24 (100.0%) | 0 (0.0%) |
| $75,000 to $99,999 | 192 (87.3%) | 28 (12.7%) |
| $100,000 and over | 66 (94.3%) | 4 (5.7%) |
Public vs Private Health Insurance Coverage by Age in Orr
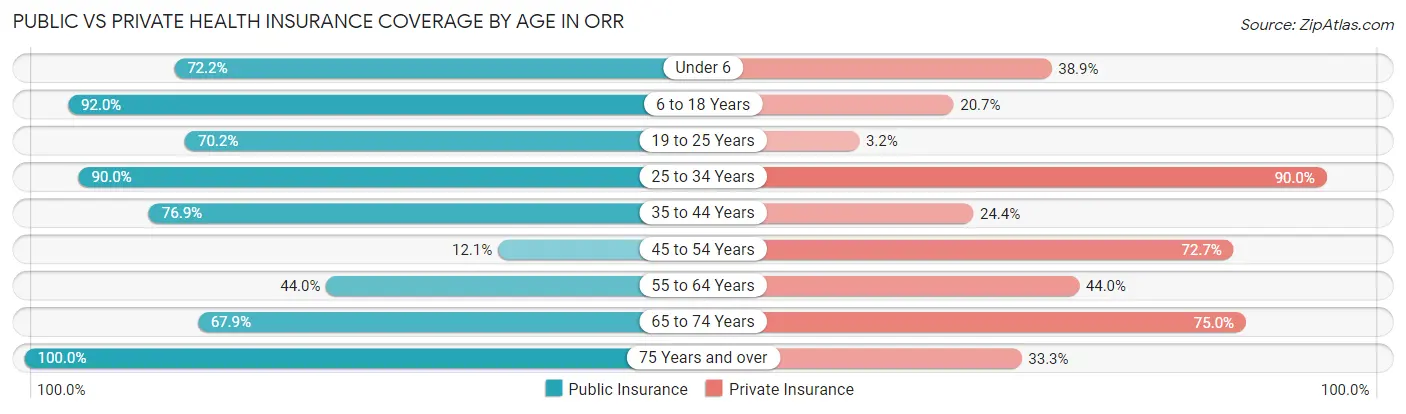
| Age Bracket | Public Insurance | Private Insurance |
| Under 6 | 13 (72.2%) | 7 (38.9%) |
| 6 to 18 Years | 80 (91.9%) | 18 (20.7%) |
| 19 to 25 Years | 66 (70.2%) | 3 (3.2%) |
| 25 to 34 Years | 9 (90.0%) | 9 (90.0%) |
| 35 to 44 Years | 60 (76.9%) | 19 (24.4%) |
| 45 to 54 Years | 4 (12.1%) | 24 (72.7%) |
| 55 to 64 Years | 11 (44.0%) | 11 (44.0%) |
| 65 to 74 Years | 19 (67.9%) | 21 (75.0%) |
| 75 Years and over | 18 (100.0%) | 6 (33.3%) |
| Total | 280 (71.6%) | 118 (30.2%) |
Disability Status by Sex by Age in Orr
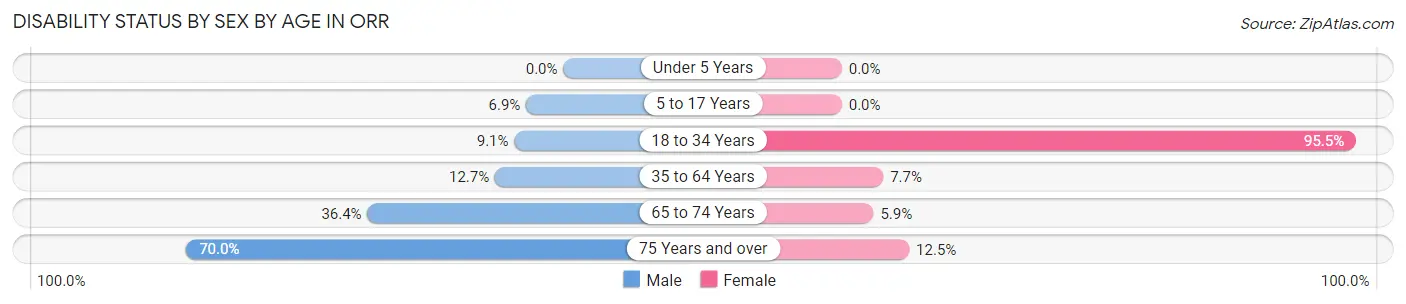
| Age Bracket | Male | Female |
| Under 5 Years | 0 (0.0%) | 0 (0.0%) |
| 5 to 17 Years | 4 (6.9%) | 0 (0.0%) |
| 18 to 34 Years | 4 (9.1%) | 63 (95.5%) |
| 35 to 64 Years | 9 (12.7%) | 5 (7.7%) |
| 65 to 74 Years | 4 (36.4%) | 1 (5.9%) |
| 75 Years and over | 7 (70.0%) | 1 (12.5%) |
Disability Class by Sex by Age in Orr
Disability Class: Hearing Difficulty
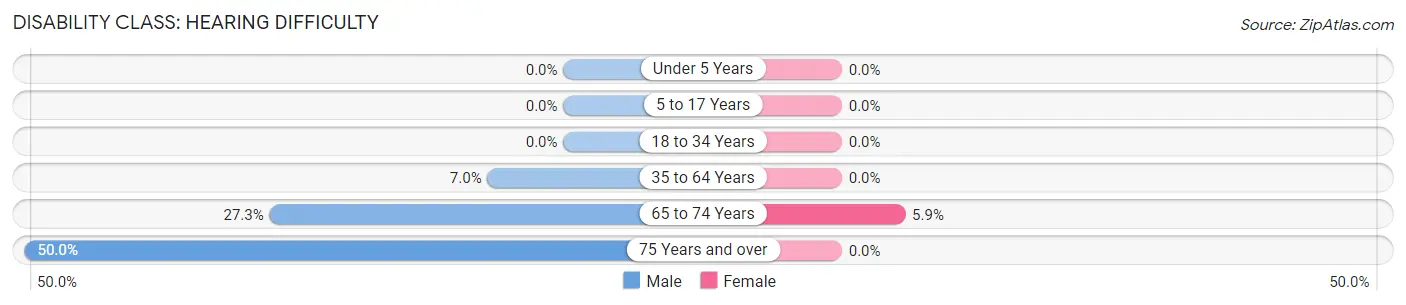
| Age Bracket | Male | Female |
| Under 5 Years | 0 (0.0%) | 0 (0.0%) |
| 5 to 17 Years | 0 (0.0%) | 0 (0.0%) |
| 18 to 34 Years | 0 (0.0%) | 0 (0.0%) |
| 35 to 64 Years | 5 (7.0%) | 0 (0.0%) |
| 65 to 74 Years | 3 (27.3%) | 1 (5.9%) |
| 75 Years and over | 5 (50.0%) | 0 (0.0%) |
Disability Class: Vision Difficulty
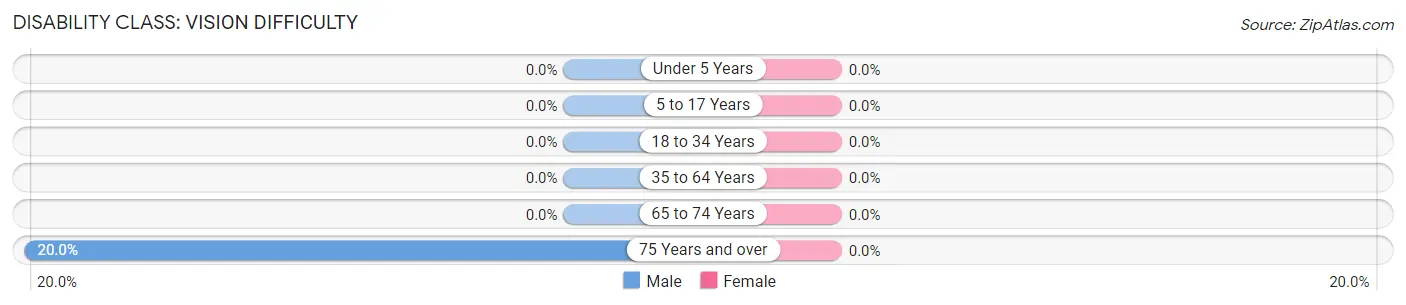
| Age Bracket | Male | Female |
| Under 5 Years | 0 (0.0%) | 0 (0.0%) |
| 5 to 17 Years | 0 (0.0%) | 0 (0.0%) |
| 18 to 34 Years | 0 (0.0%) | 0 (0.0%) |
| 35 to 64 Years | 0 (0.0%) | 0 (0.0%) |
| 65 to 74 Years | 0 (0.0%) | 0 (0.0%) |
| 75 Years and over | 2 (20.0%) | 0 (0.0%) |
Disability Class: Cognitive Difficulty
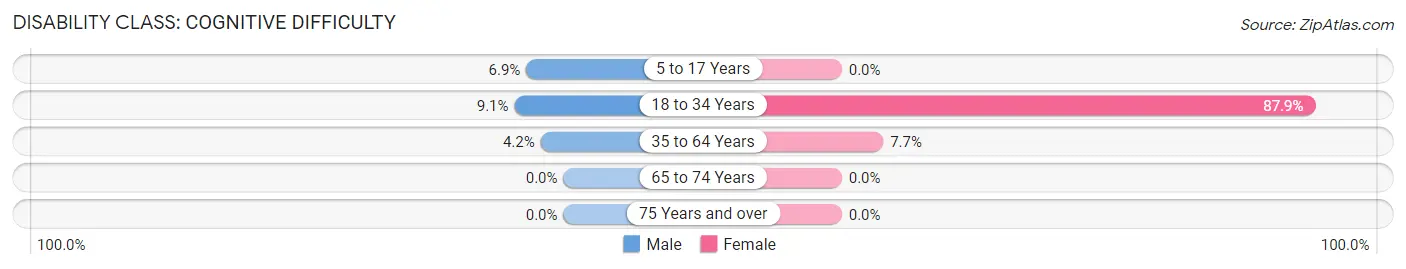
| Age Bracket | Male | Female |
| 5 to 17 Years | 4 (6.9%) | 0 (0.0%) |
| 18 to 34 Years | 4 (9.1%) | 58 (87.9%) |
| 35 to 64 Years | 3 (4.2%) | 5 (7.7%) |
| 65 to 74 Years | 0 (0.0%) | 0 (0.0%) |
| 75 Years and over | 0 (0.0%) | 0 (0.0%) |
Disability Class: Ambulatory Difficulty
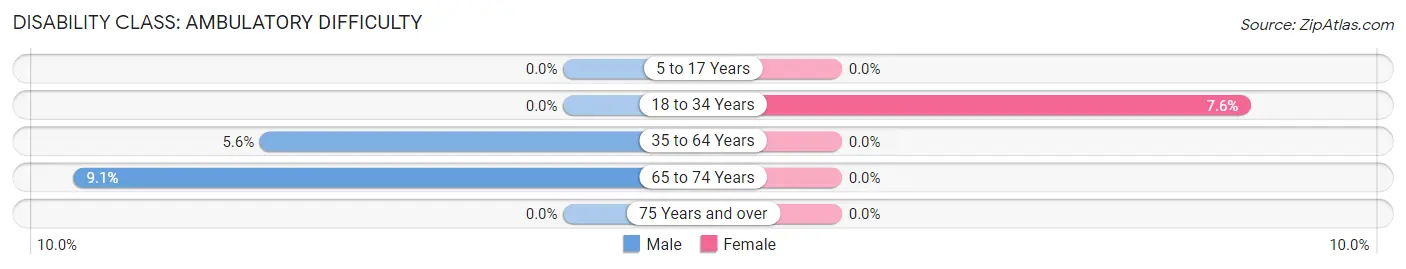
| Age Bracket | Male | Female |
| 5 to 17 Years | 0 (0.0%) | 0 (0.0%) |
| 18 to 34 Years | 0 (0.0%) | 5 (7.6%) |
| 35 to 64 Years | 4 (5.6%) | 0 (0.0%) |
| 65 to 74 Years | 1 (9.1%) | 0 (0.0%) |
| 75 Years and over | 0 (0.0%) | 0 (0.0%) |
Disability Class: Self-Care Difficulty
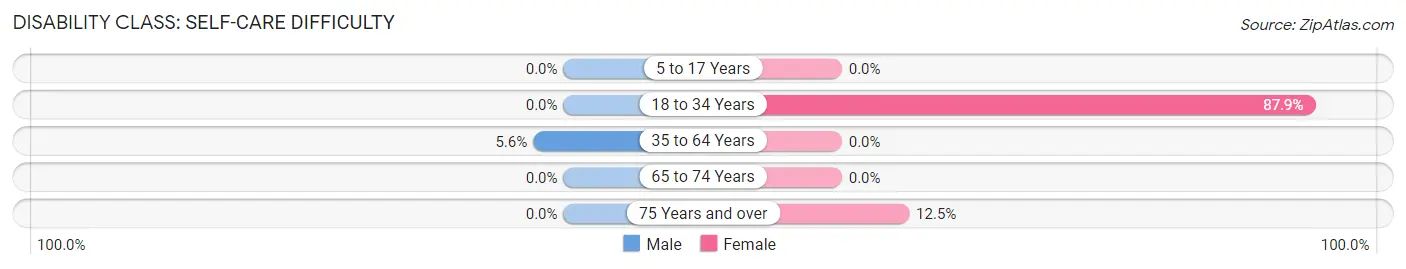
| Age Bracket | Male | Female |
| 5 to 17 Years | 0 (0.0%) | 0 (0.0%) |
| 18 to 34 Years | 0 (0.0%) | 58 (87.9%) |
| 35 to 64 Years | 4 (5.6%) | 0 (0.0%) |
| 65 to 74 Years | 0 (0.0%) | 0 (0.0%) |
| 75 Years and over | 0 (0.0%) | 1 (12.5%) |
Technology Access in Orr
Computing Device Access in Orr
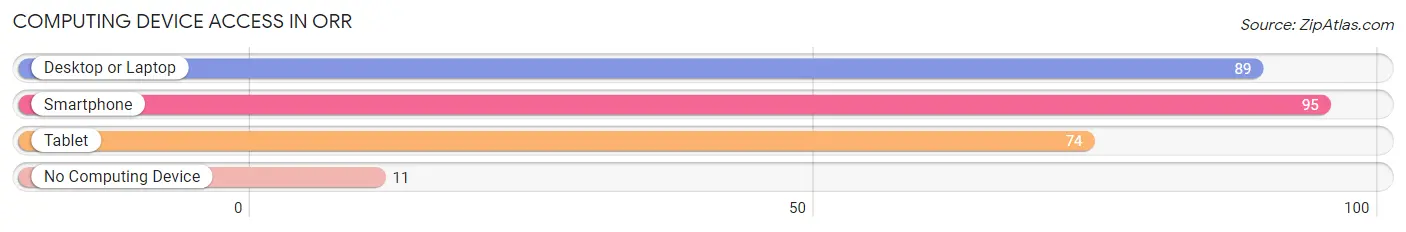
| Device Type | # Households | % Households |
| Desktop or Laptop | 89 | 77.4% |
| Smartphone | 95 | 82.6% |
| Tablet | 74 | 64.3% |
| No Computing Device | 11 | 9.6% |
| Total | 115 | 100.0% |
Internet Access in Orr
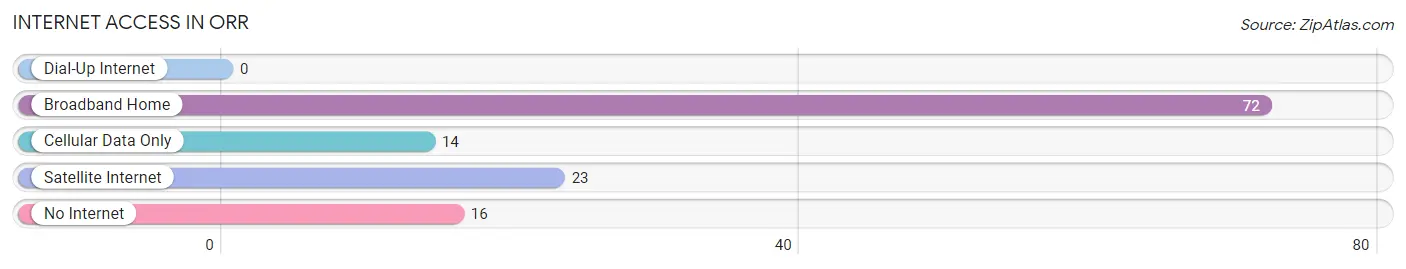
| Internet Type | # Households | % Households |
| Dial-Up Internet | 0 | 0.0% |
| Broadband Home | 72 | 62.6% |
| Cellular Data Only | 14 | 12.2% |
| Satellite Internet | 23 | 20.0% |
| No Internet | 16 | 13.9% |
| Total | 115 | 100.0% |
Orr Summary
Orr, Minnesota is a small city located in St. Louis County, in the northeastern part of the state. It is situated on the western shore of Rainy Lake, near the Canadian border. The city has a population of approximately 1,000 people, and is the county seat of St. Louis County.
History
The area that is now Orr was first settled in the late 1800s by a group of Finnish immigrants. The town was originally known as “Finn Town”, and was later renamed Orr in honor of the first postmaster, William Orr. The town was officially incorporated in 1906.
In the early 1900s, Orr was a thriving logging and mining town. The town was home to several sawmills, a flour mill, and a number of other businesses. The town also had a railroad station, which connected it to the rest of the state.
In the 1950s, the town began to decline as the logging and mining industries moved away. The railroad station closed in the 1960s, and the town’s population began to decline.
Geography
Orr is located in St. Louis County, in the northeastern part of the state. It is situated on the western shore of Rainy Lake, near the Canadian border. The city is located at the intersection of Minnesota State Highway 1 and Minnesota State Highway 11.
The city has a total area of 1.2 square miles, all of which is land. The terrain is mostly flat, with some rolling hills. The city is located in a temperate climate, with warm summers and cold winters.
Economy
The economy of Orr is largely based on tourism. The city is home to several resorts and lodges, which attract visitors from all over the state and beyond. The city is also home to a number of small businesses, including restaurants, shops, and other services.
The city is also home to a number of manufacturing companies, including a paper mill and a wood products plant. The city is also home to a number of logging and mining companies.
Demographics
As of the 2010 census, the population of Orr was 1,000 people. The racial makeup of the city was 97.2% White, 0.7% African American, 0.3% Native American, 0.2% Asian, 0.1% Pacific Islander, and 1.5% from other races.
The median household income in Orr was $37,500, and the median family income was $45,000. The per capita income was $19,000. About 10.3% of the population was below the poverty line.
Conclusion
Orr, Minnesota is a small city located in St. Louis County, in the northeastern part of the state. It is situated on the western shore of Rainy Lake, near the Canadian border. The city has a population of approximately 1,000 people, and is the county seat of St. Louis County. The economy of Orr is largely based on tourism, and the city is home to several resorts and lodges. The city is also home to a number of small businesses, manufacturing companies, and logging and mining companies. The racial makeup of the city is mostly White, with a small percentage of African American, Native American, Asian, and Pacific Islander residents. The median household income in Orr is $37,500, and the median family income is $45,000.
Common Questions
What is Per Capita Income in Orr?
Per Capita income in Orr is $25,764.
What is the Median Household income in Orr?
Median Household Income in Orr is $77,188.
What is Inequality or Gini Index in Orr?
Inequality or Gini Index in Orr is 0.28.
What is the Total Population of Orr?
Total Population of Orr is 393.
What is the Total Male Population of Orr?
Total Male Population of Orr is 194.
What is the Total Female Population of Orr?
Total Female Population of Orr is 199.
What is the Ratio of Males per 100 Females in Orr?
There are 97.49 Males per 100 Females in Orr.
What is the Ratio of Females per 100 Males in Orr?
There are 102.58 Females per 100 Males in Orr.
What is the Median Population Age in Orr?
Median Population Age in Orr is 25.7 Years.
What is the Average Family Size in Orr
Average Family Size in Orr is 2.7 People.
What is the Average Household Size in Orr
Average Household Size in Orr is 3.4 People.
How Large is the Labor Force in Orr?
There are 243 People in the Labor Forcein in Orr.
What is the Percentage of People in the Labor Force in Orr?
80.5% of People are in the Labor Force in Orr.