Norwood Young America, MN Map & Demographics
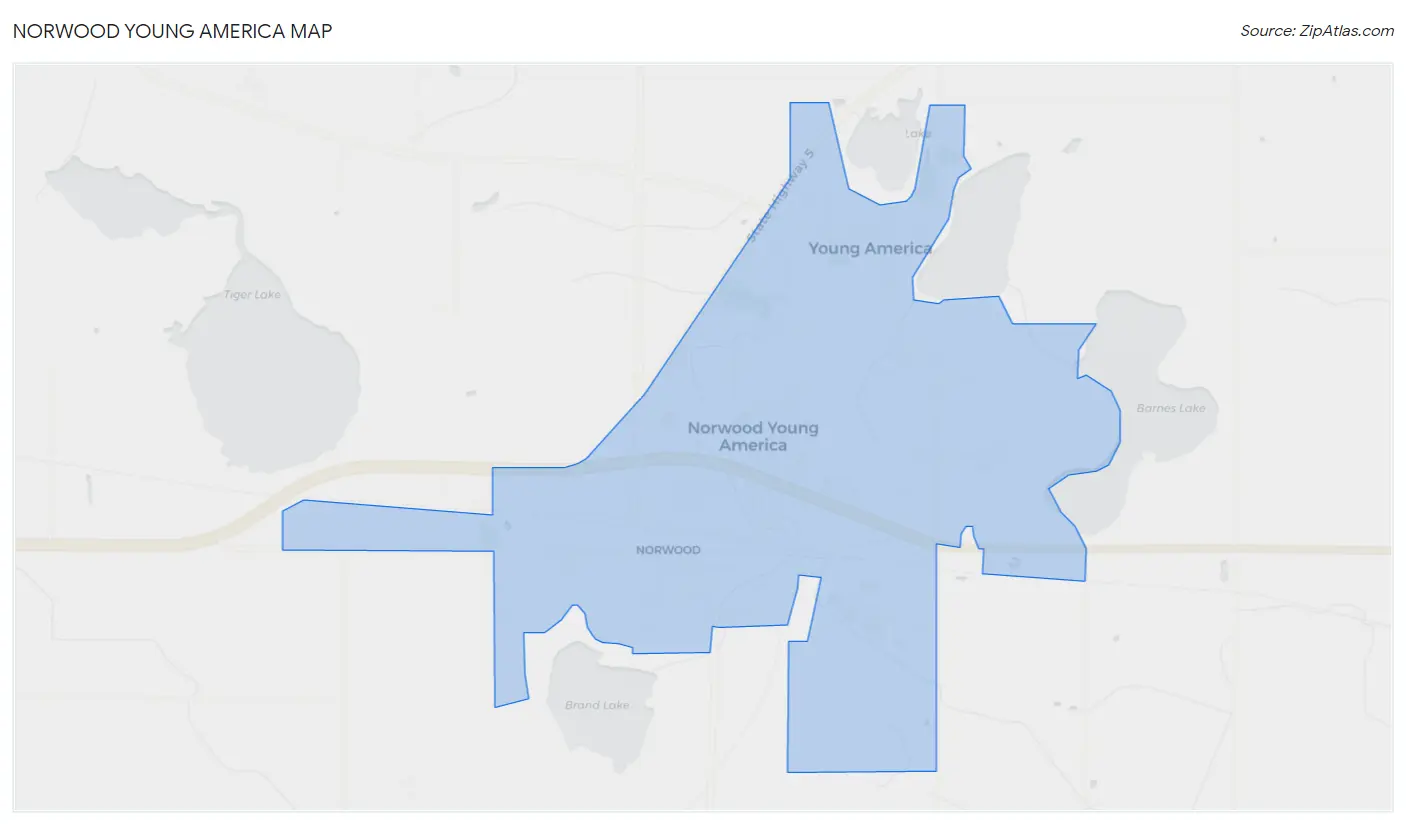
Norwood Young America Map
Norwood Young America Overview
$32,640
PER CAPITA INCOME
$93,214
AVG FAMILY INCOME
$76,538
AVG HOUSEHOLD INCOME
29.5%
WAGE / INCOME GAP [ % ]
70.5¢/ $1
WAGE / INCOME GAP [ $ ]
0.35
INEQUALITY / GINI INDEX
3,852
TOTAL POPULATION
1,976
MALE POPULATION
1,876
FEMALE POPULATION
105.33
MALES / 100 FEMALES
94.94
FEMALES / 100 MALES
36.8
MEDIAN AGE
3.3
AVG FAMILY SIZE
2.8
AVG HOUSEHOLD SIZE
2,090
LABOR FORCE [ PEOPLE ]
67.1%
PERCENT IN LABOR FORCE
5.4%
UNEMPLOYMENT RATE
Norwood Young America Zip Codes
Income in Norwood Young America
Income Overview in Norwood Young America
Per Capita Income in Norwood Young America is $32,640, while median incomes of families and households are $93,214 and $76,538 respectively.
| Characteristic | Number | Measure |
| Per Capita Income | 3,852 | $32,640 |
| Median Family Income | 932 | $93,214 |
| Mean Family Income | 932 | $102,537 |
| Median Household Income | 1,396 | $76,538 |
| Mean Household Income | 1,396 | $86,717 |
| Income Deficit | 932 | $0 |
| Wage / Income Gap (%) | 3,852 | 29.51% |
| Wage / Income Gap ($) | 3,852 | 70.49¢ per $1 |
| Gini / Inequality Index | 3,852 | 0.35 |
Earnings by Sex in Norwood Young America
Average Earnings in Norwood Young America are $50,787, $56,992 for men and $40,176 for women, a difference of 29.5%.
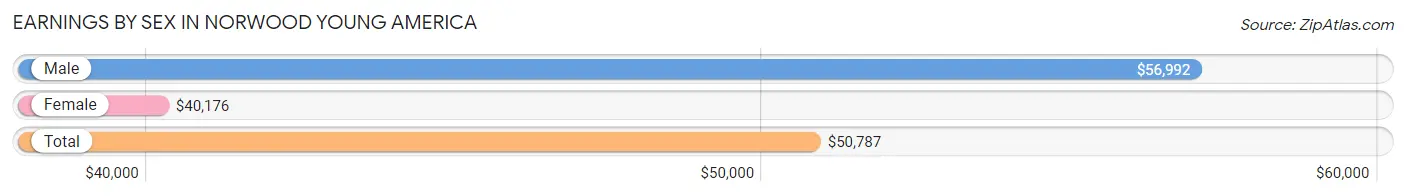
| Sex | Number | Average Earnings |
| Male | 1,165 (53.7%) | $56,992 |
| Female | 1,005 (46.3%) | $40,176 |
| Total | 2,170 (100.0%) | $50,787 |
Earnings by Sex by Income Bracket in Norwood Young America
The most common earnings brackets in Norwood Young America are $65,000 to $74,999 for men (223 | 19.1%) and $40,000 to $44,999 for women (126 | 12.5%).
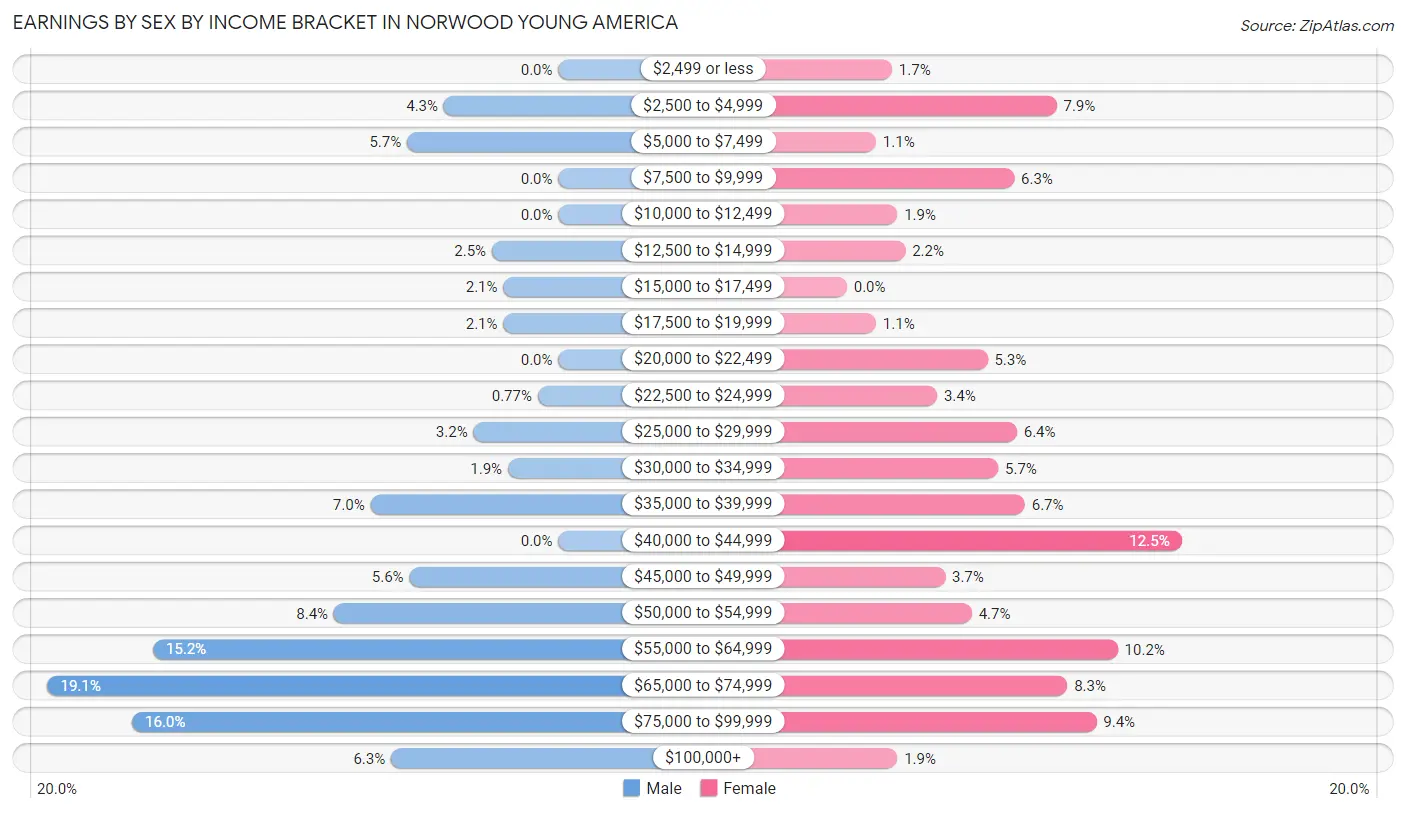
| Income | Male | Female |
| $2,499 or less | 0 (0.0%) | 17 (1.7%) |
| $2,500 to $4,999 | 50 (4.3%) | 79 (7.9%) |
| $5,000 to $7,499 | 66 (5.7%) | 11 (1.1%) |
| $7,500 to $9,999 | 0 (0.0%) | 63 (6.3%) |
| $10,000 to $12,499 | 0 (0.0%) | 19 (1.9%) |
| $12,500 to $14,999 | 29 (2.5%) | 22 (2.2%) |
| $15,000 to $17,499 | 24 (2.1%) | 0 (0.0%) |
| $17,500 to $19,999 | 24 (2.1%) | 11 (1.1%) |
| $20,000 to $22,499 | 0 (0.0%) | 53 (5.3%) |
| $22,500 to $24,999 | 9 (0.8%) | 34 (3.4%) |
| $25,000 to $29,999 | 37 (3.2%) | 64 (6.4%) |
| $30,000 to $34,999 | 22 (1.9%) | 57 (5.7%) |
| $35,000 to $39,999 | 82 (7.0%) | 67 (6.7%) |
| $40,000 to $44,999 | 0 (0.0%) | 126 (12.5%) |
| $45,000 to $49,999 | 65 (5.6%) | 37 (3.7%) |
| $50,000 to $54,999 | 98 (8.4%) | 47 (4.7%) |
| $55,000 to $64,999 | 177 (15.2%) | 102 (10.2%) |
| $65,000 to $74,999 | 223 (19.1%) | 83 (8.3%) |
| $75,000 to $99,999 | 186 (16.0%) | 94 (9.3%) |
| $100,000+ | 73 (6.3%) | 19 (1.9%) |
| Total | 1,165 (100.0%) | 1,005 (100.0%) |
Earnings by Sex by Educational Attainment in Norwood Young America
Average earnings in Norwood Young America are $63,281 for men and $41,667 for women, a difference of 34.2%. Men with an educational attainment of bachelor's degree enjoy the highest average annual earnings of $85,882, while those with high school diploma education earn the least with $47,167. Women with an educational attainment of bachelor's degree earn the most with the average annual earnings of $55,814, while those with high school diploma education have the smallest earnings of $37,542.
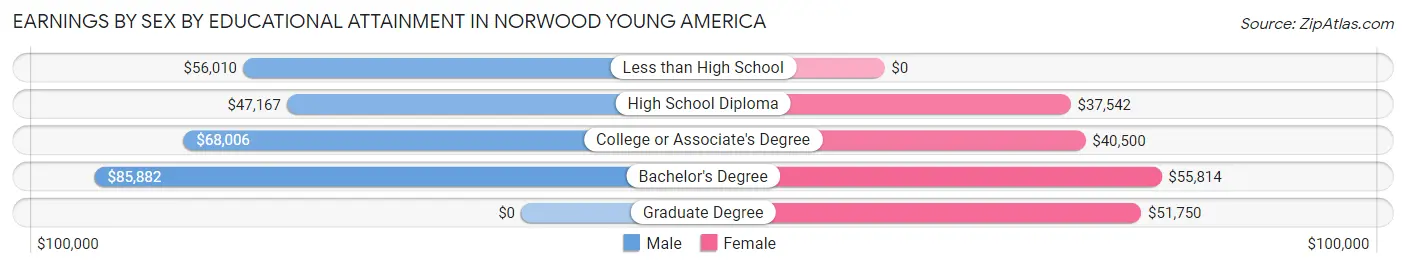
| Educational Attainment | Male Income | Female Income |
| Less than High School | $56,010 | $0 |
| High School Diploma | $47,167 | $37,542 |
| College or Associate's Degree | $68,006 | $40,500 |
| Bachelor's Degree | $85,882 | $55,814 |
| Graduate Degree | - | - |
| Total | $63,281 | $41,667 |
Family Income in Norwood Young America
Family Income Brackets in Norwood Young America
According to the Norwood Young America family income data, there are 229 families falling into the $50,000 to $74,999 income range, which is the most common income bracket and makes up 24.6% of all families.
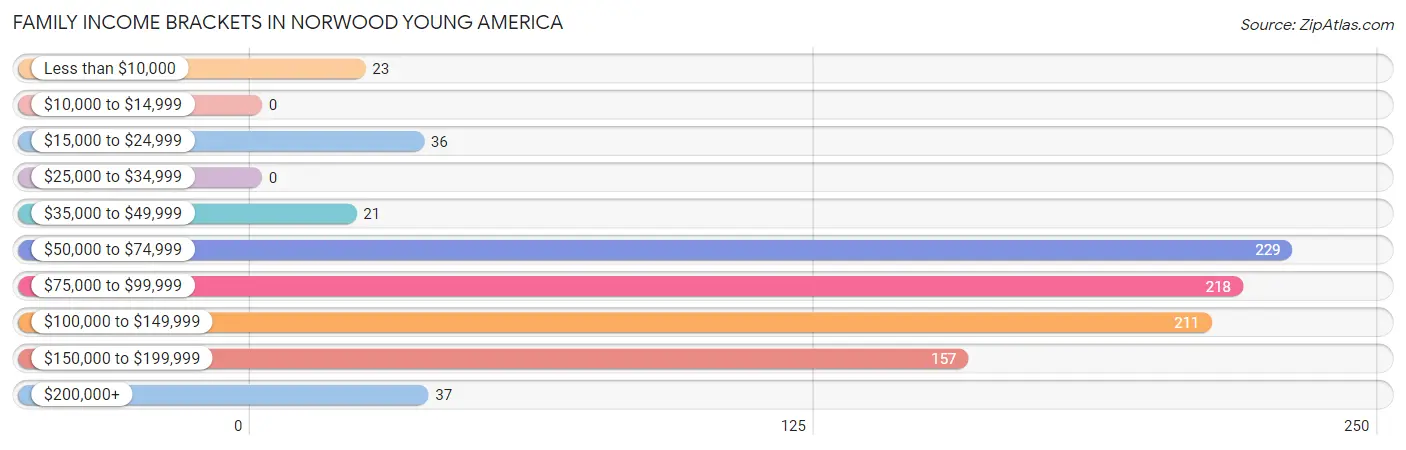
| Income Bracket | # Families | % Families |
| Less than $10,000 | 23 | 2.5% |
| $10,000 to $14,999 | 0 | 0.0% |
| $15,000 to $24,999 | 36 | 3.9% |
| $25,000 to $34,999 | 0 | 0.0% |
| $35,000 to $49,999 | 21 | 2.3% |
| $50,000 to $74,999 | 229 | 24.6% |
| $75,000 to $99,999 | 218 | 23.4% |
| $100,000 to $149,999 | 211 | 22.6% |
| $150,000 to $199,999 | 157 | 16.8% |
| $200,000+ | 37 | 4.0% |
Family Income by Famaliy Size in Norwood Young America
3-person families (138 | 14.8%) account for the highest median family income in Norwood Young America with $147,656 per family, while 3-person families (138 | 14.8%) have the highest median income of $49,219 per family member.
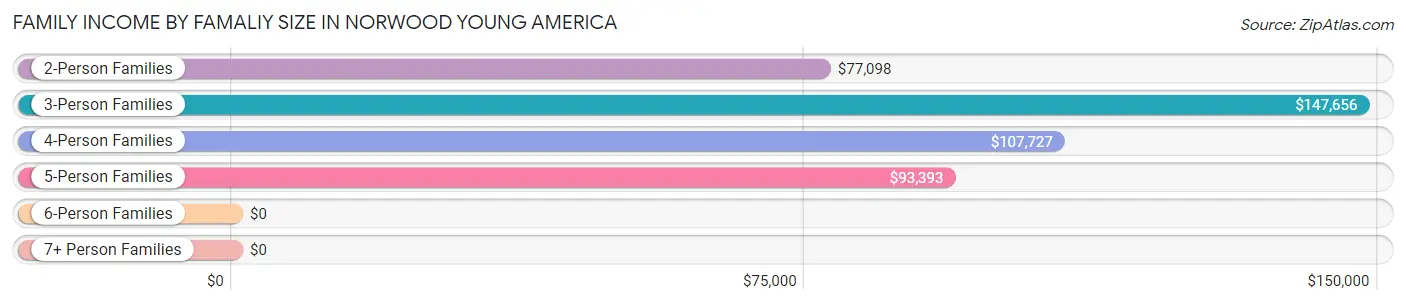
| Income Bracket | # Families | Median Income |
| 2-Person Families | 417 (44.7%) | $77,098 |
| 3-Person Families | 138 (14.8%) | $147,656 |
| 4-Person Families | 152 (16.3%) | $107,727 |
| 5-Person Families | 127 (13.6%) | $93,393 |
| 6-Person Families | 46 (4.9%) | $0 |
| 7+ Person Families | 52 (5.6%) | $0 |
| Total | 932 (100.0%) | $93,214 |
Family Income by Number of Earners in Norwood Young America
The median family income in Norwood Young America is $93,214, with families comprising 3+ earners (243) having the highest median family income of $156,118, while families with no earners (137) have the lowest median family income of $59,572, accounting for 26.1% and 14.7% of families, respectively.
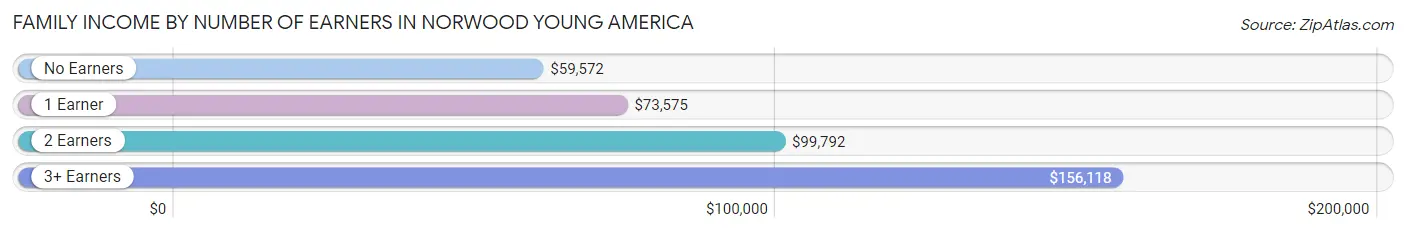
| Number of Earners | # Families | Median Income |
| No Earners | 137 (14.7%) | $59,572 |
| 1 Earner | 243 (26.1%) | $73,575 |
| 2 Earners | 309 (33.2%) | $99,792 |
| 3+ Earners | 243 (26.1%) | $156,118 |
| Total | 932 (100.0%) | $93,214 |
Household Income in Norwood Young America
Household Income Brackets in Norwood Young America
With 331 households falling in the category, the $50,000 to $74,999 income range is the most frequent in Norwood Young America, accounting for 23.7% of all households.
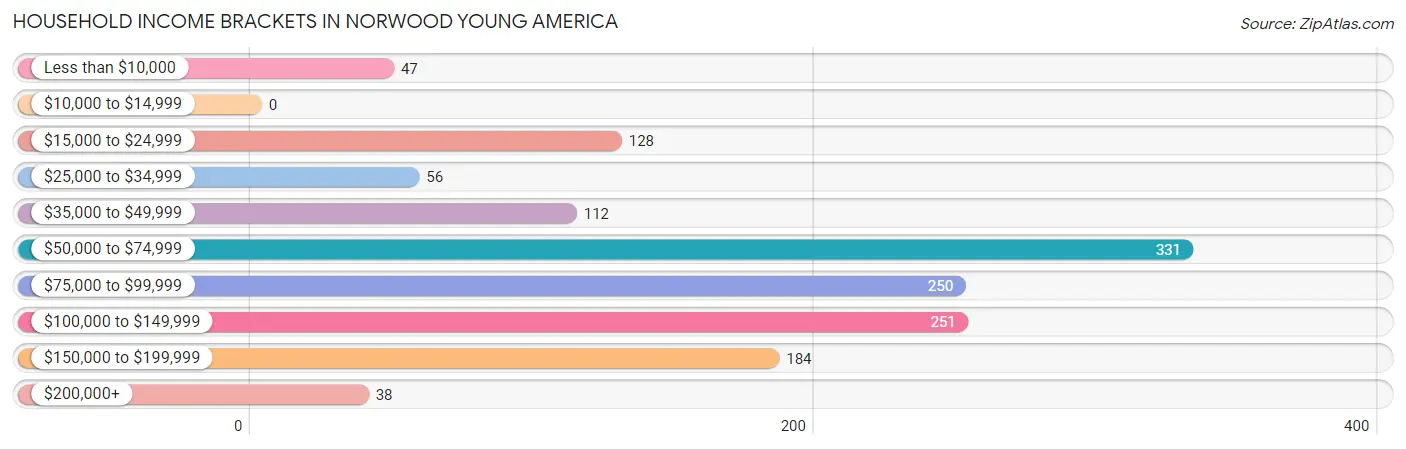
| Income Bracket | # Households | % Households |
| Less than $10,000 | 47 | 3.4% |
| $10,000 to $14,999 | 0 | 0.0% |
| $15,000 to $24,999 | 128 | 9.2% |
| $25,000 to $34,999 | 56 | 4.0% |
| $35,000 to $49,999 | 112 | 8.0% |
| $50,000 to $74,999 | 331 | 23.7% |
| $75,000 to $99,999 | 250 | 17.9% |
| $100,000 to $149,999 | 251 | 18.0% |
| $150,000 to $199,999 | 184 | 13.2% |
| $200,000+ | 38 | 2.7% |
Household Income by Householder Age in Norwood Young America
The median household income in Norwood Young America is $76,538, with the highest median household income of $108,977 found in the 25 to 44 years age bracket for the primary householder. A total of 555 households (39.8%) fall into this category. Meanwhile, the 15 to 24 years age bracket for the primary householder has the lowest median household income of $0, with 15 households (1.1%) in this group.
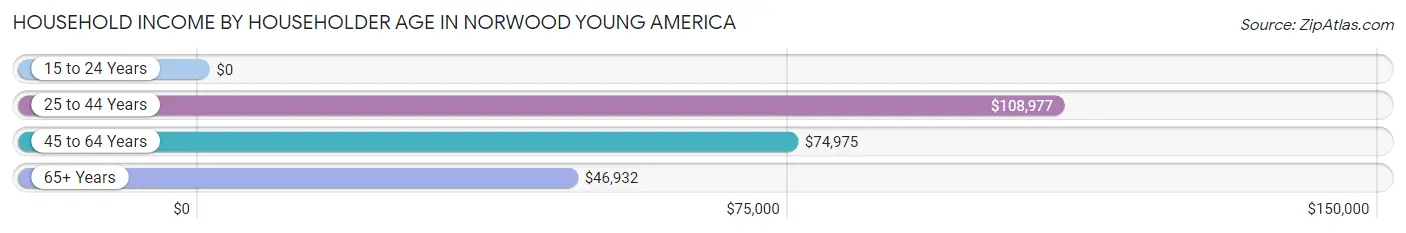
| Income Bracket | # Households | Median Income |
| 15 to 24 Years | 15 (1.1%) | $0 |
| 25 to 44 Years | 555 (39.8%) | $108,977 |
| 45 to 64 Years | 437 (31.3%) | $74,975 |
| 65+ Years | 389 (27.9%) | $46,932 |
| Total | 1,396 (100.0%) | $76,538 |
Poverty in Norwood Young America
Income Below Poverty by Sex and Age in Norwood Young America
With 3.1% poverty level for males and 14.0% for females among the residents of Norwood Young America, 12 to 14 year old males and 18 to 24 year old females are the most vulnerable to poverty, with 10 males (20.0%) and 71 females (52.2%) in their respective age groups living below the poverty level.
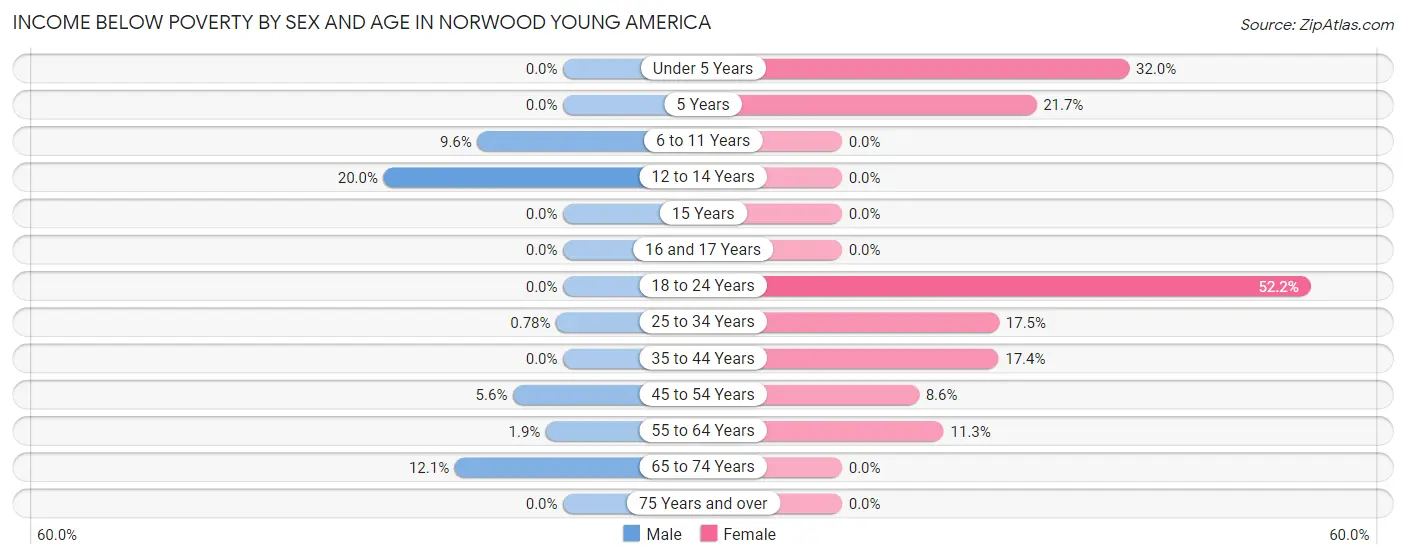
| Age Bracket | Male | Female |
| Under 5 Years | 0 (0.0%) | 32 (32.0%) |
| 5 Years | 0 (0.0%) | 21 (21.6%) |
| 6 to 11 Years | 17 (9.6%) | 0 (0.0%) |
| 12 to 14 Years | 10 (20.0%) | 0 (0.0%) |
| 15 Years | 0 (0.0%) | 0 (0.0%) |
| 16 and 17 Years | 0 (0.0%) | 0 (0.0%) |
| 18 to 24 Years | 0 (0.0%) | 71 (52.2%) |
| 25 to 34 Years | 2 (0.8%) | 53 (17.5%) |
| 35 to 44 Years | 0 (0.0%) | 38 (17.4%) |
| 45 to 54 Years | 15 (5.6%) | 18 (8.6%) |
| 55 to 64 Years | 3 (1.9%) | 28 (11.3%) |
| 65 to 74 Years | 14 (12.1%) | 0 (0.0%) |
| 75 Years and over | 0 (0.0%) | 0 (0.0%) |
| Total | 61 (3.1%) | 261 (14.0%) |
Income Above Poverty by Sex and Age in Norwood Young America
According to the poverty statistics in Norwood Young America, males aged under 5 years and females aged 6 to 11 years are the age groups that are most secure financially, with 100.0% of males and 100.0% of females in these age groups living above the poverty line.
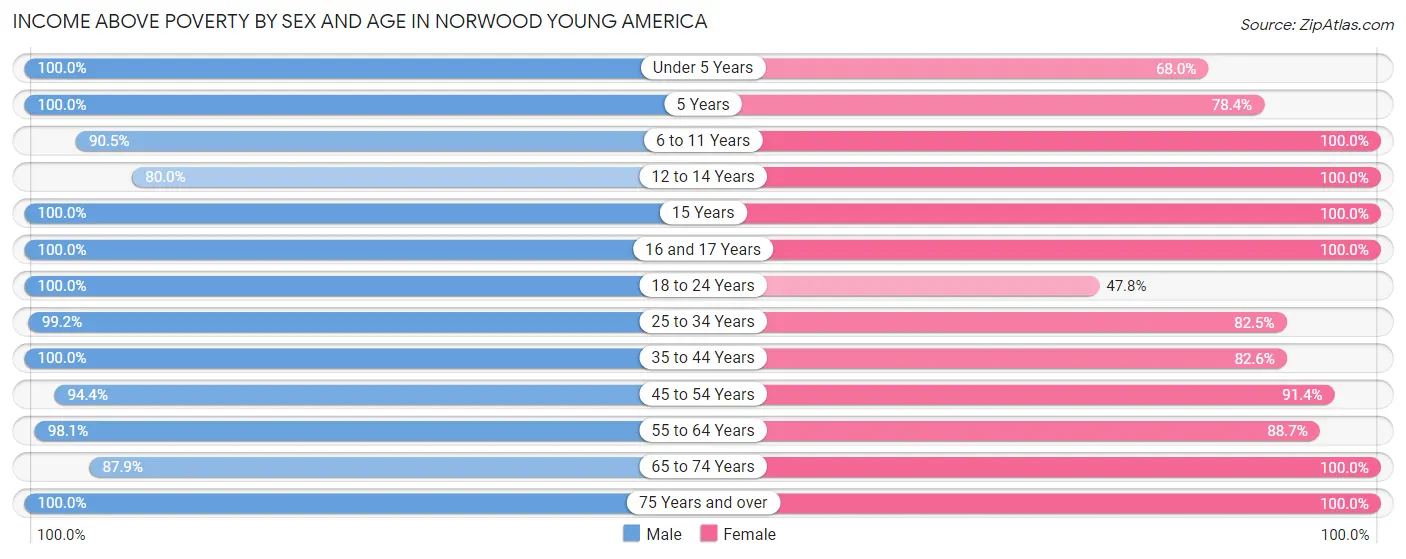
| Age Bracket | Male | Female |
| Under 5 Years | 128 (100.0%) | 68 (68.0%) |
| 5 Years | 23 (100.0%) | 76 (78.3%) |
| 6 to 11 Years | 161 (90.4%) | 53 (100.0%) |
| 12 to 14 Years | 40 (80.0%) | 81 (100.0%) |
| 15 Years | 16 (100.0%) | 11 (100.0%) |
| 16 and 17 Years | 93 (100.0%) | 57 (100.0%) |
| 18 to 24 Years | 179 (100.0%) | 65 (47.8%) |
| 25 to 34 Years | 254 (99.2%) | 250 (82.5%) |
| 35 to 44 Years | 360 (100.0%) | 180 (82.6%) |
| 45 to 54 Years | 254 (94.4%) | 192 (91.4%) |
| 55 to 64 Years | 154 (98.1%) | 219 (88.7%) |
| 65 to 74 Years | 102 (87.9%) | 121 (100.0%) |
| 75 Years and over | 151 (100.0%) | 235 (100.0%) |
| Total | 1,915 (96.9%) | 1,608 (86.0%) |
Income Below Poverty Among Married-Couple Families in Norwood Young America
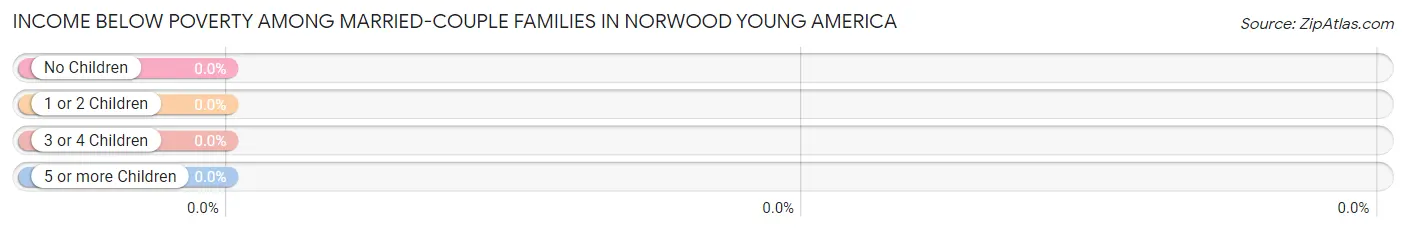
| Children | Above Poverty | Below Poverty |
| No Children | 484 (100.0%) | 0 (0.0%) |
| 1 or 2 Children | 170 (100.0%) | 0 (0.0%) |
| 3 or 4 Children | 191 (100.0%) | 0 (0.0%) |
| 5 or more Children | 0 (0.0%) | 0 (0.0%) |
| Total | 845 (100.0%) | 0 (0.0%) |
Income Below Poverty Among Single-Parent Households in Norwood Young America
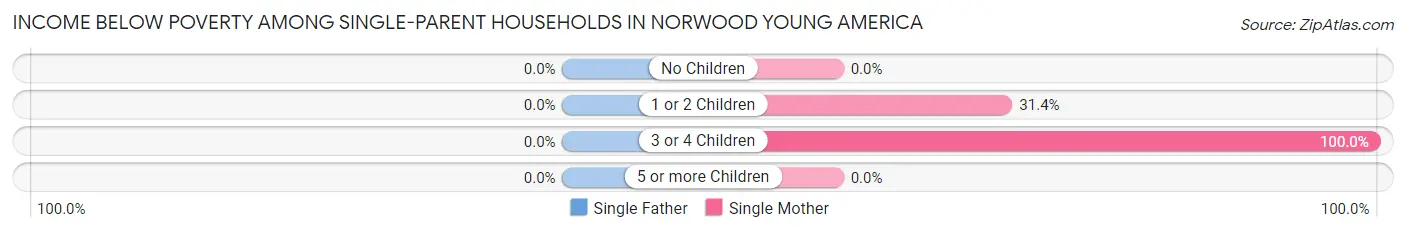
| Children | Single Father | Single Mother |
| No Children | 0 (0.0%) | 0 (0.0%) |
| 1 or 2 Children | 0 (0.0%) | 11 (31.4%) |
| 3 or 4 Children | 0 (0.0%) | 23 (100.0%) |
| 5 or more Children | 0 (0.0%) | 0 (0.0%) |
| Total | 0 (0.0%) | 34 (48.6%) |
Income Below Poverty Among Married-Couple vs Single-Parent Households in Norwood Young America
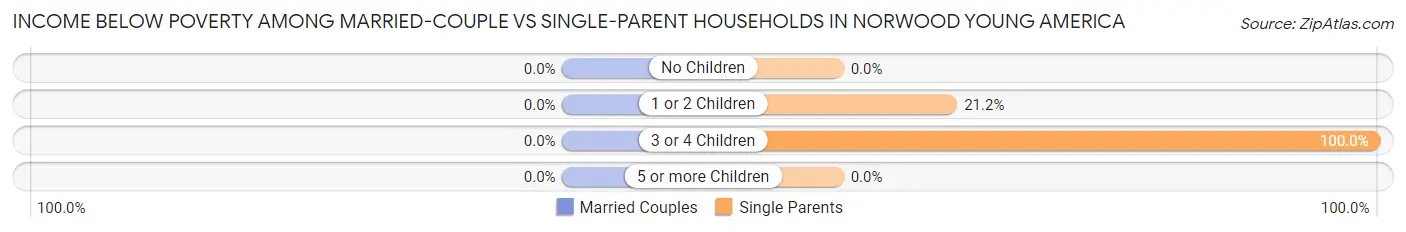
| Children | Married-Couple Families | Single-Parent Households |
| No Children | 0 (0.0%) | 0 (0.0%) |
| 1 or 2 Children | 0 (0.0%) | 11 (21.1%) |
| 3 or 4 Children | 0 (0.0%) | 23 (100.0%) |
| 5 or more Children | 0 (0.0%) | 0 (0.0%) |
| Total | 0 (0.0%) | 34 (39.1%) |
Race in Norwood Young America
The most populous races in Norwood Young America are White / Caucasian (3,468 | 90.0%), Hispanic or Latino (293 | 7.6%), and Some other Race (255 | 6.6%).
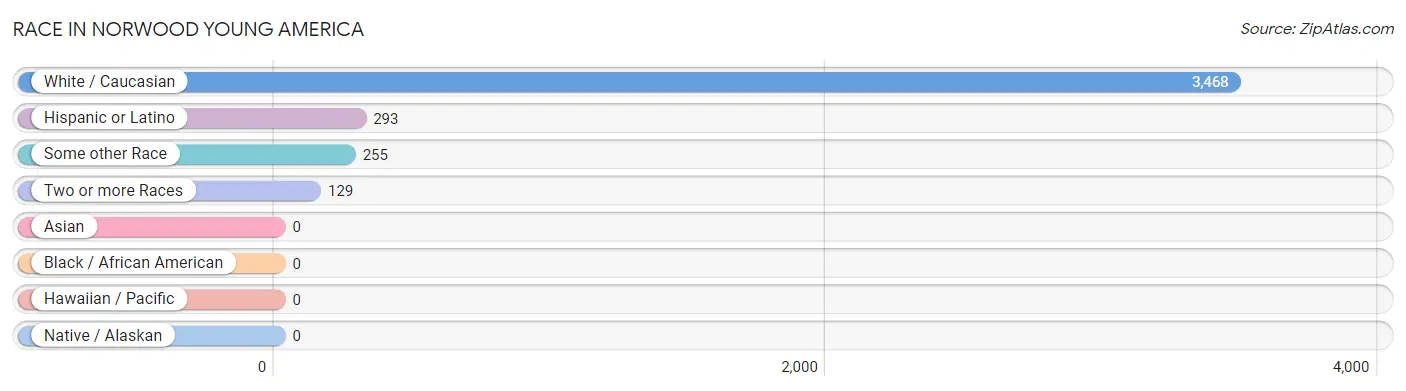
| Race | # Population | % Population |
| Asian | 0 | 0.0% |
| Black / African American | 0 | 0.0% |
| Hawaiian / Pacific | 0 | 0.0% |
| Hispanic or Latino | 293 | 7.6% |
| Native / Alaskan | 0 | 0.0% |
| White / Caucasian | 3,468 | 90.0% |
| Two or more Races | 129 | 3.4% |
| Some other Race | 255 | 6.6% |
| Total | 3,852 | 100.0% |
Ancestry in Norwood Young America
The most populous ancestries reported in Norwood Young America are German (1,886 | 49.0%), English (387 | 10.1%), Norwegian (344 | 8.9%), Mexican (263 | 6.8%), and Irish (243 | 6.3%), together accounting for 81.1% of all Norwood Young America residents.
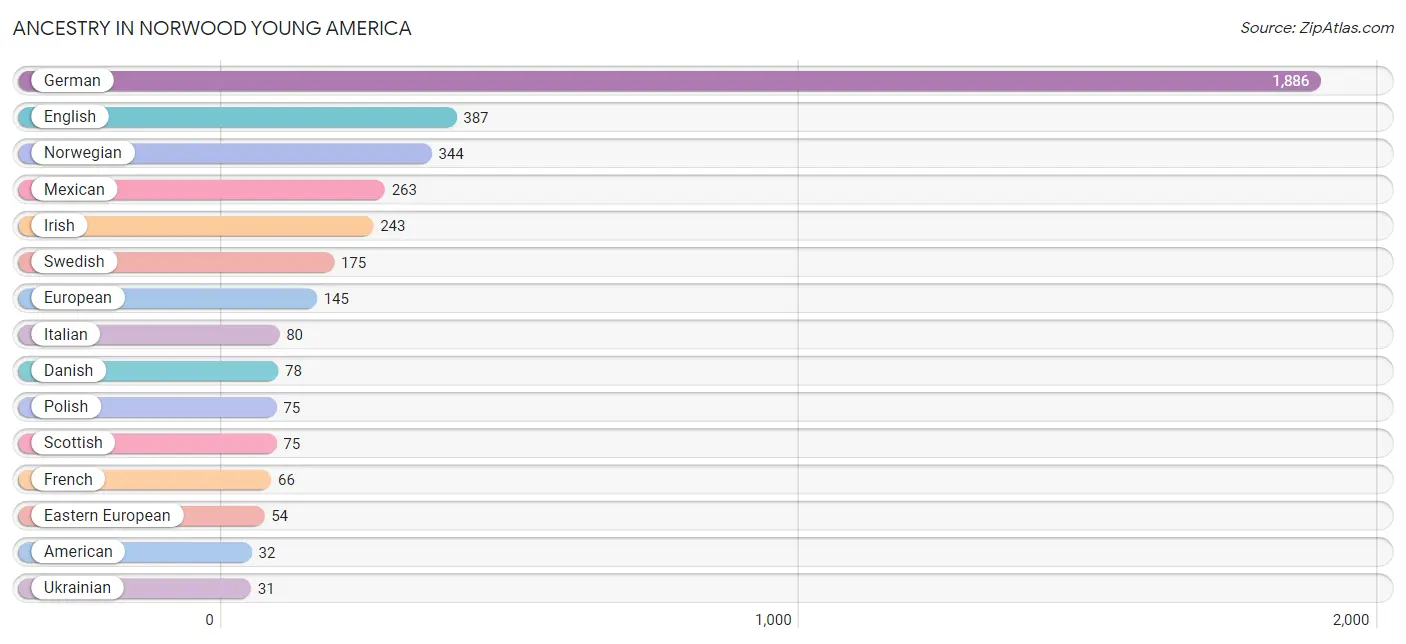
| Ancestry | # Population | % Population |
| American | 32 | 0.8% |
| Austrian | 13 | 0.3% |
| Czech | 16 | 0.4% |
| Danish | 78 | 2.0% |
| Dutch | 15 | 0.4% |
| Eastern European | 54 | 1.4% |
| English | 387 | 10.1% |
| European | 145 | 3.8% |
| Finnish | 18 | 0.5% |
| French | 66 | 1.7% |
| French Canadian | 19 | 0.5% |
| German | 1,886 | 49.0% |
| Irish | 243 | 6.3% |
| Italian | 80 | 2.1% |
| Mexican | 263 | 6.8% |
| Norwegian | 344 | 8.9% |
| Polish | 75 | 1.9% |
| Russian | 11 | 0.3% |
| Scandinavian | 16 | 0.4% |
| Scottish | 75 | 1.9% |
| Spanish | 30 | 0.8% |
| Swedish | 175 | 4.5% |
| Ukrainian | 31 | 0.8% |
| Welsh | 12 | 0.3% | View All 24 Rows |
Immigrants in Norwood Young America
The most numerous immigrant groups reported in Norwood Young America came from Central America (171 | 4.4%), Latin America (171 | 4.4%), Mexico (171 | 4.4%), Europe (16 | 0.4%), and Germany (16 | 0.4%), together accounting for 14.2% of all Norwood Young America residents.
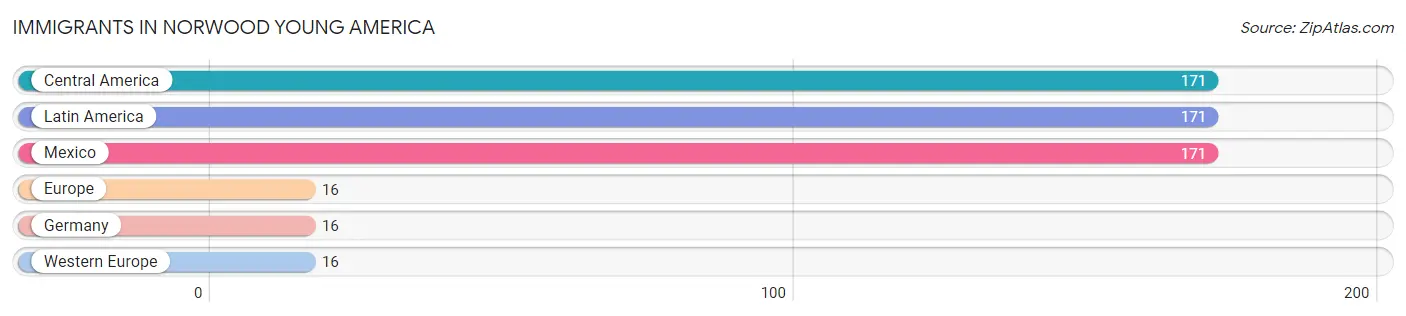
| Immigration Origin | # Population | % Population |
| Central America | 171 | 4.4% |
| Europe | 16 | 0.4% |
| Germany | 16 | 0.4% |
| Latin America | 171 | 4.4% |
| Mexico | 171 | 4.4% |
| Western Europe | 16 | 0.4% | View All 6 Rows |
Sex and Age in Norwood Young America
Sex and Age in Norwood Young America
The most populous age groups in Norwood Young America are 35 to 39 Years (229 | 11.6%) for men and 25 to 29 Years (201 | 10.7%) for women.
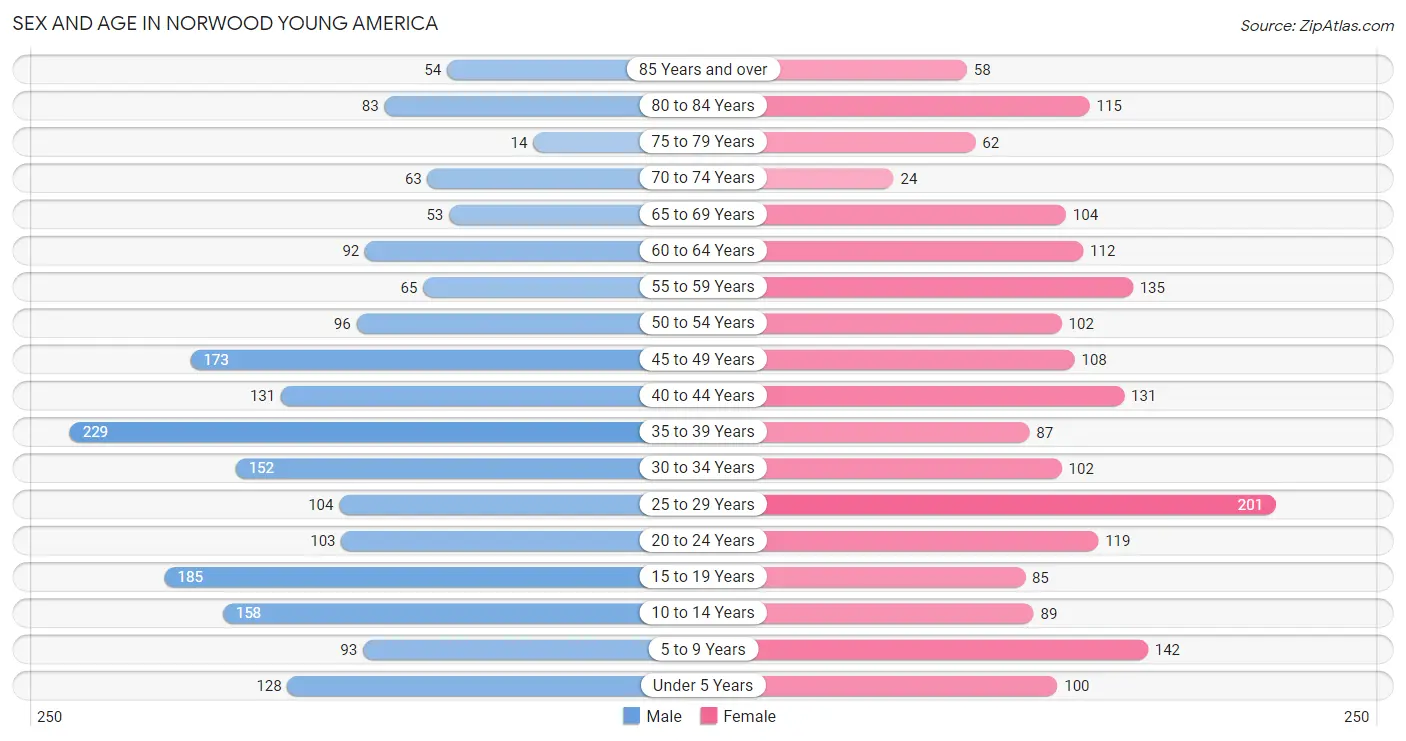
| Age Bracket | Male | Female |
| Under 5 Years | 128 (6.5%) | 100 (5.3%) |
| 5 to 9 Years | 93 (4.7%) | 142 (7.6%) |
| 10 to 14 Years | 158 (8.0%) | 89 (4.7%) |
| 15 to 19 Years | 185 (9.4%) | 85 (4.5%) |
| 20 to 24 Years | 103 (5.2%) | 119 (6.3%) |
| 25 to 29 Years | 104 (5.3%) | 201 (10.7%) |
| 30 to 34 Years | 152 (7.7%) | 102 (5.4%) |
| 35 to 39 Years | 229 (11.6%) | 87 (4.6%) |
| 40 to 44 Years | 131 (6.6%) | 131 (7.0%) |
| 45 to 49 Years | 173 (8.8%) | 108 (5.8%) |
| 50 to 54 Years | 96 (4.9%) | 102 (5.4%) |
| 55 to 59 Years | 65 (3.3%) | 135 (7.2%) |
| 60 to 64 Years | 92 (4.7%) | 112 (6.0%) |
| 65 to 69 Years | 53 (2.7%) | 104 (5.5%) |
| 70 to 74 Years | 63 (3.2%) | 24 (1.3%) |
| 75 to 79 Years | 14 (0.7%) | 62 (3.3%) |
| 80 to 84 Years | 83 (4.2%) | 115 (6.1%) |
| 85 Years and over | 54 (2.7%) | 58 (3.1%) |
| Total | 1,976 (100.0%) | 1,876 (100.0%) |
Families and Households in Norwood Young America
Median Family Size in Norwood Young America
The median family size in Norwood Young America is 3.30 persons per family, with married-couple families (845 | 90.7%) accounting for the largest median family size of 3.36 persons per family. On the other hand, single male/father families (17 | 1.8%) represent the smallest median family size with 1.65 persons per family.
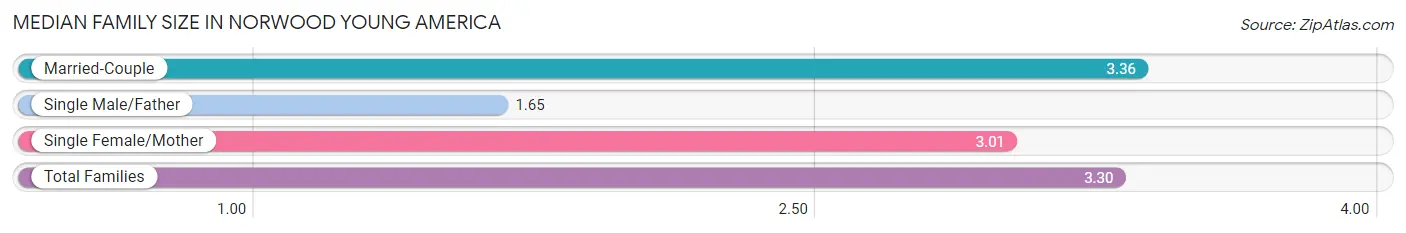
| Family Type | # Families | Family Size |
| Married-Couple | 845 (90.7%) | 3.36 |
| Single Male/Father | 17 (1.8%) | 1.65 |
| Single Female/Mother | 70 (7.5%) | 3.01 |
| Total Families | 932 (100.0%) | 3.30 |
Median Household Size in Norwood Young America
The median household size in Norwood Young America is 2.75 persons per household, with single female/mother households (70 | 5.0%) accounting for the largest median household size of 4.51 persons per household. non-family households (464 | 33.2%) represent the smallest median household size with 1.27 persons per household.
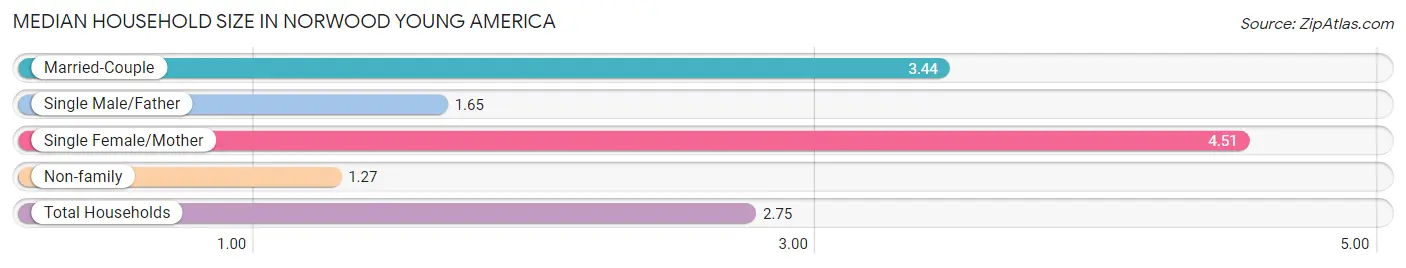
| Household Type | # Households | Household Size |
| Married-Couple | 845 (60.5%) | 3.44 |
| Single Male/Father | 17 (1.2%) | 1.65 |
| Single Female/Mother | 70 (5.0%) | 4.51 |
| Non-family | 464 (33.2%) | 1.27 |
| Total Households | 1,396 (100.0%) | 2.75 |
Household Size by Marriage Status in Norwood Young America
Out of a total of 1,396 households in Norwood Young America, 932 (66.8%) are family households, while 464 (33.2%) are nonfamily households. The most numerous type of family households are 2-person households, comprising 406, and the most common type of nonfamily households are 1-person households, comprising 335.
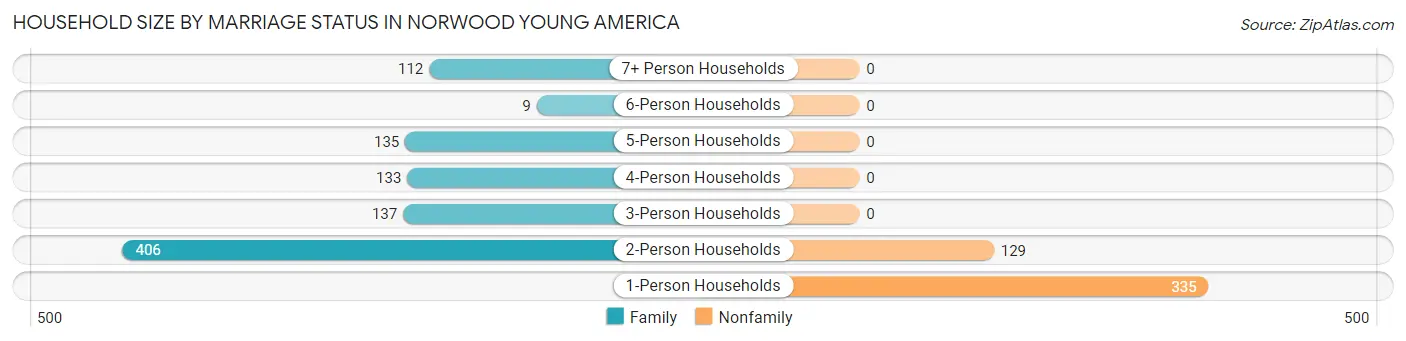
| Household Size | Family Households | Nonfamily Households |
| 1-Person Households | - | 335 (24.0%) |
| 2-Person Households | 406 (29.1%) | 129 (9.2%) |
| 3-Person Households | 137 (9.8%) | 0 (0.0%) |
| 4-Person Households | 133 (9.5%) | 0 (0.0%) |
| 5-Person Households | 135 (9.7%) | 0 (0.0%) |
| 6-Person Households | 9 (0.6%) | 0 (0.0%) |
| 7+ Person Households | 112 (8.0%) | 0 (0.0%) |
| Total | 932 (66.8%) | 464 (33.2%) |
Female Fertility in Norwood Young America
Fertility by Age in Norwood Young America
| Age Bracket | Women with Births | Births / 1,000 Women |
| 15 to 19 years | 0 (0.0%) | 0.0 |
| 20 to 34 years | 0 (0.0%) | 0.0 |
| 35 to 50 years | 0 (0.0%) | 0.0 |
| Total | 0 (0.0%) | 0.0 |
Fertility by Age by Marriage Status in Norwood Young America
| Age Bracket | Married | Unmarried |
| 15 to 19 years | 0 (0.0%) | 0 (0.0%) |
| 20 to 34 years | 0 (0.0%) | 0 (0.0%) |
| 35 to 50 years | 0 (0.0%) | 0 (0.0%) |
| Total | 0 (0.0%) | 0 (0.0%) |
Fertility by Education in Norwood Young America
| Educational Attainment | Women with Births | Births / 1,000 Women |
| Less than High School | 0 (0.0%) | 0.0 |
| High School Diploma | 0 (0.0%) | 0.0 |
| College or Associate's Degree | 0 (0.0%) | 0.0 |
| Bachelor's Degree | 0 (0.0%) | 0.0 |
| Graduate Degree | 0 (0.0%) | 0.0 |
| Total | 0 (0.0%) | 0.0 |
Fertility by Education by Marriage Status in Norwood Young America
| Educational Attainment | Married | Unmarried |
| Less than High School | 0 (0.0%) | 0 (0.0%) |
| High School Diploma | 0 (0.0%) | 0 (0.0%) |
| College or Associate's Degree | 0 (0.0%) | 0 (0.0%) |
| Bachelor's Degree | 0 (0.0%) | 0 (0.0%) |
| Graduate Degree | 0 (0.0%) | 0 (0.0%) |
| Total | 0 (0.0%) | 0 (0.0%) |
Employment Characteristics in Norwood Young America
Employment by Class of Employer in Norwood Young America
Among the 1,963 employed individuals in Norwood Young America, private company employees (1,627 | 82.9%), not-for-profit organizations (113 | 5.8%), and local government employees (70 | 3.6%) make up the most common classes of employment.
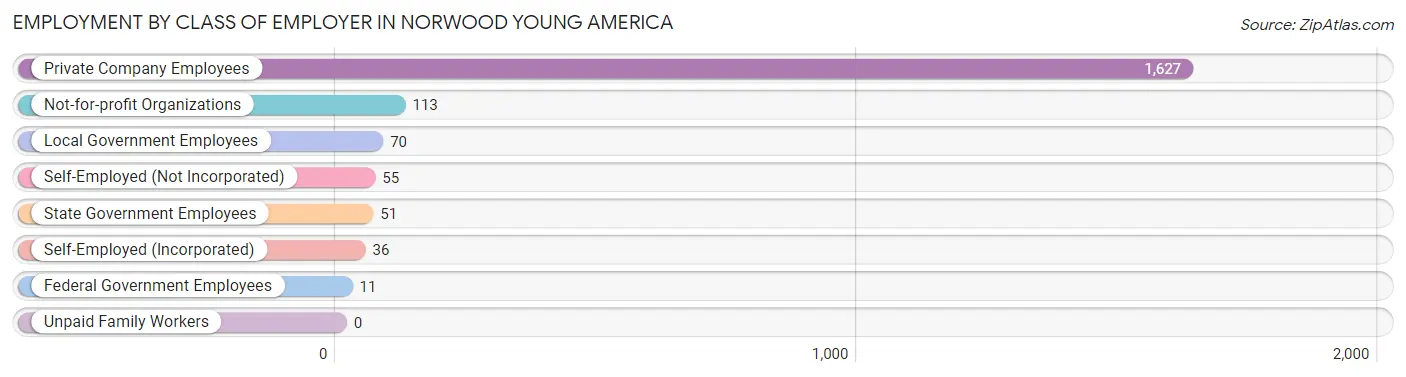
| Employer Class | # Employees | % Employees |
| Private Company Employees | 1,627 | 82.9% |
| Self-Employed (Incorporated) | 36 | 1.8% |
| Self-Employed (Not Incorporated) | 55 | 2.8% |
| Not-for-profit Organizations | 113 | 5.8% |
| Local Government Employees | 70 | 3.6% |
| State Government Employees | 51 | 2.6% |
| Federal Government Employees | 11 | 0.6% |
| Unpaid Family Workers | 0 | 0.0% |
| Total | 1,963 | 100.0% |
Employment Status by Age in Norwood Young America
According to the labor force statistics for Norwood Young America, out of the total population over 16 years of age (3,115), 67.1% or 2,090 individuals are in the labor force, with 5.4% or 113 of them unemployed. The age group with the highest labor force participation rate is 35 to 44 years, with 93.4% or 540 individuals in the labor force. Within the labor force, the 20 to 24 years age range has the highest percentage of unemployed individuals, with 28.3% or 56 of them being unemployed.
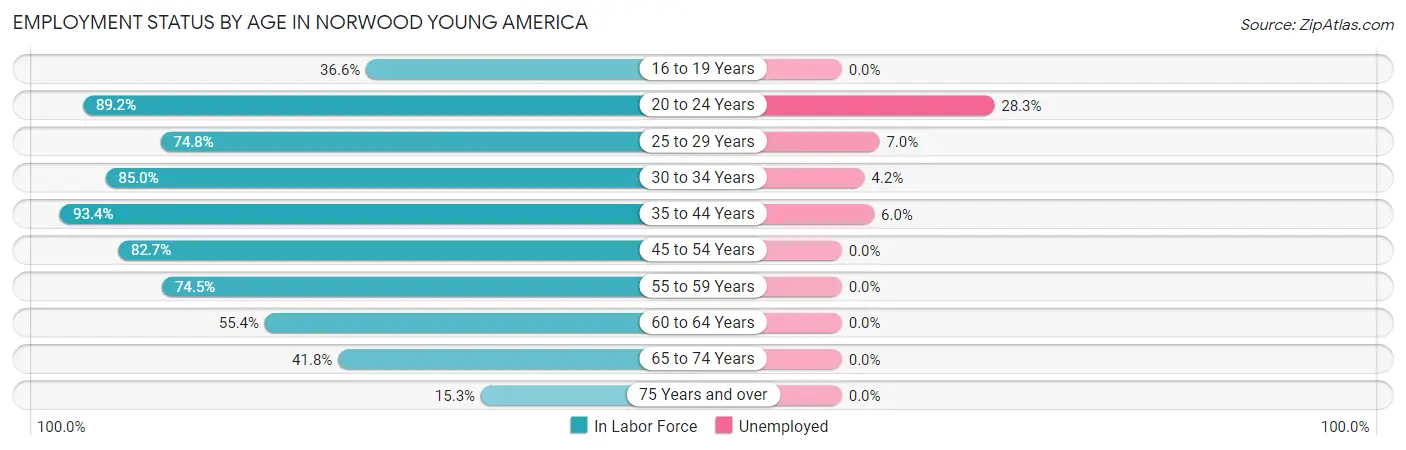
| Age Bracket | In Labor Force | Unemployed |
| 16 to 19 Years | 89 (36.6%) | 0 (0.0%) |
| 20 to 24 Years | 198 (89.2%) | 56 (28.3%) |
| 25 to 29 Years | 228 (74.8%) | 16 (7.0%) |
| 30 to 34 Years | 216 (85.0%) | 9 (4.2%) |
| 35 to 44 Years | 540 (93.4%) | 32 (6.0%) |
| 45 to 54 Years | 396 (82.7%) | 0 (0.0%) |
| 55 to 59 Years | 149 (74.5%) | 0 (0.0%) |
| 60 to 64 Years | 113 (55.4%) | 0 (0.0%) |
| 65 to 74 Years | 102 (41.8%) | 0 (0.0%) |
| 75 Years and over | 59 (15.3%) | 0 (0.0%) |
| Total | 2,090 (67.1%) | 113 (5.4%) |
Employment Status by Educational Attainment in Norwood Young America
According to labor force statistics for Norwood Young America, 81.3% of individuals (1,642) out of the total population between 25 and 64 years of age (2,020) are in the labor force, with 3.5% or 57 of them being unemployed. The group with the highest labor force participation rate are those with the educational attainment of bachelor's degree or higher, with 100.0% or 562 individuals in the labor force. Within the labor force, individuals with college / associate degree education have the highest percentage of unemployment, with 5.7% or 33 of them being unemployed.
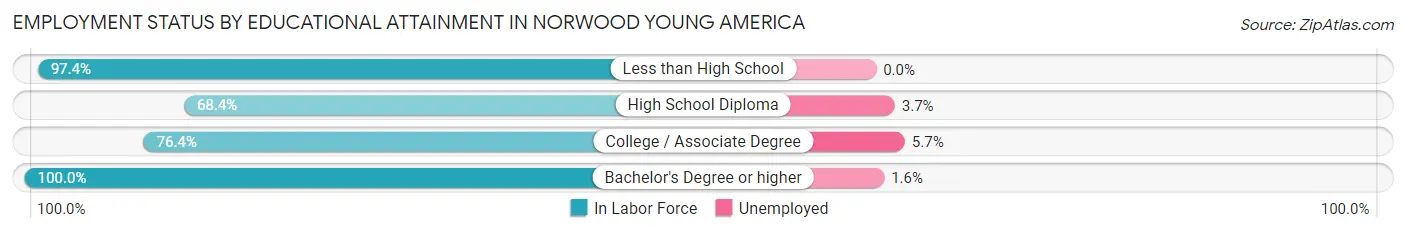
| Educational Attainment | In Labor Force | Unemployed |
| Less than High School | 76 (97.4%) | 0 (0.0%) |
| High School Diploma | 433 (68.4%) | 23 (3.7%) |
| College / Associate Degree | 571 (76.4%) | 43 (5.7%) |
| Bachelor's Degree or higher | 562 (100.0%) | 9 (1.6%) |
| Total | 1,642 (81.3%) | 71 (3.5%) |
Employment Occupations by Sex in Norwood Young America
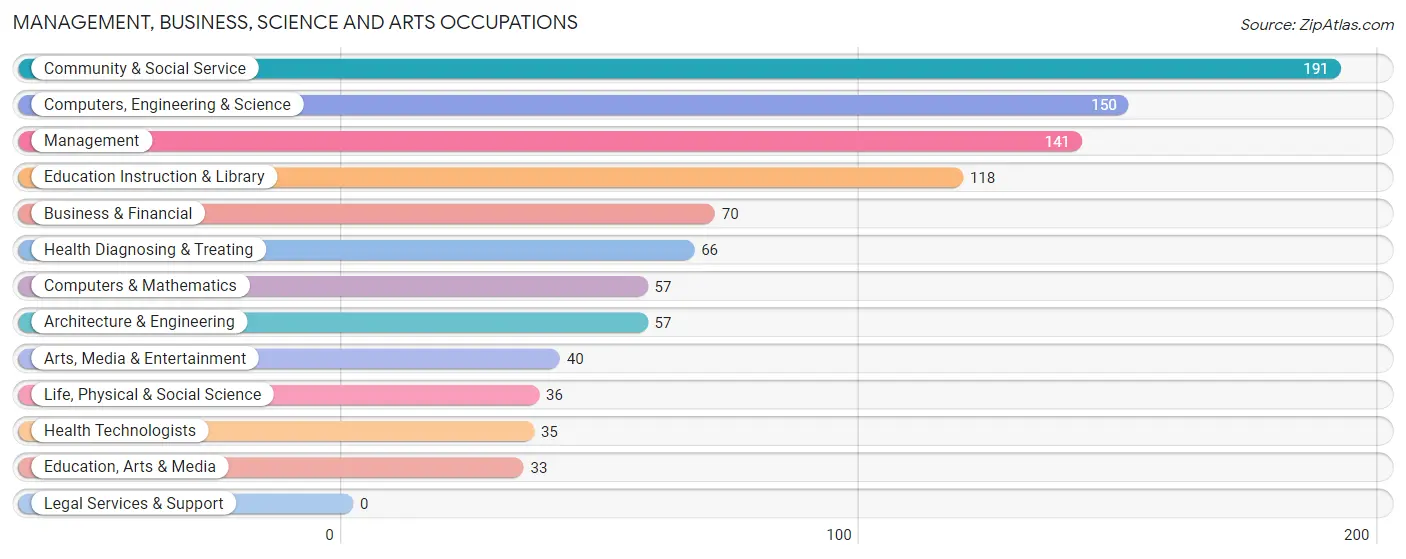
Management, Business, Science and Arts Occupations
The most common Management, Business, Science and Arts occupations in Norwood Young America are Community & Social Service (191 | 9.7%), Computers, Engineering & Science (150 | 7.6%), Management (141 | 7.2%), Education Instruction & Library (118 | 6.0%), and Business & Financial (70 | 3.6%).
Management, Business, Science and Arts Occupations by Sex
Within the Management, Business, Science and Arts occupations in Norwood Young America, the most male-oriented occupations are Life, Physical & Social Science (66.7%), Architecture & Engineering (63.2%), and Health Technologists (62.9%), while the most female-oriented occupations are Education, Arts & Media (100.0%), Computers & Mathematics (66.7%), and Arts, Media & Entertainment (65.0%).
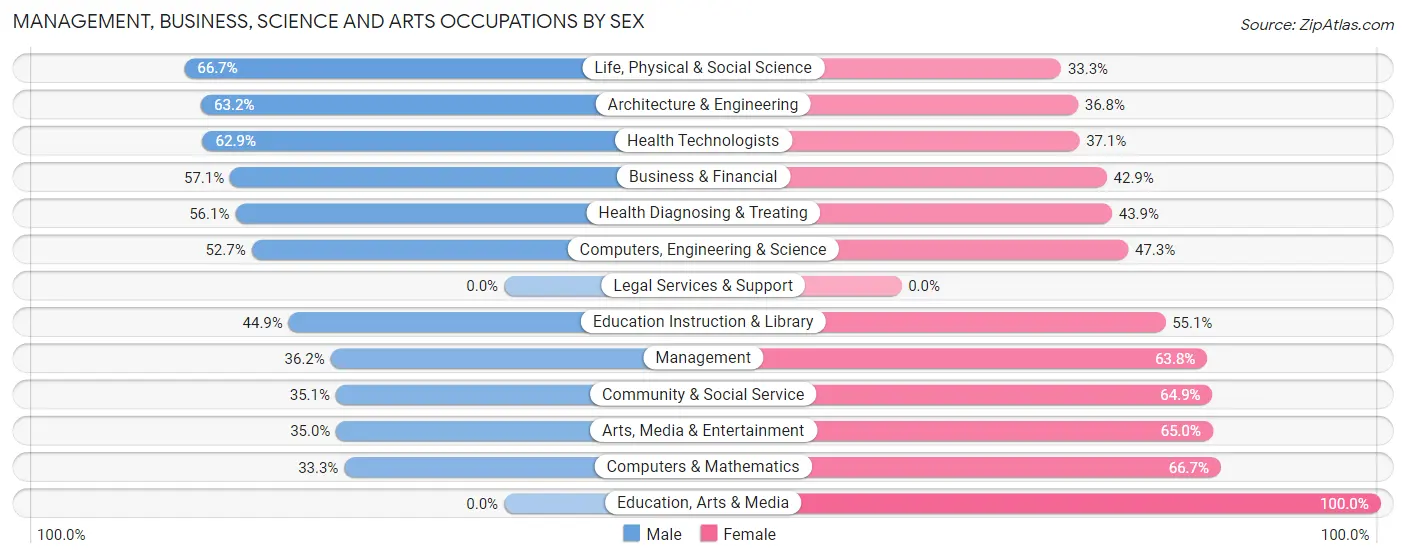
| Occupation | Male | Female |
| Management | 51 (36.2%) | 90 (63.8%) |
| Business & Financial | 40 (57.1%) | 30 (42.9%) |
| Computers, Engineering & Science | 79 (52.7%) | 71 (47.3%) |
| Computers & Mathematics | 19 (33.3%) | 38 (66.7%) |
| Architecture & Engineering | 36 (63.2%) | 21 (36.8%) |
| Life, Physical & Social Science | 24 (66.7%) | 12 (33.3%) |
| Community & Social Service | 67 (35.1%) | 124 (64.9%) |
| Education, Arts & Media | 0 (0.0%) | 33 (100.0%) |
| Legal Services & Support | 0 (0.0%) | 0 (0.0%) |
| Education Instruction & Library | 53 (44.9%) | 65 (55.1%) |
| Arts, Media & Entertainment | 14 (35.0%) | 26 (65.0%) |
| Health Diagnosing & Treating | 37 (56.1%) | 29 (43.9%) |
| Health Technologists | 22 (62.9%) | 13 (37.1%) |
| Total (Category) | 274 (44.3%) | 344 (55.7%) |
| Total (Overall) | 1,048 (53.3%) | 918 (46.7%) |
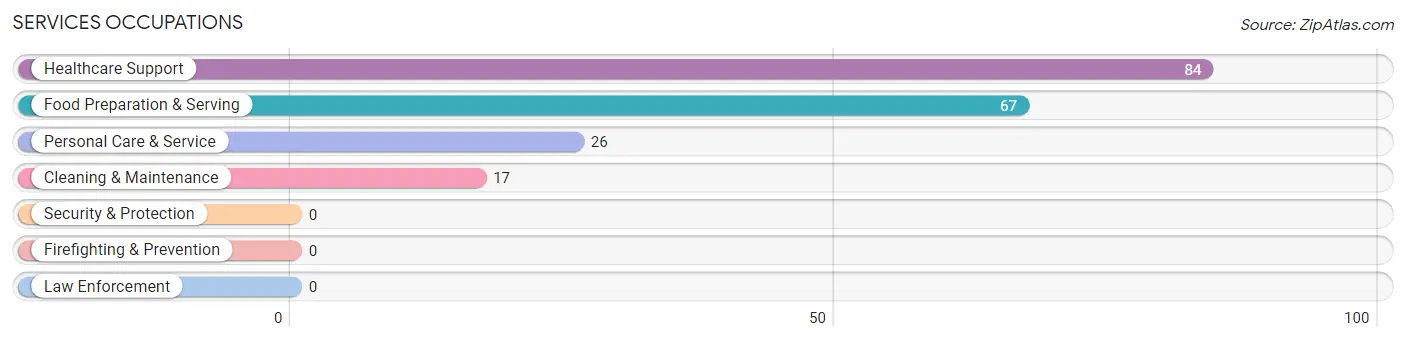
Services Occupations
The most common Services occupations in Norwood Young America are Healthcare Support (84 | 4.3%), Food Preparation & Serving (67 | 3.4%), Personal Care & Service (26 | 1.3%), and Cleaning & Maintenance (17 | 0.9%).
Services Occupations by Sex
Within the Services occupations in Norwood Young America, the most male-oriented occupations are Cleaning & Maintenance (100.0%), Food Preparation & Serving (77.6%), and Healthcare Support (20.2%), while the most female-oriented occupations are Personal Care & Service (100.0%), Healthcare Support (79.8%), and Food Preparation & Serving (22.4%).
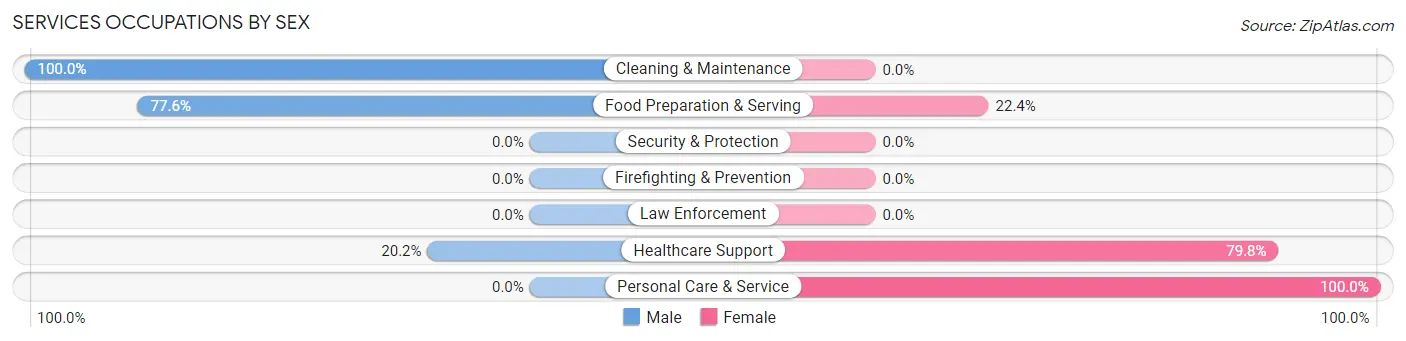
| Occupation | Male | Female |
| Healthcare Support | 17 (20.2%) | 67 (79.8%) |
| Security & Protection | 0 (0.0%) | 0 (0.0%) |
| Firefighting & Prevention | 0 (0.0%) | 0 (0.0%) |
| Law Enforcement | 0 (0.0%) | 0 (0.0%) |
| Food Preparation & Serving | 52 (77.6%) | 15 (22.4%) |
| Cleaning & Maintenance | 17 (100.0%) | 0 (0.0%) |
| Personal Care & Service | 0 (0.0%) | 26 (100.0%) |
| Total (Category) | 86 (44.3%) | 108 (55.7%) |
| Total (Overall) | 1,048 (53.3%) | 918 (46.7%) |
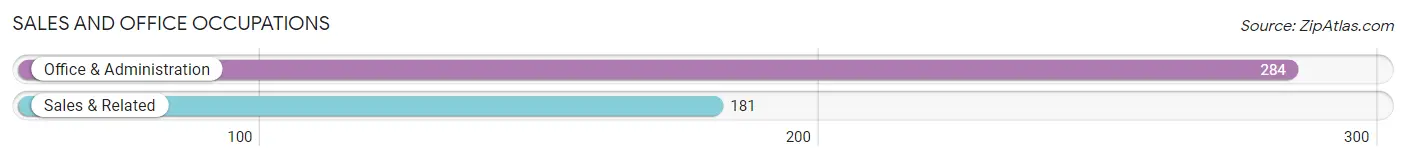
Sales and Office Occupations
The most common Sales and Office occupations in Norwood Young America are Office & Administration (284 | 14.4%), and Sales & Related (181 | 9.2%).
Sales and Office Occupations by Sex
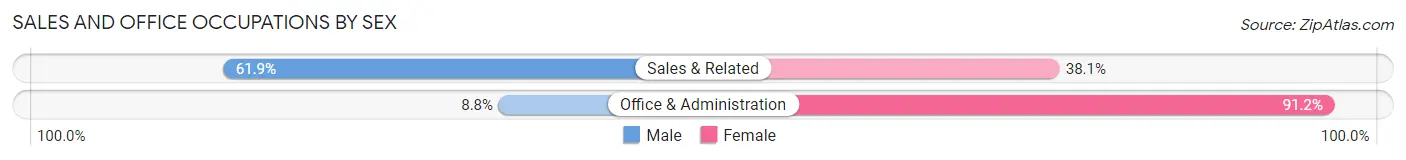
| Occupation | Male | Female |
| Sales & Related | 112 (61.9%) | 69 (38.1%) |
| Office & Administration | 25 (8.8%) | 259 (91.2%) |
| Total (Category) | 137 (29.5%) | 328 (70.5%) |
| Total (Overall) | 1,048 (53.3%) | 918 (46.7%) |
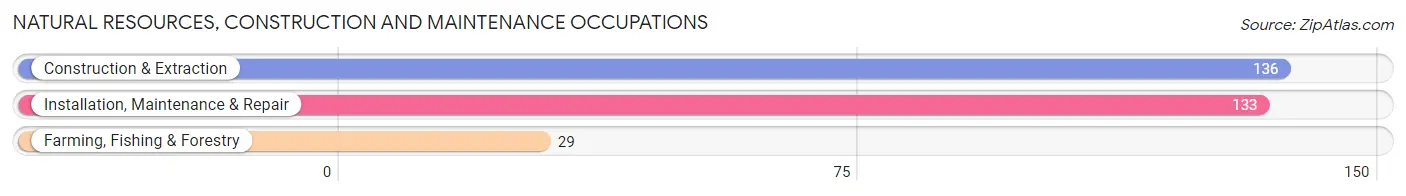
Natural Resources, Construction and Maintenance Occupations
The most common Natural Resources, Construction and Maintenance occupations in Norwood Young America are Construction & Extraction (136 | 6.9%), Installation, Maintenance & Repair (133 | 6.8%), and Farming, Fishing & Forestry (29 | 1.5%).
Natural Resources, Construction and Maintenance Occupations by Sex
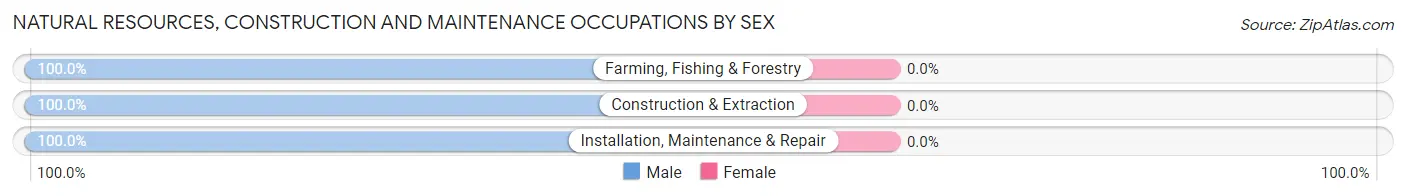
| Occupation | Male | Female |
| Farming, Fishing & Forestry | 29 (100.0%) | 0 (0.0%) |
| Construction & Extraction | 136 (100.0%) | 0 (0.0%) |
| Installation, Maintenance & Repair | 133 (100.0%) | 0 (0.0%) |
| Total (Category) | 298 (100.0%) | 0 (0.0%) |
| Total (Overall) | 1,048 (53.3%) | 918 (46.7%) |
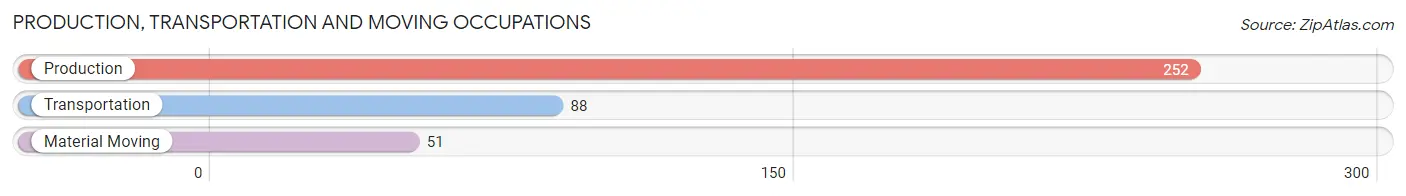
Production, Transportation and Moving Occupations
The most common Production, Transportation and Moving occupations in Norwood Young America are Production (252 | 12.8%), Transportation (88 | 4.5%), and Material Moving (51 | 2.6%).
Production, Transportation and Moving Occupations by Sex
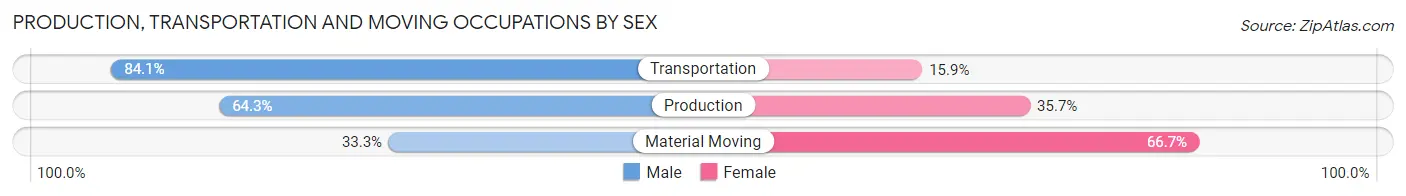
| Occupation | Male | Female |
| Production | 162 (64.3%) | 90 (35.7%) |
| Transportation | 74 (84.1%) | 14 (15.9%) |
| Material Moving | 17 (33.3%) | 34 (66.7%) |
| Total (Category) | 253 (64.7%) | 138 (35.3%) |
| Total (Overall) | 1,048 (53.3%) | 918 (46.7%) |
Employment Industries by Sex in Norwood Young America
Employment Industries in Norwood Young America
The major employment industries in Norwood Young America include Manufacturing (501 | 25.5%), Health Care & Social Assistance (377 | 19.2%), Retail Trade (238 | 12.1%), Construction (151 | 7.7%), and Educational Services (112 | 5.7%).
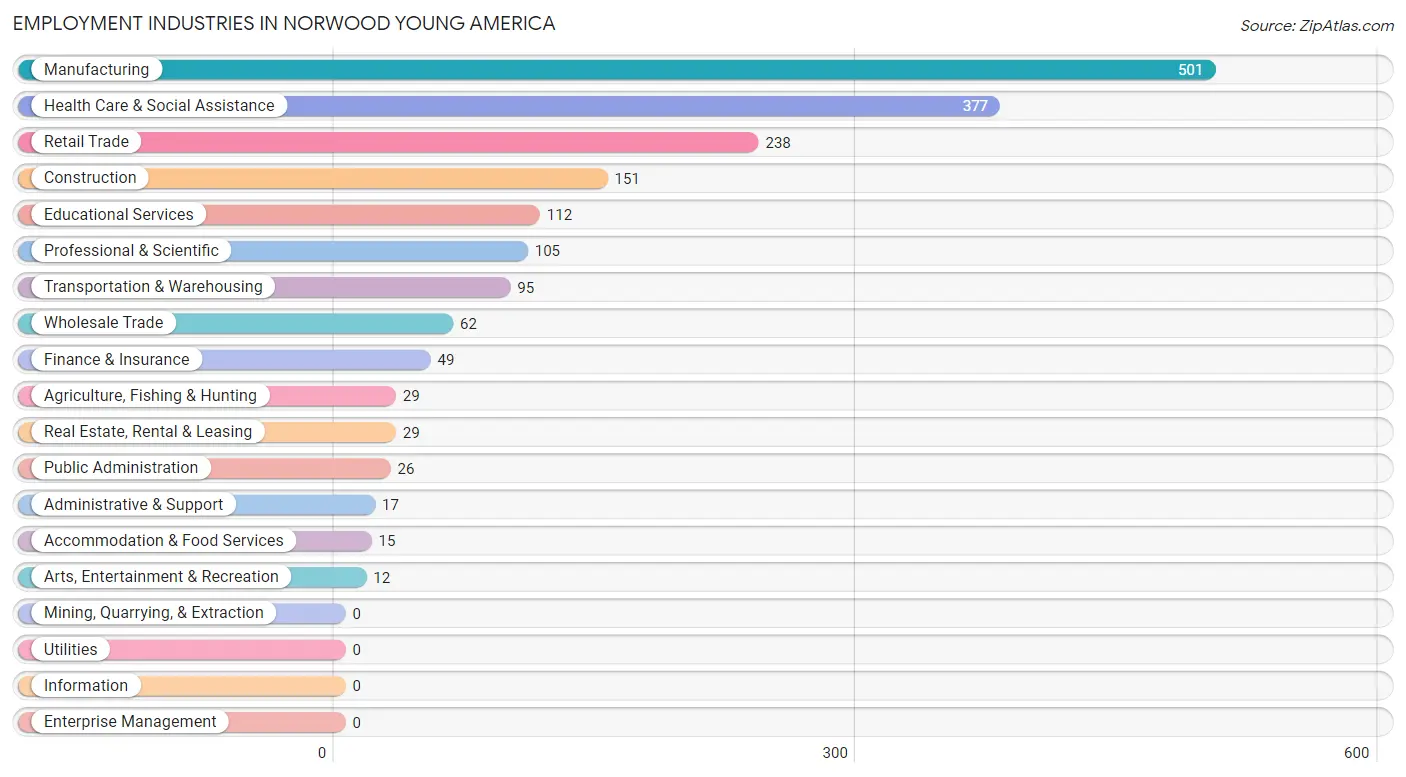
Employment Industries by Sex in Norwood Young America
The Norwood Young America industries that see more men than women are Agriculture, Fishing & Hunting (100.0%), Administrative & Support (100.0%), and Construction (90.7%), whereas the industries that tend to have a higher number of women are Finance & Insurance (100.0%), Professional & Scientific (100.0%), and Arts, Entertainment & Recreation (100.0%).
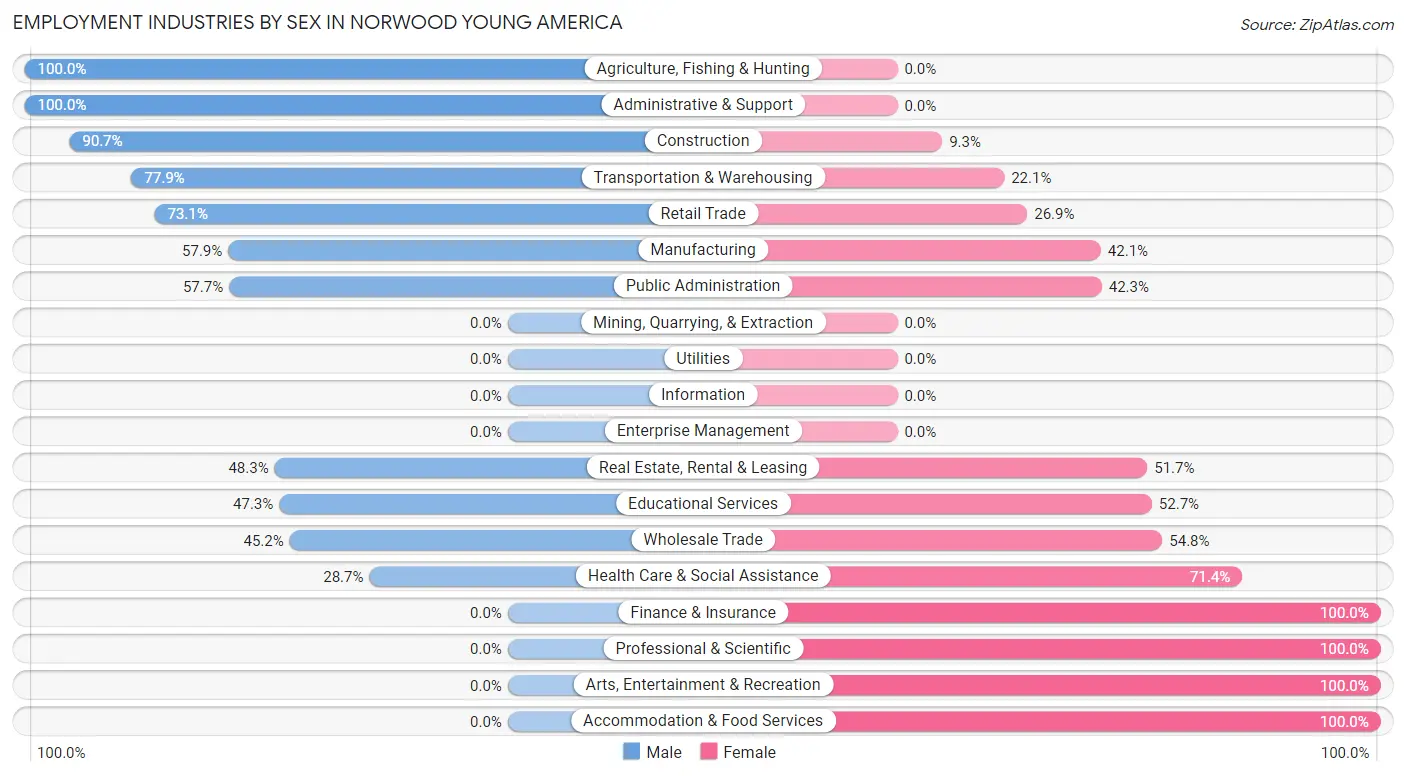
| Industry | Male | Female |
| Agriculture, Fishing & Hunting | 29 (100.0%) | 0 (0.0%) |
| Mining, Quarrying, & Extraction | 0 (0.0%) | 0 (0.0%) |
| Construction | 137 (90.7%) | 14 (9.3%) |
| Manufacturing | 290 (57.9%) | 211 (42.1%) |
| Wholesale Trade | 28 (45.2%) | 34 (54.8%) |
| Retail Trade | 174 (73.1%) | 64 (26.9%) |
| Transportation & Warehousing | 74 (77.9%) | 21 (22.1%) |
| Utilities | 0 (0.0%) | 0 (0.0%) |
| Information | 0 (0.0%) | 0 (0.0%) |
| Finance & Insurance | 0 (0.0%) | 49 (100.0%) |
| Real Estate, Rental & Leasing | 14 (48.3%) | 15 (51.7%) |
| Professional & Scientific | 0 (0.0%) | 105 (100.0%) |
| Enterprise Management | 0 (0.0%) | 0 (0.0%) |
| Administrative & Support | 17 (100.0%) | 0 (0.0%) |
| Educational Services | 53 (47.3%) | 59 (52.7%) |
| Health Care & Social Assistance | 108 (28.6%) | 269 (71.4%) |
| Arts, Entertainment & Recreation | 0 (0.0%) | 12 (100.0%) |
| Accommodation & Food Services | 0 (0.0%) | 15 (100.0%) |
| Public Administration | 15 (57.7%) | 11 (42.3%) |
| Total | 1,048 (53.3%) | 918 (46.7%) |
Education in Norwood Young America
School Enrollment in Norwood Young America
The most common levels of schooling among the 789 students in Norwood Young America are high school (241 | 30.5%), middle school (155 | 19.7%), and college / undergraduate (108 | 13.7%).
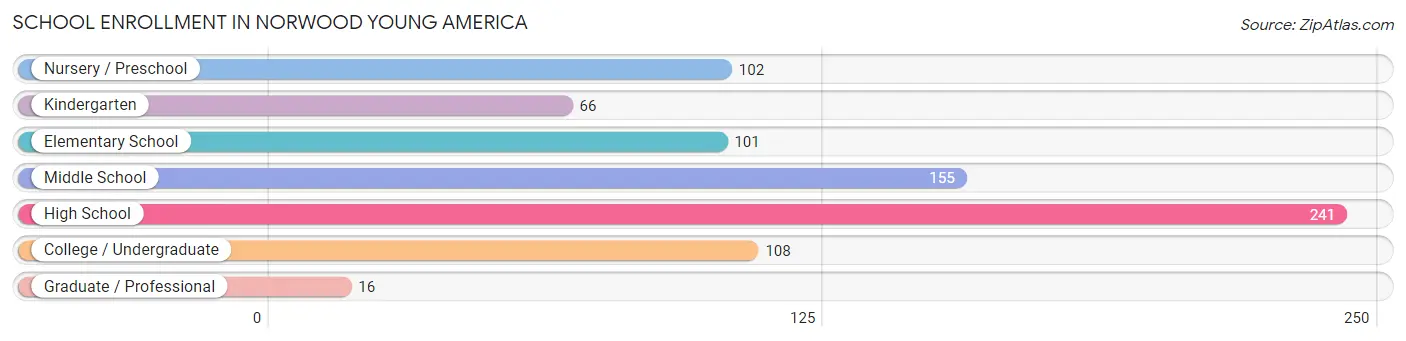
| School Level | # Students | % Students |
| Nursery / Preschool | 102 | 12.9% |
| Kindergarten | 66 | 8.4% |
| Elementary School | 101 | 12.8% |
| Middle School | 155 | 19.7% |
| High School | 241 | 30.5% |
| College / Undergraduate | 108 | 13.7% |
| Graduate / Professional | 16 | 2.0% |
| Total | 789 | 100.0% |
School Enrollment by Age by Funding Source in Norwood Young America
Out of a total of 789 students who are enrolled in schools in Norwood Young America, 175 (22.2%) attend a private institution, while the remaining 614 (77.8%) are enrolled in public schools. The age group of 35 years and over has the highest likelihood of being enrolled in private schools, with 22 (100.0% in the age bracket) enrolled. Conversely, the age group of 10 to 14 year olds has the lowest likelihood of being enrolled in a private school, with 203 (100.0% in the age bracket) attending a public institution.
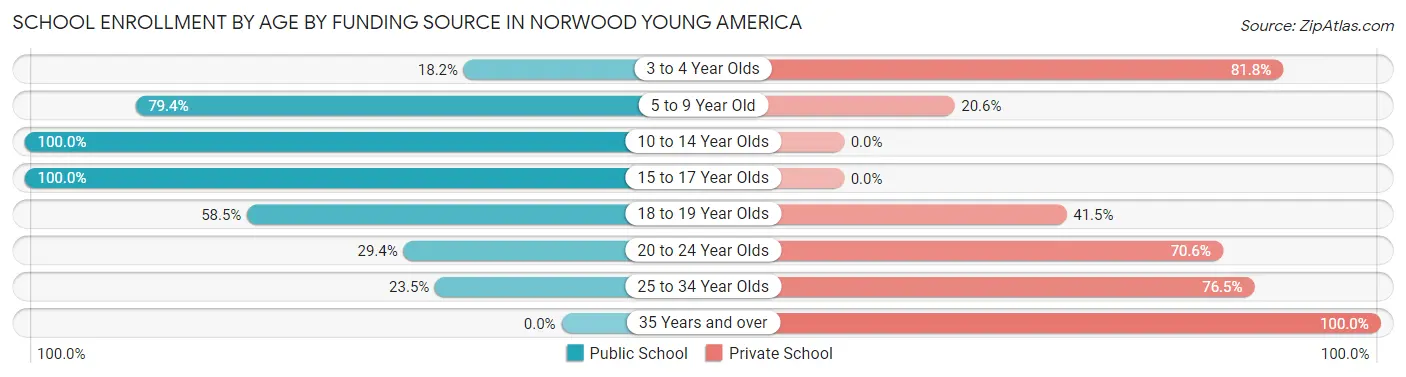
| Age Bracket | Public School | Private School |
| 3 to 4 Year Olds | 6 (18.2%) | 27 (81.8%) |
| 5 to 9 Year Old | 181 (79.4%) | 47 (20.6%) |
| 10 to 14 Year Olds | 203 (100.0%) | 0 (0.0%) |
| 15 to 17 Year Olds | 177 (100.0%) | 0 (0.0%) |
| 18 to 19 Year Olds | 24 (58.5%) | 17 (41.5%) |
| 20 to 24 Year Olds | 15 (29.4%) | 36 (70.6%) |
| 25 to 34 Year Olds | 8 (23.5%) | 26 (76.5%) |
| 35 Years and over | 0 (0.0%) | 22 (100.0%) |
| Total | 614 (77.8%) | 175 (22.2%) |
Educational Attainment by Field of Study in Norwood Young America
Physical & health sciences (136 | 18.1%), business (121 | 16.1%), bio, nature & agricultural (117 | 15.6%), education (96 | 12.8%), and science & technology (72 | 9.6%) are the most common fields of study among 751 individuals in Norwood Young America who have obtained a bachelor's degree or higher.
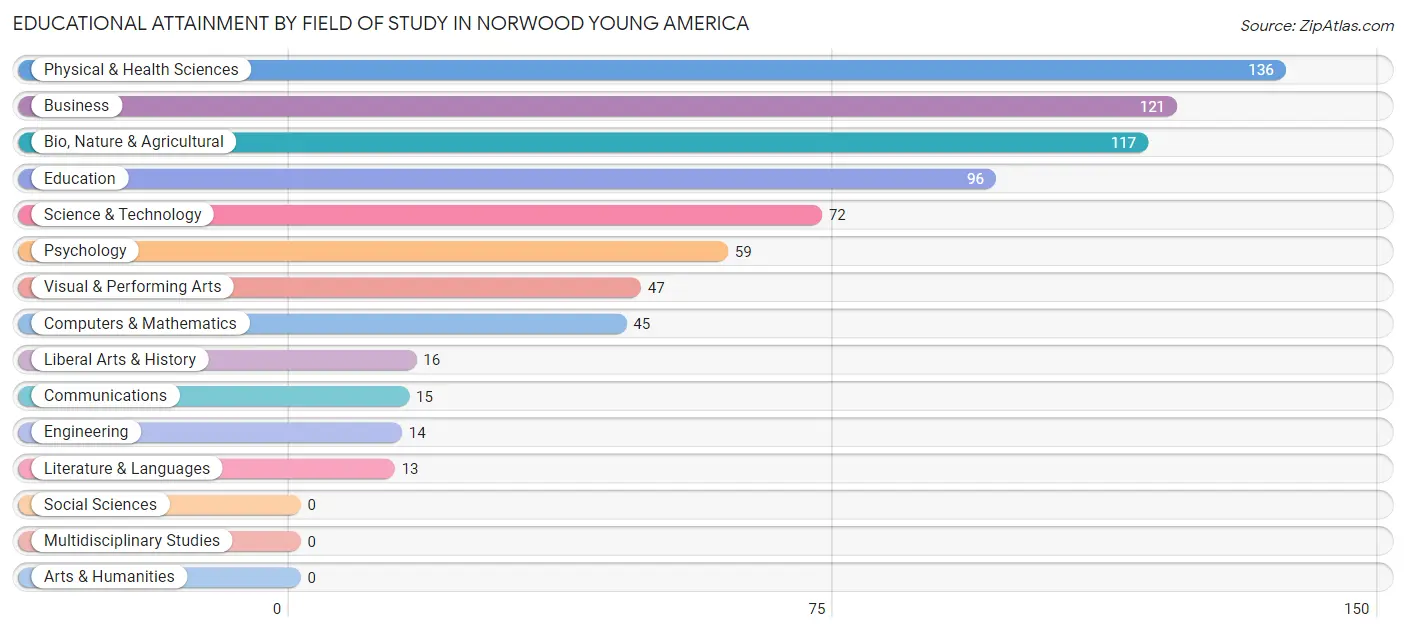
| Field of Study | # Graduates | % Graduates |
| Computers & Mathematics | 45 | 6.0% |
| Bio, Nature & Agricultural | 117 | 15.6% |
| Physical & Health Sciences | 136 | 18.1% |
| Psychology | 59 | 7.9% |
| Social Sciences | 0 | 0.0% |
| Engineering | 14 | 1.9% |
| Multidisciplinary Studies | 0 | 0.0% |
| Science & Technology | 72 | 9.6% |
| Business | 121 | 16.1% |
| Education | 96 | 12.8% |
| Literature & Languages | 13 | 1.7% |
| Liberal Arts & History | 16 | 2.1% |
| Visual & Performing Arts | 47 | 6.3% |
| Communications | 15 | 2.0% |
| Arts & Humanities | 0 | 0.0% |
| Total | 751 | 100.0% |
Transportation & Commute in Norwood Young America
Vehicle Availability by Sex in Norwood Young America
The most prevalent vehicle ownership categories in Norwood Young America are males with 2 vehicles (342, accounting for 32.3%) and females with 2 vehicles (284, making up 37.8%).
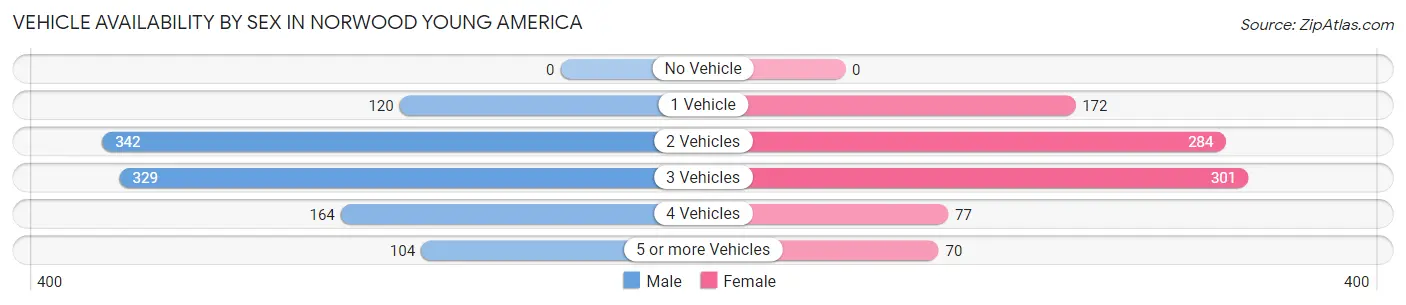
| Vehicles Available | Male | Female |
| No Vehicle | 0 (0.0%) | 0 (0.0%) |
| 1 Vehicle | 120 (11.3%) | 172 (19.0%) |
| 2 Vehicles | 342 (32.3%) | 284 (31.4%) |
| 3 Vehicles | 329 (31.1%) | 301 (33.3%) |
| 4 Vehicles | 164 (15.5%) | 77 (8.5%) |
| 5 or more Vehicles | 104 (9.8%) | 70 (7.7%) |
| Total | 1,059 (100.0%) | 904 (100.0%) |
Commute Time in Norwood Young America
The most frequently occuring commute durations in Norwood Young America are 30 to 34 minutes (439 commuters, 24.4%), 15 to 19 minutes (291 commuters, 16.2%), and 25 to 29 minutes (230 commuters, 12.8%).
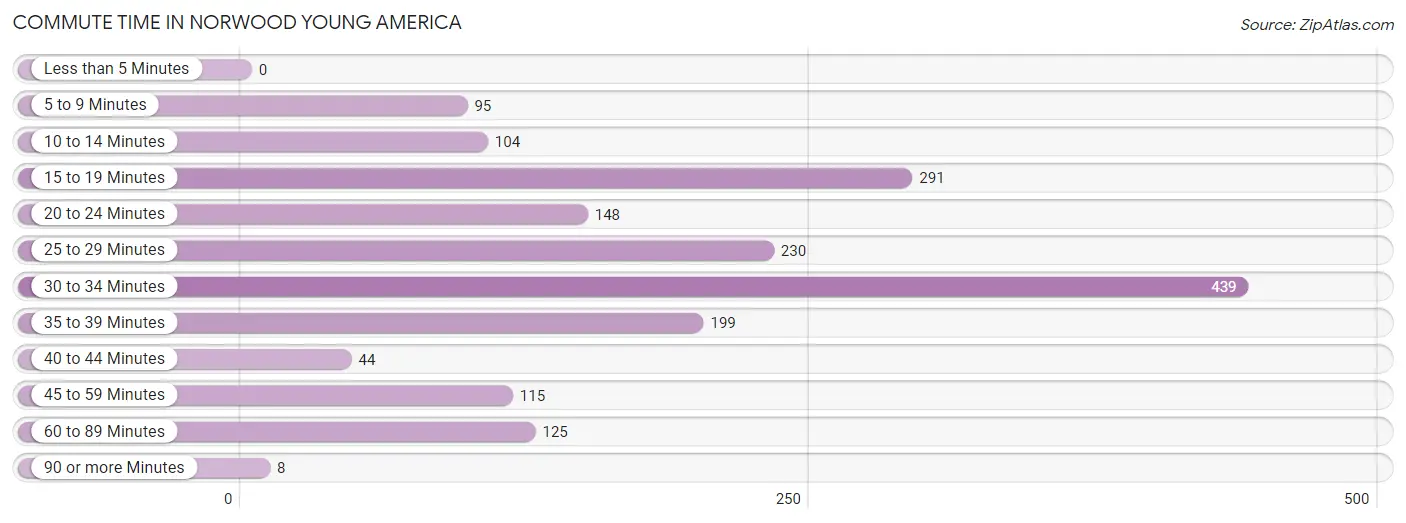
| Commute Time | # Commuters | % Commuters |
| Less than 5 Minutes | 0 | 0.0% |
| 5 to 9 Minutes | 95 | 5.3% |
| 10 to 14 Minutes | 104 | 5.8% |
| 15 to 19 Minutes | 291 | 16.2% |
| 20 to 24 Minutes | 148 | 8.2% |
| 25 to 29 Minutes | 230 | 12.8% |
| 30 to 34 Minutes | 439 | 24.4% |
| 35 to 39 Minutes | 199 | 11.1% |
| 40 to 44 Minutes | 44 | 2.5% |
| 45 to 59 Minutes | 115 | 6.4% |
| 60 to 89 Minutes | 125 | 7.0% |
| 90 or more Minutes | 8 | 0.4% |
Commute Time by Sex in Norwood Young America
The most common commute times in Norwood Young America are 30 to 34 minutes (275 commuters, 28.6%) for males and 30 to 34 minutes (164 commuters, 19.6%) for females.
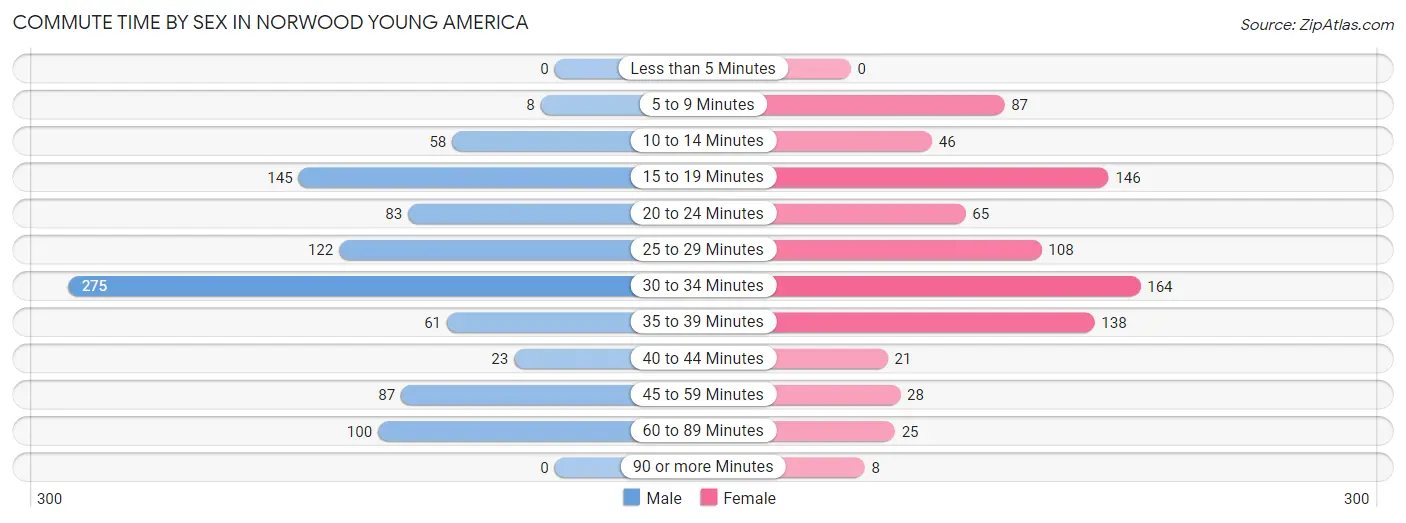
| Commute Time | Male | Female |
| Less than 5 Minutes | 0 (0.0%) | 0 (0.0%) |
| 5 to 9 Minutes | 8 (0.8%) | 87 (10.4%) |
| 10 to 14 Minutes | 58 (6.0%) | 46 (5.5%) |
| 15 to 19 Minutes | 145 (15.1%) | 146 (17.5%) |
| 20 to 24 Minutes | 83 (8.6%) | 65 (7.8%) |
| 25 to 29 Minutes | 122 (12.7%) | 108 (12.9%) |
| 30 to 34 Minutes | 275 (28.6%) | 164 (19.6%) |
| 35 to 39 Minutes | 61 (6.3%) | 138 (16.5%) |
| 40 to 44 Minutes | 23 (2.4%) | 21 (2.5%) |
| 45 to 59 Minutes | 87 (9.0%) | 28 (3.4%) |
| 60 to 89 Minutes | 100 (10.4%) | 25 (3.0%) |
| 90 or more Minutes | 0 (0.0%) | 8 (1.0%) |
Time of Departure to Work by Sex in Norwood Young America
The most frequent times of departure to work in Norwood Young America are 7:00 AM to 7:29 AM (173, 18.0%) for males and 7:30 AM to 7:59 AM (270, 32.3%) for females.
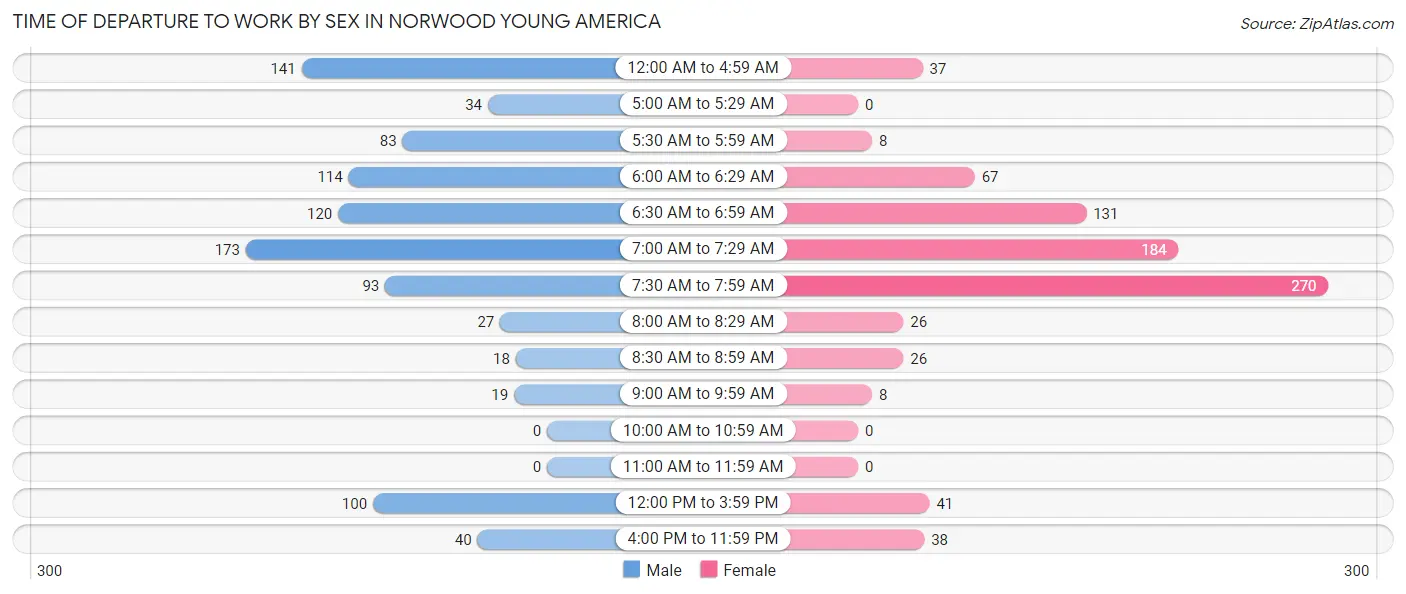
| Time of Departure | Male | Female |
| 12:00 AM to 4:59 AM | 141 (14.7%) | 37 (4.4%) |
| 5:00 AM to 5:29 AM | 34 (3.5%) | 0 (0.0%) |
| 5:30 AM to 5:59 AM | 83 (8.6%) | 8 (1.0%) |
| 6:00 AM to 6:29 AM | 114 (11.8%) | 67 (8.0%) |
| 6:30 AM to 6:59 AM | 120 (12.5%) | 131 (15.7%) |
| 7:00 AM to 7:29 AM | 173 (18.0%) | 184 (22.0%) |
| 7:30 AM to 7:59 AM | 93 (9.7%) | 270 (32.3%) |
| 8:00 AM to 8:29 AM | 27 (2.8%) | 26 (3.1%) |
| 8:30 AM to 8:59 AM | 18 (1.9%) | 26 (3.1%) |
| 9:00 AM to 9:59 AM | 19 (2.0%) | 8 (1.0%) |
| 10:00 AM to 10:59 AM | 0 (0.0%) | 0 (0.0%) |
| 11:00 AM to 11:59 AM | 0 (0.0%) | 0 (0.0%) |
| 12:00 PM to 3:59 PM | 100 (10.4%) | 41 (4.9%) |
| 4:00 PM to 11:59 PM | 40 (4.2%) | 38 (4.5%) |
| Total | 962 (100.0%) | 836 (100.0%) |
Housing Occupancy in Norwood Young America
Occupancy by Ownership in Norwood Young America
Of the total 1,396 dwellings in Norwood Young America, owner-occupied units account for 1,063 (76.1%), while renter-occupied units make up 333 (23.8%).
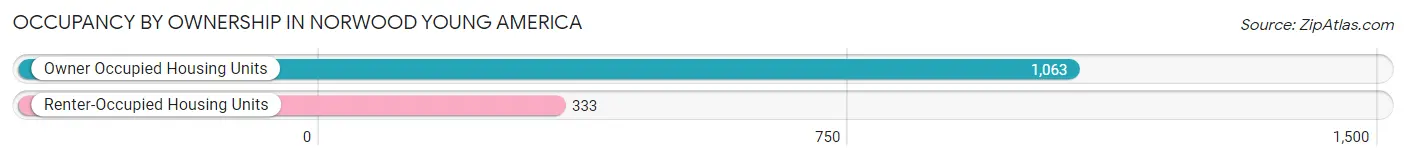
| Occupancy | # Housing Units | % Housing Units |
| Owner Occupied Housing Units | 1,063 | 76.1% |
| Renter-Occupied Housing Units | 333 | 23.8% |
| Total Occupied Housing Units | 1,396 | 100.0% |
Occupancy by Household Size in Norwood Young America
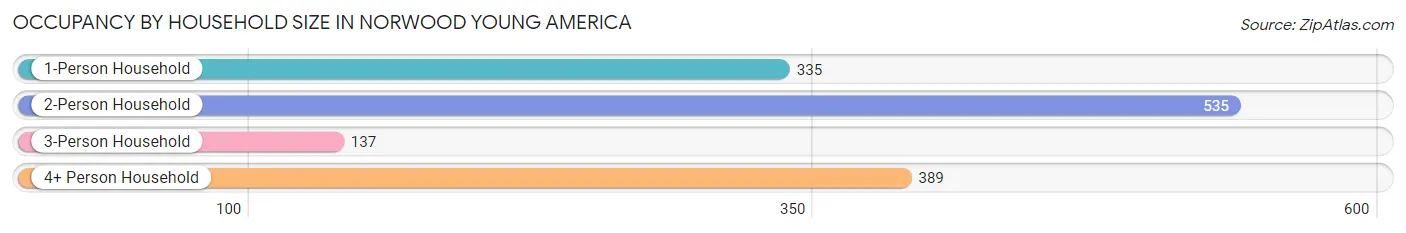
| Household Size | # Housing Units | % Housing Units |
| 1-Person Household | 335 | 24.0% |
| 2-Person Household | 535 | 38.3% |
| 3-Person Household | 137 | 9.8% |
| 4+ Person Household | 389 | 27.9% |
| Total Housing Units | 1,396 | 100.0% |
Occupancy by Ownership by Household Size in Norwood Young America
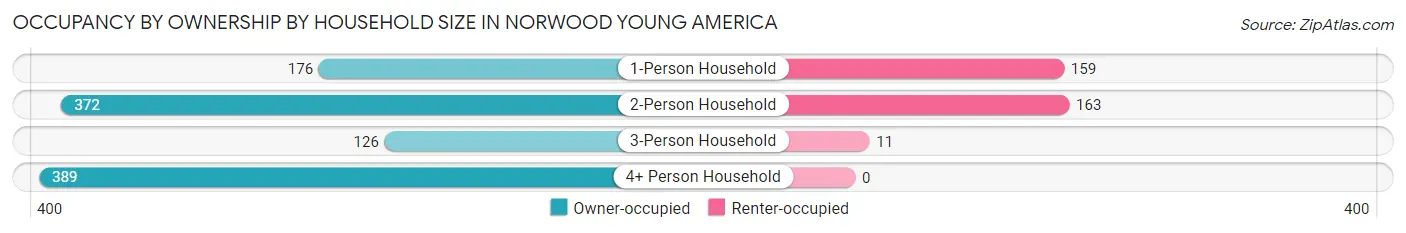
| Household Size | Owner-occupied | Renter-occupied |
| 1-Person Household | 176 (52.5%) | 159 (47.5%) |
| 2-Person Household | 372 (69.5%) | 163 (30.5%) |
| 3-Person Household | 126 (92.0%) | 11 (8.0%) |
| 4+ Person Household | 389 (100.0%) | 0 (0.0%) |
| Total Housing Units | 1,063 (76.1%) | 333 (23.8%) |
Occupancy by Educational Attainment in Norwood Young America
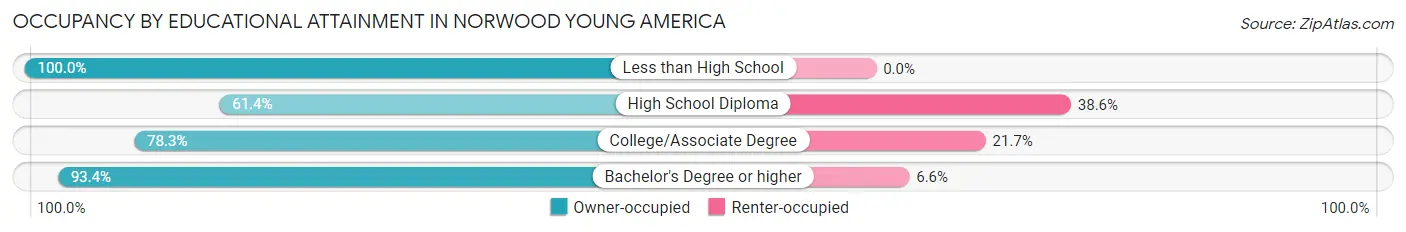
| Household Size | Owner-occupied | Renter-occupied |
| Less than High School | 70 (100.0%) | 0 (0.0%) |
| High School Diploma | 315 (61.4%) | 198 (38.6%) |
| College/Associate Degree | 422 (78.3%) | 117 (21.7%) |
| Bachelor's Degree or higher | 256 (93.4%) | 18 (6.6%) |
Occupancy by Age of Householder in Norwood Young America
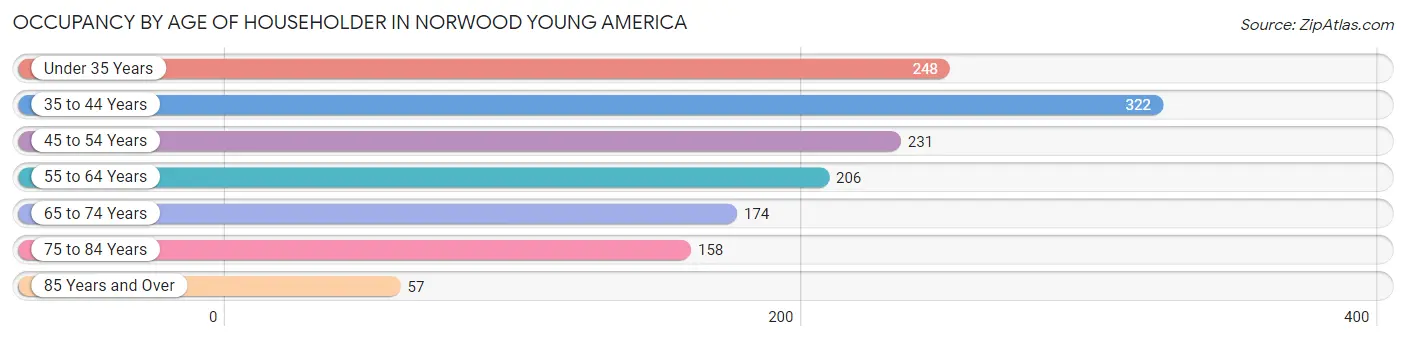
| Age Bracket | # Households | % Households |
| Under 35 Years | 248 | 17.8% |
| 35 to 44 Years | 322 | 23.1% |
| 45 to 54 Years | 231 | 16.6% |
| 55 to 64 Years | 206 | 14.8% |
| 65 to 74 Years | 174 | 12.5% |
| 75 to 84 Years | 158 | 11.3% |
| 85 Years and Over | 57 | 4.1% |
| Total | 1,396 | 100.0% |
Housing Finances in Norwood Young America
Median Income by Occupancy in Norwood Young America
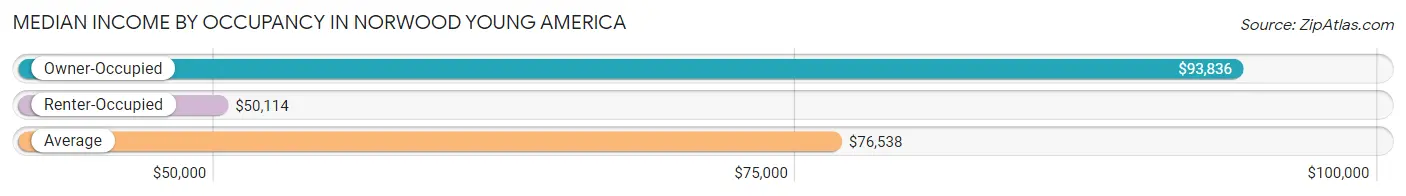
| Occupancy Type | # Households | Median Income |
| Owner-Occupied | 1,063 (76.1%) | $93,836 |
| Renter-Occupied | 333 (23.8%) | $50,114 |
| Average | 1,396 (100.0%) | $76,538 |
Occupancy by Householder Income Bracket in Norwood Young America
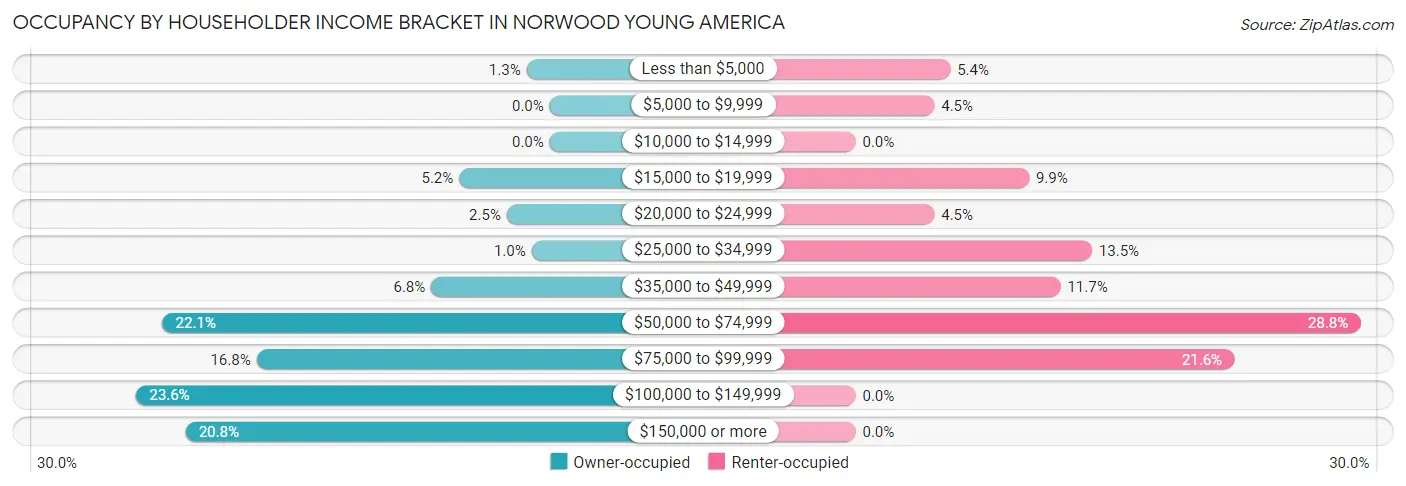
| Income Bracket | Owner-occupied | Renter-occupied |
| Less than $5,000 | 14 (1.3%) | 18 (5.4%) |
| $5,000 to $9,999 | 0 (0.0%) | 15 (4.5%) |
| $10,000 to $14,999 | 0 (0.0%) | 0 (0.0%) |
| $15,000 to $19,999 | 55 (5.2%) | 33 (9.9%) |
| $20,000 to $24,999 | 26 (2.5%) | 15 (4.5%) |
| $25,000 to $34,999 | 11 (1.0%) | 45 (13.5%) |
| $35,000 to $49,999 | 72 (6.8%) | 39 (11.7%) |
| $50,000 to $74,999 | 235 (22.1%) | 96 (28.8%) |
| $75,000 to $99,999 | 178 (16.8%) | 72 (21.6%) |
| $100,000 to $149,999 | 251 (23.6%) | 0 (0.0%) |
| $150,000 or more | 221 (20.8%) | 0 (0.0%) |
| Total | 1,063 (100.0%) | 333 (100.0%) |
Monthly Housing Cost Tiers in Norwood Young America
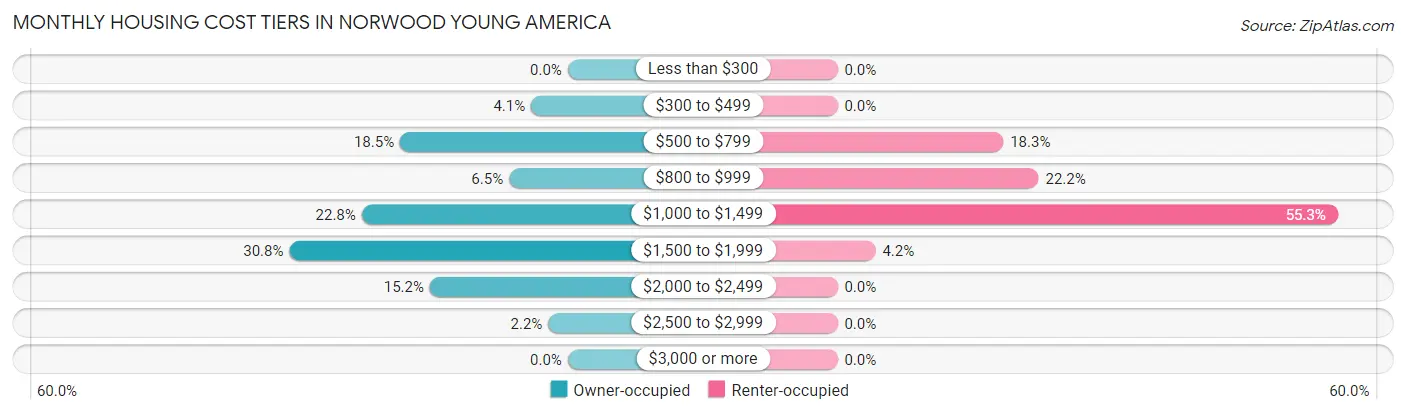
| Monthly Cost | Owner-occupied | Renter-occupied |
| Less than $300 | 0 (0.0%) | 0 (0.0%) |
| $300 to $499 | 43 (4.1%) | 0 (0.0%) |
| $500 to $799 | 197 (18.5%) | 61 (18.3%) |
| $800 to $999 | 69 (6.5%) | 74 (22.2%) |
| $1,000 to $1,499 | 242 (22.8%) | 184 (55.3%) |
| $1,500 to $1,999 | 327 (30.8%) | 14 (4.2%) |
| $2,000 to $2,499 | 162 (15.2%) | 0 (0.0%) |
| $2,500 to $2,999 | 23 (2.2%) | 0 (0.0%) |
| $3,000 or more | 0 (0.0%) | 0 (0.0%) |
| Total | 1,063 (100.0%) | 333 (100.0%) |
Physical Housing Characteristics in Norwood Young America
Housing Structures in Norwood Young America
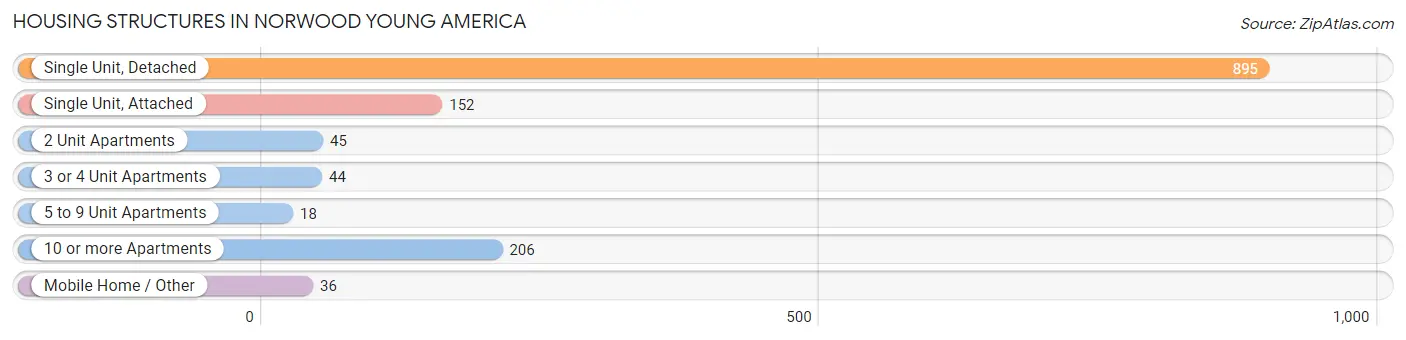
| Structure Type | # Housing Units | % Housing Units |
| Single Unit, Detached | 895 | 64.1% |
| Single Unit, Attached | 152 | 10.9% |
| 2 Unit Apartments | 45 | 3.2% |
| 3 or 4 Unit Apartments | 44 | 3.2% |
| 5 to 9 Unit Apartments | 18 | 1.3% |
| 10 or more Apartments | 206 | 14.8% |
| Mobile Home / Other | 36 | 2.6% |
| Total | 1,396 | 100.0% |
Housing Structures by Occupancy in Norwood Young America
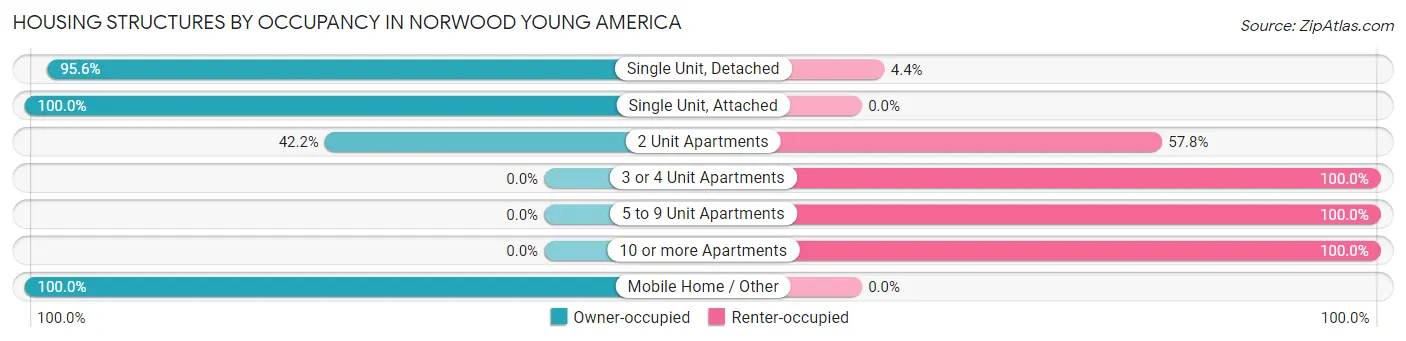
| Structure Type | Owner-occupied | Renter-occupied |
| Single Unit, Detached | 856 (95.6%) | 39 (4.4%) |
| Single Unit, Attached | 152 (100.0%) | 0 (0.0%) |
| 2 Unit Apartments | 19 (42.2%) | 26 (57.8%) |
| 3 or 4 Unit Apartments | 0 (0.0%) | 44 (100.0%) |
| 5 to 9 Unit Apartments | 0 (0.0%) | 18 (100.0%) |
| 10 or more Apartments | 0 (0.0%) | 206 (100.0%) |
| Mobile Home / Other | 36 (100.0%) | 0 (0.0%) |
| Total | 1,063 (76.1%) | 333 (23.8%) |
Housing Structures by Number of Rooms in Norwood Young America
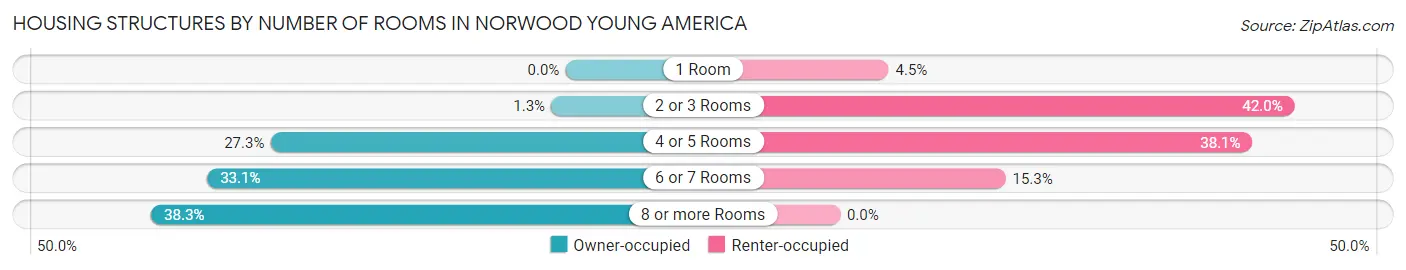
| Number of Rooms | Owner-occupied | Renter-occupied |
| 1 Room | 0 (0.0%) | 15 (4.5%) |
| 2 or 3 Rooms | 14 (1.3%) | 140 (42.0%) |
| 4 or 5 Rooms | 290 (27.3%) | 127 (38.1%) |
| 6 or 7 Rooms | 352 (33.1%) | 51 (15.3%) |
| 8 or more Rooms | 407 (38.3%) | 0 (0.0%) |
| Total | 1,063 (100.0%) | 333 (100.0%) |
Housing Structure by Heating Type in Norwood Young America
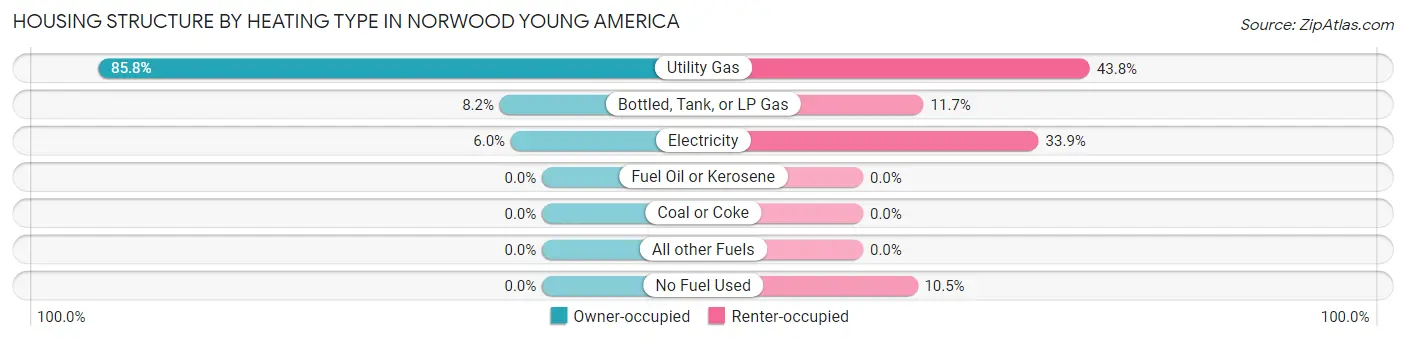
| Heating Type | Owner-occupied | Renter-occupied |
| Utility Gas | 912 (85.8%) | 146 (43.8%) |
| Bottled, Tank, or LP Gas | 87 (8.2%) | 39 (11.7%) |
| Electricity | 64 (6.0%) | 113 (33.9%) |
| Fuel Oil or Kerosene | 0 (0.0%) | 0 (0.0%) |
| Coal or Coke | 0 (0.0%) | 0 (0.0%) |
| All other Fuels | 0 (0.0%) | 0 (0.0%) |
| No Fuel Used | 0 (0.0%) | 35 (10.5%) |
| Total | 1,063 (100.0%) | 333 (100.0%) |
Household Vehicle Usage in Norwood Young America
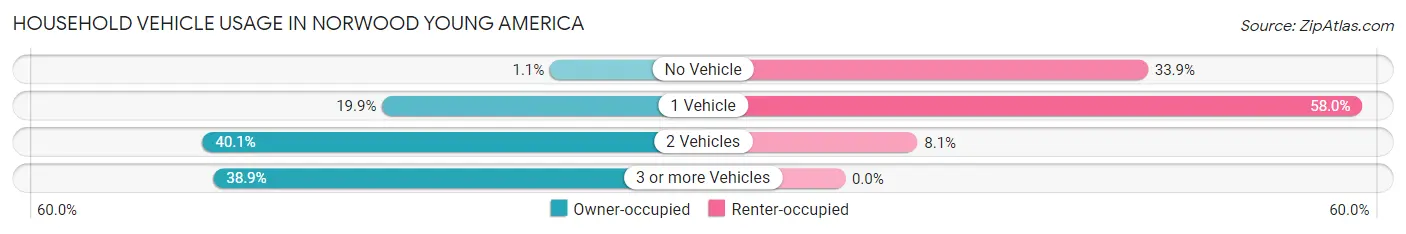
| Vehicles per Household | Owner-occupied | Renter-occupied |
| No Vehicle | 12 (1.1%) | 113 (33.9%) |
| 1 Vehicle | 212 (19.9%) | 193 (58.0%) |
| 2 Vehicles | 426 (40.1%) | 27 (8.1%) |
| 3 or more Vehicles | 413 (38.9%) | 0 (0.0%) |
| Total | 1,063 (100.0%) | 333 (100.0%) |
Real Estate & Mortgages in Norwood Young America
Real Estate and Mortgage Overview in Norwood Young America
| Characteristic | Without Mortgage | With Mortgage |
| Housing Units | 213 | 850 |
| Median Property Value | $249,700 | $279,300 |
| Median Household Income | $46,932 | $202 |
| Monthly Housing Costs | $623 | $0 |
| Real Estate Taxes | $3,068 | $0 |
Property Value by Mortgage Status in Norwood Young America
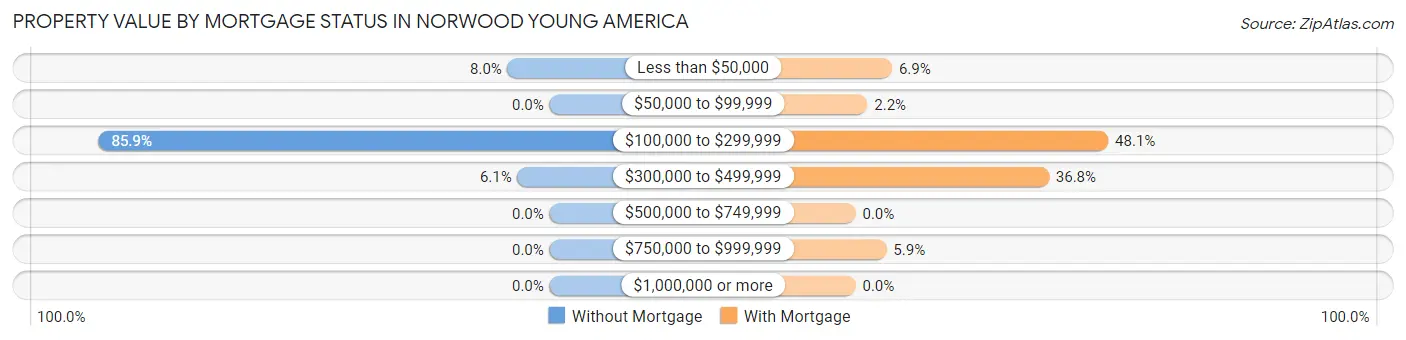
| Property Value | Without Mortgage | With Mortgage |
| Less than $50,000 | 17 (8.0%) | 59 (6.9%) |
| $50,000 to $99,999 | 0 (0.0%) | 19 (2.2%) |
| $100,000 to $299,999 | 183 (85.9%) | 409 (48.1%) |
| $300,000 to $499,999 | 13 (6.1%) | 313 (36.8%) |
| $500,000 to $749,999 | 0 (0.0%) | 0 (0.0%) |
| $750,000 to $999,999 | 0 (0.0%) | 50 (5.9%) |
| $1,000,000 or more | 0 (0.0%) | 0 (0.0%) |
| Total | 213 (100.0%) | 850 (100.0%) |
Household Income by Mortgage Status in Norwood Young America
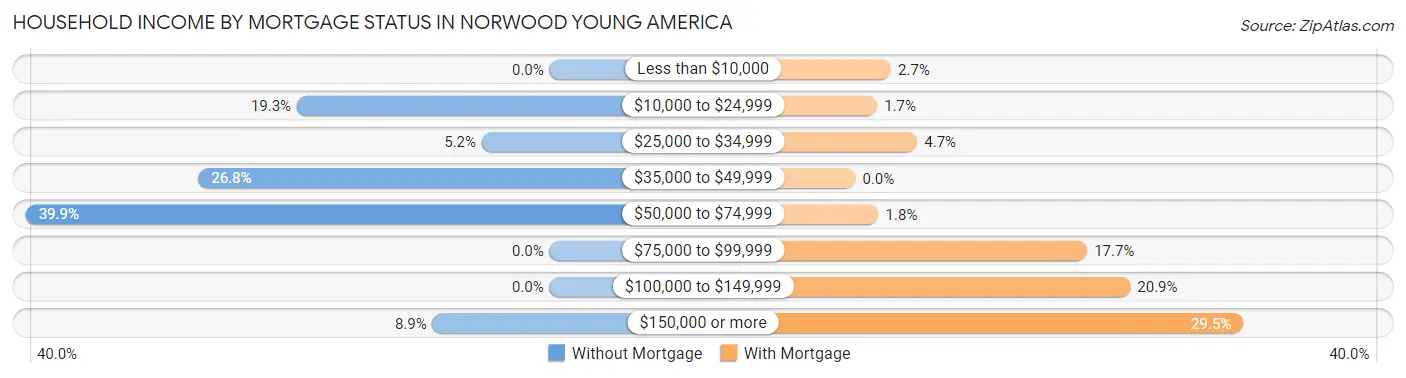
| Household Income | Without Mortgage | With Mortgage |
| Less than $10,000 | 0 (0.0%) | 23 (2.7%) |
| $10,000 to $24,999 | 41 (19.3%) | 14 (1.7%) |
| $25,000 to $34,999 | 11 (5.2%) | 40 (4.7%) |
| $35,000 to $49,999 | 57 (26.8%) | 0 (0.0%) |
| $50,000 to $74,999 | 85 (39.9%) | 15 (1.8%) |
| $75,000 to $99,999 | 0 (0.0%) | 150 (17.6%) |
| $100,000 to $149,999 | 0 (0.0%) | 178 (20.9%) |
| $150,000 or more | 19 (8.9%) | 251 (29.5%) |
| Total | 213 (100.0%) | 850 (100.0%) |
Property Value to Household Income Ratio in Norwood Young America
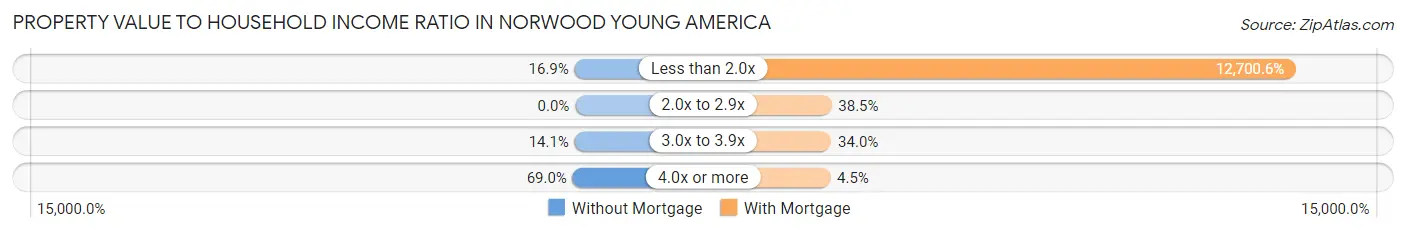
| Value-to-Income Ratio | Without Mortgage | With Mortgage |
| Less than 2.0x | 36 (16.9%) | 107,955 (12,700.6%) |
| 2.0x to 2.9x | 0 (0.0%) | 327 (38.5%) |
| 3.0x to 3.9x | 30 (14.1%) | 289 (34.0%) |
| 4.0x or more | 147 (69.0%) | 38 (4.5%) |
| Total | 213 (100.0%) | 850 (100.0%) |
Real Estate Taxes by Mortgage Status in Norwood Young America
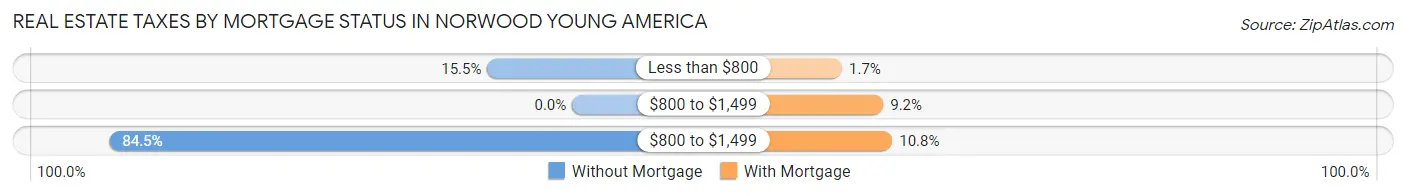
| Property Taxes | Without Mortgage | With Mortgage |
| Less than $800 | 33 (15.5%) | 14 (1.7%) |
| $800 to $1,499 | 0 (0.0%) | 78 (9.2%) |
| $800 to $1,499 | 180 (84.5%) | 92 (10.8%) |
| Total | 213 (100.0%) | 850 (100.0%) |
Health & Disability in Norwood Young America
Health Insurance Coverage by Age in Norwood Young America
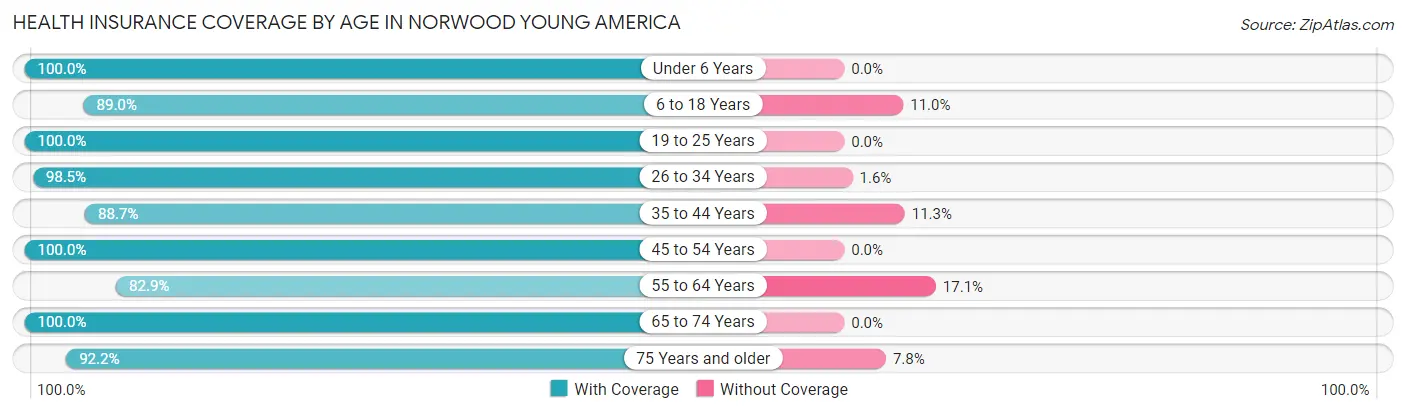
| Age Bracket | With Coverage | Without Coverage |
| Under 6 Years | 348 (100.0%) | 0 (0.0%) |
| 6 to 18 Years | 501 (89.0%) | 62 (11.0%) |
| 19 to 25 Years | 334 (100.0%) | 0 (0.0%) |
| 26 to 34 Years | 508 (98.5%) | 8 (1.5%) |
| 35 to 44 Years | 503 (88.7%) | 64 (11.3%) |
| 45 to 54 Years | 479 (100.0%) | 0 (0.0%) |
| 55 to 64 Years | 335 (82.9%) | 69 (17.1%) |
| 65 to 74 Years | 237 (100.0%) | 0 (0.0%) |
| 75 Years and older | 356 (92.2%) | 30 (7.8%) |
| Total | 3,601 (93.9%) | 233 (6.1%) |
Health Insurance Coverage by Citizenship Status in Norwood Young America
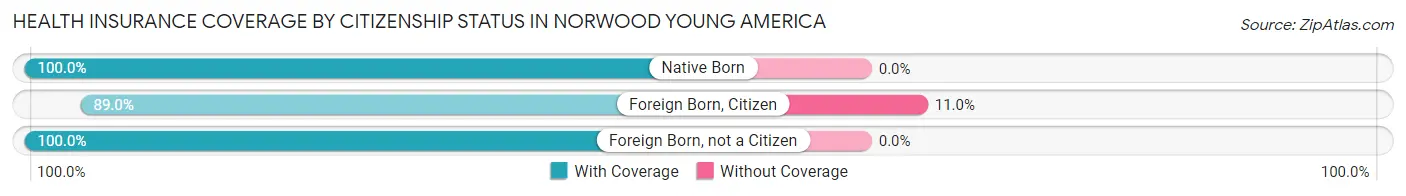
| Citizenship Status | With Coverage | Without Coverage |
| Native Born | 348 (100.0%) | 0 (0.0%) |
| Foreign Born, Citizen | 501 (89.0%) | 62 (11.0%) |
| Foreign Born, not a Citizen | 334 (100.0%) | 0 (0.0%) |
Health Insurance Coverage by Household Income in Norwood Young America
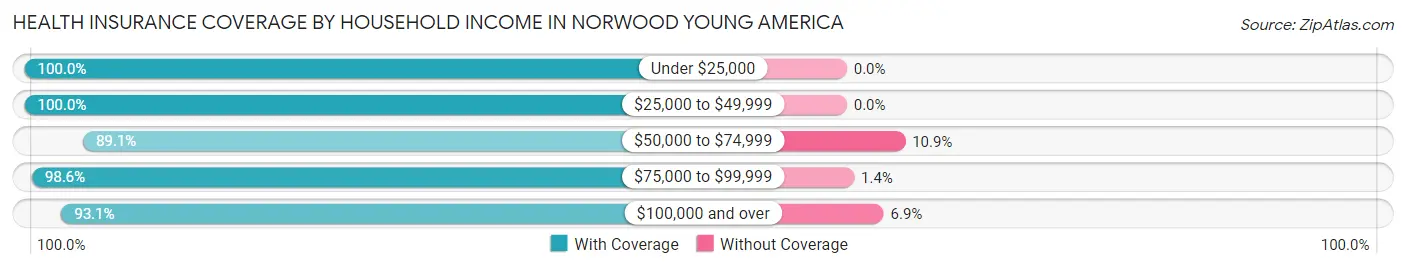
| Household Income | With Coverage | Without Coverage |
| Under $25,000 | 227 (100.0%) | 0 (0.0%) |
| $25,000 to $49,999 | 234 (100.0%) | 0 (0.0%) |
| $50,000 to $74,999 | 684 (89.1%) | 84 (10.9%) |
| $75,000 to $99,999 | 574 (98.6%) | 8 (1.4%) |
| $100,000 and over | 1,877 (93.1%) | 139 (6.9%) |
Public vs Private Health Insurance Coverage by Age in Norwood Young America
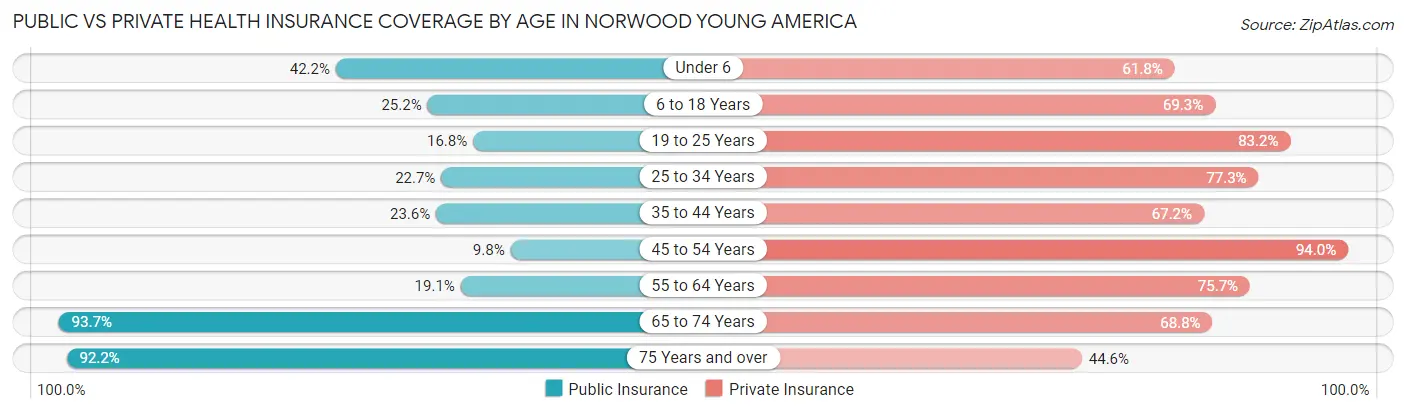
| Age Bracket | Public Insurance | Private Insurance |
| Under 6 | 147 (42.2%) | 215 (61.8%) |
| 6 to 18 Years | 142 (25.2%) | 390 (69.3%) |
| 19 to 25 Years | 56 (16.8%) | 278 (83.2%) |
| 25 to 34 Years | 117 (22.7%) | 399 (77.3%) |
| 35 to 44 Years | 134 (23.6%) | 381 (67.2%) |
| 45 to 54 Years | 47 (9.8%) | 450 (94.0%) |
| 55 to 64 Years | 77 (19.1%) | 306 (75.7%) |
| 65 to 74 Years | 222 (93.7%) | 163 (68.8%) |
| 75 Years and over | 356 (92.2%) | 172 (44.6%) |
| Total | 1,298 (33.9%) | 2,754 (71.8%) |
Disability Status by Sex by Age in Norwood Young America
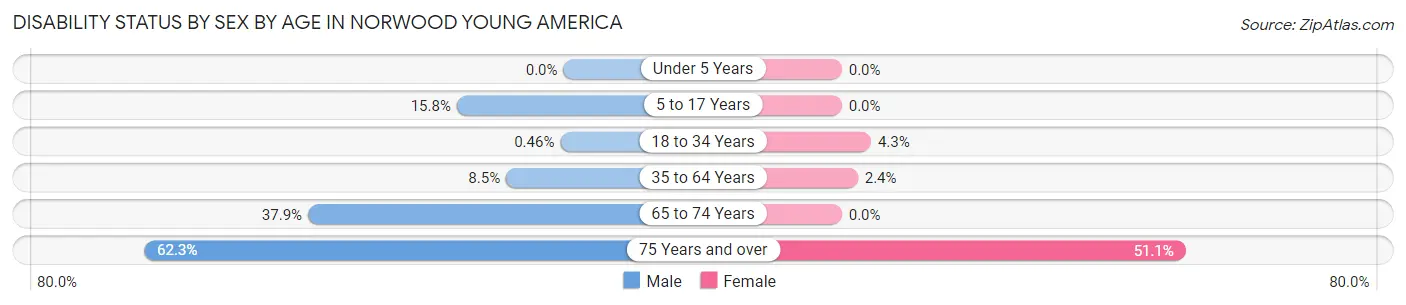
| Age Bracket | Male | Female |
| Under 5 Years | 0 (0.0%) | 0 (0.0%) |
| 5 to 17 Years | 57 (15.8%) | 0 (0.0%) |
| 18 to 34 Years | 2 (0.5%) | 19 (4.3%) |
| 35 to 64 Years | 66 (8.5%) | 16 (2.4%) |
| 65 to 74 Years | 44 (37.9%) | 0 (0.0%) |
| 75 Years and over | 94 (62.3%) | 120 (51.1%) |
Disability Class by Sex by Age in Norwood Young America
Disability Class: Hearing Difficulty
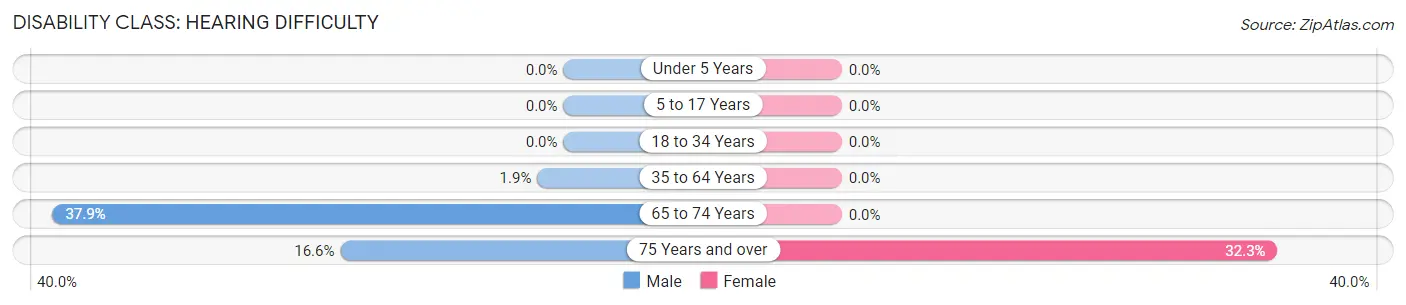
| Age Bracket | Male | Female |
| Under 5 Years | 0 (0.0%) | 0 (0.0%) |
| 5 to 17 Years | 0 (0.0%) | 0 (0.0%) |
| 18 to 34 Years | 0 (0.0%) | 0 (0.0%) |
| 35 to 64 Years | 15 (1.9%) | 0 (0.0%) |
| 65 to 74 Years | 44 (37.9%) | 0 (0.0%) |
| 75 Years and over | 25 (16.6%) | 76 (32.3%) |
Disability Class: Vision Difficulty
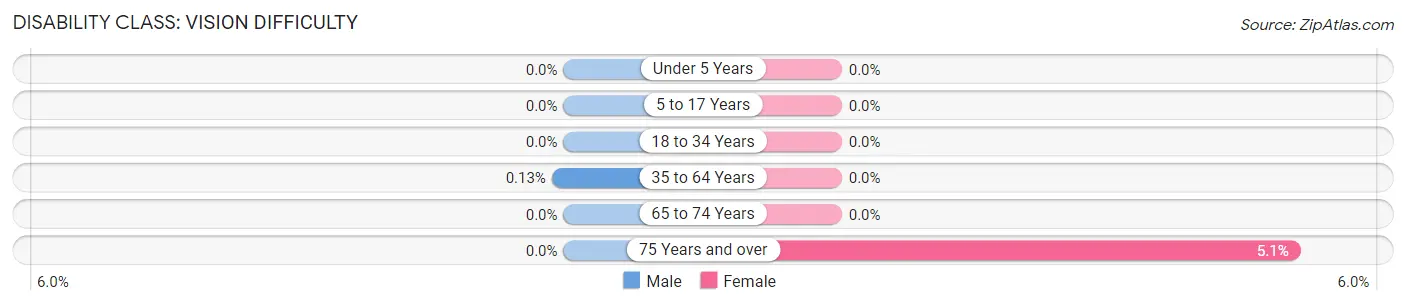
| Age Bracket | Male | Female |
| Under 5 Years | 0 (0.0%) | 0 (0.0%) |
| 5 to 17 Years | 0 (0.0%) | 0 (0.0%) |
| 18 to 34 Years | 0 (0.0%) | 0 (0.0%) |
| 35 to 64 Years | 1 (0.1%) | 0 (0.0%) |
| 65 to 74 Years | 0 (0.0%) | 0 (0.0%) |
| 75 Years and over | 0 (0.0%) | 12 (5.1%) |
Disability Class: Cognitive Difficulty
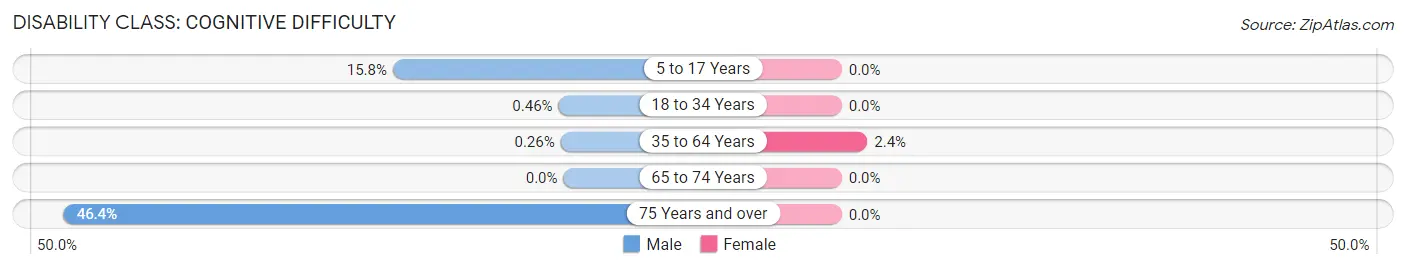
| Age Bracket | Male | Female |
| 5 to 17 Years | 57 (15.8%) | 0 (0.0%) |
| 18 to 34 Years | 2 (0.5%) | 0 (0.0%) |
| 35 to 64 Years | 2 (0.3%) | 16 (2.4%) |
| 65 to 74 Years | 0 (0.0%) | 0 (0.0%) |
| 75 Years and over | 70 (46.4%) | 0 (0.0%) |
Disability Class: Ambulatory Difficulty
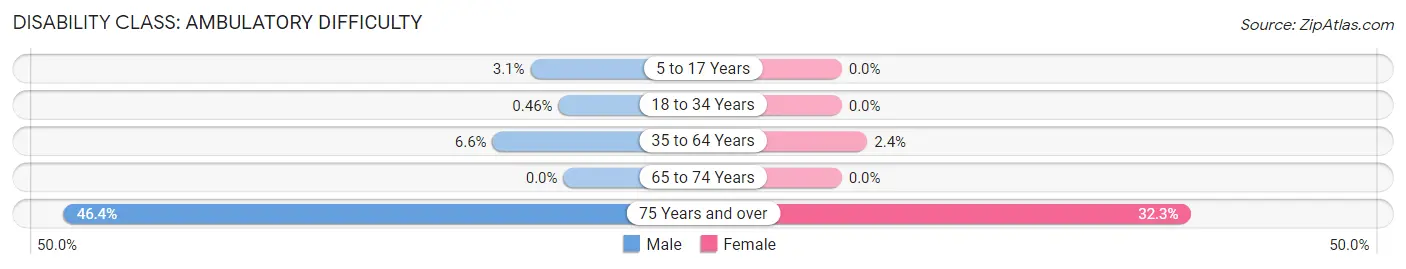
| Age Bracket | Male | Female |
| 5 to 17 Years | 11 (3.1%) | 0 (0.0%) |
| 18 to 34 Years | 2 (0.5%) | 0 (0.0%) |
| 35 to 64 Years | 51 (6.6%) | 16 (2.4%) |
| 65 to 74 Years | 0 (0.0%) | 0 (0.0%) |
| 75 Years and over | 70 (46.4%) | 76 (32.3%) |
Disability Class: Self-Care Difficulty
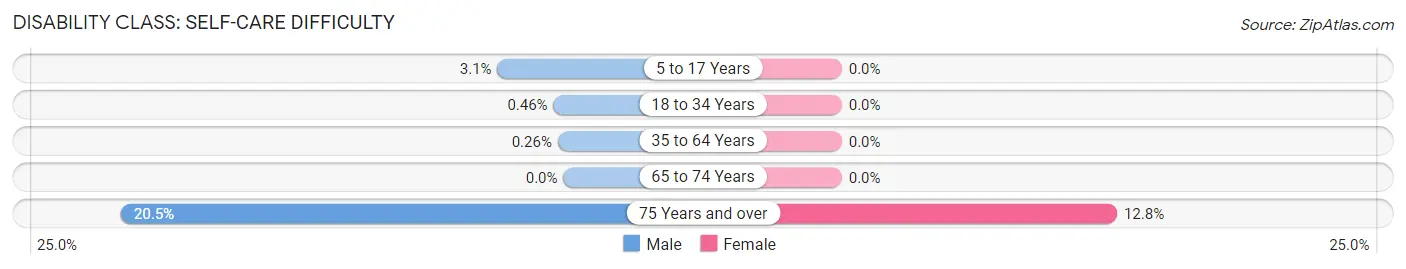
| Age Bracket | Male | Female |
| 5 to 17 Years | 11 (3.1%) | 0 (0.0%) |
| 18 to 34 Years | 2 (0.5%) | 0 (0.0%) |
| 35 to 64 Years | 2 (0.3%) | 0 (0.0%) |
| 65 to 74 Years | 0 (0.0%) | 0 (0.0%) |
| 75 Years and over | 31 (20.5%) | 30 (12.8%) |
Technology Access in Norwood Young America
Computing Device Access in Norwood Young America
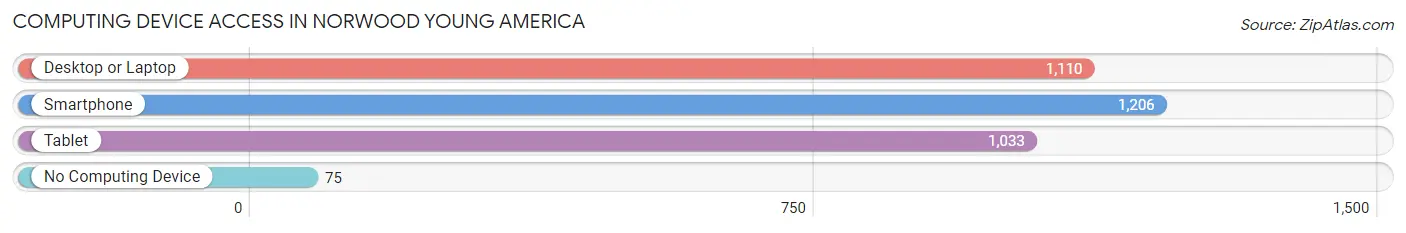
| Device Type | # Households | % Households |
| Desktop or Laptop | 1,110 | 79.5% |
| Smartphone | 1,206 | 86.4% |
| Tablet | 1,033 | 74.0% |
| No Computing Device | 75 | 5.4% |
| Total | 1,396 | 100.0% |
Internet Access in Norwood Young America
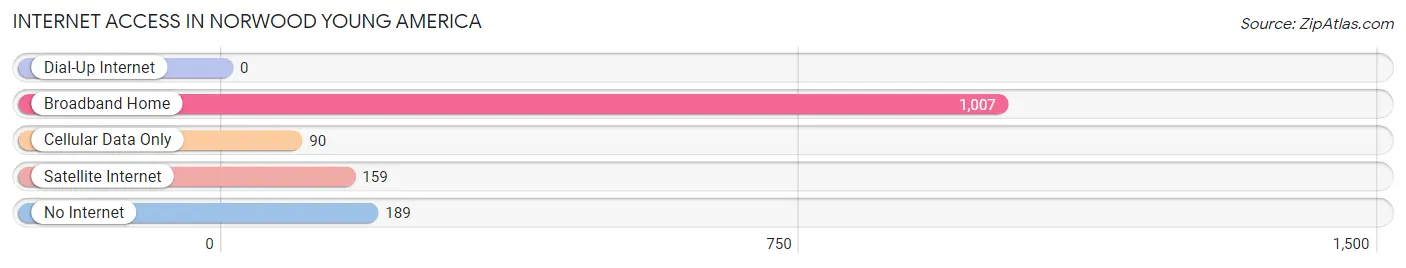
| Internet Type | # Households | % Households |
| Dial-Up Internet | 0 | 0.0% |
| Broadband Home | 1,007 | 72.1% |
| Cellular Data Only | 90 | 6.5% |
| Satellite Internet | 159 | 11.4% |
| No Internet | 189 | 13.5% |
| Total | 1,396 | 100.0% |
Norwood Young America Summary
Norwood Young America (NYA) is a city located in Carver County, Minnesota, United States. The population was 2,845 at the 2010 census. It is part of the Minneapolis-St. Paul metropolitan area.
History
The area that is now Norwood Young America was first settled in the mid-1800s by German and Irish immigrants. The town was originally known as Young America, and was named after the Young America movement, a political movement of the 1840s and 1850s that sought to expand the United States into the western territories. The town was later renamed Norwood Young America in 1887, after the nearby town of Norwood.
Geography
Norwood Young America is located at the intersection of Minnesota State Highways 5 and 212, about 40 miles southwest of Minneapolis. The city is situated on the banks of the Crow River, and is surrounded by rolling hills and farmland.
Climate
Norwood Young America has a humid continental climate, with cold winters and hot, humid summers. The average annual temperature is 43°F (6°C), and the average annual precipitation is 30 inches (76 cm).
Demographics
As of the 2010 census, there were 2,845 people, 1,093 households, and 790 families residing in the city. The population density was 1,093.3 people per square mile (422.2/km2). The racial makeup of the city was 97.2% White, 0.3% African American, 0.3% Native American, 0.4% Asian, 0.1% Pacific Islander, 0.7% from other races, and 0.9% from two or more races. Hispanic or Latino of any race were 1.7% of the population.
Economy
Norwood Young America is a small, rural community with a strong agricultural economy. The city is home to several large farms, as well as several small businesses. The city is also home to a number of manufacturing companies, including a large food processing plant. The city is also home to a number of retail stores, restaurants, and other businesses.
Education
Norwood Young America is served by the Norwood Young America School District, which includes two elementary schools, one middle school, and one high school. The district also operates a number of alternative education programs, including a virtual school and a home school program. The city is also home to a number of private schools, including a Catholic school and a Lutheran school.
Conclusion
Norwood Young America is a small, rural city located in Carver County, Minnesota. The city has a strong agricultural economy, and is home to several large farms and manufacturing companies. The city is also home to a number of retail stores, restaurants, and other businesses. The city is served by the Norwood Young America School District, which includes two elementary schools, one middle school, and one high school. The city is also home to a number of private schools, including a Catholic school and a Lutheran school.
Common Questions
What is Per Capita Income in Norwood Young America?
Per Capita income in Norwood Young America is $32,640.
What is the Median Family Income in Norwood Young America?
Median Family Income in Norwood Young America is $93,214.
What is the Median Household income in Norwood Young America?
Median Household Income in Norwood Young America is $76,538.
What is Income or Wage Gap in Norwood Young America?
Income or Wage Gap in Norwood Young America is 29.5%.
Women in Norwood Young America earn 70.5 cents for every dollar earned by a man.
What is Inequality or Gini Index in Norwood Young America?
Inequality or Gini Index in Norwood Young America is 0.35.
What is the Total Population of Norwood Young America?
Total Population of Norwood Young America is 3,852.
What is the Total Male Population of Norwood Young America?
Total Male Population of Norwood Young America is 1,976.
What is the Total Female Population of Norwood Young America?
Total Female Population of Norwood Young America is 1,876.
What is the Ratio of Males per 100 Females in Norwood Young America?
There are 105.33 Males per 100 Females in Norwood Young America.
What is the Ratio of Females per 100 Males in Norwood Young America?
There are 94.94 Females per 100 Males in Norwood Young America.
What is the Median Population Age in Norwood Young America?
Median Population Age in Norwood Young America is 36.8 Years.
What is the Average Family Size in Norwood Young America
Average Family Size in Norwood Young America is 3.3 People.
What is the Average Household Size in Norwood Young America
Average Household Size in Norwood Young America is 2.8 People.
How Large is the Labor Force in Norwood Young America?
There are 2,090 People in the Labor Forcein in Norwood Young America.
What is the Percentage of People in the Labor Force in Norwood Young America?
67.1% of People are in the Labor Force in Norwood Young America.
What is the Unemployment Rate in Norwood Young America?
Unemployment Rate in Norwood Young America is 5.4%.