Norcross, MN Map & Demographics
Norcross Map
Norcross Overview
$60,746
PER CAPITA INCOME
$110,625
AVG FAMILY INCOME
$94,083
AVG HOUSEHOLD INCOME
0.41
INEQUALITY / GINI INDEX
104
TOTAL POPULATION
61
MALE POPULATION
43
FEMALE POPULATION
141.86
MALES / 100 FEMALES
70.49
FEMALES / 100 MALES
35.7
MEDIAN AGE
3.2
AVG FAMILY SIZE
2.4
AVG HOUSEHOLD SIZE
50
LABOR FORCE [ PEOPLE ]
63.3%
PERCENT IN LABOR FORCE
Norcross Zip Codes
Norcross Area Codes
Income in Norcross
Income Overview in Norcross
Per Capita Income in Norcross is $60,746, while median incomes of families and households are $110,625 and $94,083 respectively.
| Characteristic | Number | Measure |
| Per Capita Income | 104 | $60,746 |
| Median Family Income | 28 | $110,625 |
| Mean Family Income | 28 | $182,871 |
| Median Household Income | 43 | $94,083 |
| Mean Household Income | 43 | $151,621 |
| Income Deficit | 28 | $0 |
| Wage / Income Gap (%) | 104 | 0.00% |
| Wage / Income Gap ($) | 104 | 100.00¢ per $1 |
| Gini / Inequality Index | 104 | 0.41 |
Earnings by Sex in Norcross
| Sex | Number | Average Earnings |
| Male | 42 (72.4%) | $0 |
| Female | 16 (27.6%) | $0 |
| Total | 58 (100.0%) | $0 |
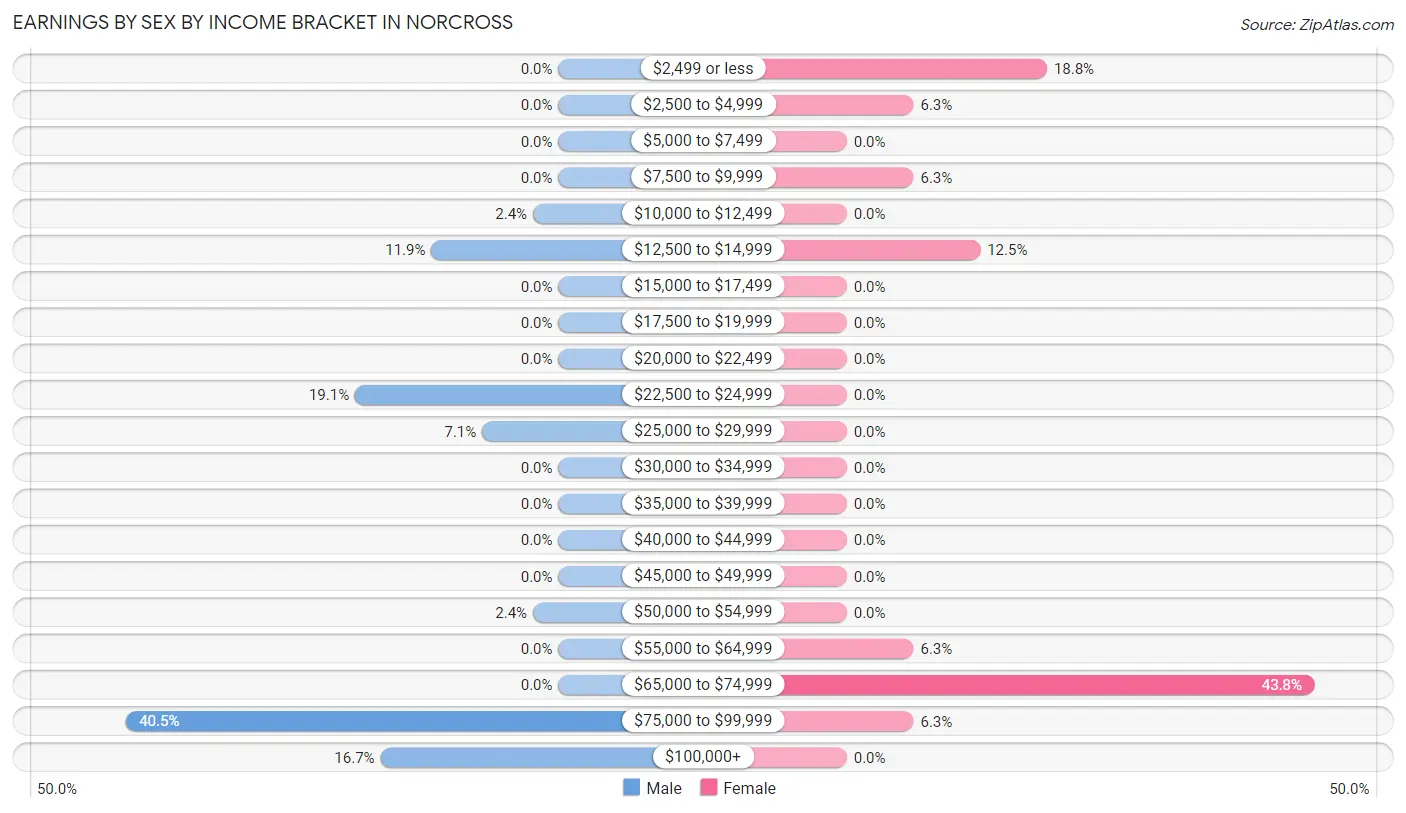
Earnings by Sex by Income Bracket in Norcross
The most common earnings brackets in Norcross are $75,000 to $99,999 for men (17 | 40.5%) and $65,000 to $74,999 for women (7 | 43.8%).
| Income | Male | Female |
| $2,499 or less | 0 (0.0%) | 3 (18.8%) |
| $2,500 to $4,999 | 0 (0.0%) | 1 (6.2%) |
| $5,000 to $7,499 | 0 (0.0%) | 0 (0.0%) |
| $7,500 to $9,999 | 0 (0.0%) | 1 (6.2%) |
| $10,000 to $12,499 | 1 (2.4%) | 0 (0.0%) |
| $12,500 to $14,999 | 5 (11.9%) | 2 (12.5%) |
| $15,000 to $17,499 | 0 (0.0%) | 0 (0.0%) |
| $17,500 to $19,999 | 0 (0.0%) | 0 (0.0%) |
| $20,000 to $22,499 | 0 (0.0%) | 0 (0.0%) |
| $22,500 to $24,999 | 8 (19.1%) | 0 (0.0%) |
| $25,000 to $29,999 | 3 (7.1%) | 0 (0.0%) |
| $30,000 to $34,999 | 0 (0.0%) | 0 (0.0%) |
| $35,000 to $39,999 | 0 (0.0%) | 0 (0.0%) |
| $40,000 to $44,999 | 0 (0.0%) | 0 (0.0%) |
| $45,000 to $49,999 | 0 (0.0%) | 0 (0.0%) |
| $50,000 to $54,999 | 1 (2.4%) | 0 (0.0%) |
| $55,000 to $64,999 | 0 (0.0%) | 1 (6.2%) |
| $65,000 to $74,999 | 0 (0.0%) | 7 (43.8%) |
| $75,000 to $99,999 | 17 (40.5%) | 1 (6.2%) |
| $100,000+ | 7 (16.7%) | 0 (0.0%) |
| Total | 42 (100.0%) | 16 (100.0%) |
Earnings by Sex by Educational Attainment in Norcross
| Educational Attainment | Male Income | Female Income |
| Less than High School | - | - |
| High School Diploma | - | - |
| College or Associate's Degree | - | - |
| Bachelor's Degree | - | - |
| Graduate Degree | - | - |
| Total | $92,917 | $70,714 |
Family Income in Norcross
Family Income Brackets in Norcross
According to the Norcross family income data, there are 12 families falling into the $50,000 to $74,999 income range, which is the most common income bracket and makes up 42.9% of all families.
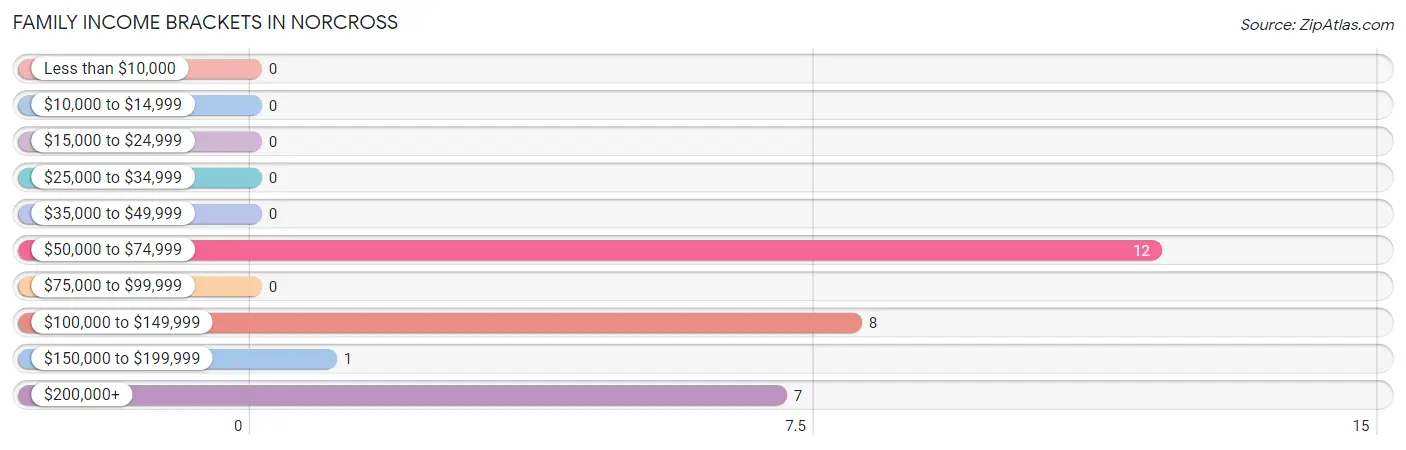
| Income Bracket | # Families | % Families |
| Less than $10,000 | 0 | 0.0% |
| $10,000 to $14,999 | 0 | 0.0% |
| $15,000 to $24,999 | 0 | 0.0% |
| $25,000 to $34,999 | 0 | 0.0% |
| $35,000 to $49,999 | 0 | 0.0% |
| $50,000 to $74,999 | 12 | 42.9% |
| $75,000 to $99,999 | 0 | 0.0% |
| $100,000 to $149,999 | 8 | 28.6% |
| $150,000 to $199,999 | 1 | 3.6% |
| $200,000+ | 7 | 25.0% |
Family Income by Famaliy Size in Norcross
2-person families (11 | 39.3%) account for the highest median family income in Norcross with $65,250 per family, while 2-person families (11 | 39.3%) have the highest median income of $32,625 per family member.
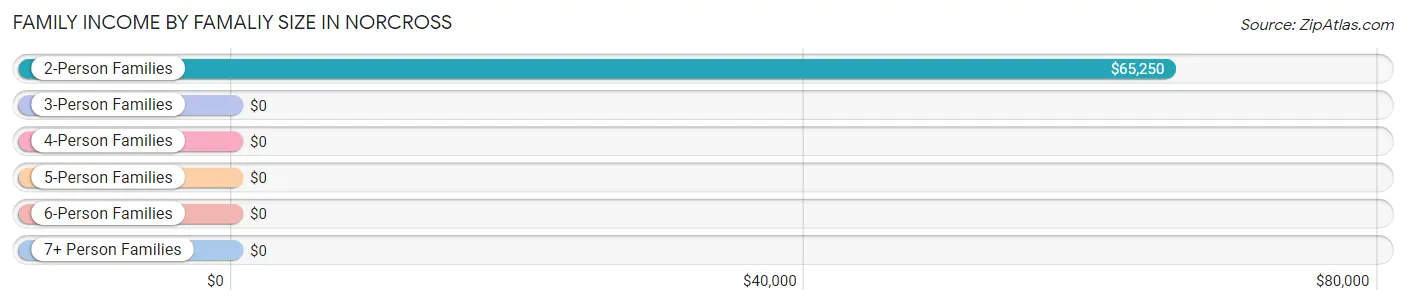
| Income Bracket | # Families | Median Income |
| 2-Person Families | 11 (39.3%) | $65,250 |
| 3-Person Families | 1 (3.6%) | $0 |
| 4-Person Families | 8 (28.6%) | $0 |
| 5-Person Families | 0 (0.0%) | $0 |
| 6-Person Families | 0 (0.0%) | $0 |
| 7+ Person Families | 8 (28.6%) | $0 |
| Total | 28 (100.0%) | $110,625 |
Family Income by Number of Earners in Norcross
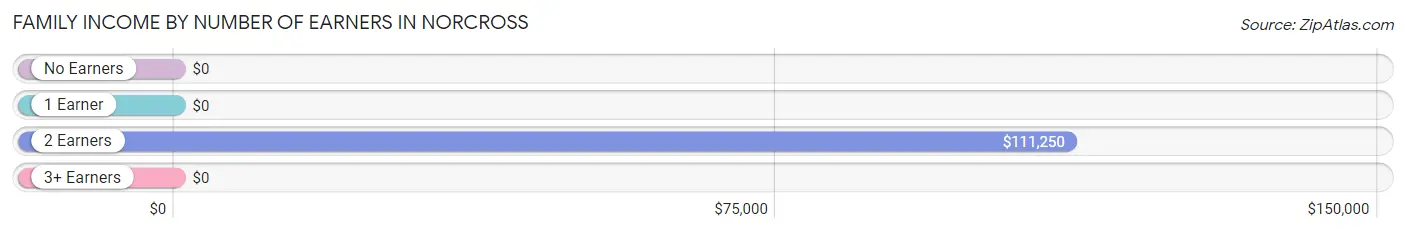
| Number of Earners | # Families | Median Income |
| No Earners | 5 (17.9%) | $0 |
| 1 Earner | 5 (17.9%) | $0 |
| 2 Earners | 10 (35.7%) | $111,250 |
| 3+ Earners | 8 (28.6%) | $0 |
| Total | 28 (100.0%) | $110,625 |
Household Income in Norcross
Household Income Brackets in Norcross
With 15 households falling in the category, the $75,000 to $99,999 income range is the most frequent in Norcross, accounting for 34.9% of all households.
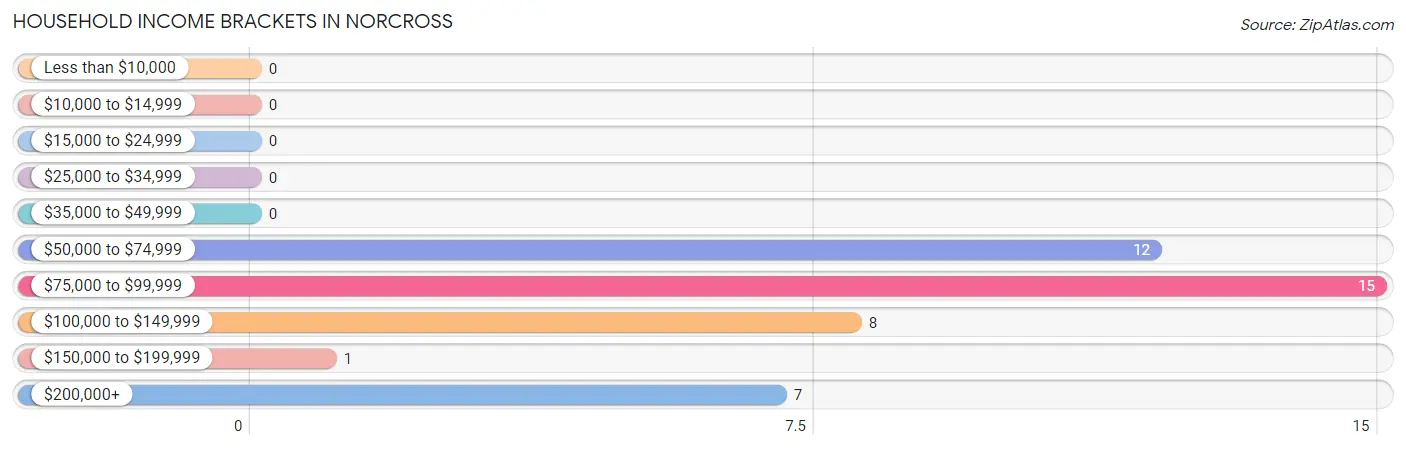
| Income Bracket | # Households | % Households |
| Less than $10,000 | 0 | 0.0% |
| $10,000 to $14,999 | 0 | 0.0% |
| $15,000 to $24,999 | 0 | 0.0% |
| $25,000 to $34,999 | 0 | 0.0% |
| $35,000 to $49,999 | 0 | 0.0% |
| $50,000 to $74,999 | 12 | 27.9% |
| $75,000 to $99,999 | 15 | 34.9% |
| $100,000 to $149,999 | 8 | 18.6% |
| $150,000 to $199,999 | 1 | 2.3% |
| $200,000+ | 7 | 16.3% |
Household Income by Householder Age in Norcross
The median household income in Norcross is $94,083, with the highest median household income of $94,250 found in the 25 to 44 years age bracket for the primary householder. A total of 25 households (58.1%) fall into this category.
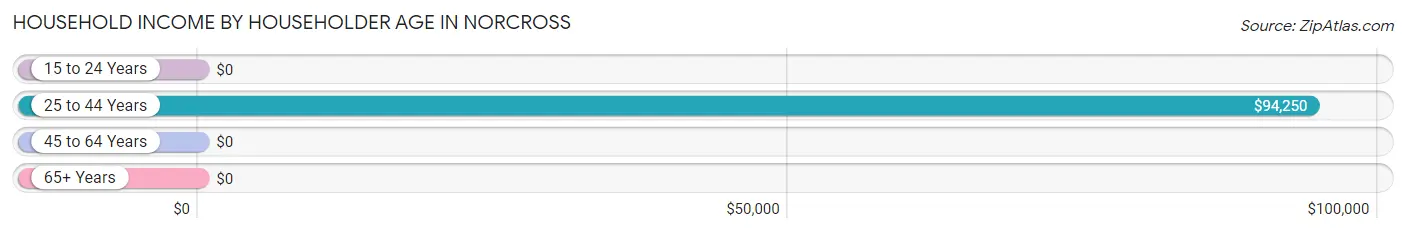
| Income Bracket | # Households | Median Income |
| 15 to 24 Years | 0 (0.0%) | $0 |
| 25 to 44 Years | 25 (58.1%) | $94,250 |
| 45 to 64 Years | 8 (18.6%) | $0 |
| 65+ Years | 10 (23.3%) | $0 |
| Total | 43 (100.0%) | $94,083 |
Poverty in Norcross
Income Below Poverty by Sex and Age in Norcross
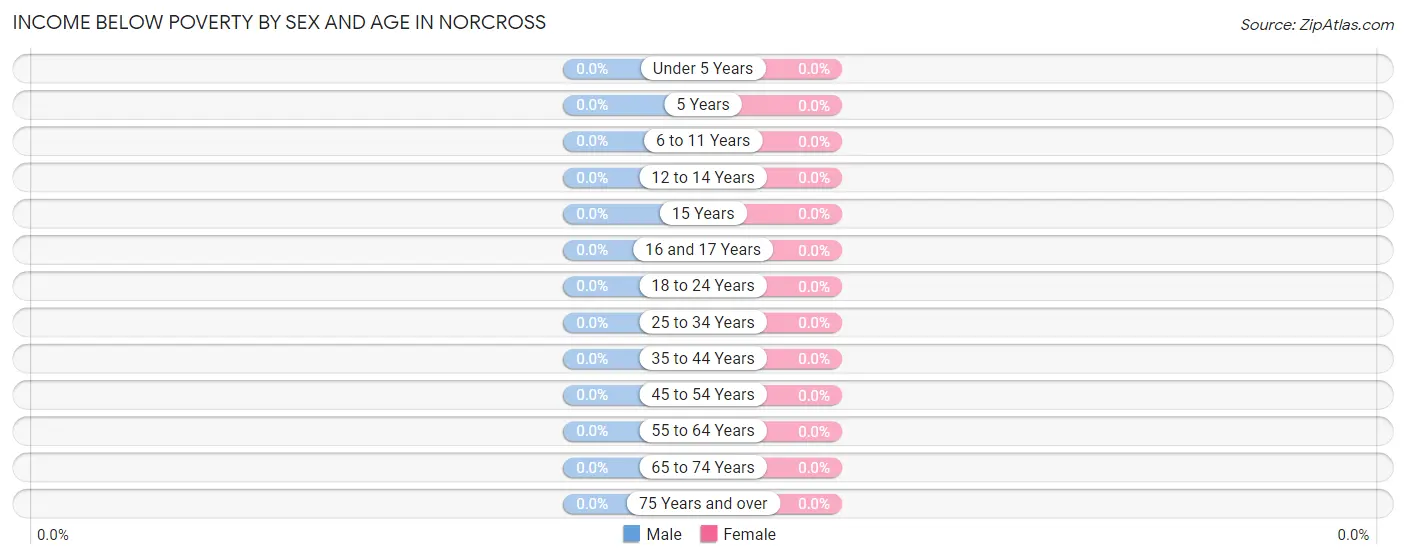
| Age Bracket | Male | Female |
| Under 5 Years | 0 (0.0%) | 0 (0.0%) |
| 5 Years | 0 (0.0%) | 0 (0.0%) |
| 6 to 11 Years | 0 (0.0%) | 0 (0.0%) |
| 12 to 14 Years | 0 (0.0%) | 0 (0.0%) |
| 15 Years | 0 (0.0%) | 0 (0.0%) |
| 16 and 17 Years | 0 (0.0%) | 0 (0.0%) |
| 18 to 24 Years | 0 (0.0%) | 0 (0.0%) |
| 25 to 34 Years | 0 (0.0%) | 0 (0.0%) |
| 35 to 44 Years | 0 (0.0%) | 0 (0.0%) |
| 45 to 54 Years | 0 (0.0%) | 0 (0.0%) |
| 55 to 64 Years | 0 (0.0%) | 0 (0.0%) |
| 65 to 74 Years | 0 (0.0%) | 0 (0.0%) |
| 75 Years and over | 0 (0.0%) | 0 (0.0%) |
| Total | 0 (0.0%) | 0 (0.0%) |
Income Above Poverty by Sex and Age in Norcross
According to the poverty statistics in Norcross, males aged 6 to 11 years and females aged under 5 years are the age groups that are most secure financially, with 100.0% of males and 100.0% of females in these age groups living above the poverty line.
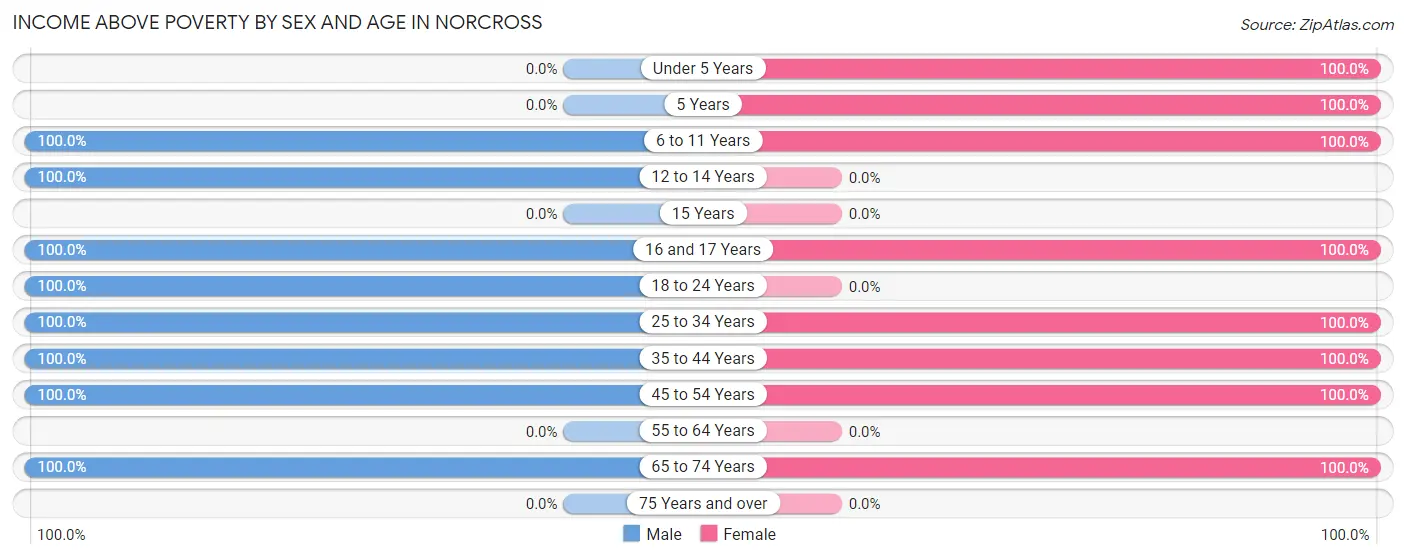
| Age Bracket | Male | Female |
| Under 5 Years | 0 (0.0%) | 6 (100.0%) |
| 5 Years | 0 (0.0%) | 6 (100.0%) |
| 6 to 11 Years | 6 (100.0%) | 1 (100.0%) |
| 12 to 14 Years | 6 (100.0%) | 0 (0.0%) |
| 15 Years | 0 (0.0%) | 0 (0.0%) |
| 16 and 17 Years | 2 (100.0%) | 10 (100.0%) |
| 18 to 24 Years | 3 (100.0%) | 0 (0.0%) |
| 25 to 34 Years | 1 (100.0%) | 1 (100.0%) |
| 35 to 44 Years | 24 (100.0%) | 8 (100.0%) |
| 45 to 54 Years | 9 (100.0%) | 3 (100.0%) |
| 55 to 64 Years | 0 (0.0%) | 0 (0.0%) |
| 65 to 74 Years | 10 (100.0%) | 8 (100.0%) |
| 75 Years and over | 0 (0.0%) | 0 (0.0%) |
| Total | 61 (100.0%) | 43 (100.0%) |
Income Below Poverty Among Married-Couple Families in Norcross
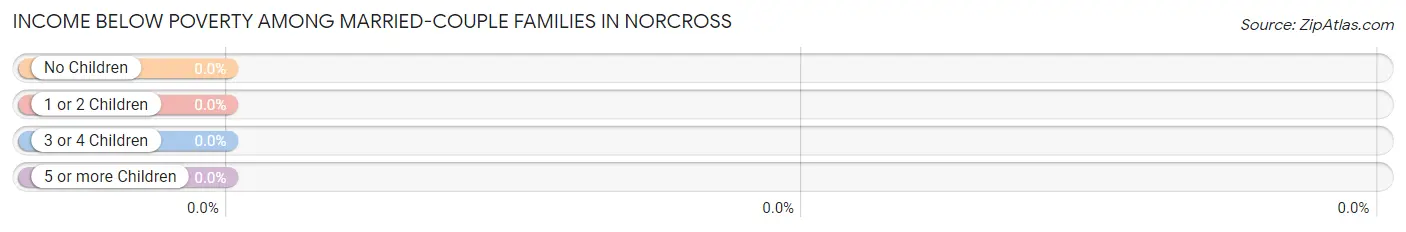
| Children | Above Poverty | Below Poverty |
| No Children | 11 (100.0%) | 0 (0.0%) |
| 1 or 2 Children | 9 (100.0%) | 0 (0.0%) |
| 3 or 4 Children | 0 (0.0%) | 0 (0.0%) |
| 5 or more Children | 8 (100.0%) | 0 (0.0%) |
| Total | 28 (100.0%) | 0 (0.0%) |
Income Below Poverty Among Single-Parent Households in Norcross
| Children | Single Father | Single Mother |
| No Children | 0 (0.0%) | 0 (0.0%) |
| 1 or 2 Children | 0 (0.0%) | 0 (0.0%) |
| 3 or 4 Children | 0 (0.0%) | 0 (0.0%) |
| 5 or more Children | 0 (0.0%) | 0 (0.0%) |
| Total | 0 (0.0%) | 0 (0.0%) |
Income Below Poverty Among Married-Couple vs Single-Parent Households in Norcross
| Children | Married-Couple Families | Single-Parent Households |
| No Children | 0 (0.0%) | 0 (0.0%) |
| 1 or 2 Children | 0 (0.0%) | 0 (0.0%) |
| 3 or 4 Children | 0 (0.0%) | 0 (0.0%) |
| 5 or more Children | 0 (0.0%) | 0 (0.0%) |
| Total | 0 (0.0%) | 0 (0.0%) |
Race in Norcross
The most populous races in Norcross are White / Caucasian (100 | 96.2%), and Native / Alaskan (4 | 3.8%).
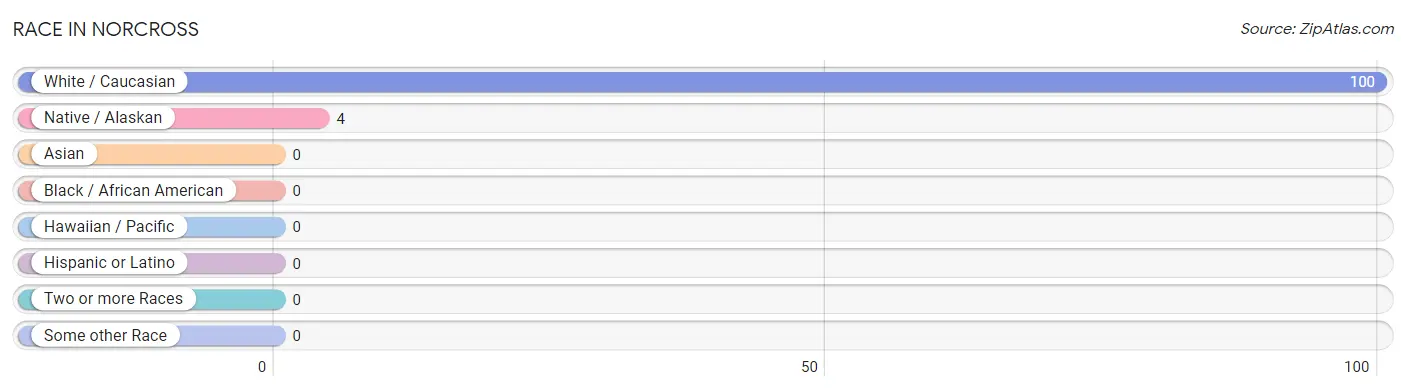
| Race | # Population | % Population |
| Asian | 0 | 0.0% |
| Black / African American | 0 | 0.0% |
| Hawaiian / Pacific | 0 | 0.0% |
| Hispanic or Latino | 0 | 0.0% |
| Native / Alaskan | 4 | 3.8% |
| White / Caucasian | 100 | 96.2% |
| Two or more Races | 0 | 0.0% |
| Some other Race | 0 | 0.0% |
| Total | 104 | 100.0% |
Ancestry in Norcross
The most populous ancestries reported in Norcross are Norwegian (48 | 46.2%), German (43 | 41.3%), Scotch-Irish (15 | 14.4%), Sioux (3 | 2.9%), and Chippewa (1 | 1.0%), together accounting for 105.8% of all Norcross residents.
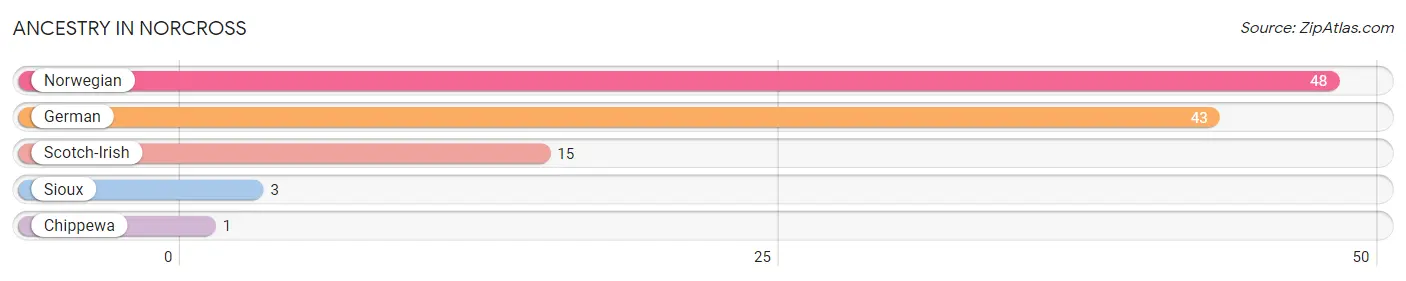
| Ancestry | # Population | % Population |
| Chippewa | 1 | 1.0% |
| German | 43 | 41.3% |
| Norwegian | 48 | 46.2% |
| Scotch-Irish | 15 | 14.4% |
| Sioux | 3 | 2.9% | View All 5 Rows |
Immigrants in Norcross

| Immigration Origin | # Population | % Population | View All 0 Rows |
Sex and Age in Norcross
Sex and Age in Norcross
The most populous age groups in Norcross are 35 to 39 Years (15 | 24.6%) for men and 15 to 19 Years (10 | 23.3%) for women.
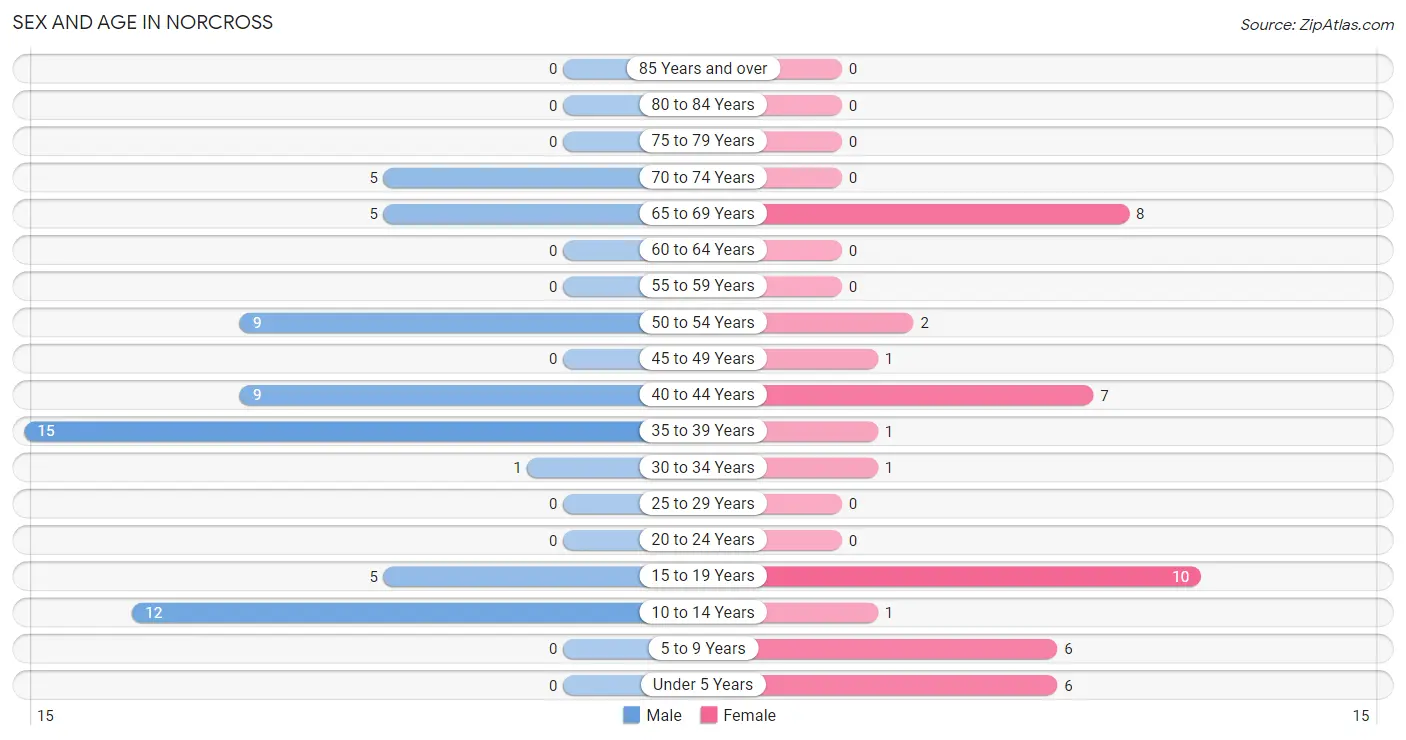
| Age Bracket | Male | Female |
| Under 5 Years | 0 (0.0%) | 6 (14.0%) |
| 5 to 9 Years | 0 (0.0%) | 6 (14.0%) |
| 10 to 14 Years | 12 (19.7%) | 1 (2.3%) |
| 15 to 19 Years | 5 (8.2%) | 10 (23.3%) |
| 20 to 24 Years | 0 (0.0%) | 0 (0.0%) |
| 25 to 29 Years | 0 (0.0%) | 0 (0.0%) |
| 30 to 34 Years | 1 (1.6%) | 1 (2.3%) |
| 35 to 39 Years | 15 (24.6%) | 1 (2.3%) |
| 40 to 44 Years | 9 (14.7%) | 7 (16.3%) |
| 45 to 49 Years | 0 (0.0%) | 1 (2.3%) |
| 50 to 54 Years | 9 (14.7%) | 2 (4.6%) |
| 55 to 59 Years | 0 (0.0%) | 0 (0.0%) |
| 60 to 64 Years | 0 (0.0%) | 0 (0.0%) |
| 65 to 69 Years | 5 (8.2%) | 8 (18.6%) |
| 70 to 74 Years | 5 (8.2%) | 0 (0.0%) |
| 75 to 79 Years | 0 (0.0%) | 0 (0.0%) |
| 80 to 84 Years | 0 (0.0%) | 0 (0.0%) |
| 85 Years and over | 0 (0.0%) | 0 (0.0%) |
| Total | 61 (100.0%) | 43 (100.0%) |
Families and Households in Norcross
Median Family Size in Norcross
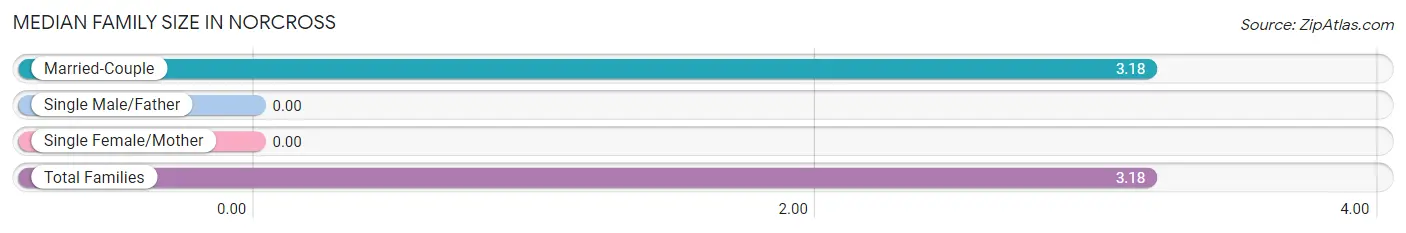
| Family Type | # Families | Family Size |
| Married-Couple | 28 (100.0%) | 3.18 |
| Single Male/Father | 0 (0.0%) | - |
| Single Female/Mother | 0 (0.0%) | - |
| Total Families | 28 (100.0%) | 3.18 |
Median Household Size in Norcross
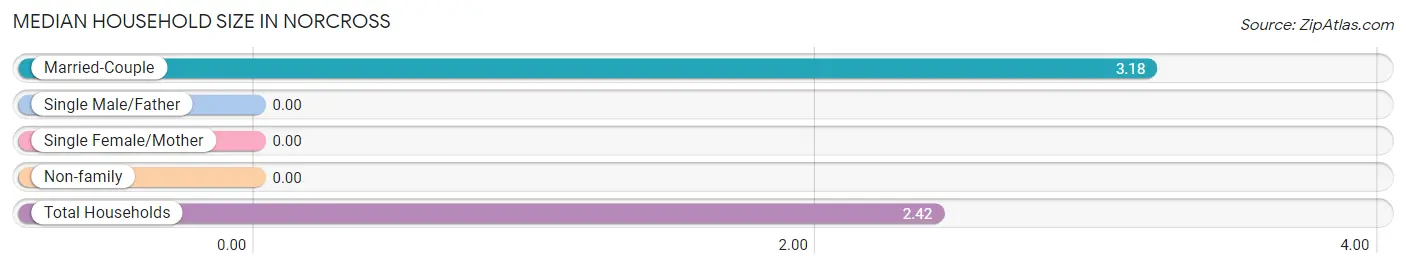
| Household Type | # Households | Household Size |
| Married-Couple | 28 (65.1%) | 3.18 |
| Single Male/Father | 0 (0.0%) | - |
| Single Female/Mother | 0 (0.0%) | - |
| Non-family | 15 (34.9%) | - |
| Total Households | 43 (100.0%) | 2.42 |
Household Size by Marriage Status in Norcross
Out of a total of 43 households in Norcross, 28 (65.1%) are family households, while 15 (34.9%) are nonfamily households. The most numerous type of family households are 2-person households, comprising 11, and the most common type of nonfamily households are 1-person households, comprising 15.
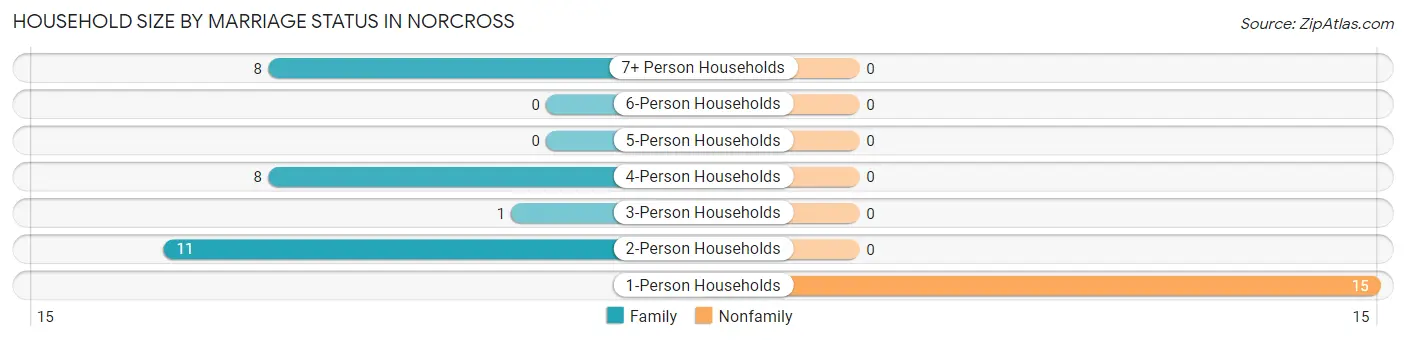
| Household Size | Family Households | Nonfamily Households |
| 1-Person Households | - | 15 (34.9%) |
| 2-Person Households | 11 (25.6%) | 0 (0.0%) |
| 3-Person Households | 1 (2.3%) | 0 (0.0%) |
| 4-Person Households | 8 (18.6%) | 0 (0.0%) |
| 5-Person Households | 0 (0.0%) | 0 (0.0%) |
| 6-Person Households | 0 (0.0%) | 0 (0.0%) |
| 7+ Person Households | 8 (18.6%) | 0 (0.0%) |
| Total | 28 (65.1%) | 15 (34.9%) |
Female Fertility in Norcross
Fertility by Age in Norcross
| Age Bracket | Women with Births | Births / 1,000 Women |
| 15 to 19 years | 0 (0.0%) | 0.0 |
| 20 to 34 years | 0 (0.0%) | 0.0 |
| 35 to 50 years | 0 (0.0%) | 0.0 |
| Total | 0 (0.0%) | 0.0 |
Fertility by Age by Marriage Status in Norcross
| Age Bracket | Married | Unmarried |
| 15 to 19 years | 0 (0.0%) | 0 (0.0%) |
| 20 to 34 years | 0 (0.0%) | 0 (0.0%) |
| 35 to 50 years | 0 (0.0%) | 0 (0.0%) |
| Total | 0 (0.0%) | 0 (0.0%) |
Fertility by Education in Norcross
| Educational Attainment | Women with Births | Births / 1,000 Women |
| Less than High School | 0 (0.0%) | 0.0 |
| High School Diploma | 0 (0.0%) | 0.0 |
| College or Associate's Degree | 0 (0.0%) | 0.0 |
| Bachelor's Degree | 0 (0.0%) | 0.0 |
| Graduate Degree | 0 (0.0%) | 0.0 |
| Total | 0 (0.0%) | 0.0 |
Fertility by Education by Marriage Status in Norcross
| Educational Attainment | Married | Unmarried |
| Less than High School | 0 (0.0%) | 0 (0.0%) |
| High School Diploma | 0 (0.0%) | 0 (0.0%) |
| College or Associate's Degree | 0 (0.0%) | 0 (0.0%) |
| Bachelor's Degree | 0 (0.0%) | 0 (0.0%) |
| Graduate Degree | 0 (0.0%) | 0 (0.0%) |
| Total | 0 (0.0%) | 0 (0.0%) |
Employment Characteristics in Norcross
Employment by Class of Employer in Norcross
Among the 50 employed individuals in Norcross, private company employees (18 | 36.0%), self-employed (not incorporated) (16 | 32.0%), and self-employed (incorporated) (15 | 30.0%) make up the most common classes of employment.
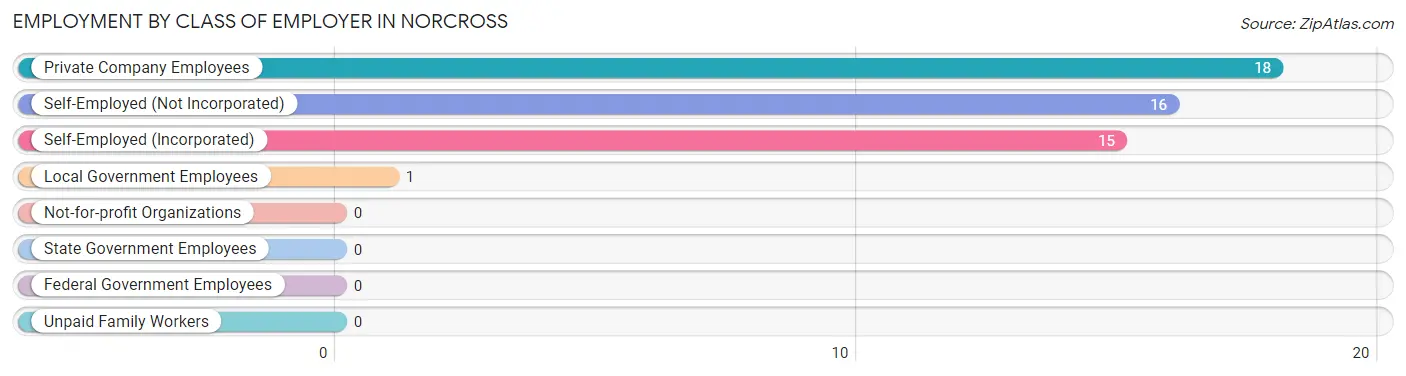
| Employer Class | # Employees | % Employees |
| Private Company Employees | 18 | 36.0% |
| Self-Employed (Incorporated) | 15 | 30.0% |
| Self-Employed (Not Incorporated) | 16 | 32.0% |
| Not-for-profit Organizations | 0 | 0.0% |
| Local Government Employees | 1 | 2.0% |
| State Government Employees | 0 | 0.0% |
| Federal Government Employees | 0 | 0.0% |
| Unpaid Family Workers | 0 | 0.0% |
| Total | 50 | 100.0% |
Employment Status by Age in Norcross
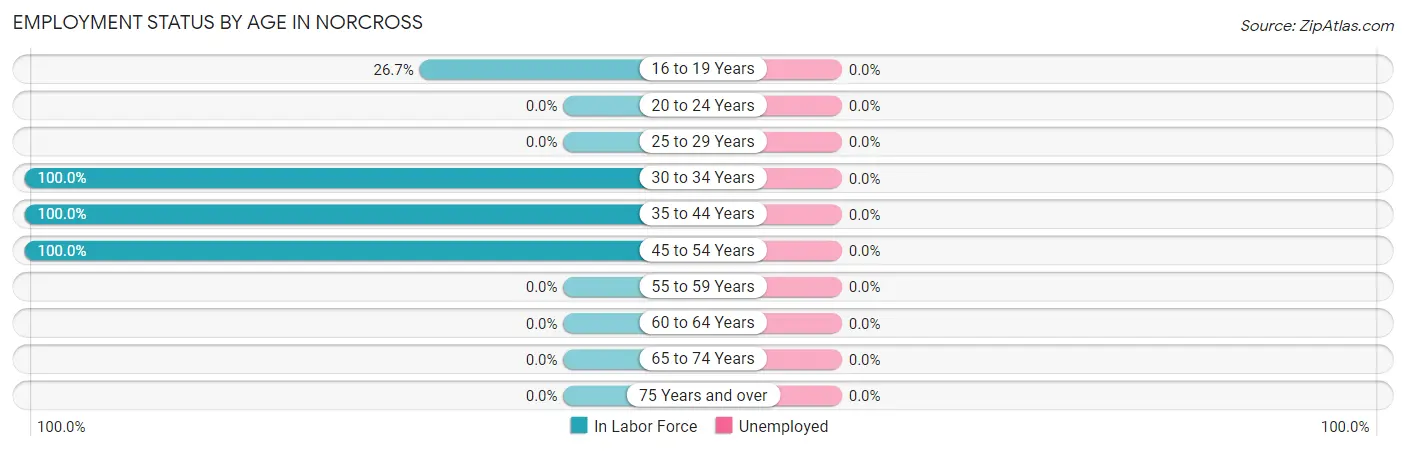
| Age Bracket | In Labor Force | Unemployed |
| 16 to 19 Years | 4 (26.7%) | 0 (0.0%) |
| 20 to 24 Years | 0 (0.0%) | 0 (0.0%) |
| 25 to 29 Years | 0 (0.0%) | 0 (0.0%) |
| 30 to 34 Years | 2 (100.0%) | 0 (0.0%) |
| 35 to 44 Years | 32 (100.0%) | 0 (0.0%) |
| 45 to 54 Years | 12 (100.0%) | 0 (0.0%) |
| 55 to 59 Years | 0 (0.0%) | 0 (0.0%) |
| 60 to 64 Years | 0 (0.0%) | 0 (0.0%) |
| 65 to 74 Years | 0 (0.0%) | 0 (0.0%) |
| 75 Years and over | 0 (0.0%) | 0 (0.0%) |
| Total | 50 (63.3%) | 0 (0.0%) |
Employment Status by Educational Attainment in Norcross
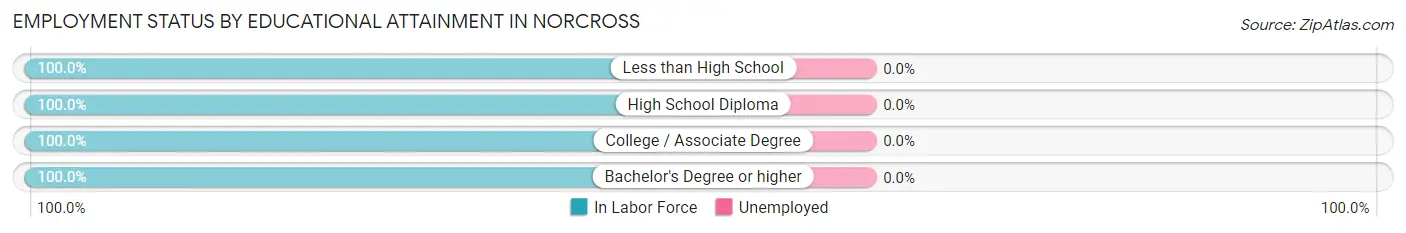
| Educational Attainment | In Labor Force | Unemployed |
| Less than High School | 1 (100.0%) | 0 (0.0%) |
| High School Diploma | 11 (100.0%) | 0 (0.0%) |
| College / Associate Degree | 19 (100.0%) | 0 (0.0%) |
| Bachelor's Degree or higher | 15 (100.0%) | 0 (0.0%) |
| Total | 46 (100.0%) | 0 (0.0%) |
Employment Occupations by Sex in Norcross
Management, Business, Science and Arts Occupations
The most common Management, Business, Science and Arts occupations in Norcross are Management (16 | 32.0%), Community & Social Service (1 | 2.0%), and Education Instruction & Library (1 | 2.0%).
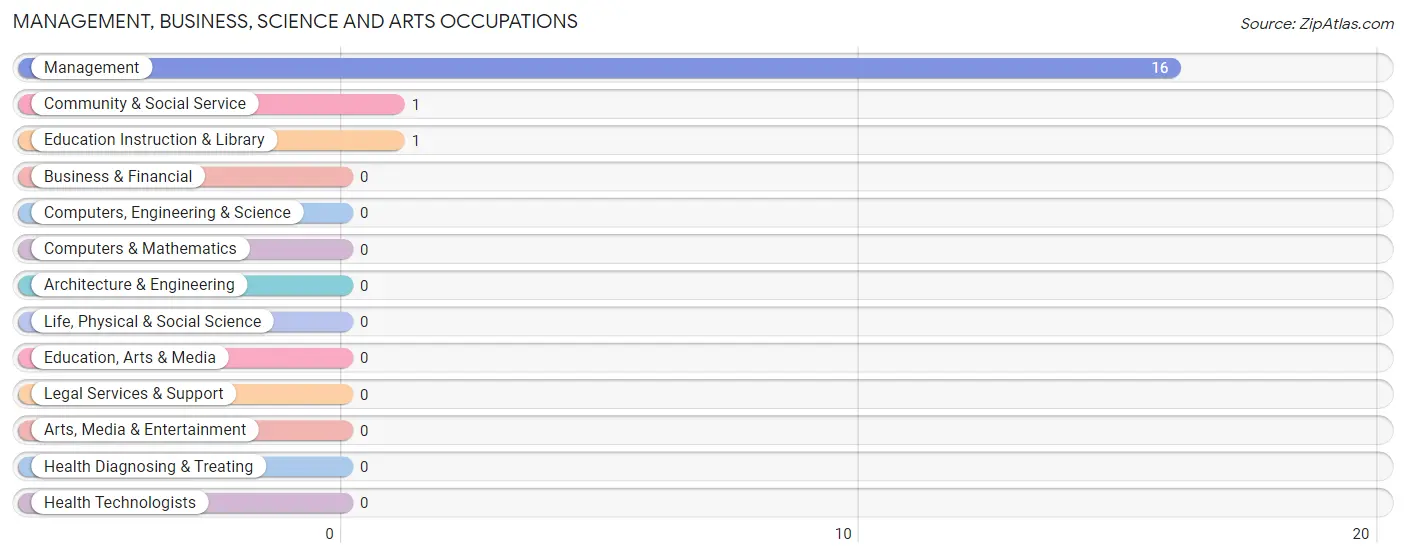
Management, Business, Science and Arts Occupations by Sex
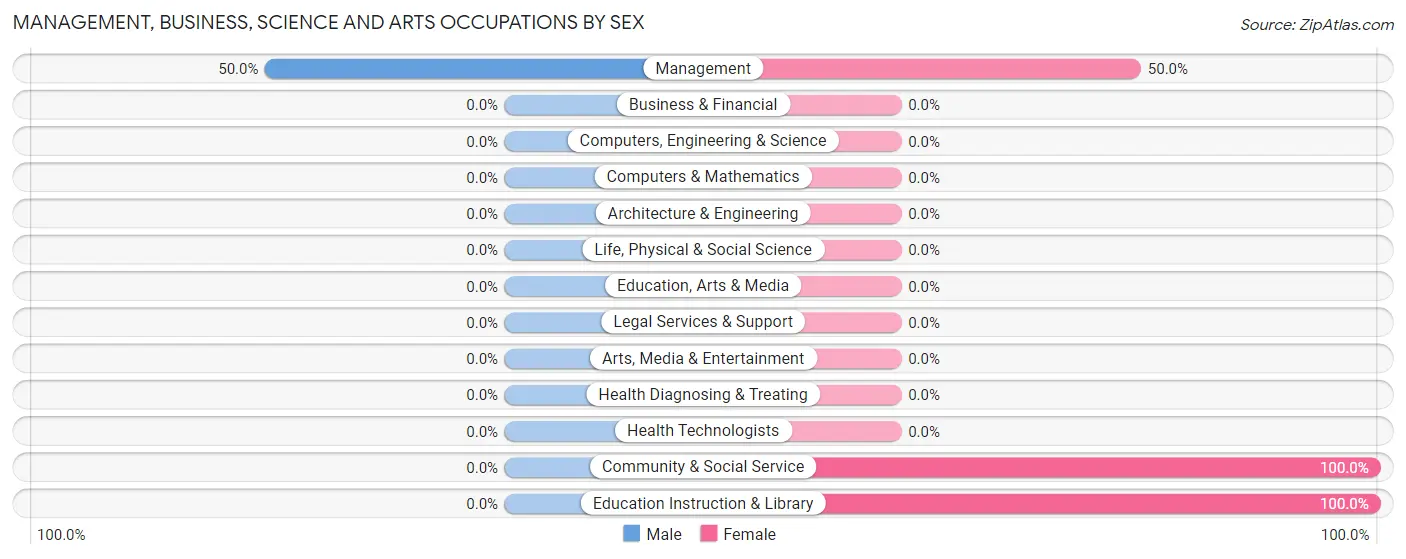
| Occupation | Male | Female |
| Management | 8 (50.0%) | 8 (50.0%) |
| Business & Financial | 0 (0.0%) | 0 (0.0%) |
| Computers, Engineering & Science | 0 (0.0%) | 0 (0.0%) |
| Computers & Mathematics | 0 (0.0%) | 0 (0.0%) |
| Architecture & Engineering | 0 (0.0%) | 0 (0.0%) |
| Life, Physical & Social Science | 0 (0.0%) | 0 (0.0%) |
| Community & Social Service | 0 (0.0%) | 1 (100.0%) |
| Education, Arts & Media | 0 (0.0%) | 0 (0.0%) |
| Legal Services & Support | 0 (0.0%) | 0 (0.0%) |
| Education Instruction & Library | 0 (0.0%) | 1 (100.0%) |
| Arts, Media & Entertainment | 0 (0.0%) | 0 (0.0%) |
| Health Diagnosing & Treating | 0 (0.0%) | 0 (0.0%) |
| Health Technologists | 0 (0.0%) | 0 (0.0%) |
| Total (Category) | 8 (47.1%) | 9 (52.9%) |
| Total (Overall) | 37 (74.0%) | 13 (26.0%) |
Services Occupations
The most common Services occupations in Norcross are Personal Care & Service (8 | 16.0%), Healthcare Support (1 | 2.0%), and Food Preparation & Serving (1 | 2.0%).
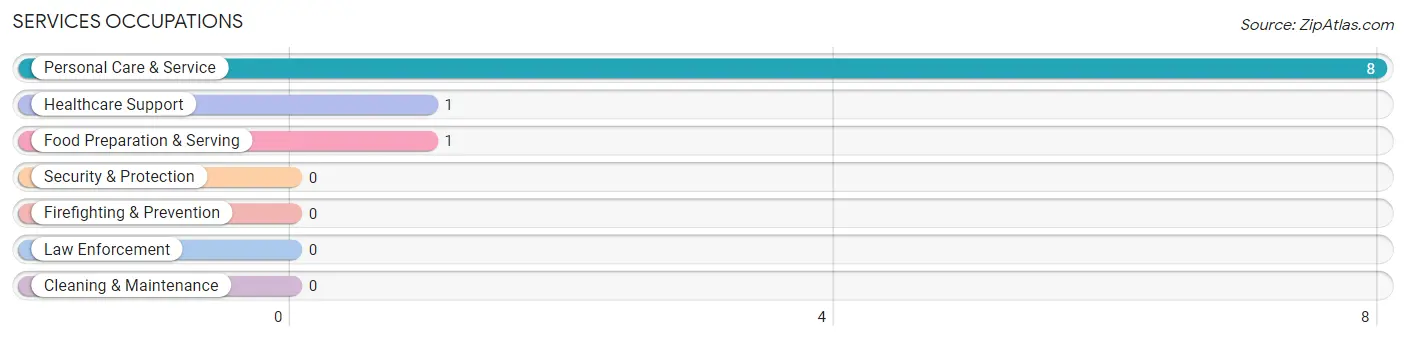
Services Occupations by Sex
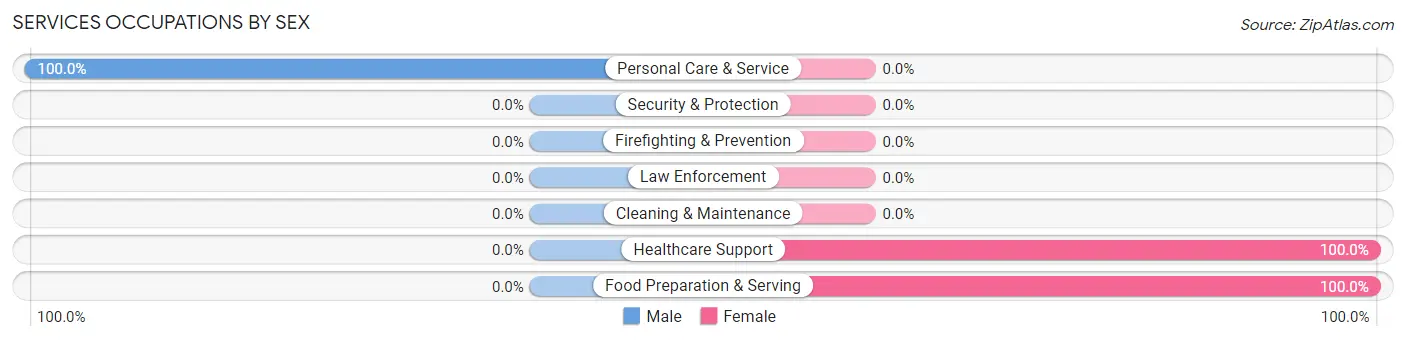
| Occupation | Male | Female |
| Healthcare Support | 0 (0.0%) | 1 (100.0%) |
| Security & Protection | 0 (0.0%) | 0 (0.0%) |
| Firefighting & Prevention | 0 (0.0%) | 0 (0.0%) |
| Law Enforcement | 0 (0.0%) | 0 (0.0%) |
| Food Preparation & Serving | 0 (0.0%) | 1 (100.0%) |
| Cleaning & Maintenance | 0 (0.0%) | 0 (0.0%) |
| Personal Care & Service | 8 (100.0%) | 0 (0.0%) |
| Total (Category) | 8 (80.0%) | 2 (20.0%) |
| Total (Overall) | 37 (74.0%) | 13 (26.0%) |
Sales and Office Occupations
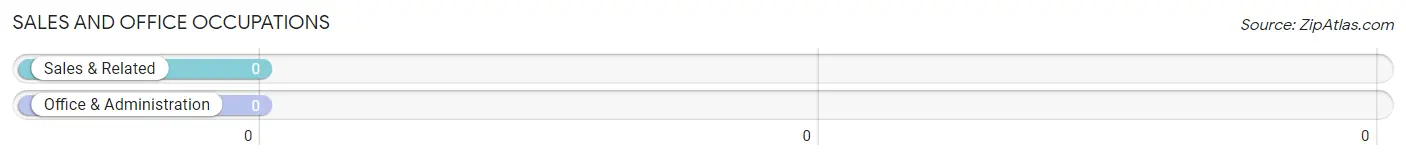
Sales and Office Occupations by Sex
| Occupation | Male | Female |
| Sales & Related | 0 (0.0%) | 0 (0.0%) |
| Office & Administration | 0 (0.0%) | 0 (0.0%) |
| Total (Category) | 0 (0.0%) | 0 (0.0%) |
| Total (Overall) | 37 (74.0%) | 13 (26.0%) |
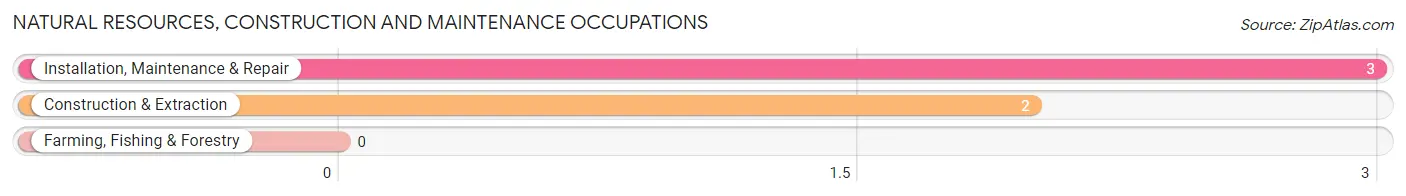
Natural Resources, Construction and Maintenance Occupations
The most common Natural Resources, Construction and Maintenance occupations in Norcross are Installation, Maintenance & Repair (3 | 6.0%), and Construction & Extraction (2 | 4.0%).
Natural Resources, Construction and Maintenance Occupations by Sex
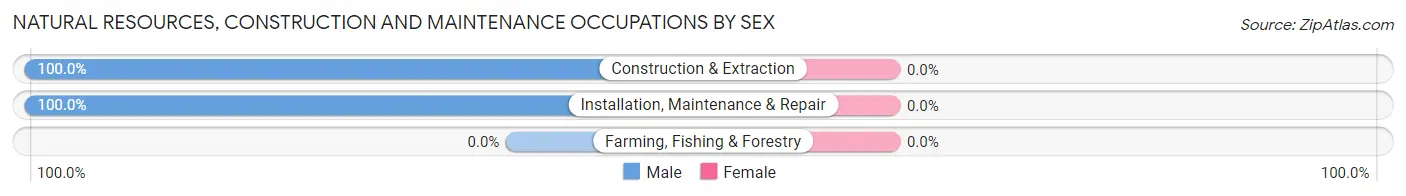
| Occupation | Male | Female |
| Farming, Fishing & Forestry | 0 (0.0%) | 0 (0.0%) |
| Construction & Extraction | 2 (100.0%) | 0 (0.0%) |
| Installation, Maintenance & Repair | 3 (100.0%) | 0 (0.0%) |
| Total (Category) | 5 (100.0%) | 0 (0.0%) |
| Total (Overall) | 37 (74.0%) | 13 (26.0%) |
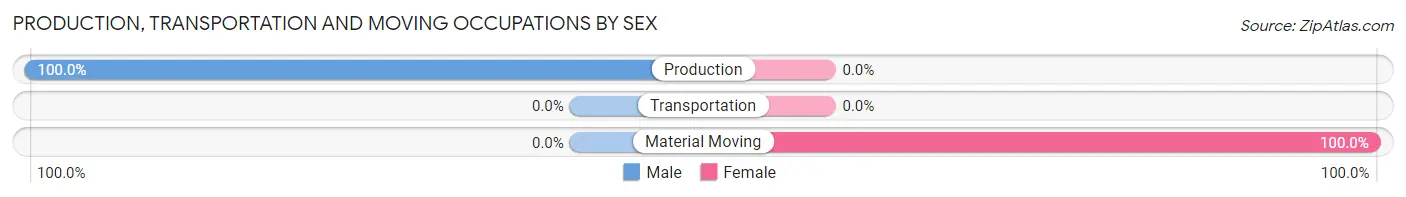
Production, Transportation and Moving Occupations
The most common Production, Transportation and Moving occupations in Norcross are Production (16 | 32.0%), and Material Moving (2 | 4.0%).
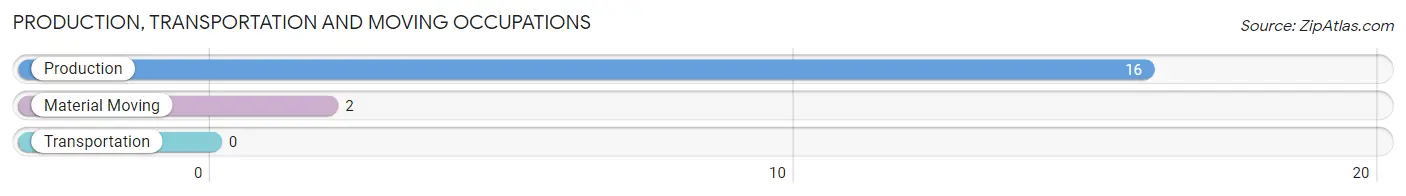
Production, Transportation and Moving Occupations by Sex
| Occupation | Male | Female |
| Production | 16 (100.0%) | 0 (0.0%) |
| Transportation | 0 (0.0%) | 0 (0.0%) |
| Material Moving | 0 (0.0%) | 2 (100.0%) |
| Total (Category) | 16 (88.9%) | 2 (11.1%) |
| Total (Overall) | 37 (74.0%) | 13 (26.0%) |
Employment Industries by Sex in Norcross
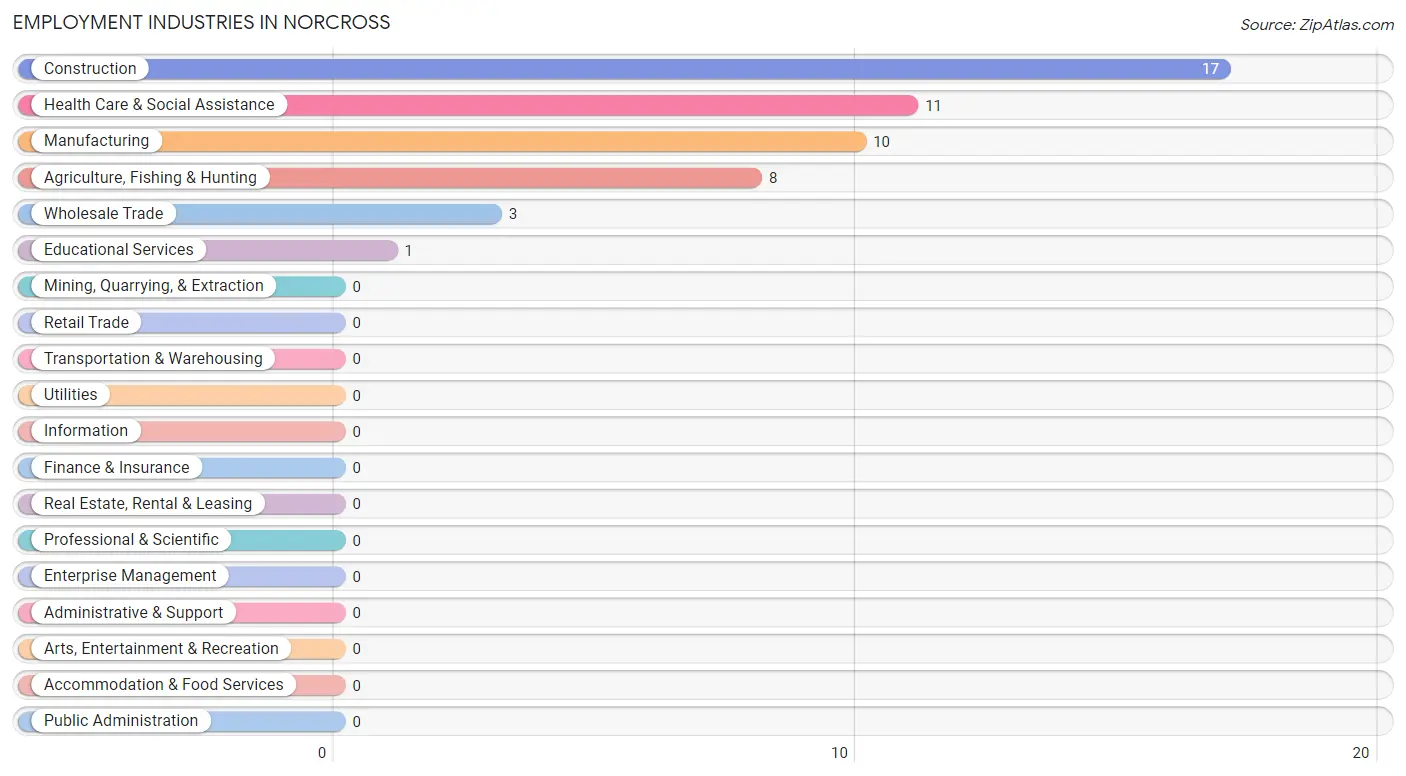
Employment Industries in Norcross
The major employment industries in Norcross include Construction (17 | 34.0%), Health Care & Social Assistance (11 | 22.0%), Manufacturing (10 | 20.0%), Agriculture, Fishing & Hunting (8 | 16.0%), and Wholesale Trade (3 | 6.0%).
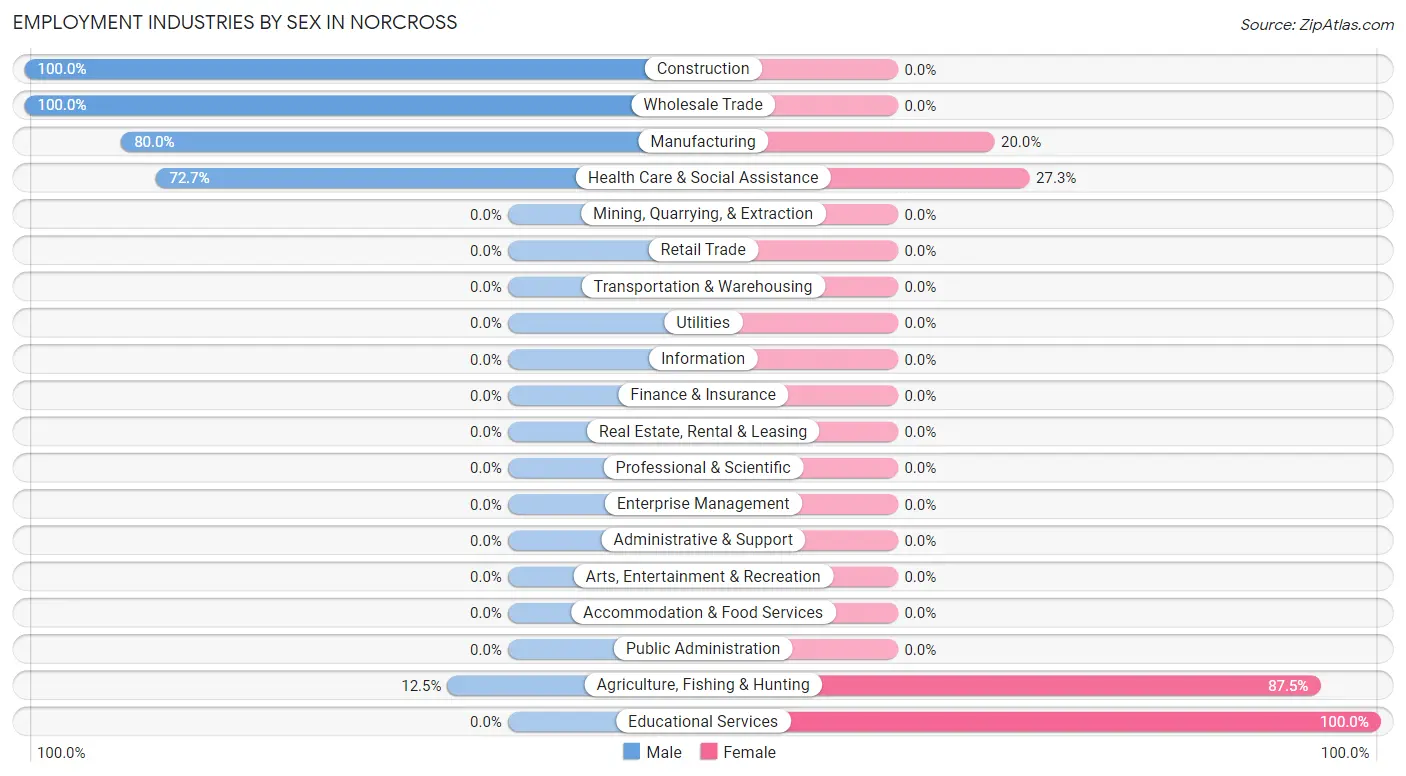
Employment Industries by Sex in Norcross
The Norcross industries that see more men than women are Construction (100.0%), Wholesale Trade (100.0%), and Manufacturing (80.0%), whereas the industries that tend to have a higher number of women are Educational Services (100.0%), Agriculture, Fishing & Hunting (87.5%), and Health Care & Social Assistance (27.3%).
| Industry | Male | Female |
| Agriculture, Fishing & Hunting | 1 (12.5%) | 7 (87.5%) |
| Mining, Quarrying, & Extraction | 0 (0.0%) | 0 (0.0%) |
| Construction | 17 (100.0%) | 0 (0.0%) |
| Manufacturing | 8 (80.0%) | 2 (20.0%) |
| Wholesale Trade | 3 (100.0%) | 0 (0.0%) |
| Retail Trade | 0 (0.0%) | 0 (0.0%) |
| Transportation & Warehousing | 0 (0.0%) | 0 (0.0%) |
| Utilities | 0 (0.0%) | 0 (0.0%) |
| Information | 0 (0.0%) | 0 (0.0%) |
| Finance & Insurance | 0 (0.0%) | 0 (0.0%) |
| Real Estate, Rental & Leasing | 0 (0.0%) | 0 (0.0%) |
| Professional & Scientific | 0 (0.0%) | 0 (0.0%) |
| Enterprise Management | 0 (0.0%) | 0 (0.0%) |
| Administrative & Support | 0 (0.0%) | 0 (0.0%) |
| Educational Services | 0 (0.0%) | 1 (100.0%) |
| Health Care & Social Assistance | 8 (72.7%) | 3 (27.3%) |
| Arts, Entertainment & Recreation | 0 (0.0%) | 0 (0.0%) |
| Accommodation & Food Services | 0 (0.0%) | 0 (0.0%) |
| Public Administration | 0 (0.0%) | 0 (0.0%) |
| Total | 37 (74.0%) | 13 (26.0%) |
Education in Norcross
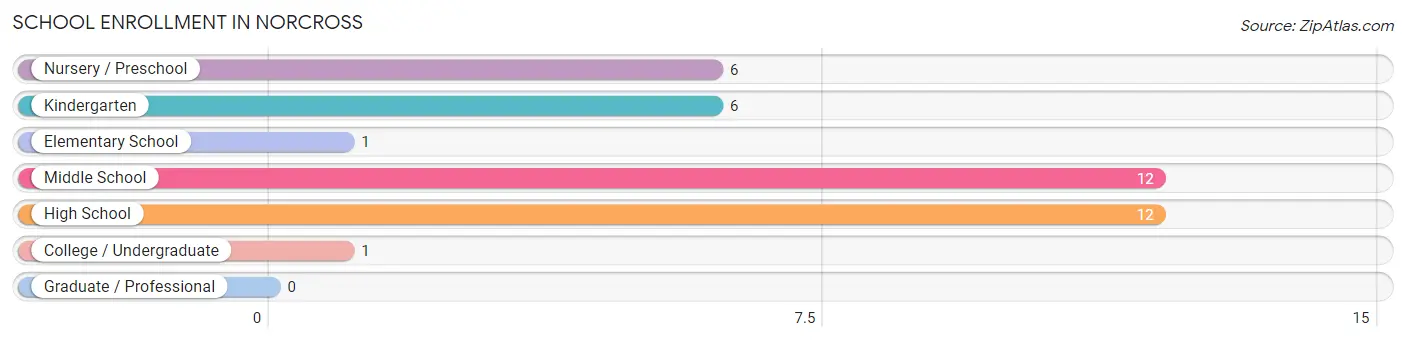
School Enrollment in Norcross
The most common levels of schooling among the 38 students in Norcross are middle school (12 | 31.6%), high school (12 | 31.6%), and nursery / preschool (6 | 15.8%).
| School Level | # Students | % Students |
| Nursery / Preschool | 6 | 15.8% |
| Kindergarten | 6 | 15.8% |
| Elementary School | 1 | 2.6% |
| Middle School | 12 | 31.6% |
| High School | 12 | 31.6% |
| College / Undergraduate | 1 | 2.6% |
| Graduate / Professional | 0 | 0.0% |
| Total | 38 | 100.0% |
School Enrollment by Age by Funding Source in Norcross
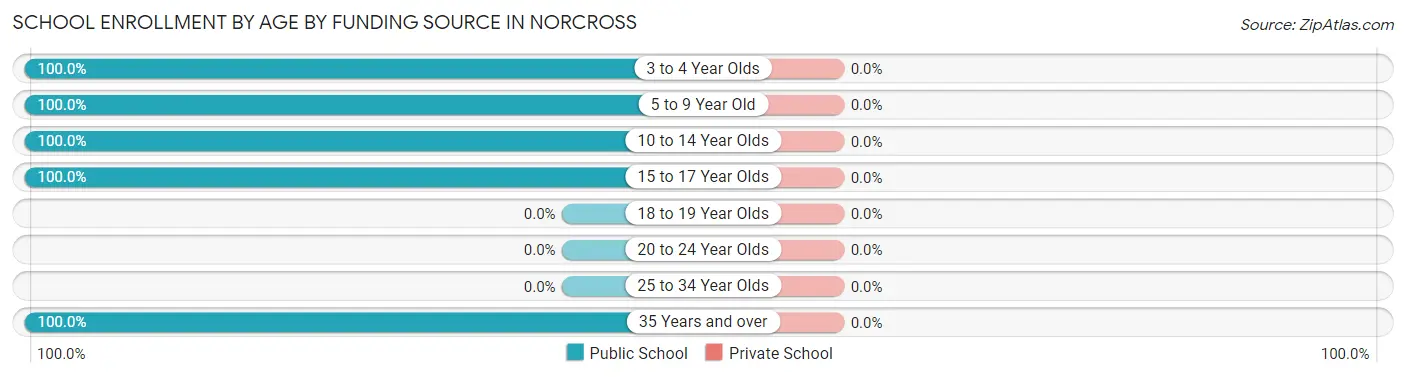
| Age Bracket | Public School | Private School |
| 3 to 4 Year Olds | 6 (100.0%) | 0 (0.0%) |
| 5 to 9 Year Old | 6 (100.0%) | 0 (0.0%) |
| 10 to 14 Year Olds | 13 (100.0%) | 0 (0.0%) |
| 15 to 17 Year Olds | 12 (100.0%) | 0 (0.0%) |
| 18 to 19 Year Olds | 0 (0.0%) | 0 (0.0%) |
| 20 to 24 Year Olds | 0 (0.0%) | 0 (0.0%) |
| 25 to 34 Year Olds | 0 (0.0%) | 0 (0.0%) |
| 35 Years and over | 1 (100.0%) | 0 (0.0%) |
| Total | 38 (100.0%) | 0 (0.0%) |
Educational Attainment by Field of Study in Norcross
Bio, nature & agricultural (7 | 46.7%), business (7 | 46.7%), and education (1 | 6.7%) are the most common fields of study among 15 individuals in Norcross who have obtained a bachelor's degree or higher.
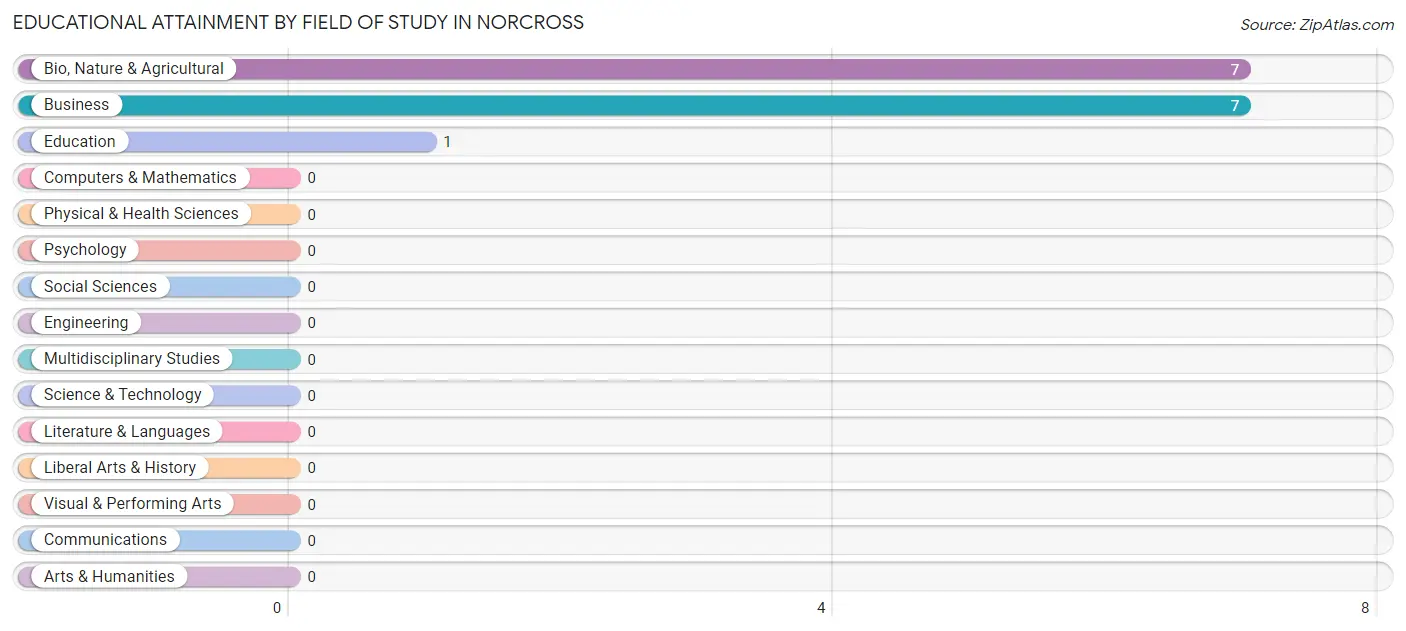
| Field of Study | # Graduates | % Graduates |
| Computers & Mathematics | 0 | 0.0% |
| Bio, Nature & Agricultural | 7 | 46.7% |
| Physical & Health Sciences | 0 | 0.0% |
| Psychology | 0 | 0.0% |
| Social Sciences | 0 | 0.0% |
| Engineering | 0 | 0.0% |
| Multidisciplinary Studies | 0 | 0.0% |
| Science & Technology | 0 | 0.0% |
| Business | 7 | 46.7% |
| Education | 1 | 6.7% |
| Literature & Languages | 0 | 0.0% |
| Liberal Arts & History | 0 | 0.0% |
| Visual & Performing Arts | 0 | 0.0% |
| Communications | 0 | 0.0% |
| Arts & Humanities | 0 | 0.0% |
| Total | 15 | 100.0% |
Transportation & Commute in Norcross
Vehicle Availability by Sex in Norcross
The most prevalent vehicle ownership categories in Norcross are males with 3 vehicles (26, accounting for 70.3%) and females with 3 vehicles (9, making up 200.0%).
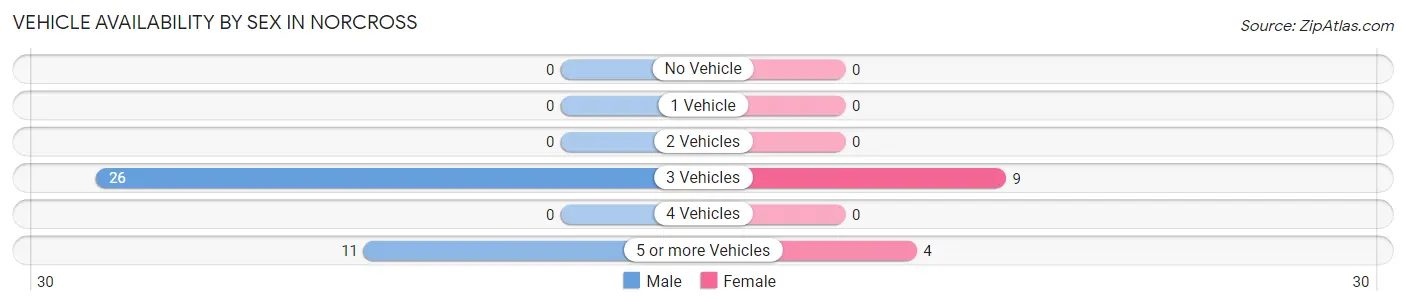
| Vehicles Available | Male | Female |
| No Vehicle | 0 (0.0%) | 0 (0.0%) |
| 1 Vehicle | 0 (0.0%) | 0 (0.0%) |
| 2 Vehicles | 0 (0.0%) | 0 (0.0%) |
| 3 Vehicles | 26 (70.3%) | 9 (69.2%) |
| 4 Vehicles | 0 (0.0%) | 0 (0.0%) |
| 5 or more Vehicles | 11 (29.7%) | 4 (30.8%) |
| Total | 37 (100.0%) | 13 (100.0%) |
Commute Time in Norcross
The most frequently occuring commute durations in Norcross are less than 5 minutes (8 commuters, 40.0%), 30 to 34 minutes (7 commuters, 35.0%), and 60 to 89 minutes (3 commuters, 15.0%).
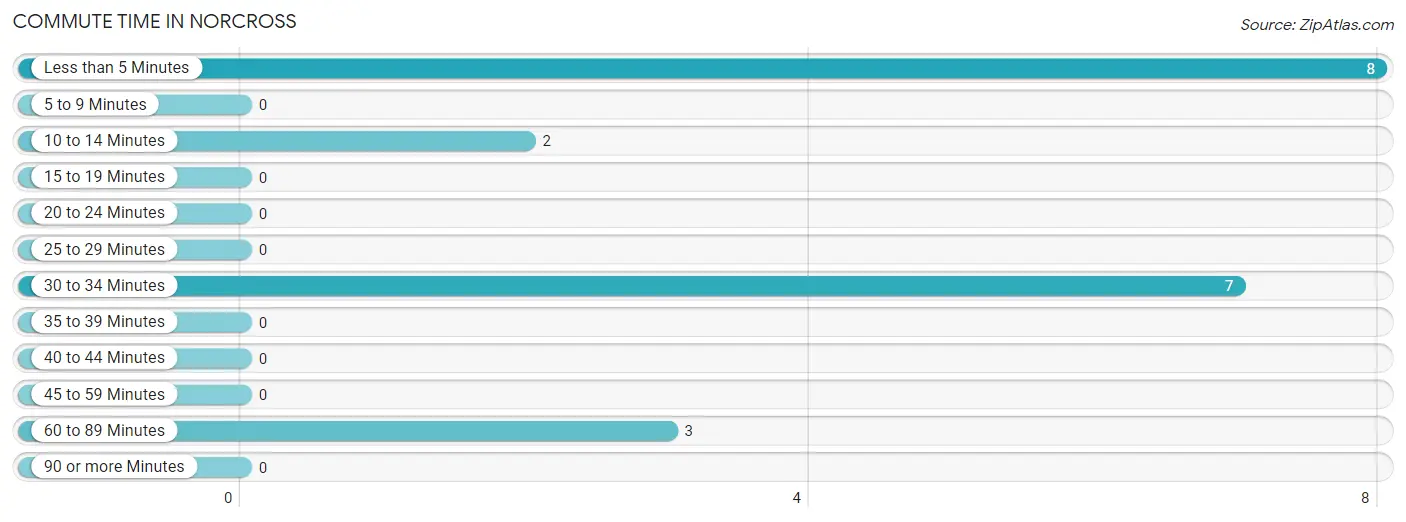
| Commute Time | # Commuters | % Commuters |
| Less than 5 Minutes | 8 | 40.0% |
| 5 to 9 Minutes | 0 | 0.0% |
| 10 to 14 Minutes | 2 | 10.0% |
| 15 to 19 Minutes | 0 | 0.0% |
| 20 to 24 Minutes | 0 | 0.0% |
| 25 to 29 Minutes | 0 | 0.0% |
| 30 to 34 Minutes | 7 | 35.0% |
| 35 to 39 Minutes | 0 | 0.0% |
| 40 to 44 Minutes | 0 | 0.0% |
| 45 to 59 Minutes | 0 | 0.0% |
| 60 to 89 Minutes | 3 | 15.0% |
| 90 or more Minutes | 0 | 0.0% |
Commute Time by Sex in Norcross
The most common commute times in Norcross are less than 5 minutes (8 commuters, 57.1%) for males and 30 to 34 minutes (3 commuters, 50.0%) for females.
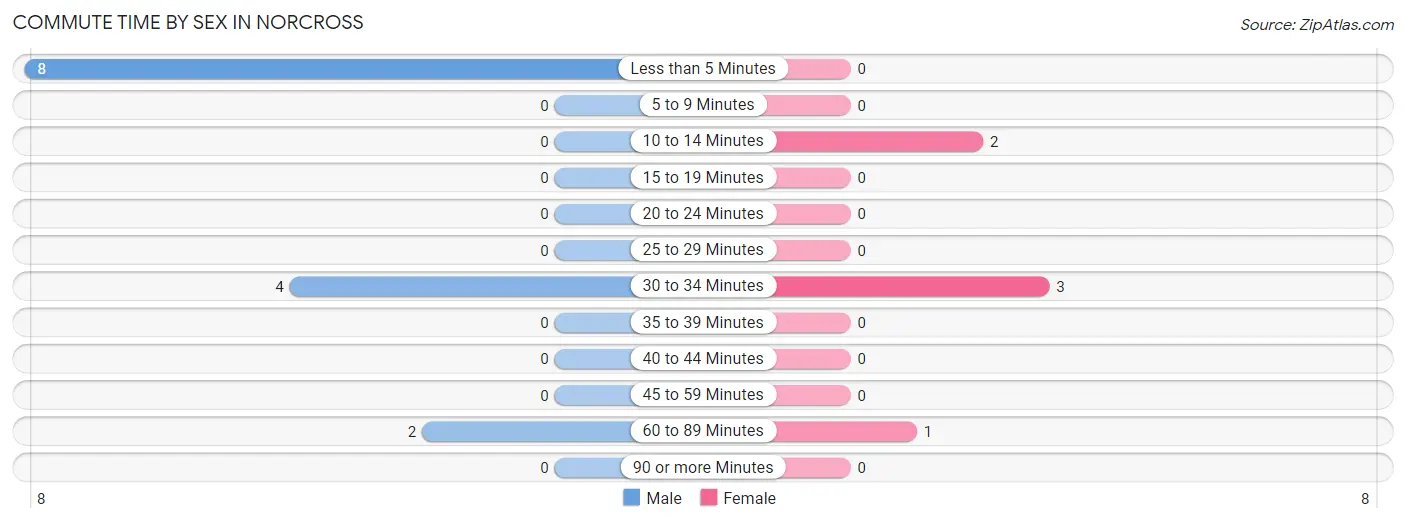
| Commute Time | Male | Female |
| Less than 5 Minutes | 8 (57.1%) | 0 (0.0%) |
| 5 to 9 Minutes | 0 (0.0%) | 0 (0.0%) |
| 10 to 14 Minutes | 0 (0.0%) | 2 (33.3%) |
| 15 to 19 Minutes | 0 (0.0%) | 0 (0.0%) |
| 20 to 24 Minutes | 0 (0.0%) | 0 (0.0%) |
| 25 to 29 Minutes | 0 (0.0%) | 0 (0.0%) |
| 30 to 34 Minutes | 4 (28.6%) | 3 (50.0%) |
| 35 to 39 Minutes | 0 (0.0%) | 0 (0.0%) |
| 40 to 44 Minutes | 0 (0.0%) | 0 (0.0%) |
| 45 to 59 Minutes | 0 (0.0%) | 0 (0.0%) |
| 60 to 89 Minutes | 2 (14.3%) | 1 (16.7%) |
| 90 or more Minutes | 0 (0.0%) | 0 (0.0%) |
Time of Departure to Work by Sex in Norcross
The most frequent times of departure to work in Norcross are 7:00 AM to 7:29 AM (8, 57.1%) for males and 7:30 AM to 7:59 AM (2, 33.3%) for females.
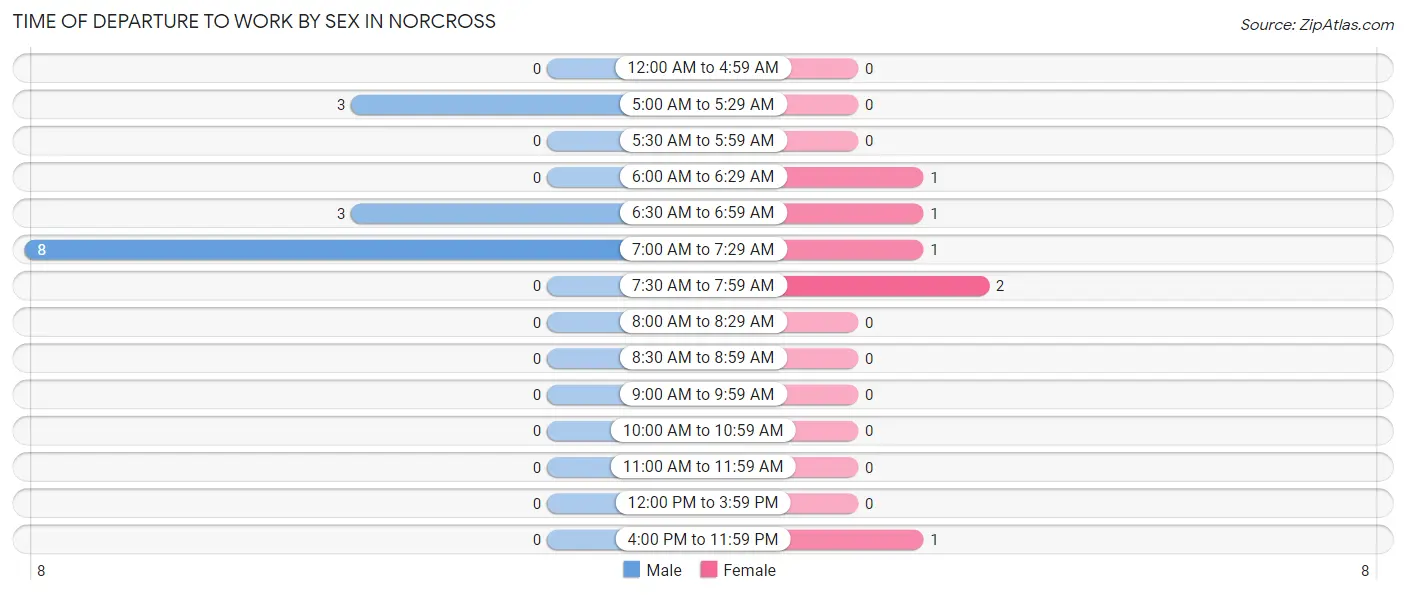
| Time of Departure | Male | Female |
| 12:00 AM to 4:59 AM | 0 (0.0%) | 0 (0.0%) |
| 5:00 AM to 5:29 AM | 3 (21.4%) | 0 (0.0%) |
| 5:30 AM to 5:59 AM | 0 (0.0%) | 0 (0.0%) |
| 6:00 AM to 6:29 AM | 0 (0.0%) | 1 (16.7%) |
| 6:30 AM to 6:59 AM | 3 (21.4%) | 1 (16.7%) |
| 7:00 AM to 7:29 AM | 8 (57.1%) | 1 (16.7%) |
| 7:30 AM to 7:59 AM | 0 (0.0%) | 2 (33.3%) |
| 8:00 AM to 8:29 AM | 0 (0.0%) | 0 (0.0%) |
| 8:30 AM to 8:59 AM | 0 (0.0%) | 0 (0.0%) |
| 9:00 AM to 9:59 AM | 0 (0.0%) | 0 (0.0%) |
| 10:00 AM to 10:59 AM | 0 (0.0%) | 0 (0.0%) |
| 11:00 AM to 11:59 AM | 0 (0.0%) | 0 (0.0%) |
| 12:00 PM to 3:59 PM | 0 (0.0%) | 0 (0.0%) |
| 4:00 PM to 11:59 PM | 0 (0.0%) | 1 (16.7%) |
| Total | 14 (100.0%) | 6 (100.0%) |
Housing Occupancy in Norcross
Occupancy by Ownership in Norcross
Of the total 43 dwellings in Norcross, owner-occupied units account for 43 (100.0%), while renter-occupied units make up 0 (0.0%).
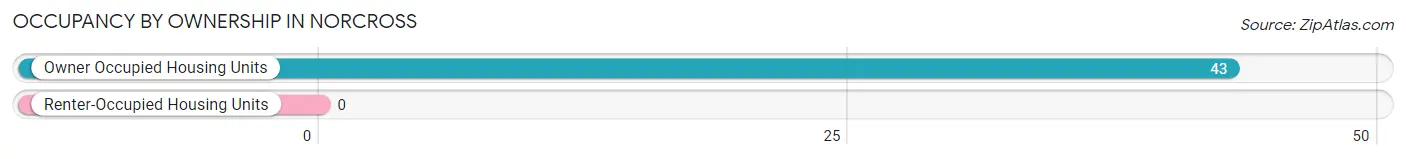
| Occupancy | # Housing Units | % Housing Units |
| Owner Occupied Housing Units | 43 | 100.0% |
| Renter-Occupied Housing Units | 0 | 0.0% |
| Total Occupied Housing Units | 43 | 100.0% |
Occupancy by Household Size in Norcross
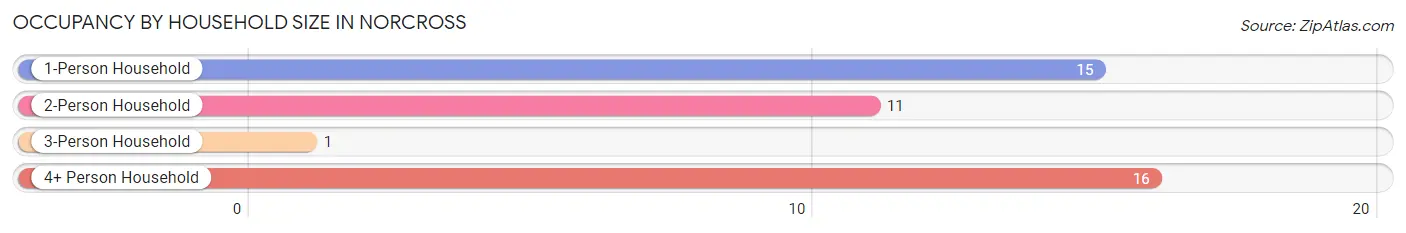
| Household Size | # Housing Units | % Housing Units |
| 1-Person Household | 15 | 34.9% |
| 2-Person Household | 11 | 25.6% |
| 3-Person Household | 1 | 2.3% |
| 4+ Person Household | 16 | 37.2% |
| Total Housing Units | 43 | 100.0% |
Occupancy by Ownership by Household Size in Norcross
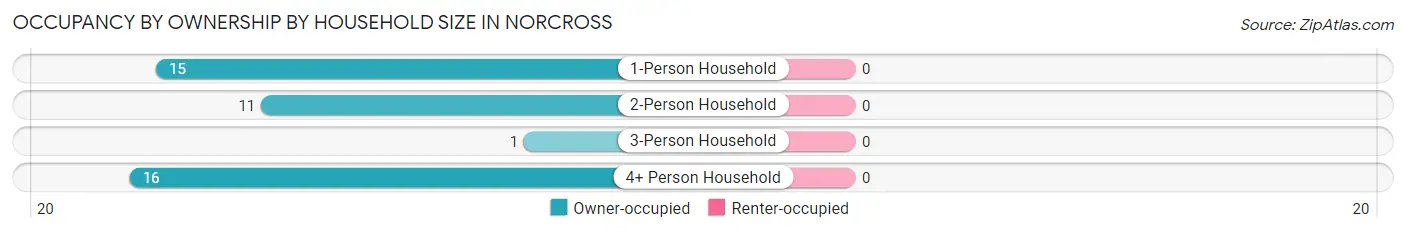
| Household Size | Owner-occupied | Renter-occupied |
| 1-Person Household | 15 (100.0%) | 0 (0.0%) |
| 2-Person Household | 11 (100.0%) | 0 (0.0%) |
| 3-Person Household | 1 (100.0%) | 0 (0.0%) |
| 4+ Person Household | 16 (100.0%) | 0 (0.0%) |
| Total Housing Units | 43 (100.0%) | 0 (0.0%) |
Occupancy by Educational Attainment in Norcross
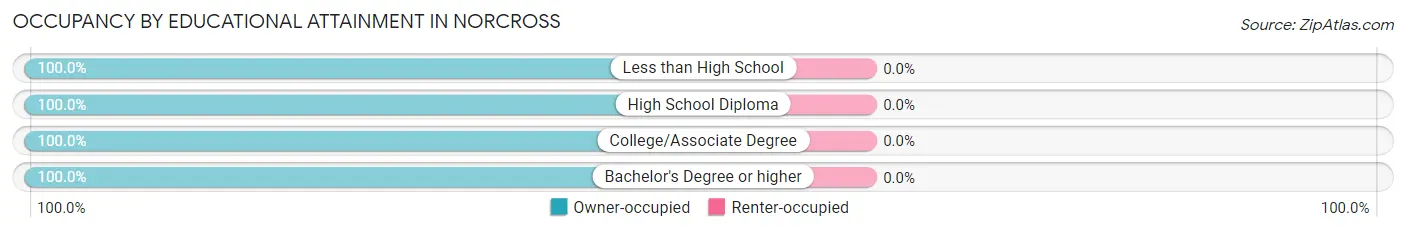
| Household Size | Owner-occupied | Renter-occupied |
| Less than High School | 5 (100.0%) | 0 (0.0%) |
| High School Diploma | 13 (100.0%) | 0 (0.0%) |
| College/Associate Degree | 17 (100.0%) | 0 (0.0%) |
| Bachelor's Degree or higher | 8 (100.0%) | 0 (0.0%) |
Occupancy by Age of Householder in Norcross
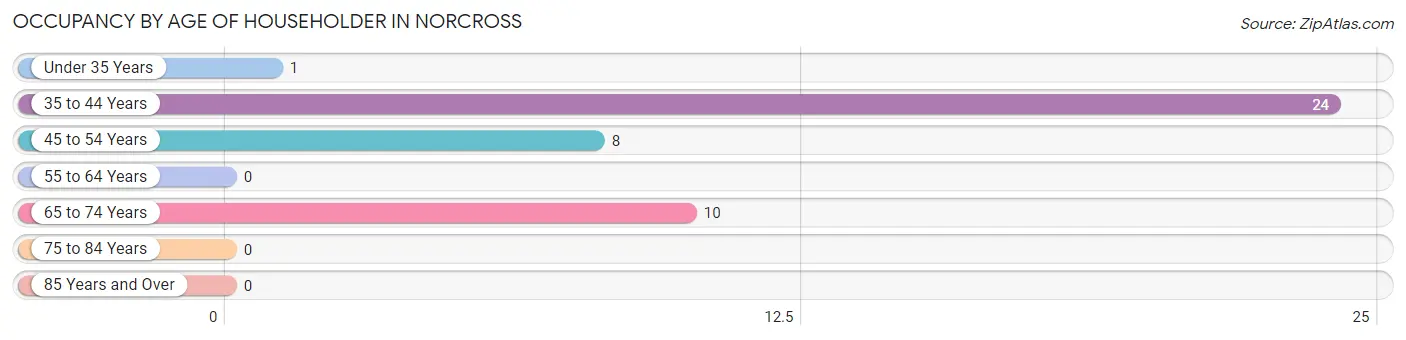
| Age Bracket | # Households | % Households |
| Under 35 Years | 1 | 2.3% |
| 35 to 44 Years | 24 | 55.8% |
| 45 to 54 Years | 8 | 18.6% |
| 55 to 64 Years | 0 | 0.0% |
| 65 to 74 Years | 10 | 23.3% |
| 75 to 84 Years | 0 | 0.0% |
| 85 Years and Over | 0 | 0.0% |
| Total | 43 | 100.0% |
Housing Finances in Norcross
Median Income by Occupancy in Norcross
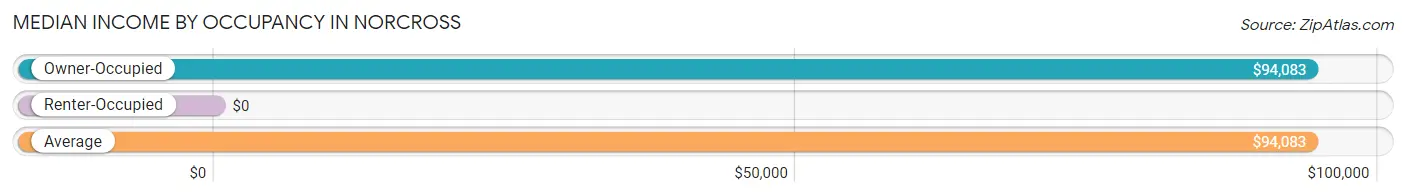
| Occupancy Type | # Households | Median Income |
| Owner-Occupied | 43 (100.0%) | $94,083 |
| Renter-Occupied | 0 (0.0%) | $0 |
| Average | 43 (100.0%) | $94,083 |
Occupancy by Householder Income Bracket in Norcross
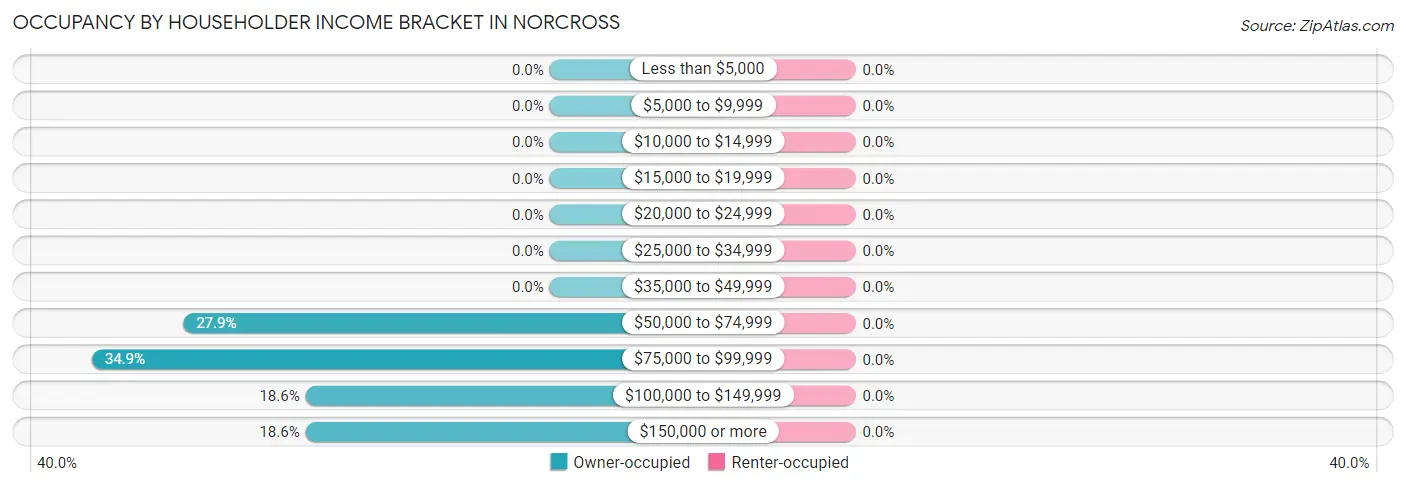
| Income Bracket | Owner-occupied | Renter-occupied |
| Less than $5,000 | 0 (0.0%) | 0 (0.0%) |
| $5,000 to $9,999 | 0 (0.0%) | 0 (0.0%) |
| $10,000 to $14,999 | 0 (0.0%) | 0 (0.0%) |
| $15,000 to $19,999 | 0 (0.0%) | 0 (0.0%) |
| $20,000 to $24,999 | 0 (0.0%) | 0 (0.0%) |
| $25,000 to $34,999 | 0 (0.0%) | 0 (0.0%) |
| $35,000 to $49,999 | 0 (0.0%) | 0 (0.0%) |
| $50,000 to $74,999 | 12 (27.9%) | 0 (0.0%) |
| $75,000 to $99,999 | 15 (34.9%) | 0 (0.0%) |
| $100,000 to $149,999 | 8 (18.6%) | 0 (0.0%) |
| $150,000 or more | 8 (18.6%) | 0 (0.0%) |
| Total | 43 (100.0%) | 0 (0.0%) |
Monthly Housing Cost Tiers in Norcross
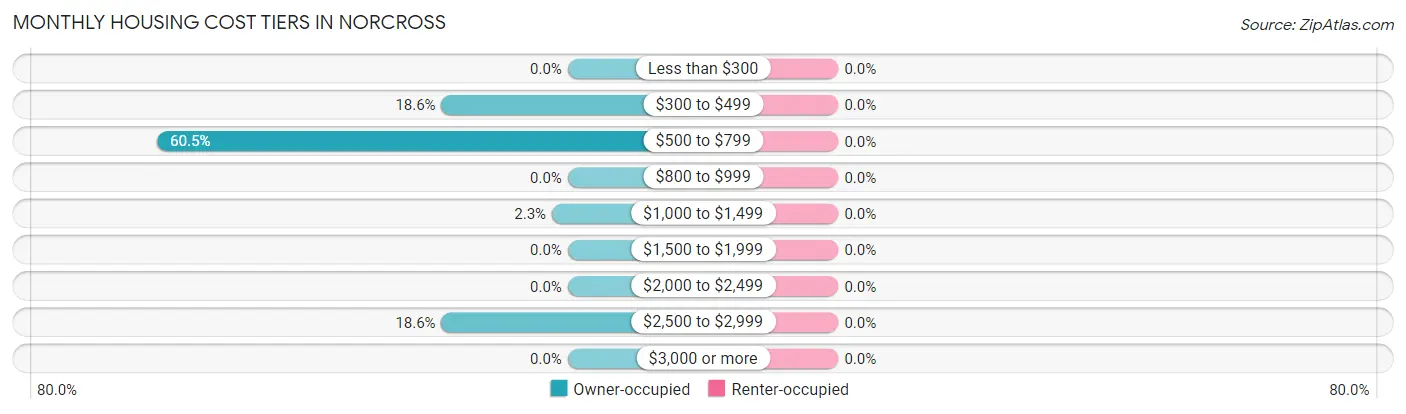
| Monthly Cost | Owner-occupied | Renter-occupied |
| Less than $300 | 0 (0.0%) | 0 (0.0%) |
| $300 to $499 | 8 (18.6%) | 0 (0.0%) |
| $500 to $799 | 26 (60.5%) | 0 (0.0%) |
| $800 to $999 | 0 (0.0%) | 0 (0.0%) |
| $1,000 to $1,499 | 1 (2.3%) | 0 (0.0%) |
| $1,500 to $1,999 | 0 (0.0%) | 0 (0.0%) |
| $2,000 to $2,499 | 0 (0.0%) | 0 (0.0%) |
| $2,500 to $2,999 | 8 (18.6%) | 0 (0.0%) |
| $3,000 or more | 0 (0.0%) | 0 (0.0%) |
| Total | 43 (100.0%) | 0 (0.0%) |
Physical Housing Characteristics in Norcross
Housing Structures in Norcross
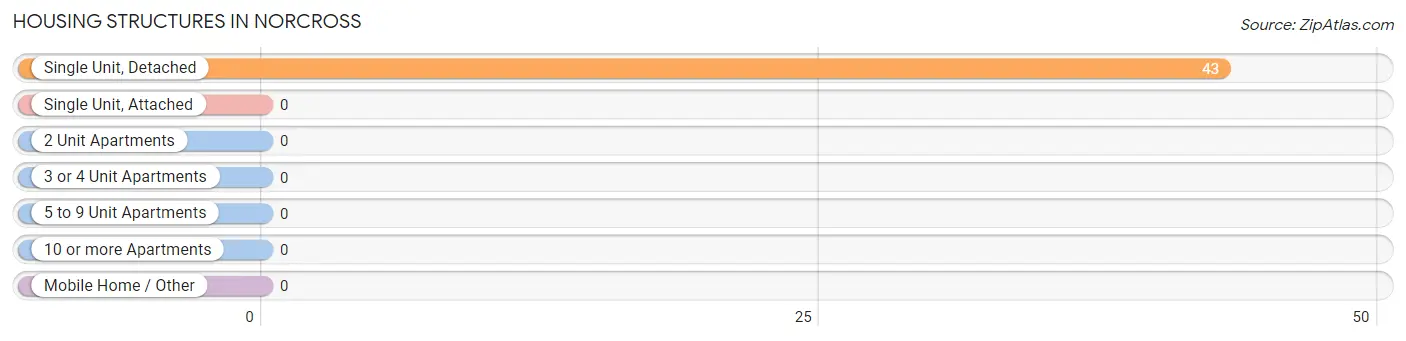
| Structure Type | # Housing Units | % Housing Units |
| Single Unit, Detached | 43 | 100.0% |
| Single Unit, Attached | 0 | 0.0% |
| 2 Unit Apartments | 0 | 0.0% |
| 3 or 4 Unit Apartments | 0 | 0.0% |
| 5 to 9 Unit Apartments | 0 | 0.0% |
| 10 or more Apartments | 0 | 0.0% |
| Mobile Home / Other | 0 | 0.0% |
| Total | 43 | 100.0% |
Housing Structures by Occupancy in Norcross
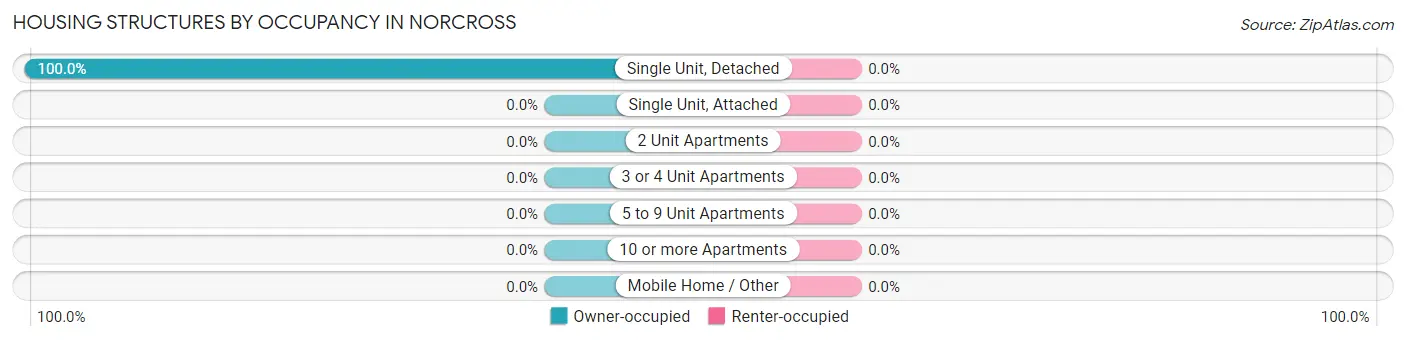
| Structure Type | Owner-occupied | Renter-occupied |
| Single Unit, Detached | 43 (100.0%) | 0 (0.0%) |
| Single Unit, Attached | 0 (0.0%) | 0 (0.0%) |
| 2 Unit Apartments | 0 (0.0%) | 0 (0.0%) |
| 3 or 4 Unit Apartments | 0 (0.0%) | 0 (0.0%) |
| 5 to 9 Unit Apartments | 0 (0.0%) | 0 (0.0%) |
| 10 or more Apartments | 0 (0.0%) | 0 (0.0%) |
| Mobile Home / Other | 0 (0.0%) | 0 (0.0%) |
| Total | 43 (100.0%) | 0 (0.0%) |
Housing Structures by Number of Rooms in Norcross
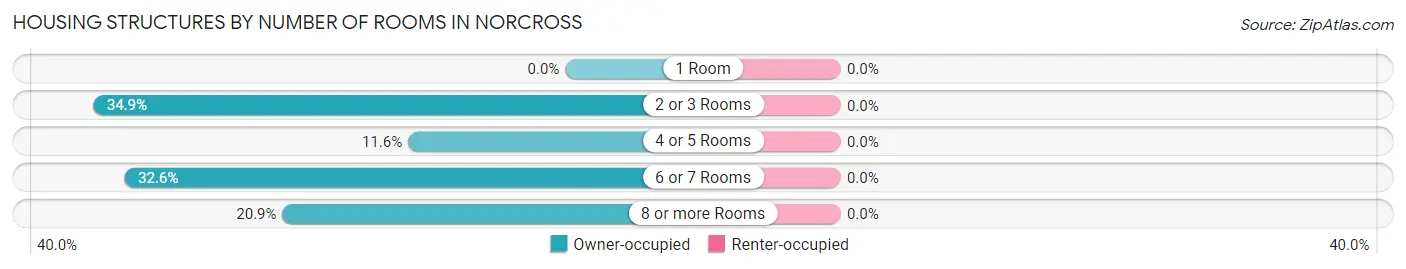
| Number of Rooms | Owner-occupied | Renter-occupied |
| 1 Room | 0 (0.0%) | 0 (0.0%) |
| 2 or 3 Rooms | 15 (34.9%) | 0 (0.0%) |
| 4 or 5 Rooms | 5 (11.6%) | 0 (0.0%) |
| 6 or 7 Rooms | 14 (32.6%) | 0 (0.0%) |
| 8 or more Rooms | 9 (20.9%) | 0 (0.0%) |
| Total | 43 (100.0%) | 0 (0.0%) |
Housing Structure by Heating Type in Norcross
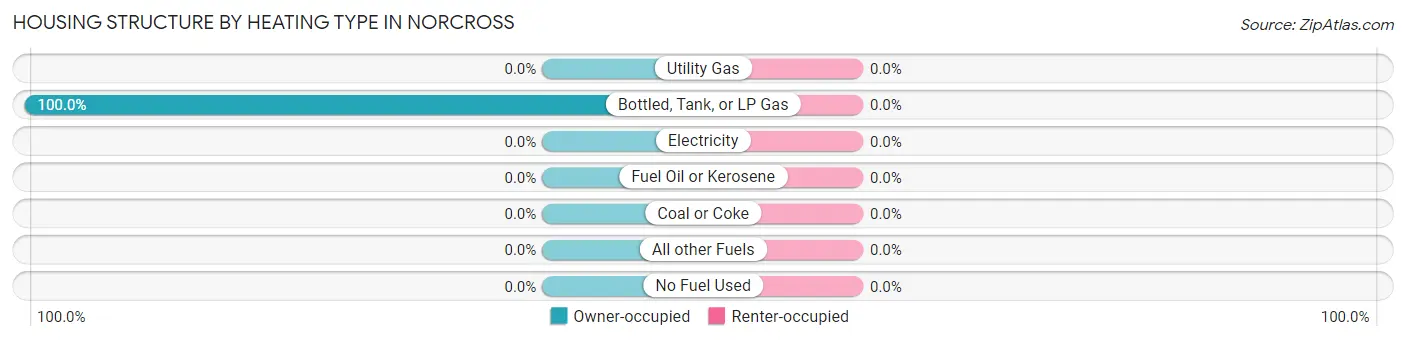
| Heating Type | Owner-occupied | Renter-occupied |
| Utility Gas | 0 (0.0%) | 0 (0.0%) |
| Bottled, Tank, or LP Gas | 43 (100.0%) | 0 (0.0%) |
| Electricity | 0 (0.0%) | 0 (0.0%) |
| Fuel Oil or Kerosene | 0 (0.0%) | 0 (0.0%) |
| Coal or Coke | 0 (0.0%) | 0 (0.0%) |
| All other Fuels | 0 (0.0%) | 0 (0.0%) |
| No Fuel Used | 0 (0.0%) | 0 (0.0%) |
| Total | 43 (100.0%) | 0 (0.0%) |
Household Vehicle Usage in Norcross
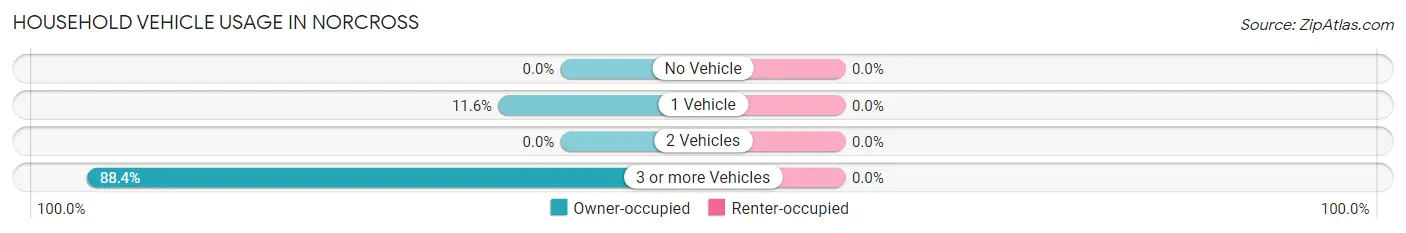
| Vehicles per Household | Owner-occupied | Renter-occupied |
| No Vehicle | 0 (0.0%) | 0 (0.0%) |
| 1 Vehicle | 5 (11.6%) | 0 (0.0%) |
| 2 Vehicles | 0 (0.0%) | 0 (0.0%) |
| 3 or more Vehicles | 38 (88.4%) | 0 (0.0%) |
| Total | 43 (100.0%) | 0 (0.0%) |
Real Estate & Mortgages in Norcross
Real Estate and Mortgage Overview in Norcross
| Characteristic | Without Mortgage | With Mortgage |
| Housing Units | 14 | 29 |
| Median Property Value | $67,100 | $0 |
| Median Household Income | - | - |
| Monthly Housing Costs | $488 | $0 |
| Real Estate Taxes | - | - |
Property Value by Mortgage Status in Norcross
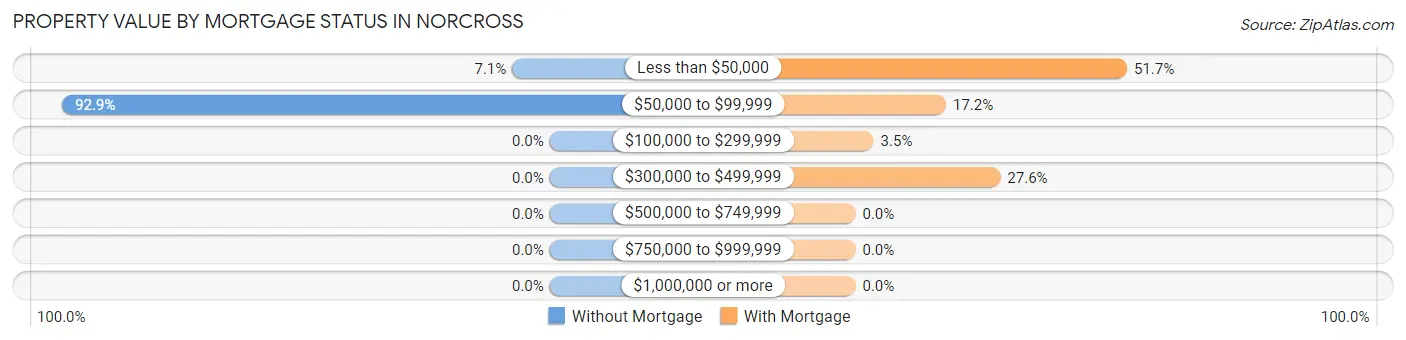
| Property Value | Without Mortgage | With Mortgage |
| Less than $50,000 | 1 (7.1%) | 15 (51.7%) |
| $50,000 to $99,999 | 13 (92.9%) | 5 (17.2%) |
| $100,000 to $299,999 | 0 (0.0%) | 1 (3.5%) |
| $300,000 to $499,999 | 0 (0.0%) | 8 (27.6%) |
| $500,000 to $749,999 | 0 (0.0%) | 0 (0.0%) |
| $750,000 to $999,999 | 0 (0.0%) | 0 (0.0%) |
| $1,000,000 or more | 0 (0.0%) | 0 (0.0%) |
| Total | 14 (100.0%) | 29 (100.0%) |
Household Income by Mortgage Status in Norcross
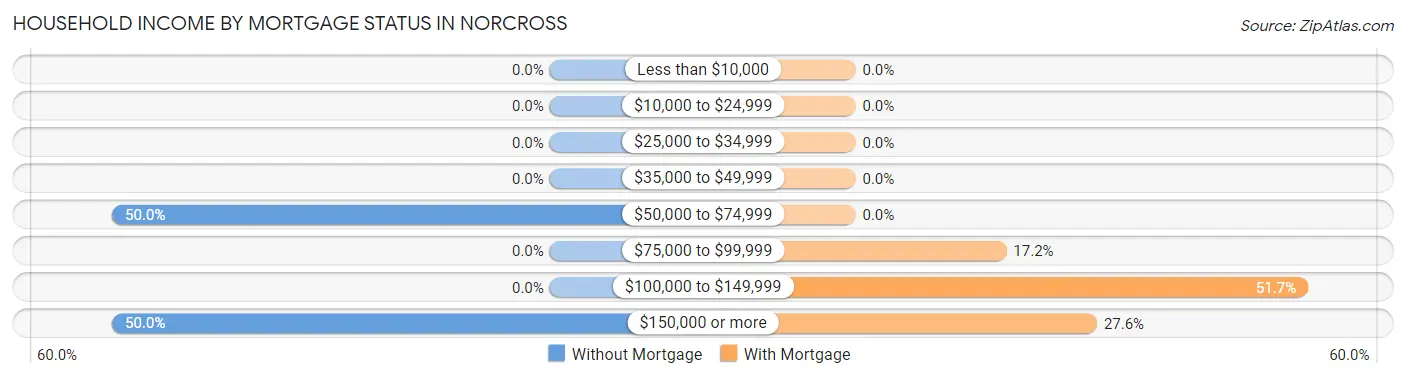
| Household Income | Without Mortgage | With Mortgage |
| Less than $10,000 | 0 (0.0%) | 0 (0.0%) |
| $10,000 to $24,999 | 0 (0.0%) | 0 (0.0%) |
| $25,000 to $34,999 | 0 (0.0%) | 0 (0.0%) |
| $35,000 to $49,999 | 0 (0.0%) | 0 (0.0%) |
| $50,000 to $74,999 | 7 (50.0%) | 0 (0.0%) |
| $75,000 to $99,999 | 0 (0.0%) | 5 (17.2%) |
| $100,000 to $149,999 | 0 (0.0%) | 15 (51.7%) |
| $150,000 or more | 7 (50.0%) | 8 (27.6%) |
| Total | 14 (100.0%) | 29 (100.0%) |
Property Value to Household Income Ratio in Norcross
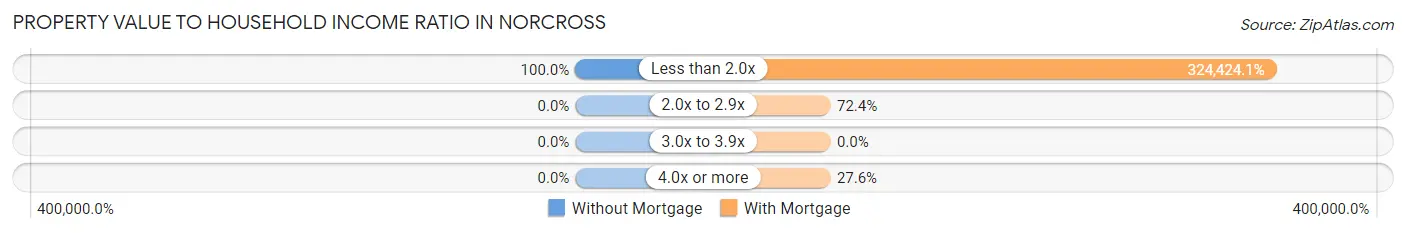
| Value-to-Income Ratio | Without Mortgage | With Mortgage |
| Less than 2.0x | 14 (100.0%) | 94,083 (324,424.1%) |
| 2.0x to 2.9x | 0 (0.0%) | 21 (72.4%) |
| 3.0x to 3.9x | 0 (0.0%) | 0 (0.0%) |
| 4.0x or more | 0 (0.0%) | 8 (27.6%) |
| Total | 14 (100.0%) | 29 (100.0%) |
Real Estate Taxes by Mortgage Status in Norcross
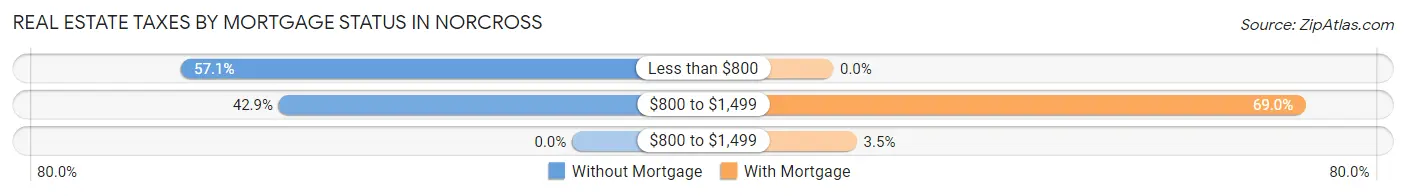
| Property Taxes | Without Mortgage | With Mortgage |
| Less than $800 | 8 (57.1%) | 0 (0.0%) |
| $800 to $1,499 | 6 (42.9%) | 20 (69.0%) |
| $800 to $1,499 | 0 (0.0%) | 1 (3.5%) |
| Total | 14 (100.0%) | 29 (100.0%) |
Health & Disability in Norcross
Health Insurance Coverage by Age in Norcross
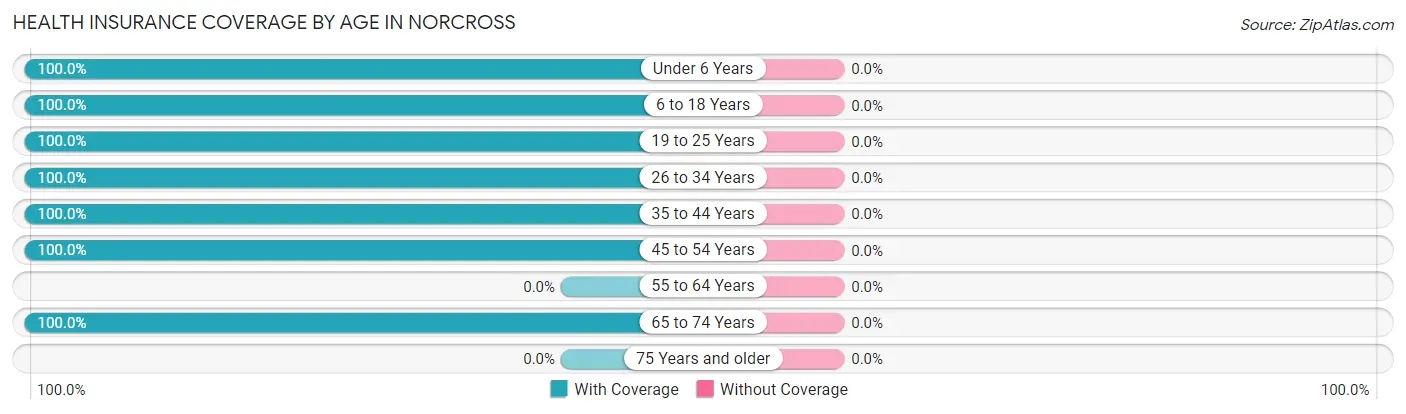
| Age Bracket | With Coverage | Without Coverage |
| Under 6 Years | 12 (100.0%) | 0 (0.0%) |
| 6 to 18 Years | 25 (100.0%) | 0 (0.0%) |
| 19 to 25 Years | 3 (100.0%) | 0 (0.0%) |
| 26 to 34 Years | 2 (100.0%) | 0 (0.0%) |
| 35 to 44 Years | 32 (100.0%) | 0 (0.0%) |
| 45 to 54 Years | 12 (100.0%) | 0 (0.0%) |
| 55 to 64 Years | 0 (0.0%) | 0 (0.0%) |
| 65 to 74 Years | 18 (100.0%) | 0 (0.0%) |
| 75 Years and older | 0 (0.0%) | 0 (0.0%) |
| Total | 104 (100.0%) | 0 (0.0%) |
Health Insurance Coverage by Citizenship Status in Norcross
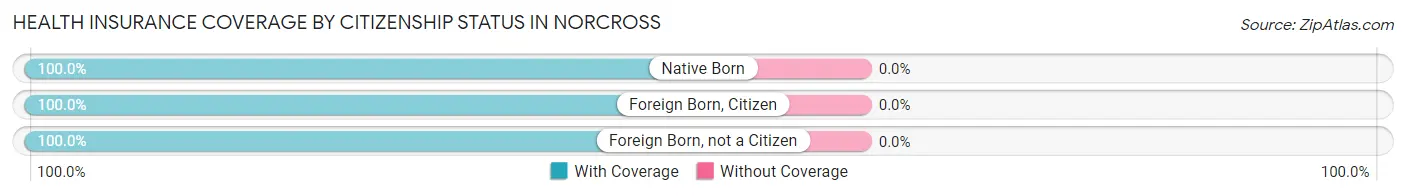
| Citizenship Status | With Coverage | Without Coverage |
| Native Born | 12 (100.0%) | 0 (0.0%) |
| Foreign Born, Citizen | 25 (100.0%) | 0 (0.0%) |
| Foreign Born, not a Citizen | 3 (100.0%) | 0 (0.0%) |
Health Insurance Coverage by Household Income in Norcross
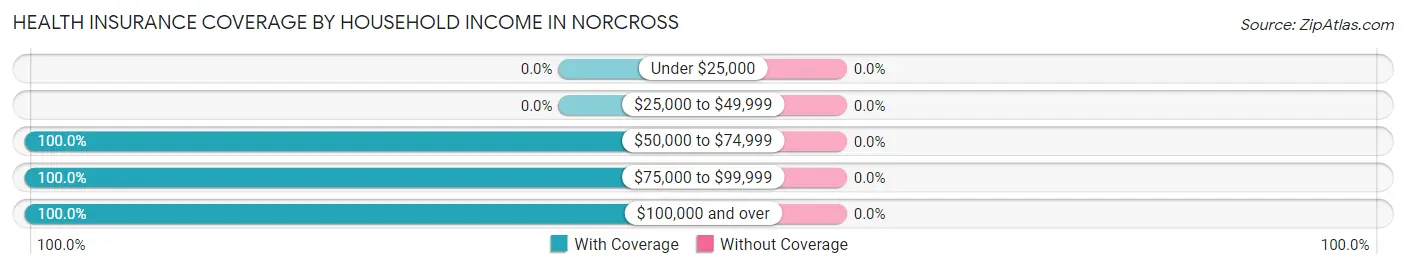
| Household Income | With Coverage | Without Coverage |
| Under $25,000 | 0 (0.0%) | 0 (0.0%) |
| $25,000 to $49,999 | 0 (0.0%) | 0 (0.0%) |
| $50,000 to $74,999 | 24 (100.0%) | 0 (0.0%) |
| $75,000 to $99,999 | 15 (100.0%) | 0 (0.0%) |
| $100,000 and over | 65 (100.0%) | 0 (0.0%) |
Public vs Private Health Insurance Coverage by Age in Norcross
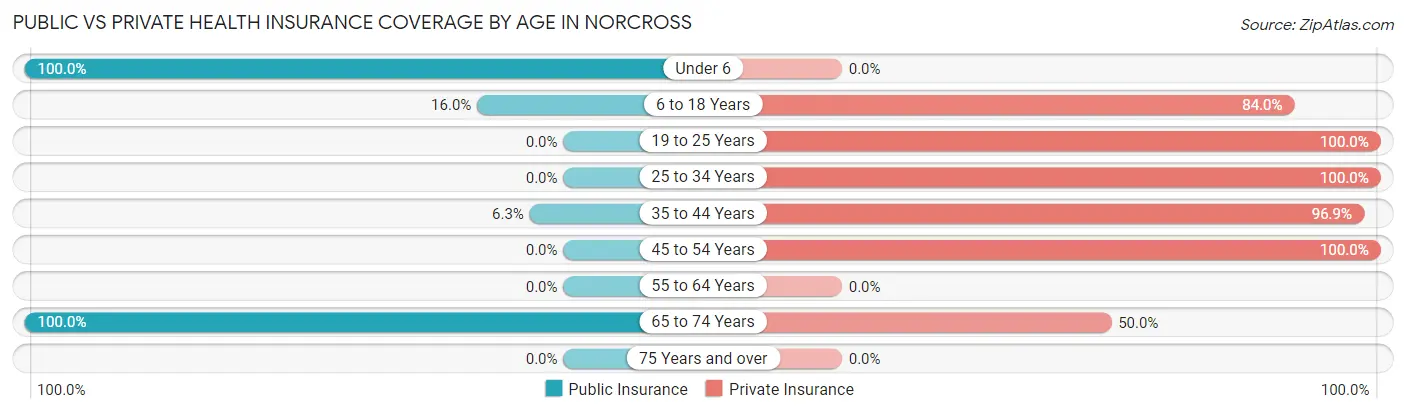
| Age Bracket | Public Insurance | Private Insurance |
| Under 6 | 12 (100.0%) | 0 (0.0%) |
| 6 to 18 Years | 4 (16.0%) | 21 (84.0%) |
| 19 to 25 Years | 0 (0.0%) | 3 (100.0%) |
| 25 to 34 Years | 0 (0.0%) | 2 (100.0%) |
| 35 to 44 Years | 2 (6.2%) | 31 (96.9%) |
| 45 to 54 Years | 0 (0.0%) | 12 (100.0%) |
| 55 to 64 Years | 0 (0.0%) | 0 (0.0%) |
| 65 to 74 Years | 18 (100.0%) | 9 (50.0%) |
| 75 Years and over | 0 (0.0%) | 0 (0.0%) |
| Total | 36 (34.6%) | 78 (75.0%) |
Disability Status by Sex by Age in Norcross
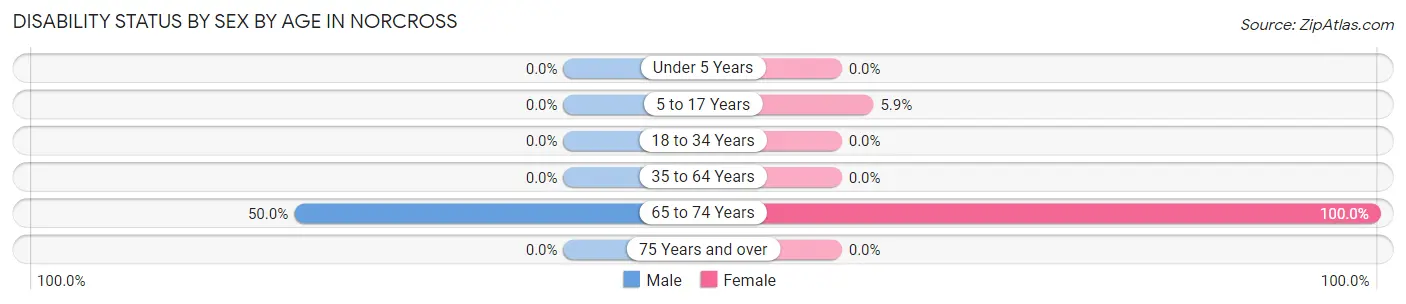
| Age Bracket | Male | Female |
| Under 5 Years | 0 (0.0%) | 0 (0.0%) |
| 5 to 17 Years | 0 (0.0%) | 1 (5.9%) |
| 18 to 34 Years | 0 (0.0%) | 0 (0.0%) |
| 35 to 64 Years | 0 (0.0%) | 0 (0.0%) |
| 65 to 74 Years | 5 (50.0%) | 8 (100.0%) |
| 75 Years and over | 0 (0.0%) | 0 (0.0%) |
Disability Class by Sex by Age in Norcross
Disability Class: Hearing Difficulty
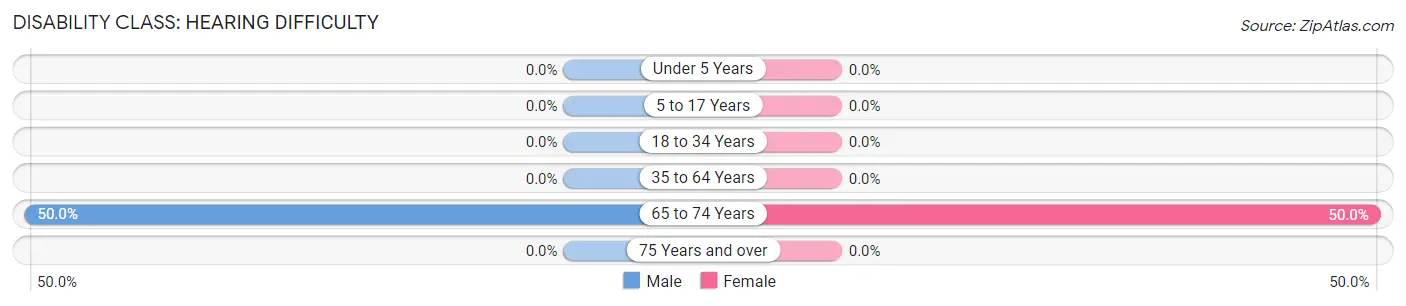
| Age Bracket | Male | Female |
| Under 5 Years | 0 (0.0%) | 0 (0.0%) |
| 5 to 17 Years | 0 (0.0%) | 0 (0.0%) |
| 18 to 34 Years | 0 (0.0%) | 0 (0.0%) |
| 35 to 64 Years | 0 (0.0%) | 0 (0.0%) |
| 65 to 74 Years | 5 (50.0%) | 4 (50.0%) |
| 75 Years and over | 0 (0.0%) | 0 (0.0%) |
Disability Class: Vision Difficulty
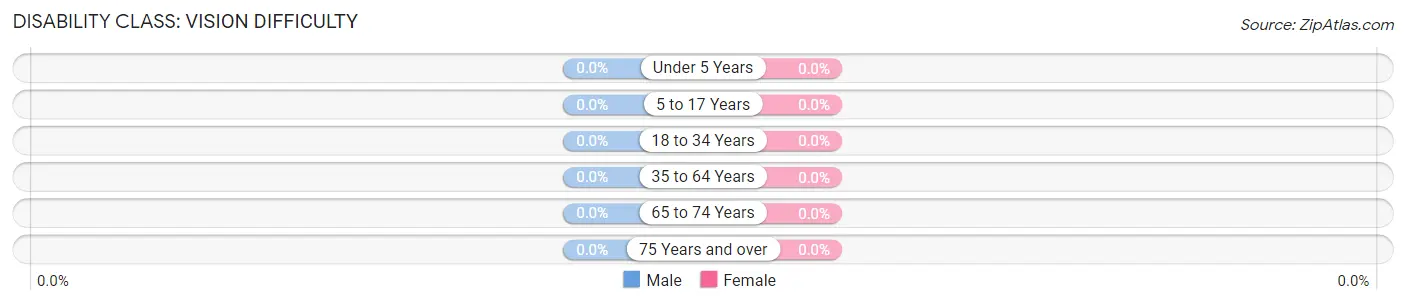
| Age Bracket | Male | Female |
| Under 5 Years | 0 (0.0%) | 0 (0.0%) |
| 5 to 17 Years | 0 (0.0%) | 0 (0.0%) |
| 18 to 34 Years | 0 (0.0%) | 0 (0.0%) |
| 35 to 64 Years | 0 (0.0%) | 0 (0.0%) |
| 65 to 74 Years | 0 (0.0%) | 0 (0.0%) |
| 75 Years and over | 0 (0.0%) | 0 (0.0%) |
Disability Class: Cognitive Difficulty
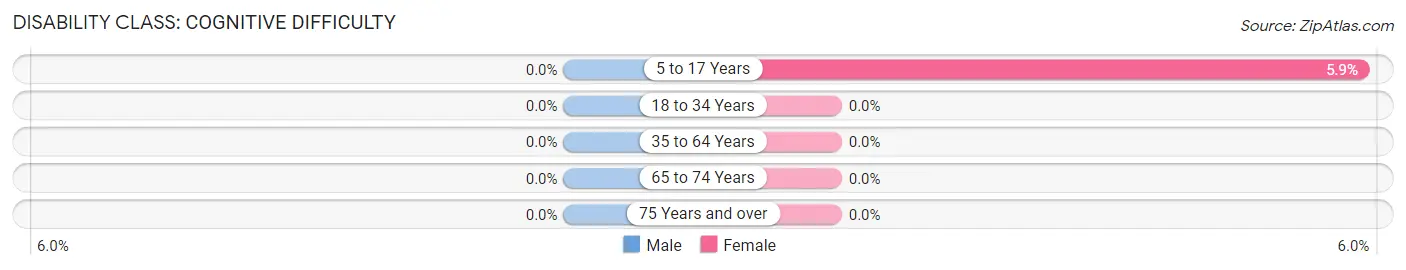
| Age Bracket | Male | Female |
| 5 to 17 Years | 0 (0.0%) | 1 (5.9%) |
| 18 to 34 Years | 0 (0.0%) | 0 (0.0%) |
| 35 to 64 Years | 0 (0.0%) | 0 (0.0%) |
| 65 to 74 Years | 0 (0.0%) | 0 (0.0%) |
| 75 Years and over | 0 (0.0%) | 0 (0.0%) |
Disability Class: Ambulatory Difficulty
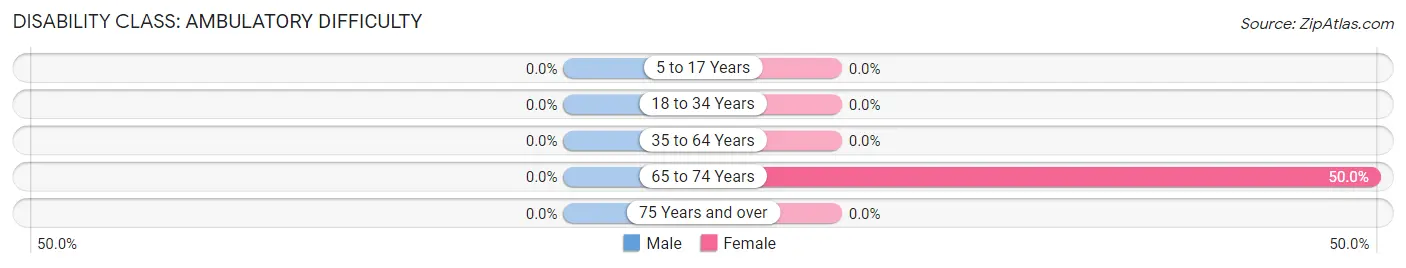
| Age Bracket | Male | Female |
| 5 to 17 Years | 0 (0.0%) | 0 (0.0%) |
| 18 to 34 Years | 0 (0.0%) | 0 (0.0%) |
| 35 to 64 Years | 0 (0.0%) | 0 (0.0%) |
| 65 to 74 Years | 0 (0.0%) | 4 (50.0%) |
| 75 Years and over | 0 (0.0%) | 0 (0.0%) |
Disability Class: Self-Care Difficulty

| Age Bracket | Male | Female |
| 5 to 17 Years | 0 (0.0%) | 0 (0.0%) |
| 18 to 34 Years | 0 (0.0%) | 0 (0.0%) |
| 35 to 64 Years | 0 (0.0%) | 0 (0.0%) |
| 65 to 74 Years | 0 (0.0%) | 4 (50.0%) |
| 75 Years and over | 0 (0.0%) | 0 (0.0%) |
Technology Access in Norcross
Computing Device Access in Norcross
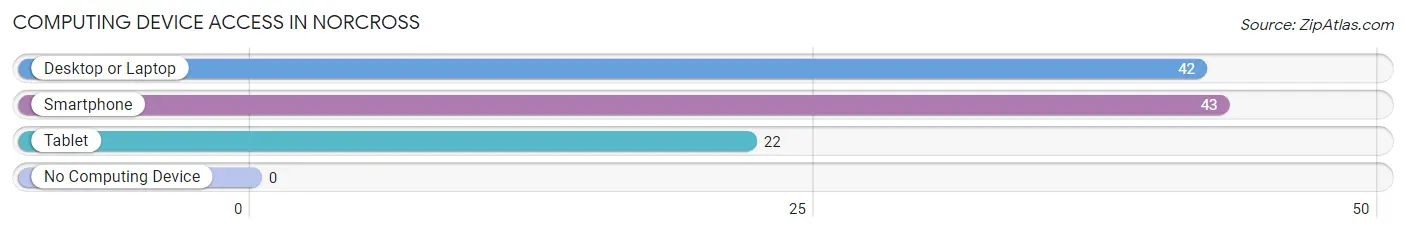
| Device Type | # Households | % Households |
| Desktop or Laptop | 42 | 97.7% |
| Smartphone | 43 | 100.0% |
| Tablet | 22 | 51.2% |
| No Computing Device | 0 | 0.0% |
| Total | 43 | 100.0% |
Internet Access in Norcross
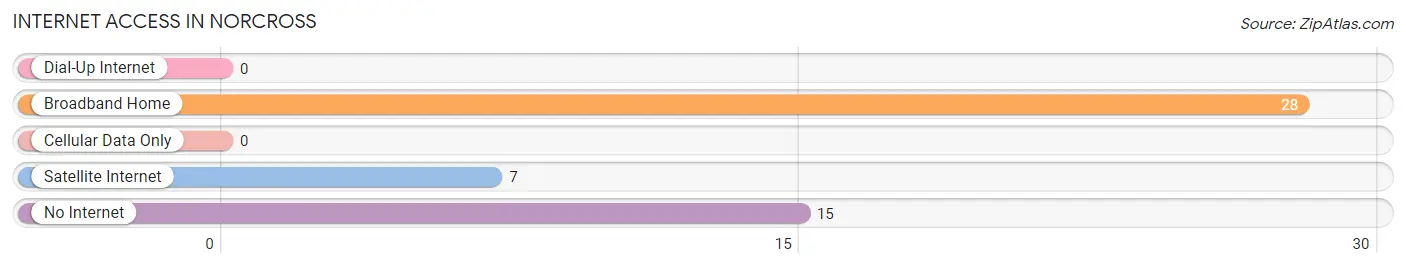
| Internet Type | # Households | % Households |
| Dial-Up Internet | 0 | 0.0% |
| Broadband Home | 28 | 65.1% |
| Cellular Data Only | 0 | 0.0% |
| Satellite Internet | 7 | 16.3% |
| No Internet | 15 | 34.9% |
| Total | 43 | 100.0% |
Norcross Summary
Norcross is a small city located in the state of Minnesota, United States. It is situated in the southeastern corner of the state, near the border with Wisconsin. The city has a population of approximately 1,500 people and is part of the Twin Cities metropolitan area.
History
Norcross was founded in 1856 by a group of settlers from Norway. The city was named after the Norwegian city of Norcross, which was the hometown of one of the settlers. The settlers were attracted to the area due to its abundance of natural resources, including timber and water.
The city was incorporated in 1872 and quickly grew in size and population. By the early 1900s, Norcross had become a thriving community with a variety of businesses, including a sawmill, a flour mill, a creamery, and a brickyard.
In the 1950s, Norcross began to experience a decline in population as people moved away to larger cities. However, the city has since experienced a resurgence in population and is now home to a variety of businesses and industries.
Geography
Norcross is located in the southeastern corner of Minnesota, near the border with Wisconsin. The city is situated on the banks of the St. Croix River, which forms the border between Minnesota and Wisconsin.
The city is surrounded by rolling hills and forests, and is home to a variety of wildlife, including deer, foxes, and bald eagles. The city is also home to several lakes, including Lake Norcross, which is a popular destination for fishing and boating.
Economy
Norcross is home to a variety of businesses and industries, including manufacturing, retail, and tourism. The city is home to several manufacturing plants, including a paper mill and a furniture factory.
The city is also home to a variety of retail stores, including grocery stores, clothing stores, and restaurants. Tourism is also an important part of the local economy, as the city is home to several attractions, including the Norcross Historical Museum and the Norcross Wildlife Refuge.
Demographics
As of the 2010 census, the population of Norcross was 1,500 people. The racial makeup of the city was 95.3% White, 0.7% African American, 0.7% Native American, 0.7% Asian, 0.3% from other races, and 2.0% from two or more races.
The median household income in Norcross was $45,000, and the median family income was $50,000. The per capita income in the city was $20,000. The poverty rate in Norcross was 8.3%.
Conclusion
Norcross is a small city located in the southeastern corner of Minnesota, near the border with Wisconsin. The city has a population of approximately 1,500 people and is part of the Twin Cities metropolitan area. Norcross was founded in 1856 by a group of settlers from Norway and has since become a thriving community with a variety of businesses and industries. The city is home to a variety of retail stores, manufacturing plants, and tourist attractions. The population of Norcross is predominantly White, with a median household income of $45,000 and a poverty rate of 8.3%.
Common Questions
What is Per Capita Income in Norcross?
Per Capita income in Norcross is $60,746.
What is the Median Family Income in Norcross?
Median Family Income in Norcross is $110,625.
What is the Median Household income in Norcross?
Median Household Income in Norcross is $94,083.
What is Inequality or Gini Index in Norcross?
Inequality or Gini Index in Norcross is 0.41.
What is the Total Population of Norcross?
Total Population of Norcross is 104.
What is the Total Male Population of Norcross?
Total Male Population of Norcross is 61.
What is the Total Female Population of Norcross?
Total Female Population of Norcross is 43.
What is the Ratio of Males per 100 Females in Norcross?
There are 141.86 Males per 100 Females in Norcross.
What is the Ratio of Females per 100 Males in Norcross?
There are 70.49 Females per 100 Males in Norcross.
What is the Median Population Age in Norcross?
Median Population Age in Norcross is 35.7 Years.
What is the Average Family Size in Norcross
Average Family Size in Norcross is 3.2 People.
What is the Average Household Size in Norcross
Average Household Size in Norcross is 2.4 People.
How Large is the Labor Force in Norcross?
There are 50 People in the Labor Forcein in Norcross.
What is the Percentage of People in the Labor Force in Norcross?
63.3% of People are in the Labor Force in Norcross.