New Richland, MN Map & Demographics
New Richland Map
New Richland Overview
$27,876
PER CAPITA INCOME
$77,500
AVG FAMILY INCOME
$54,464
AVG HOUSEHOLD INCOME
15.5%
WAGE / INCOME GAP [ % ]
84.5¢/ $1
WAGE / INCOME GAP [ $ ]
0.37
INEQUALITY / GINI INDEX
1,020
TOTAL POPULATION
511
MALE POPULATION
509
FEMALE POPULATION
100.39
MALES / 100 FEMALES
99.61
FEMALES / 100 MALES
40.6
MEDIAN AGE
2.9
AVG FAMILY SIZE
2.3
AVG HOUSEHOLD SIZE
476
LABOR FORCE [ PEOPLE ]
60.3%
PERCENT IN LABOR FORCE
5.0%
UNEMPLOYMENT RATE
New Richland Zip Codes
New Richland Area Codes
Income in New Richland
Income Overview in New Richland
Per Capita Income in New Richland is $27,876, while median incomes of families and households are $77,500 and $54,464 respectively.
| Characteristic | Number | Measure |
| Per Capita Income | 1,020 | $27,876 |
| Median Family Income | 260 | $77,500 |
| Mean Family Income | 260 | $82,057 |
| Median Household Income | 406 | $54,464 |
| Mean Household Income | 406 | $66,857 |
| Income Deficit | 260 | $0 |
| Wage / Income Gap (%) | 1,020 | 15.49% |
| Wage / Income Gap ($) | 1,020 | 84.51¢ per $1 |
| Gini / Inequality Index | 1,020 | 0.37 |
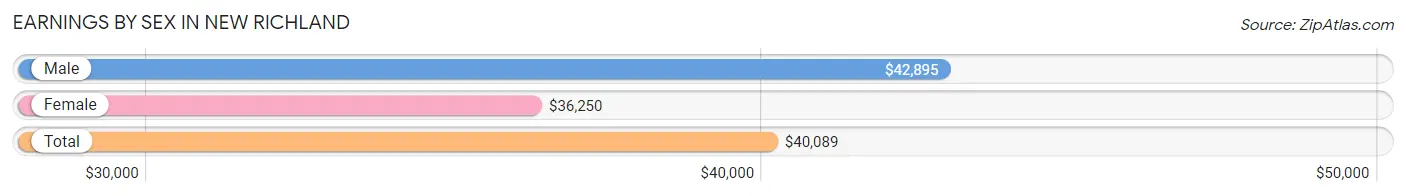
Earnings by Sex in New Richland
Average Earnings in New Richland are $40,089, $42,895 for men and $36,250 for women, a difference of 15.5%.
| Sex | Number | Average Earnings |
| Male | 278 (55.3%) | $42,895 |
| Female | 225 (44.7%) | $36,250 |
| Total | 503 (100.0%) | $40,089 |
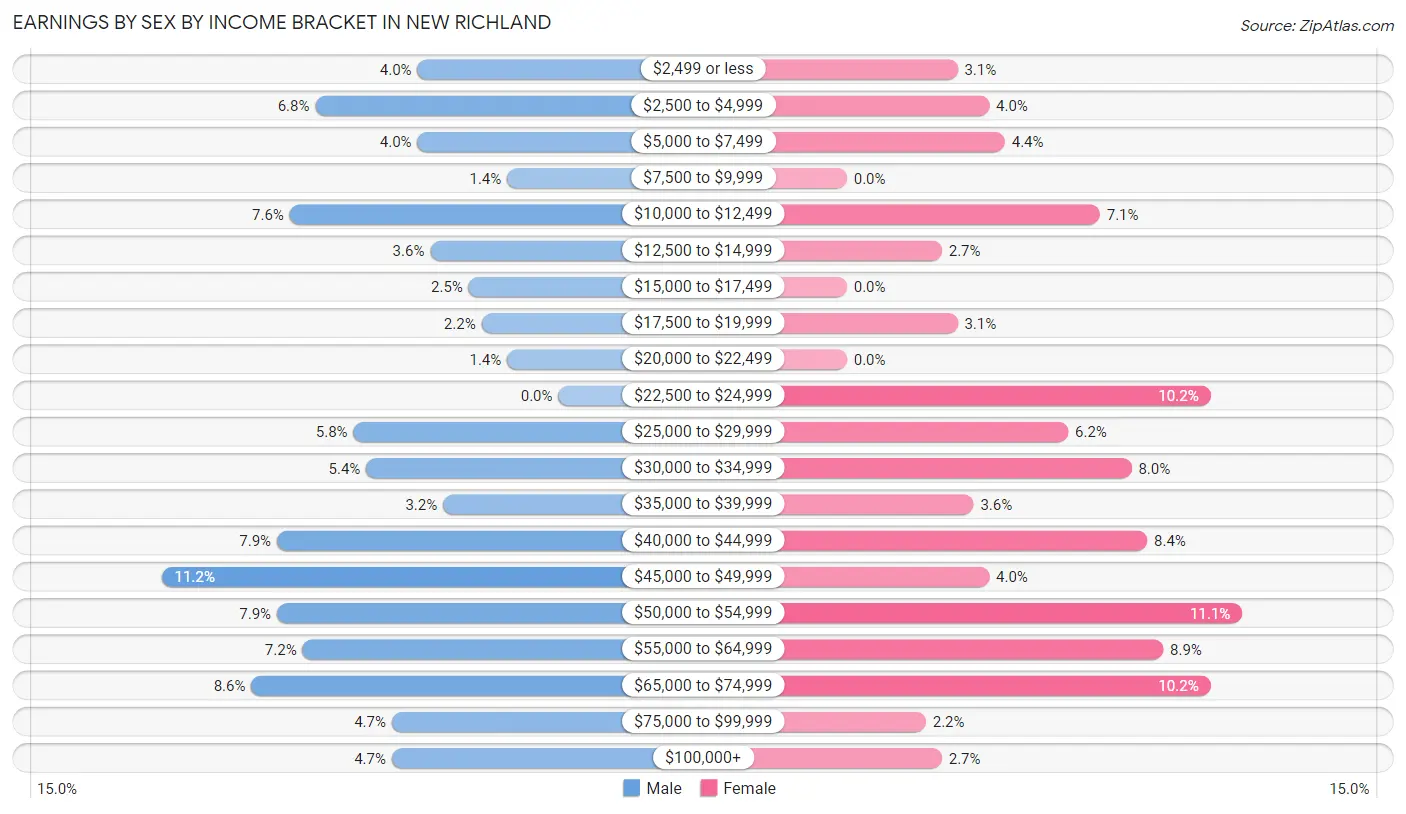
Earnings by Sex by Income Bracket in New Richland
The most common earnings brackets in New Richland are $45,000 to $49,999 for men (31 | 11.2%) and $50,000 to $54,999 for women (25 | 11.1%).
| Income | Male | Female |
| $2,499 or less | 11 (4.0%) | 7 (3.1%) |
| $2,500 to $4,999 | 19 (6.8%) | 9 (4.0%) |
| $5,000 to $7,499 | 11 (4.0%) | 10 (4.4%) |
| $7,500 to $9,999 | 4 (1.4%) | 0 (0.0%) |
| $10,000 to $12,499 | 21 (7.5%) | 16 (7.1%) |
| $12,500 to $14,999 | 10 (3.6%) | 6 (2.7%) |
| $15,000 to $17,499 | 7 (2.5%) | 0 (0.0%) |
| $17,500 to $19,999 | 6 (2.2%) | 7 (3.1%) |
| $20,000 to $22,499 | 4 (1.4%) | 0 (0.0%) |
| $22,500 to $24,999 | 0 (0.0%) | 23 (10.2%) |
| $25,000 to $29,999 | 16 (5.8%) | 14 (6.2%) |
| $30,000 to $34,999 | 15 (5.4%) | 18 (8.0%) |
| $35,000 to $39,999 | 9 (3.2%) | 8 (3.6%) |
| $40,000 to $44,999 | 22 (7.9%) | 19 (8.4%) |
| $45,000 to $49,999 | 31 (11.2%) | 9 (4.0%) |
| $50,000 to $54,999 | 22 (7.9%) | 25 (11.1%) |
| $55,000 to $64,999 | 20 (7.2%) | 20 (8.9%) |
| $65,000 to $74,999 | 24 (8.6%) | 23 (10.2%) |
| $75,000 to $99,999 | 13 (4.7%) | 5 (2.2%) |
| $100,000+ | 13 (4.7%) | 6 (2.7%) |
| Total | 278 (100.0%) | 225 (100.0%) |
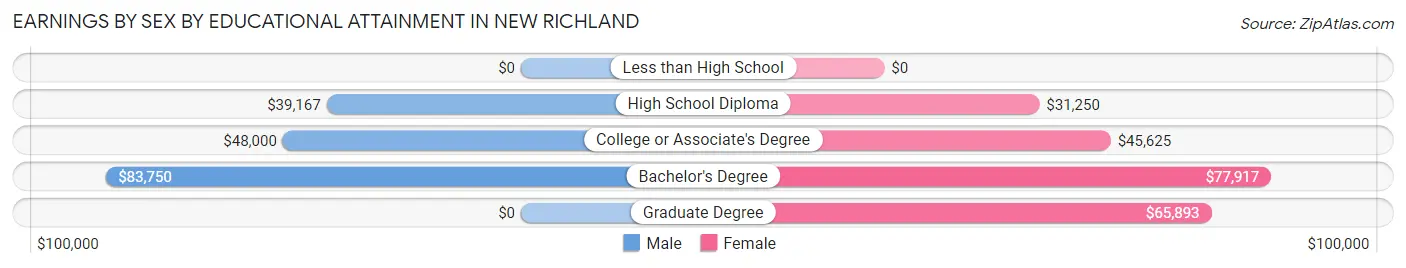
Earnings by Sex by Educational Attainment in New Richland
Average earnings in New Richland are $46,838 for men and $41,705 for women, a difference of 11.0%. Men with an educational attainment of bachelor's degree enjoy the highest average annual earnings of $83,750, while those with high school diploma education earn the least with $39,167. Women with an educational attainment of bachelor's degree earn the most with the average annual earnings of $77,917, while those with high school diploma education have the smallest earnings of $31,250.
| Educational Attainment | Male Income | Female Income |
| Less than High School | - | - |
| High School Diploma | $39,167 | $31,250 |
| College or Associate's Degree | $48,000 | $45,625 |
| Bachelor's Degree | $83,750 | $77,917 |
| Graduate Degree | - | - |
| Total | $46,838 | $41,705 |
Family Income in New Richland
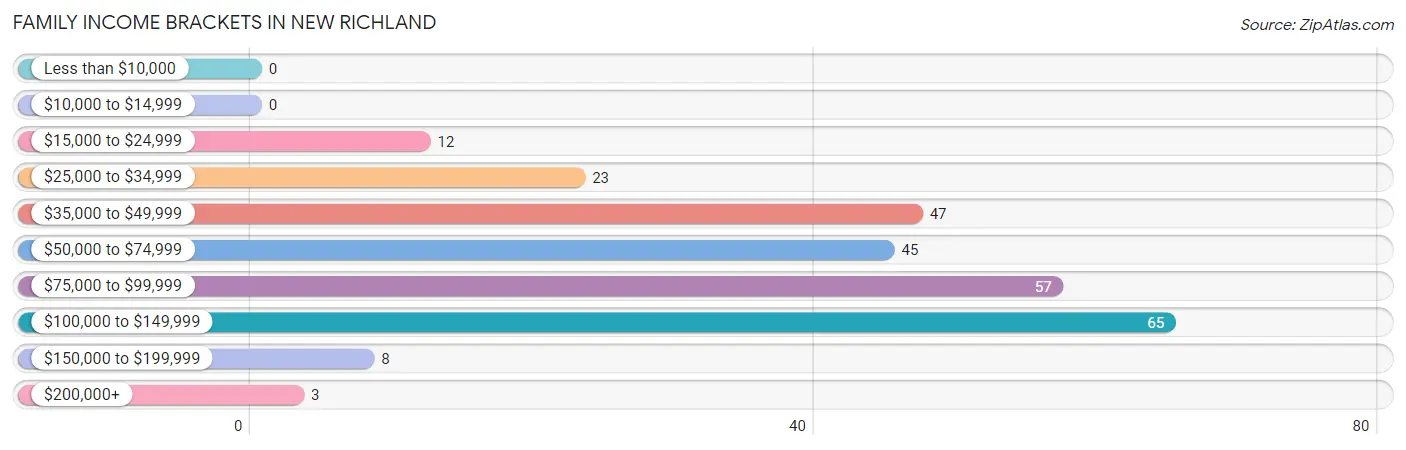
Family Income Brackets in New Richland
According to the New Richland family income data, there are 65 families falling into the $100,000 to $149,999 income range, which is the most common income bracket and makes up 25.0% of all families.
| Income Bracket | # Families | % Families |
| Less than $10,000 | 0 | 0.0% |
| $10,000 to $14,999 | 0 | 0.0% |
| $15,000 to $24,999 | 12 | 4.6% |
| $25,000 to $34,999 | 23 | 8.8% |
| $35,000 to $49,999 | 47 | 18.1% |
| $50,000 to $74,999 | 45 | 17.3% |
| $75,000 to $99,999 | 57 | 21.9% |
| $100,000 to $149,999 | 65 | 25.0% |
| $150,000 to $199,999 | 8 | 3.1% |
| $200,000+ | 3 | 1.2% |
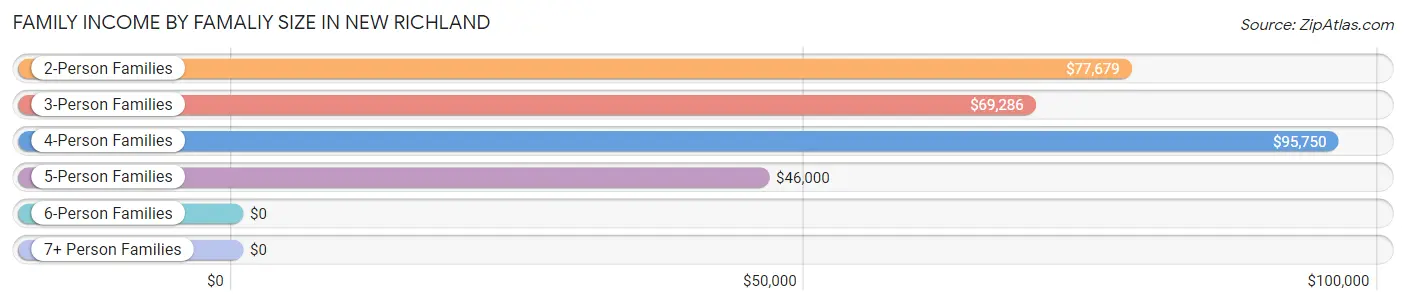
Family Income by Famaliy Size in New Richland
4-person families (39 | 15.0%) account for the highest median family income in New Richland with $95,750 per family, while 2-person families (133 | 51.1%) have the highest median income of $38,840 per family member.
| Income Bracket | # Families | Median Income |
| 2-Person Families | 133 (51.1%) | $77,679 |
| 3-Person Families | 60 (23.1%) | $69,286 |
| 4-Person Families | 39 (15.0%) | $95,750 |
| 5-Person Families | 16 (6.1%) | $46,000 |
| 6-Person Families | 12 (4.6%) | $0 |
| 7+ Person Families | 0 (0.0%) | $0 |
| Total | 260 (100.0%) | $77,500 |
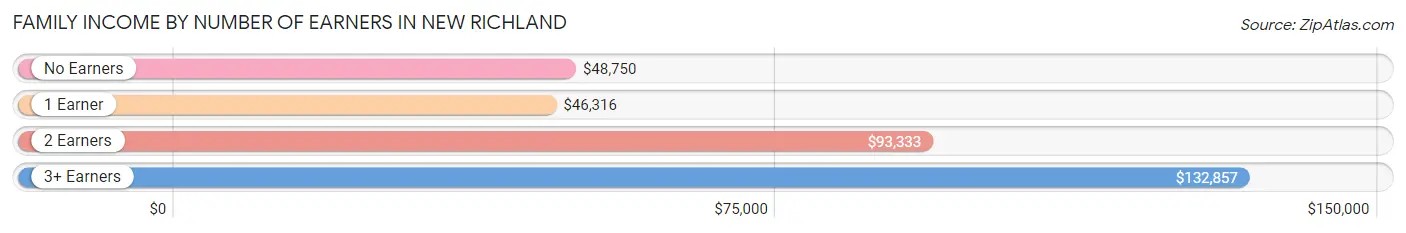
Family Income by Number of Earners in New Richland
The median family income in New Richland is $77,500, with families comprising 3+ earners (28) having the highest median family income of $132,857, while families with 1 earner (84) have the lowest median family income of $46,316, accounting for 10.8% and 32.3% of families, respectively.
| Number of Earners | # Families | Median Income |
| No Earners | 34 (13.1%) | $48,750 |
| 1 Earner | 84 (32.3%) | $46,316 |
| 2 Earners | 114 (43.9%) | $93,333 |
| 3+ Earners | 28 (10.8%) | $132,857 |
| Total | 260 (100.0%) | $77,500 |
Household Income in New Richland
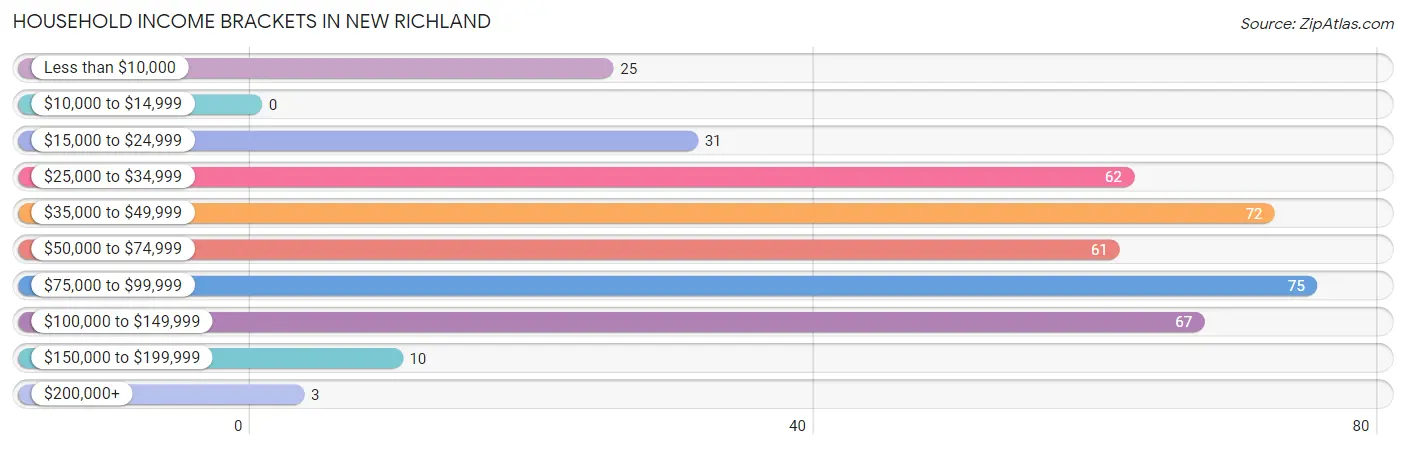
Household Income Brackets in New Richland
With 75 households falling in the category, the $75,000 to $99,999 income range is the most frequent in New Richland, accounting for 18.5% of all households.
| Income Bracket | # Households | % Households |
| Less than $10,000 | 25 | 6.2% |
| $10,000 to $14,999 | 0 | 0.0% |
| $15,000 to $24,999 | 31 | 7.6% |
| $25,000 to $34,999 | 62 | 15.3% |
| $35,000 to $49,999 | 72 | 17.7% |
| $50,000 to $74,999 | 61 | 15.0% |
| $75,000 to $99,999 | 75 | 18.5% |
| $100,000 to $149,999 | 67 | 16.5% |
| $150,000 to $199,999 | 10 | 2.5% |
| $200,000+ | 3 | 0.7% |
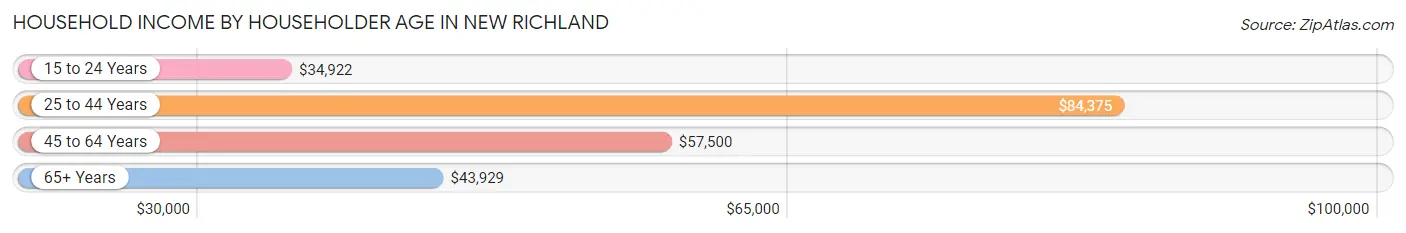
Household Income by Householder Age in New Richland
The median household income in New Richland is $54,464, with the highest median household income of $84,375 found in the 25 to 44 years age bracket for the primary householder. A total of 121 households (29.8%) fall into this category. Meanwhile, the 15 to 24 years age bracket for the primary householder has the lowest median household income of $34,922, with 43 households (10.6%) in this group.
| Income Bracket | # Households | Median Income |
| 15 to 24 Years | 43 (10.6%) | $34,922 |
| 25 to 44 Years | 121 (29.8%) | $84,375 |
| 45 to 64 Years | 124 (30.5%) | $57,500 |
| 65+ Years | 118 (29.1%) | $43,929 |
| Total | 406 (100.0%) | $54,464 |
Poverty in New Richland
Income Below Poverty by Sex and Age in New Richland
With 10.4% poverty level for males and 9.5% for females among the residents of New Richland, 45 to 54 year old males and 15 year old females are the most vulnerable to poverty, with 4 males (25.0%) and 2 females (40.0%) in their respective age groups living below the poverty level.
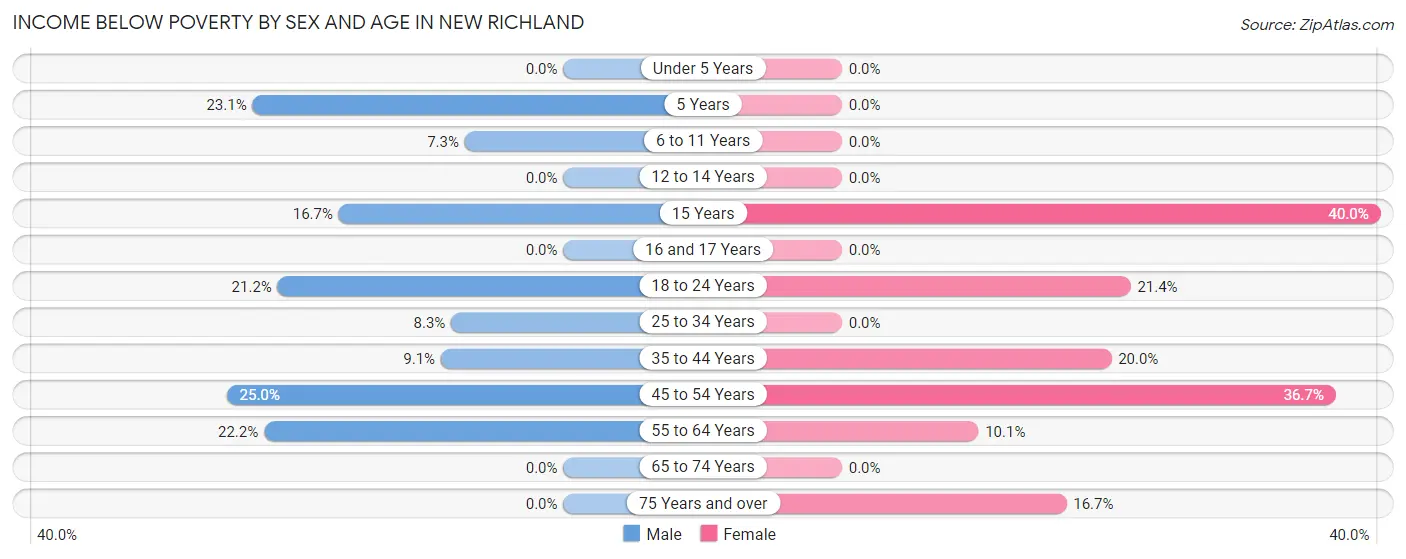
| Age Bracket | Male | Female |
| Under 5 Years | 0 (0.0%) | 0 (0.0%) |
| 5 Years | 3 (23.1%) | 0 (0.0%) |
| 6 to 11 Years | 3 (7.3%) | 0 (0.0%) |
| 12 to 14 Years | 0 (0.0%) | 0 (0.0%) |
| 15 Years | 2 (16.7%) | 2 (40.0%) |
| 16 and 17 Years | 0 (0.0%) | 0 (0.0%) |
| 18 to 24 Years | 14 (21.2%) | 6 (21.4%) |
| 25 to 34 Years | 3 (8.3%) | 0 (0.0%) |
| 35 to 44 Years | 6 (9.1%) | 12 (20.0%) |
| 45 to 54 Years | 4 (25.0%) | 11 (36.7%) |
| 55 to 64 Years | 16 (22.2%) | 8 (10.1%) |
| 65 to 74 Years | 0 (0.0%) | 0 (0.0%) |
| 75 Years and over | 0 (0.0%) | 3 (16.7%) |
| Total | 51 (10.4%) | 42 (9.5%) |
Income Above Poverty by Sex and Age in New Richland
According to the poverty statistics in New Richland, males aged under 5 years and females aged under 5 years are the age groups that are most secure financially, with 100.0% of males and 100.0% of females in these age groups living above the poverty line.
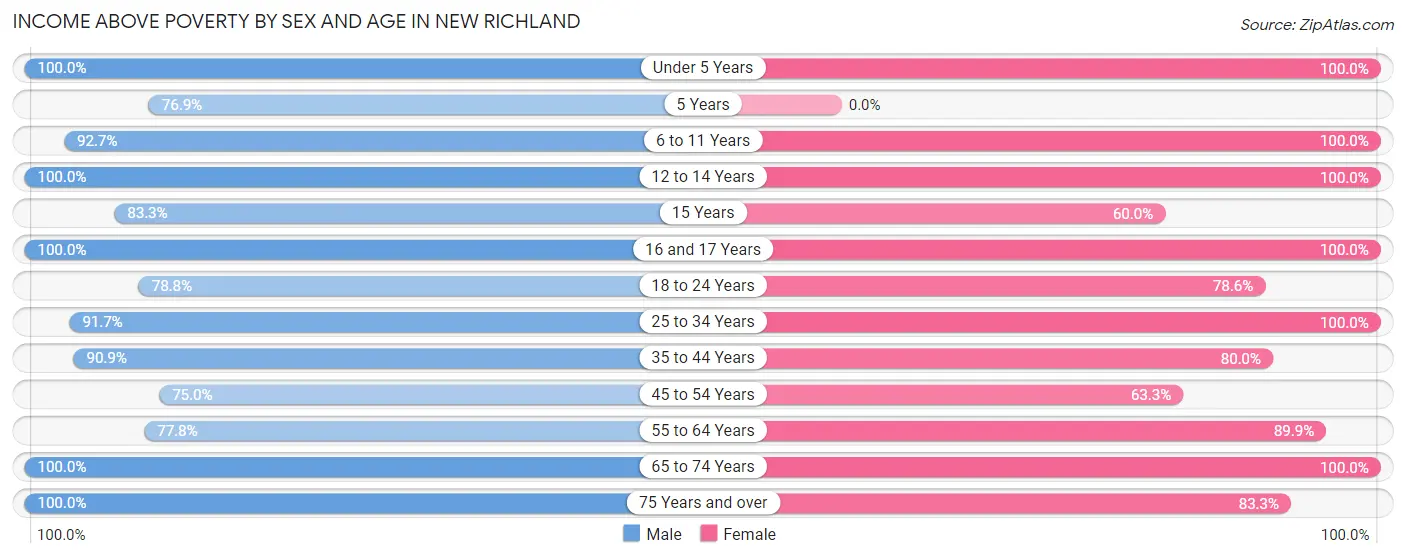
| Age Bracket | Male | Female |
| Under 5 Years | 33 (100.0%) | 26 (100.0%) |
| 5 Years | 10 (76.9%) | 0 (0.0%) |
| 6 to 11 Years | 38 (92.7%) | 52 (100.0%) |
| 12 to 14 Years | 23 (100.0%) | 20 (100.0%) |
| 15 Years | 10 (83.3%) | 3 (60.0%) |
| 16 and 17 Years | 12 (100.0%) | 7 (100.0%) |
| 18 to 24 Years | 52 (78.8%) | 22 (78.6%) |
| 25 to 34 Years | 33 (91.7%) | 58 (100.0%) |
| 35 to 44 Years | 60 (90.9%) | 48 (80.0%) |
| 45 to 54 Years | 12 (75.0%) | 19 (63.3%) |
| 55 to 64 Years | 56 (77.8%) | 71 (89.9%) |
| 65 to 74 Years | 72 (100.0%) | 60 (100.0%) |
| 75 Years and over | 29 (100.0%) | 15 (83.3%) |
| Total | 440 (89.6%) | 401 (90.5%) |
Income Below Poverty Among Married-Couple Families in New Richland
The poverty statistics for married-couple families in New Richland show that 3.2% or 6 of the total 188 families live below the poverty line. Families with 1 or 2 children have the highest poverty rate of 6.4%, comprising of 3 families. On the other hand, families with 3 or 4 children have the lowest poverty rate of 0.0%, which includes 0 families.
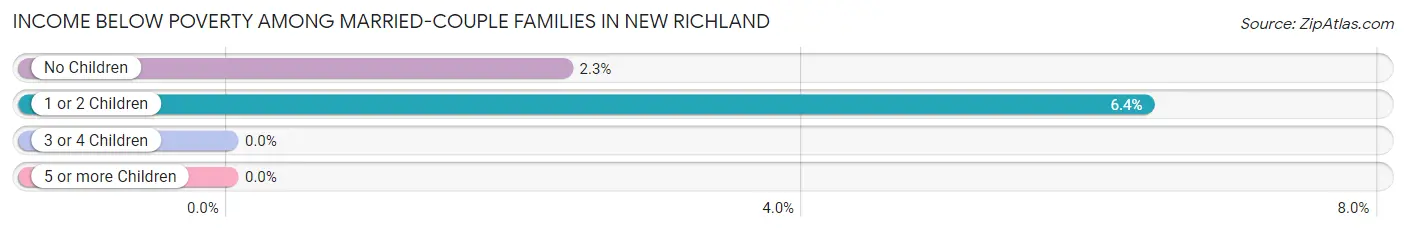
| Children | Above Poverty | Below Poverty |
| No Children | 126 (97.7%) | 3 (2.3%) |
| 1 or 2 Children | 44 (93.6%) | 3 (6.4%) |
| 3 or 4 Children | 12 (100.0%) | 0 (0.0%) |
| 5 or more Children | 0 (0.0%) | 0 (0.0%) |
| Total | 182 (96.8%) | 6 (3.2%) |
Income Below Poverty Among Single-Parent Households in New Richland
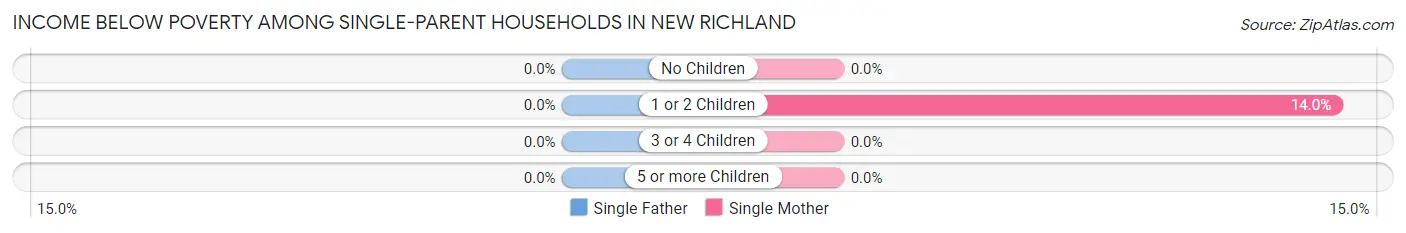
| Children | Single Father | Single Mother |
| No Children | 0 (0.0%) | 0 (0.0%) |
| 1 or 2 Children | 0 (0.0%) | 6 (14.0%) |
| 3 or 4 Children | 0 (0.0%) | 0 (0.0%) |
| 5 or more Children | 0 (0.0%) | 0 (0.0%) |
| Total | 0 (0.0%) | 6 (10.2%) |
Income Below Poverty Among Married-Couple vs Single-Parent Households in New Richland
The poverty data for New Richland shows that 6 of the married-couple family households (3.2%) and 6 of the single-parent households (8.3%) are living below the poverty level. Within the married-couple family households, those with 1 or 2 children have the highest poverty rate, with 3 households (6.4%) falling below the poverty line. Among the single-parent households, those with 1 or 2 children have the highest poverty rate, with 6 household (12.2%) living below poverty.
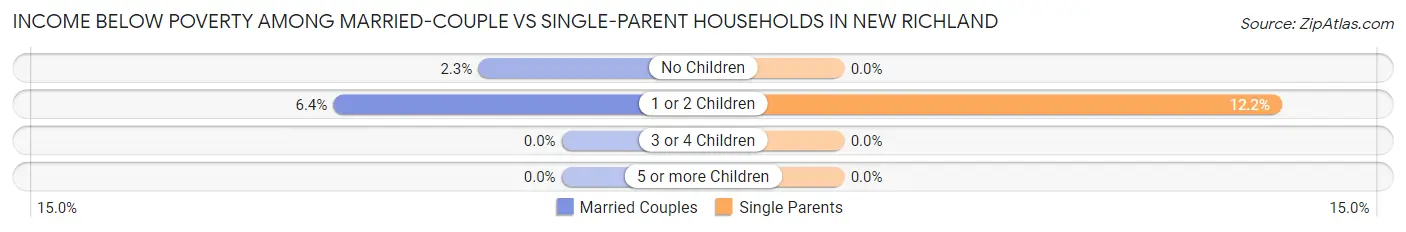
| Children | Married-Couple Families | Single-Parent Households |
| No Children | 3 (2.3%) | 0 (0.0%) |
| 1 or 2 Children | 3 (6.4%) | 6 (12.2%) |
| 3 or 4 Children | 0 (0.0%) | 0 (0.0%) |
| 5 or more Children | 0 (0.0%) | 0 (0.0%) |
| Total | 6 (3.2%) | 6 (8.3%) |
Race in New Richland
The most populous races in New Richland are White / Caucasian (1,005 | 98.5%), Hispanic or Latino (22 | 2.2%), and Two or more Races (10 | 1.0%).
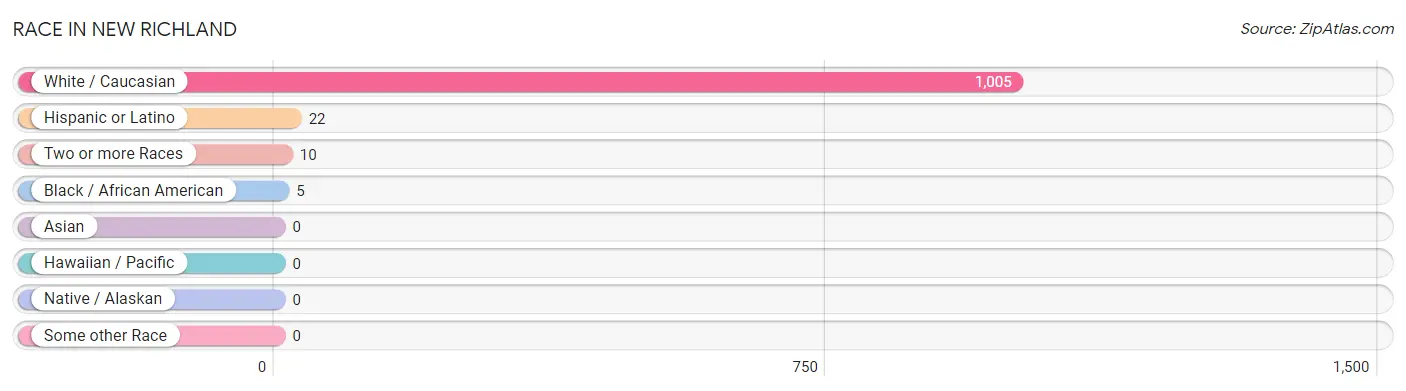
| Race | # Population | % Population |
| Asian | 0 | 0.0% |
| Black / African American | 5 | 0.5% |
| Hawaiian / Pacific | 0 | 0.0% |
| Hispanic or Latino | 22 | 2.2% |
| Native / Alaskan | 0 | 0.0% |
| White / Caucasian | 1,005 | 98.5% |
| Two or more Races | 10 | 1.0% |
| Some other Race | 0 | 0.0% |
| Total | 1,020 | 100.0% |
Ancestry in New Richland
The most populous ancestries reported in New Richland are German (413 | 40.5%), Norwegian (224 | 22.0%), English (71 | 7.0%), Swedish (57 | 5.6%), and Danish (49 | 4.8%), together accounting for 79.8% of all New Richland residents.
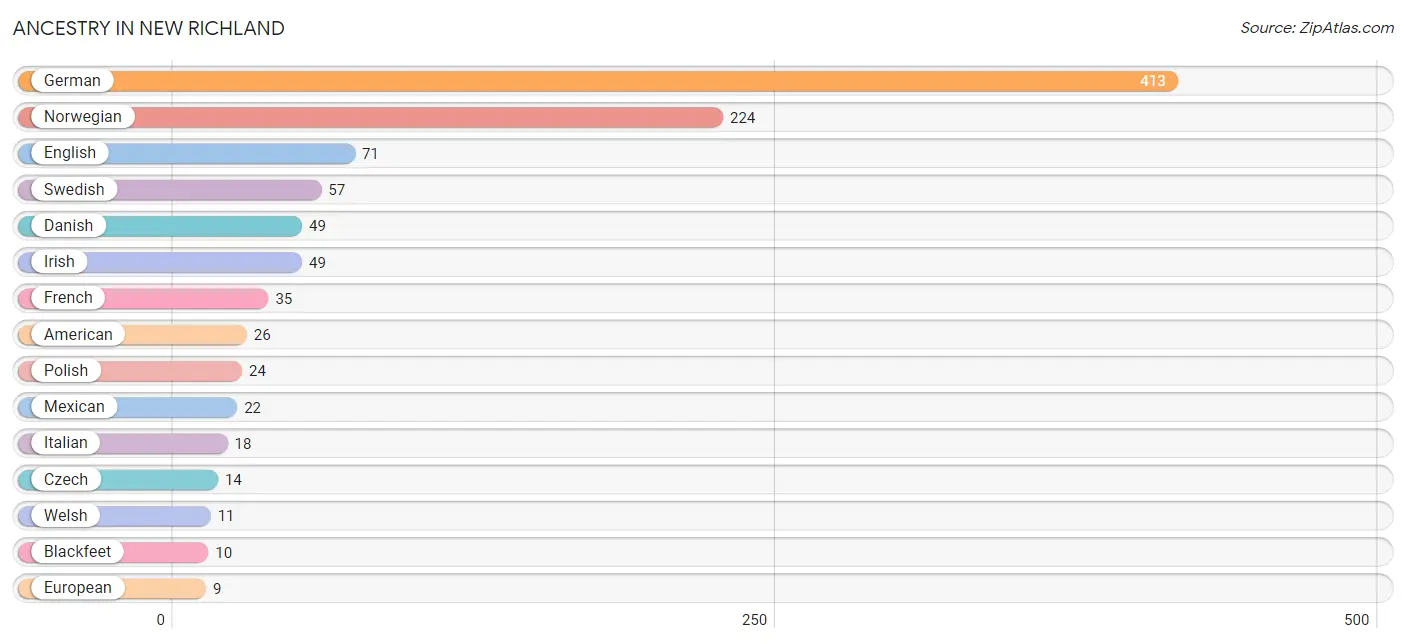
| Ancestry | # Population | % Population |
| American | 26 | 2.5% |
| Belgian | 5 | 0.5% |
| Blackfeet | 10 | 1.0% |
| British | 2 | 0.2% |
| Czech | 14 | 1.4% |
| Czechoslovakian | 3 | 0.3% |
| Danish | 49 | 4.8% |
| Dutch | 6 | 0.6% |
| English | 71 | 7.0% |
| European | 9 | 0.9% |
| French | 35 | 3.4% |
| French Canadian | 9 | 0.9% |
| German | 413 | 40.5% |
| Irish | 49 | 4.8% |
| Italian | 18 | 1.8% |
| Mexican | 22 | 2.2% |
| Norwegian | 224 | 22.0% |
| Polish | 24 | 2.4% |
| Russian | 3 | 0.3% |
| Scotch-Irish | 6 | 0.6% |
| Scottish | 3 | 0.3% |
| Swedish | 57 | 5.6% |
| Welsh | 11 | 1.1% | View All 23 Rows |
Immigrants in New Richland
The most numerous immigrant groups reported in New Richland came from Central America (11 | 1.1%), Latin America (11 | 1.1%), Mexico (11 | 1.1%), Eastern Europe (3 | 0.3%), and Europe (3 | 0.3%), together accounting for 3.8% of all New Richland residents.
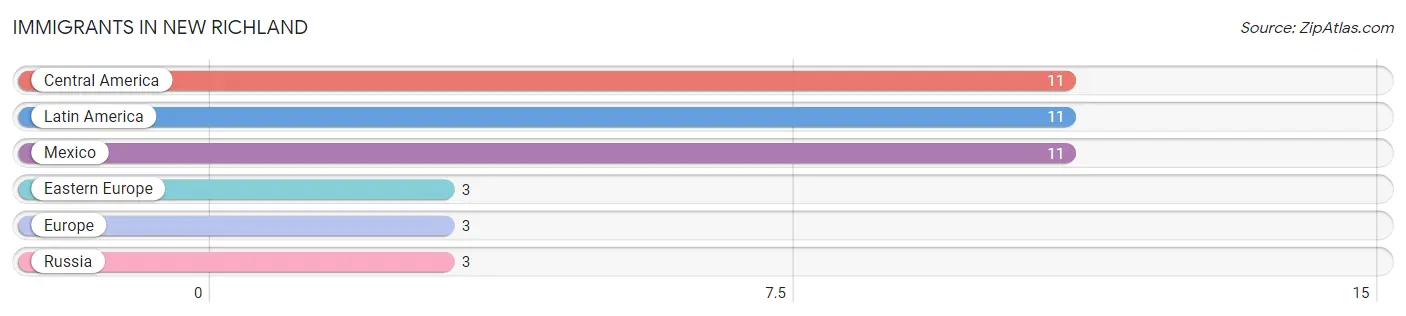
| Immigration Origin | # Population | % Population |
| Central America | 11 | 1.1% |
| Eastern Europe | 3 | 0.3% |
| Europe | 3 | 0.3% |
| Latin America | 11 | 1.1% |
| Mexico | 11 | 1.1% |
| Russia | 3 | 0.3% | View All 6 Rows |
Sex and Age in New Richland
Sex and Age in New Richland
The most populous age groups in New Richland are 20 to 24 Years (53 | 10.4%) for men and 55 to 59 Years (46 | 9.0%) for women.
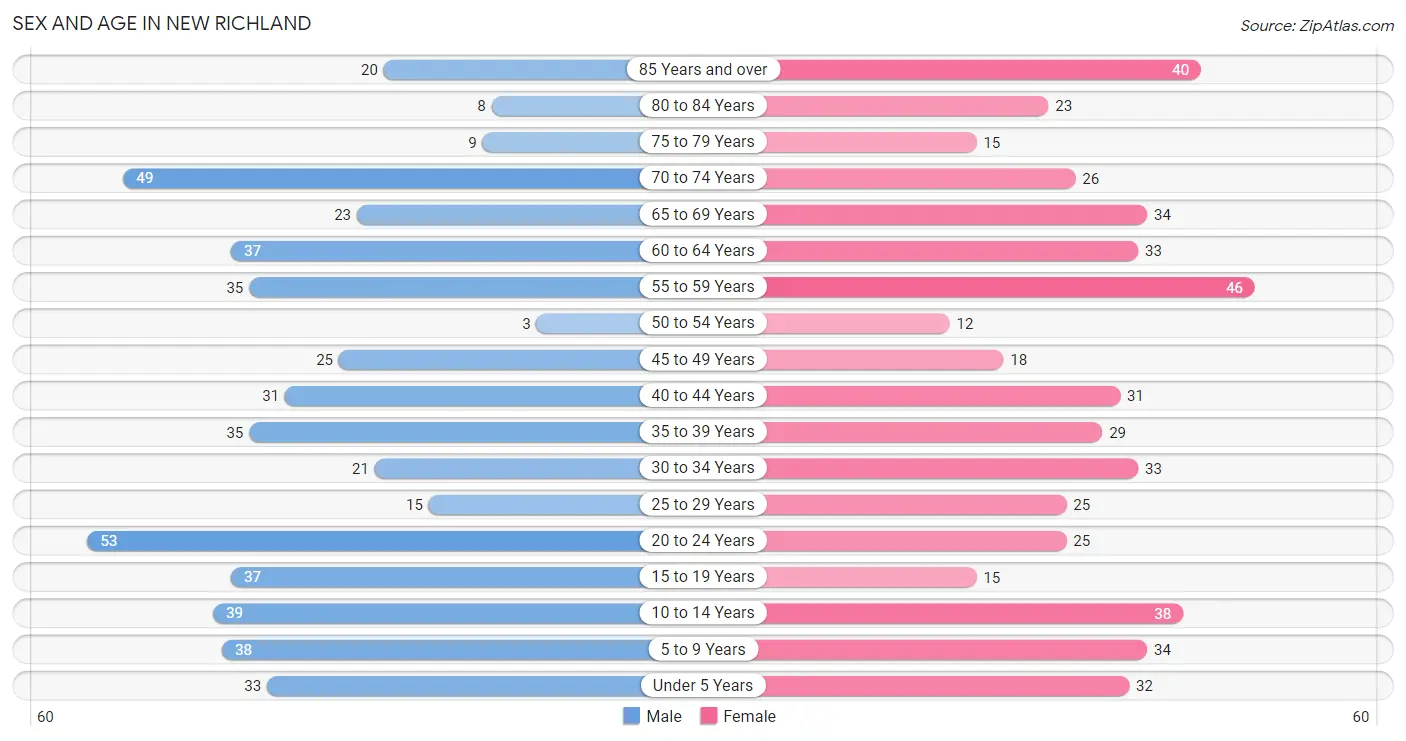
| Age Bracket | Male | Female |
| Under 5 Years | 33 (6.5%) | 32 (6.3%) |
| 5 to 9 Years | 38 (7.4%) | 34 (6.7%) |
| 10 to 14 Years | 39 (7.6%) | 38 (7.5%) |
| 15 to 19 Years | 37 (7.2%) | 15 (2.9%) |
| 20 to 24 Years | 53 (10.4%) | 25 (4.9%) |
| 25 to 29 Years | 15 (2.9%) | 25 (4.9%) |
| 30 to 34 Years | 21 (4.1%) | 33 (6.5%) |
| 35 to 39 Years | 35 (6.9%) | 29 (5.7%) |
| 40 to 44 Years | 31 (6.1%) | 31 (6.1%) |
| 45 to 49 Years | 25 (4.9%) | 18 (3.5%) |
| 50 to 54 Years | 3 (0.6%) | 12 (2.4%) |
| 55 to 59 Years | 35 (6.9%) | 46 (9.0%) |
| 60 to 64 Years | 37 (7.2%) | 33 (6.5%) |
| 65 to 69 Years | 23 (4.5%) | 34 (6.7%) |
| 70 to 74 Years | 49 (9.6%) | 26 (5.1%) |
| 75 to 79 Years | 9 (1.8%) | 15 (2.9%) |
| 80 to 84 Years | 8 (1.6%) | 23 (4.5%) |
| 85 Years and over | 20 (3.9%) | 40 (7.9%) |
| Total | 511 (100.0%) | 509 (100.0%) |
Families and Households in New Richland
Median Family Size in New Richland
The median family size in New Richland is 2.85 persons per family, with single male/father families (13 | 5.0%) accounting for the largest median family size of 3.69 persons per family. On the other hand, married-couple families (188 | 72.3%) represent the smallest median family size with 2.77 persons per family.
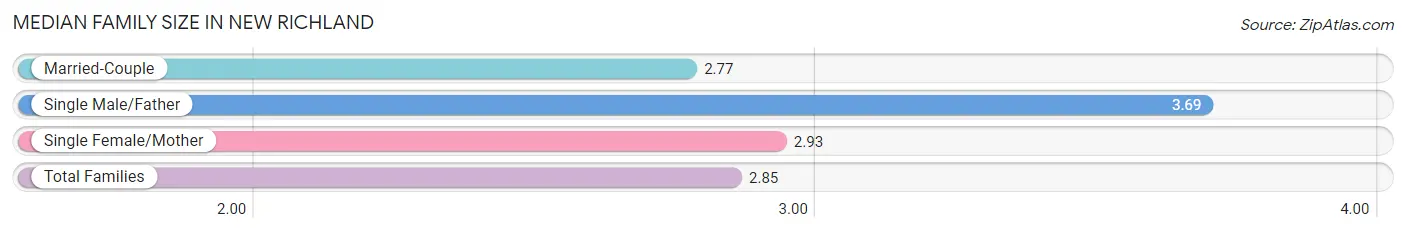
| Family Type | # Families | Family Size |
| Married-Couple | 188 (72.3%) | 2.77 |
| Single Male/Father | 13 (5.0%) | 3.69 |
| Single Female/Mother | 59 (22.7%) | 2.93 |
| Total Families | 260 (100.0%) | 2.85 |
Median Household Size in New Richland
The median household size in New Richland is 2.32 persons per household, with single male/father households (13 | 3.2%) accounting for the largest median household size of 4.54 persons per household. non-family households (146 | 36.0%) represent the smallest median household size with 1.14 persons per household.
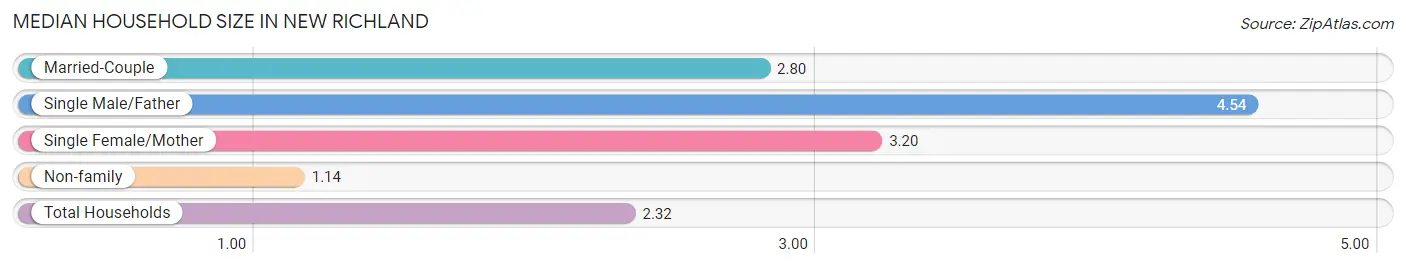
| Household Type | # Households | Household Size |
| Married-Couple | 188 (46.3%) | 2.80 |
| Single Male/Father | 13 (3.2%) | 4.54 |
| Single Female/Mother | 59 (14.5%) | 3.20 |
| Non-family | 146 (36.0%) | 1.14 |
| Total Households | 406 (100.0%) | 2.32 |
Household Size by Marriage Status in New Richland
Out of a total of 406 households in New Richland, 260 (64.0%) are family households, while 146 (36.0%) are nonfamily households. The most numerous type of family households are 2-person households, comprising 127, and the most common type of nonfamily households are 1-person households, comprising 127.
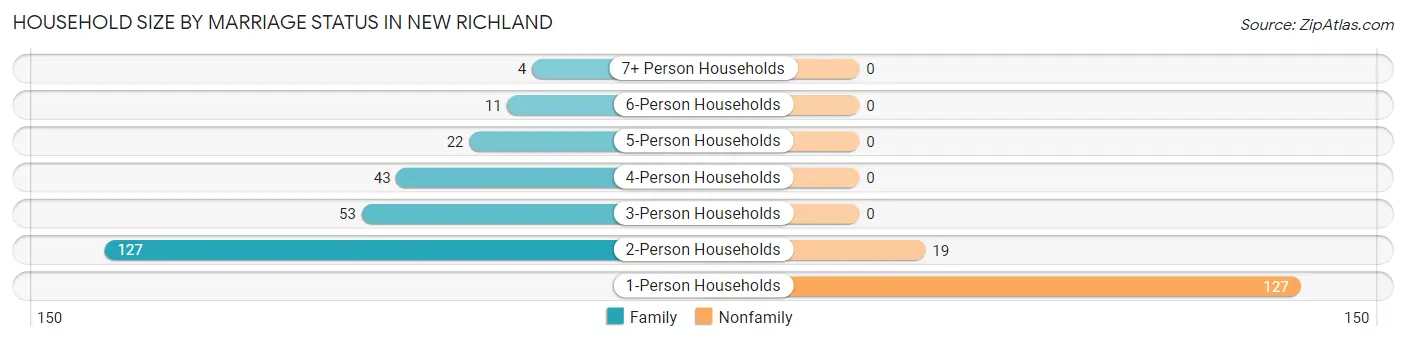
| Household Size | Family Households | Nonfamily Households |
| 1-Person Households | - | 127 (31.3%) |
| 2-Person Households | 127 (31.3%) | 19 (4.7%) |
| 3-Person Households | 53 (13.1%) | 0 (0.0%) |
| 4-Person Households | 43 (10.6%) | 0 (0.0%) |
| 5-Person Households | 22 (5.4%) | 0 (0.0%) |
| 6-Person Households | 11 (2.7%) | 0 (0.0%) |
| 7+ Person Households | 4 (1.0%) | 0 (0.0%) |
| Total | 260 (64.0%) | 146 (36.0%) |
Female Fertility in New Richland
Fertility by Age in New Richland
Average fertility rate in New Richland is 106.0 births per 1,000 women. Women in the age bracket of 20 to 34 years have the highest fertility rate with 229.0 births per 1,000 women. Women in the age bracket of 20 to 34 years acount for 100.0% of all women with births.
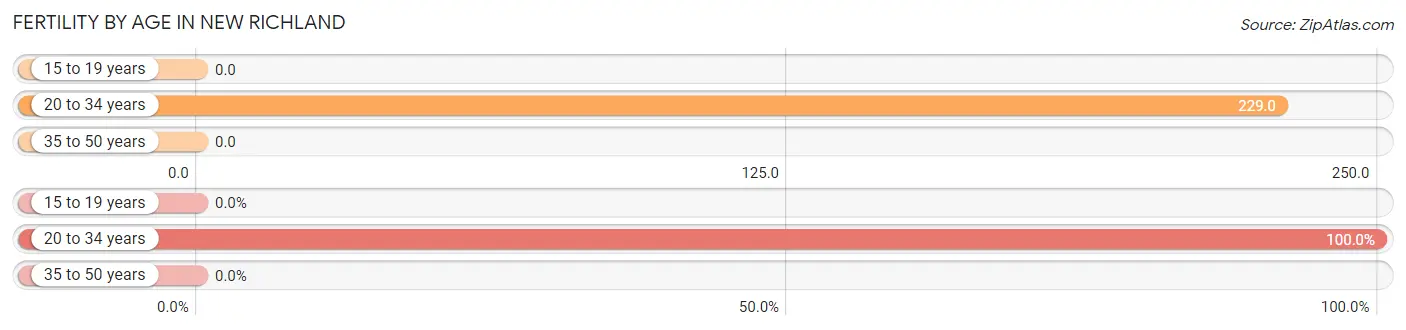
| Age Bracket | Women with Births | Births / 1,000 Women |
| 15 to 19 years | 0 (0.0%) | 0.0 |
| 20 to 34 years | 19 (100.0%) | 229.0 |
| 35 to 50 years | 0 (0.0%) | 0.0 |
| Total | 19 (100.0%) | 106.0 |
Fertility by Age by Marriage Status in New Richland
63.2% of women with births (19) in New Richland are married. The highest percentage of unmarried women with births falls into 20 to 34 years age bracket with 36.8% of them unmarried at the time of birth, while the lowest percentage of unmarried women with births belong to 20 to 34 years age bracket with 36.8% of them unmarried.
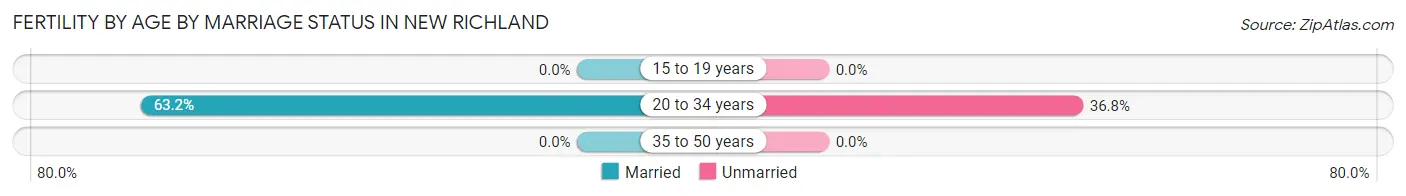
| Age Bracket | Married | Unmarried |
| 15 to 19 years | 0 (0.0%) | 0 (0.0%) |
| 20 to 34 years | 12 (63.2%) | 7 (36.8%) |
| 35 to 50 years | 0 (0.0%) | 0 (0.0%) |
| Total | 12 (63.2%) | 7 (36.8%) |
Fertility by Education in New Richland
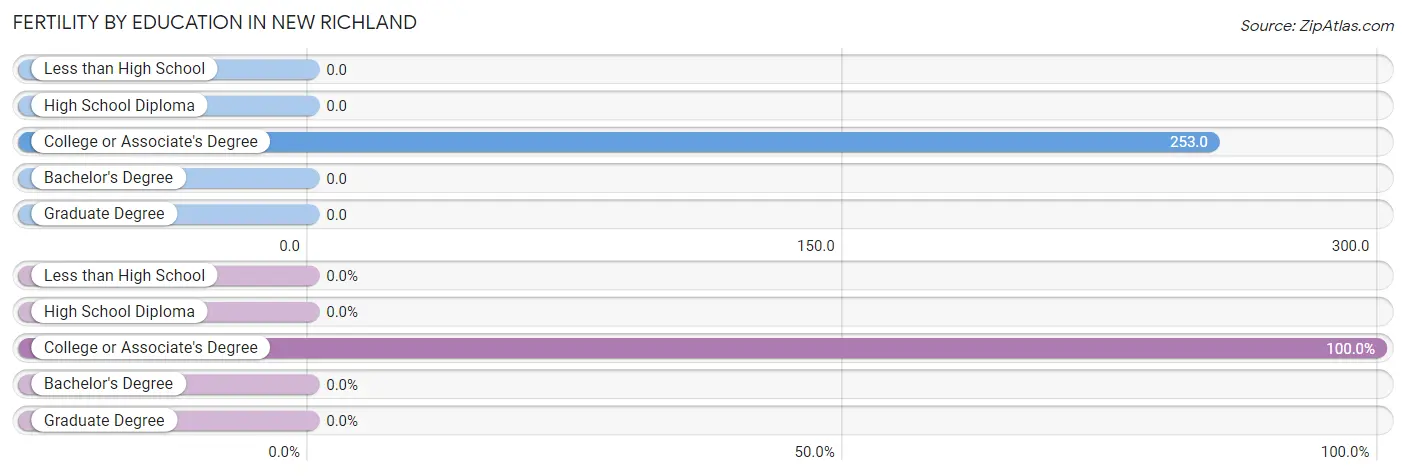
| Educational Attainment | Women with Births | Births / 1,000 Women |
| Less than High School | 0 (0.0%) | 0.0 |
| High School Diploma | 0 (0.0%) | 0.0 |
| College or Associate's Degree | 19 (100.0%) | 253.0 |
| Bachelor's Degree | 0 (0.0%) | 0.0 |
| Graduate Degree | 0 (0.0%) | 0.0 |
| Total | 19 (100.0%) | 106.0 |
Fertility by Education by Marriage Status in New Richland
36.8% of women with births in New Richland are unmarried. Women with the educational attainment of college or associate's degree are most likely to be married with 63.2% of them married at childbirth, while women with the educational attainment of college or associate's degree are least likely to be married with 36.8% of them unmarried at childbirth.
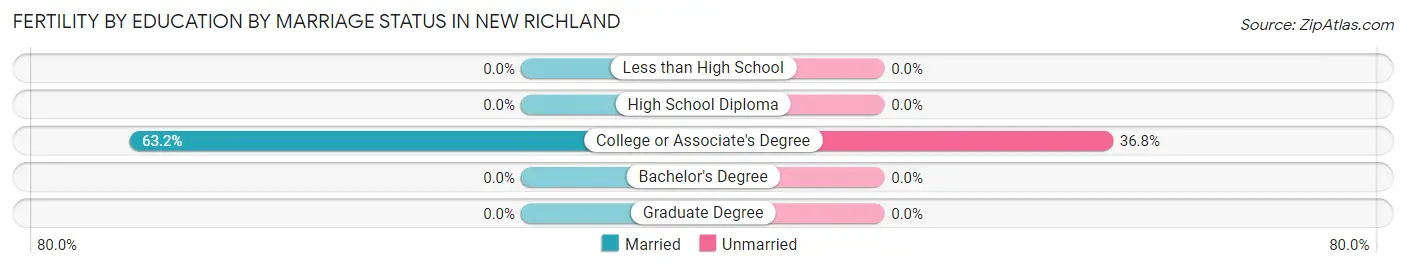
| Educational Attainment | Married | Unmarried |
| Less than High School | 0 (0.0%) | 0 (0.0%) |
| High School Diploma | 0 (0.0%) | 0 (0.0%) |
| College or Associate's Degree | 12 (63.2%) | 7 (36.8%) |
| Bachelor's Degree | 0 (0.0%) | 0 (0.0%) |
| Graduate Degree | 0 (0.0%) | 0 (0.0%) |
| Total | 12 (63.2%) | 7 (36.8%) |
Employment Characteristics in New Richland
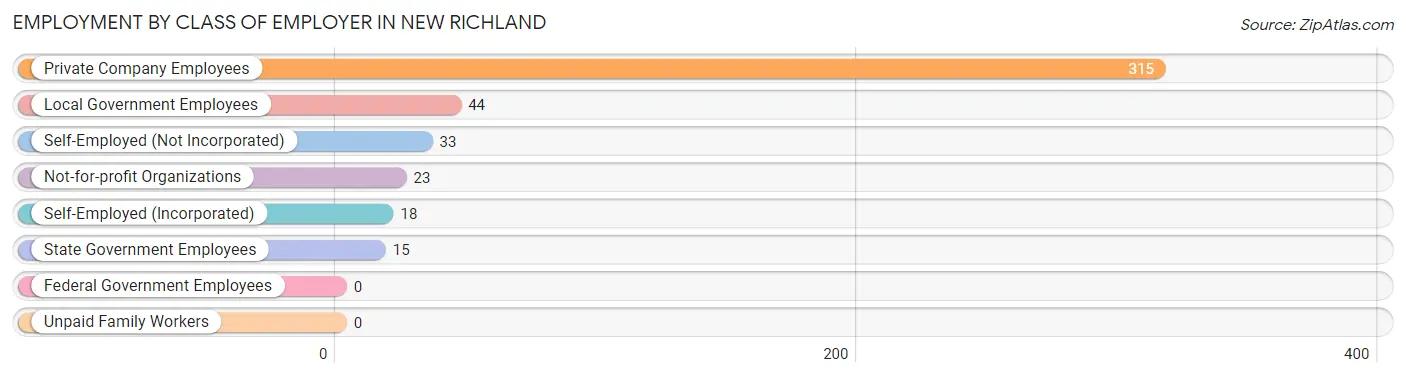
Employment by Class of Employer in New Richland
Among the 448 employed individuals in New Richland, private company employees (315 | 70.3%), local government employees (44 | 9.8%), and self-employed (not incorporated) (33 | 7.4%) make up the most common classes of employment.
| Employer Class | # Employees | % Employees |
| Private Company Employees | 315 | 70.3% |
| Self-Employed (Incorporated) | 18 | 4.0% |
| Self-Employed (Not Incorporated) | 33 | 7.4% |
| Not-for-profit Organizations | 23 | 5.1% |
| Local Government Employees | 44 | 9.8% |
| State Government Employees | 15 | 3.4% |
| Federal Government Employees | 0 | 0.0% |
| Unpaid Family Workers | 0 | 0.0% |
| Total | 448 | 100.0% |
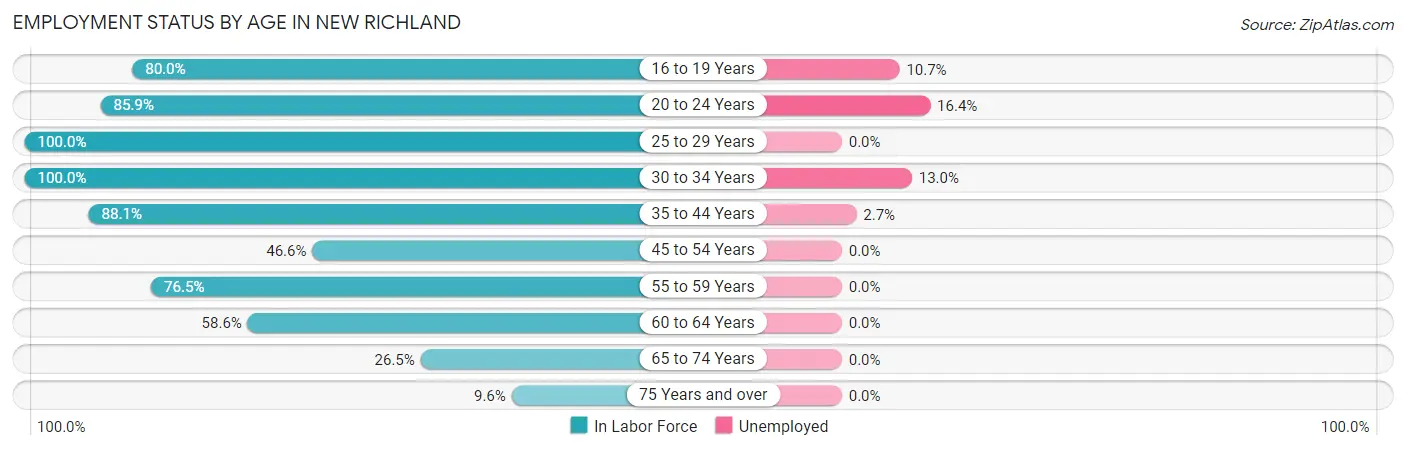
Employment Status by Age in New Richland
According to the labor force statistics for New Richland, out of the total population over 16 years of age (789), 60.3% or 476 individuals are in the labor force, with 5.0% or 24 of them unemployed. The age group with the highest labor force participation rate is 25 to 29 years, with 100.0% or 40 individuals in the labor force. Within the labor force, the 20 to 24 years age range has the highest percentage of unemployed individuals, with 16.4% or 11 of them being unemployed.
| Age Bracket | In Labor Force | Unemployed |
| 16 to 19 Years | 28 (80.0%) | 3 (10.7%) |
| 20 to 24 Years | 67 (85.9%) | 11 (16.4%) |
| 25 to 29 Years | 40 (100.0%) | 0 (0.0%) |
| 30 to 34 Years | 54 (100.0%) | 7 (13.0%) |
| 35 to 44 Years | 111 (88.1%) | 3 (2.7%) |
| 45 to 54 Years | 27 (46.6%) | 0 (0.0%) |
| 55 to 59 Years | 62 (76.5%) | 0 (0.0%) |
| 60 to 64 Years | 41 (58.6%) | 0 (0.0%) |
| 65 to 74 Years | 35 (26.5%) | 0 (0.0%) |
| 75 Years and over | 11 (9.6%) | 0 (0.0%) |
| Total | 476 (60.3%) | 24 (5.0%) |
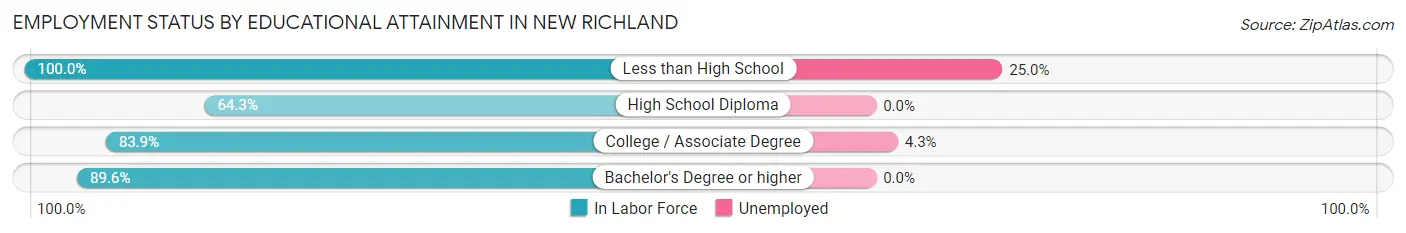
Employment Status by Educational Attainment in New Richland
According to labor force statistics for New Richland, 78.1% of individuals (335) out of the total population between 25 and 64 years of age (429) are in the labor force, with 3.0% or 10 of them being unemployed. The group with the highest labor force participation rate are those with the educational attainment of less than high school, with 100.0% or 12 individuals in the labor force. Within the labor force, individuals with less than high school education have the highest percentage of unemployment, with 25.0% or 3 of them being unemployed.
| Educational Attainment | In Labor Force | Unemployed |
| Less than High School | 12 (100.0%) | 3 (25.0%) |
| High School Diploma | 101 (64.3%) | 0 (0.0%) |
| College / Associate Degree | 162 (83.9%) | 8 (4.3%) |
| Bachelor's Degree or higher | 60 (89.6%) | 0 (0.0%) |
| Total | 335 (78.1%) | 13 (3.0%) |
Employment Occupations by Sex in New Richland
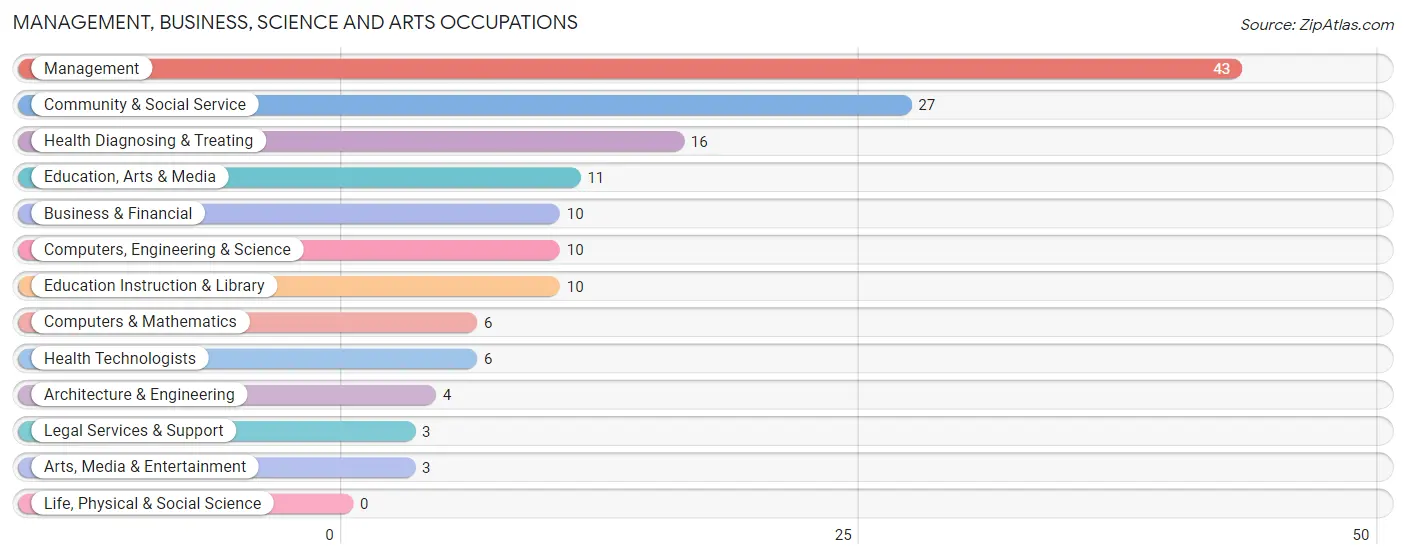
Management, Business, Science and Arts Occupations
The most common Management, Business, Science and Arts occupations in New Richland are Management (43 | 9.5%), Community & Social Service (27 | 6.0%), Health Diagnosing & Treating (16 | 3.5%), Education, Arts & Media (11 | 2.4%), and Business & Financial (10 | 2.2%).
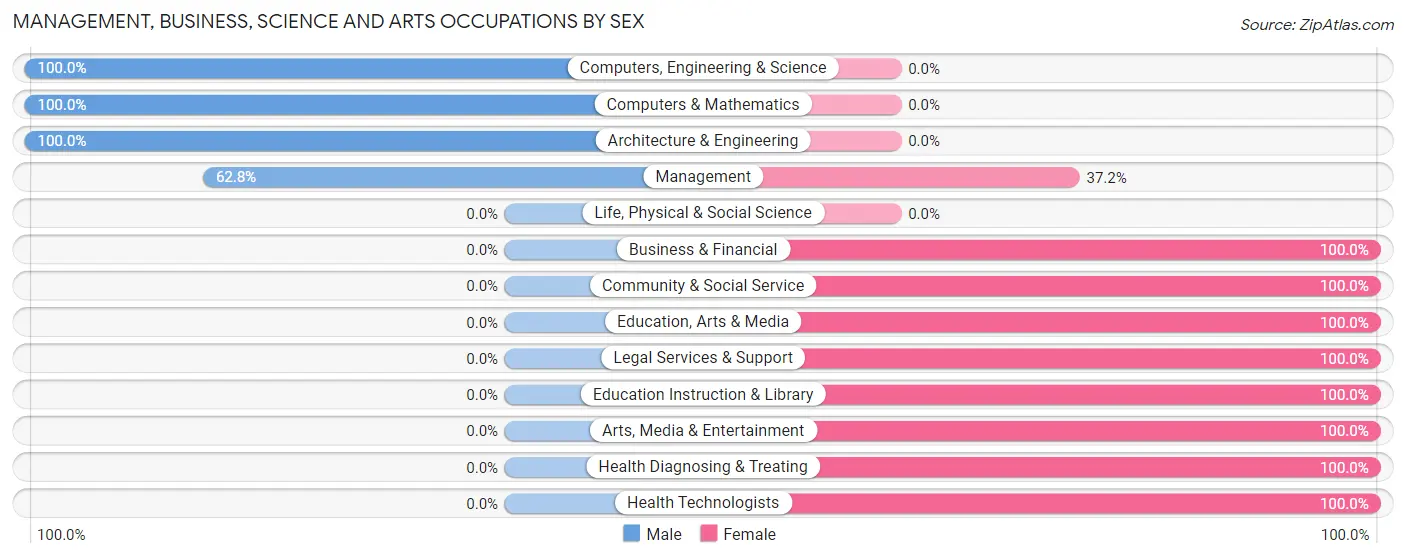
Management, Business, Science and Arts Occupations by Sex
Within the Management, Business, Science and Arts occupations in New Richland, the most male-oriented occupations are Computers, Engineering & Science (100.0%), Computers & Mathematics (100.0%), and Architecture & Engineering (100.0%), while the most female-oriented occupations are Business & Financial (100.0%), Community & Social Service (100.0%), and Education, Arts & Media (100.0%).
| Occupation | Male | Female |
| Management | 27 (62.8%) | 16 (37.2%) |
| Business & Financial | 0 (0.0%) | 10 (100.0%) |
| Computers, Engineering & Science | 10 (100.0%) | 0 (0.0%) |
| Computers & Mathematics | 6 (100.0%) | 0 (0.0%) |
| Architecture & Engineering | 4 (100.0%) | 0 (0.0%) |
| Life, Physical & Social Science | 0 (0.0%) | 0 (0.0%) |
| Community & Social Service | 0 (0.0%) | 27 (100.0%) |
| Education, Arts & Media | 0 (0.0%) | 11 (100.0%) |
| Legal Services & Support | 0 (0.0%) | 3 (100.0%) |
| Education Instruction & Library | 0 (0.0%) | 10 (100.0%) |
| Arts, Media & Entertainment | 0 (0.0%) | 3 (100.0%) |
| Health Diagnosing & Treating | 0 (0.0%) | 16 (100.0%) |
| Health Technologists | 0 (0.0%) | 6 (100.0%) |
| Total (Category) | 37 (34.9%) | 69 (65.1%) |
| Total (Overall) | 251 (55.5%) | 201 (44.5%) |
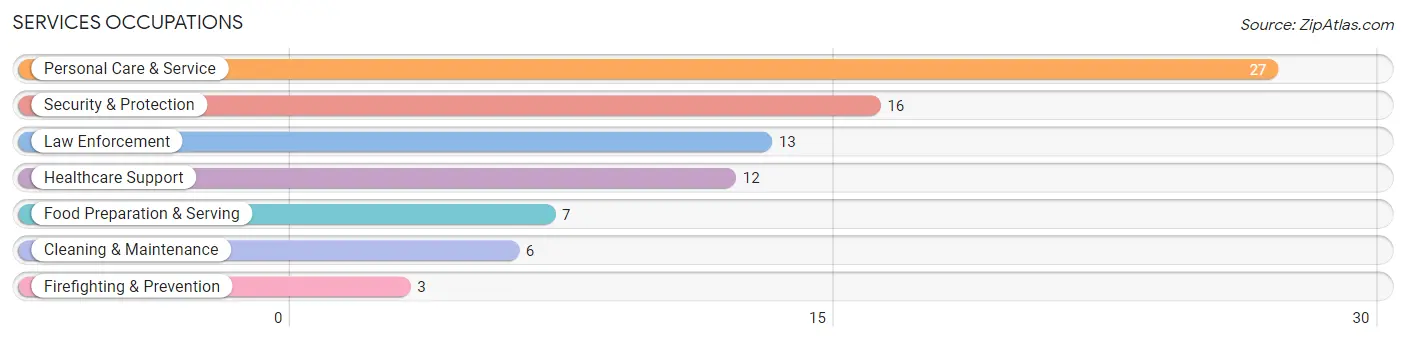
Services Occupations
The most common Services occupations in New Richland are Personal Care & Service (27 | 6.0%), Security & Protection (16 | 3.5%), Law Enforcement (13 | 2.9%), Healthcare Support (12 | 2.6%), and Food Preparation & Serving (7 | 1.5%).
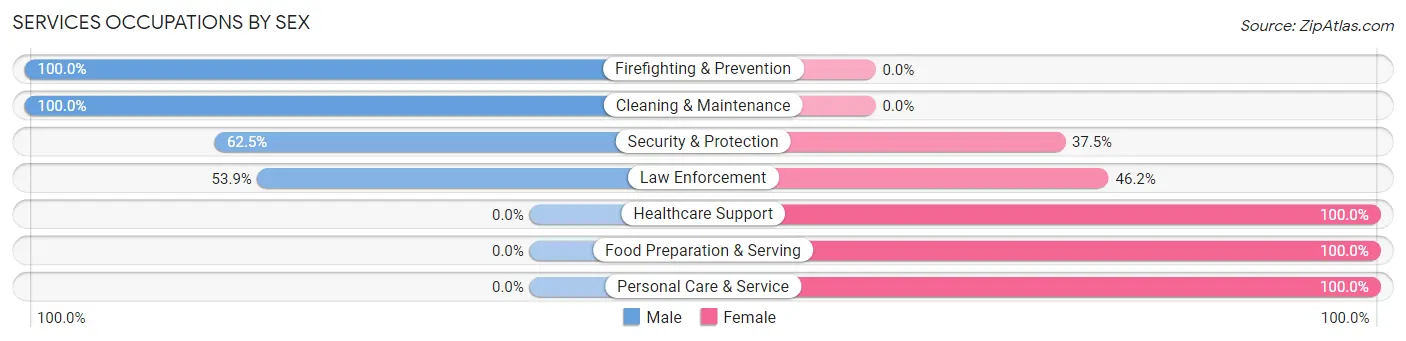
Services Occupations by Sex
Within the Services occupations in New Richland, the most male-oriented occupations are Firefighting & Prevention (100.0%), Cleaning & Maintenance (100.0%), and Security & Protection (62.5%), while the most female-oriented occupations are Healthcare Support (100.0%), Food Preparation & Serving (100.0%), and Personal Care & Service (100.0%).
| Occupation | Male | Female |
| Healthcare Support | 0 (0.0%) | 12 (100.0%) |
| Security & Protection | 10 (62.5%) | 6 (37.5%) |
| Firefighting & Prevention | 3 (100.0%) | 0 (0.0%) |
| Law Enforcement | 7 (53.8%) | 6 (46.2%) |
| Food Preparation & Serving | 0 (0.0%) | 7 (100.0%) |
| Cleaning & Maintenance | 6 (100.0%) | 0 (0.0%) |
| Personal Care & Service | 0 (0.0%) | 27 (100.0%) |
| Total (Category) | 16 (23.5%) | 52 (76.5%) |
| Total (Overall) | 251 (55.5%) | 201 (44.5%) |
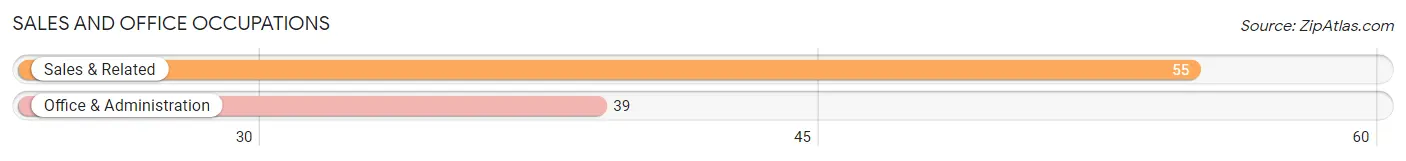
Sales and Office Occupations
The most common Sales and Office occupations in New Richland are Sales & Related (55 | 12.2%), and Office & Administration (39 | 8.6%).
Sales and Office Occupations by Sex
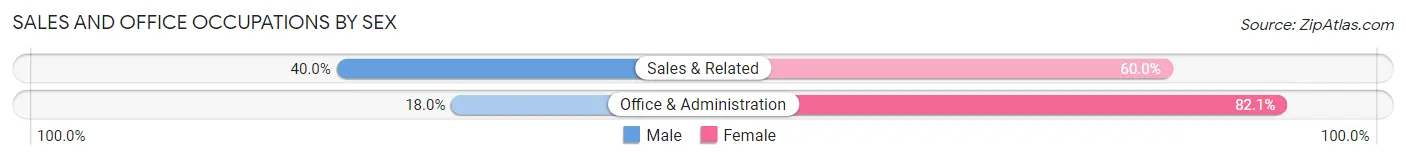
| Occupation | Male | Female |
| Sales & Related | 22 (40.0%) | 33 (60.0%) |
| Office & Administration | 7 (17.9%) | 32 (82.1%) |
| Total (Category) | 29 (30.8%) | 65 (69.2%) |
| Total (Overall) | 251 (55.5%) | 201 (44.5%) |
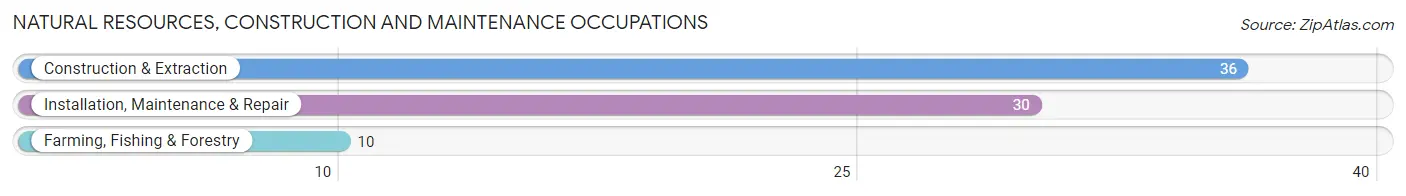
Natural Resources, Construction and Maintenance Occupations
The most common Natural Resources, Construction and Maintenance occupations in New Richland are Construction & Extraction (36 | 8.0%), Installation, Maintenance & Repair (30 | 6.6%), and Farming, Fishing & Forestry (10 | 2.2%).
Natural Resources, Construction and Maintenance Occupations by Sex
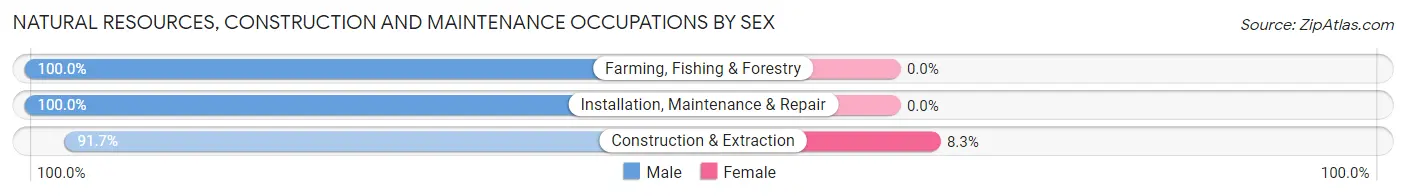
| Occupation | Male | Female |
| Farming, Fishing & Forestry | 10 (100.0%) | 0 (0.0%) |
| Construction & Extraction | 33 (91.7%) | 3 (8.3%) |
| Installation, Maintenance & Repair | 30 (100.0%) | 0 (0.0%) |
| Total (Category) | 73 (96.1%) | 3 (4.0%) |
| Total (Overall) | 251 (55.5%) | 201 (44.5%) |
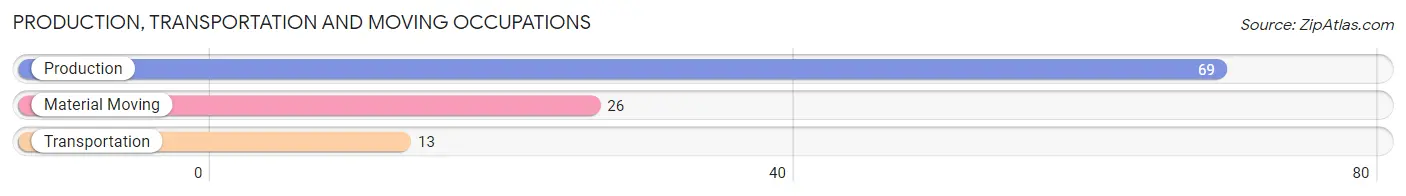
Production, Transportation and Moving Occupations
The most common Production, Transportation and Moving occupations in New Richland are Production (69 | 15.3%), Material Moving (26 | 5.8%), and Transportation (13 | 2.9%).
Production, Transportation and Moving Occupations by Sex
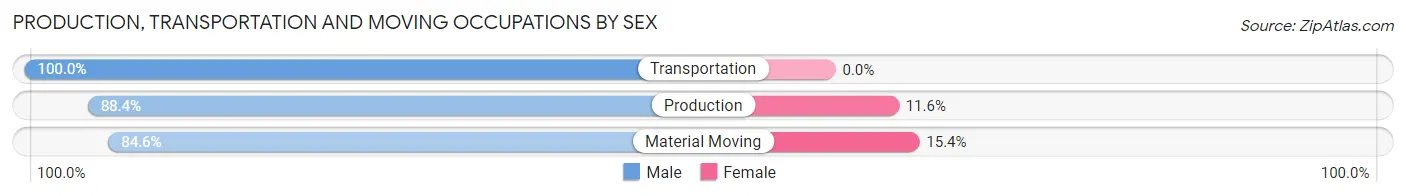
| Occupation | Male | Female |
| Production | 61 (88.4%) | 8 (11.6%) |
| Transportation | 13 (100.0%) | 0 (0.0%) |
| Material Moving | 22 (84.6%) | 4 (15.4%) |
| Total (Category) | 96 (88.9%) | 12 (11.1%) |
| Total (Overall) | 251 (55.5%) | 201 (44.5%) |
Employment Industries by Sex in New Richland
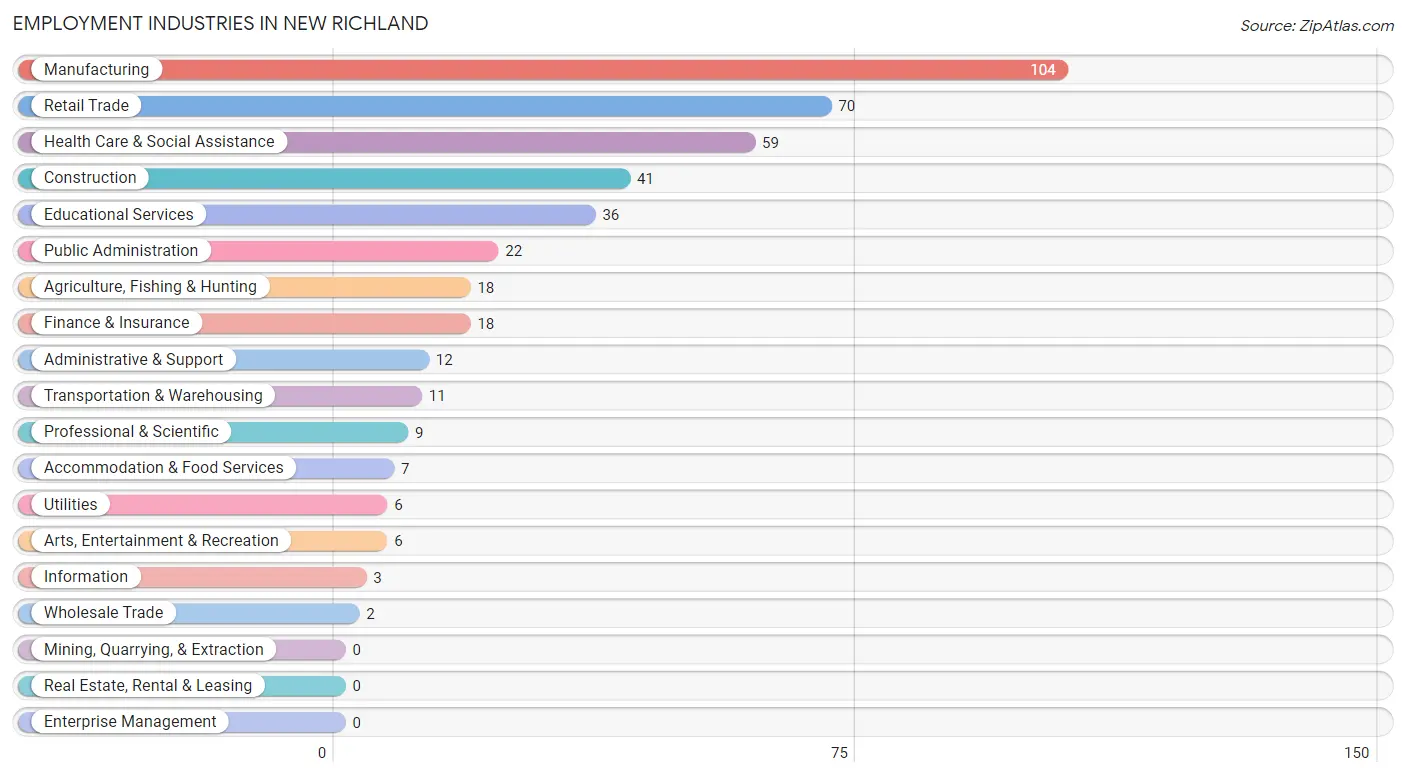
Employment Industries in New Richland
The major employment industries in New Richland include Manufacturing (104 | 23.0%), Retail Trade (70 | 15.5%), Health Care & Social Assistance (59 | 13.1%), Construction (41 | 9.1%), and Educational Services (36 | 8.0%).
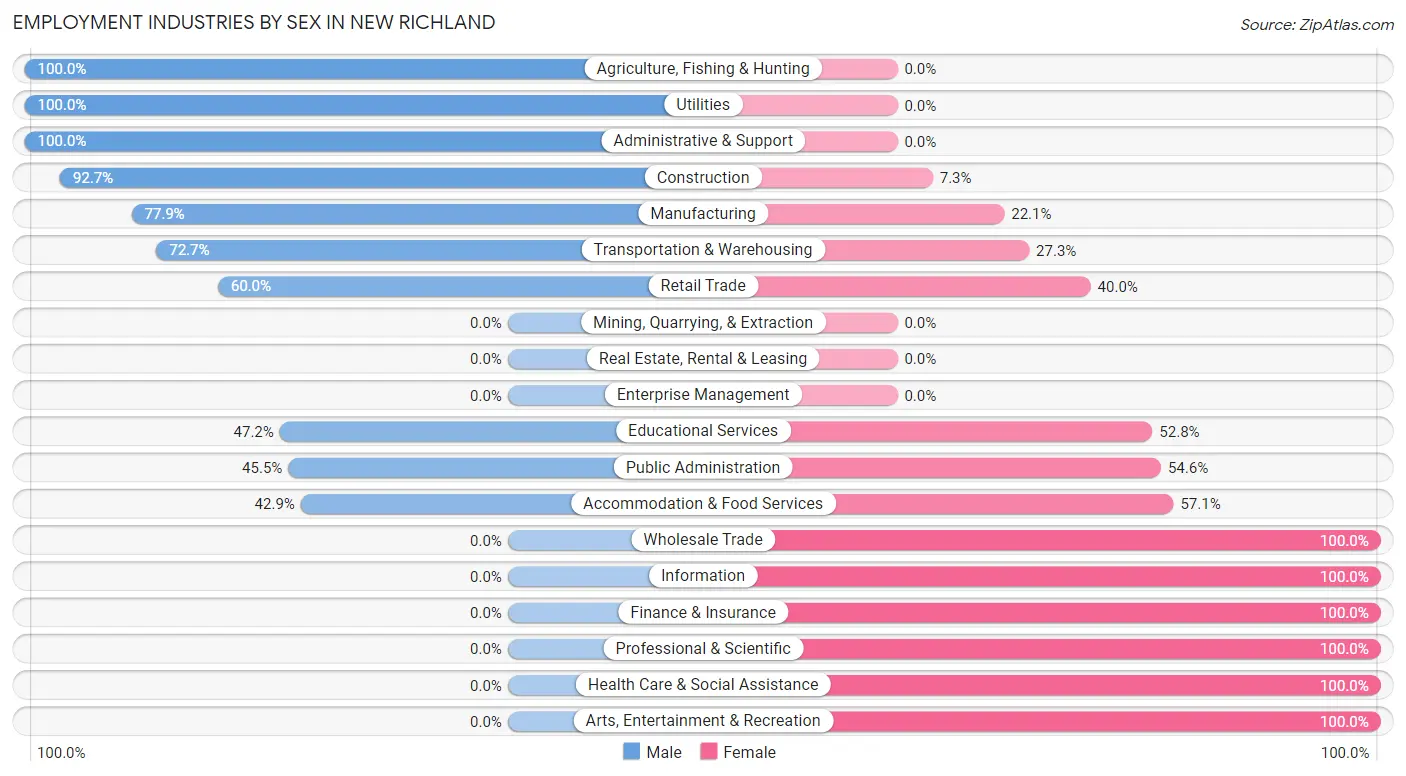
Employment Industries by Sex in New Richland
The New Richland industries that see more men than women are Agriculture, Fishing & Hunting (100.0%), Utilities (100.0%), and Administrative & Support (100.0%), whereas the industries that tend to have a higher number of women are Wholesale Trade (100.0%), Information (100.0%), and Finance & Insurance (100.0%).
| Industry | Male | Female |
| Agriculture, Fishing & Hunting | 18 (100.0%) | 0 (0.0%) |
| Mining, Quarrying, & Extraction | 0 (0.0%) | 0 (0.0%) |
| Construction | 38 (92.7%) | 3 (7.3%) |
| Manufacturing | 81 (77.9%) | 23 (22.1%) |
| Wholesale Trade | 0 (0.0%) | 2 (100.0%) |
| Retail Trade | 42 (60.0%) | 28 (40.0%) |
| Transportation & Warehousing | 8 (72.7%) | 3 (27.3%) |
| Utilities | 6 (100.0%) | 0 (0.0%) |
| Information | 0 (0.0%) | 3 (100.0%) |
| Finance & Insurance | 0 (0.0%) | 18 (100.0%) |
| Real Estate, Rental & Leasing | 0 (0.0%) | 0 (0.0%) |
| Professional & Scientific | 0 (0.0%) | 9 (100.0%) |
| Enterprise Management | 0 (0.0%) | 0 (0.0%) |
| Administrative & Support | 12 (100.0%) | 0 (0.0%) |
| Educational Services | 17 (47.2%) | 19 (52.8%) |
| Health Care & Social Assistance | 0 (0.0%) | 59 (100.0%) |
| Arts, Entertainment & Recreation | 0 (0.0%) | 6 (100.0%) |
| Accommodation & Food Services | 3 (42.9%) | 4 (57.1%) |
| Public Administration | 10 (45.5%) | 12 (54.5%) |
| Total | 251 (55.5%) | 201 (44.5%) |
Education in New Richland
School Enrollment in New Richland
The most common levels of schooling among the 235 students in New Richland are middle school (63 | 26.8%), elementary school (62 | 26.4%), and high school (48 | 20.4%).
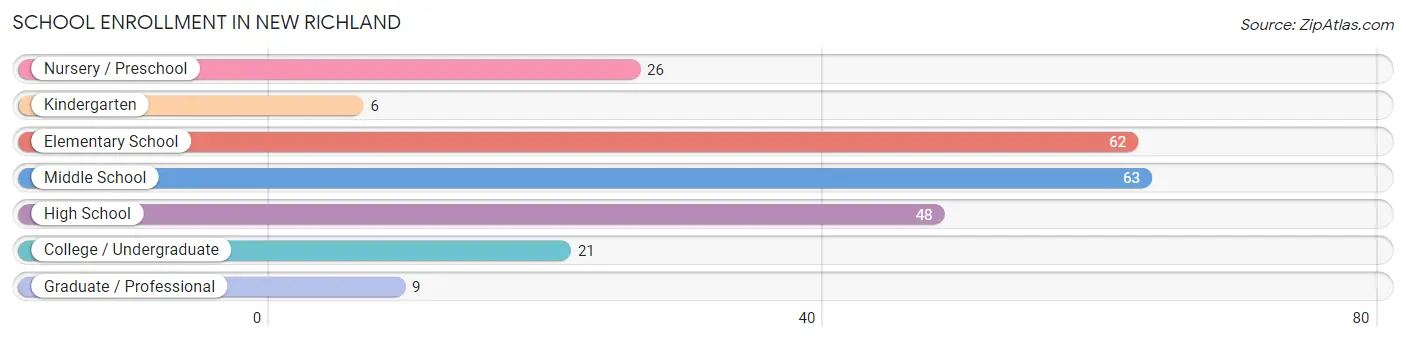
| School Level | # Students | % Students |
| Nursery / Preschool | 26 | 11.1% |
| Kindergarten | 6 | 2.5% |
| Elementary School | 62 | 26.4% |
| Middle School | 63 | 26.8% |
| High School | 48 | 20.4% |
| College / Undergraduate | 21 | 8.9% |
| Graduate / Professional | 9 | 3.8% |
| Total | 235 | 100.0% |
School Enrollment by Age by Funding Source in New Richland
Out of a total of 235 students who are enrolled in schools in New Richland, 16 (6.8%) attend a private institution, while the remaining 219 (93.2%) are enrolled in public schools. The age group of 18 to 19 year olds has the highest likelihood of being enrolled in private schools, with 3 (18.8% in the age bracket) enrolled. Conversely, the age group of 20 to 24 year olds has the lowest likelihood of being enrolled in a private school, with 10 (100.0% in the age bracket) attending a public institution.
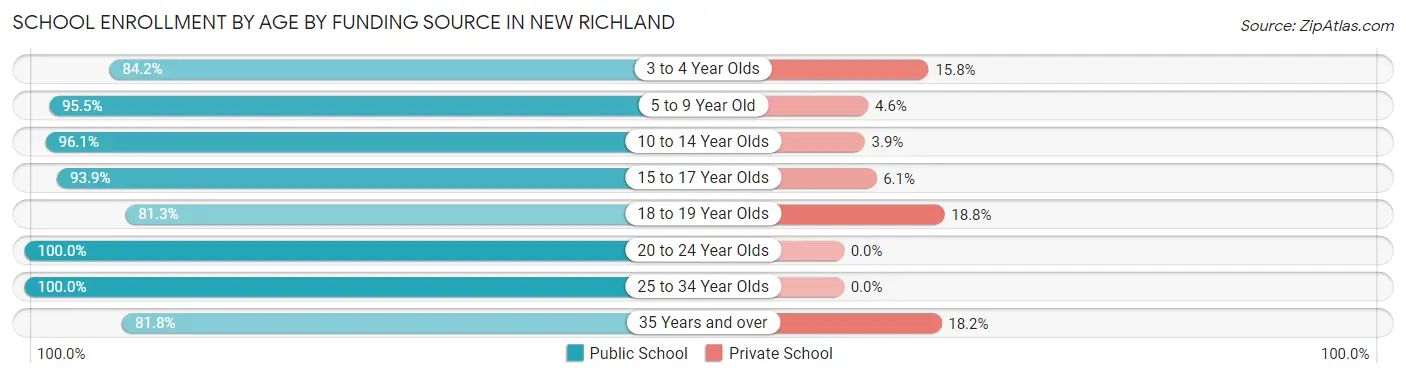
| Age Bracket | Public School | Private School |
| 3 to 4 Year Olds | 16 (84.2%) | 3 (15.8%) |
| 5 to 9 Year Old | 63 (95.5%) | 3 (4.5%) |
| 10 to 14 Year Olds | 74 (96.1%) | 3 (3.9%) |
| 15 to 17 Year Olds | 31 (93.9%) | 2 (6.1%) |
| 18 to 19 Year Olds | 13 (81.2%) | 3 (18.8%) |
| 20 to 24 Year Olds | 10 (100.0%) | 0 (0.0%) |
| 25 to 34 Year Olds | 3 (100.0%) | 0 (0.0%) |
| 35 Years and over | 9 (81.8%) | 2 (18.2%) |
| Total | 219 (93.2%) | 16 (6.8%) |
Educational Attainment by Field of Study in New Richland
Education (33 | 30.8%), business (17 | 15.9%), social sciences (10 | 9.3%), science & technology (10 | 9.3%), and communications (9 | 8.4%) are the most common fields of study among 107 individuals in New Richland who have obtained a bachelor's degree or higher.
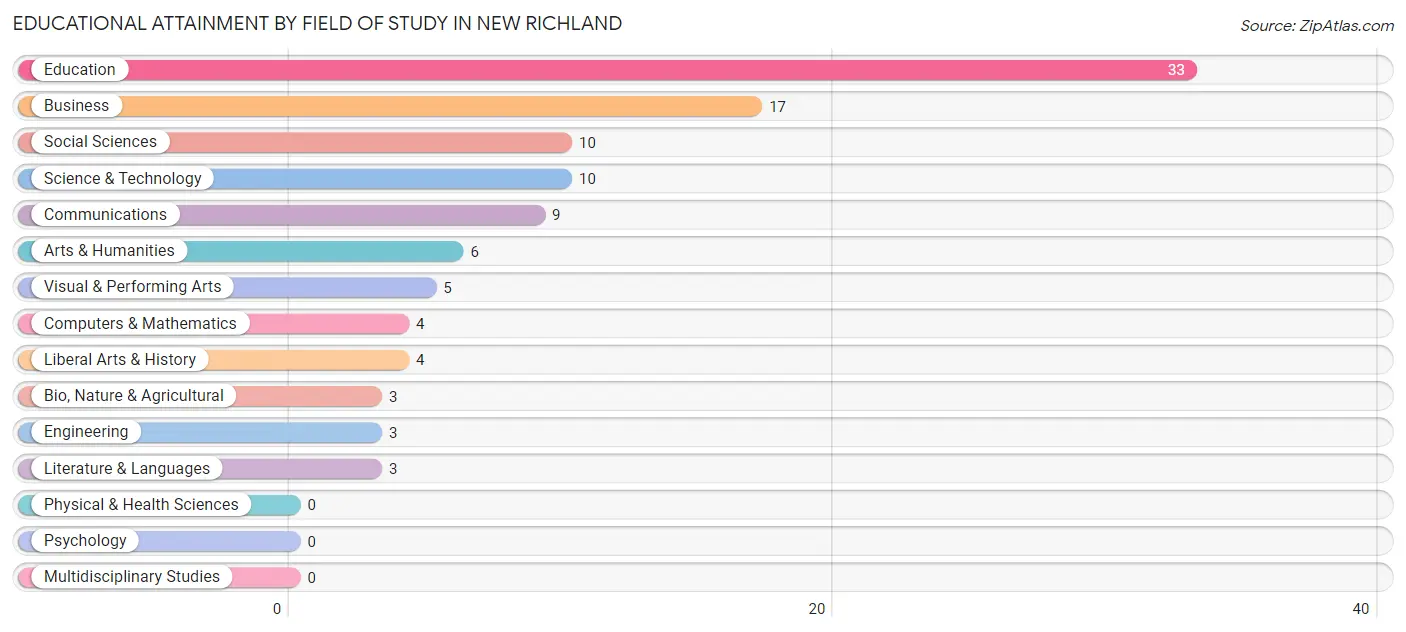
| Field of Study | # Graduates | % Graduates |
| Computers & Mathematics | 4 | 3.7% |
| Bio, Nature & Agricultural | 3 | 2.8% |
| Physical & Health Sciences | 0 | 0.0% |
| Psychology | 0 | 0.0% |
| Social Sciences | 10 | 9.3% |
| Engineering | 3 | 2.8% |
| Multidisciplinary Studies | 0 | 0.0% |
| Science & Technology | 10 | 9.3% |
| Business | 17 | 15.9% |
| Education | 33 | 30.8% |
| Literature & Languages | 3 | 2.8% |
| Liberal Arts & History | 4 | 3.7% |
| Visual & Performing Arts | 5 | 4.7% |
| Communications | 9 | 8.4% |
| Arts & Humanities | 6 | 5.6% |
| Total | 107 | 100.0% |
Transportation & Commute in New Richland
Vehicle Availability by Sex in New Richland
The most prevalent vehicle ownership categories in New Richland are males with 2 vehicles (80, accounting for 32.4%) and females with 2 vehicles (85, making up 39.8%).
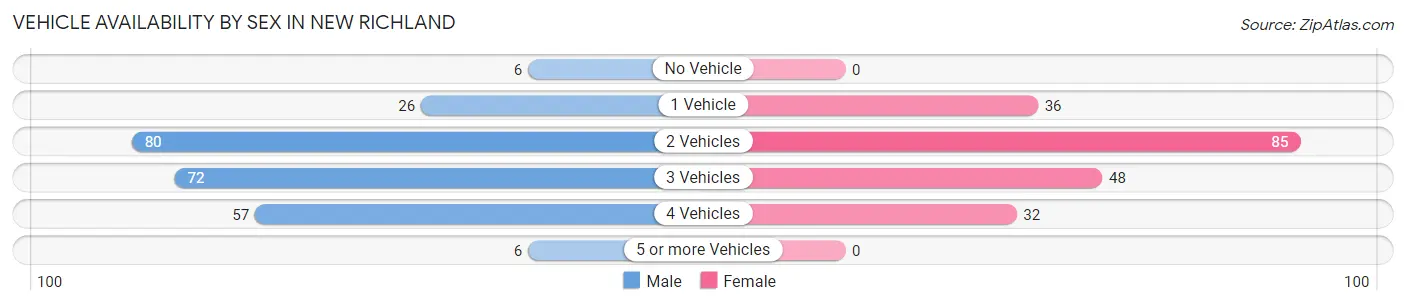
| Vehicles Available | Male | Female |
| No Vehicle | 6 (2.4%) | 0 (0.0%) |
| 1 Vehicle | 26 (10.5%) | 36 (17.9%) |
| 2 Vehicles | 80 (32.4%) | 85 (42.3%) |
| 3 Vehicles | 72 (29.1%) | 48 (23.9%) |
| 4 Vehicles | 57 (23.1%) | 32 (15.9%) |
| 5 or more Vehicles | 6 (2.4%) | 0 (0.0%) |
| Total | 247 (100.0%) | 201 (100.0%) |
Commute Time in New Richland
The most frequently occuring commute durations in New Richland are 30 to 34 minutes (110 commuters, 26.0%), less than 5 minutes (56 commuters, 13.2%), and 25 to 29 minutes (49 commuters, 11.6%).
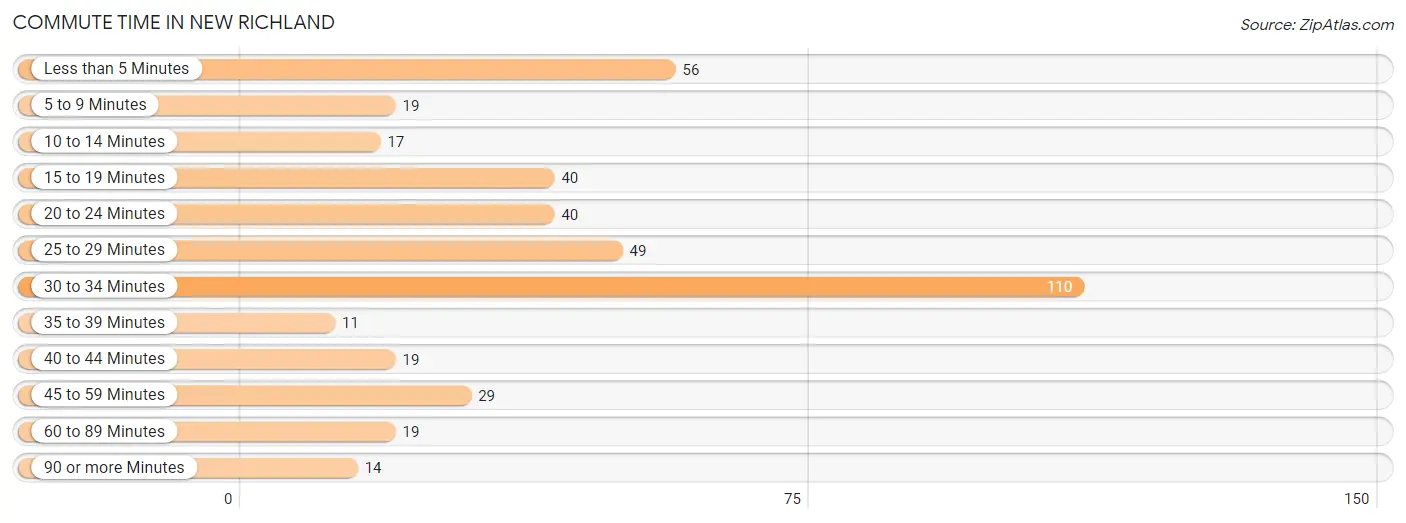
| Commute Time | # Commuters | % Commuters |
| Less than 5 Minutes | 56 | 13.2% |
| 5 to 9 Minutes | 19 | 4.5% |
| 10 to 14 Minutes | 17 | 4.0% |
| 15 to 19 Minutes | 40 | 9.5% |
| 20 to 24 Minutes | 40 | 9.5% |
| 25 to 29 Minutes | 49 | 11.6% |
| 30 to 34 Minutes | 110 | 26.0% |
| 35 to 39 Minutes | 11 | 2.6% |
| 40 to 44 Minutes | 19 | 4.5% |
| 45 to 59 Minutes | 29 | 6.9% |
| 60 to 89 Minutes | 19 | 4.5% |
| 90 or more Minutes | 14 | 3.3% |
Commute Time by Sex in New Richland
The most common commute times in New Richland are 30 to 34 minutes (69 commuters, 28.3%) for males and 30 to 34 minutes (41 commuters, 22.9%) for females.
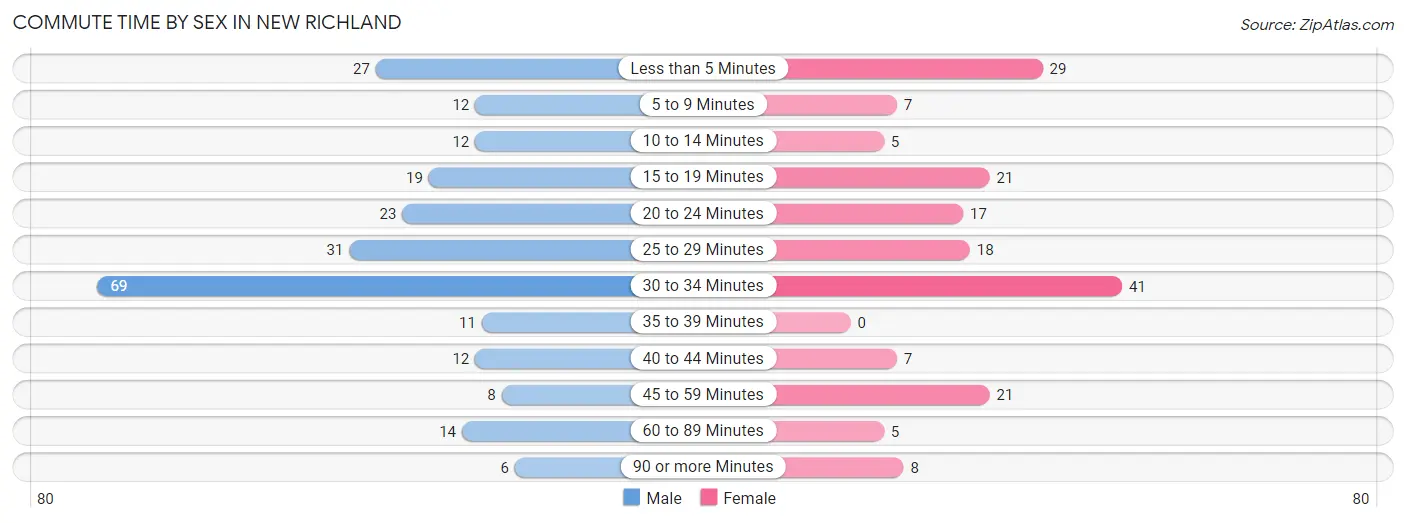
| Commute Time | Male | Female |
| Less than 5 Minutes | 27 (11.1%) | 29 (16.2%) |
| 5 to 9 Minutes | 12 (4.9%) | 7 (3.9%) |
| 10 to 14 Minutes | 12 (4.9%) | 5 (2.8%) |
| 15 to 19 Minutes | 19 (7.8%) | 21 (11.7%) |
| 20 to 24 Minutes | 23 (9.4%) | 17 (9.5%) |
| 25 to 29 Minutes | 31 (12.7%) | 18 (10.1%) |
| 30 to 34 Minutes | 69 (28.3%) | 41 (22.9%) |
| 35 to 39 Minutes | 11 (4.5%) | 0 (0.0%) |
| 40 to 44 Minutes | 12 (4.9%) | 7 (3.9%) |
| 45 to 59 Minutes | 8 (3.3%) | 21 (11.7%) |
| 60 to 89 Minutes | 14 (5.7%) | 5 (2.8%) |
| 90 or more Minutes | 6 (2.5%) | 8 (4.5%) |
Time of Departure to Work by Sex in New Richland
The most frequent times of departure to work in New Richland are 7:30 AM to 7:59 AM (46, 18.9%) for males and 7:30 AM to 7:59 AM (41, 22.9%) for females.
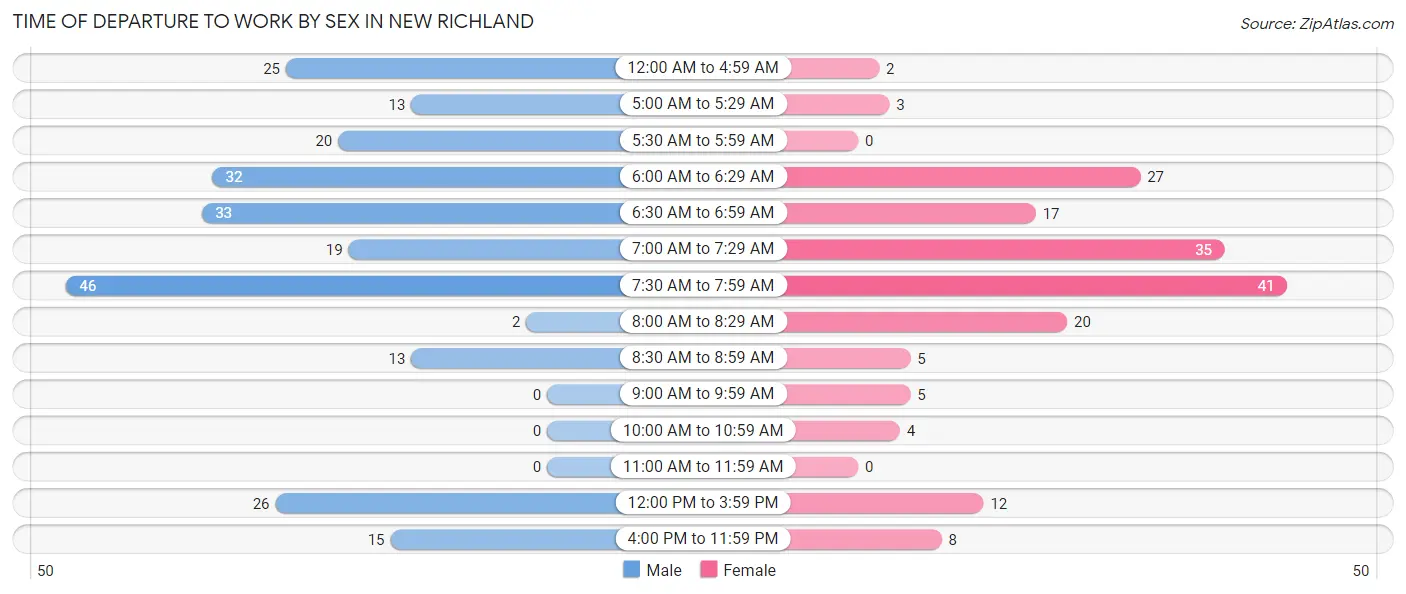
| Time of Departure | Male | Female |
| 12:00 AM to 4:59 AM | 25 (10.2%) | 2 (1.1%) |
| 5:00 AM to 5:29 AM | 13 (5.3%) | 3 (1.7%) |
| 5:30 AM to 5:59 AM | 20 (8.2%) | 0 (0.0%) |
| 6:00 AM to 6:29 AM | 32 (13.1%) | 27 (15.1%) |
| 6:30 AM to 6:59 AM | 33 (13.5%) | 17 (9.5%) |
| 7:00 AM to 7:29 AM | 19 (7.8%) | 35 (19.6%) |
| 7:30 AM to 7:59 AM | 46 (18.9%) | 41 (22.9%) |
| 8:00 AM to 8:29 AM | 2 (0.8%) | 20 (11.2%) |
| 8:30 AM to 8:59 AM | 13 (5.3%) | 5 (2.8%) |
| 9:00 AM to 9:59 AM | 0 (0.0%) | 5 (2.8%) |
| 10:00 AM to 10:59 AM | 0 (0.0%) | 4 (2.2%) |
| 11:00 AM to 11:59 AM | 0 (0.0%) | 0 (0.0%) |
| 12:00 PM to 3:59 PM | 26 (10.7%) | 12 (6.7%) |
| 4:00 PM to 11:59 PM | 15 (6.1%) | 8 (4.5%) |
| Total | 244 (100.0%) | 179 (100.0%) |
Housing Occupancy in New Richland
Occupancy by Ownership in New Richland
Of the total 406 dwellings in New Richland, owner-occupied units account for 319 (78.6%), while renter-occupied units make up 87 (21.4%).
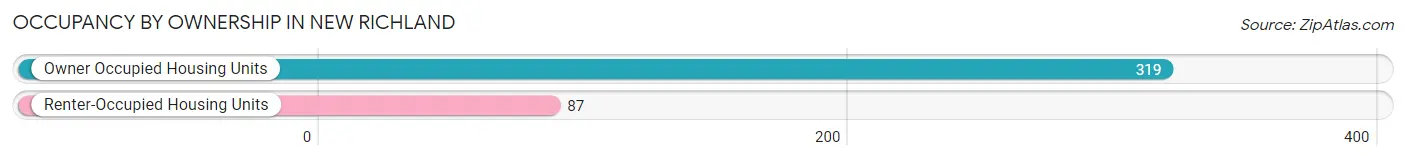
| Occupancy | # Housing Units | % Housing Units |
| Owner Occupied Housing Units | 319 | 78.6% |
| Renter-Occupied Housing Units | 87 | 21.4% |
| Total Occupied Housing Units | 406 | 100.0% |
Occupancy by Household Size in New Richland
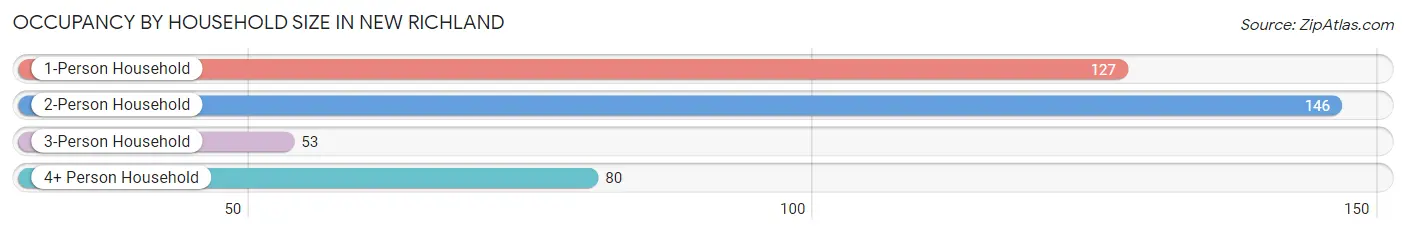
| Household Size | # Housing Units | % Housing Units |
| 1-Person Household | 127 | 31.3% |
| 2-Person Household | 146 | 36.0% |
| 3-Person Household | 53 | 13.1% |
| 4+ Person Household | 80 | 19.7% |
| Total Housing Units | 406 | 100.0% |
Occupancy by Ownership by Household Size in New Richland
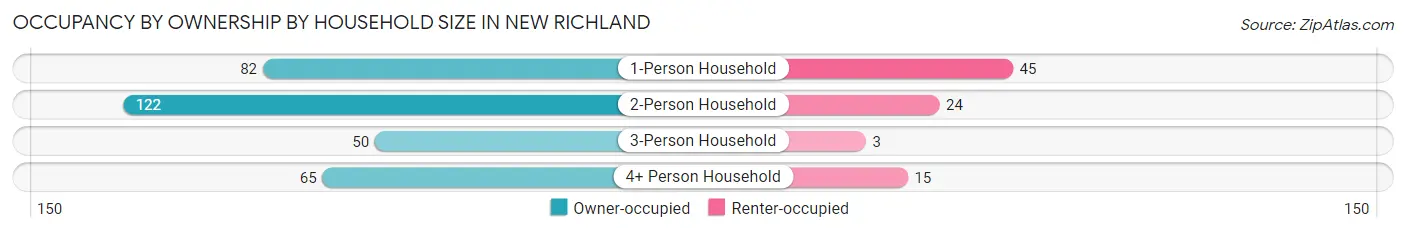
| Household Size | Owner-occupied | Renter-occupied |
| 1-Person Household | 82 (64.6%) | 45 (35.4%) |
| 2-Person Household | 122 (83.6%) | 24 (16.4%) |
| 3-Person Household | 50 (94.3%) | 3 (5.7%) |
| 4+ Person Household | 65 (81.2%) | 15 (18.8%) |
| Total Housing Units | 319 (78.6%) | 87 (21.4%) |
Occupancy by Educational Attainment in New Richland
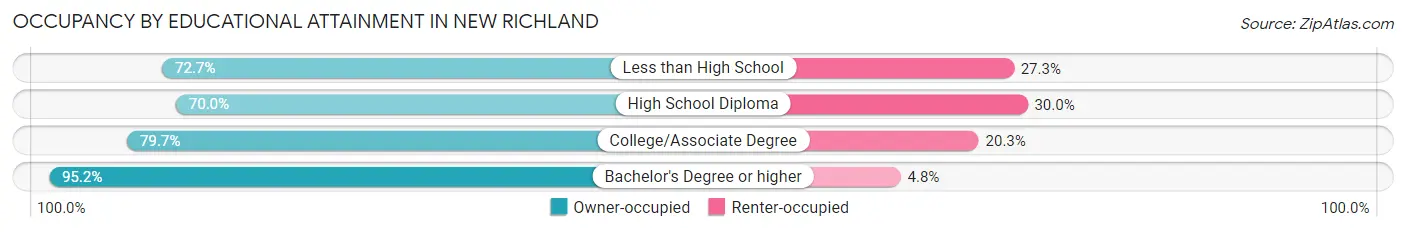
| Household Size | Owner-occupied | Renter-occupied |
| Less than High School | 16 (72.7%) | 6 (27.3%) |
| High School Diploma | 91 (70.0%) | 39 (30.0%) |
| College/Associate Degree | 153 (79.7%) | 39 (20.3%) |
| Bachelor's Degree or higher | 59 (95.2%) | 3 (4.8%) |
Occupancy by Age of Householder in New Richland
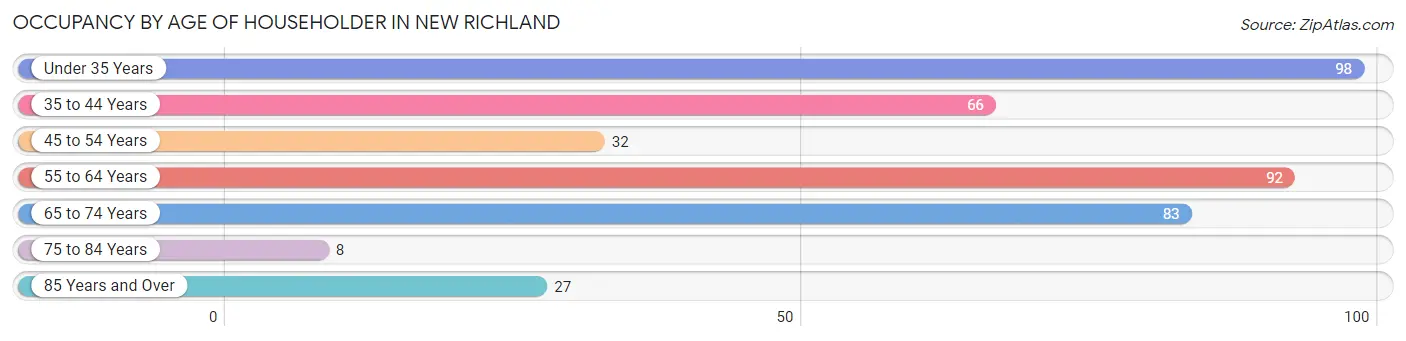
| Age Bracket | # Households | % Households |
| Under 35 Years | 98 | 24.1% |
| 35 to 44 Years | 66 | 16.3% |
| 45 to 54 Years | 32 | 7.9% |
| 55 to 64 Years | 92 | 22.7% |
| 65 to 74 Years | 83 | 20.4% |
| 75 to 84 Years | 8 | 2.0% |
| 85 Years and Over | 27 | 6.7% |
| Total | 406 | 100.0% |
Housing Finances in New Richland
Median Income by Occupancy in New Richland
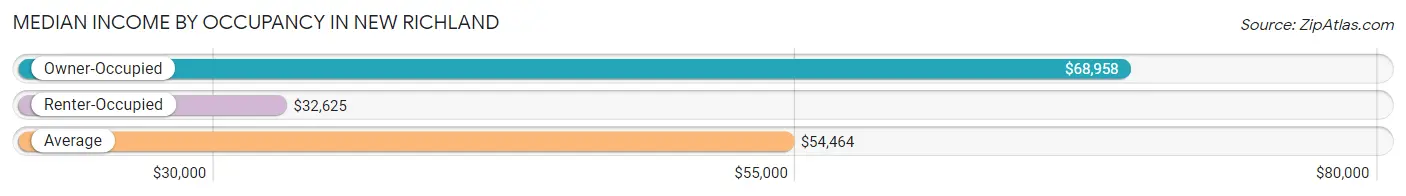
| Occupancy Type | # Households | Median Income |
| Owner-Occupied | 319 (78.6%) | $68,958 |
| Renter-Occupied | 87 (21.4%) | $32,625 |
| Average | 406 (100.0%) | $54,464 |
Occupancy by Householder Income Bracket in New Richland
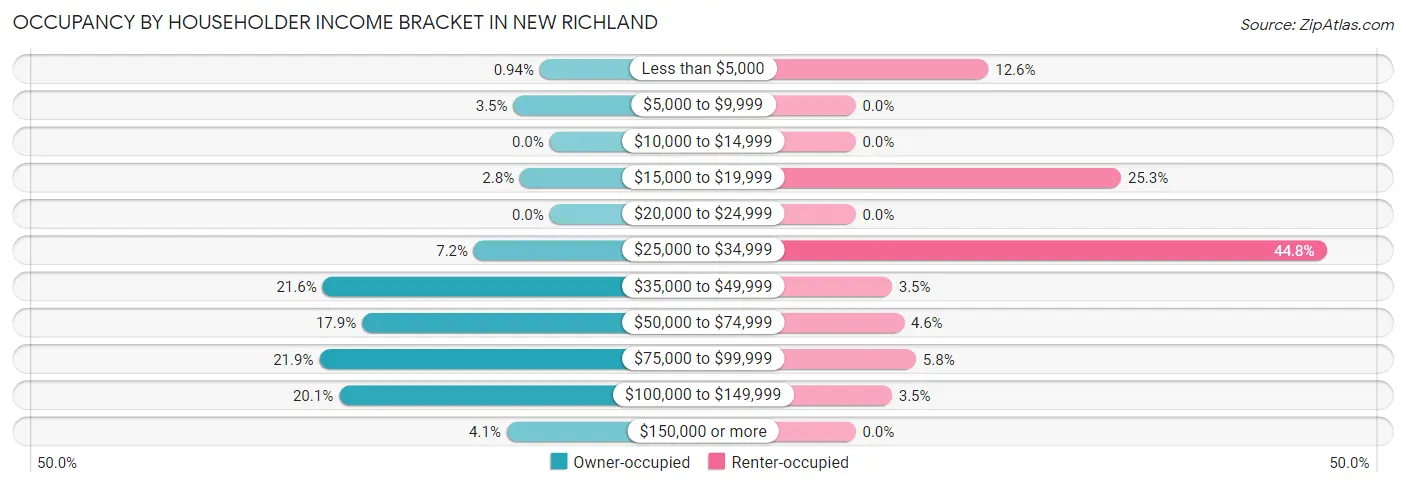
| Income Bracket | Owner-occupied | Renter-occupied |
| Less than $5,000 | 3 (0.9%) | 11 (12.6%) |
| $5,000 to $9,999 | 11 (3.5%) | 0 (0.0%) |
| $10,000 to $14,999 | 0 (0.0%) | 0 (0.0%) |
| $15,000 to $19,999 | 9 (2.8%) | 22 (25.3%) |
| $20,000 to $24,999 | 0 (0.0%) | 0 (0.0%) |
| $25,000 to $34,999 | 23 (7.2%) | 39 (44.8%) |
| $35,000 to $49,999 | 69 (21.6%) | 3 (3.5%) |
| $50,000 to $74,999 | 57 (17.9%) | 4 (4.6%) |
| $75,000 to $99,999 | 70 (21.9%) | 5 (5.8%) |
| $100,000 to $149,999 | 64 (20.1%) | 3 (3.5%) |
| $150,000 or more | 13 (4.1%) | 0 (0.0%) |
| Total | 319 (100.0%) | 87 (100.0%) |
Monthly Housing Cost Tiers in New Richland
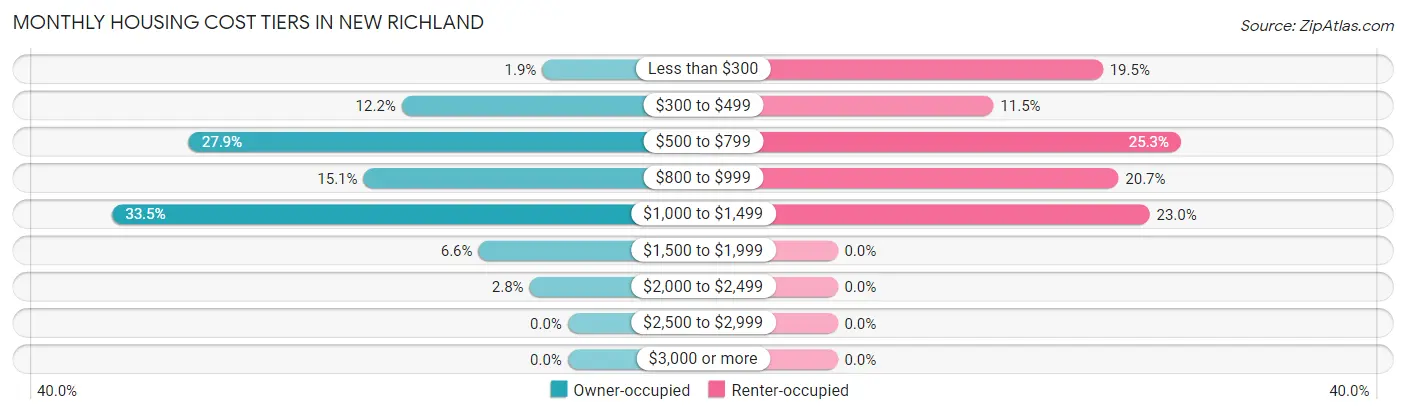
| Monthly Cost | Owner-occupied | Renter-occupied |
| Less than $300 | 6 (1.9%) | 17 (19.5%) |
| $300 to $499 | 39 (12.2%) | 10 (11.5%) |
| $500 to $799 | 89 (27.9%) | 22 (25.3%) |
| $800 to $999 | 48 (15.0%) | 18 (20.7%) |
| $1,000 to $1,499 | 107 (33.5%) | 20 (23.0%) |
| $1,500 to $1,999 | 21 (6.6%) | 0 (0.0%) |
| $2,000 to $2,499 | 9 (2.8%) | 0 (0.0%) |
| $2,500 to $2,999 | 0 (0.0%) | 0 (0.0%) |
| $3,000 or more | 0 (0.0%) | 0 (0.0%) |
| Total | 319 (100.0%) | 87 (100.0%) |
Physical Housing Characteristics in New Richland
Housing Structures in New Richland
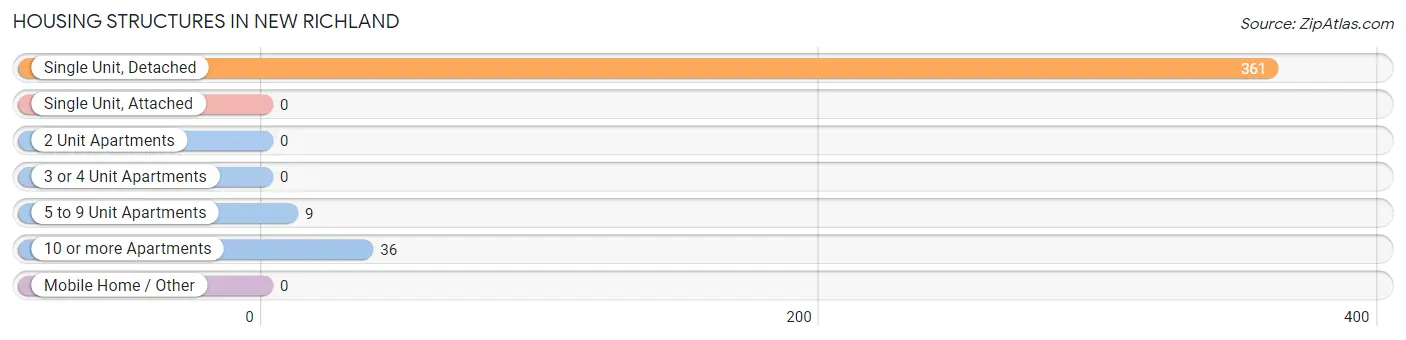
| Structure Type | # Housing Units | % Housing Units |
| Single Unit, Detached | 361 | 88.9% |
| Single Unit, Attached | 0 | 0.0% |
| 2 Unit Apartments | 0 | 0.0% |
| 3 or 4 Unit Apartments | 0 | 0.0% |
| 5 to 9 Unit Apartments | 9 | 2.2% |
| 10 or more Apartments | 36 | 8.9% |
| Mobile Home / Other | 0 | 0.0% |
| Total | 406 | 100.0% |
Housing Structures by Occupancy in New Richland
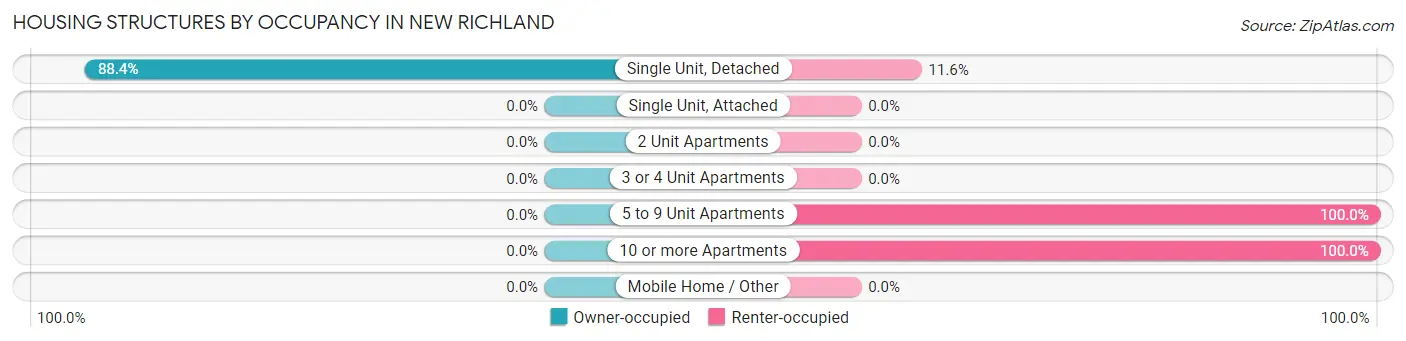
| Structure Type | Owner-occupied | Renter-occupied |
| Single Unit, Detached | 319 (88.4%) | 42 (11.6%) |
| Single Unit, Attached | 0 (0.0%) | 0 (0.0%) |
| 2 Unit Apartments | 0 (0.0%) | 0 (0.0%) |
| 3 or 4 Unit Apartments | 0 (0.0%) | 0 (0.0%) |
| 5 to 9 Unit Apartments | 0 (0.0%) | 9 (100.0%) |
| 10 or more Apartments | 0 (0.0%) | 36 (100.0%) |
| Mobile Home / Other | 0 (0.0%) | 0 (0.0%) |
| Total | 319 (78.6%) | 87 (21.4%) |
Housing Structures by Number of Rooms in New Richland
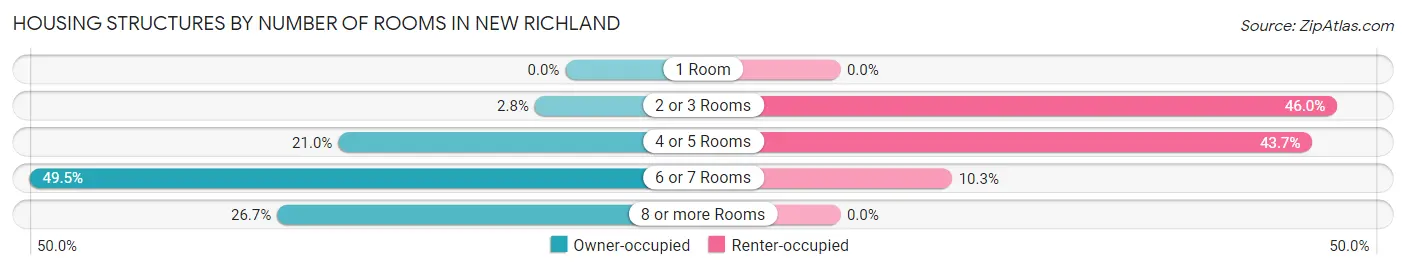
| Number of Rooms | Owner-occupied | Renter-occupied |
| 1 Room | 0 (0.0%) | 0 (0.0%) |
| 2 or 3 Rooms | 9 (2.8%) | 40 (46.0%) |
| 4 or 5 Rooms | 67 (21.0%) | 38 (43.7%) |
| 6 or 7 Rooms | 158 (49.5%) | 9 (10.3%) |
| 8 or more Rooms | 85 (26.7%) | 0 (0.0%) |
| Total | 319 (100.0%) | 87 (100.0%) |
Housing Structure by Heating Type in New Richland
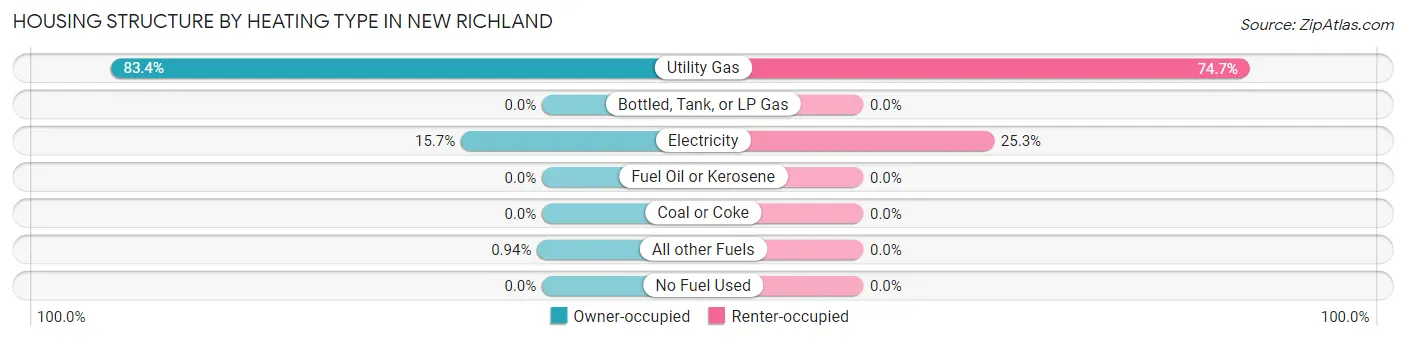
| Heating Type | Owner-occupied | Renter-occupied |
| Utility Gas | 266 (83.4%) | 65 (74.7%) |
| Bottled, Tank, or LP Gas | 0 (0.0%) | 0 (0.0%) |
| Electricity | 50 (15.7%) | 22 (25.3%) |
| Fuel Oil or Kerosene | 0 (0.0%) | 0 (0.0%) |
| Coal or Coke | 0 (0.0%) | 0 (0.0%) |
| All other Fuels | 3 (0.9%) | 0 (0.0%) |
| No Fuel Used | 0 (0.0%) | 0 (0.0%) |
| Total | 319 (100.0%) | 87 (100.0%) |
Household Vehicle Usage in New Richland
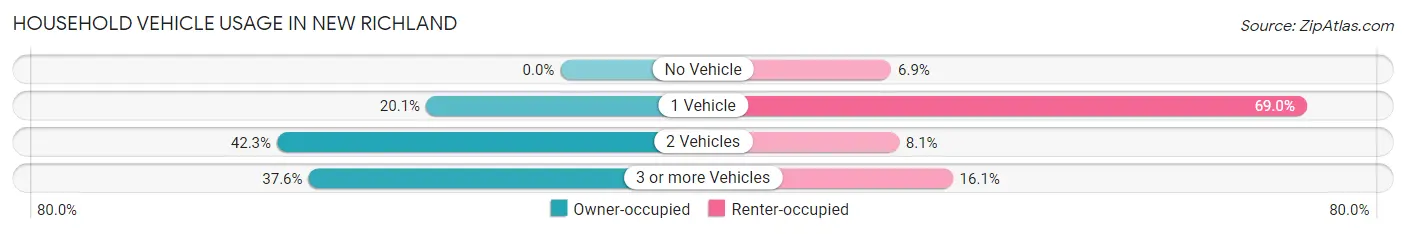
| Vehicles per Household | Owner-occupied | Renter-occupied |
| No Vehicle | 0 (0.0%) | 6 (6.9%) |
| 1 Vehicle | 64 (20.1%) | 60 (69.0%) |
| 2 Vehicles | 135 (42.3%) | 7 (8.1%) |
| 3 or more Vehicles | 120 (37.6%) | 14 (16.1%) |
| Total | 319 (100.0%) | 87 (100.0%) |
Real Estate & Mortgages in New Richland
Real Estate and Mortgage Overview in New Richland
| Characteristic | Without Mortgage | With Mortgage |
| Housing Units | 100 | 219 |
| Median Property Value | $144,100 | $123,600 |
| Median Household Income | $49,167 | $10 |
| Monthly Housing Costs | $535 | $0 |
| Real Estate Taxes | $1,722 | $6 |
Property Value by Mortgage Status in New Richland
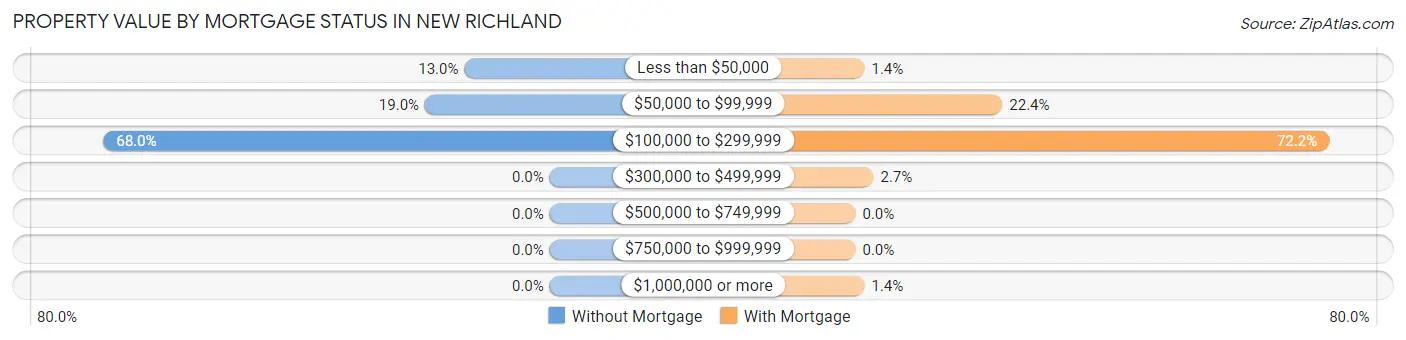
| Property Value | Without Mortgage | With Mortgage |
| Less than $50,000 | 13 (13.0%) | 3 (1.4%) |
| $50,000 to $99,999 | 19 (19.0%) | 49 (22.4%) |
| $100,000 to $299,999 | 68 (68.0%) | 158 (72.2%) |
| $300,000 to $499,999 | 0 (0.0%) | 6 (2.7%) |
| $500,000 to $749,999 | 0 (0.0%) | 0 (0.0%) |
| $750,000 to $999,999 | 0 (0.0%) | 0 (0.0%) |
| $1,000,000 or more | 0 (0.0%) | 3 (1.4%) |
| Total | 100 (100.0%) | 219 (100.0%) |
Household Income by Mortgage Status in New Richland
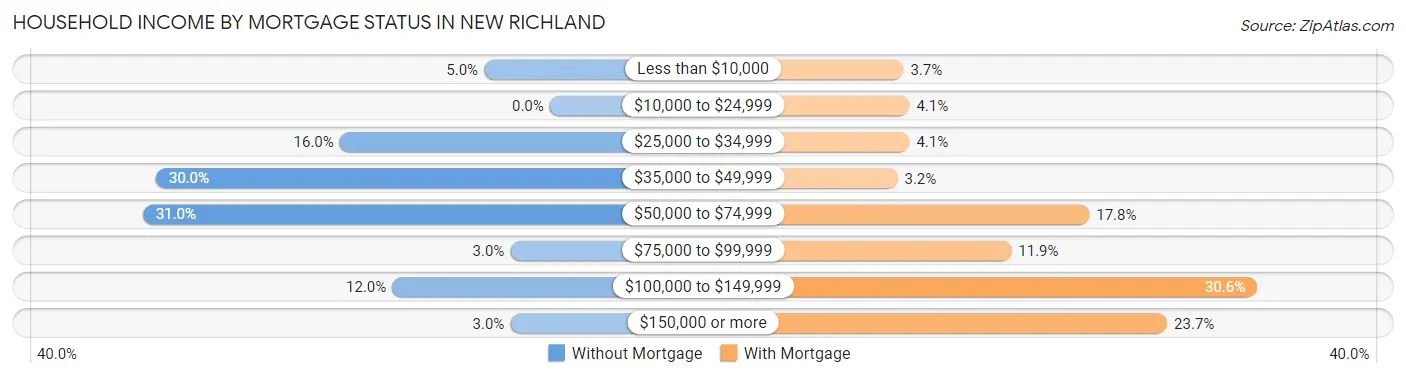
| Household Income | Without Mortgage | With Mortgage |
| Less than $10,000 | 5 (5.0%) | 8 (3.6%) |
| $10,000 to $24,999 | 0 (0.0%) | 9 (4.1%) |
| $25,000 to $34,999 | 16 (16.0%) | 9 (4.1%) |
| $35,000 to $49,999 | 30 (30.0%) | 7 (3.2%) |
| $50,000 to $74,999 | 31 (31.0%) | 39 (17.8%) |
| $75,000 to $99,999 | 3 (3.0%) | 26 (11.9%) |
| $100,000 to $149,999 | 12 (12.0%) | 67 (30.6%) |
| $150,000 or more | 3 (3.0%) | 52 (23.7%) |
| Total | 100 (100.0%) | 219 (100.0%) |
Property Value to Household Income Ratio in New Richland
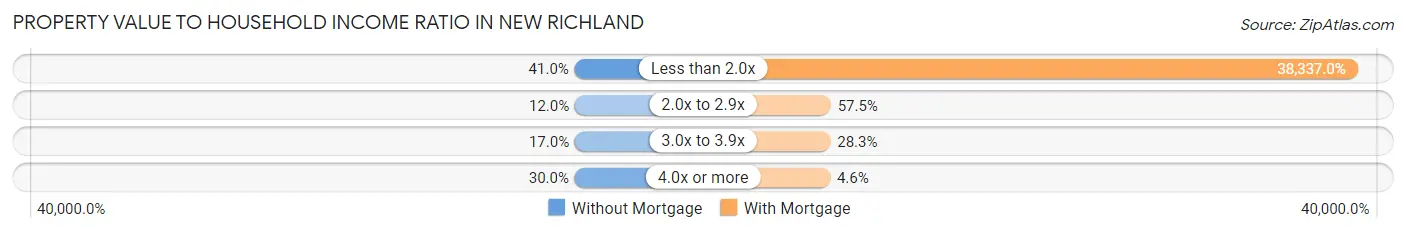
| Value-to-Income Ratio | Without Mortgage | With Mortgage |
| Less than 2.0x | 41 (41.0%) | 83,958 (38,337.0%) |
| 2.0x to 2.9x | 12 (12.0%) | 126 (57.5%) |
| 3.0x to 3.9x | 17 (17.0%) | 62 (28.3%) |
| 4.0x or more | 30 (30.0%) | 10 (4.6%) |
| Total | 100 (100.0%) | 219 (100.0%) |
Real Estate Taxes by Mortgage Status in New Richland
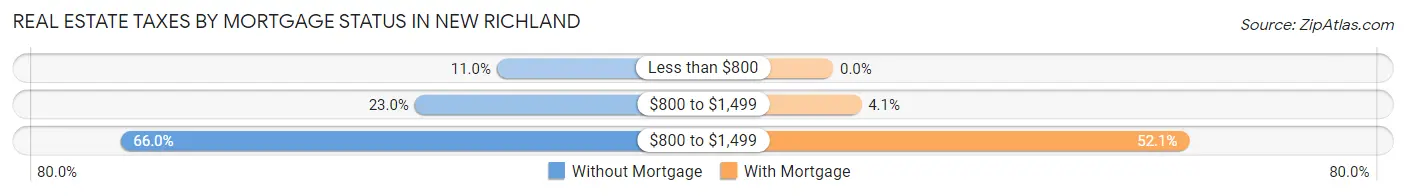
| Property Taxes | Without Mortgage | With Mortgage |
| Less than $800 | 11 (11.0%) | 0 (0.0%) |
| $800 to $1,499 | 23 (23.0%) | 9 (4.1%) |
| $800 to $1,499 | 66 (66.0%) | 114 (52.0%) |
| Total | 100 (100.0%) | 219 (100.0%) |
Health & Disability in New Richland
Health Insurance Coverage by Age in New Richland
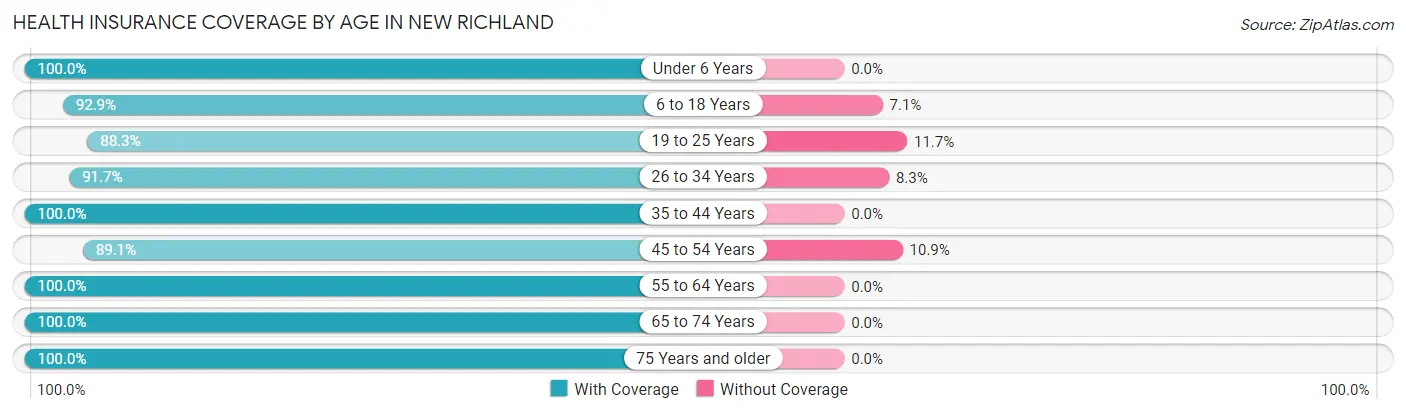
| Age Bracket | With Coverage | Without Coverage |
| Under 6 Years | 78 (100.0%) | 0 (0.0%) |
| 6 to 18 Years | 169 (92.9%) | 13 (7.1%) |
| 19 to 25 Years | 83 (88.3%) | 11 (11.7%) |
| 26 to 34 Years | 77 (91.7%) | 7 (8.3%) |
| 35 to 44 Years | 126 (100.0%) | 0 (0.0%) |
| 45 to 54 Years | 41 (89.1%) | 5 (10.9%) |
| 55 to 64 Years | 151 (100.0%) | 0 (0.0%) |
| 65 to 74 Years | 132 (100.0%) | 0 (0.0%) |
| 75 Years and older | 47 (100.0%) | 0 (0.0%) |
| Total | 904 (96.2%) | 36 (3.8%) |
Health Insurance Coverage by Citizenship Status in New Richland
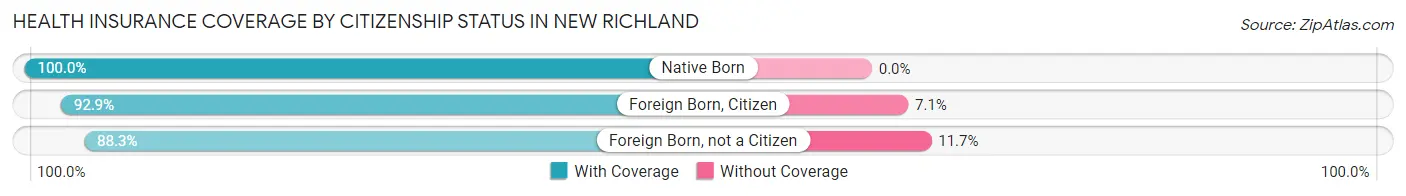
| Citizenship Status | With Coverage | Without Coverage |
| Native Born | 78 (100.0%) | 0 (0.0%) |
| Foreign Born, Citizen | 169 (92.9%) | 13 (7.1%) |
| Foreign Born, not a Citizen | 83 (88.3%) | 11 (11.7%) |
Health Insurance Coverage by Household Income in New Richland
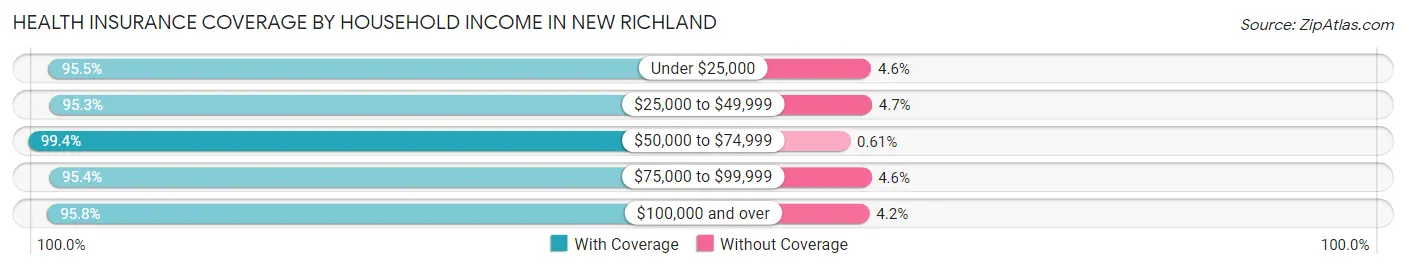
| Household Income | With Coverage | Without Coverage |
| Under $25,000 | 84 (95.5%) | 4 (4.5%) |
| $25,000 to $49,999 | 223 (95.3%) | 11 (4.7%) |
| $50,000 to $74,999 | 162 (99.4%) | 1 (0.6%) |
| $75,000 to $99,999 | 209 (95.4%) | 10 (4.6%) |
| $100,000 and over | 226 (95.8%) | 10 (4.2%) |
Public vs Private Health Insurance Coverage by Age in New Richland
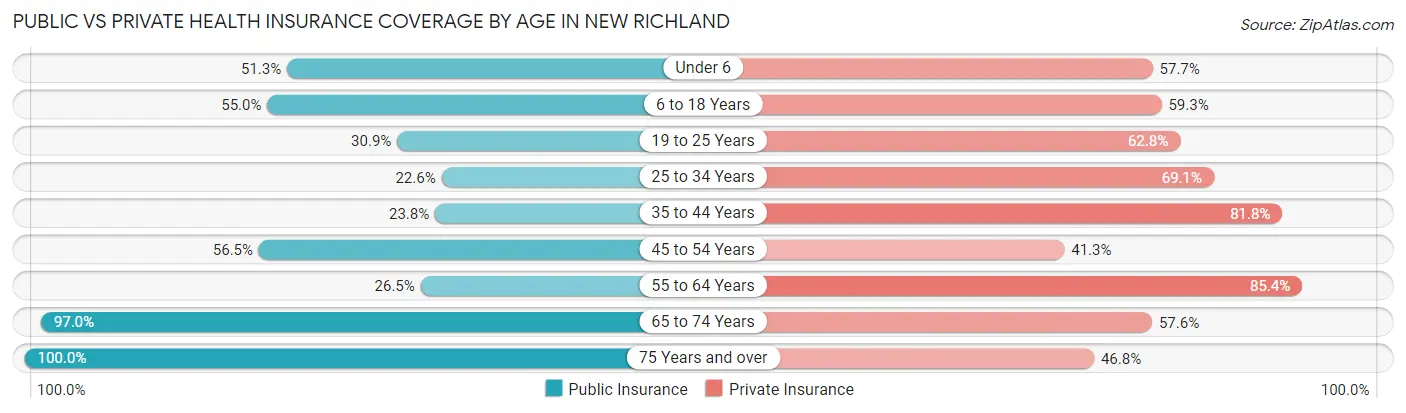
| Age Bracket | Public Insurance | Private Insurance |
| Under 6 | 40 (51.3%) | 45 (57.7%) |
| 6 to 18 Years | 100 (54.9%) | 108 (59.3%) |
| 19 to 25 Years | 29 (30.8%) | 59 (62.8%) |
| 25 to 34 Years | 19 (22.6%) | 58 (69.1%) |
| 35 to 44 Years | 30 (23.8%) | 103 (81.8%) |
| 45 to 54 Years | 26 (56.5%) | 19 (41.3%) |
| 55 to 64 Years | 40 (26.5%) | 129 (85.4%) |
| 65 to 74 Years | 128 (97.0%) | 76 (57.6%) |
| 75 Years and over | 47 (100.0%) | 22 (46.8%) |
| Total | 459 (48.8%) | 619 (65.8%) |
Disability Status by Sex by Age in New Richland
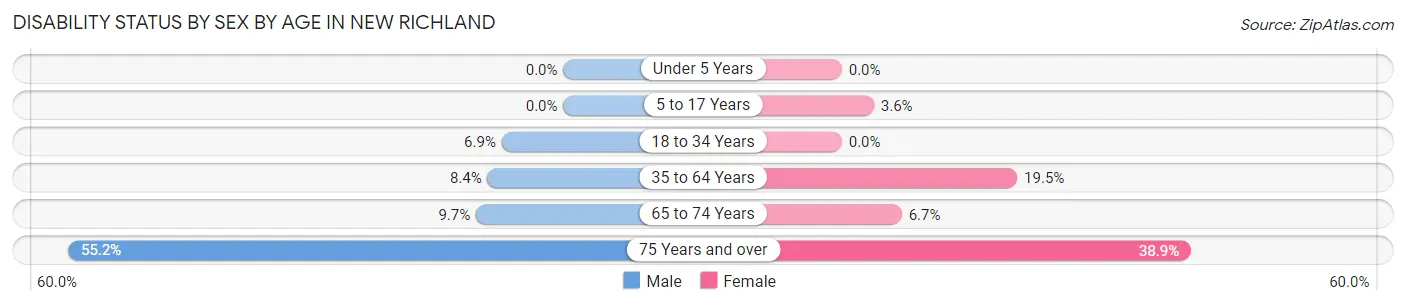
| Age Bracket | Male | Female |
| Under 5 Years | 0 (0.0%) | 0 (0.0%) |
| 5 to 17 Years | 0 (0.0%) | 3 (3.6%) |
| 18 to 34 Years | 7 (6.9%) | 0 (0.0%) |
| 35 to 64 Years | 13 (8.4%) | 33 (19.5%) |
| 65 to 74 Years | 7 (9.7%) | 4 (6.7%) |
| 75 Years and over | 16 (55.2%) | 7 (38.9%) |
Disability Class by Sex by Age in New Richland
Disability Class: Hearing Difficulty
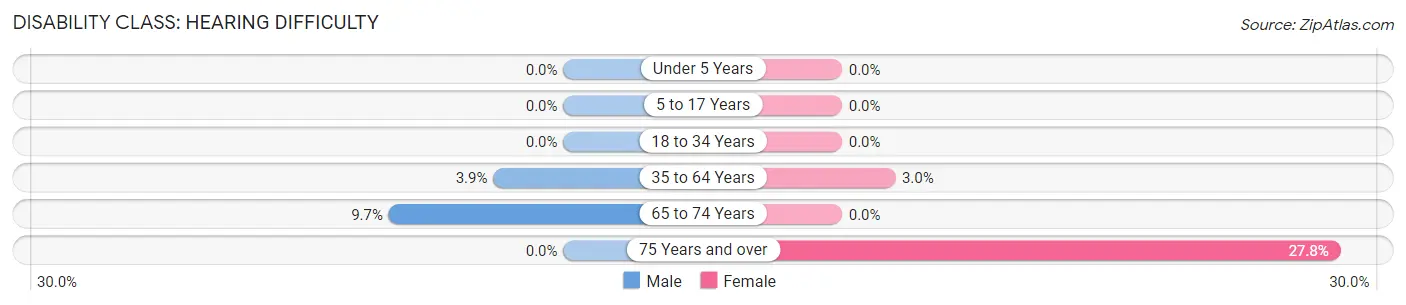
| Age Bracket | Male | Female |
| Under 5 Years | 0 (0.0%) | 0 (0.0%) |
| 5 to 17 Years | 0 (0.0%) | 0 (0.0%) |
| 18 to 34 Years | 0 (0.0%) | 0 (0.0%) |
| 35 to 64 Years | 6 (3.9%) | 5 (3.0%) |
| 65 to 74 Years | 7 (9.7%) | 0 (0.0%) |
| 75 Years and over | 0 (0.0%) | 5 (27.8%) |
Disability Class: Vision Difficulty
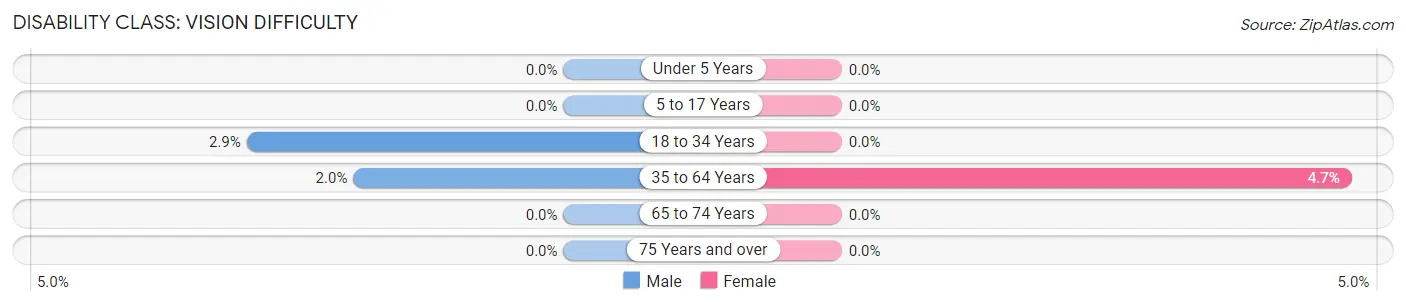
| Age Bracket | Male | Female |
| Under 5 Years | 0 (0.0%) | 0 (0.0%) |
| 5 to 17 Years | 0 (0.0%) | 0 (0.0%) |
| 18 to 34 Years | 3 (2.9%) | 0 (0.0%) |
| 35 to 64 Years | 3 (1.9%) | 8 (4.7%) |
| 65 to 74 Years | 0 (0.0%) | 0 (0.0%) |
| 75 Years and over | 0 (0.0%) | 0 (0.0%) |
Disability Class: Cognitive Difficulty
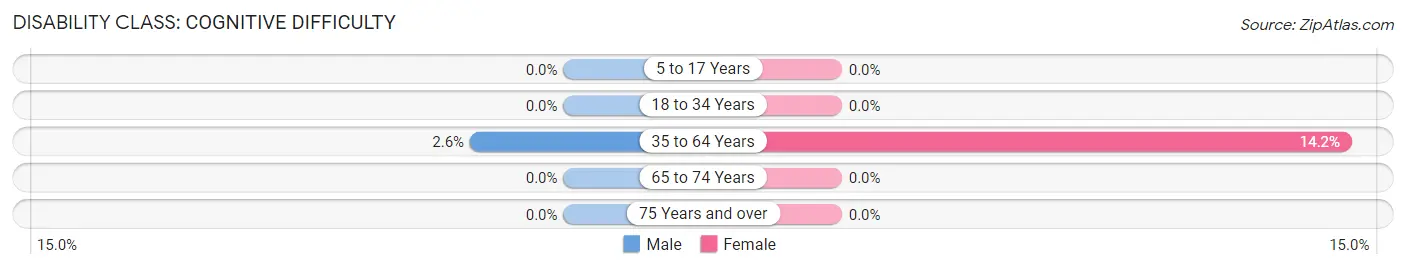
| Age Bracket | Male | Female |
| 5 to 17 Years | 0 (0.0%) | 0 (0.0%) |
| 18 to 34 Years | 0 (0.0%) | 0 (0.0%) |
| 35 to 64 Years | 4 (2.6%) | 24 (14.2%) |
| 65 to 74 Years | 0 (0.0%) | 0 (0.0%) |
| 75 Years and over | 0 (0.0%) | 0 (0.0%) |
Disability Class: Ambulatory Difficulty
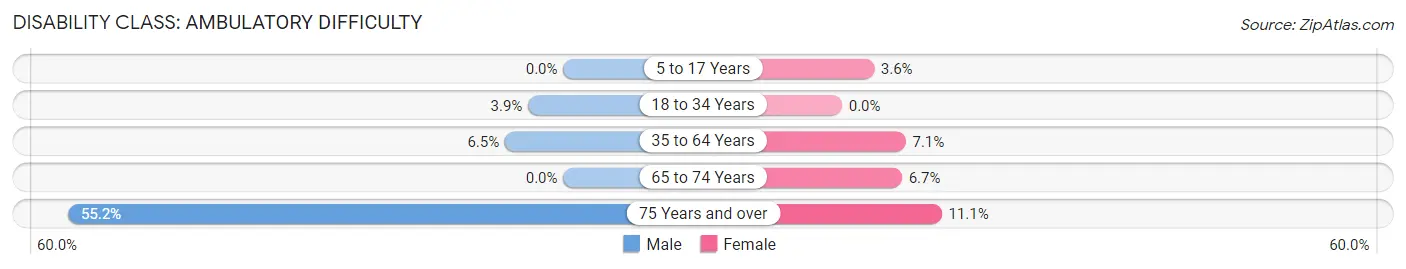
| Age Bracket | Male | Female |
| 5 to 17 Years | 0 (0.0%) | 3 (3.6%) |
| 18 to 34 Years | 4 (3.9%) | 0 (0.0%) |
| 35 to 64 Years | 10 (6.5%) | 12 (7.1%) |
| 65 to 74 Years | 0 (0.0%) | 4 (6.7%) |
| 75 Years and over | 16 (55.2%) | 2 (11.1%) |
Disability Class: Self-Care Difficulty
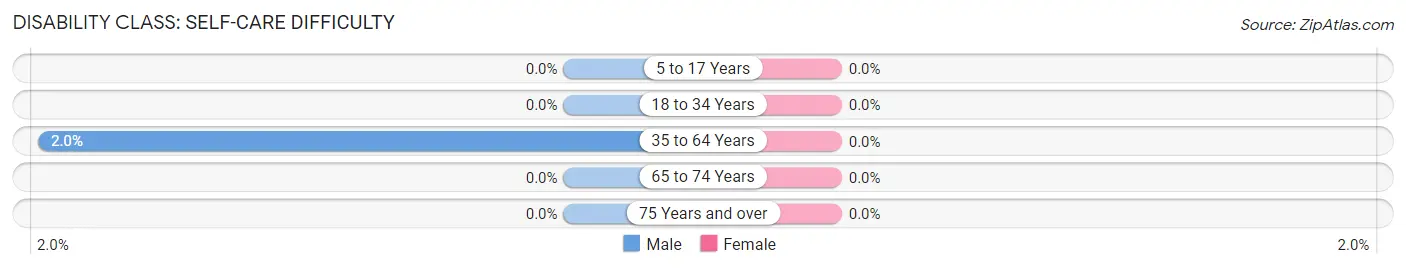
| Age Bracket | Male | Female |
| 5 to 17 Years | 0 (0.0%) | 0 (0.0%) |
| 18 to 34 Years | 0 (0.0%) | 0 (0.0%) |
| 35 to 64 Years | 3 (1.9%) | 0 (0.0%) |
| 65 to 74 Years | 0 (0.0%) | 0 (0.0%) |
| 75 Years and over | 0 (0.0%) | 0 (0.0%) |
Technology Access in New Richland
Computing Device Access in New Richland
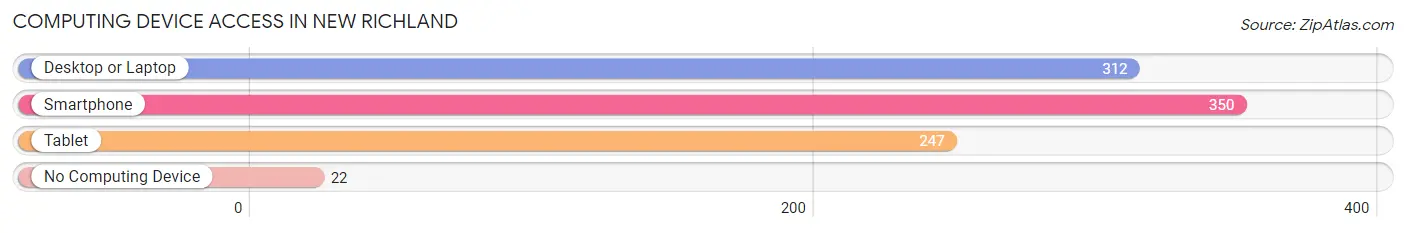
| Device Type | # Households | % Households |
| Desktop or Laptop | 312 | 76.8% |
| Smartphone | 350 | 86.2% |
| Tablet | 247 | 60.8% |
| No Computing Device | 22 | 5.4% |
| Total | 406 | 100.0% |
Internet Access in New Richland
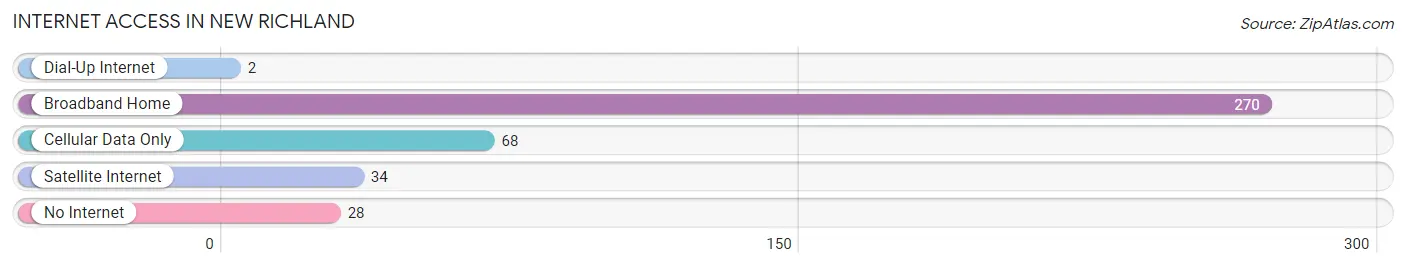
| Internet Type | # Households | % Households |
| Dial-Up Internet | 2 | 0.5% |
| Broadband Home | 270 | 66.5% |
| Cellular Data Only | 68 | 16.8% |
| Satellite Internet | 34 | 8.4% |
| No Internet | 28 | 6.9% |
| Total | 406 | 100.0% |
New Richland Summary
Richland, Minnesota is a small city located in Waseca County, in the south-central part of the state. It is situated on the banks of the Cannon River, and is home to a population of just over 1,000 people. Richland is a rural community, with a strong agricultural base, and is known for its small-town charm and friendly atmosphere.
History
Richland was first settled in 1856 by a group of settlers from New York. The town was originally named Richland Center, after the nearby Richland Creek. The name was changed to Richland in 1872, when the post office was established.
The town grew slowly, but steadily, over the years, and by the early 1900s, it had become a thriving agricultural community. The town was home to several grain elevators, a creamery, a flour mill, and a cheese factory.
In the late 1950s, Richland began to experience a period of growth and development. The town was incorporated in 1959, and the population grew to over 1,000 by the 1970s.
Geography
Richland is located in Waseca County, in the south-central part of Minnesota. It is situated on the banks of the Cannon River, and is surrounded by rolling hills and farmland. The town is located about 50 miles south of Minneapolis, and about 25 miles west of Rochester.
The climate in Richland is typical of the Midwest, with cold winters and hot, humid summers. The average annual temperature is around 45 degrees Fahrenheit, and the average annual precipitation is around 30 inches.
Economy
Richland’s economy is largely based on agriculture. The town is home to several grain elevators, a creamery, a flour mill, and a cheese factory. The town is also home to several small businesses, including a hardware store, a grocery store, and a restaurant.
The town is also home to a number of manufacturing companies, including a plastics manufacturer, a metal fabricator, and a machine shop.
Demographics
As of the 2010 census, Richland had a population of 1,072 people. The racial makeup of the town was 97.2% White, 0.7% African American, 0.3% Native American, 0.2% Asian, 0.1% Pacific Islander, and 1.5% from other races.
The median household income in Richland was $45,000, and the median family income was $50,000. The per capita income was $20,000. About 8.5% of the population was below the poverty line.
Richland is a small, rural community with a strong agricultural base. The town is known for its small-town charm and friendly atmosphere, and is a great place to live and work.
Common Questions
What is Per Capita Income in New Richland?
Per Capita income in New Richland is $27,876.
What is the Median Family Income in New Richland?
Median Family Income in New Richland is $77,500.
What is the Median Household income in New Richland?
Median Household Income in New Richland is $54,464.
What is Income or Wage Gap in New Richland?
Income or Wage Gap in New Richland is 15.5%.
Women in New Richland earn 84.5 cents for every dollar earned by a man.
What is Inequality or Gini Index in New Richland?
Inequality or Gini Index in New Richland is 0.37.
What is the Total Population of New Richland?
Total Population of New Richland is 1,020.
What is the Total Male Population of New Richland?
Total Male Population of New Richland is 511.
What is the Total Female Population of New Richland?
Total Female Population of New Richland is 509.
What is the Ratio of Males per 100 Females in New Richland?
There are 100.39 Males per 100 Females in New Richland.
What is the Ratio of Females per 100 Males in New Richland?
There are 99.61 Females per 100 Males in New Richland.
What is the Median Population Age in New Richland?
Median Population Age in New Richland is 40.6 Years.
What is the Average Family Size in New Richland
Average Family Size in New Richland is 2.9 People.
What is the Average Household Size in New Richland
Average Household Size in New Richland is 2.3 People.
How Large is the Labor Force in New Richland?
There are 476 People in the Labor Forcein in New Richland.
What is the Percentage of People in the Labor Force in New Richland?
60.3% of People are in the Labor Force in New Richland.
What is the Unemployment Rate in New Richland?
Unemployment Rate in New Richland is 5.0%.