Nevis, MN Map & Demographics
Nevis Map
Nevis Overview
$28,520
PER CAPITA INCOME
$72,500
AVG FAMILY INCOME
$54,583
AVG HOUSEHOLD INCOME
26.6%
WAGE / INCOME GAP [ % ]
73.4¢/ $1
WAGE / INCOME GAP [ $ ]
$5,300
FAMILY INCOME DEFICIT
0.38
INEQUALITY / GINI INDEX
429
TOTAL POPULATION
211
MALE POPULATION
218
FEMALE POPULATION
96.79
MALES / 100 FEMALES
103.32
FEMALES / 100 MALES
40.3
MEDIAN AGE
3.4
AVG FAMILY SIZE
2.5
AVG HOUSEHOLD SIZE
197
LABOR FORCE [ PEOPLE ]
65.4%
PERCENT IN LABOR FORCE
2.0%
UNEMPLOYMENT RATE
Nevis Zip Codes
Nevis Area Codes
Income in Nevis
Income Overview in Nevis
Per Capita Income in Nevis is $28,520, while median incomes of families and households are $72,500 and $54,583 respectively.
| Characteristic | Number | Measure |
| Per Capita Income | 429 | $28,520 |
| Median Family Income | 96 | $72,500 |
| Mean Family Income | 96 | $78,474 |
| Median Household Income | 170 | $54,583 |
| Mean Household Income | 170 | $67,692 |
| Income Deficit | 96 | $5,300 |
| Wage / Income Gap (%) | 429 | 26.57% |
| Wage / Income Gap ($) | 429 | 73.43¢ per $1 |
| Gini / Inequality Index | 429 | 0.38 |
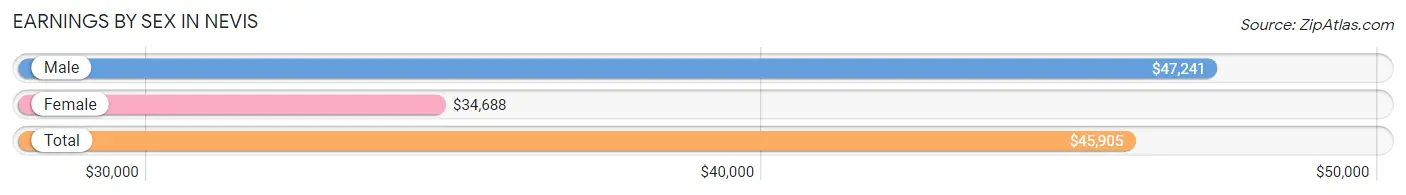
Earnings by Sex in Nevis
Average Earnings in Nevis are $45,905, $47,241 for men and $34,688 for women, a difference of 26.6%.
| Sex | Number | Average Earnings |
| Male | 96 (48.2%) | $47,241 |
| Female | 103 (51.8%) | $34,688 |
| Total | 199 (100.0%) | $45,905 |
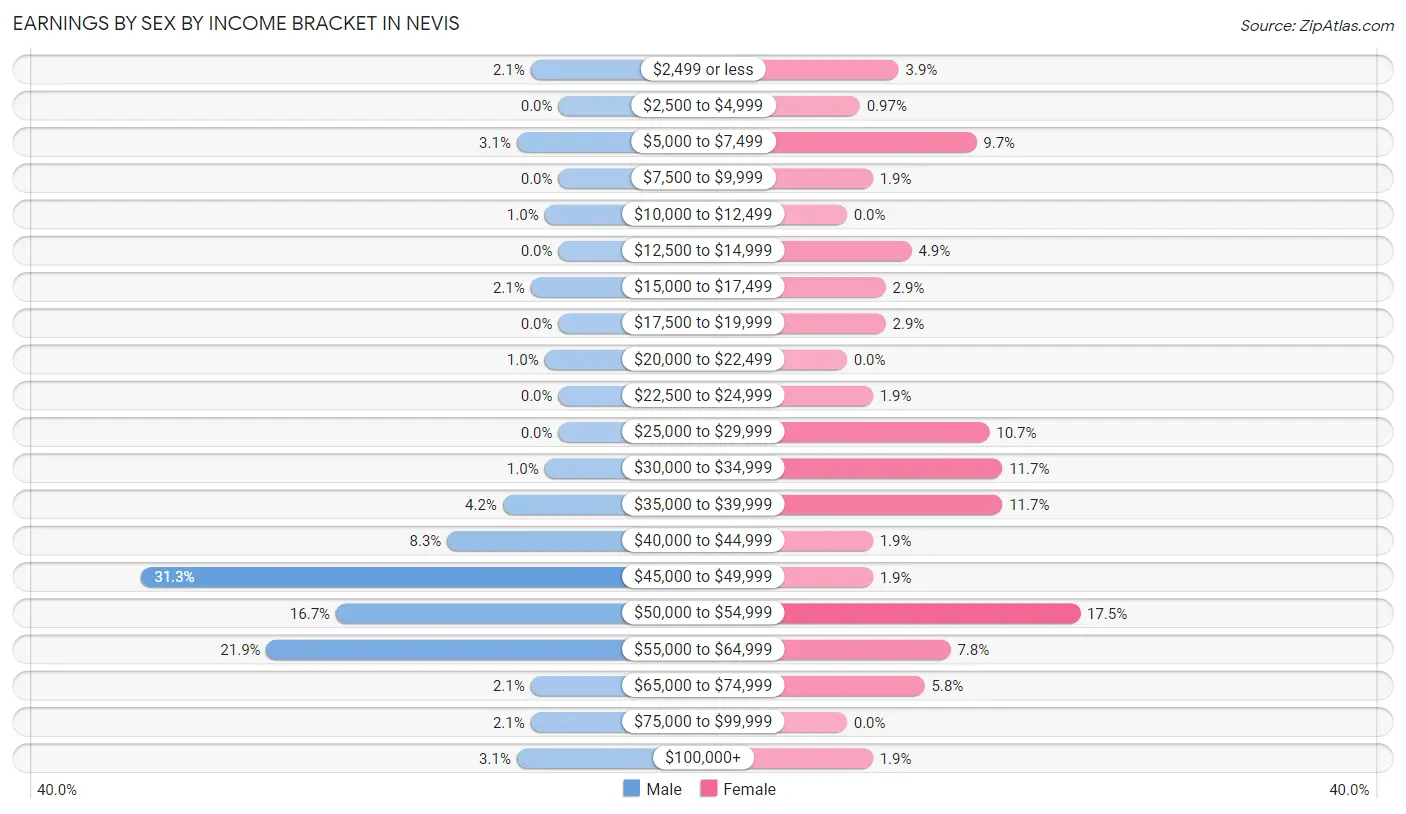
Earnings by Sex by Income Bracket in Nevis
The most common earnings brackets in Nevis are $45,000 to $49,999 for men (30 | 31.2%) and $50,000 to $54,999 for women (18 | 17.5%).
| Income | Male | Female |
| $2,499 or less | 2 (2.1%) | 4 (3.9%) |
| $2,500 to $4,999 | 0 (0.0%) | 1 (1.0%) |
| $5,000 to $7,499 | 3 (3.1%) | 10 (9.7%) |
| $7,500 to $9,999 | 0 (0.0%) | 2 (1.9%) |
| $10,000 to $12,499 | 1 (1.0%) | 0 (0.0%) |
| $12,500 to $14,999 | 0 (0.0%) | 5 (4.9%) |
| $15,000 to $17,499 | 2 (2.1%) | 3 (2.9%) |
| $17,500 to $19,999 | 0 (0.0%) | 3 (2.9%) |
| $20,000 to $22,499 | 1 (1.0%) | 0 (0.0%) |
| $22,500 to $24,999 | 0 (0.0%) | 2 (1.9%) |
| $25,000 to $29,999 | 0 (0.0%) | 11 (10.7%) |
| $30,000 to $34,999 | 1 (1.0%) | 12 (11.7%) |
| $35,000 to $39,999 | 4 (4.2%) | 12 (11.7%) |
| $40,000 to $44,999 | 8 (8.3%) | 2 (1.9%) |
| $45,000 to $49,999 | 30 (31.2%) | 2 (1.9%) |
| $50,000 to $54,999 | 16 (16.7%) | 18 (17.5%) |
| $55,000 to $64,999 | 21 (21.9%) | 8 (7.8%) |
| $65,000 to $74,999 | 2 (2.1%) | 6 (5.8%) |
| $75,000 to $99,999 | 2 (2.1%) | 0 (0.0%) |
| $100,000+ | 3 (3.1%) | 2 (1.9%) |
| Total | 96 (100.0%) | 103 (100.0%) |
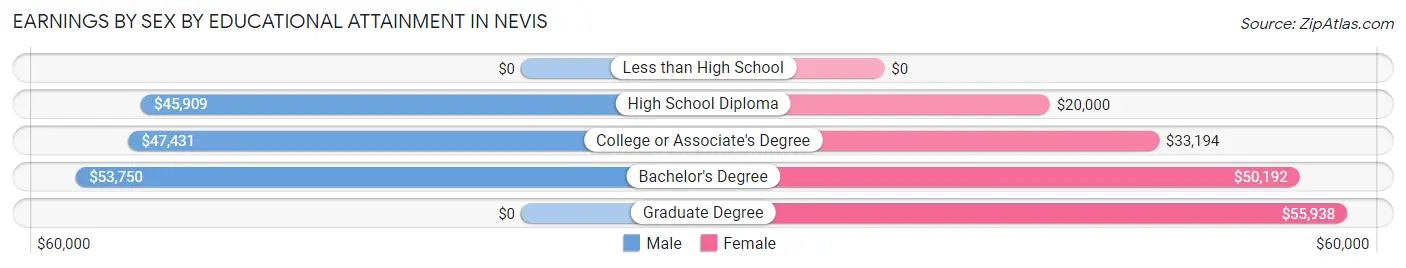
Earnings by Sex by Educational Attainment in Nevis
Average earnings in Nevis are $47,241 for men and $34,792 for women, a difference of 26.4%. Men with an educational attainment of bachelor's degree enjoy the highest average annual earnings of $53,750, while those with high school diploma education earn the least with $45,909. Women with an educational attainment of graduate degree earn the most with the average annual earnings of $55,938, while those with high school diploma education have the smallest earnings of $20,000.
| Educational Attainment | Male Income | Female Income |
| Less than High School | - | - |
| High School Diploma | $45,909 | $20,000 |
| College or Associate's Degree | $47,431 | $33,194 |
| Bachelor's Degree | $53,750 | $50,192 |
| Graduate Degree | - | - |
| Total | $47,241 | $34,792 |
Family Income in Nevis
Family Income Brackets in Nevis
According to the Nevis family income data, there are 23 families falling into the $100,000 to $149,999 income range, which is the most common income bracket and makes up 24.0% of all families.
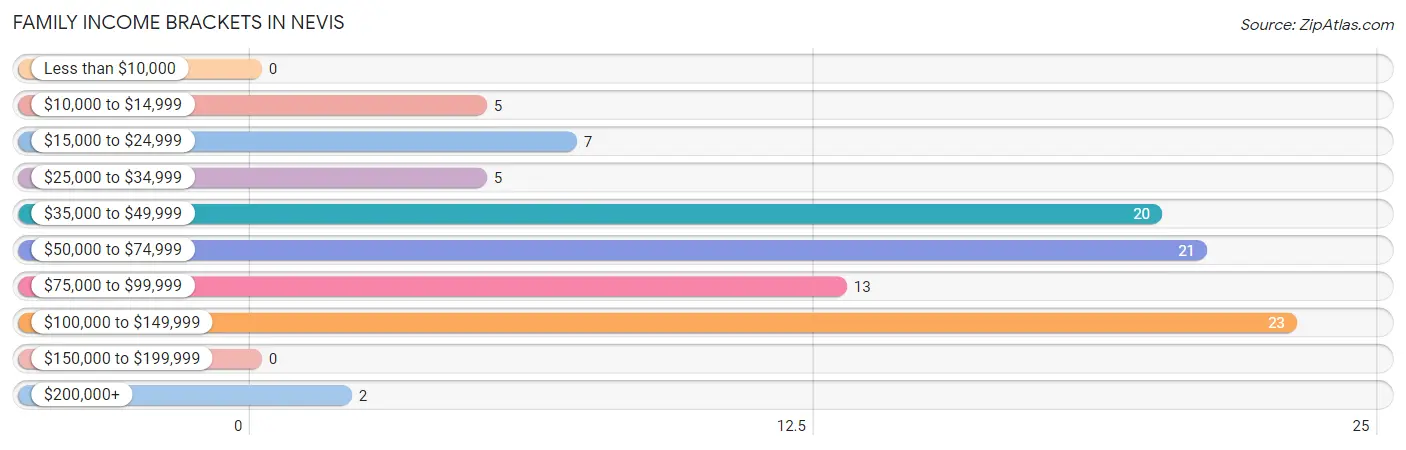
| Income Bracket | # Families | % Families |
| Less than $10,000 | 0 | 0.0% |
| $10,000 to $14,999 | 5 | 5.2% |
| $15,000 to $24,999 | 7 | 7.3% |
| $25,000 to $34,999 | 5 | 5.2% |
| $35,000 to $49,999 | 20 | 20.8% |
| $50,000 to $74,999 | 21 | 21.9% |
| $75,000 to $99,999 | 13 | 13.5% |
| $100,000 to $149,999 | 23 | 24.0% |
| $150,000 to $199,999 | 0 | 0.0% |
| $200,000+ | 2 | 2.1% |
Family Income by Famaliy Size in Nevis
4-person families (12 | 12.5%) account for the highest median family income in Nevis with $89,167 per family, while 2-person families (54 | 56.2%) have the highest median income of $36,625 per family member.
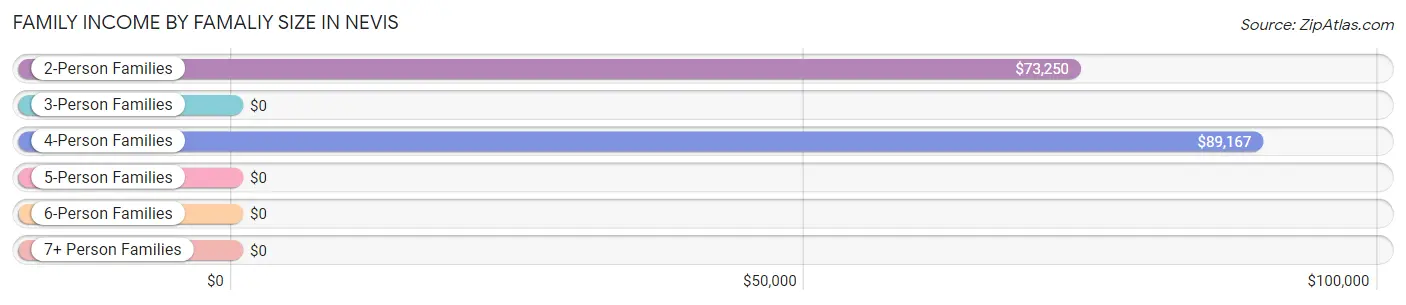
| Income Bracket | # Families | Median Income |
| 2-Person Families | 54 (56.2%) | $73,250 |
| 3-Person Families | 10 (10.4%) | $0 |
| 4-Person Families | 12 (12.5%) | $89,167 |
| 5-Person Families | 17 (17.7%) | $0 |
| 6-Person Families | 2 (2.1%) | $0 |
| 7+ Person Families | 1 (1.0%) | $0 |
| Total | 96 (100.0%) | $72,500 |
Family Income by Number of Earners in Nevis
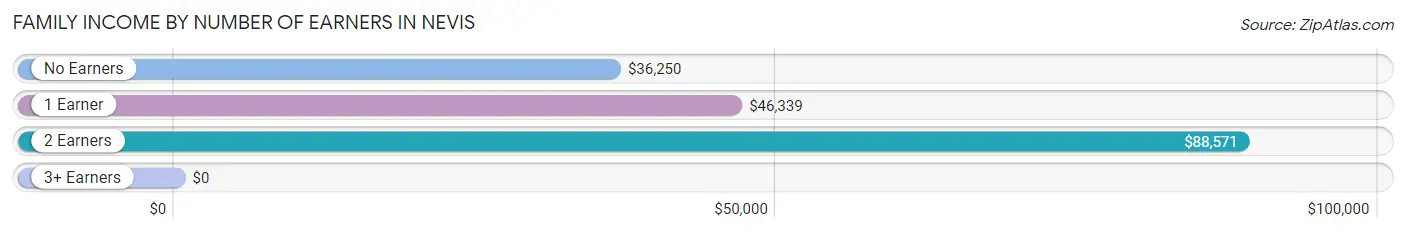
| Number of Earners | # Families | Median Income |
| No Earners | 16 (16.7%) | $36,250 |
| 1 Earner | 31 (32.3%) | $46,339 |
| 2 Earners | 46 (47.9%) | $88,571 |
| 3+ Earners | 3 (3.1%) | $0 |
| Total | 96 (100.0%) | $72,500 |
Household Income in Nevis
Household Income Brackets in Nevis
With 44 households falling in the category, the $50,000 to $74,999 income range is the most frequent in Nevis, accounting for 25.9% of all households.
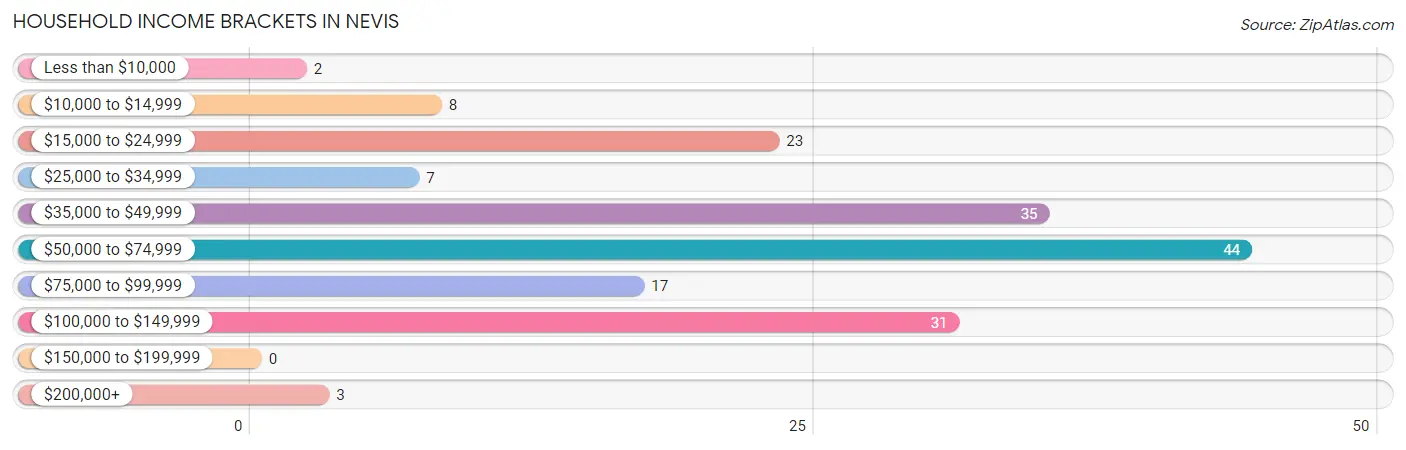
| Income Bracket | # Households | % Households |
| Less than $10,000 | 2 | 1.2% |
| $10,000 to $14,999 | 8 | 4.7% |
| $15,000 to $24,999 | 23 | 13.5% |
| $25,000 to $34,999 | 7 | 4.1% |
| $35,000 to $49,999 | 35 | 20.6% |
| $50,000 to $74,999 | 44 | 25.9% |
| $75,000 to $99,999 | 17 | 10.0% |
| $100,000 to $149,999 | 31 | 18.2% |
| $150,000 to $199,999 | 0 | 0.0% |
| $200,000+ | 3 | 1.8% |
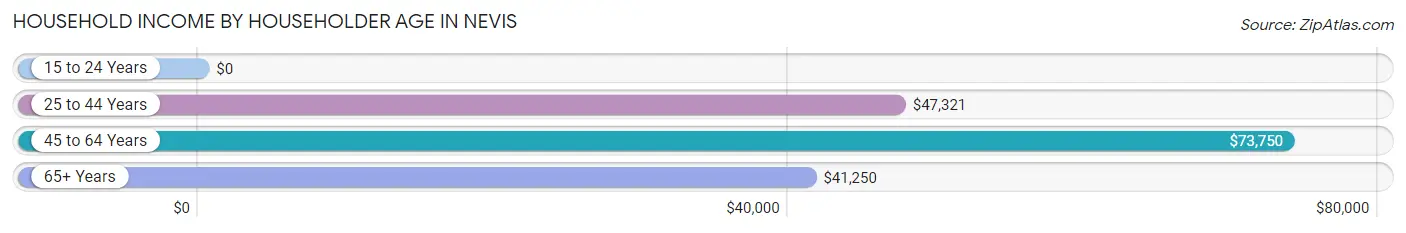
Household Income by Householder Age in Nevis
The median household income in Nevis is $54,583, with the highest median household income of $73,750 found in the 45 to 64 years age bracket for the primary householder. A total of 59 households (34.7%) fall into this category. Meanwhile, the 15 to 24 years age bracket for the primary householder has the lowest median household income of $0, with 1 households (0.6%) in this group.
| Income Bracket | # Households | Median Income |
| 15 to 24 Years | 1 (0.6%) | $0 |
| 25 to 44 Years | 50 (29.4%) | $47,321 |
| 45 to 64 Years | 59 (34.7%) | $73,750 |
| 65+ Years | 60 (35.3%) | $41,250 |
| Total | 170 (100.0%) | $54,583 |
Poverty in Nevis
Income Below Poverty by Sex and Age in Nevis
With 5.7% poverty level for males and 8.3% for females among the residents of Nevis, 55 to 64 year old males and 6 to 11 year old females are the most vulnerable to poverty, with 6 males (20.0%) and 3 females (33.3%) in their respective age groups living below the poverty level.
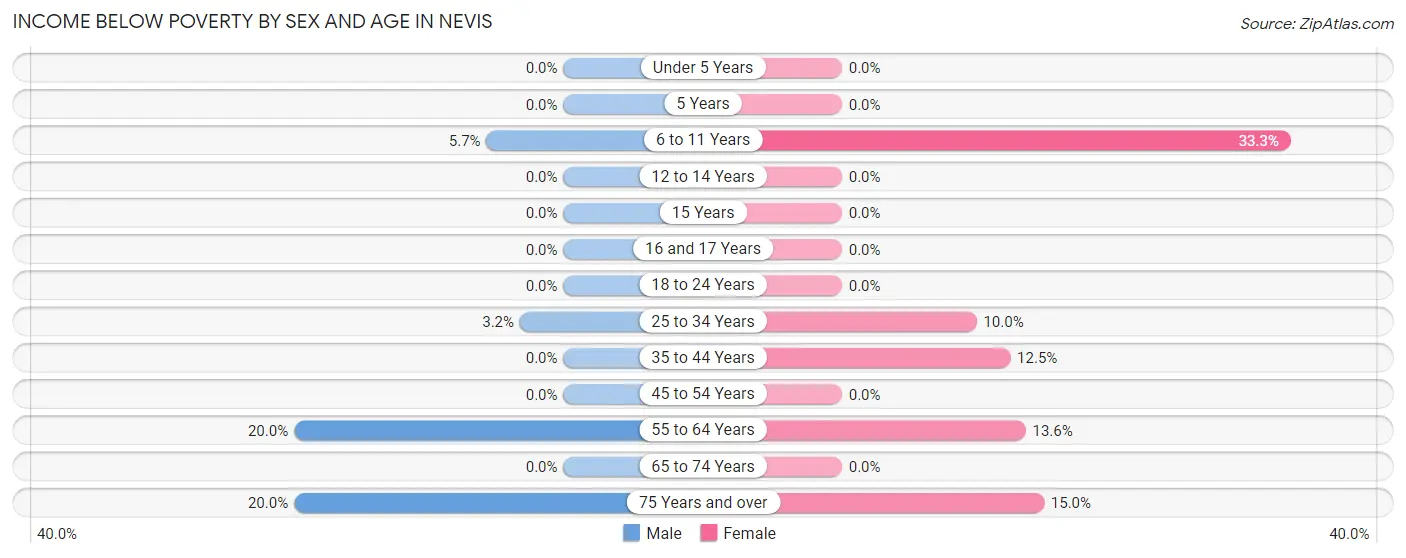
| Age Bracket | Male | Female |
| Under 5 Years | 0 (0.0%) | 0 (0.0%) |
| 5 Years | 0 (0.0%) | 0 (0.0%) |
| 6 to 11 Years | 2 (5.7%) | 3 (33.3%) |
| 12 to 14 Years | 0 (0.0%) | 0 (0.0%) |
| 15 Years | 0 (0.0%) | 0 (0.0%) |
| 16 and 17 Years | 0 (0.0%) | 0 (0.0%) |
| 18 to 24 Years | 0 (0.0%) | 0 (0.0%) |
| 25 to 34 Years | 1 (3.2%) | 3 (10.0%) |
| 35 to 44 Years | 0 (0.0%) | 3 (12.5%) |
| 45 to 54 Years | 0 (0.0%) | 0 (0.0%) |
| 55 to 64 Years | 6 (20.0%) | 6 (13.6%) |
| 65 to 74 Years | 0 (0.0%) | 0 (0.0%) |
| 75 Years and over | 3 (20.0%) | 3 (15.0%) |
| Total | 12 (5.7%) | 18 (8.3%) |
Income Above Poverty by Sex and Age in Nevis
According to the poverty statistics in Nevis, males aged under 5 years and females aged under 5 years are the age groups that are most secure financially, with 100.0% of males and 100.0% of females in these age groups living above the poverty line.
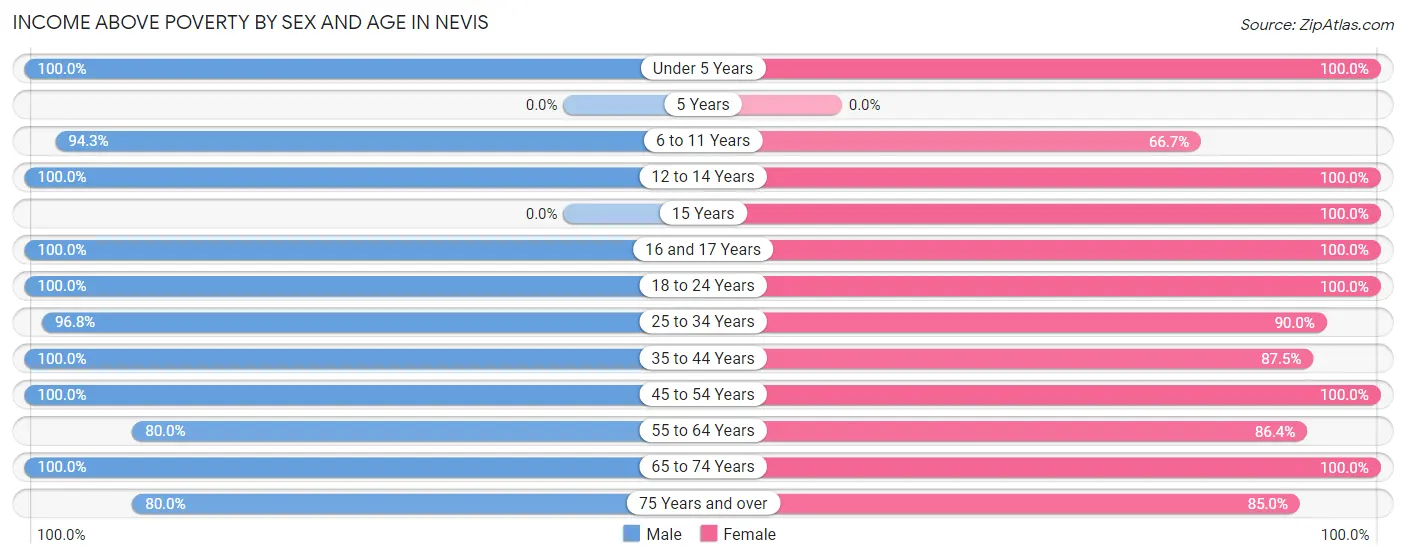
| Age Bracket | Male | Female |
| Under 5 Years | 28 (100.0%) | 39 (100.0%) |
| 5 Years | 0 (0.0%) | 0 (0.0%) |
| 6 to 11 Years | 33 (94.3%) | 6 (66.7%) |
| 12 to 14 Years | 7 (100.0%) | 3 (100.0%) |
| 15 Years | 0 (0.0%) | 7 (100.0%) |
| 16 and 17 Years | 5 (100.0%) | 3 (100.0%) |
| 18 to 24 Years | 1 (100.0%) | 2 (100.0%) |
| 25 to 34 Years | 30 (96.8%) | 27 (90.0%) |
| 35 to 44 Years | 9 (100.0%) | 21 (87.5%) |
| 45 to 54 Years | 30 (100.0%) | 9 (100.0%) |
| 55 to 64 Years | 24 (80.0%) | 38 (86.4%) |
| 65 to 74 Years | 20 (100.0%) | 28 (100.0%) |
| 75 Years and over | 12 (80.0%) | 17 (85.0%) |
| Total | 199 (94.3%) | 200 (91.7%) |
Income Below Poverty Among Married-Couple Families in Nevis
The poverty statistics for married-couple families in Nevis show that 8.8% or 8 of the total 91 families live below the poverty line. Families with 1 or 2 children have the highest poverty rate of 11.8%, comprising of 2 families. On the other hand, families with 3 or 4 children have the lowest poverty rate of 0.0%, which includes 0 families.
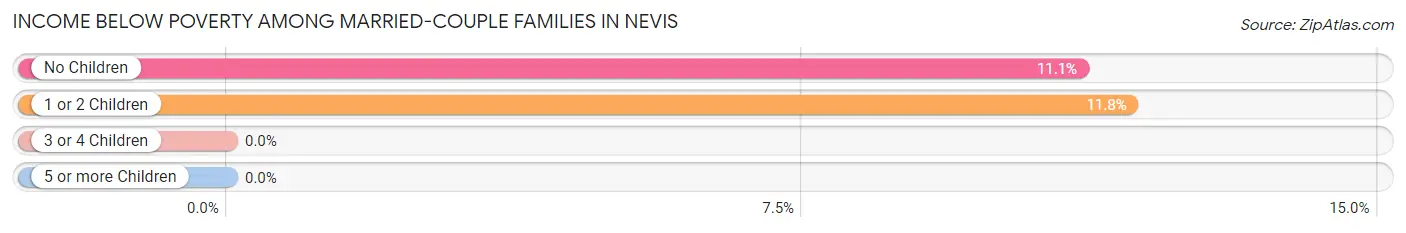
| Children | Above Poverty | Below Poverty |
| No Children | 48 (88.9%) | 6 (11.1%) |
| 1 or 2 Children | 15 (88.2%) | 2 (11.8%) |
| 3 or 4 Children | 19 (100.0%) | 0 (0.0%) |
| 5 or more Children | 1 (100.0%) | 0 (0.0%) |
| Total | 83 (91.2%) | 8 (8.8%) |
Income Below Poverty Among Single-Parent Households in Nevis
| Children | Single Father | Single Mother |
| No Children | 0 (0.0%) | 0 (0.0%) |
| 1 or 2 Children | 0 (0.0%) | 0 (0.0%) |
| 3 or 4 Children | 0 (0.0%) | 0 (0.0%) |
| 5 or more Children | 0 (0.0%) | 0 (0.0%) |
| Total | 0 (0.0%) | 0 (0.0%) |
Income Below Poverty Among Married-Couple vs Single-Parent Households in Nevis
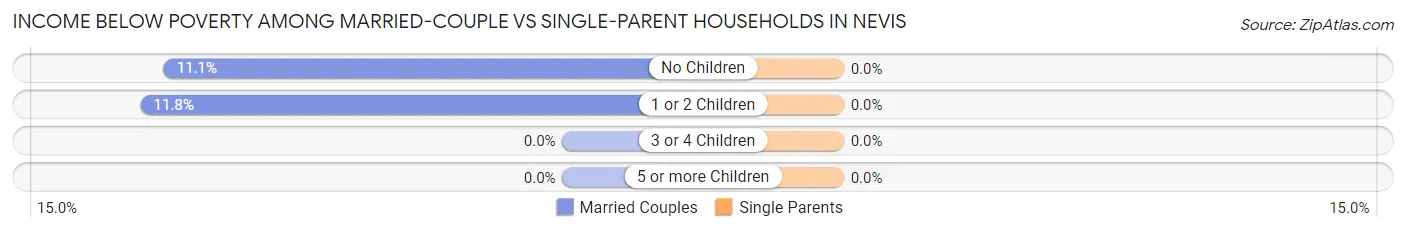
| Children | Married-Couple Families | Single-Parent Households |
| No Children | 6 (11.1%) | 0 (0.0%) |
| 1 or 2 Children | 2 (11.8%) | 0 (0.0%) |
| 3 or 4 Children | 0 (0.0%) | 0 (0.0%) |
| 5 or more Children | 0 (0.0%) | 0 (0.0%) |
| Total | 8 (8.8%) | 0 (0.0%) |
Race in Nevis
The most populous races in Nevis are White / Caucasian (405 | 94.4%), Native / Alaskan (10 | 2.3%), and Hispanic or Latino (8 | 1.9%).
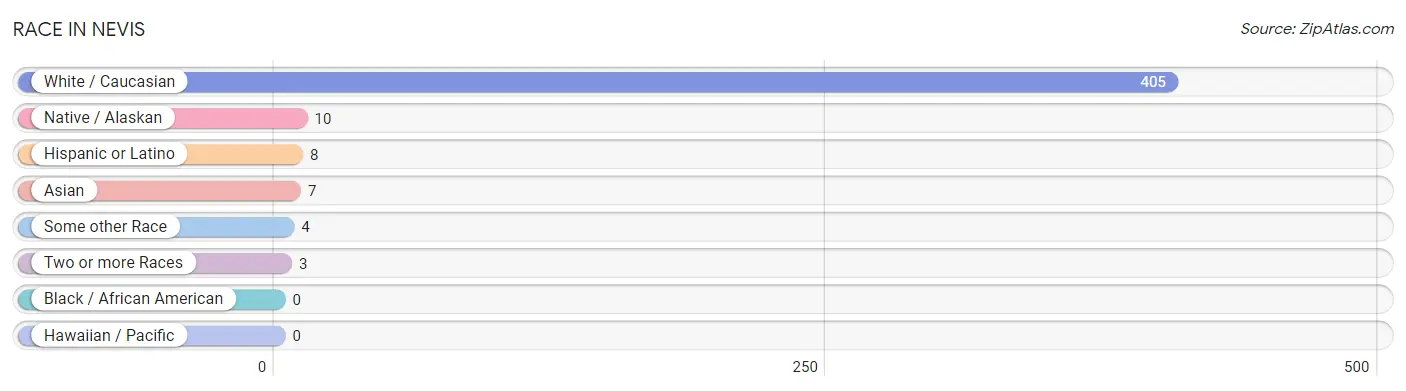
| Race | # Population | % Population |
| Asian | 7 | 1.6% |
| Black / African American | 0 | 0.0% |
| Hawaiian / Pacific | 0 | 0.0% |
| Hispanic or Latino | 8 | 1.9% |
| Native / Alaskan | 10 | 2.3% |
| White / Caucasian | 405 | 94.4% |
| Two or more Races | 3 | 0.7% |
| Some other Race | 4 | 0.9% |
| Total | 429 | 100.0% |
Ancestry in Nevis
The most populous ancestries reported in Nevis are German (133 | 31.0%), American (105 | 24.5%), Norwegian (52 | 12.1%), Irish (29 | 6.8%), and English (21 | 4.9%), together accounting for 79.3% of all Nevis residents.
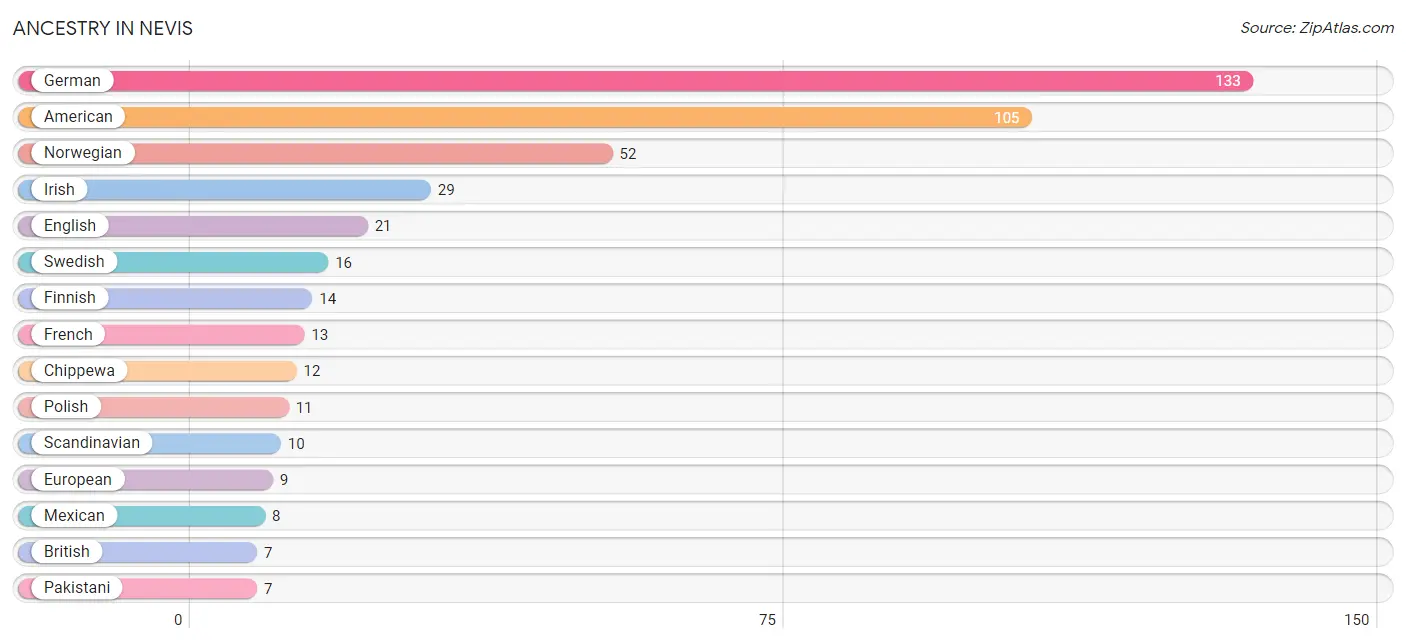
| Ancestry | # Population | % Population |
| American | 105 | 24.5% |
| Austrian | 3 | 0.7% |
| British | 7 | 1.6% |
| Cherokee | 1 | 0.2% |
| Chippewa | 12 | 2.8% |
| Czech | 4 | 0.9% |
| Danish | 1 | 0.2% |
| Dutch | 6 | 1.4% |
| English | 21 | 4.9% |
| European | 9 | 2.1% |
| Finnish | 14 | 3.3% |
| French | 13 | 3.0% |
| French Canadian | 5 | 1.2% |
| German | 133 | 31.0% |
| Hungarian | 4 | 0.9% |
| Irish | 29 | 6.8% |
| Italian | 1 | 0.2% |
| Mexican | 8 | 1.9% |
| Norwegian | 52 | 12.1% |
| Pakistani | 7 | 1.6% |
| Polish | 11 | 2.6% |
| Russian | 4 | 0.9% |
| Scandinavian | 10 | 2.3% |
| Scottish | 3 | 0.7% |
| Swedish | 16 | 3.7% |
| Swiss | 2 | 0.5% |
| Welsh | 2 | 0.5% | View All 27 Rows |
Immigrants in Nevis
The most numerous immigrant groups reported in Nevis came from Asia (7 | 1.6%), South Eastern Asia (7 | 1.6%), and Thailand (7 | 1.6%), together accounting for 4.9% of all Nevis residents.
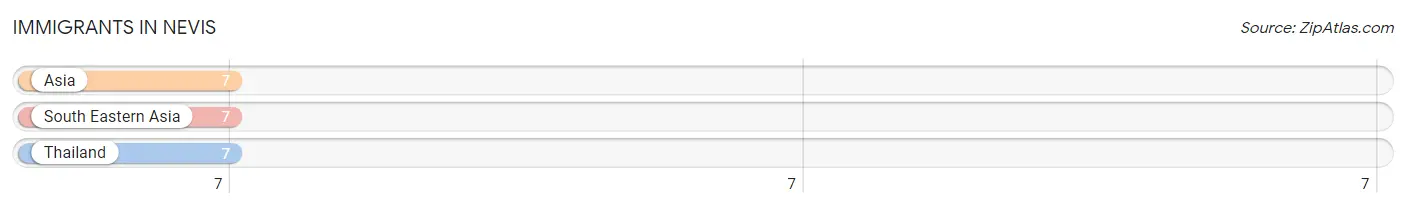
| Immigration Origin | # Population | % Population |
| Asia | 7 | 1.6% |
| South Eastern Asia | 7 | 1.6% |
| Thailand | 7 | 1.6% | View All 3 Rows |
Sex and Age in Nevis
Sex and Age in Nevis
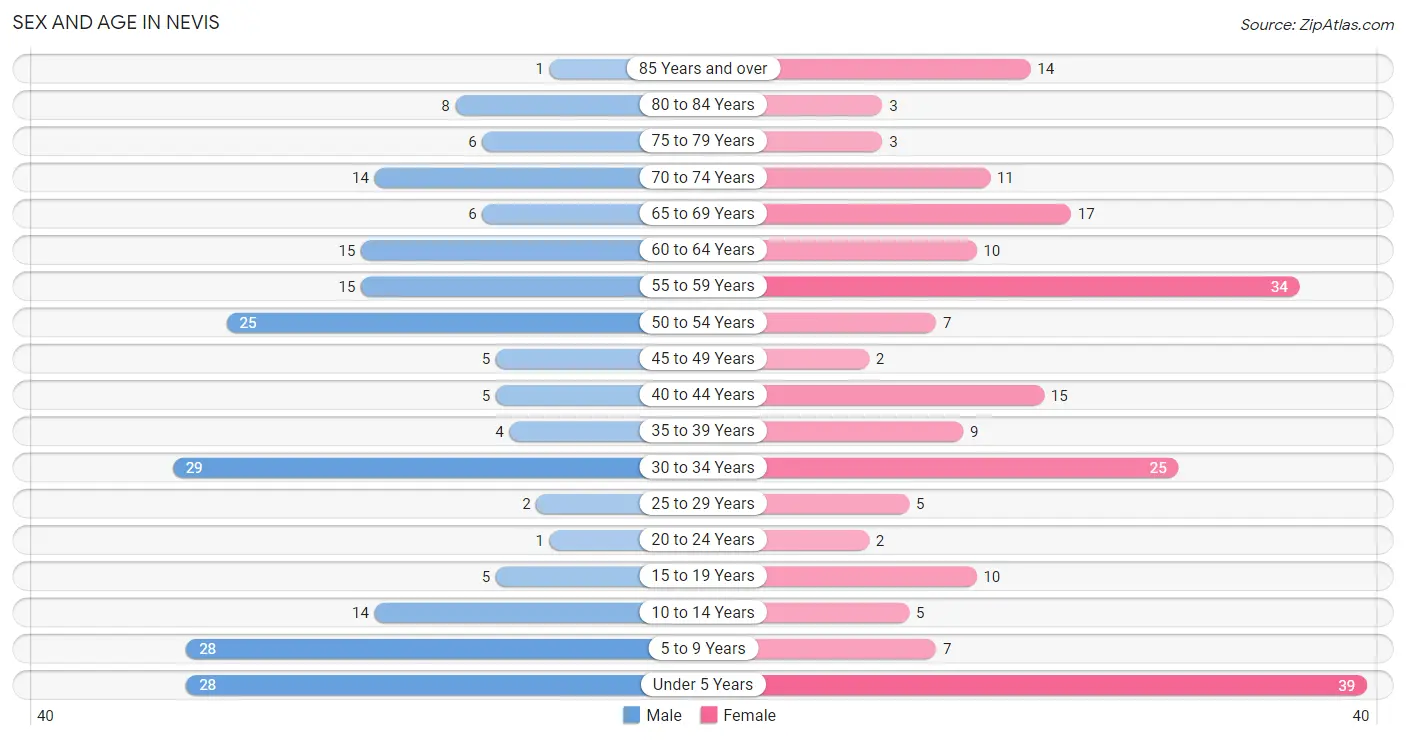
The most populous age groups in Nevis are 30 to 34 Years (29 | 13.7%) for men and Under 5 Years (39 | 17.9%) for women.
| Age Bracket | Male | Female |
| Under 5 Years | 28 (13.3%) | 39 (17.9%) |
| 5 to 9 Years | 28 (13.3%) | 7 (3.2%) |
| 10 to 14 Years | 14 (6.6%) | 5 (2.3%) |
| 15 to 19 Years | 5 (2.4%) | 10 (4.6%) |
| 20 to 24 Years | 1 (0.5%) | 2 (0.9%) |
| 25 to 29 Years | 2 (0.9%) | 5 (2.3%) |
| 30 to 34 Years | 29 (13.7%) | 25 (11.5%) |
| 35 to 39 Years | 4 (1.9%) | 9 (4.1%) |
| 40 to 44 Years | 5 (2.4%) | 15 (6.9%) |
| 45 to 49 Years | 5 (2.4%) | 2 (0.9%) |
| 50 to 54 Years | 25 (11.8%) | 7 (3.2%) |
| 55 to 59 Years | 15 (7.1%) | 34 (15.6%) |
| 60 to 64 Years | 15 (7.1%) | 10 (4.6%) |
| 65 to 69 Years | 6 (2.8%) | 17 (7.8%) |
| 70 to 74 Years | 14 (6.6%) | 11 (5.1%) |
| 75 to 79 Years | 6 (2.8%) | 3 (1.4%) |
| 80 to 84 Years | 8 (3.8%) | 3 (1.4%) |
| 85 Years and over | 1 (0.5%) | 14 (6.4%) |
| Total | 211 (100.0%) | 218 (100.0%) |
Families and Households in Nevis
Median Family Size in Nevis
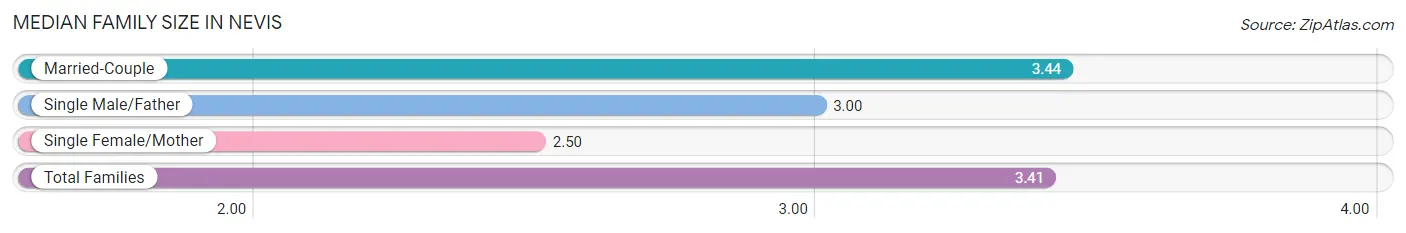
The median family size in Nevis is 3.41 persons per family, with married-couple families (91 | 94.8%) accounting for the largest median family size of 3.44 persons per family. On the other hand, single female/mother families (2 | 2.1%) represent the smallest median family size with 2.50 persons per family.
| Family Type | # Families | Family Size |
| Married-Couple | 91 (94.8%) | 3.44 |
| Single Male/Father | 3 (3.1%) | 3.00 |
| Single Female/Mother | 2 (2.1%) | 2.50 |
| Total Families | 96 (100.0%) | 3.41 |
Median Household Size in Nevis
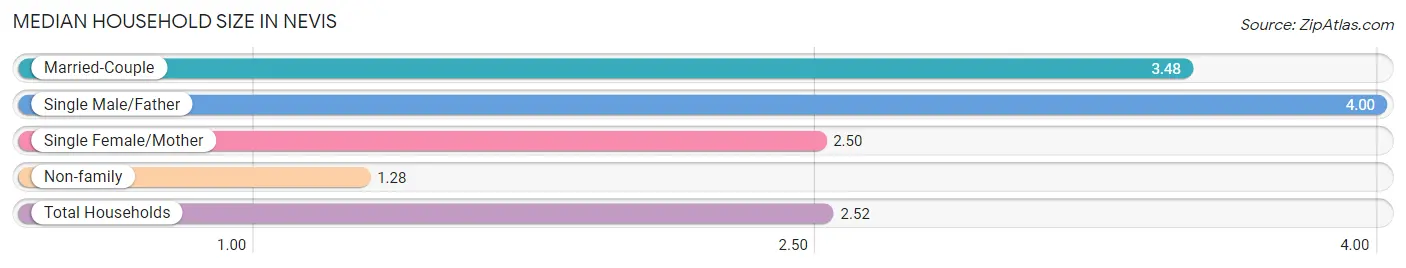
The median household size in Nevis is 2.52 persons per household, with single male/father households (3 | 1.8%) accounting for the largest median household size of 4 persons per household. non-family households (74 | 43.5%) represent the smallest median household size with 1.28 persons per household.
| Household Type | # Households | Household Size |
| Married-Couple | 91 (53.5%) | 3.48 |
| Single Male/Father | 3 (1.8%) | 4.00 |
| Single Female/Mother | 2 (1.2%) | 2.50 |
| Non-family | 74 (43.5%) | 1.28 |
| Total Households | 170 (100.0%) | 2.52 |
Household Size by Marriage Status in Nevis
Out of a total of 170 households in Nevis, 96 (56.5%) are family households, while 74 (43.5%) are nonfamily households. The most numerous type of family households are 2-person households, comprising 53, and the most common type of nonfamily households are 1-person households, comprising 61.
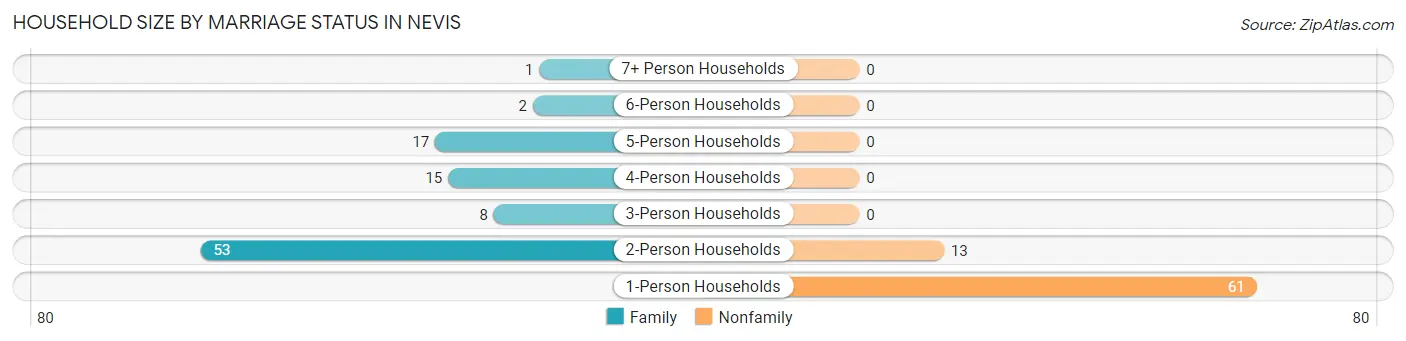
| Household Size | Family Households | Nonfamily Households |
| 1-Person Households | - | 61 (35.9%) |
| 2-Person Households | 53 (31.2%) | 13 (7.6%) |
| 3-Person Households | 8 (4.7%) | 0 (0.0%) |
| 4-Person Households | 15 (8.8%) | 0 (0.0%) |
| 5-Person Households | 17 (10.0%) | 0 (0.0%) |
| 6-Person Households | 2 (1.2%) | 0 (0.0%) |
| 7+ Person Households | 1 (0.6%) | 0 (0.0%) |
| Total | 96 (56.5%) | 74 (43.5%) |
Female Fertility in Nevis
Fertility by Age in Nevis
| Age Bracket | Women with Births | Births / 1,000 Women |
| 15 to 19 years | 0 (0.0%) | 0.0 |
| 20 to 34 years | 0 (0.0%) | 0.0 |
| 35 to 50 years | 0 (0.0%) | 0.0 |
| Total | 0 (0.0%) | 0.0 |
Fertility by Age by Marriage Status in Nevis
| Age Bracket | Married | Unmarried |
| 15 to 19 years | 0 (0.0%) | 0 (0.0%) |
| 20 to 34 years | 0 (0.0%) | 0 (0.0%) |
| 35 to 50 years | 0 (0.0%) | 0 (0.0%) |
| Total | 0 (0.0%) | 0 (0.0%) |
Fertility by Education in Nevis
| Educational Attainment | Women with Births | Births / 1,000 Women |
| Less than High School | 0 (0.0%) | 0.0 |
| High School Diploma | 0 (0.0%) | 0.0 |
| College or Associate's Degree | 0 (0.0%) | 0.0 |
| Bachelor's Degree | 0 (0.0%) | 0.0 |
| Graduate Degree | 0 (0.0%) | 0.0 |
| Total | 0 (0.0%) | 0.0 |
Fertility by Education by Marriage Status in Nevis
| Educational Attainment | Married | Unmarried |
| Less than High School | 0 (0.0%) | 0 (0.0%) |
| High School Diploma | 0 (0.0%) | 0 (0.0%) |
| College or Associate's Degree | 0 (0.0%) | 0 (0.0%) |
| Bachelor's Degree | 0 (0.0%) | 0 (0.0%) |
| Graduate Degree | 0 (0.0%) | 0 (0.0%) |
| Total | 0 (0.0%) | 0 (0.0%) |
Employment Characteristics in Nevis
Employment by Class of Employer in Nevis
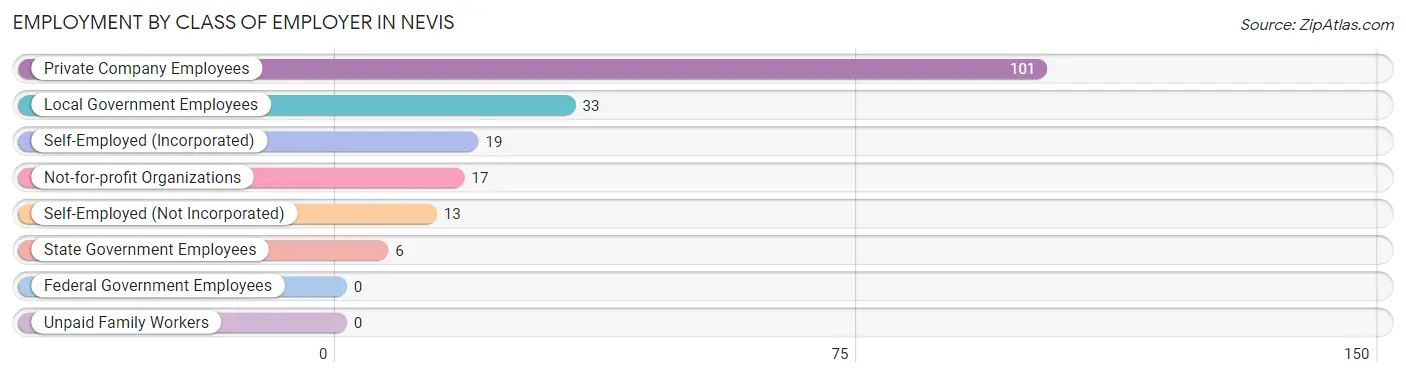
Among the 189 employed individuals in Nevis, private company employees (101 | 53.4%), local government employees (33 | 17.5%), and self-employed (incorporated) (19 | 10.1%) make up the most common classes of employment.
| Employer Class | # Employees | % Employees |
| Private Company Employees | 101 | 53.4% |
| Self-Employed (Incorporated) | 19 | 10.1% |
| Self-Employed (Not Incorporated) | 13 | 6.9% |
| Not-for-profit Organizations | 17 | 9.0% |
| Local Government Employees | 33 | 17.5% |
| State Government Employees | 6 | 3.2% |
| Federal Government Employees | 0 | 0.0% |
| Unpaid Family Workers | 0 | 0.0% |
| Total | 189 | 100.0% |
Employment Status by Age in Nevis
According to the labor force statistics for Nevis, out of the total population over 16 years of age (301), 65.4% or 197 individuals are in the labor force, with 2.0% or 4 of them unemployed. The age group with the highest labor force participation rate is 20 to 24 years, with 100.0% or 3 individuals in the labor force. Within the labor force, the 16 to 19 years age range has the highest percentage of unemployed individuals, with 40.0% or 2 of them being unemployed.
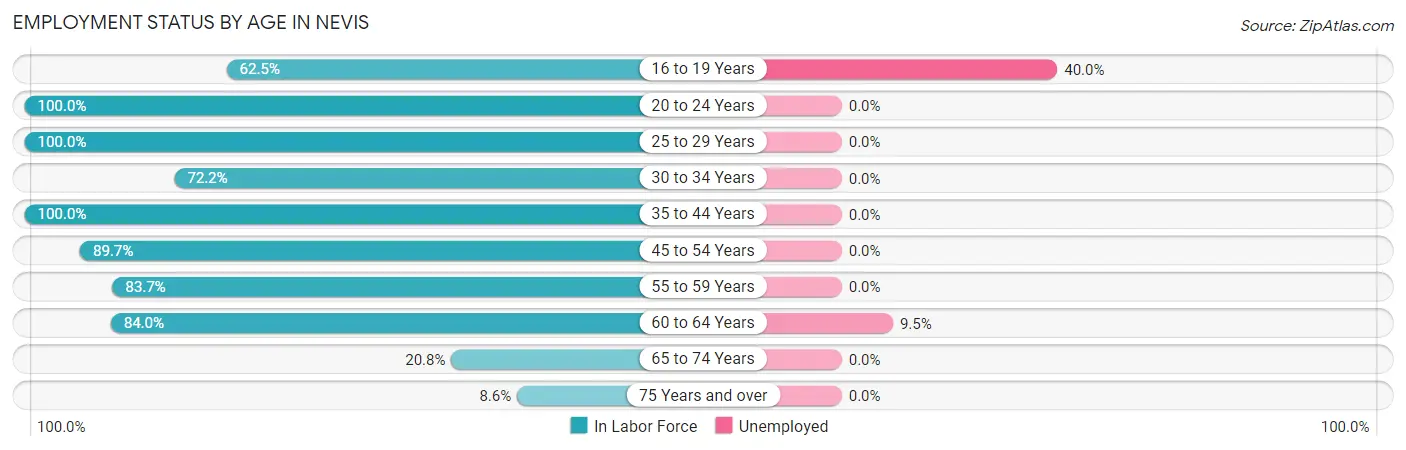
| Age Bracket | In Labor Force | Unemployed |
| 16 to 19 Years | 5 (62.5%) | 2 (40.0%) |
| 20 to 24 Years | 3 (100.0%) | 0 (0.0%) |
| 25 to 29 Years | 7 (100.0%) | 0 (0.0%) |
| 30 to 34 Years | 39 (72.2%) | 0 (0.0%) |
| 35 to 44 Years | 33 (100.0%) | 0 (0.0%) |
| 45 to 54 Years | 35 (89.7%) | 0 (0.0%) |
| 55 to 59 Years | 41 (83.7%) | 0 (0.0%) |
| 60 to 64 Years | 21 (84.0%) | 2 (9.5%) |
| 65 to 74 Years | 10 (20.8%) | 0 (0.0%) |
| 75 Years and over | 3 (8.6%) | 0 (0.0%) |
| Total | 197 (65.4%) | 4 (2.0%) |
Employment Status by Educational Attainment in Nevis
According to labor force statistics for Nevis, 85.0% of individuals (176) out of the total population between 25 and 64 years of age (207) are in the labor force, with 1.1% or 2 of them being unemployed. The group with the highest labor force participation rate are those with the educational attainment of bachelor's degree or higher, with 96.0% or 48 individuals in the labor force. Within the labor force, individuals with high school diploma education have the highest percentage of unemployment, with 2.6% or 1 of them being unemployed.
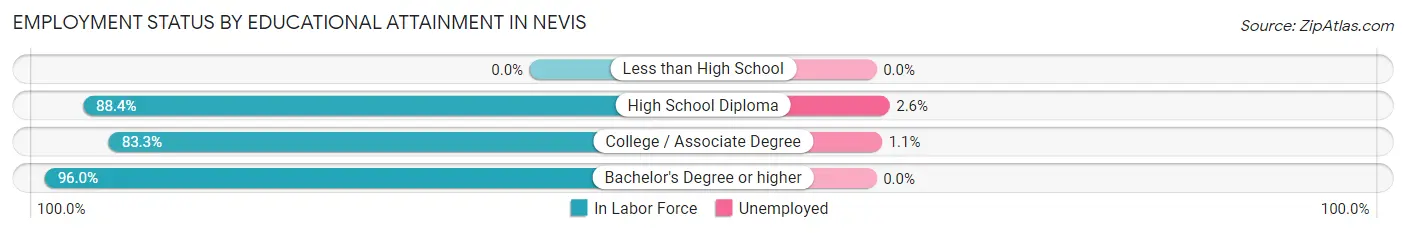
| Educational Attainment | In Labor Force | Unemployed |
| Less than High School | 0 (0.0%) | 0 (0.0%) |
| High School Diploma | 38 (88.4%) | 1 (2.6%) |
| College / Associate Degree | 90 (83.3%) | 1 (1.1%) |
| Bachelor's Degree or higher | 48 (96.0%) | 0 (0.0%) |
| Total | 176 (85.0%) | 2 (1.1%) |
Employment Occupations by Sex in Nevis
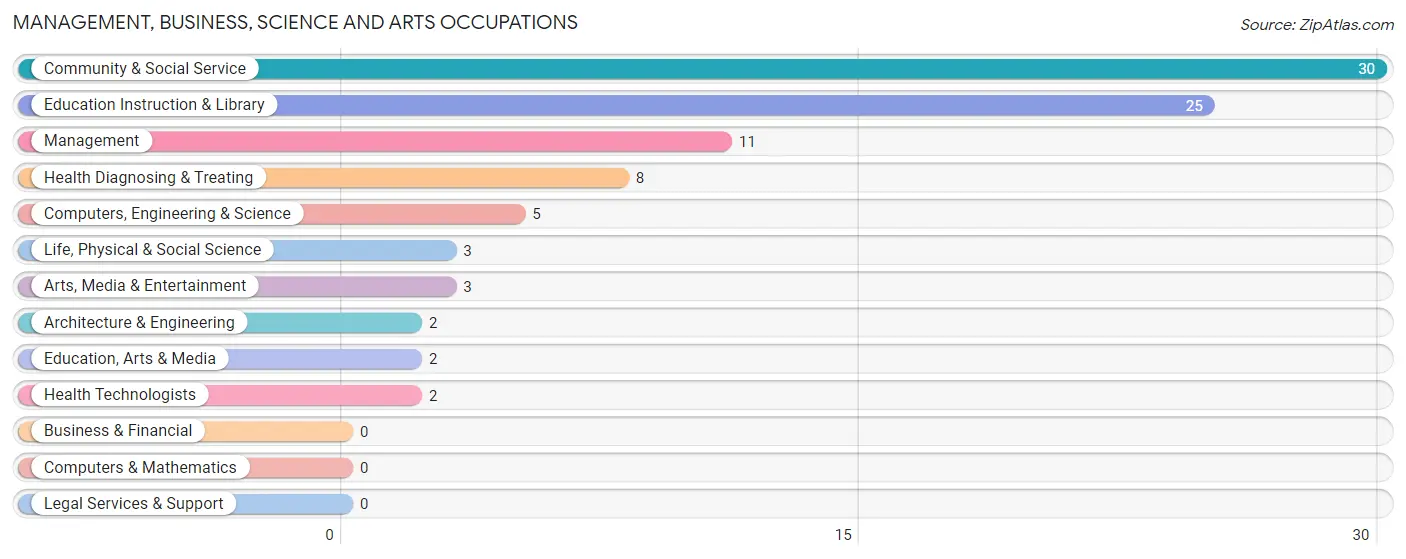
Management, Business, Science and Arts Occupations
The most common Management, Business, Science and Arts occupations in Nevis are Community & Social Service (30 | 15.5%), Education Instruction & Library (25 | 13.0%), Management (11 | 5.7%), Health Diagnosing & Treating (8 | 4.2%), and Computers, Engineering & Science (5 | 2.6%).
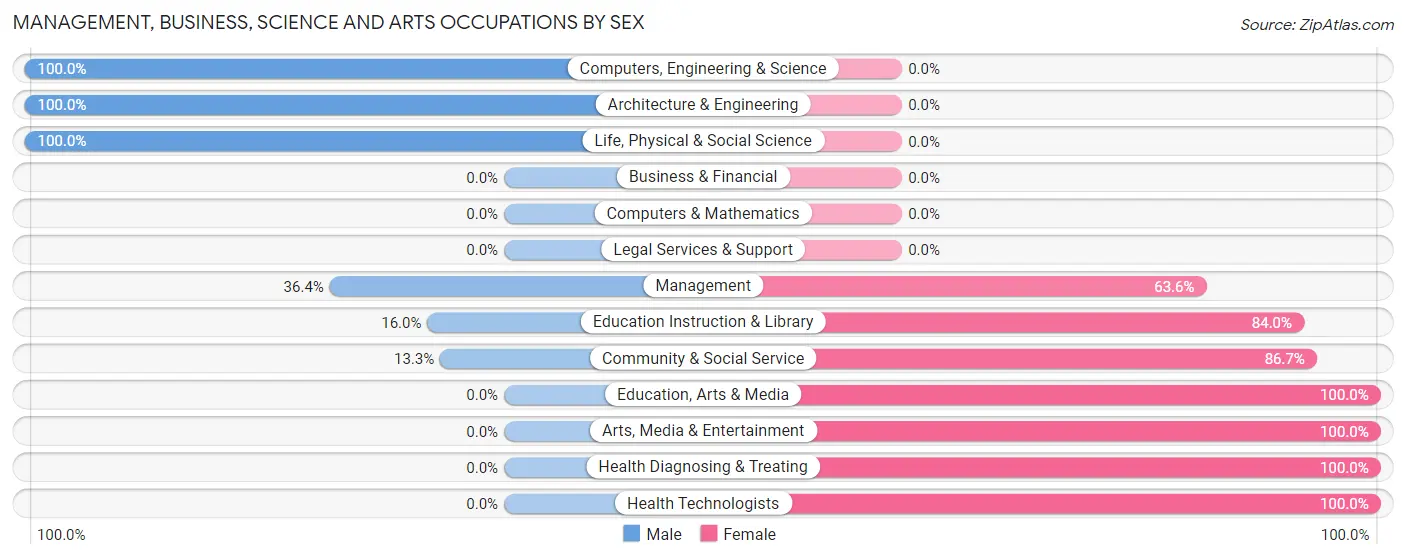
Management, Business, Science and Arts Occupations by Sex
Within the Management, Business, Science and Arts occupations in Nevis, the most male-oriented occupations are Computers, Engineering & Science (100.0%), Architecture & Engineering (100.0%), and Life, Physical & Social Science (100.0%), while the most female-oriented occupations are Education, Arts & Media (100.0%), Arts, Media & Entertainment (100.0%), and Health Diagnosing & Treating (100.0%).
| Occupation | Male | Female |
| Management | 4 (36.4%) | 7 (63.6%) |
| Business & Financial | 0 (0.0%) | 0 (0.0%) |
| Computers, Engineering & Science | 5 (100.0%) | 0 (0.0%) |
| Computers & Mathematics | 0 (0.0%) | 0 (0.0%) |
| Architecture & Engineering | 2 (100.0%) | 0 (0.0%) |
| Life, Physical & Social Science | 3 (100.0%) | 0 (0.0%) |
| Community & Social Service | 4 (13.3%) | 26 (86.7%) |
| Education, Arts & Media | 0 (0.0%) | 2 (100.0%) |
| Legal Services & Support | 0 (0.0%) | 0 (0.0%) |
| Education Instruction & Library | 4 (16.0%) | 21 (84.0%) |
| Arts, Media & Entertainment | 0 (0.0%) | 3 (100.0%) |
| Health Diagnosing & Treating | 0 (0.0%) | 8 (100.0%) |
| Health Technologists | 0 (0.0%) | 2 (100.0%) |
| Total (Category) | 13 (24.1%) | 41 (75.9%) |
| Total (Overall) | 93 (48.2%) | 100 (51.8%) |
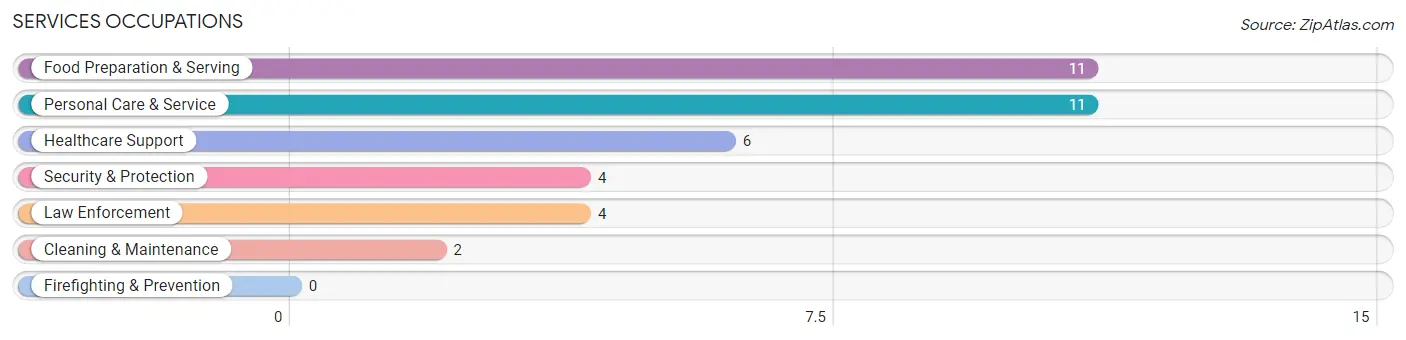
Services Occupations
The most common Services occupations in Nevis are Food Preparation & Serving (11 | 5.7%), Personal Care & Service (11 | 5.7%), Healthcare Support (6 | 3.1%), Security & Protection (4 | 2.1%), and Law Enforcement (4 | 2.1%).
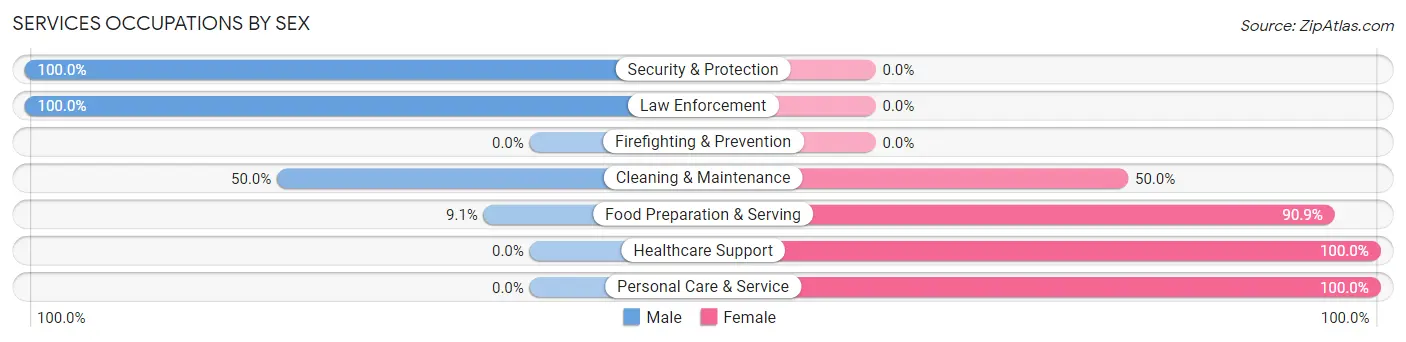
Services Occupations by Sex
Within the Services occupations in Nevis, the most male-oriented occupations are Security & Protection (100.0%), Law Enforcement (100.0%), and Cleaning & Maintenance (50.0%), while the most female-oriented occupations are Healthcare Support (100.0%), Personal Care & Service (100.0%), and Food Preparation & Serving (90.9%).
| Occupation | Male | Female |
| Healthcare Support | 0 (0.0%) | 6 (100.0%) |
| Security & Protection | 4 (100.0%) | 0 (0.0%) |
| Firefighting & Prevention | 0 (0.0%) | 0 (0.0%) |
| Law Enforcement | 4 (100.0%) | 0 (0.0%) |
| Food Preparation & Serving | 1 (9.1%) | 10 (90.9%) |
| Cleaning & Maintenance | 1 (50.0%) | 1 (50.0%) |
| Personal Care & Service | 0 (0.0%) | 11 (100.0%) |
| Total (Category) | 6 (17.6%) | 28 (82.4%) |
| Total (Overall) | 93 (48.2%) | 100 (51.8%) |
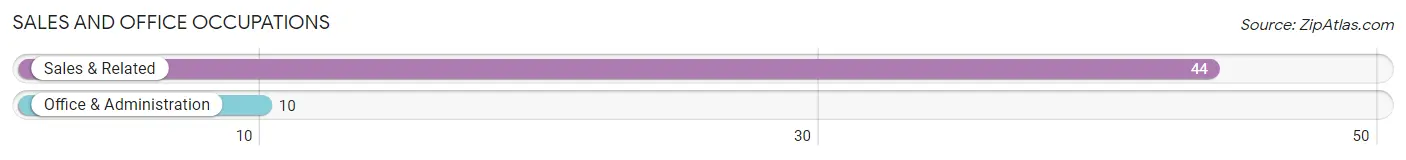
Sales and Office Occupations
The most common Sales and Office occupations in Nevis are Sales & Related (44 | 22.8%), and Office & Administration (10 | 5.2%).
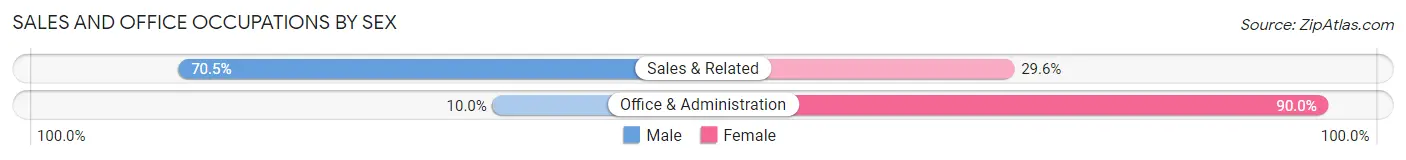
Sales and Office Occupations by Sex
| Occupation | Male | Female |
| Sales & Related | 31 (70.5%) | 13 (29.5%) |
| Office & Administration | 1 (10.0%) | 9 (90.0%) |
| Total (Category) | 32 (59.3%) | 22 (40.7%) |
| Total (Overall) | 93 (48.2%) | 100 (51.8%) |
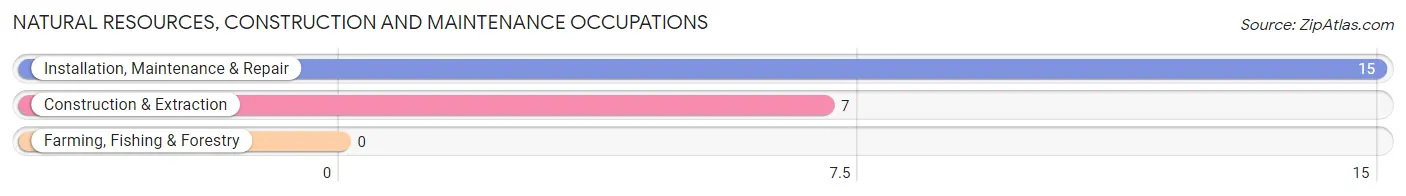
Natural Resources, Construction and Maintenance Occupations
The most common Natural Resources, Construction and Maintenance occupations in Nevis are Installation, Maintenance & Repair (15 | 7.8%), and Construction & Extraction (7 | 3.6%).
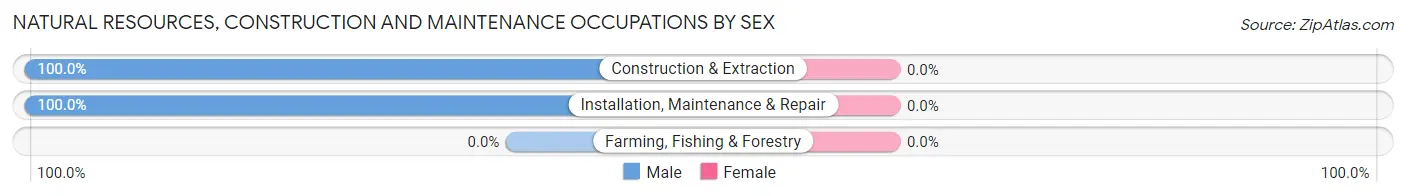
Natural Resources, Construction and Maintenance Occupations by Sex
| Occupation | Male | Female |
| Farming, Fishing & Forestry | 0 (0.0%) | 0 (0.0%) |
| Construction & Extraction | 7 (100.0%) | 0 (0.0%) |
| Installation, Maintenance & Repair | 15 (100.0%) | 0 (0.0%) |
| Total (Category) | 22 (100.0%) | 0 (0.0%) |
| Total (Overall) | 93 (48.2%) | 100 (51.8%) |
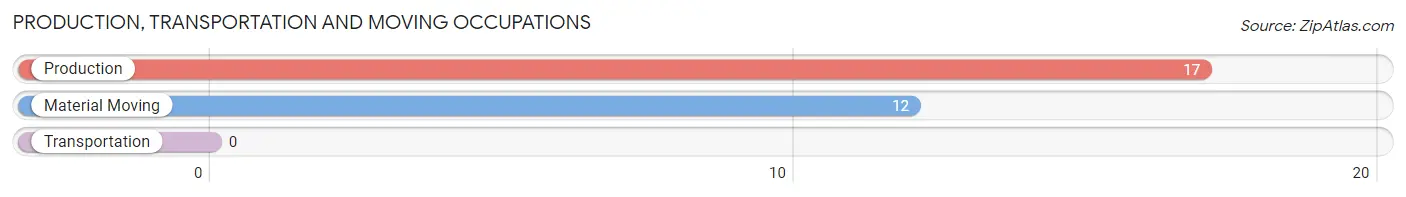
Production, Transportation and Moving Occupations
The most common Production, Transportation and Moving occupations in Nevis are Production (17 | 8.8%), and Material Moving (12 | 6.2%).
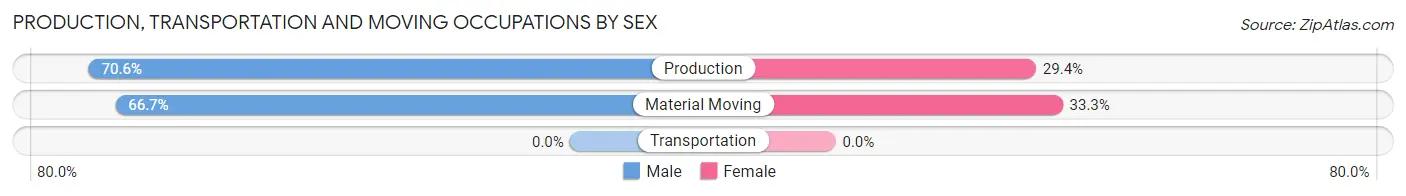
Production, Transportation and Moving Occupations by Sex
| Occupation | Male | Female |
| Production | 12 (70.6%) | 5 (29.4%) |
| Transportation | 0 (0.0%) | 0 (0.0%) |
| Material Moving | 8 (66.7%) | 4 (33.3%) |
| Total (Category) | 20 (69.0%) | 9 (31.0%) |
| Total (Overall) | 93 (48.2%) | 100 (51.8%) |
Employment Industries by Sex in Nevis
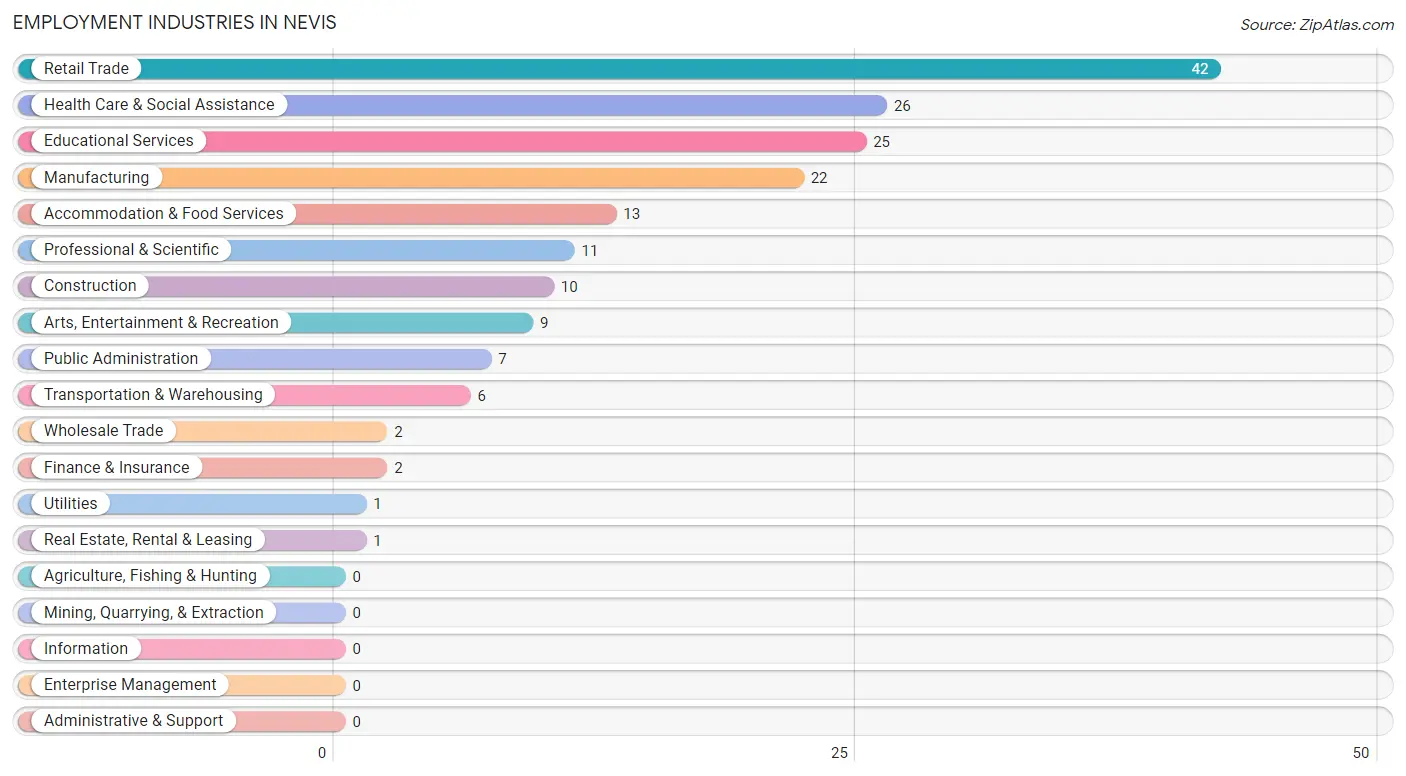
Employment Industries in Nevis
The major employment industries in Nevis include Retail Trade (42 | 21.8%), Health Care & Social Assistance (26 | 13.5%), Educational Services (25 | 13.0%), Manufacturing (22 | 11.4%), and Accommodation & Food Services (13 | 6.7%).
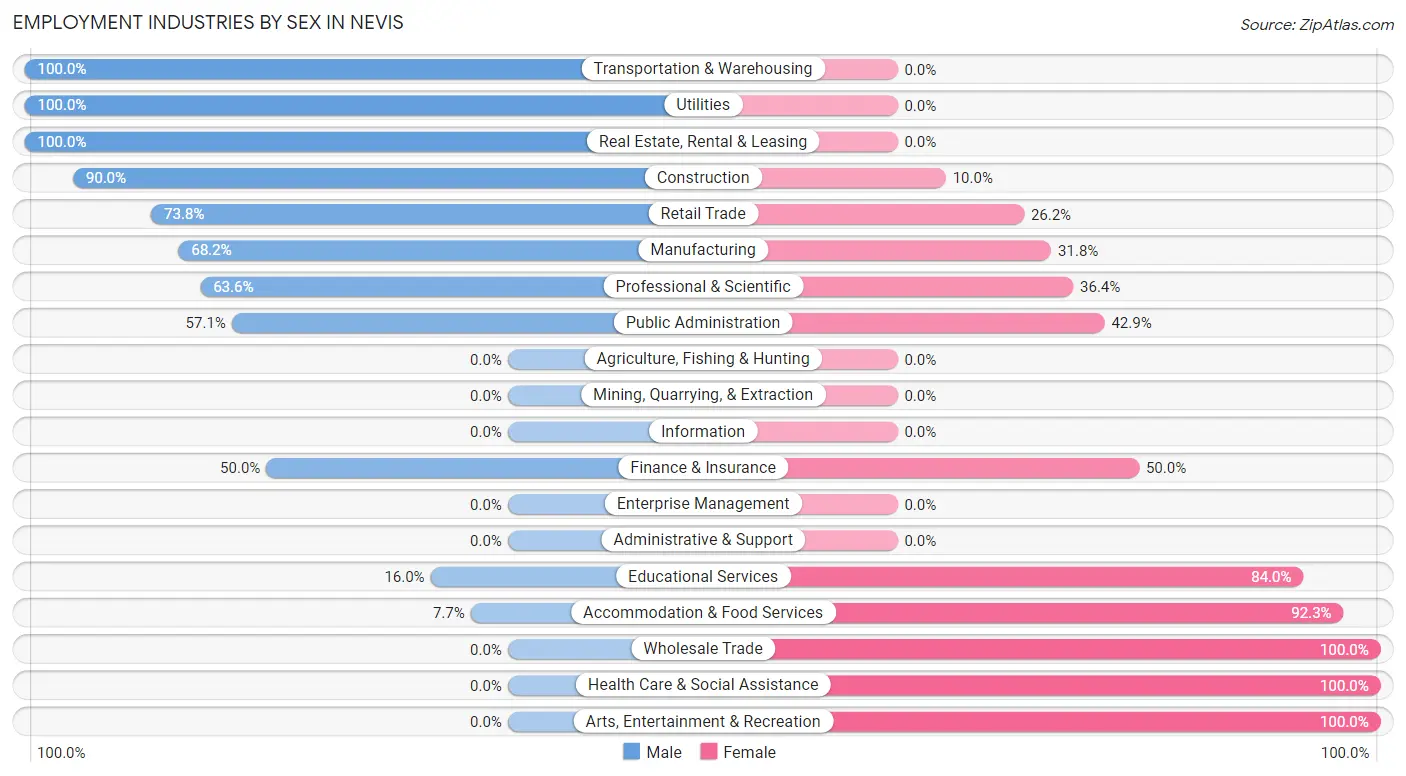
Employment Industries by Sex in Nevis
The Nevis industries that see more men than women are Transportation & Warehousing (100.0%), Utilities (100.0%), and Real Estate, Rental & Leasing (100.0%), whereas the industries that tend to have a higher number of women are Wholesale Trade (100.0%), Health Care & Social Assistance (100.0%), and Arts, Entertainment & Recreation (100.0%).
| Industry | Male | Female |
| Agriculture, Fishing & Hunting | 0 (0.0%) | 0 (0.0%) |
| Mining, Quarrying, & Extraction | 0 (0.0%) | 0 (0.0%) |
| Construction | 9 (90.0%) | 1 (10.0%) |
| Manufacturing | 15 (68.2%) | 7 (31.8%) |
| Wholesale Trade | 0 (0.0%) | 2 (100.0%) |
| Retail Trade | 31 (73.8%) | 11 (26.2%) |
| Transportation & Warehousing | 6 (100.0%) | 0 (0.0%) |
| Utilities | 1 (100.0%) | 0 (0.0%) |
| Information | 0 (0.0%) | 0 (0.0%) |
| Finance & Insurance | 1 (50.0%) | 1 (50.0%) |
| Real Estate, Rental & Leasing | 1 (100.0%) | 0 (0.0%) |
| Professional & Scientific | 7 (63.6%) | 4 (36.4%) |
| Enterprise Management | 0 (0.0%) | 0 (0.0%) |
| Administrative & Support | 0 (0.0%) | 0 (0.0%) |
| Educational Services | 4 (16.0%) | 21 (84.0%) |
| Health Care & Social Assistance | 0 (0.0%) | 26 (100.0%) |
| Arts, Entertainment & Recreation | 0 (0.0%) | 9 (100.0%) |
| Accommodation & Food Services | 1 (7.7%) | 12 (92.3%) |
| Public Administration | 4 (57.1%) | 3 (42.9%) |
| Total | 93 (48.2%) | 100 (51.8%) |
Education in Nevis
School Enrollment in Nevis
The most common levels of schooling among the 82 students in Nevis are kindergarten (24 | 29.3%), high school (21 | 25.6%), and elementary school (14 | 17.1%).
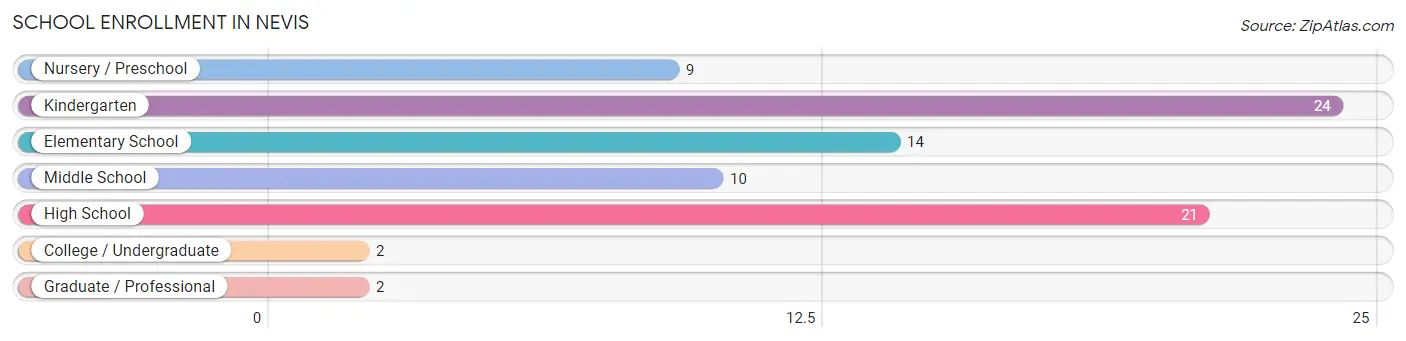
| School Level | # Students | % Students |
| Nursery / Preschool | 9 | 11.0% |
| Kindergarten | 24 | 29.3% |
| Elementary School | 14 | 17.1% |
| Middle School | 10 | 12.2% |
| High School | 21 | 25.6% |
| College / Undergraduate | 2 | 2.4% |
| Graduate / Professional | 2 | 2.4% |
| Total | 82 | 100.0% |
School Enrollment by Age by Funding Source in Nevis
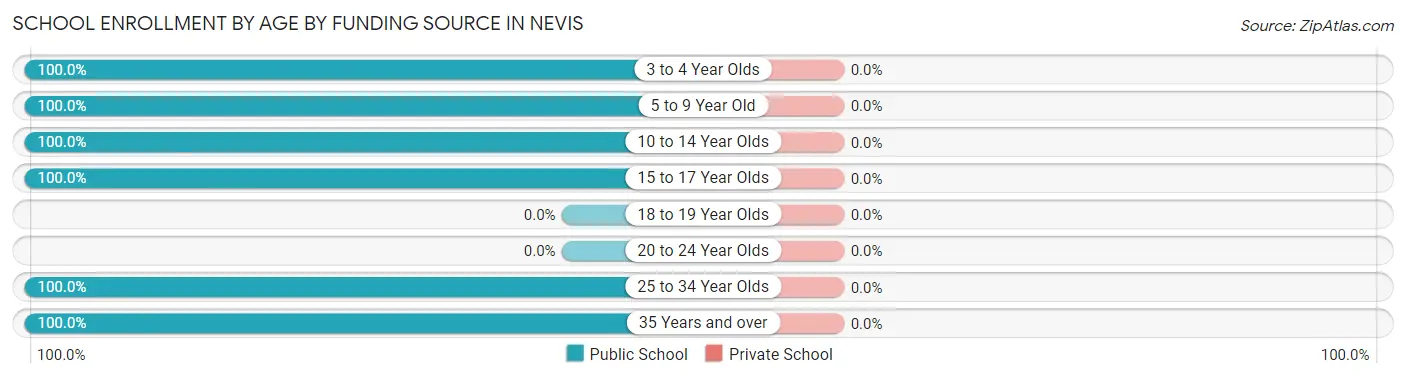
| Age Bracket | Public School | Private School |
| 3 to 4 Year Olds | 9 (100.0%) | 0 (0.0%) |
| 5 to 9 Year Old | 35 (100.0%) | 0 (0.0%) |
| 10 to 14 Year Olds | 19 (100.0%) | 0 (0.0%) |
| 15 to 17 Year Olds | 15 (100.0%) | 0 (0.0%) |
| 18 to 19 Year Olds | 0 (0.0%) | 0 (0.0%) |
| 20 to 24 Year Olds | 0 (0.0%) | 0 (0.0%) |
| 25 to 34 Year Olds | 2 (100.0%) | 0 (0.0%) |
| 35 Years and over | 2 (100.0%) | 0 (0.0%) |
| Total | 82 (100.0%) | 0 (0.0%) |
Educational Attainment by Field of Study in Nevis
Education (35 | 50.0%), psychology (5 | 7.1%), science & technology (5 | 7.1%), literature & languages (5 | 7.1%), and bio, nature & agricultural (4 | 5.7%) are the most common fields of study among 70 individuals in Nevis who have obtained a bachelor's degree or higher.
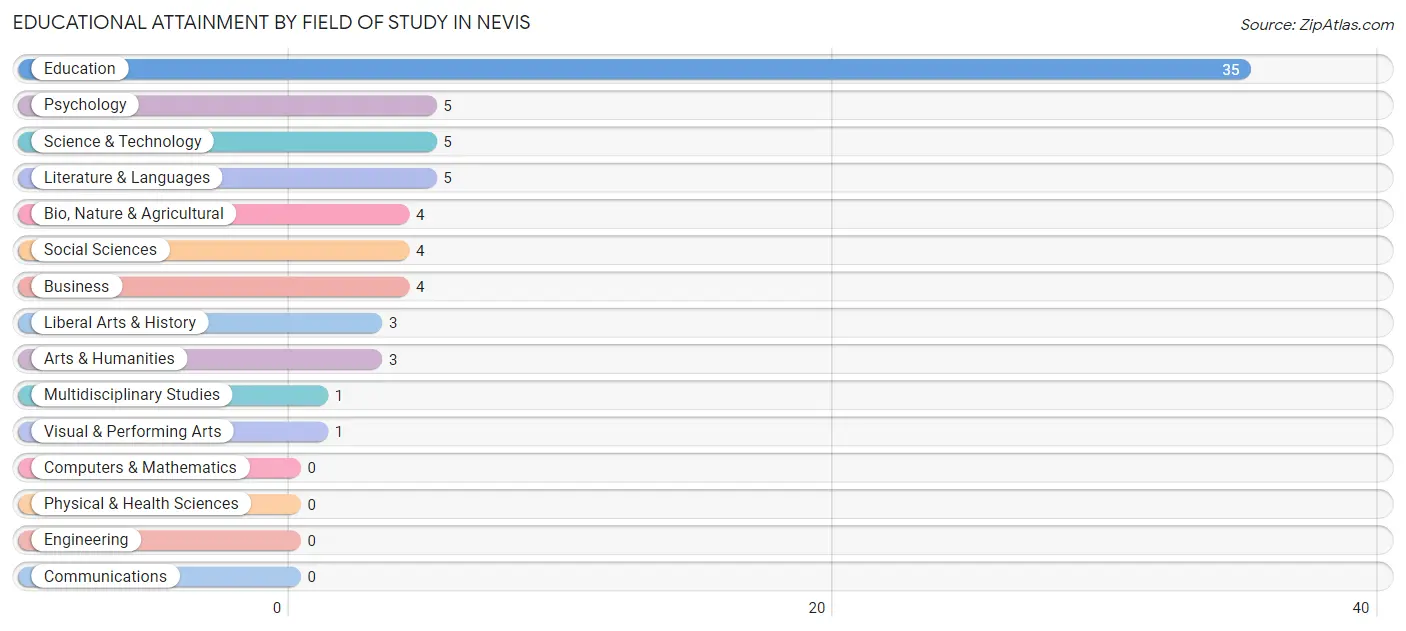
| Field of Study | # Graduates | % Graduates |
| Computers & Mathematics | 0 | 0.0% |
| Bio, Nature & Agricultural | 4 | 5.7% |
| Physical & Health Sciences | 0 | 0.0% |
| Psychology | 5 | 7.1% |
| Social Sciences | 4 | 5.7% |
| Engineering | 0 | 0.0% |
| Multidisciplinary Studies | 1 | 1.4% |
| Science & Technology | 5 | 7.1% |
| Business | 4 | 5.7% |
| Education | 35 | 50.0% |
| Literature & Languages | 5 | 7.1% |
| Liberal Arts & History | 3 | 4.3% |
| Visual & Performing Arts | 1 | 1.4% |
| Communications | 0 | 0.0% |
| Arts & Humanities | 3 | 4.3% |
| Total | 70 | 100.0% |
Transportation & Commute in Nevis
Vehicle Availability by Sex in Nevis
The most prevalent vehicle ownership categories in Nevis are males with 2 vehicles (46, accounting for 51.7%) and females with 2 vehicles (34, making up 46.0%).
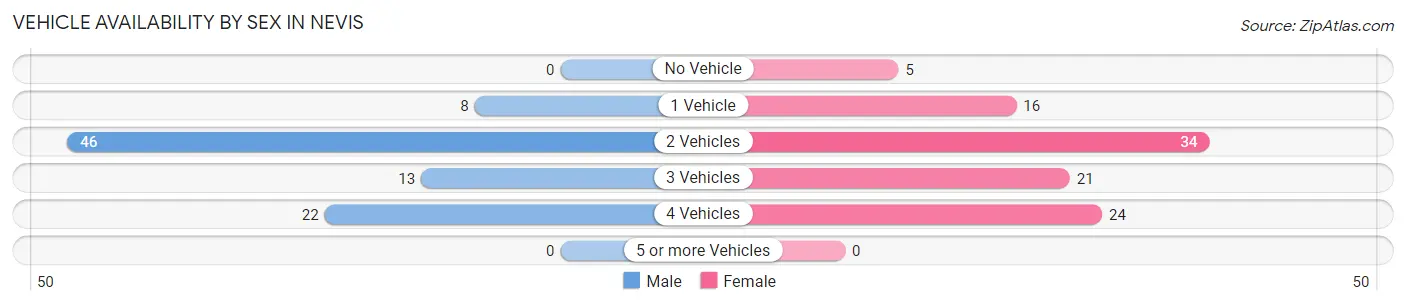
| Vehicles Available | Male | Female |
| No Vehicle | 0 (0.0%) | 5 (5.0%) |
| 1 Vehicle | 8 (9.0%) | 16 (16.0%) |
| 2 Vehicles | 46 (51.7%) | 34 (34.0%) |
| 3 Vehicles | 13 (14.6%) | 21 (21.0%) |
| 4 Vehicles | 22 (24.7%) | 24 (24.0%) |
| 5 or more Vehicles | 0 (0.0%) | 0 (0.0%) |
| Total | 89 (100.0%) | 100 (100.0%) |
Commute Time in Nevis
The most frequently occuring commute durations in Nevis are 20 to 24 minutes (79 commuters, 47.0%), 15 to 19 minutes (22 commuters, 13.1%), and 25 to 29 minutes (16 commuters, 9.5%).
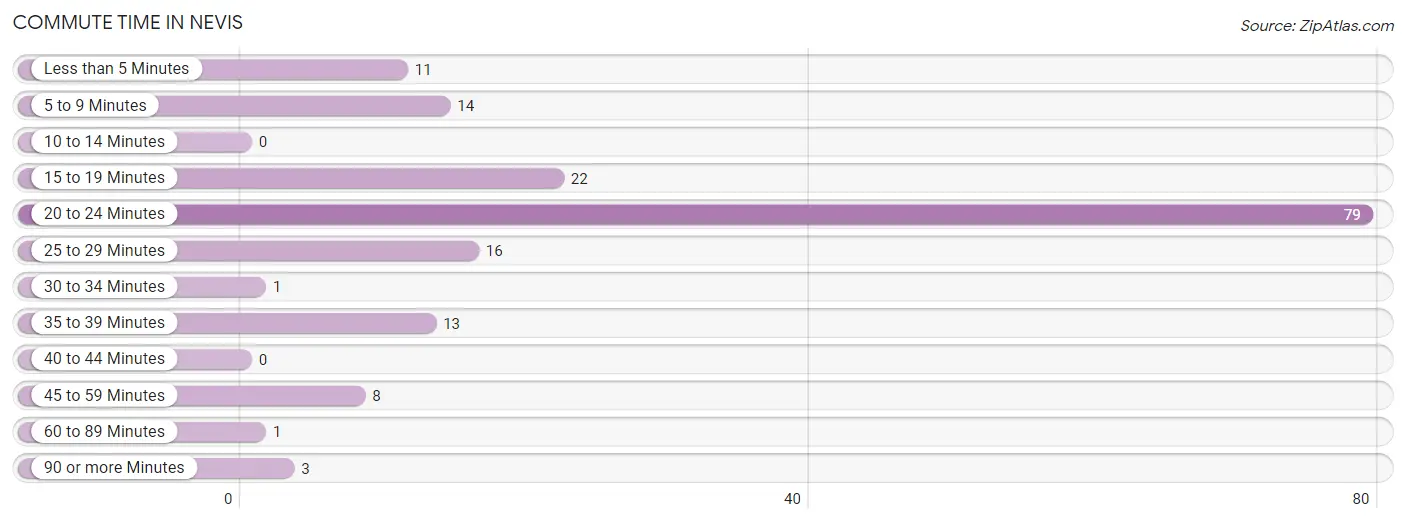
| Commute Time | # Commuters | % Commuters |
| Less than 5 Minutes | 11 | 6.6% |
| 5 to 9 Minutes | 14 | 8.3% |
| 10 to 14 Minutes | 0 | 0.0% |
| 15 to 19 Minutes | 22 | 13.1% |
| 20 to 24 Minutes | 79 | 47.0% |
| 25 to 29 Minutes | 16 | 9.5% |
| 30 to 34 Minutes | 1 | 0.6% |
| 35 to 39 Minutes | 13 | 7.7% |
| 40 to 44 Minutes | 0 | 0.0% |
| 45 to 59 Minutes | 8 | 4.8% |
| 60 to 89 Minutes | 1 | 0.6% |
| 90 or more Minutes | 3 | 1.8% |
Commute Time by Sex in Nevis
The most common commute times in Nevis are 20 to 24 minutes (50 commuters, 59.5%) for males and 20 to 24 minutes (29 commuters, 34.5%) for females.
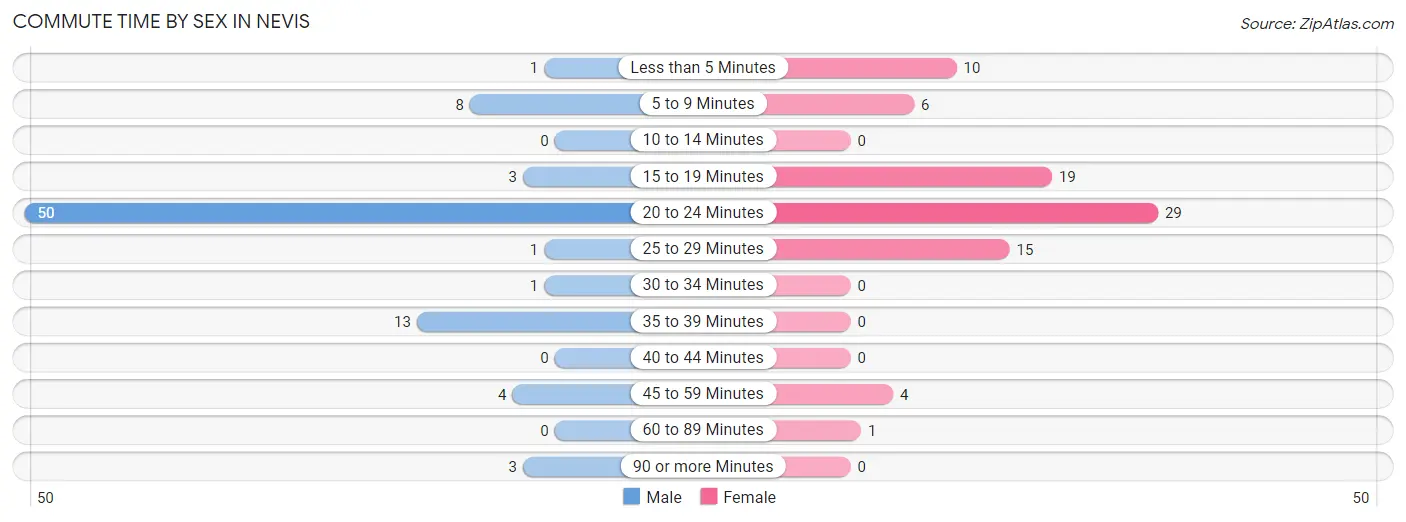
| Commute Time | Male | Female |
| Less than 5 Minutes | 1 (1.2%) | 10 (11.9%) |
| 5 to 9 Minutes | 8 (9.5%) | 6 (7.1%) |
| 10 to 14 Minutes | 0 (0.0%) | 0 (0.0%) |
| 15 to 19 Minutes | 3 (3.6%) | 19 (22.6%) |
| 20 to 24 Minutes | 50 (59.5%) | 29 (34.5%) |
| 25 to 29 Minutes | 1 (1.2%) | 15 (17.9%) |
| 30 to 34 Minutes | 1 (1.2%) | 0 (0.0%) |
| 35 to 39 Minutes | 13 (15.5%) | 0 (0.0%) |
| 40 to 44 Minutes | 0 (0.0%) | 0 (0.0%) |
| 45 to 59 Minutes | 4 (4.8%) | 4 (4.8%) |
| 60 to 89 Minutes | 0 (0.0%) | 1 (1.2%) |
| 90 or more Minutes | 3 (3.6%) | 0 (0.0%) |
Time of Departure to Work by Sex in Nevis
The most frequent times of departure to work in Nevis are 7:00 AM to 7:29 AM (27, 32.1%) for males and 7:00 AM to 7:29 AM (25, 29.8%) for females.
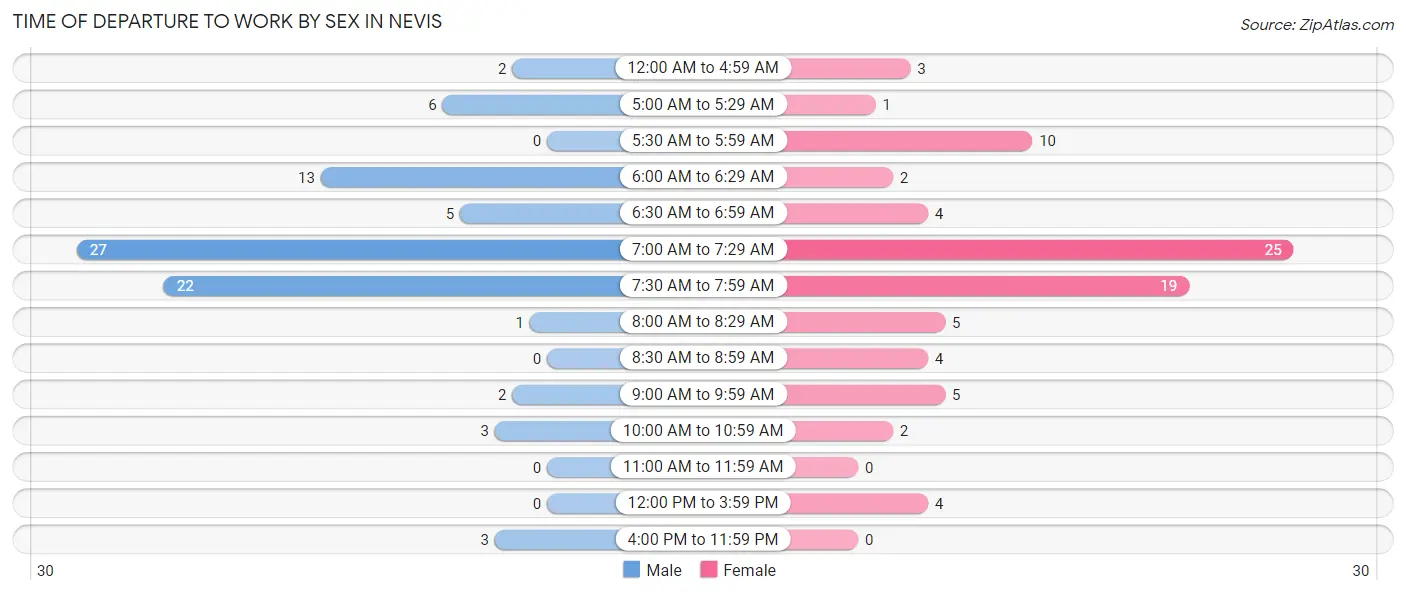
| Time of Departure | Male | Female |
| 12:00 AM to 4:59 AM | 2 (2.4%) | 3 (3.6%) |
| 5:00 AM to 5:29 AM | 6 (7.1%) | 1 (1.2%) |
| 5:30 AM to 5:59 AM | 0 (0.0%) | 10 (11.9%) |
| 6:00 AM to 6:29 AM | 13 (15.5%) | 2 (2.4%) |
| 6:30 AM to 6:59 AM | 5 (5.9%) | 4 (4.8%) |
| 7:00 AM to 7:29 AM | 27 (32.1%) | 25 (29.8%) |
| 7:30 AM to 7:59 AM | 22 (26.2%) | 19 (22.6%) |
| 8:00 AM to 8:29 AM | 1 (1.2%) | 5 (5.9%) |
| 8:30 AM to 8:59 AM | 0 (0.0%) | 4 (4.8%) |
| 9:00 AM to 9:59 AM | 2 (2.4%) | 5 (5.9%) |
| 10:00 AM to 10:59 AM | 3 (3.6%) | 2 (2.4%) |
| 11:00 AM to 11:59 AM | 0 (0.0%) | 0 (0.0%) |
| 12:00 PM to 3:59 PM | 0 (0.0%) | 4 (4.8%) |
| 4:00 PM to 11:59 PM | 3 (3.6%) | 0 (0.0%) |
| Total | 84 (100.0%) | 84 (100.0%) |
Housing Occupancy in Nevis
Occupancy by Ownership in Nevis
Of the total 170 dwellings in Nevis, owner-occupied units account for 146 (85.9%), while renter-occupied units make up 24 (14.1%).
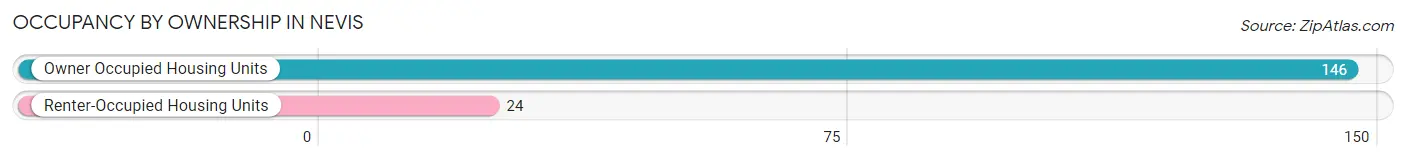
| Occupancy | # Housing Units | % Housing Units |
| Owner Occupied Housing Units | 146 | 85.9% |
| Renter-Occupied Housing Units | 24 | 14.1% |
| Total Occupied Housing Units | 170 | 100.0% |
Occupancy by Household Size in Nevis
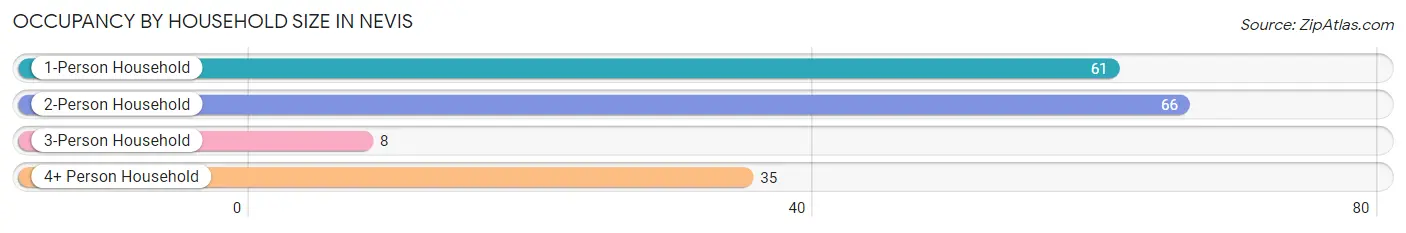
| Household Size | # Housing Units | % Housing Units |
| 1-Person Household | 61 | 35.9% |
| 2-Person Household | 66 | 38.8% |
| 3-Person Household | 8 | 4.7% |
| 4+ Person Household | 35 | 20.6% |
| Total Housing Units | 170 | 100.0% |
Occupancy by Ownership by Household Size in Nevis
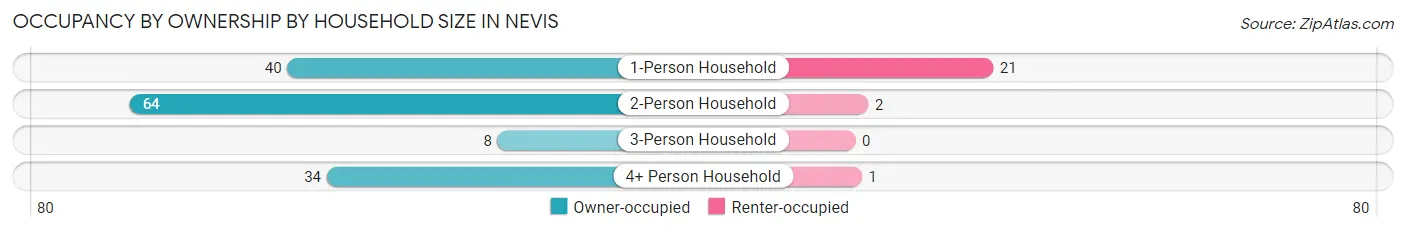
| Household Size | Owner-occupied | Renter-occupied |
| 1-Person Household | 40 (65.6%) | 21 (34.4%) |
| 2-Person Household | 64 (97.0%) | 2 (3.0%) |
| 3-Person Household | 8 (100.0%) | 0 (0.0%) |
| 4+ Person Household | 34 (97.1%) | 1 (2.9%) |
| Total Housing Units | 146 (85.9%) | 24 (14.1%) |
Occupancy by Educational Attainment in Nevis
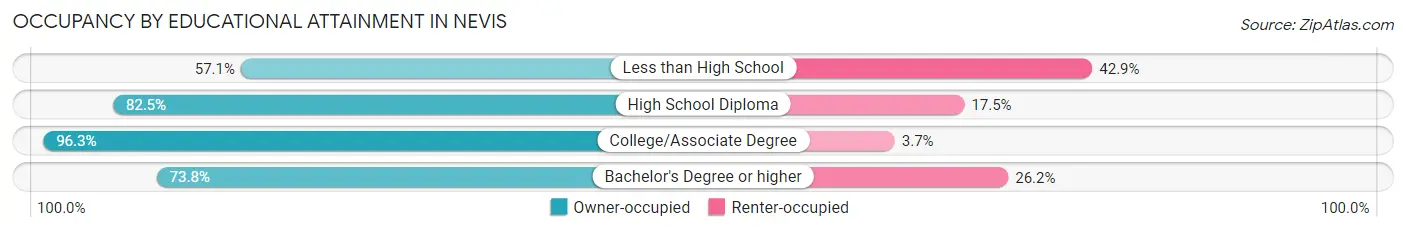
| Household Size | Owner-occupied | Renter-occupied |
| Less than High School | 4 (57.1%) | 3 (42.9%) |
| High School Diploma | 33 (82.5%) | 7 (17.5%) |
| College/Associate Degree | 78 (96.3%) | 3 (3.7%) |
| Bachelor's Degree or higher | 31 (73.8%) | 11 (26.2%) |
Occupancy by Age of Householder in Nevis
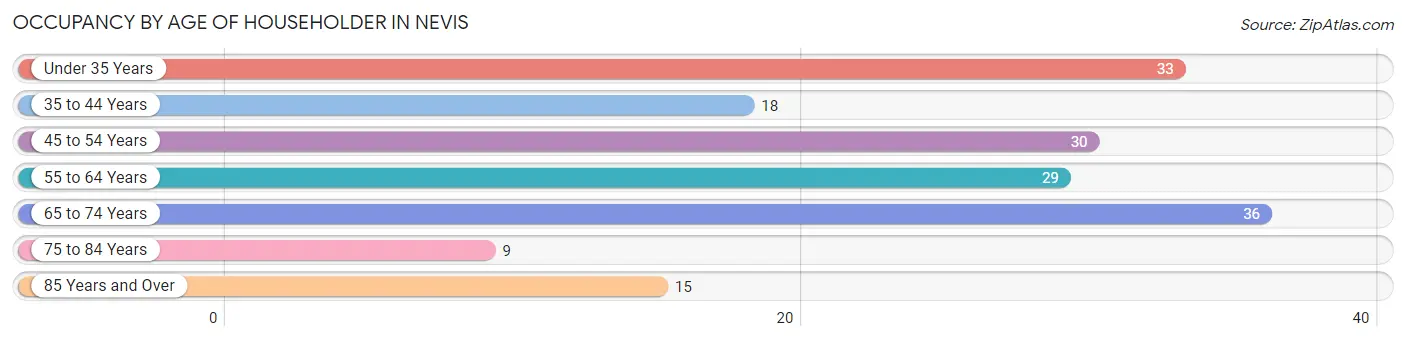
| Age Bracket | # Households | % Households |
| Under 35 Years | 33 | 19.4% |
| 35 to 44 Years | 18 | 10.6% |
| 45 to 54 Years | 30 | 17.6% |
| 55 to 64 Years | 29 | 17.1% |
| 65 to 74 Years | 36 | 21.2% |
| 75 to 84 Years | 9 | 5.3% |
| 85 Years and Over | 15 | 8.8% |
| Total | 170 | 100.0% |
Housing Finances in Nevis
Median Income by Occupancy in Nevis
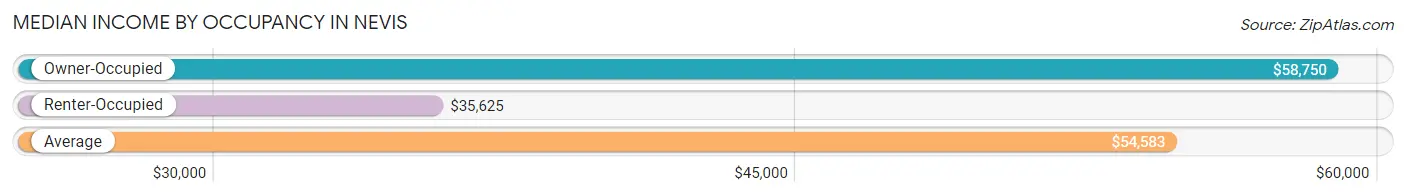
| Occupancy Type | # Households | Median Income |
| Owner-Occupied | 146 (85.9%) | $58,750 |
| Renter-Occupied | 24 (14.1%) | $35,625 |
| Average | 170 (100.0%) | $54,583 |
Occupancy by Householder Income Bracket in Nevis
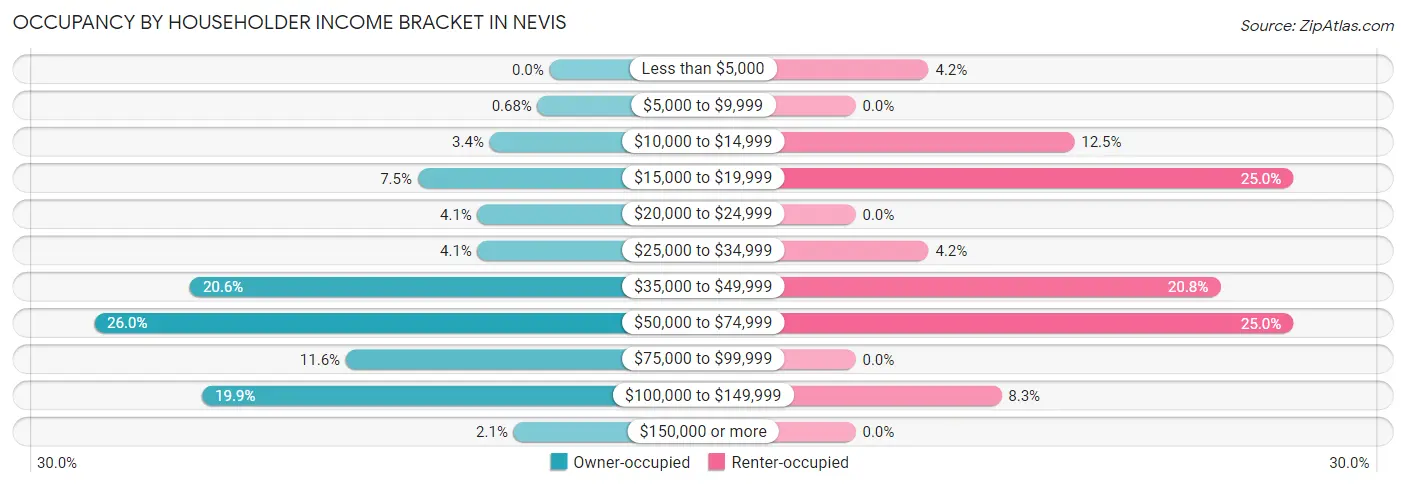
| Income Bracket | Owner-occupied | Renter-occupied |
| Less than $5,000 | 0 (0.0%) | 1 (4.2%) |
| $5,000 to $9,999 | 1 (0.7%) | 0 (0.0%) |
| $10,000 to $14,999 | 5 (3.4%) | 3 (12.5%) |
| $15,000 to $19,999 | 11 (7.5%) | 6 (25.0%) |
| $20,000 to $24,999 | 6 (4.1%) | 0 (0.0%) |
| $25,000 to $34,999 | 6 (4.1%) | 1 (4.2%) |
| $35,000 to $49,999 | 30 (20.5%) | 5 (20.8%) |
| $50,000 to $74,999 | 38 (26.0%) | 6 (25.0%) |
| $75,000 to $99,999 | 17 (11.6%) | 0 (0.0%) |
| $100,000 to $149,999 | 29 (19.9%) | 2 (8.3%) |
| $150,000 or more | 3 (2.1%) | 0 (0.0%) |
| Total | 146 (100.0%) | 24 (100.0%) |
Monthly Housing Cost Tiers in Nevis
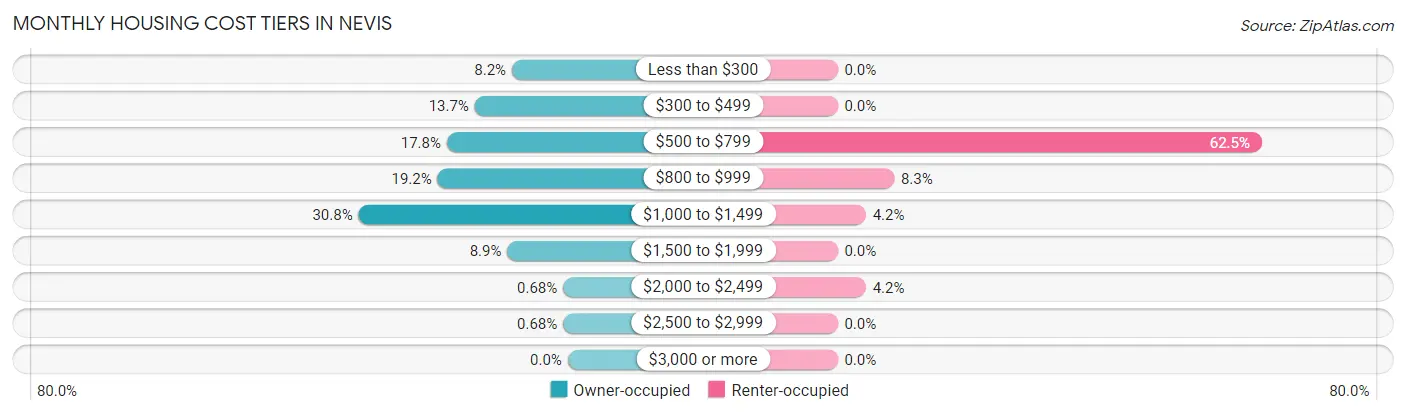
| Monthly Cost | Owner-occupied | Renter-occupied |
| Less than $300 | 12 (8.2%) | 0 (0.0%) |
| $300 to $499 | 20 (13.7%) | 0 (0.0%) |
| $500 to $799 | 26 (17.8%) | 15 (62.5%) |
| $800 to $999 | 28 (19.2%) | 2 (8.3%) |
| $1,000 to $1,499 | 45 (30.8%) | 1 (4.2%) |
| $1,500 to $1,999 | 13 (8.9%) | 0 (0.0%) |
| $2,000 to $2,499 | 1 (0.7%) | 1 (4.2%) |
| $2,500 to $2,999 | 1 (0.7%) | 0 (0.0%) |
| $3,000 or more | 0 (0.0%) | 0 (0.0%) |
| Total | 146 (100.0%) | 24 (100.0%) |
Physical Housing Characteristics in Nevis
Housing Structures in Nevis
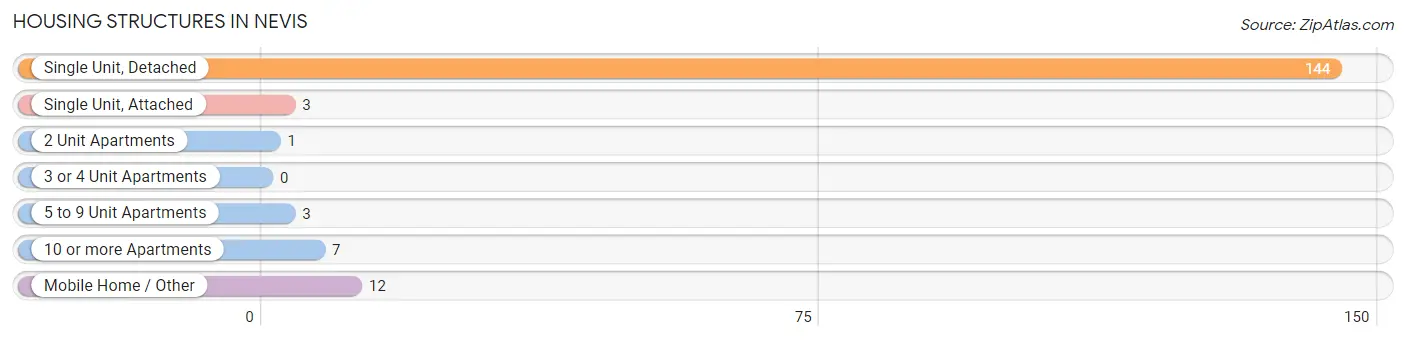
| Structure Type | # Housing Units | % Housing Units |
| Single Unit, Detached | 144 | 84.7% |
| Single Unit, Attached | 3 | 1.8% |
| 2 Unit Apartments | 1 | 0.6% |
| 3 or 4 Unit Apartments | 0 | 0.0% |
| 5 to 9 Unit Apartments | 3 | 1.8% |
| 10 or more Apartments | 7 | 4.1% |
| Mobile Home / Other | 12 | 7.1% |
| Total | 170 | 100.0% |
Housing Structures by Occupancy in Nevis
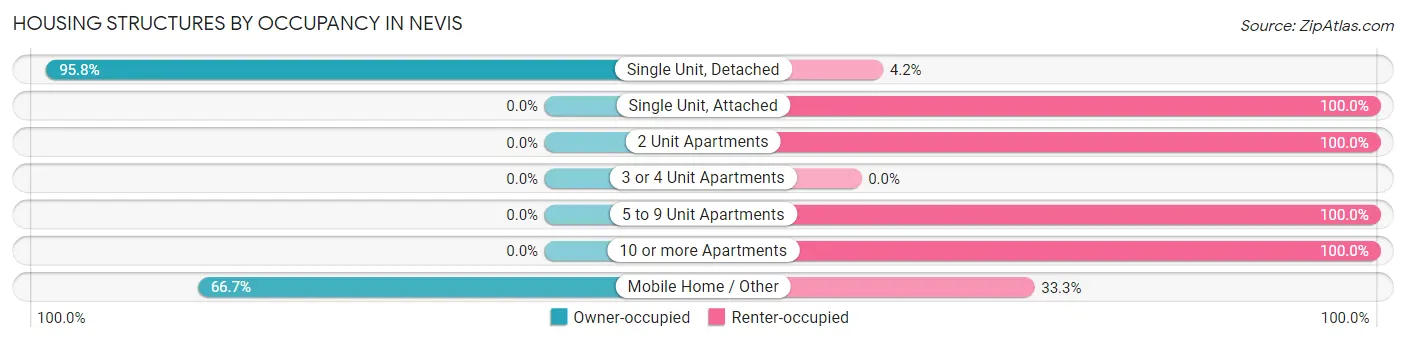
| Structure Type | Owner-occupied | Renter-occupied |
| Single Unit, Detached | 138 (95.8%) | 6 (4.2%) |
| Single Unit, Attached | 0 (0.0%) | 3 (100.0%) |
| 2 Unit Apartments | 0 (0.0%) | 1 (100.0%) |
| 3 or 4 Unit Apartments | 0 (0.0%) | 0 (0.0%) |
| 5 to 9 Unit Apartments | 0 (0.0%) | 3 (100.0%) |
| 10 or more Apartments | 0 (0.0%) | 7 (100.0%) |
| Mobile Home / Other | 8 (66.7%) | 4 (33.3%) |
| Total | 146 (85.9%) | 24 (14.1%) |
Housing Structures by Number of Rooms in Nevis
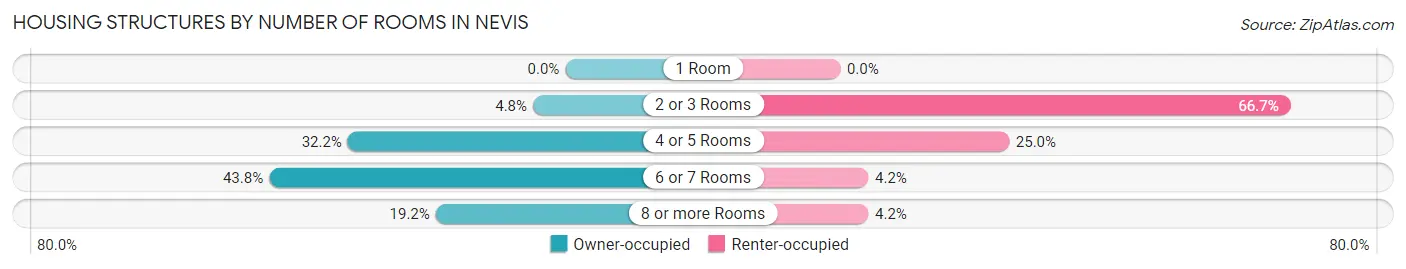
| Number of Rooms | Owner-occupied | Renter-occupied |
| 1 Room | 0 (0.0%) | 0 (0.0%) |
| 2 or 3 Rooms | 7 (4.8%) | 16 (66.7%) |
| 4 or 5 Rooms | 47 (32.2%) | 6 (25.0%) |
| 6 or 7 Rooms | 64 (43.8%) | 1 (4.2%) |
| 8 or more Rooms | 28 (19.2%) | 1 (4.2%) |
| Total | 146 (100.0%) | 24 (100.0%) |
Housing Structure by Heating Type in Nevis
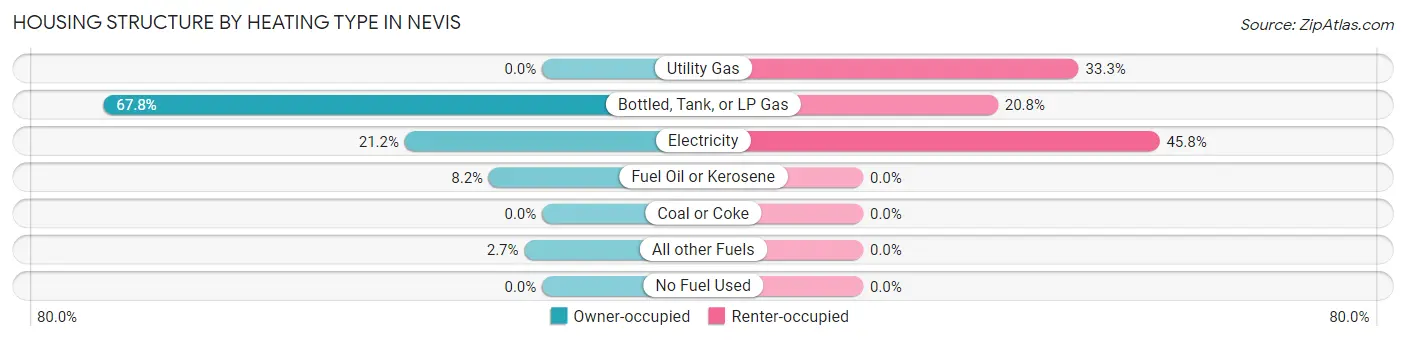
| Heating Type | Owner-occupied | Renter-occupied |
| Utility Gas | 0 (0.0%) | 8 (33.3%) |
| Bottled, Tank, or LP Gas | 99 (67.8%) | 5 (20.8%) |
| Electricity | 31 (21.2%) | 11 (45.8%) |
| Fuel Oil or Kerosene | 12 (8.2%) | 0 (0.0%) |
| Coal or Coke | 0 (0.0%) | 0 (0.0%) |
| All other Fuels | 4 (2.7%) | 0 (0.0%) |
| No Fuel Used | 0 (0.0%) | 0 (0.0%) |
| Total | 146 (100.0%) | 24 (100.0%) |
Household Vehicle Usage in Nevis
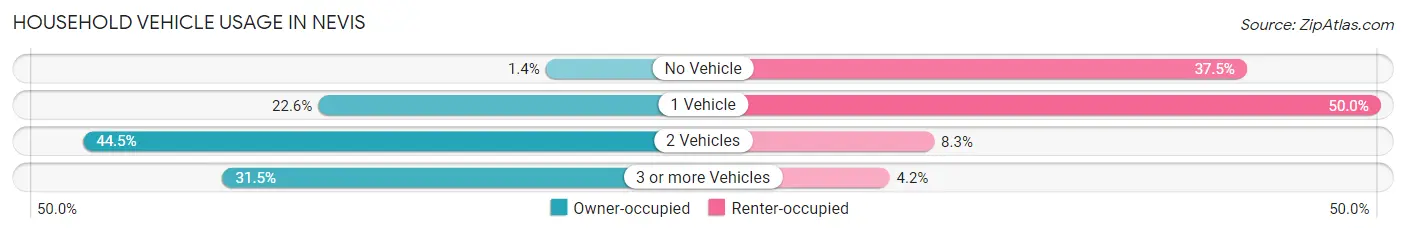
| Vehicles per Household | Owner-occupied | Renter-occupied |
| No Vehicle | 2 (1.4%) | 9 (37.5%) |
| 1 Vehicle | 33 (22.6%) | 12 (50.0%) |
| 2 Vehicles | 65 (44.5%) | 2 (8.3%) |
| 3 or more Vehicles | 46 (31.5%) | 1 (4.2%) |
| Total | 146 (100.0%) | 24 (100.0%) |
Real Estate & Mortgages in Nevis
Real Estate and Mortgage Overview in Nevis
| Characteristic | Without Mortgage | With Mortgage |
| Housing Units | 72 | 74 |
| Median Property Value | $225,000 | $159,200 |
| Median Household Income | $50,833 | $2 |
| Monthly Housing Costs | $619 | $0 |
| Real Estate Taxes | $2,889 | $1 |
Property Value by Mortgage Status in Nevis
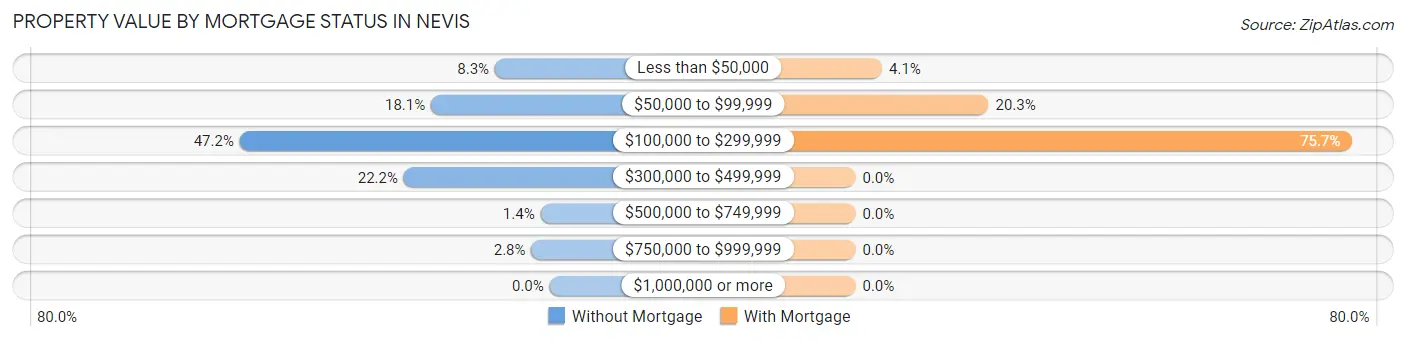
| Property Value | Without Mortgage | With Mortgage |
| Less than $50,000 | 6 (8.3%) | 3 (4.1%) |
| $50,000 to $99,999 | 13 (18.1%) | 15 (20.3%) |
| $100,000 to $299,999 | 34 (47.2%) | 56 (75.7%) |
| $300,000 to $499,999 | 16 (22.2%) | 0 (0.0%) |
| $500,000 to $749,999 | 1 (1.4%) | 0 (0.0%) |
| $750,000 to $999,999 | 2 (2.8%) | 0 (0.0%) |
| $1,000,000 or more | 0 (0.0%) | 0 (0.0%) |
| Total | 72 (100.0%) | 74 (100.0%) |
Household Income by Mortgage Status in Nevis
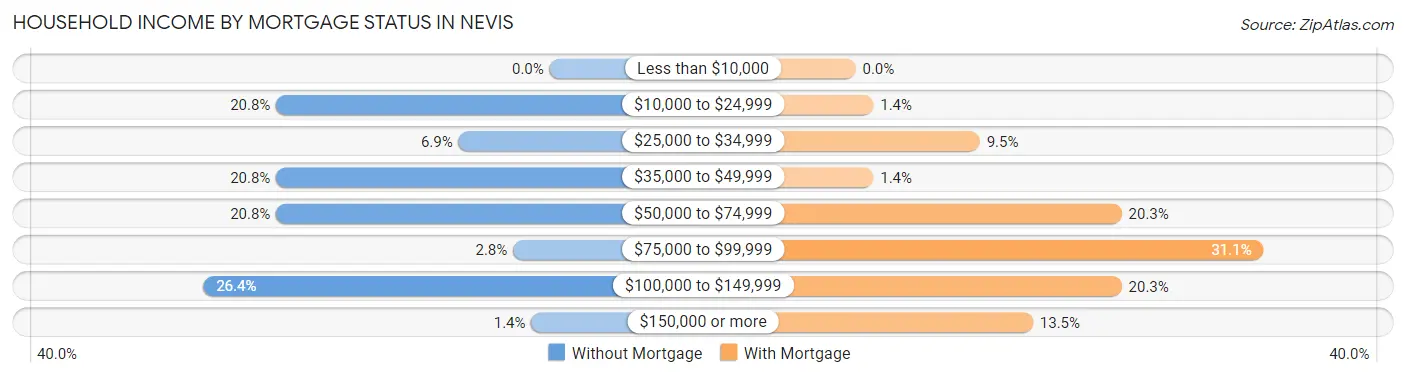
| Household Income | Without Mortgage | With Mortgage |
| Less than $10,000 | 0 (0.0%) | 0 (0.0%) |
| $10,000 to $24,999 | 15 (20.8%) | 1 (1.3%) |
| $25,000 to $34,999 | 5 (6.9%) | 7 (9.5%) |
| $35,000 to $49,999 | 15 (20.8%) | 1 (1.3%) |
| $50,000 to $74,999 | 15 (20.8%) | 15 (20.3%) |
| $75,000 to $99,999 | 2 (2.8%) | 23 (31.1%) |
| $100,000 to $149,999 | 19 (26.4%) | 15 (20.3%) |
| $150,000 or more | 1 (1.4%) | 10 (13.5%) |
| Total | 72 (100.0%) | 74 (100.0%) |
Property Value to Household Income Ratio in Nevis
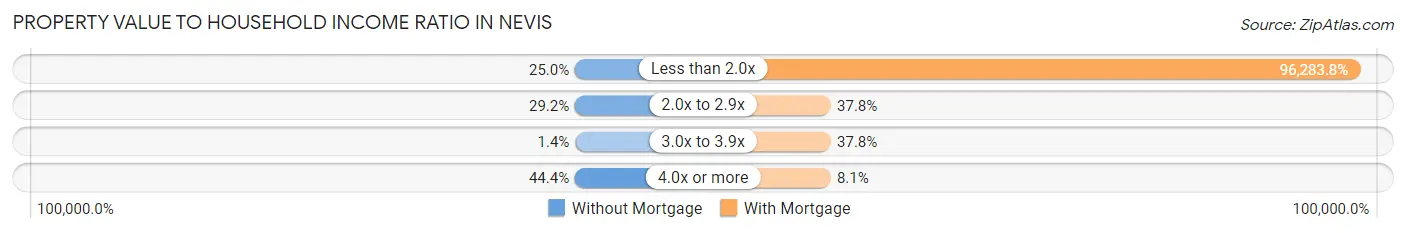
| Value-to-Income Ratio | Without Mortgage | With Mortgage |
| Less than 2.0x | 18 (25.0%) | 71,250 (96,283.8%) |
| 2.0x to 2.9x | 21 (29.2%) | 28 (37.8%) |
| 3.0x to 3.9x | 1 (1.4%) | 28 (37.8%) |
| 4.0x or more | 32 (44.4%) | 6 (8.1%) |
| Total | 72 (100.0%) | 74 (100.0%) |
Real Estate Taxes by Mortgage Status in Nevis
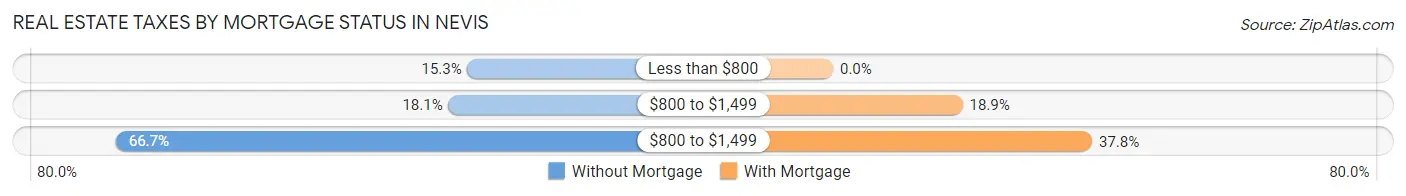
| Property Taxes | Without Mortgage | With Mortgage |
| Less than $800 | 11 (15.3%) | 0 (0.0%) |
| $800 to $1,499 | 13 (18.1%) | 14 (18.9%) |
| $800 to $1,499 | 48 (66.7%) | 28 (37.8%) |
| Total | 72 (100.0%) | 74 (100.0%) |
Health & Disability in Nevis
Health Insurance Coverage by Age in Nevis
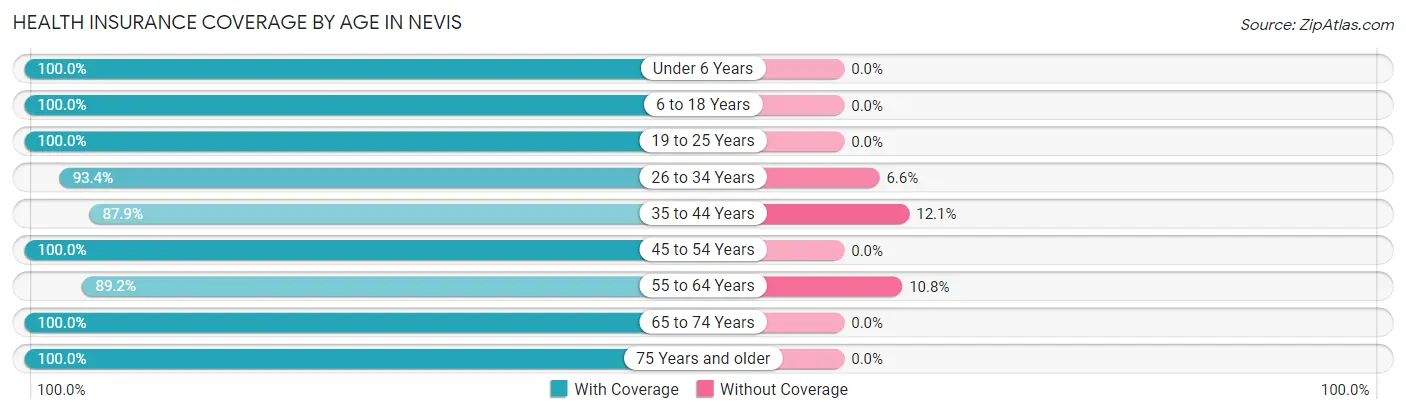
| Age Bracket | With Coverage | Without Coverage |
| Under 6 Years | 67 (100.0%) | 0 (0.0%) |
| 6 to 18 Years | 69 (100.0%) | 0 (0.0%) |
| 19 to 25 Years | 3 (100.0%) | 0 (0.0%) |
| 26 to 34 Years | 57 (93.4%) | 4 (6.6%) |
| 35 to 44 Years | 29 (87.9%) | 4 (12.1%) |
| 45 to 54 Years | 39 (100.0%) | 0 (0.0%) |
| 55 to 64 Years | 66 (89.2%) | 8 (10.8%) |
| 65 to 74 Years | 48 (100.0%) | 0 (0.0%) |
| 75 Years and older | 35 (100.0%) | 0 (0.0%) |
| Total | 413 (96.3%) | 16 (3.7%) |
Health Insurance Coverage by Citizenship Status in Nevis
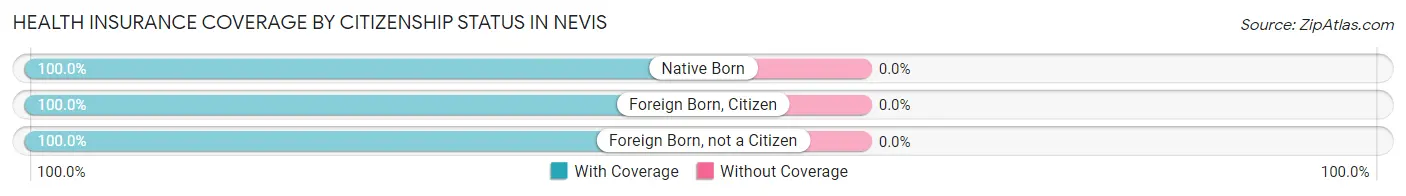
| Citizenship Status | With Coverage | Without Coverage |
| Native Born | 67 (100.0%) | 0 (0.0%) |
| Foreign Born, Citizen | 69 (100.0%) | 0 (0.0%) |
| Foreign Born, not a Citizen | 3 (100.0%) | 0 (0.0%) |
Health Insurance Coverage by Household Income in Nevis
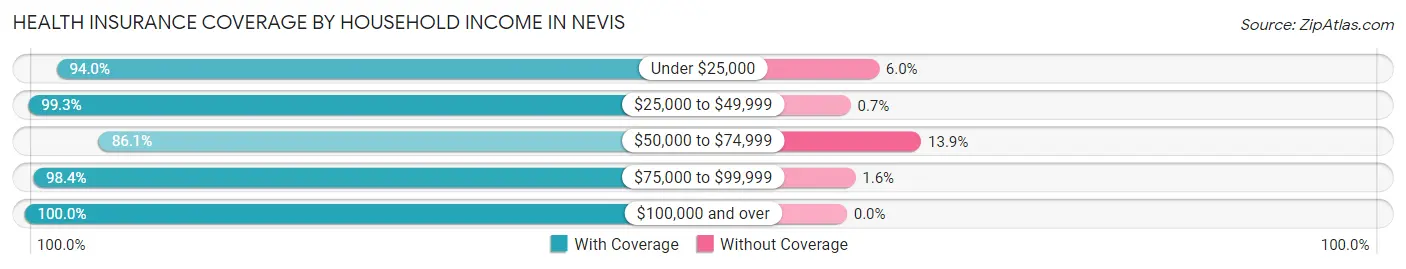
| Household Income | With Coverage | Without Coverage |
| Under $25,000 | 47 (94.0%) | 3 (6.0%) |
| $25,000 to $49,999 | 141 (99.3%) | 1 (0.7%) |
| $50,000 to $74,999 | 68 (86.1%) | 11 (13.9%) |
| $75,000 to $99,999 | 61 (98.4%) | 1 (1.6%) |
| $100,000 and over | 96 (100.0%) | 0 (0.0%) |
Public vs Private Health Insurance Coverage by Age in Nevis
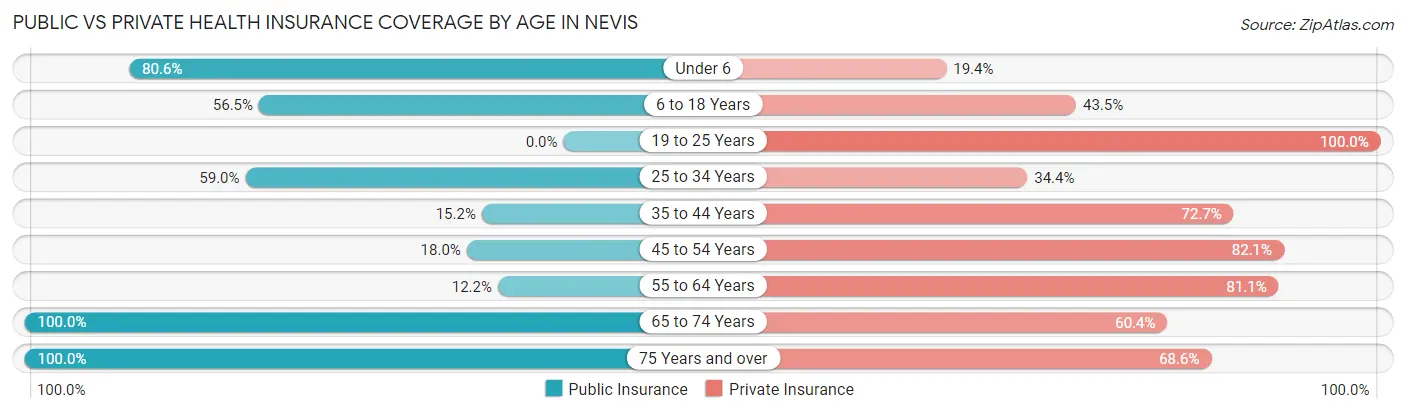
| Age Bracket | Public Insurance | Private Insurance |
| Under 6 | 54 (80.6%) | 13 (19.4%) |
| 6 to 18 Years | 39 (56.5%) | 30 (43.5%) |
| 19 to 25 Years | 0 (0.0%) | 3 (100.0%) |
| 25 to 34 Years | 36 (59.0%) | 21 (34.4%) |
| 35 to 44 Years | 5 (15.1%) | 24 (72.7%) |
| 45 to 54 Years | 7 (17.9%) | 32 (82.1%) |
| 55 to 64 Years | 9 (12.2%) | 60 (81.1%) |
| 65 to 74 Years | 48 (100.0%) | 29 (60.4%) |
| 75 Years and over | 35 (100.0%) | 24 (68.6%) |
| Total | 233 (54.3%) | 236 (55.0%) |
Disability Status by Sex by Age in Nevis
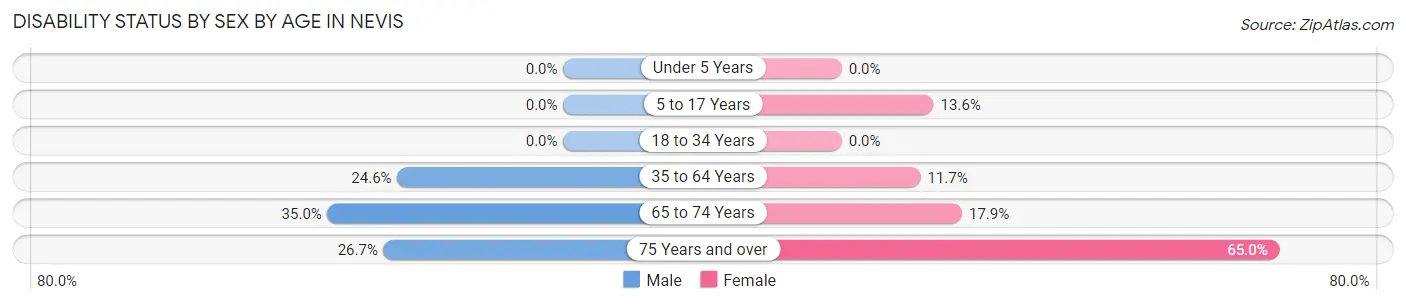
| Age Bracket | Male | Female |
| Under 5 Years | 0 (0.0%) | 0 (0.0%) |
| 5 to 17 Years | 0 (0.0%) | 3 (13.6%) |
| 18 to 34 Years | 0 (0.0%) | 0 (0.0%) |
| 35 to 64 Years | 17 (24.6%) | 9 (11.7%) |
| 65 to 74 Years | 7 (35.0%) | 5 (17.9%) |
| 75 Years and over | 4 (26.7%) | 13 (65.0%) |
Disability Class by Sex by Age in Nevis
Disability Class: Hearing Difficulty
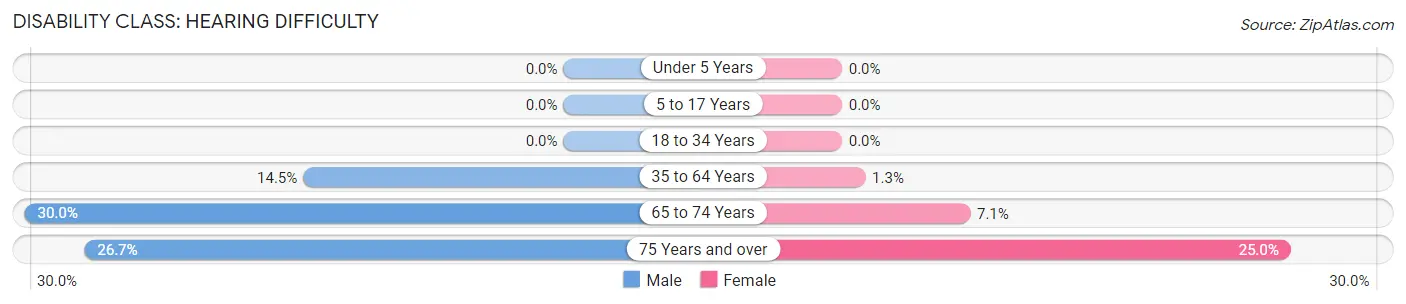
| Age Bracket | Male | Female |
| Under 5 Years | 0 (0.0%) | 0 (0.0%) |
| 5 to 17 Years | 0 (0.0%) | 0 (0.0%) |
| 18 to 34 Years | 0 (0.0%) | 0 (0.0%) |
| 35 to 64 Years | 10 (14.5%) | 1 (1.3%) |
| 65 to 74 Years | 6 (30.0%) | 2 (7.1%) |
| 75 Years and over | 4 (26.7%) | 5 (25.0%) |
Disability Class: Vision Difficulty
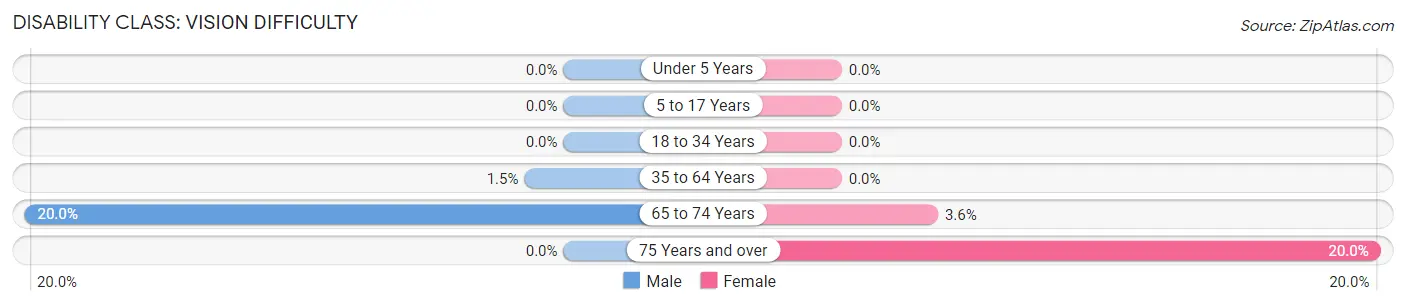
| Age Bracket | Male | Female |
| Under 5 Years | 0 (0.0%) | 0 (0.0%) |
| 5 to 17 Years | 0 (0.0%) | 0 (0.0%) |
| 18 to 34 Years | 0 (0.0%) | 0 (0.0%) |
| 35 to 64 Years | 1 (1.5%) | 0 (0.0%) |
| 65 to 74 Years | 4 (20.0%) | 1 (3.6%) |
| 75 Years and over | 0 (0.0%) | 4 (20.0%) |
Disability Class: Cognitive Difficulty
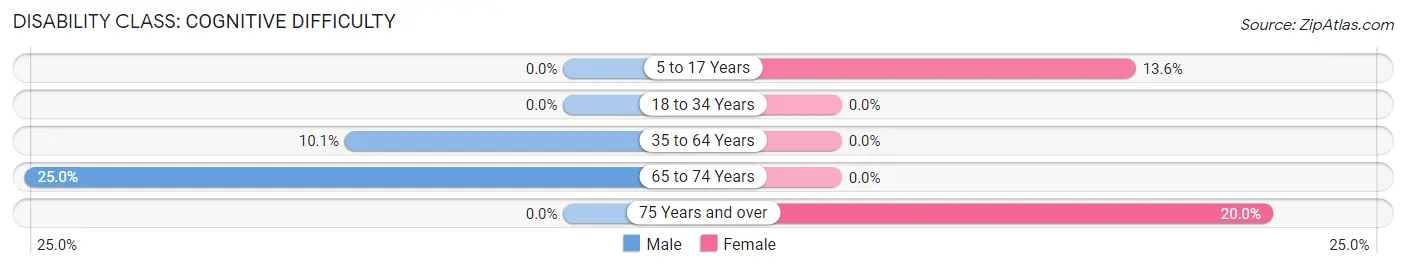
| Age Bracket | Male | Female |
| 5 to 17 Years | 0 (0.0%) | 3 (13.6%) |
| 18 to 34 Years | 0 (0.0%) | 0 (0.0%) |
| 35 to 64 Years | 7 (10.1%) | 0 (0.0%) |
| 65 to 74 Years | 5 (25.0%) | 0 (0.0%) |
| 75 Years and over | 0 (0.0%) | 4 (20.0%) |
Disability Class: Ambulatory Difficulty
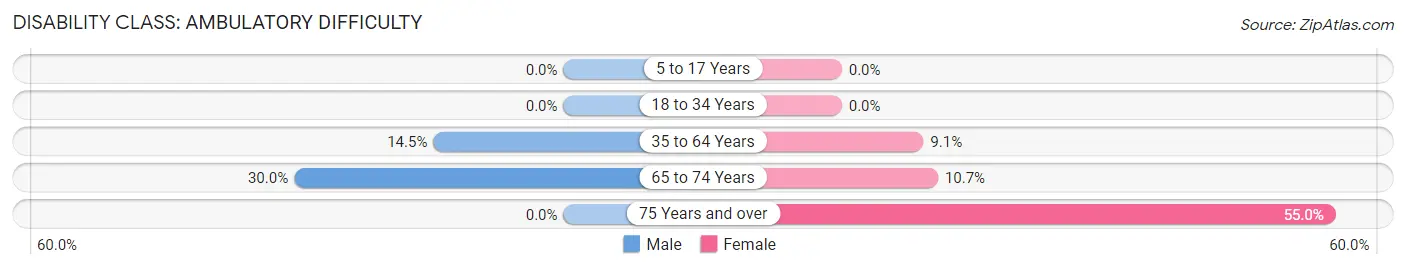
| Age Bracket | Male | Female |
| 5 to 17 Years | 0 (0.0%) | 0 (0.0%) |
| 18 to 34 Years | 0 (0.0%) | 0 (0.0%) |
| 35 to 64 Years | 10 (14.5%) | 7 (9.1%) |
| 65 to 74 Years | 6 (30.0%) | 3 (10.7%) |
| 75 Years and over | 0 (0.0%) | 11 (55.0%) |
Disability Class: Self-Care Difficulty
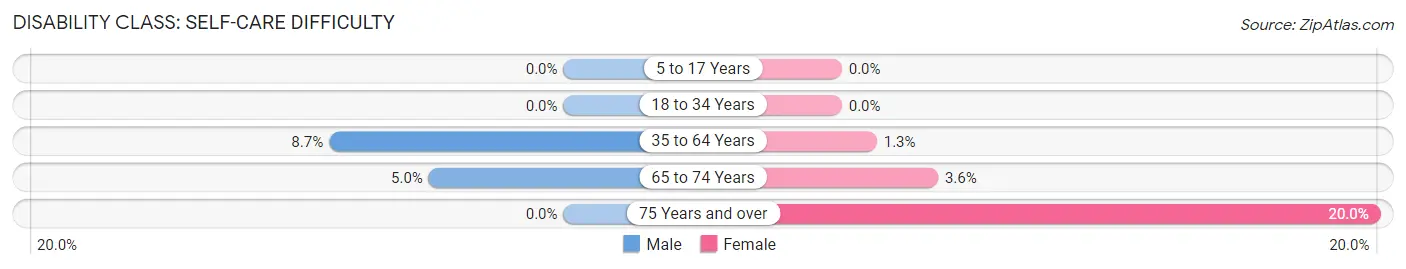
| Age Bracket | Male | Female |
| 5 to 17 Years | 0 (0.0%) | 0 (0.0%) |
| 18 to 34 Years | 0 (0.0%) | 0 (0.0%) |
| 35 to 64 Years | 6 (8.7%) | 1 (1.3%) |
| 65 to 74 Years | 1 (5.0%) | 1 (3.6%) |
| 75 Years and over | 0 (0.0%) | 4 (20.0%) |
Technology Access in Nevis
Computing Device Access in Nevis
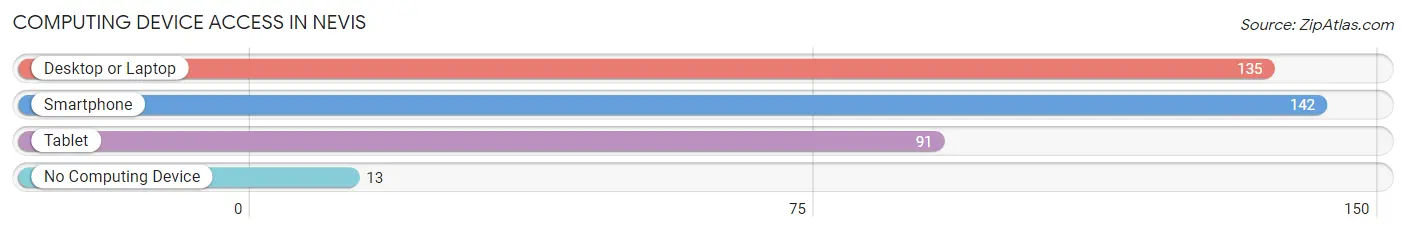
| Device Type | # Households | % Households |
| Desktop or Laptop | 135 | 79.4% |
| Smartphone | 142 | 83.5% |
| Tablet | 91 | 53.5% |
| No Computing Device | 13 | 7.6% |
| Total | 170 | 100.0% |
Internet Access in Nevis
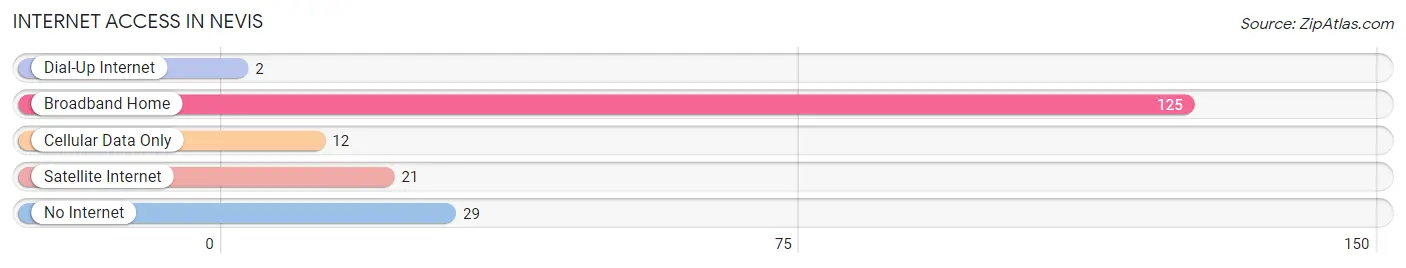
| Internet Type | # Households | % Households |
| Dial-Up Internet | 2 | 1.2% |
| Broadband Home | 125 | 73.5% |
| Cellular Data Only | 12 | 7.1% |
| Satellite Internet | 21 | 12.3% |
| No Internet | 29 | 17.1% |
| Total | 170 | 100.0% |
Nevis Summary
History
The small town of Nevis, Minnesota is located in Hubbard County, in the north-central part of the state. It is situated on the banks of the Crow Wing River, and is surrounded by the Chippewa National Forest. The town was founded in 1881 by settlers from Norway, and was named after the city of Nevis in Scotland. The first settlers were attracted to the area by the abundance of timber and the potential for farming.
The town grew slowly, but steadily, and by the early 1900s, it had become a thriving community. The town was home to a variety of businesses, including a sawmill, a flour mill, a creamery, a blacksmith shop, and a general store. The town also had a school, a post office, and a church.
In the early 1900s, the town was also home to a large logging industry. Logging was the main source of income for many of the town’s residents, and the industry provided employment for many of the town’s residents. The logging industry also provided the town with a steady supply of timber, which was used to build homes and businesses.
In the late 1920s, the town was connected to the rest of the state by the Great Northern Railway. This allowed for easier transportation of goods and people, and helped to spur the town’s growth.
In the 1950s, the town began to experience a decline in population. This was due to the decline of the logging industry, as well as the increasing popularity of larger cities. Despite this, the town has managed to remain a vibrant community, and is still home to a variety of businesses and services.
Geography
Nevis is located in the north-central part of Minnesota, in Hubbard County. It is situated on the banks of the Crow Wing River, and is surrounded by the Chippewa National Forest. The town is located approximately 40 miles north of Brainerd, and is about a two-hour drive from Minneapolis.
The town is situated in a region of rolling hills and forests, and is home to a variety of wildlife, including deer, bear, and moose. The area is also home to a variety of birds, including bald eagles, hawks, and owls.
The climate in Nevis is typical of the northern part of the state, with cold winters and warm summers. The average temperature in the winter is around 10 degrees Fahrenheit, and in the summer it is around 70 degrees Fahrenheit.
Economy
The economy of Nevis is largely based on tourism and recreation. The town is home to a variety of outdoor activities, including fishing, hunting, camping, and hiking. The town is also home to a variety of restaurants, shops, and other businesses.
The town is also home to a variety of manufacturing businesses, including a sawmill, a flour mill, and a creamery. These businesses provide employment for many of the town’s residents.
Demographics
As of the 2010 census, the population of Nevis was 1,092. The town is predominantly white, with 92.3% of the population identifying as white. The town also has a small Hispanic population, with 4.2% of the population identifying as Hispanic or Latino.
The median household income in Nevis is $41,250, and the median home value is $127,400. The town has a poverty rate of 11.2%, which is slightly higher than the state average of 10.2%.
Conclusion
Nevis, Minnesota is a small town located in Hubbard County, in the north-central part of the state. The town was founded in 1881 by settlers from Norway, and was named after the city of Nevis in Scotland. The town has a long history of logging and other industries, and is now largely based on tourism and recreation. The town has a population of 1,092, and is predominantly white. The median household income in Nevis is $41,250, and the median home value is $127,400.
Common Questions
What is Per Capita Income in Nevis?
Per Capita income in Nevis is $28,520.
What is the Median Family Income in Nevis?
Median Family Income in Nevis is $72,500.
What is the Median Household income in Nevis?
Median Household Income in Nevis is $54,583.
What is Income or Wage Gap in Nevis?
Income or Wage Gap in Nevis is 26.6%.
Women in Nevis earn 73.4 cents for every dollar earned by a man.
What is Family Income Deficit in Nevis?
Family Income Deficit in Nevis is $5,300.
Families that are below poverty line in Nevis earn $5,300 less on average than the poverty threshold level.
What is Inequality or Gini Index in Nevis?
Inequality or Gini Index in Nevis is 0.38.
What is the Total Population of Nevis?
Total Population of Nevis is 429.
What is the Total Male Population of Nevis?
Total Male Population of Nevis is 211.
What is the Total Female Population of Nevis?
Total Female Population of Nevis is 218.
What is the Ratio of Males per 100 Females in Nevis?
There are 96.79 Males per 100 Females in Nevis.
What is the Ratio of Females per 100 Males in Nevis?
There are 103.32 Females per 100 Males in Nevis.
What is the Median Population Age in Nevis?
Median Population Age in Nevis is 40.3 Years.
What is the Average Family Size in Nevis
Average Family Size in Nevis is 3.4 People.
What is the Average Household Size in Nevis
Average Household Size in Nevis is 2.5 People.
How Large is the Labor Force in Nevis?
There are 197 People in the Labor Forcein in Nevis.
What is the Percentage of People in the Labor Force in Nevis?
65.4% of People are in the Labor Force in Nevis.
What is the Unemployment Rate in Nevis?
Unemployment Rate in Nevis is 2.0%.