Nashwauk, MN Map & Demographics
Nashwauk Map
Nashwauk Overview
$32,889
PER CAPITA INCOME
$78,958
AVG FAMILY INCOME
$59,615
AVG HOUSEHOLD INCOME
32.1%
WAGE / INCOME GAP [ % ]
67.9¢/ $1
WAGE / INCOME GAP [ $ ]
$15,073
FAMILY INCOME DEFICIT
0.38
INEQUALITY / GINI INDEX
1,091
TOTAL POPULATION
632
MALE POPULATION
459
FEMALE POPULATION
137.69
MALES / 100 FEMALES
72.63
FEMALES / 100 MALES
40.4
MEDIAN AGE
2.8
AVG FAMILY SIZE
2.3
AVG HOUSEHOLD SIZE
541
LABOR FORCE [ PEOPLE ]
57.8%
PERCENT IN LABOR FORCE
5.2%
UNEMPLOYMENT RATE
Nashwauk Zip Codes
Nashwauk Area Codes
Income in Nashwauk
Income Overview in Nashwauk
Per Capita Income in Nashwauk is $32,889, while median incomes of families and households are $78,958 and $59,615 respectively.
| Characteristic | Number | Measure |
| Per Capita Income | 1,091 | $32,889 |
| Median Family Income | 286 | $78,958 |
| Mean Family Income | 286 | $85,715 |
| Median Household Income | 480 | $59,615 |
| Mean Household Income | 480 | $72,255 |
| Income Deficit | 286 | $15,073 |
| Wage / Income Gap (%) | 1,091 | 32.05% |
| Wage / Income Gap ($) | 1,091 | 67.95¢ per $1 |
| Gini / Inequality Index | 1,091 | 0.38 |
Earnings by Sex in Nashwauk
Average Earnings in Nashwauk are $40,870, $45,625 for men and $31,000 for women, a difference of 32.1%.
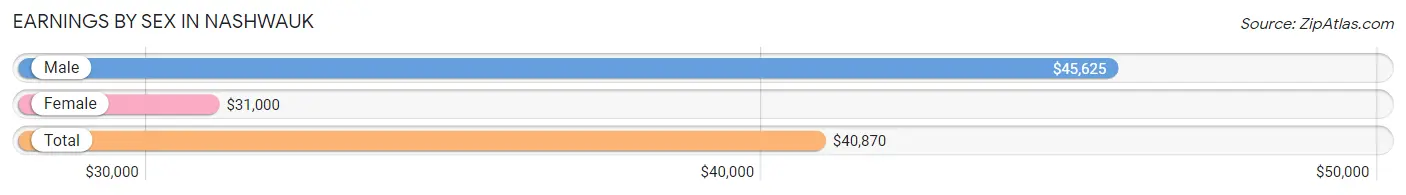
| Sex | Number | Average Earnings |
| Male | 360 (59.4%) | $45,625 |
| Female | 246 (40.6%) | $31,000 |
| Total | 606 (100.0%) | $40,870 |
Earnings by Sex by Income Bracket in Nashwauk
The most common earnings brackets in Nashwauk are $55,000 to $64,999 for men (49 | 13.6%) and $2,499 or less for women (24 | 9.8%).
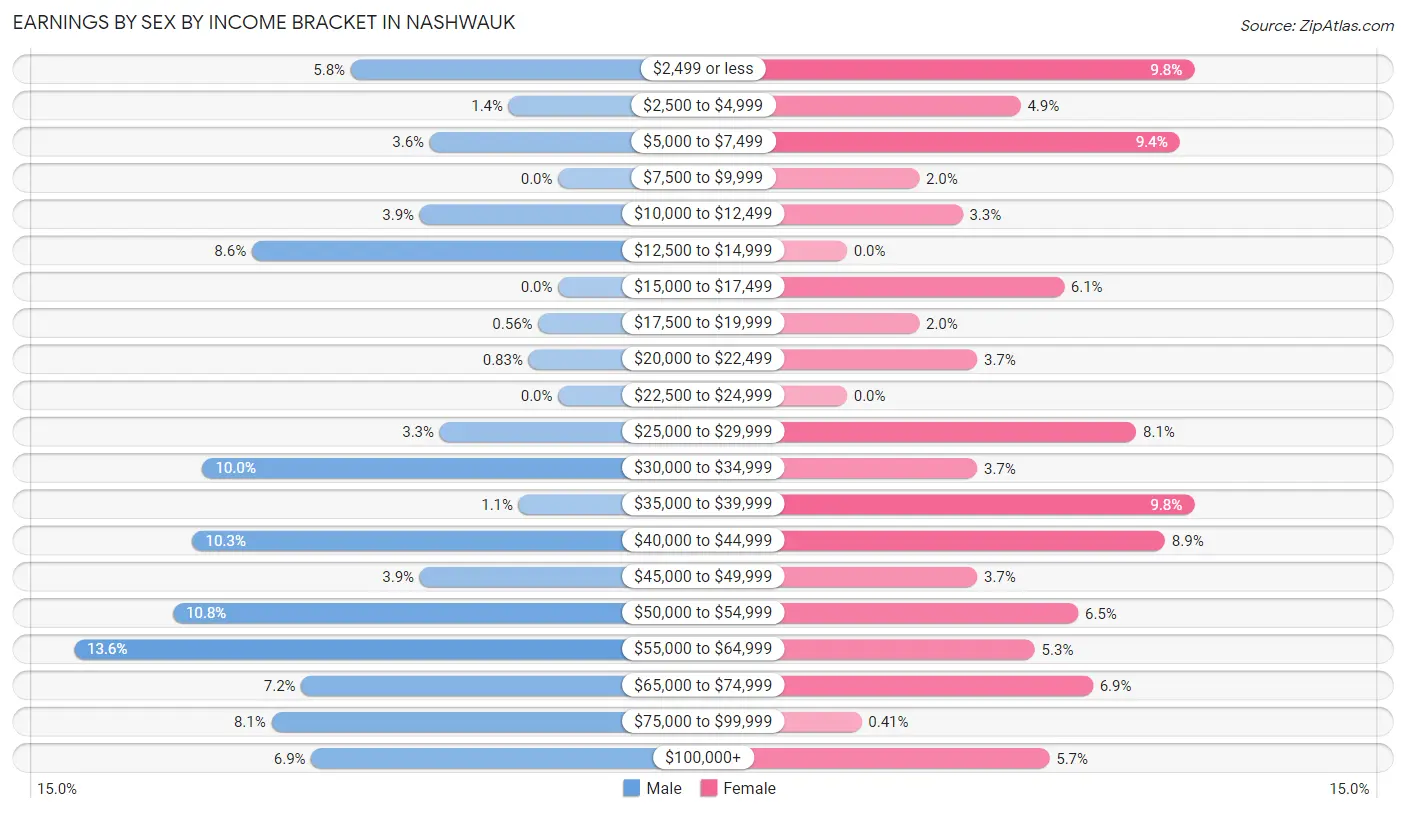
| Income | Male | Female |
| $2,499 or less | 21 (5.8%) | 24 (9.8%) |
| $2,500 to $4,999 | 5 (1.4%) | 12 (4.9%) |
| $5,000 to $7,499 | 13 (3.6%) | 23 (9.3%) |
| $7,500 to $9,999 | 0 (0.0%) | 5 (2.0%) |
| $10,000 to $12,499 | 14 (3.9%) | 8 (3.3%) |
| $12,500 to $14,999 | 31 (8.6%) | 0 (0.0%) |
| $15,000 to $17,499 | 0 (0.0%) | 15 (6.1%) |
| $17,500 to $19,999 | 2 (0.6%) | 5 (2.0%) |
| $20,000 to $22,499 | 3 (0.8%) | 9 (3.7%) |
| $22,500 to $24,999 | 0 (0.0%) | 0 (0.0%) |
| $25,000 to $29,999 | 12 (3.3%) | 20 (8.1%) |
| $30,000 to $34,999 | 36 (10.0%) | 9 (3.7%) |
| $35,000 to $39,999 | 4 (1.1%) | 24 (9.8%) |
| $40,000 to $44,999 | 37 (10.3%) | 22 (8.9%) |
| $45,000 to $49,999 | 14 (3.9%) | 9 (3.7%) |
| $50,000 to $54,999 | 39 (10.8%) | 16 (6.5%) |
| $55,000 to $64,999 | 49 (13.6%) | 13 (5.3%) |
| $65,000 to $74,999 | 26 (7.2%) | 17 (6.9%) |
| $75,000 to $99,999 | 29 (8.1%) | 1 (0.4%) |
| $100,000+ | 25 (6.9%) | 14 (5.7%) |
| Total | 360 (100.0%) | 246 (100.0%) |
Earnings by Sex by Educational Attainment in Nashwauk
Average earnings in Nashwauk are $50,735 for men and $38,854 for women, a difference of 23.4%. Men with an educational attainment of bachelor's degree enjoy the highest average annual earnings of $60,536, while those with high school diploma education earn the least with $40,455. Women with an educational attainment of bachelor's degree earn the most with the average annual earnings of $46,667, while those with college or associate's degree education have the smallest earnings of $43,438.
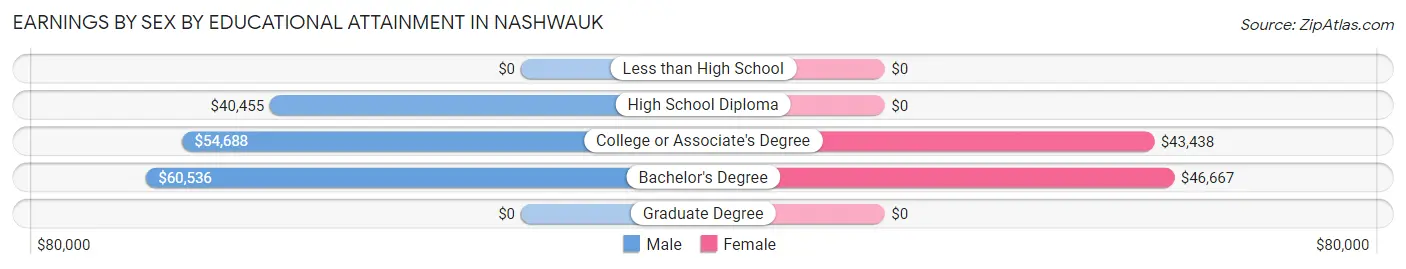
| Educational Attainment | Male Income | Female Income |
| Less than High School | - | - |
| High School Diploma | $40,455 | $0 |
| College or Associate's Degree | $54,688 | $43,438 |
| Bachelor's Degree | $60,536 | $46,667 |
| Graduate Degree | - | - |
| Total | $50,735 | $38,854 |
Family Income in Nashwauk
Family Income Brackets in Nashwauk
According to the Nashwauk family income data, there are 73 families falling into the $50,000 to $74,999 income range, which is the most common income bracket and makes up 25.5% of all families.
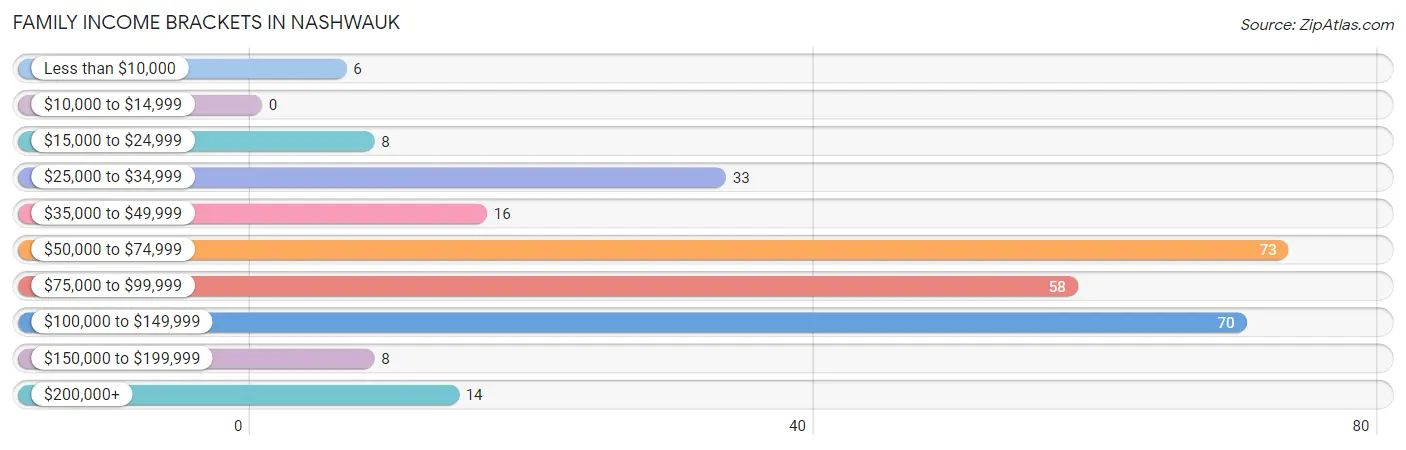
| Income Bracket | # Families | % Families |
| Less than $10,000 | 6 | 2.1% |
| $10,000 to $14,999 | 0 | 0.0% |
| $15,000 to $24,999 | 8 | 2.8% |
| $25,000 to $34,999 | 33 | 11.5% |
| $35,000 to $49,999 | 16 | 5.6% |
| $50,000 to $74,999 | 73 | 25.5% |
| $75,000 to $99,999 | 58 | 20.3% |
| $100,000 to $149,999 | 70 | 24.5% |
| $150,000 to $199,999 | 8 | 2.8% |
| $200,000+ | 14 | 4.9% |
Family Income by Famaliy Size in Nashwauk
3-person families (57 | 19.9%) account for the highest median family income in Nashwauk with $86,250 per family, while 2-person families (180 | 62.9%) have the highest median income of $29,500 per family member.
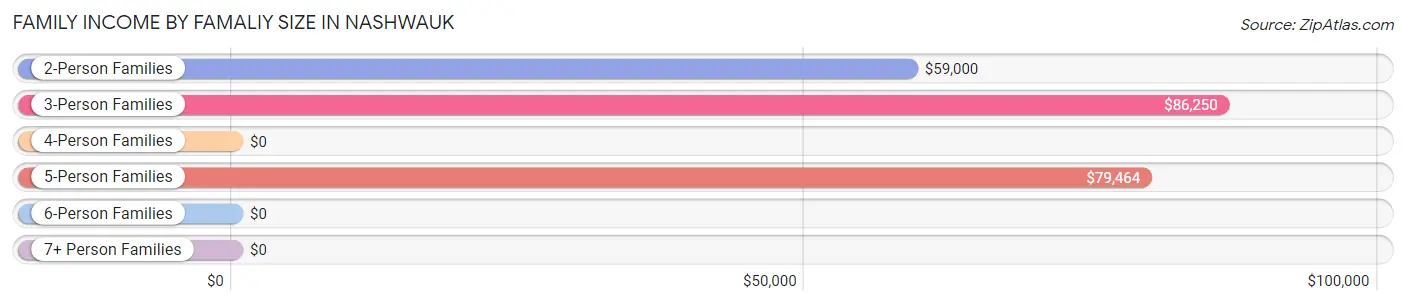
| Income Bracket | # Families | Median Income |
| 2-Person Families | 180 (62.9%) | $59,000 |
| 3-Person Families | 57 (19.9%) | $86,250 |
| 4-Person Families | 24 (8.4%) | $0 |
| 5-Person Families | 25 (8.7%) | $79,464 |
| 6-Person Families | 0 (0.0%) | $0 |
| 7+ Person Families | 0 (0.0%) | $0 |
| Total | 286 (100.0%) | $78,958 |
Family Income by Number of Earners in Nashwauk
The median family income in Nashwauk is $78,958, with families comprising 2 earners (92) having the highest median family income of $114,583, while families with 1 earner (125) have the lowest median family income of $51,473, accounting for 32.2% and 43.7% of families, respectively.
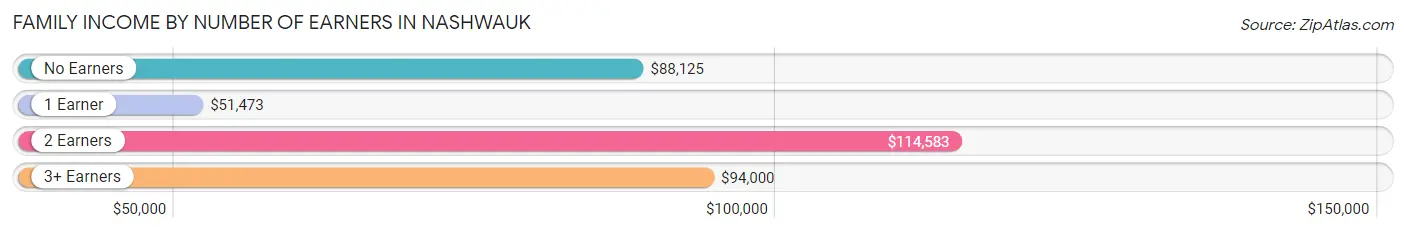
| Number of Earners | # Families | Median Income |
| No Earners | 41 (14.3%) | $88,125 |
| 1 Earner | 125 (43.7%) | $51,473 |
| 2 Earners | 92 (32.2%) | $114,583 |
| 3+ Earners | 28 (9.8%) | $94,000 |
| Total | 286 (100.0%) | $78,958 |
Household Income in Nashwauk
Household Income Brackets in Nashwauk
With 100 households falling in the category, the $100,000 to $149,999 income range is the most frequent in Nashwauk, accounting for 20.8% of all households. In contrast, only 14 households (2.9%) fall into the $10,000 to $14,999 income bracket, making it the least populous group.
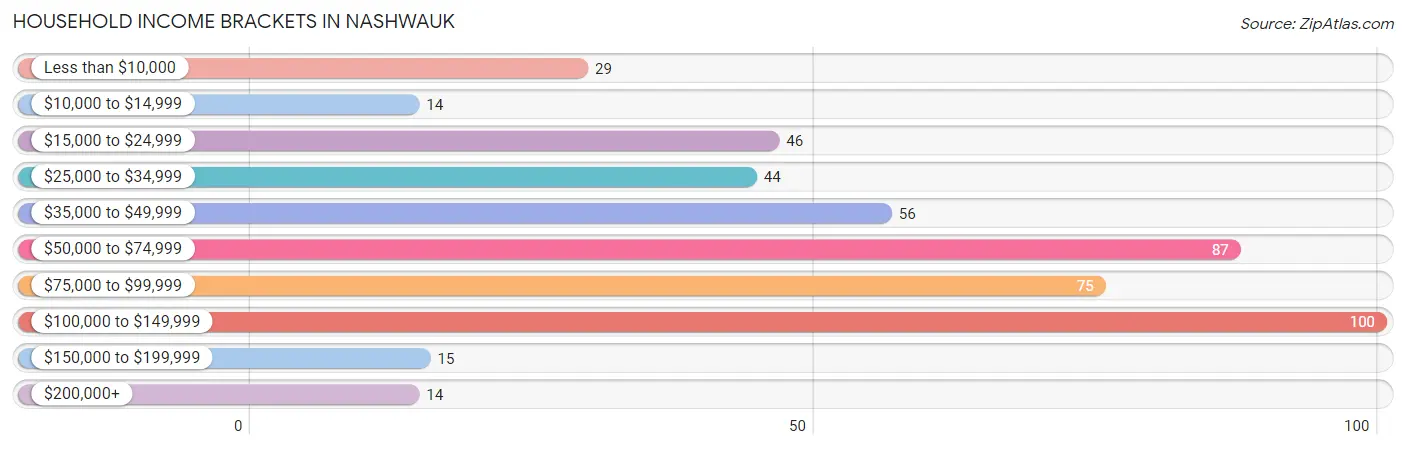
| Income Bracket | # Households | % Households |
| Less than $10,000 | 29 | 6.0% |
| $10,000 to $14,999 | 14 | 2.9% |
| $15,000 to $24,999 | 46 | 9.6% |
| $25,000 to $34,999 | 44 | 9.2% |
| $35,000 to $49,999 | 56 | 11.7% |
| $50,000 to $74,999 | 87 | 18.1% |
| $75,000 to $99,999 | 75 | 15.6% |
| $100,000 to $149,999 | 100 | 20.8% |
| $150,000 to $199,999 | 15 | 3.1% |
| $200,000+ | 14 | 2.9% |
Household Income by Householder Age in Nashwauk
The median household income in Nashwauk is $59,615, with the highest median household income of $128,000 found in the 15 to 24 years age bracket for the primary householder. A total of 16 households (3.3%) fall into this category. Meanwhile, the 65+ years age bracket for the primary householder has the lowest median household income of $38,304, with 145 households (30.2%) in this group.
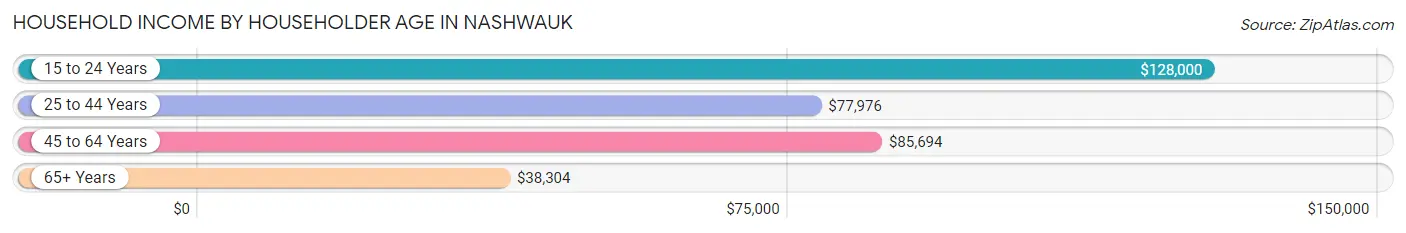
| Income Bracket | # Households | Median Income |
| 15 to 24 Years | 16 (3.3%) | $128,000 |
| 25 to 44 Years | 110 (22.9%) | $77,976 |
| 45 to 64 Years | 209 (43.5%) | $85,694 |
| 65+ Years | 145 (30.2%) | $38,304 |
| Total | 480 (100.0%) | $59,615 |
Poverty in Nashwauk
Income Below Poverty by Sex and Age in Nashwauk
With 6.3% poverty level for males and 11.3% for females among the residents of Nashwauk, 12 to 14 year old males and 65 to 74 year old females are the most vulnerable to poverty, with 2 males (100.0%) and 15 females (48.4%) in their respective age groups living below the poverty level.
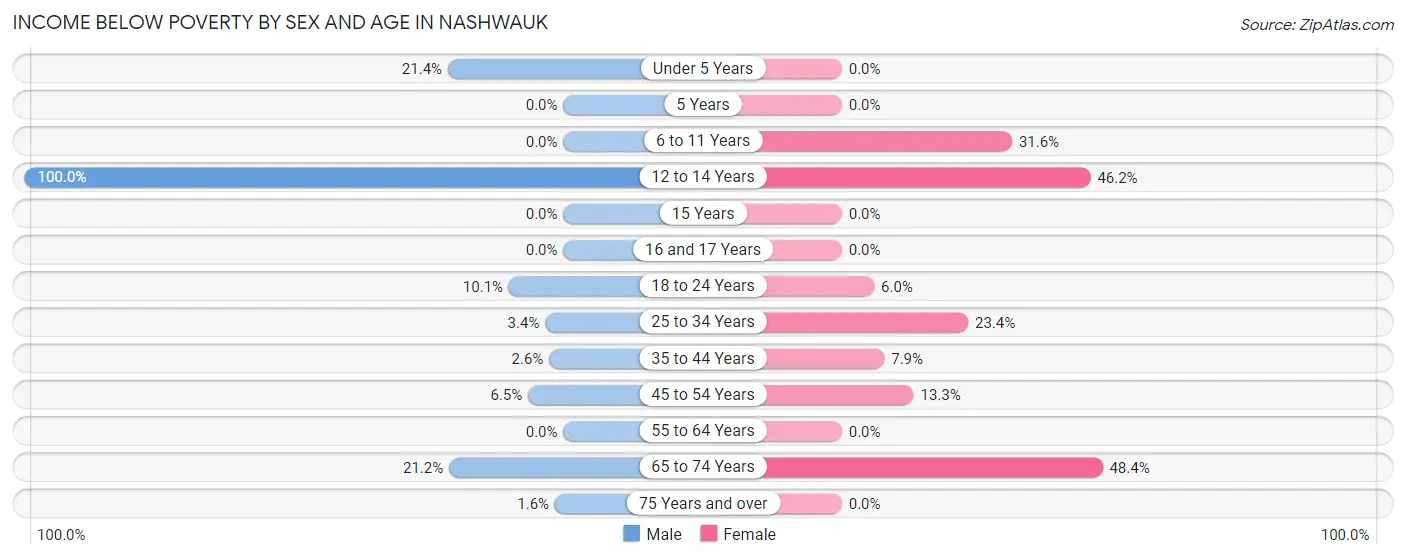
| Age Bracket | Male | Female |
| Under 5 Years | 9 (21.4%) | 0 (0.0%) |
| 5 Years | 0 (0.0%) | 0 (0.0%) |
| 6 to 11 Years | 0 (0.0%) | 6 (31.6%) |
| 12 to 14 Years | 2 (100.0%) | 6 (46.2%) |
| 15 Years | 0 (0.0%) | 0 (0.0%) |
| 16 and 17 Years | 0 (0.0%) | 0 (0.0%) |
| 18 to 24 Years | 9 (10.1%) | 3 (6.0%) |
| 25 to 34 Years | 4 (3.4%) | 15 (23.4%) |
| 35 to 44 Years | 1 (2.6%) | 3 (7.9%) |
| 45 to 54 Years | 7 (6.5%) | 4 (13.3%) |
| 55 to 64 Years | 0 (0.0%) | 0 (0.0%) |
| 65 to 74 Years | 7 (21.2%) | 15 (48.4%) |
| 75 Years and over | 1 (1.6%) | 0 (0.0%) |
| Total | 40 (6.3%) | 52 (11.3%) |
Income Above Poverty by Sex and Age in Nashwauk
According to the poverty statistics in Nashwauk, males aged 6 to 11 years and females aged under 5 years are the age groups that are most secure financially, with 100.0% of males and 100.0% of females in these age groups living above the poverty line.
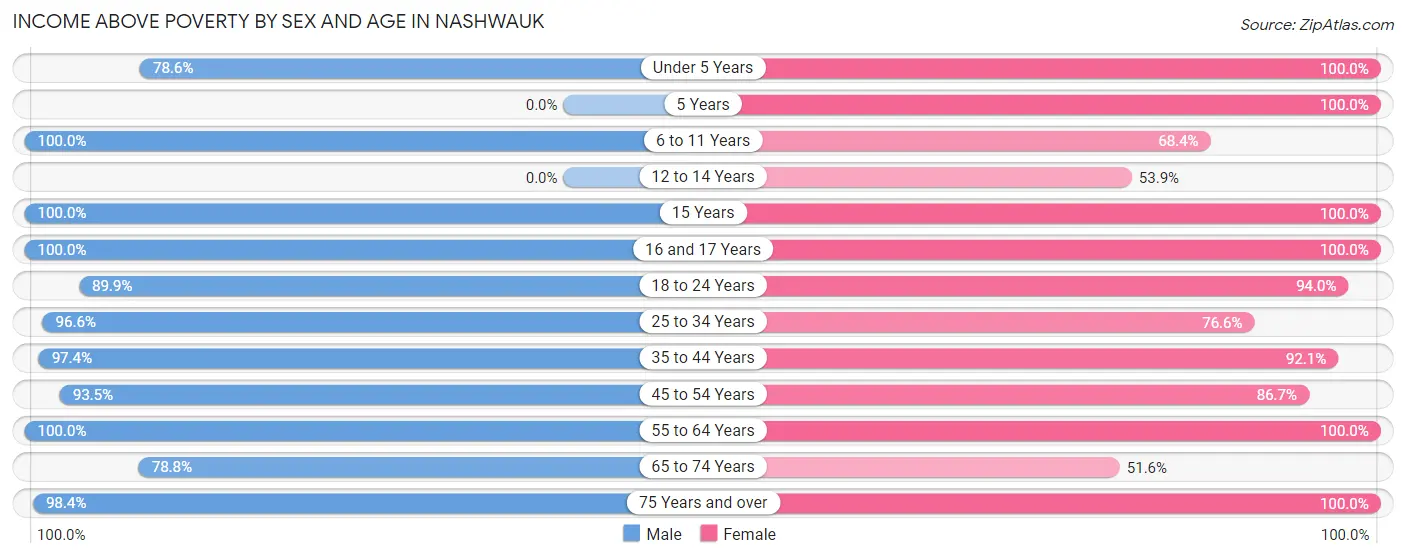
| Age Bracket | Male | Female |
| Under 5 Years | 33 (78.6%) | 37 (100.0%) |
| 5 Years | 0 (0.0%) | 2 (100.0%) |
| 6 to 11 Years | 34 (100.0%) | 13 (68.4%) |
| 12 to 14 Years | 0 (0.0%) | 7 (53.8%) |
| 15 Years | 4 (100.0%) | 1 (100.0%) |
| 16 and 17 Years | 12 (100.0%) | 1 (100.0%) |
| 18 to 24 Years | 80 (89.9%) | 47 (94.0%) |
| 25 to 34 Years | 115 (96.6%) | 49 (76.6%) |
| 35 to 44 Years | 37 (97.4%) | 35 (92.1%) |
| 45 to 54 Years | 100 (93.5%) | 26 (86.7%) |
| 55 to 64 Years | 87 (100.0%) | 95 (100.0%) |
| 65 to 74 Years | 26 (78.8%) | 16 (51.6%) |
| 75 Years and over | 63 (98.4%) | 78 (100.0%) |
| Total | 591 (93.7%) | 407 (88.7%) |
Income Below Poverty Among Married-Couple Families in Nashwauk
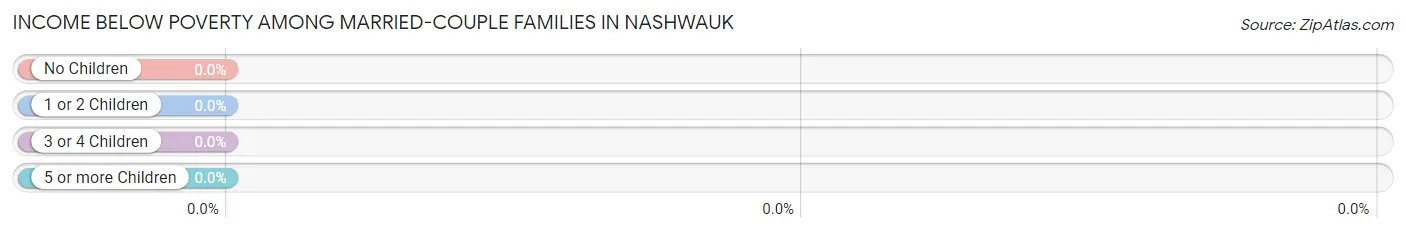
| Children | Above Poverty | Below Poverty |
| No Children | 128 (100.0%) | 0 (0.0%) |
| 1 or 2 Children | 22 (100.0%) | 0 (0.0%) |
| 3 or 4 Children | 13 (100.0%) | 0 (0.0%) |
| 5 or more Children | 0 (0.0%) | 0 (0.0%) |
| Total | 163 (100.0%) | 0 (0.0%) |
Income Below Poverty Among Single-Parent Households in Nashwauk
| Children | Single Father | Single Mother |
| No Children | 0 (0.0%) | 3 (14.3%) |
| 1 or 2 Children | 0 (0.0%) | 4 (18.2%) |
| 3 or 4 Children | 0 (0.0%) | 4 (57.1%) |
| 5 or more Children | 0 (0.0%) | 0 (0.0%) |
| Total | 0 (0.0%) | 11 (22.0%) |
Income Below Poverty Among Married-Couple vs Single-Parent Households in Nashwauk
| Children | Married-Couple Families | Single-Parent Households |
| No Children | 0 (0.0%) | 3 (4.4%) |
| 1 or 2 Children | 0 (0.0%) | 4 (8.3%) |
| 3 or 4 Children | 0 (0.0%) | 4 (57.1%) |
| 5 or more Children | 0 (0.0%) | 0 (0.0%) |
| Total | 0 (0.0%) | 11 (8.9%) |
Race in Nashwauk
The most populous races in Nashwauk are White / Caucasian (954 | 87.4%), Two or more Races (69 | 6.3%), and Hispanic or Latino (40 | 3.7%).
| Race | # Population | % Population |
| Asian | 15 | 1.4% |
| Black / African American | 8 | 0.7% |
| Hawaiian / Pacific | 0 | 0.0% |
| Hispanic or Latino | 40 | 3.7% |
| Native / Alaskan | 15 | 1.4% |
| White / Caucasian | 954 | 87.4% |
| Two or more Races | 69 | 6.3% |
| Some other Race | 30 | 2.8% |
| Total | 1,091 | 100.0% |
Ancestry in Nashwauk
The most populous ancestries reported in Nashwauk are German (267 | 24.5%), Finnish (160 | 14.7%), Italian (160 | 14.7%), Norwegian (127 | 11.6%), and Swedish (94 | 8.6%), together accounting for 74.1% of all Nashwauk residents.
| Ancestry | # Population | % Population |
| American | 8 | 0.7% |
| Blackfeet | 4 | 0.4% |
| British | 4 | 0.4% |
| Burmese | 6 | 0.5% |
| Cherokee | 9 | 0.8% |
| Chippewa | 7 | 0.6% |
| Croatian | 37 | 3.4% |
| Danish | 34 | 3.1% |
| English | 64 | 5.9% |
| European | 2 | 0.2% |
| Finnish | 160 | 14.7% |
| French | 45 | 4.1% |
| French Canadian | 54 | 5.0% |
| German | 267 | 24.5% |
| Greek | 11 | 1.0% |
| Hungarian | 10 | 0.9% |
| Irish | 91 | 8.3% |
| Italian | 160 | 14.7% |
| Mexican | 5 | 0.5% |
| Northern European | 3 | 0.3% |
| Norwegian | 127 | 11.6% |
| Polish | 6 | 0.5% |
| Pueblo | 3 | 0.3% |
| Scandinavian | 8 | 0.7% |
| Scottish | 7 | 0.6% |
| Seminole | 1 | 0.1% |
| Serbian | 34 | 3.1% |
| Sioux | 23 | 2.1% |
| Slavic | 3 | 0.3% |
| Slovene | 3 | 0.3% |
| Spanish | 31 | 2.8% |
| Swedish | 94 | 8.6% |
| Swiss | 11 | 1.0% |
| Thai | 15 | 1.4% |
| Welsh | 8 | 0.7% |
| Yugoslavian | 8 | 0.7% | View All 36 Rows |
Immigrants in Nashwauk
The most numerous immigrant groups reported in Nashwauk came from Asia (10 | 0.9%), India (10 | 0.9%), South Central Asia (10 | 0.9%), Central America (5 | 0.5%), and Latin America (5 | 0.5%), together accounting for 3.7% of all Nashwauk residents.
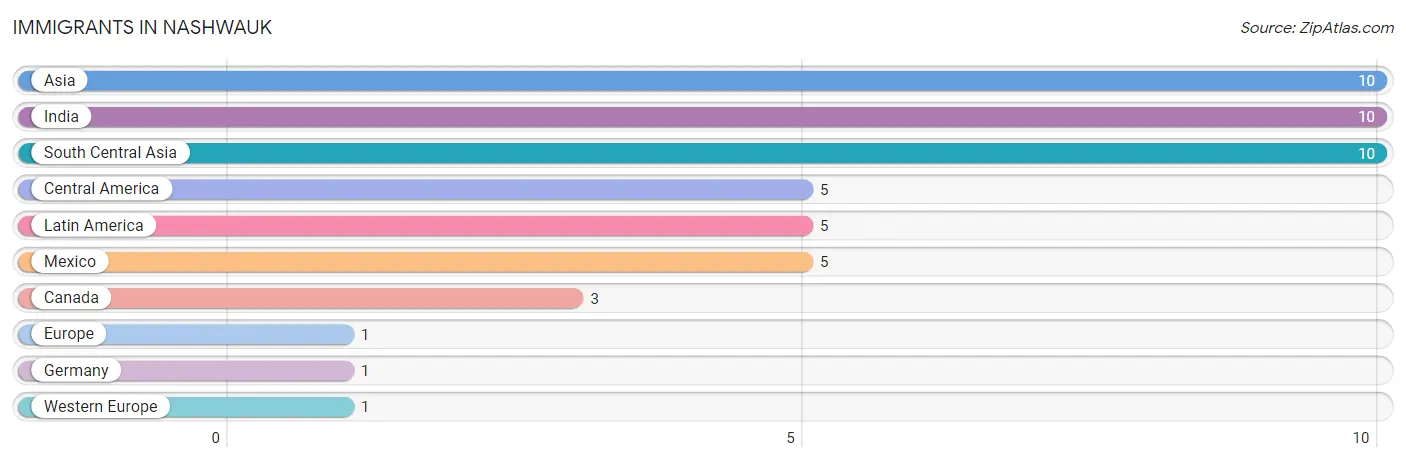
| Immigration Origin | # Population | % Population |
| Asia | 10 | 0.9% |
| Canada | 3 | 0.3% |
| Central America | 5 | 0.5% |
| Europe | 1 | 0.1% |
| Germany | 1 | 0.1% |
| India | 10 | 0.9% |
| Latin America | 5 | 0.5% |
| Mexico | 5 | 0.5% |
| South Central Asia | 10 | 0.9% |
| Western Europe | 1 | 0.1% | View All 10 Rows |
Sex and Age in Nashwauk
Sex and Age in Nashwauk
The most populous age groups in Nashwauk are 25 to 29 Years (94 | 14.9%) for men and 60 to 64 Years (53 | 11.6%) for women.
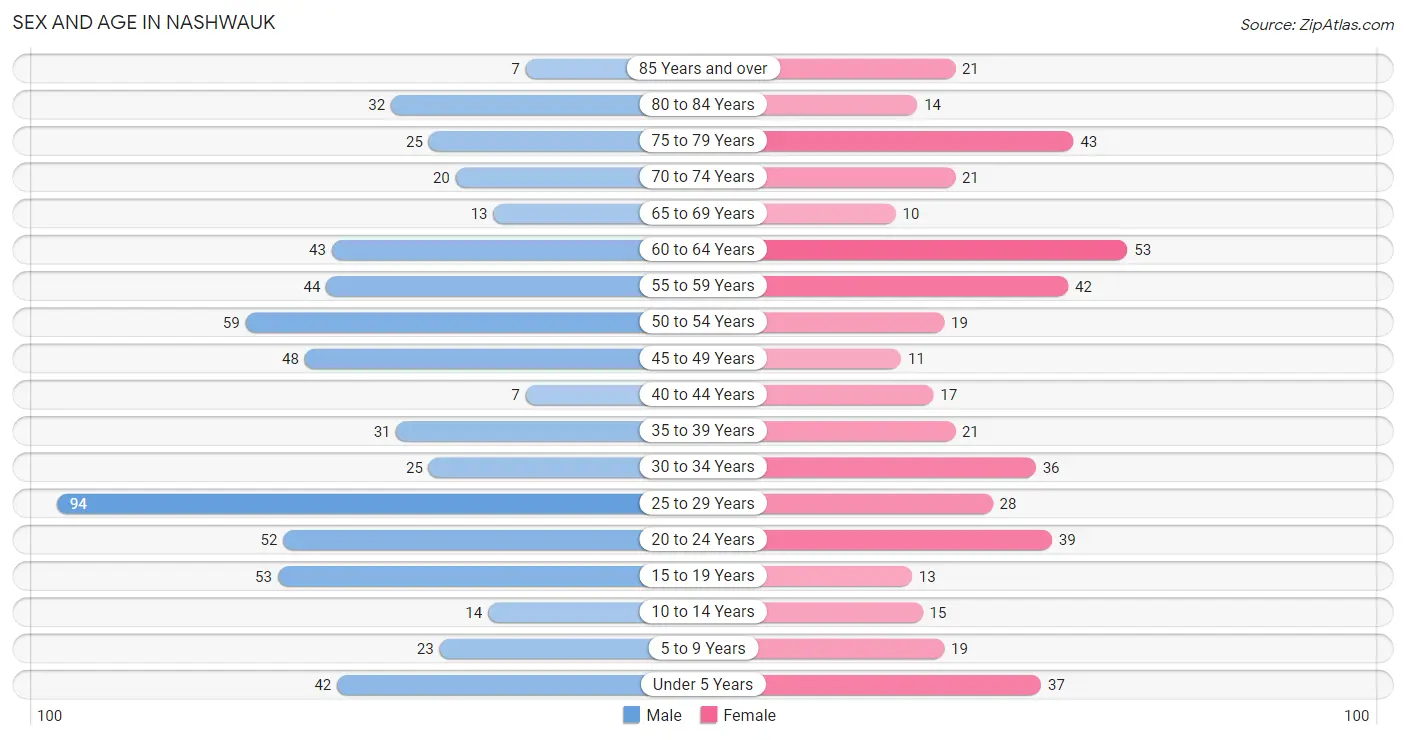
| Age Bracket | Male | Female |
| Under 5 Years | 42 (6.7%) | 37 (8.1%) |
| 5 to 9 Years | 23 (3.6%) | 19 (4.1%) |
| 10 to 14 Years | 14 (2.2%) | 15 (3.3%) |
| 15 to 19 Years | 53 (8.4%) | 13 (2.8%) |
| 20 to 24 Years | 52 (8.2%) | 39 (8.5%) |
| 25 to 29 Years | 94 (14.9%) | 28 (6.1%) |
| 30 to 34 Years | 25 (4.0%) | 36 (7.8%) |
| 35 to 39 Years | 31 (4.9%) | 21 (4.6%) |
| 40 to 44 Years | 7 (1.1%) | 17 (3.7%) |
| 45 to 49 Years | 48 (7.6%) | 11 (2.4%) |
| 50 to 54 Years | 59 (9.3%) | 19 (4.1%) |
| 55 to 59 Years | 44 (7.0%) | 42 (9.1%) |
| 60 to 64 Years | 43 (6.8%) | 53 (11.6%) |
| 65 to 69 Years | 13 (2.1%) | 10 (2.2%) |
| 70 to 74 Years | 20 (3.2%) | 21 (4.6%) |
| 75 to 79 Years | 25 (4.0%) | 43 (9.4%) |
| 80 to 84 Years | 32 (5.1%) | 14 (3.0%) |
| 85 Years and over | 7 (1.1%) | 21 (4.6%) |
| Total | 632 (100.0%) | 459 (100.0%) |
Families and Households in Nashwauk
Median Family Size in Nashwauk
The median family size in Nashwauk is 2.84 persons per family, with single female/mother families (50 | 17.5%) accounting for the largest median family size of 3.12 persons per family. On the other hand, married-couple families (163 | 57.0%) represent the smallest median family size with 2.75 persons per family.
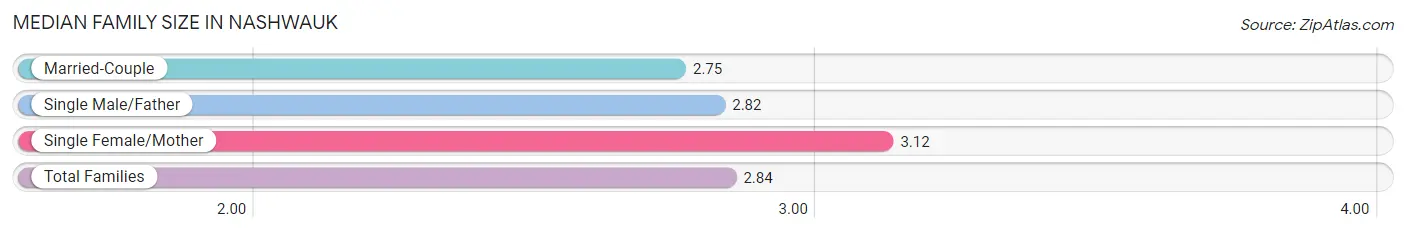
| Family Type | # Families | Family Size |
| Married-Couple | 163 (57.0%) | 2.75 |
| Single Male/Father | 73 (25.5%) | 2.82 |
| Single Female/Mother | 50 (17.5%) | 3.12 |
| Total Families | 286 (100.0%) | 2.84 |
Median Household Size in Nashwauk
The median household size in Nashwauk is 2.26 persons per household, with single female/mother households (50 | 10.4%) accounting for the largest median household size of 3.3 persons per household. non-family households (194 | 40.4%) represent the smallest median household size with 1.21 persons per household.
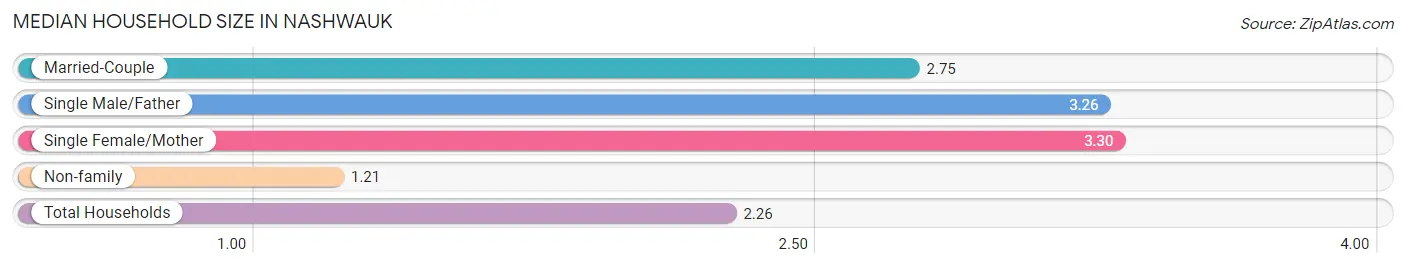
| Household Type | # Households | Household Size |
| Married-Couple | 163 (34.0%) | 2.75 |
| Single Male/Father | 73 (15.2%) | 3.26 |
| Single Female/Mother | 50 (10.4%) | 3.30 |
| Non-family | 194 (40.4%) | 1.21 |
| Total Households | 480 (100.0%) | 2.26 |
Household Size by Marriage Status in Nashwauk
Out of a total of 480 households in Nashwauk, 286 (59.6%) are family households, while 194 (40.4%) are nonfamily households. The most numerous type of family households are 2-person households, comprising 154, and the most common type of nonfamily households are 1-person households, comprising 161.
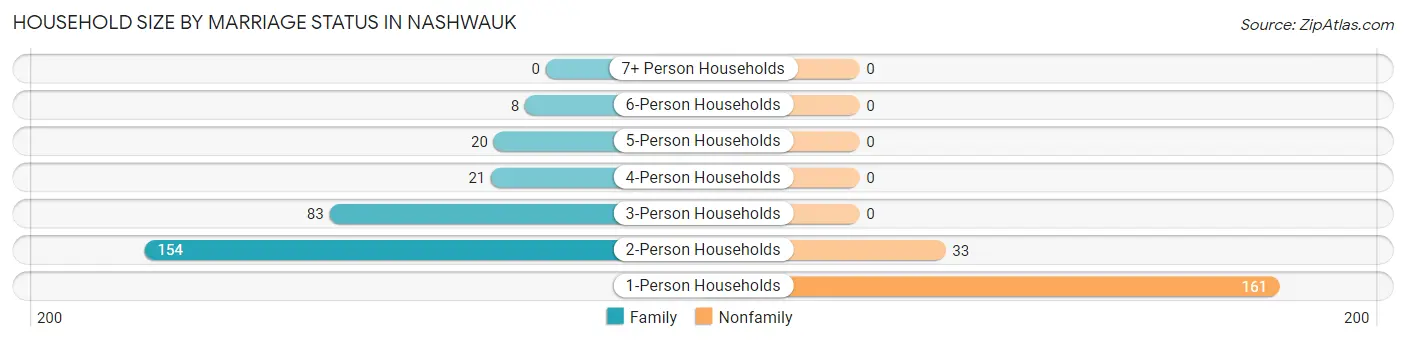
| Household Size | Family Households | Nonfamily Households |
| 1-Person Households | - | 161 (33.5%) |
| 2-Person Households | 154 (32.1%) | 33 (6.9%) |
| 3-Person Households | 83 (17.3%) | 0 (0.0%) |
| 4-Person Households | 21 (4.4%) | 0 (0.0%) |
| 5-Person Households | 20 (4.2%) | 0 (0.0%) |
| 6-Person Households | 8 (1.7%) | 0 (0.0%) |
| 7+ Person Households | 0 (0.0%) | 0 (0.0%) |
| Total | 286 (59.6%) | 194 (40.4%) |
Female Fertility in Nashwauk
Fertility by Age in Nashwauk
Average fertility rate in Nashwauk is 84.0 births per 1,000 women. Women in the age bracket of 20 to 34 years have the highest fertility rate with 136.0 births per 1,000 women. Women in the age bracket of 20 to 34 years acount for 100.0% of all women with births.
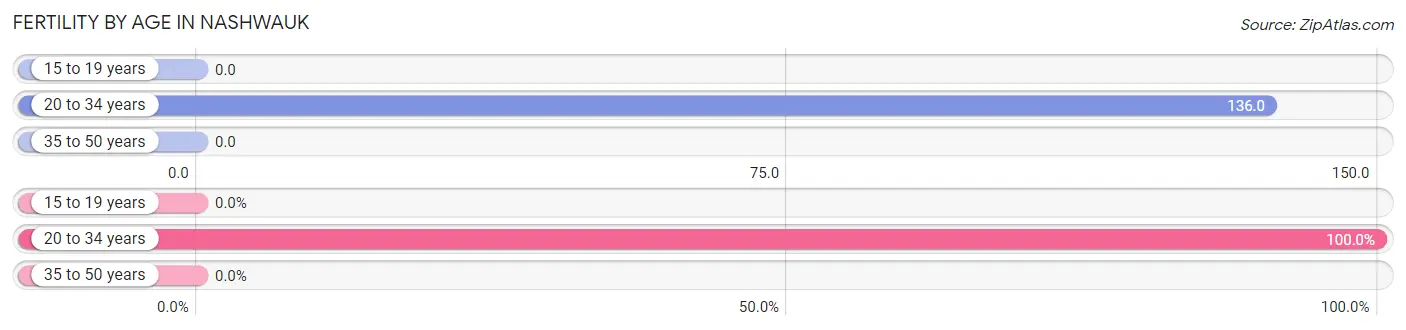
| Age Bracket | Women with Births | Births / 1,000 Women |
| 15 to 19 years | 0 (0.0%) | 0.0 |
| 20 to 34 years | 14 (100.0%) | 136.0 |
| 35 to 50 years | 0 (0.0%) | 0.0 |
| Total | 14 (100.0%) | 84.0 |
Fertility by Age by Marriage Status in Nashwauk
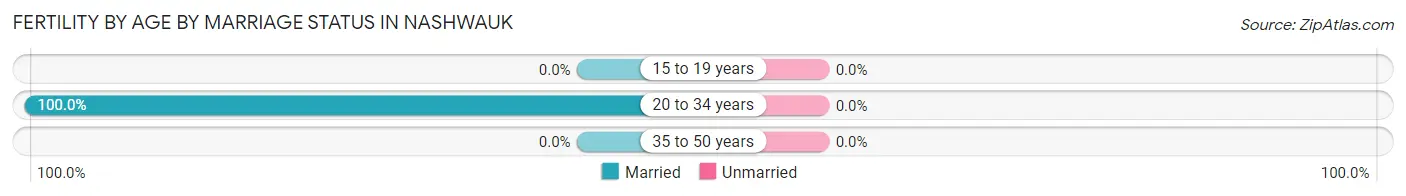
| Age Bracket | Married | Unmarried |
| 15 to 19 years | 0 (0.0%) | 0 (0.0%) |
| 20 to 34 years | 14 (100.0%) | 0 (0.0%) |
| 35 to 50 years | 0 (0.0%) | 0 (0.0%) |
| Total | 14 (100.0%) | 0 (0.0%) |
Fertility by Education in Nashwauk
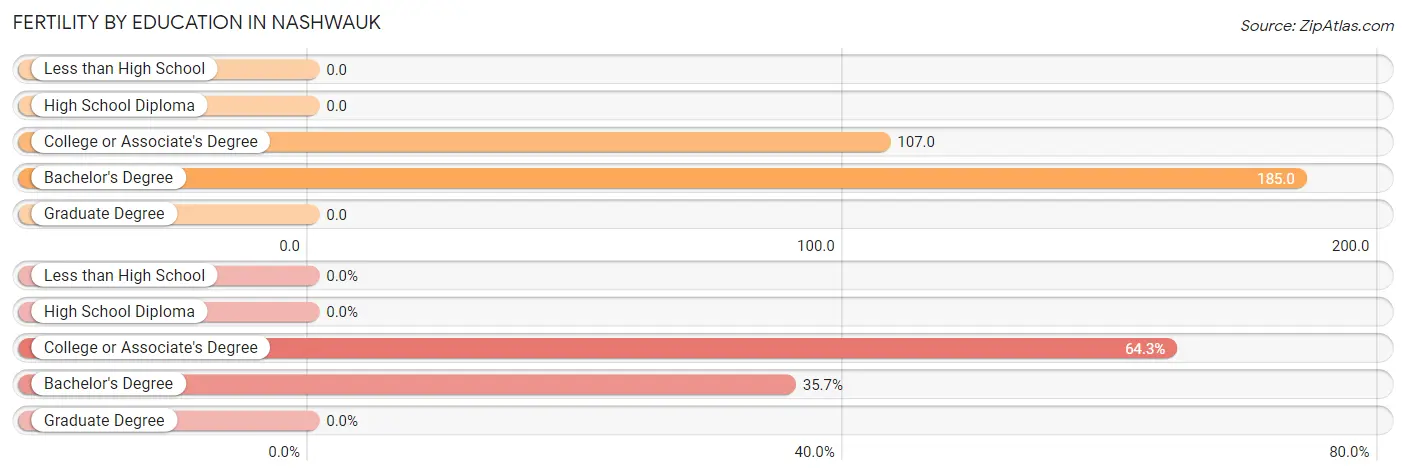
| Educational Attainment | Women with Births | Births / 1,000 Women |
| Less than High School | 0 (0.0%) | 0.0 |
| High School Diploma | 0 (0.0%) | 0.0 |
| College or Associate's Degree | 9 (64.3%) | 107.0 |
| Bachelor's Degree | 5 (35.7%) | 185.0 |
| Graduate Degree | 0 (0.0%) | 0.0 |
| Total | 14 (100.0%) | 84.0 |
Fertility by Education by Marriage Status in Nashwauk
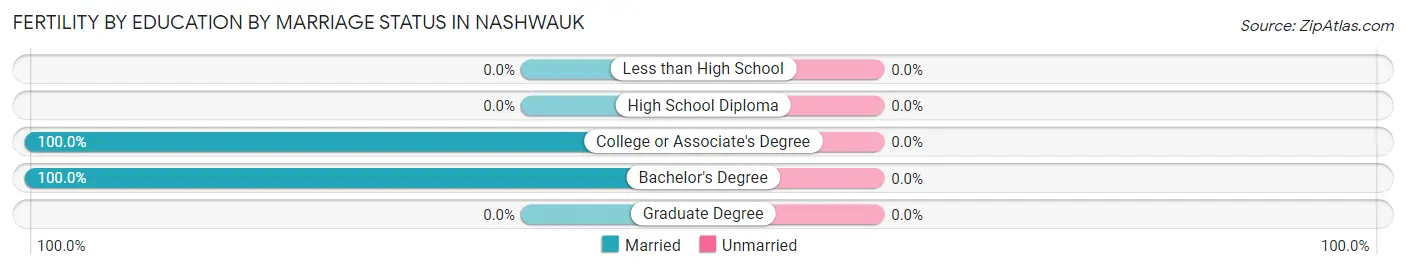
| Educational Attainment | Married | Unmarried |
| Less than High School | 0 (0.0%) | 0 (0.0%) |
| High School Diploma | 0 (0.0%) | 0 (0.0%) |
| College or Associate's Degree | 9 (100.0%) | 0 (0.0%) |
| Bachelor's Degree | 5 (100.0%) | 0 (0.0%) |
| Graduate Degree | 0 (0.0%) | 0 (0.0%) |
| Total | 14 (100.0%) | 0 (0.0%) |
Employment Characteristics in Nashwauk
Employment by Class of Employer in Nashwauk
Among the 511 employed individuals in Nashwauk, private company employees (311 | 60.9%), local government employees (94 | 18.4%), and state government employees (35 | 6.9%) make up the most common classes of employment.
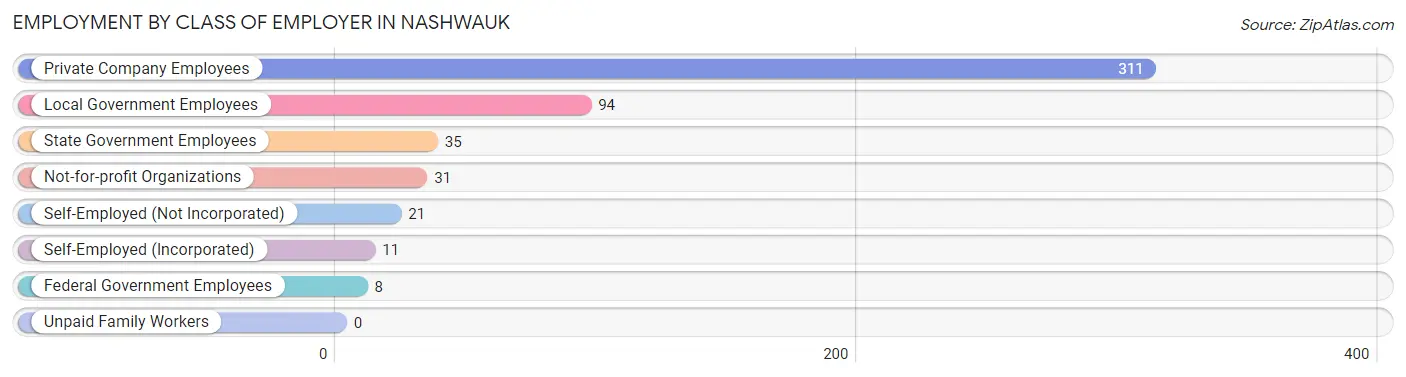
| Employer Class | # Employees | % Employees |
| Private Company Employees | 311 | 60.9% |
| Self-Employed (Incorporated) | 11 | 2.1% |
| Self-Employed (Not Incorporated) | 21 | 4.1% |
| Not-for-profit Organizations | 31 | 6.1% |
| Local Government Employees | 94 | 18.4% |
| State Government Employees | 35 | 6.9% |
| Federal Government Employees | 8 | 1.6% |
| Unpaid Family Workers | 0 | 0.0% |
| Total | 511 | 100.0% |
Employment Status by Age in Nashwauk
According to the labor force statistics for Nashwauk, out of the total population over 16 years of age (936), 57.8% or 541 individuals are in the labor force, with 5.2% or 28 of them unemployed. The age group with the highest labor force participation rate is 35 to 44 years, with 94.7% or 72 individuals in the labor force. Within the labor force, the 30 to 34 years age range has the highest percentage of unemployed individuals, with 22.6% or 12 of them being unemployed.
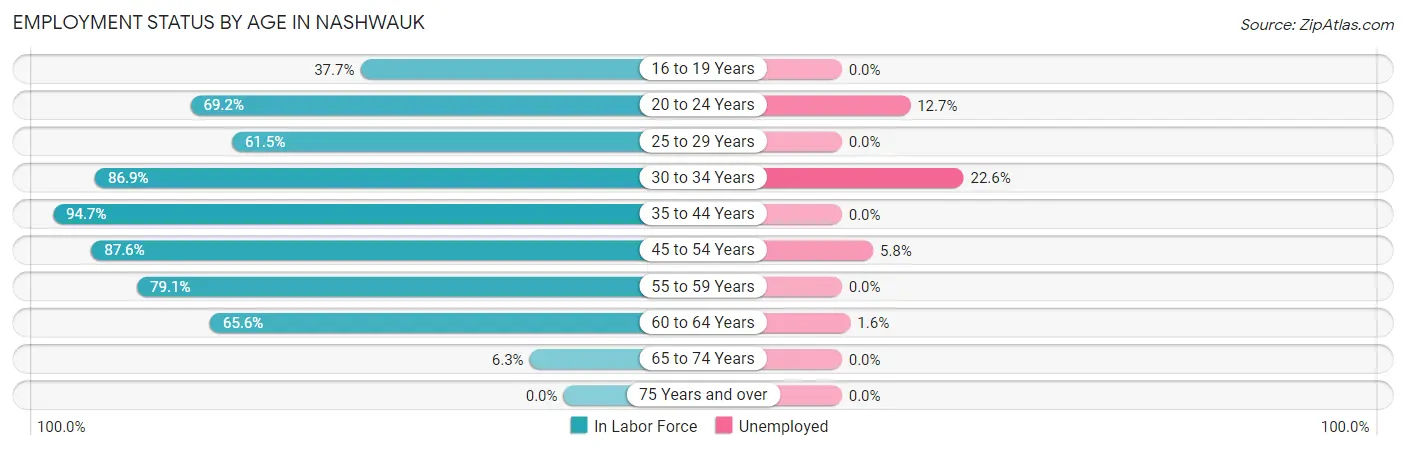
| Age Bracket | In Labor Force | Unemployed |
| 16 to 19 Years | 23 (37.7%) | 0 (0.0%) |
| 20 to 24 Years | 63 (69.2%) | 8 (12.7%) |
| 25 to 29 Years | 75 (61.5%) | 0 (0.0%) |
| 30 to 34 Years | 53 (86.9%) | 12 (22.6%) |
| 35 to 44 Years | 72 (94.7%) | 0 (0.0%) |
| 45 to 54 Years | 120 (87.6%) | 7 (5.8%) |
| 55 to 59 Years | 68 (79.1%) | 0 (0.0%) |
| 60 to 64 Years | 63 (65.6%) | 1 (1.6%) |
| 65 to 74 Years | 4 (6.3%) | 0 (0.0%) |
| 75 Years and over | 0 (0.0%) | 0 (0.0%) |
| Total | 541 (57.8%) | 28 (5.2%) |
Employment Status by Educational Attainment in Nashwauk
According to labor force statistics for Nashwauk, 78.0% of individuals (451) out of the total population between 25 and 64 years of age (578) are in the labor force, with 4.4% or 20 of them being unemployed. The group with the highest labor force participation rate are those with the educational attainment of less than high school, with 100.0% or 17 individuals in the labor force. Within the labor force, individuals with college / associate degree education have the highest percentage of unemployment, with 7.4% or 16 of them being unemployed.
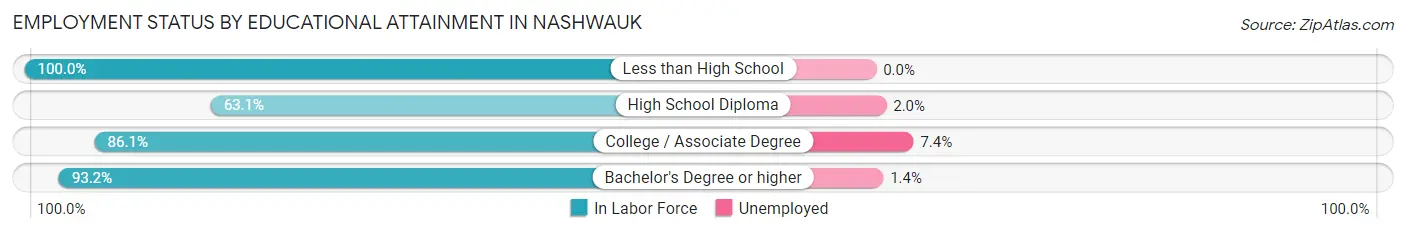
| Educational Attainment | In Labor Force | Unemployed |
| Less than High School | 17 (100.0%) | 0 (0.0%) |
| High School Diploma | 149 (63.1%) | 5 (2.0%) |
| College / Associate Degree | 216 (86.1%) | 19 (7.4%) |
| Bachelor's Degree or higher | 69 (93.2%) | 1 (1.4%) |
| Total | 451 (78.0%) | 25 (4.4%) |
Employment Occupations by Sex in Nashwauk
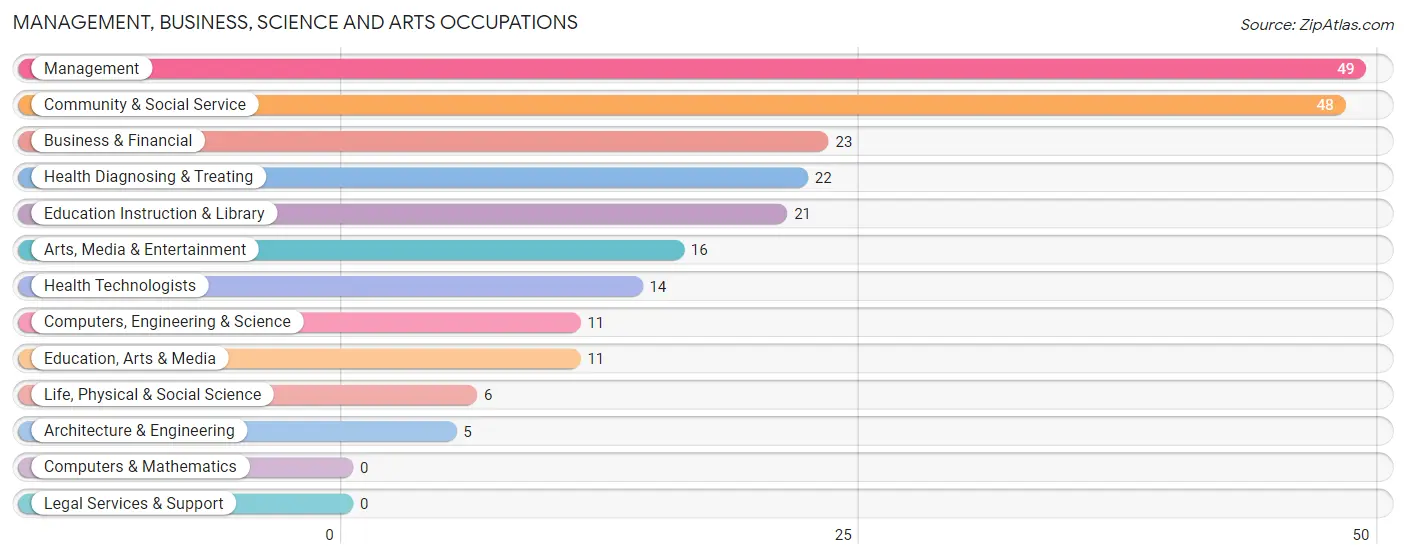
Management, Business, Science and Arts Occupations
The most common Management, Business, Science and Arts occupations in Nashwauk are Management (49 | 9.6%), Community & Social Service (48 | 9.4%), Business & Financial (23 | 4.5%), Health Diagnosing & Treating (22 | 4.3%), and Education Instruction & Library (21 | 4.1%).
Management, Business, Science and Arts Occupations by Sex
Within the Management, Business, Science and Arts occupations in Nashwauk, the most male-oriented occupations are Computers, Engineering & Science (100.0%), Architecture & Engineering (100.0%), and Life, Physical & Social Science (100.0%), while the most female-oriented occupations are Business & Financial (100.0%), Health Technologists (100.0%), and Health Diagnosing & Treating (86.4%).
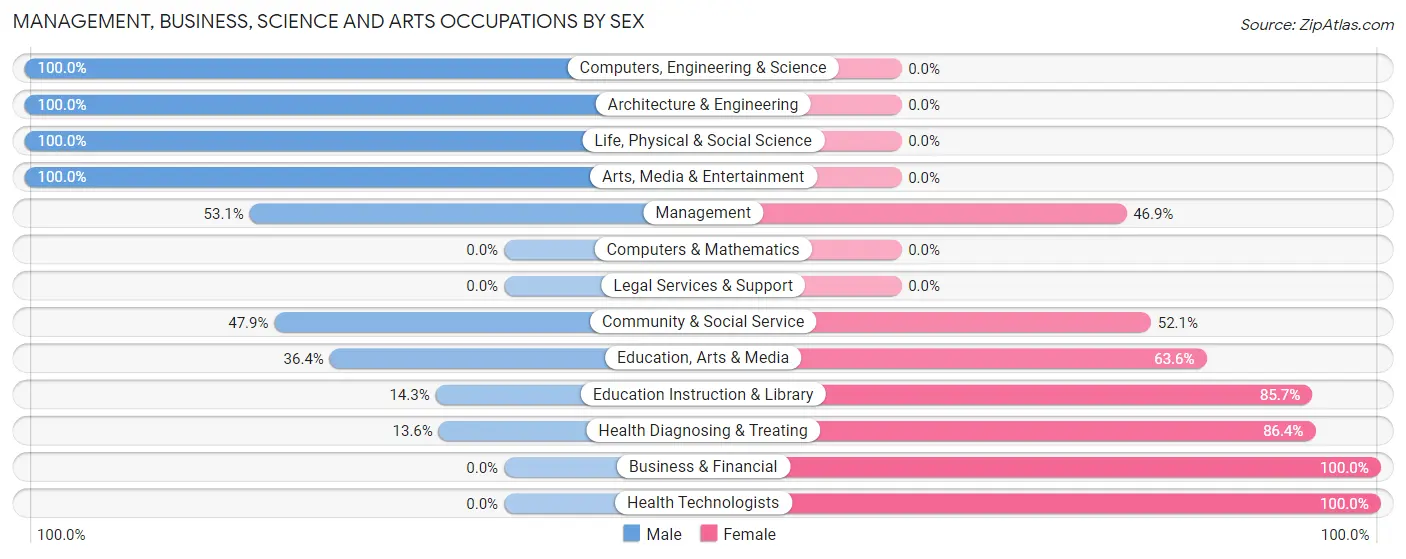
| Occupation | Male | Female |
| Management | 26 (53.1%) | 23 (46.9%) |
| Business & Financial | 0 (0.0%) | 23 (100.0%) |
| Computers, Engineering & Science | 11 (100.0%) | 0 (0.0%) |
| Computers & Mathematics | 0 (0.0%) | 0 (0.0%) |
| Architecture & Engineering | 5 (100.0%) | 0 (0.0%) |
| Life, Physical & Social Science | 6 (100.0%) | 0 (0.0%) |
| Community & Social Service | 23 (47.9%) | 25 (52.1%) |
| Education, Arts & Media | 4 (36.4%) | 7 (63.6%) |
| Legal Services & Support | 0 (0.0%) | 0 (0.0%) |
| Education Instruction & Library | 3 (14.3%) | 18 (85.7%) |
| Arts, Media & Entertainment | 16 (100.0%) | 0 (0.0%) |
| Health Diagnosing & Treating | 3 (13.6%) | 19 (86.4%) |
| Health Technologists | 0 (0.0%) | 14 (100.0%) |
| Total (Category) | 63 (41.2%) | 90 (58.8%) |
| Total (Overall) | 324 (63.2%) | 189 (36.8%) |
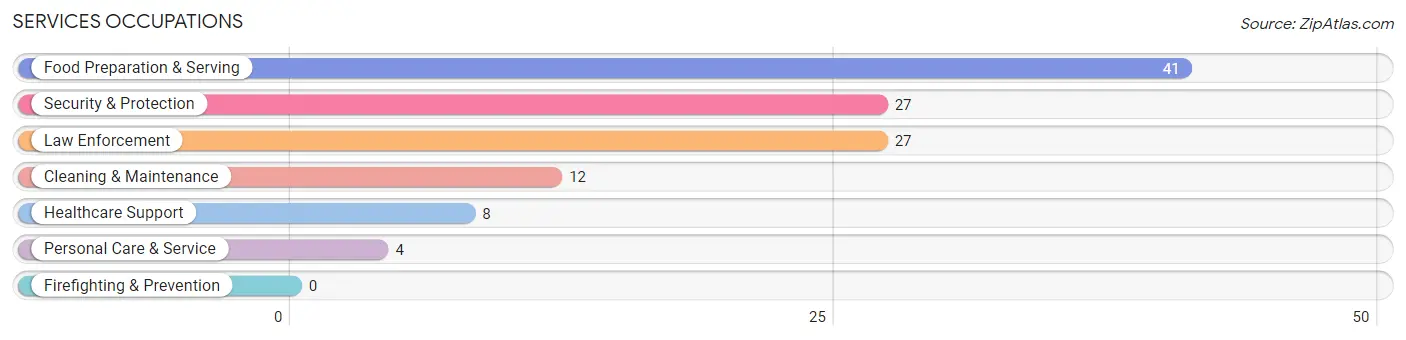
Services Occupations
The most common Services occupations in Nashwauk are Food Preparation & Serving (41 | 8.0%), Security & Protection (27 | 5.3%), Law Enforcement (27 | 5.3%), Cleaning & Maintenance (12 | 2.3%), and Healthcare Support (8 | 1.6%).
Services Occupations by Sex
Within the Services occupations in Nashwauk, the most male-oriented occupations are Security & Protection (100.0%), Law Enforcement (100.0%), and Food Preparation & Serving (78.0%), while the most female-oriented occupations are Healthcare Support (100.0%), Personal Care & Service (100.0%), and Cleaning & Maintenance (41.7%).
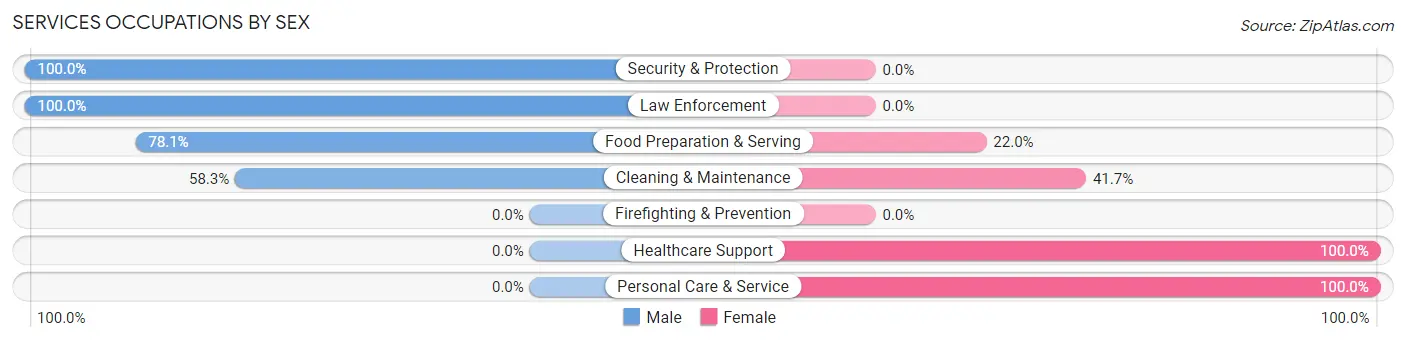
| Occupation | Male | Female |
| Healthcare Support | 0 (0.0%) | 8 (100.0%) |
| Security & Protection | 27 (100.0%) | 0 (0.0%) |
| Firefighting & Prevention | 0 (0.0%) | 0 (0.0%) |
| Law Enforcement | 27 (100.0%) | 0 (0.0%) |
| Food Preparation & Serving | 32 (78.0%) | 9 (22.0%) |
| Cleaning & Maintenance | 7 (58.3%) | 5 (41.7%) |
| Personal Care & Service | 0 (0.0%) | 4 (100.0%) |
| Total (Category) | 66 (71.7%) | 26 (28.3%) |
| Total (Overall) | 324 (63.2%) | 189 (36.8%) |
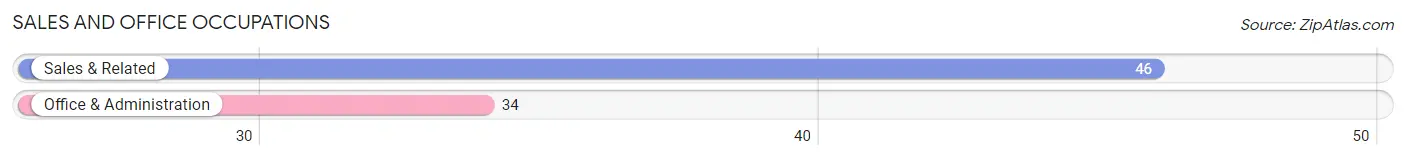
Sales and Office Occupations
The most common Sales and Office occupations in Nashwauk are Sales & Related (46 | 9.0%), and Office & Administration (34 | 6.6%).
Sales and Office Occupations by Sex
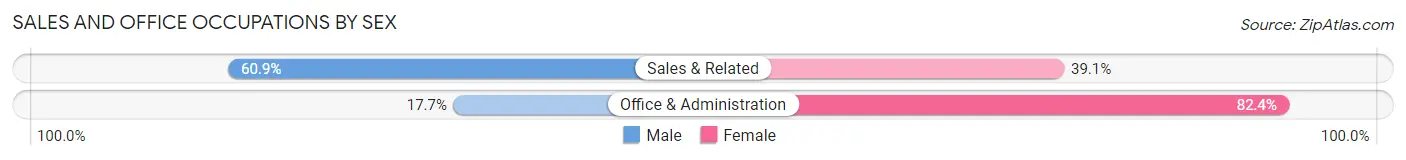
| Occupation | Male | Female |
| Sales & Related | 28 (60.9%) | 18 (39.1%) |
| Office & Administration | 6 (17.6%) | 28 (82.4%) |
| Total (Category) | 34 (42.5%) | 46 (57.5%) |
| Total (Overall) | 324 (63.2%) | 189 (36.8%) |
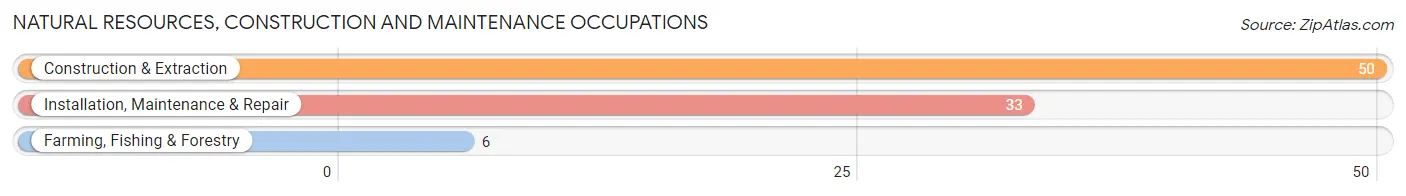
Natural Resources, Construction and Maintenance Occupations
The most common Natural Resources, Construction and Maintenance occupations in Nashwauk are Construction & Extraction (50 | 9.8%), Installation, Maintenance & Repair (33 | 6.4%), and Farming, Fishing & Forestry (6 | 1.2%).
Natural Resources, Construction and Maintenance Occupations by Sex
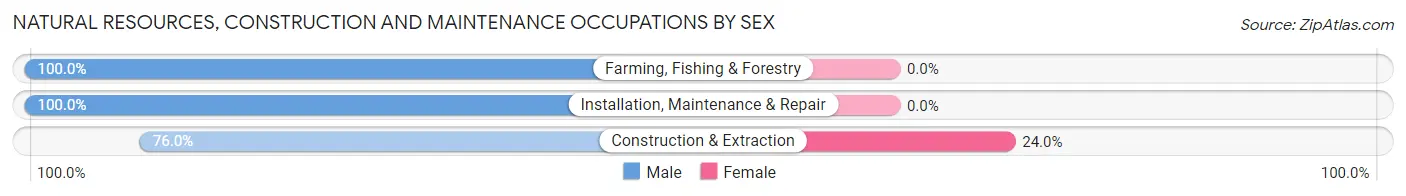
| Occupation | Male | Female |
| Farming, Fishing & Forestry | 6 (100.0%) | 0 (0.0%) |
| Construction & Extraction | 38 (76.0%) | 12 (24.0%) |
| Installation, Maintenance & Repair | 33 (100.0%) | 0 (0.0%) |
| Total (Category) | 77 (86.5%) | 12 (13.5%) |
| Total (Overall) | 324 (63.2%) | 189 (36.8%) |
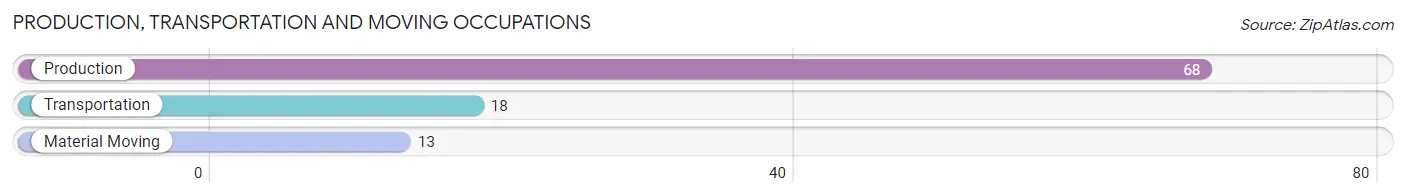
Production, Transportation and Moving Occupations
The most common Production, Transportation and Moving occupations in Nashwauk are Production (68 | 13.3%), Transportation (18 | 3.5%), and Material Moving (13 | 2.5%).
Production, Transportation and Moving Occupations by Sex
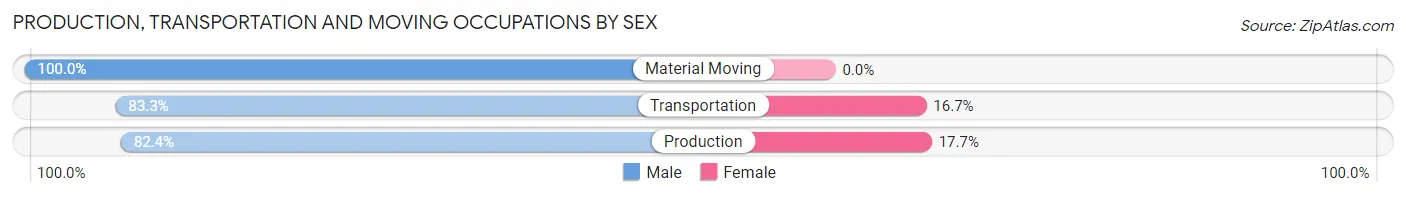
| Occupation | Male | Female |
| Production | 56 (82.4%) | 12 (17.6%) |
| Transportation | 15 (83.3%) | 3 (16.7%) |
| Material Moving | 13 (100.0%) | 0 (0.0%) |
| Total (Category) | 84 (84.9%) | 15 (15.1%) |
| Total (Overall) | 324 (63.2%) | 189 (36.8%) |
Employment Industries by Sex in Nashwauk
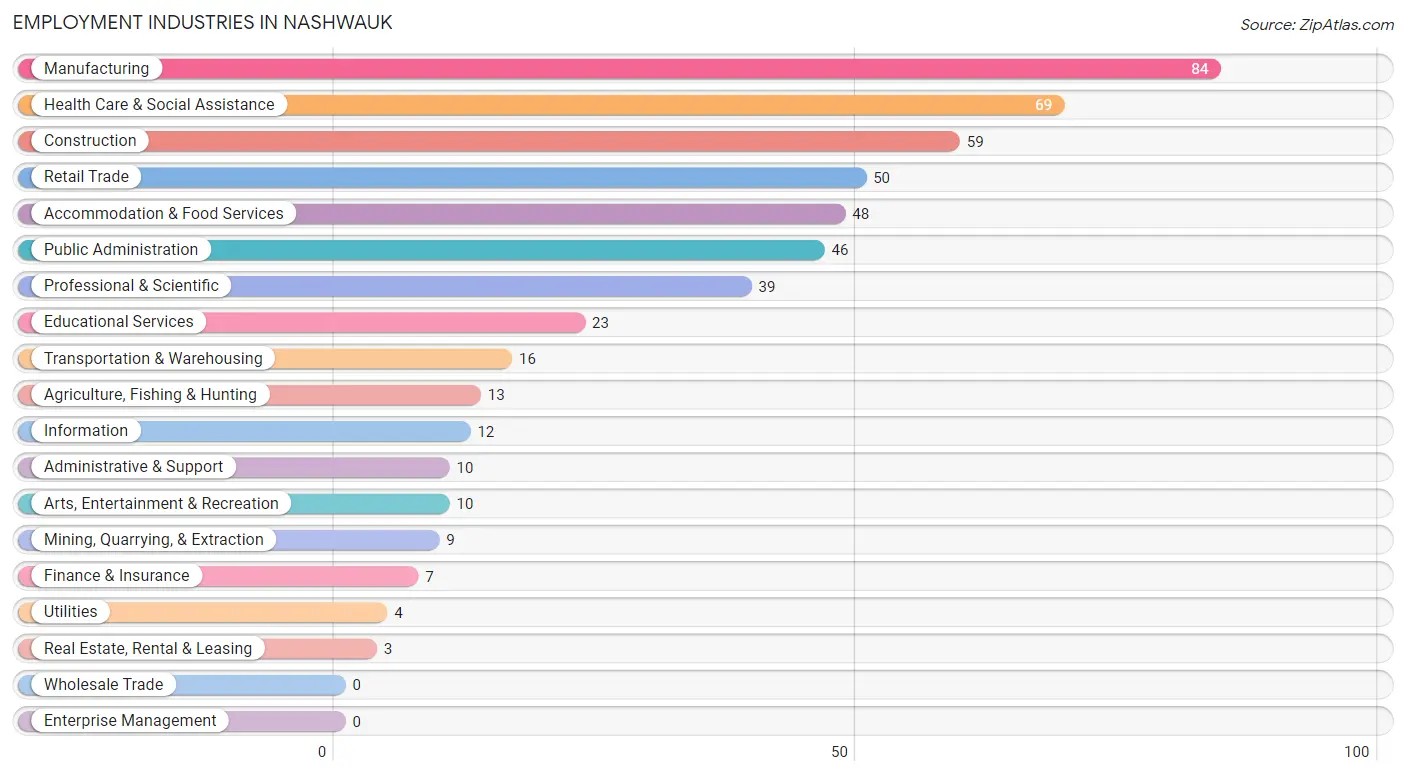
Employment Industries in Nashwauk
The major employment industries in Nashwauk include Manufacturing (84 | 16.4%), Health Care & Social Assistance (69 | 13.5%), Construction (59 | 11.5%), Retail Trade (50 | 9.8%), and Accommodation & Food Services (48 | 9.4%).
Employment Industries by Sex in Nashwauk
The Nashwauk industries that see more men than women are Mining, Quarrying, & Extraction (100.0%), Real Estate, Rental & Leasing (100.0%), and Arts, Entertainment & Recreation (100.0%), whereas the industries that tend to have a higher number of women are Utilities (100.0%), Information (100.0%), and Finance & Insurance (100.0%).
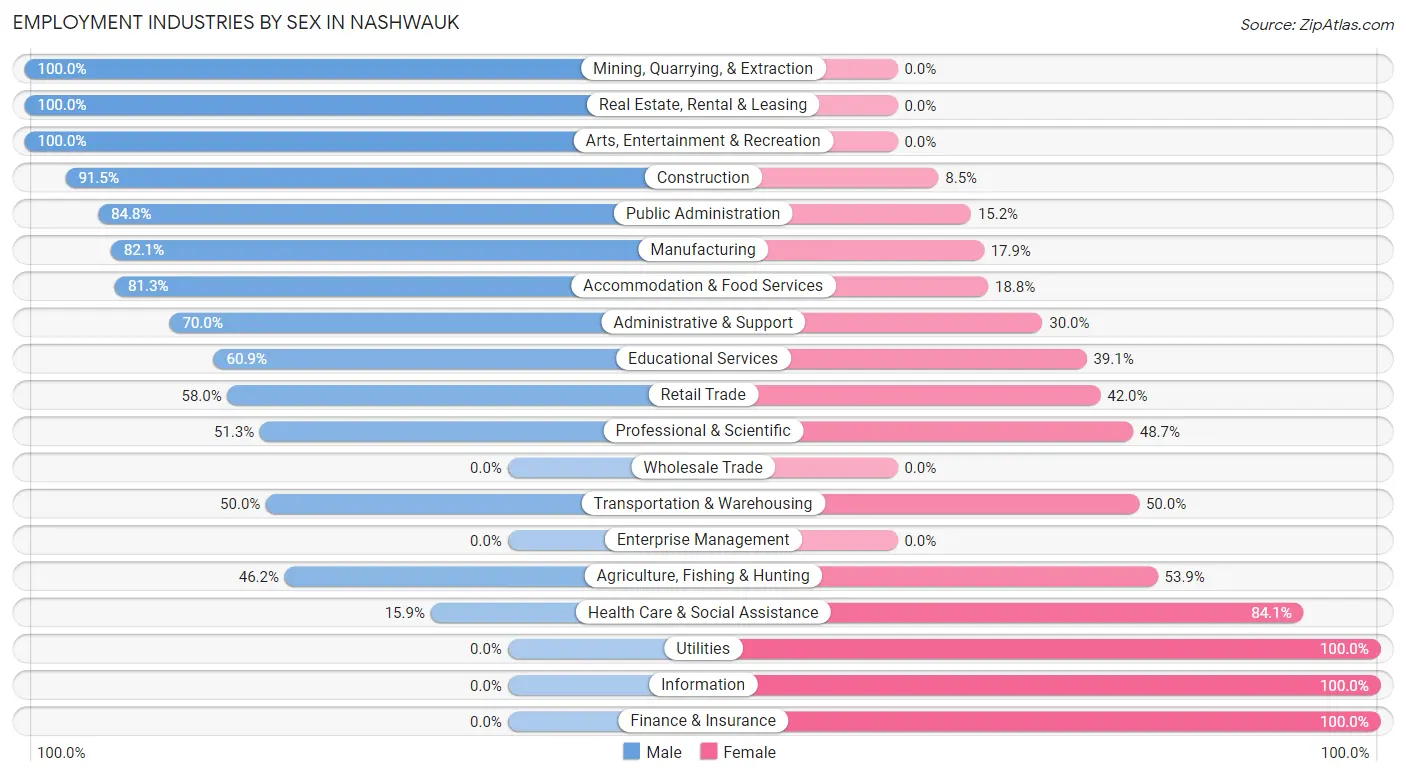
| Industry | Male | Female |
| Agriculture, Fishing & Hunting | 6 (46.2%) | 7 (53.8%) |
| Mining, Quarrying, & Extraction | 9 (100.0%) | 0 (0.0%) |
| Construction | 54 (91.5%) | 5 (8.5%) |
| Manufacturing | 69 (82.1%) | 15 (17.9%) |
| Wholesale Trade | 0 (0.0%) | 0 (0.0%) |
| Retail Trade | 29 (58.0%) | 21 (42.0%) |
| Transportation & Warehousing | 8 (50.0%) | 8 (50.0%) |
| Utilities | 0 (0.0%) | 4 (100.0%) |
| Information | 0 (0.0%) | 12 (100.0%) |
| Finance & Insurance | 0 (0.0%) | 7 (100.0%) |
| Real Estate, Rental & Leasing | 3 (100.0%) | 0 (0.0%) |
| Professional & Scientific | 20 (51.3%) | 19 (48.7%) |
| Enterprise Management | 0 (0.0%) | 0 (0.0%) |
| Administrative & Support | 7 (70.0%) | 3 (30.0%) |
| Educational Services | 14 (60.9%) | 9 (39.1%) |
| Health Care & Social Assistance | 11 (15.9%) | 58 (84.1%) |
| Arts, Entertainment & Recreation | 10 (100.0%) | 0 (0.0%) |
| Accommodation & Food Services | 39 (81.2%) | 9 (18.8%) |
| Public Administration | 39 (84.8%) | 7 (15.2%) |
| Total | 324 (63.2%) | 189 (36.8%) |
Education in Nashwauk
School Enrollment in Nashwauk
The most common levels of schooling among the 158 students in Nashwauk are elementary school (42 | 26.6%), college / undergraduate (42 | 26.6%), and high school (37 | 23.4%).
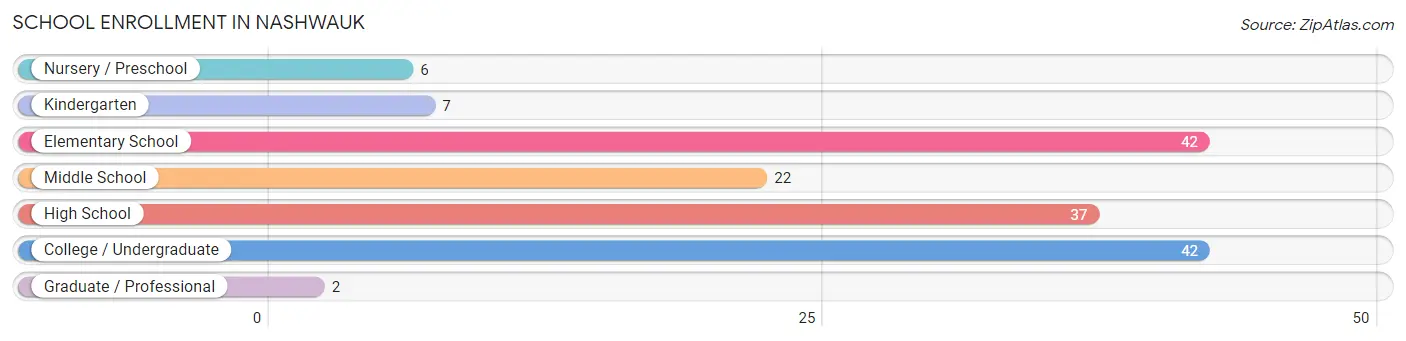
| School Level | # Students | % Students |
| Nursery / Preschool | 6 | 3.8% |
| Kindergarten | 7 | 4.4% |
| Elementary School | 42 | 26.6% |
| Middle School | 22 | 13.9% |
| High School | 37 | 23.4% |
| College / Undergraduate | 42 | 26.6% |
| Graduate / Professional | 2 | 1.3% |
| Total | 158 | 100.0% |
School Enrollment by Age by Funding Source in Nashwauk
Out of a total of 158 students who are enrolled in schools in Nashwauk, 8 (5.1%) attend a private institution, while the remaining 150 (94.9%) are enrolled in public schools. The age group of 18 to 19 year olds has the highest likelihood of being enrolled in private schools, with 6 (31.6% in the age bracket) enrolled. Conversely, the age group of 3 to 4 year olds has the lowest likelihood of being enrolled in a private school, with 6 (100.0% in the age bracket) attending a public institution.
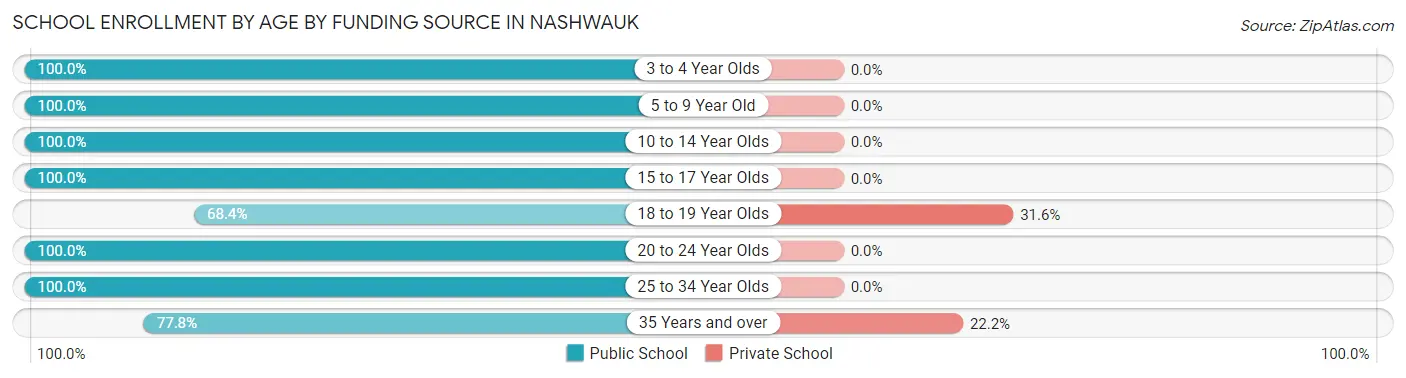
| Age Bracket | Public School | Private School |
| 3 to 4 Year Olds | 6 (100.0%) | 0 (0.0%) |
| 5 to 9 Year Old | 42 (100.0%) | 0 (0.0%) |
| 10 to 14 Year Olds | 29 (100.0%) | 0 (0.0%) |
| 15 to 17 Year Olds | 18 (100.0%) | 0 (0.0%) |
| 18 to 19 Year Olds | 13 (68.4%) | 6 (31.6%) |
| 20 to 24 Year Olds | 25 (100.0%) | 0 (0.0%) |
| 25 to 34 Year Olds | 10 (100.0%) | 0 (0.0%) |
| 35 Years and over | 7 (77.8%) | 2 (22.2%) |
| Total | 150 (94.9%) | 8 (5.1%) |
Educational Attainment by Field of Study in Nashwauk
Education (27 | 23.7%), arts & humanities (24 | 21.0%), business (16 | 14.0%), science & technology (13 | 11.4%), and social sciences (10 | 8.8%) are the most common fields of study among 114 individuals in Nashwauk who have obtained a bachelor's degree or higher.
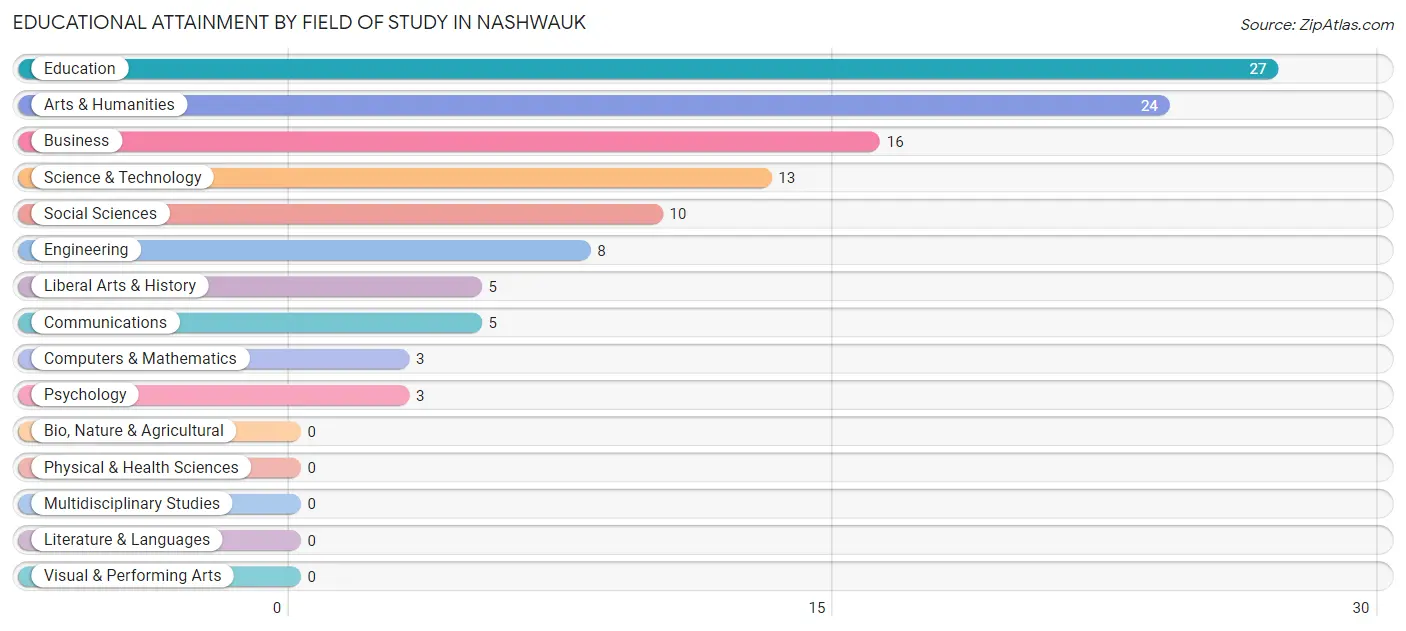
| Field of Study | # Graduates | % Graduates |
| Computers & Mathematics | 3 | 2.6% |
| Bio, Nature & Agricultural | 0 | 0.0% |
| Physical & Health Sciences | 0 | 0.0% |
| Psychology | 3 | 2.6% |
| Social Sciences | 10 | 8.8% |
| Engineering | 8 | 7.0% |
| Multidisciplinary Studies | 0 | 0.0% |
| Science & Technology | 13 | 11.4% |
| Business | 16 | 14.0% |
| Education | 27 | 23.7% |
| Literature & Languages | 0 | 0.0% |
| Liberal Arts & History | 5 | 4.4% |
| Visual & Performing Arts | 0 | 0.0% |
| Communications | 5 | 4.4% |
| Arts & Humanities | 24 | 21.0% |
| Total | 114 | 100.0% |
Transportation & Commute in Nashwauk
Vehicle Availability by Sex in Nashwauk
The most prevalent vehicle ownership categories in Nashwauk are males with 2 vehicles (129, accounting for 40.1%) and females with 2 vehicles (71, making up 69.0%).
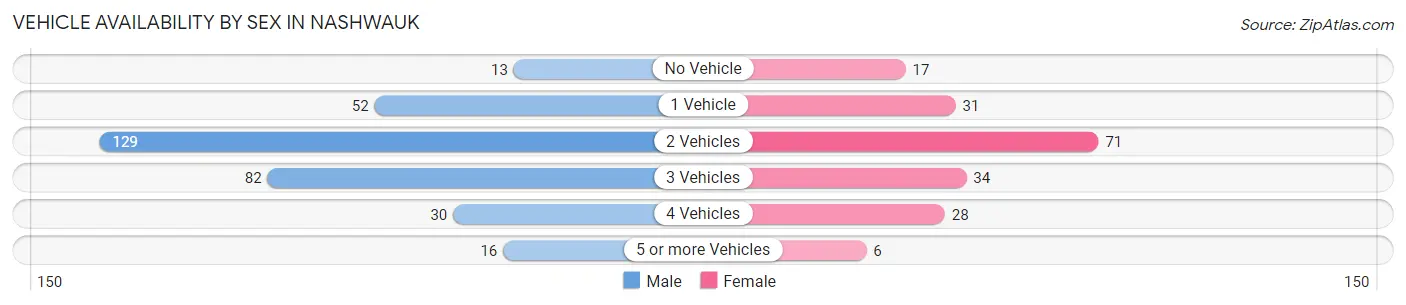
| Vehicles Available | Male | Female |
| No Vehicle | 13 (4.0%) | 17 (9.1%) |
| 1 Vehicle | 52 (16.2%) | 31 (16.6%) |
| 2 Vehicles | 129 (40.1%) | 71 (38.0%) |
| 3 Vehicles | 82 (25.5%) | 34 (18.2%) |
| 4 Vehicles | 30 (9.3%) | 28 (15.0%) |
| 5 or more Vehicles | 16 (5.0%) | 6 (3.2%) |
| Total | 322 (100.0%) | 187 (100.0%) |
Commute Time in Nashwauk
The most frequently occuring commute durations in Nashwauk are 20 to 24 minutes (103 commuters, 22.0%), 5 to 9 minutes (73 commuters, 15.6%), and 15 to 19 minutes (68 commuters, 14.5%).
| Commute Time | # Commuters | % Commuters |
| Less than 5 Minutes | 44 | 9.4% |
| 5 to 9 Minutes | 73 | 15.6% |
| 10 to 14 Minutes | 17 | 3.6% |
| 15 to 19 Minutes | 68 | 14.5% |
| 20 to 24 Minutes | 103 | 22.0% |
| 25 to 29 Minutes | 8 | 1.7% |
| 30 to 34 Minutes | 66 | 14.1% |
| 35 to 39 Minutes | 20 | 4.3% |
| 40 to 44 Minutes | 25 | 5.3% |
| 45 to 59 Minutes | 24 | 5.1% |
| 60 to 89 Minutes | 7 | 1.5% |
| 90 or more Minutes | 14 | 3.0% |
Commute Time by Sex in Nashwauk
The most common commute times in Nashwauk are 5 to 9 minutes (64 commuters, 21.1%) for males and 20 to 24 minutes (44 commuters, 26.5%) for females.
| Commute Time | Male | Female |
| Less than 5 Minutes | 23 (7.6%) | 21 (12.7%) |
| 5 to 9 Minutes | 64 (21.1%) | 9 (5.4%) |
| 10 to 14 Minutes | 10 (3.3%) | 7 (4.2%) |
| 15 to 19 Minutes | 33 (10.9%) | 35 (21.1%) |
| 20 to 24 Minutes | 59 (19.5%) | 44 (26.5%) |
| 25 to 29 Minutes | 5 (1.7%) | 3 (1.8%) |
| 30 to 34 Minutes | 46 (15.2%) | 20 (12.0%) |
| 35 to 39 Minutes | 10 (3.3%) | 10 (6.0%) |
| 40 to 44 Minutes | 16 (5.3%) | 9 (5.4%) |
| 45 to 59 Minutes | 16 (5.3%) | 8 (4.8%) |
| 60 to 89 Minutes | 7 (2.3%) | 0 (0.0%) |
| 90 or more Minutes | 14 (4.6%) | 0 (0.0%) |
Time of Departure to Work by Sex in Nashwauk
The most frequent times of departure to work in Nashwauk are 6:30 AM to 6:59 AM (58, 19.1%) for males and 6:30 AM to 6:59 AM (38, 22.9%) for females.
| Time of Departure | Male | Female |
| 12:00 AM to 4:59 AM | 24 (7.9%) | 4 (2.4%) |
| 5:00 AM to 5:29 AM | 31 (10.2%) | 0 (0.0%) |
| 5:30 AM to 5:59 AM | 12 (4.0%) | 5 (3.0%) |
| 6:00 AM to 6:29 AM | 39 (12.9%) | 13 (7.8%) |
| 6:30 AM to 6:59 AM | 58 (19.1%) | 38 (22.9%) |
| 7:00 AM to 7:29 AM | 23 (7.6%) | 26 (15.7%) |
| 7:30 AM to 7:59 AM | 14 (4.6%) | 23 (13.9%) |
| 8:00 AM to 8:29 AM | 28 (9.2%) | 17 (10.2%) |
| 8:30 AM to 8:59 AM | 0 (0.0%) | 3 (1.8%) |
| 9:00 AM to 9:59 AM | 0 (0.0%) | 21 (12.7%) |
| 10:00 AM to 10:59 AM | 0 (0.0%) | 3 (1.8%) |
| 11:00 AM to 11:59 AM | 0 (0.0%) | 0 (0.0%) |
| 12:00 PM to 3:59 PM | 43 (14.2%) | 8 (4.8%) |
| 4:00 PM to 11:59 PM | 31 (10.2%) | 5 (3.0%) |
| Total | 303 (100.0%) | 166 (100.0%) |
Housing Occupancy in Nashwauk
Occupancy by Ownership in Nashwauk
Of the total 480 dwellings in Nashwauk, owner-occupied units account for 402 (83.8%), while renter-occupied units make up 78 (16.3%).
| Occupancy | # Housing Units | % Housing Units |
| Owner Occupied Housing Units | 402 | 83.8% |
| Renter-Occupied Housing Units | 78 | 16.3% |
| Total Occupied Housing Units | 480 | 100.0% |
Occupancy by Household Size in Nashwauk
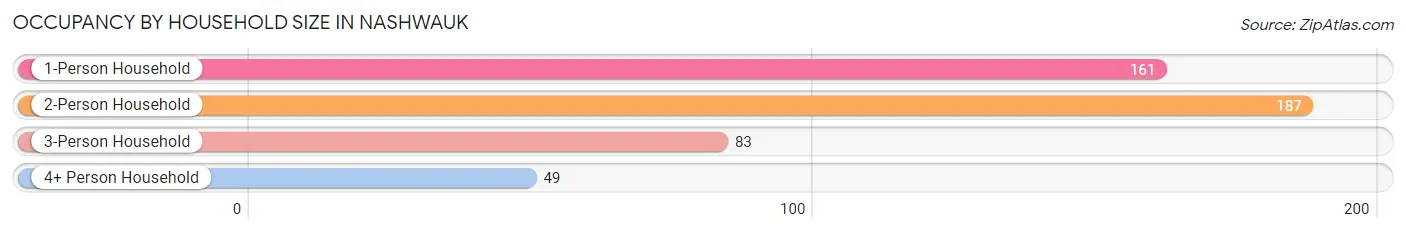
| Household Size | # Housing Units | % Housing Units |
| 1-Person Household | 161 | 33.5% |
| 2-Person Household | 187 | 39.0% |
| 3-Person Household | 83 | 17.3% |
| 4+ Person Household | 49 | 10.2% |
| Total Housing Units | 480 | 100.0% |
Occupancy by Ownership by Household Size in Nashwauk
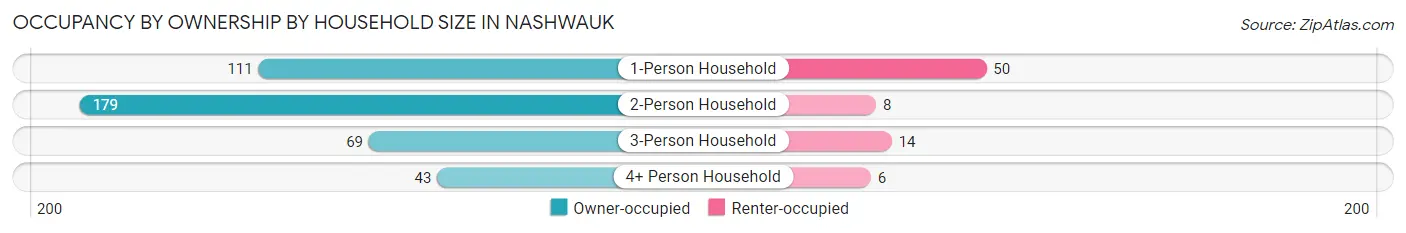
| Household Size | Owner-occupied | Renter-occupied |
| 1-Person Household | 111 (68.9%) | 50 (31.1%) |
| 2-Person Household | 179 (95.7%) | 8 (4.3%) |
| 3-Person Household | 69 (83.1%) | 14 (16.9%) |
| 4+ Person Household | 43 (87.8%) | 6 (12.2%) |
| Total Housing Units | 402 (83.8%) | 78 (16.3%) |
Occupancy by Educational Attainment in Nashwauk
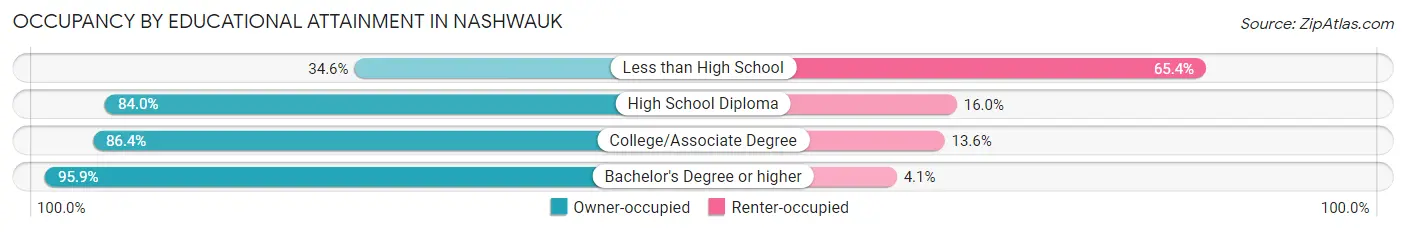
| Household Size | Owner-occupied | Renter-occupied |
| Less than High School | 9 (34.6%) | 17 (65.4%) |
| High School Diploma | 142 (84.0%) | 27 (16.0%) |
| College/Associate Degree | 204 (86.4%) | 32 (13.6%) |
| Bachelor's Degree or higher | 47 (95.9%) | 2 (4.1%) |
Occupancy by Age of Householder in Nashwauk
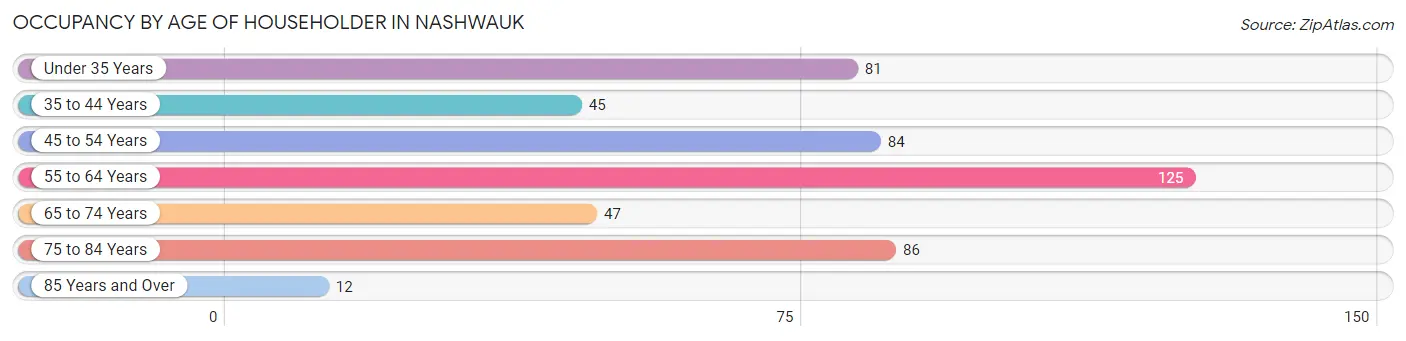
| Age Bracket | # Households | % Households |
| Under 35 Years | 81 | 16.9% |
| 35 to 44 Years | 45 | 9.4% |
| 45 to 54 Years | 84 | 17.5% |
| 55 to 64 Years | 125 | 26.0% |
| 65 to 74 Years | 47 | 9.8% |
| 75 to 84 Years | 86 | 17.9% |
| 85 Years and Over | 12 | 2.5% |
| Total | 480 | 100.0% |
Housing Finances in Nashwauk
Median Income by Occupancy in Nashwauk
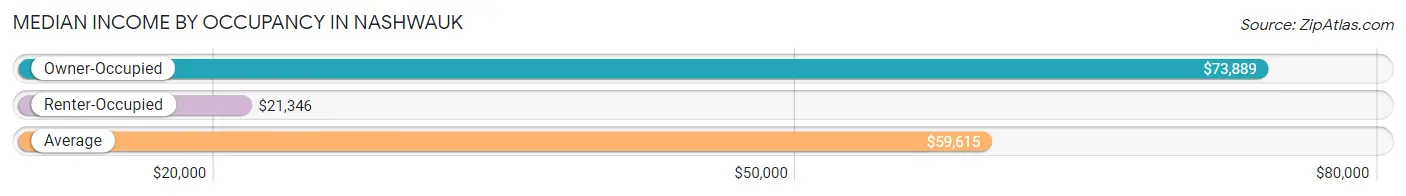
| Occupancy Type | # Households | Median Income |
| Owner-Occupied | 402 (83.8%) | $73,889 |
| Renter-Occupied | 78 (16.3%) | $21,346 |
| Average | 480 (100.0%) | $59,615 |
Occupancy by Householder Income Bracket in Nashwauk
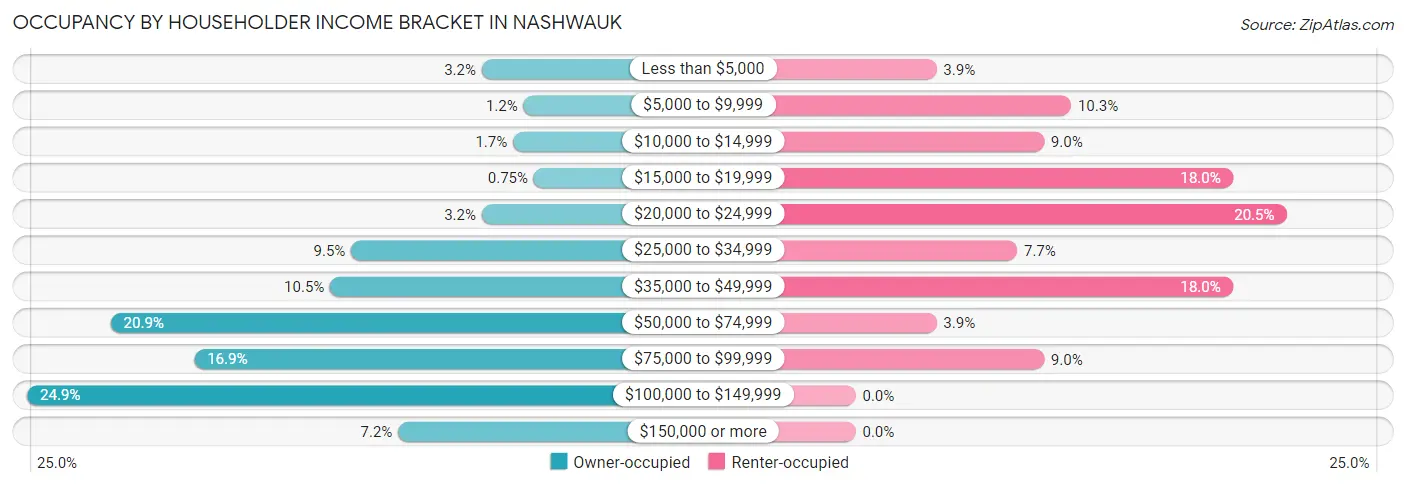
| Income Bracket | Owner-occupied | Renter-occupied |
| Less than $5,000 | 13 (3.2%) | 3 (3.8%) |
| $5,000 to $9,999 | 5 (1.2%) | 8 (10.3%) |
| $10,000 to $14,999 | 7 (1.7%) | 7 (9.0%) |
| $15,000 to $19,999 | 3 (0.7%) | 14 (17.9%) |
| $20,000 to $24,999 | 13 (3.2%) | 16 (20.5%) |
| $25,000 to $34,999 | 38 (9.5%) | 6 (7.7%) |
| $35,000 to $49,999 | 42 (10.4%) | 14 (17.9%) |
| $50,000 to $74,999 | 84 (20.9%) | 3 (3.8%) |
| $75,000 to $99,999 | 68 (16.9%) | 7 (9.0%) |
| $100,000 to $149,999 | 100 (24.9%) | 0 (0.0%) |
| $150,000 or more | 29 (7.2%) | 0 (0.0%) |
| Total | 402 (100.0%) | 78 (100.0%) |
Monthly Housing Cost Tiers in Nashwauk
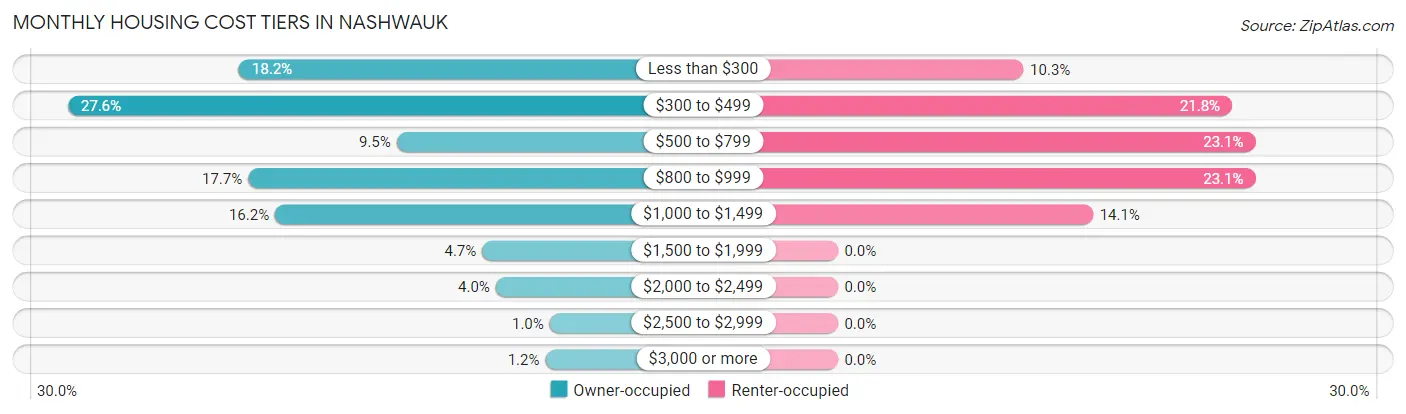
| Monthly Cost | Owner-occupied | Renter-occupied |
| Less than $300 | 73 (18.2%) | 8 (10.3%) |
| $300 to $499 | 111 (27.6%) | 17 (21.8%) |
| $500 to $799 | 38 (9.5%) | 18 (23.1%) |
| $800 to $999 | 71 (17.7%) | 18 (23.1%) |
| $1,000 to $1,499 | 65 (16.2%) | 11 (14.1%) |
| $1,500 to $1,999 | 19 (4.7%) | 0 (0.0%) |
| $2,000 to $2,499 | 16 (4.0%) | 0 (0.0%) |
| $2,500 to $2,999 | 4 (1.0%) | 0 (0.0%) |
| $3,000 or more | 5 (1.2%) | 0 (0.0%) |
| Total | 402 (100.0%) | 78 (100.0%) |
Physical Housing Characteristics in Nashwauk
Housing Structures in Nashwauk
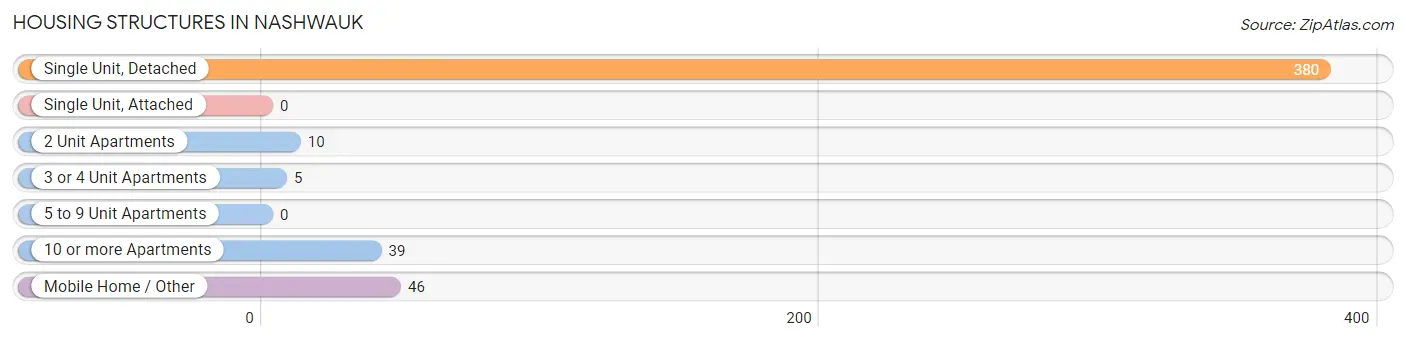
| Structure Type | # Housing Units | % Housing Units |
| Single Unit, Detached | 380 | 79.2% |
| Single Unit, Attached | 0 | 0.0% |
| 2 Unit Apartments | 10 | 2.1% |
| 3 or 4 Unit Apartments | 5 | 1.0% |
| 5 to 9 Unit Apartments | 0 | 0.0% |
| 10 or more Apartments | 39 | 8.1% |
| Mobile Home / Other | 46 | 9.6% |
| Total | 480 | 100.0% |
Housing Structures by Occupancy in Nashwauk
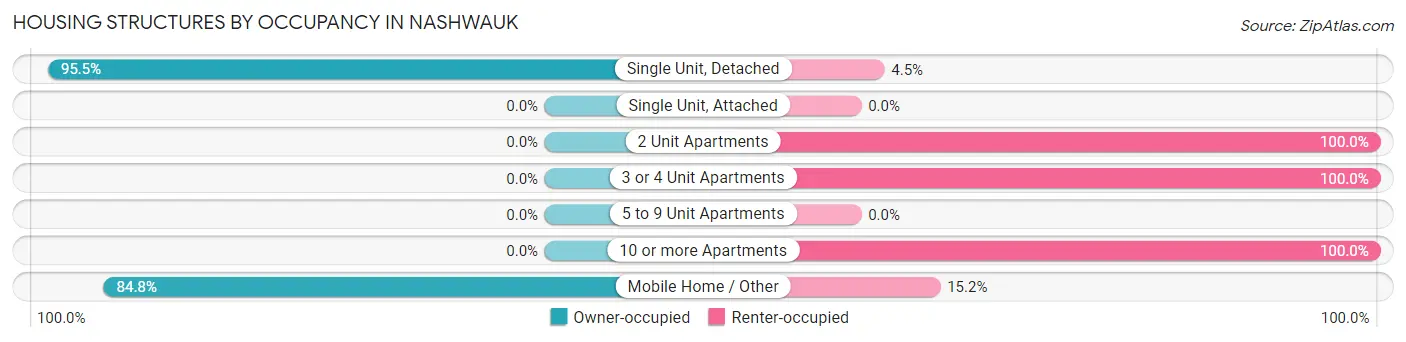
| Structure Type | Owner-occupied | Renter-occupied |
| Single Unit, Detached | 363 (95.5%) | 17 (4.5%) |
| Single Unit, Attached | 0 (0.0%) | 0 (0.0%) |
| 2 Unit Apartments | 0 (0.0%) | 10 (100.0%) |
| 3 or 4 Unit Apartments | 0 (0.0%) | 5 (100.0%) |
| 5 to 9 Unit Apartments | 0 (0.0%) | 0 (0.0%) |
| 10 or more Apartments | 0 (0.0%) | 39 (100.0%) |
| Mobile Home / Other | 39 (84.8%) | 7 (15.2%) |
| Total | 402 (83.8%) | 78 (16.3%) |
Housing Structures by Number of Rooms in Nashwauk
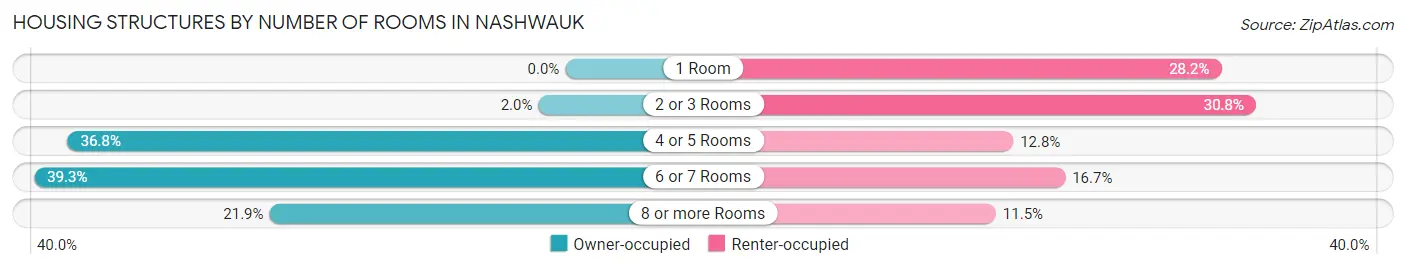
| Number of Rooms | Owner-occupied | Renter-occupied |
| 1 Room | 0 (0.0%) | 22 (28.2%) |
| 2 or 3 Rooms | 8 (2.0%) | 24 (30.8%) |
| 4 or 5 Rooms | 148 (36.8%) | 10 (12.8%) |
| 6 or 7 Rooms | 158 (39.3%) | 13 (16.7%) |
| 8 or more Rooms | 88 (21.9%) | 9 (11.5%) |
| Total | 402 (100.0%) | 78 (100.0%) |
Housing Structure by Heating Type in Nashwauk
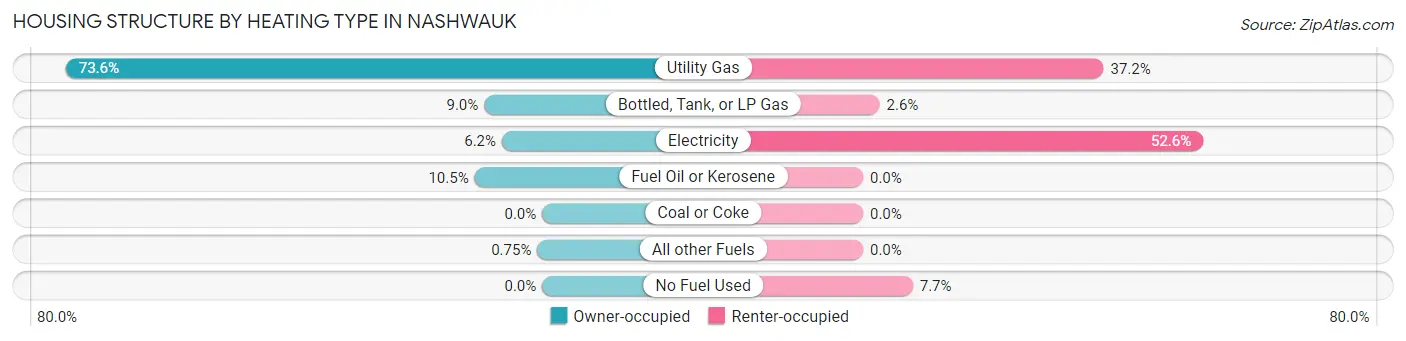
| Heating Type | Owner-occupied | Renter-occupied |
| Utility Gas | 296 (73.6%) | 29 (37.2%) |
| Bottled, Tank, or LP Gas | 36 (9.0%) | 2 (2.6%) |
| Electricity | 25 (6.2%) | 41 (52.6%) |
| Fuel Oil or Kerosene | 42 (10.4%) | 0 (0.0%) |
| Coal or Coke | 0 (0.0%) | 0 (0.0%) |
| All other Fuels | 3 (0.7%) | 0 (0.0%) |
| No Fuel Used | 0 (0.0%) | 6 (7.7%) |
| Total | 402 (100.0%) | 78 (100.0%) |
Household Vehicle Usage in Nashwauk
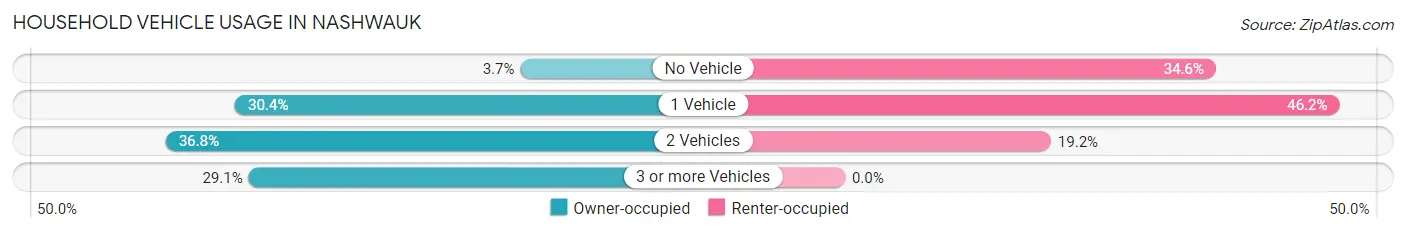
| Vehicles per Household | Owner-occupied | Renter-occupied |
| No Vehicle | 15 (3.7%) | 27 (34.6%) |
| 1 Vehicle | 122 (30.3%) | 36 (46.2%) |
| 2 Vehicles | 148 (36.8%) | 15 (19.2%) |
| 3 or more Vehicles | 117 (29.1%) | 0 (0.0%) |
| Total | 402 (100.0%) | 78 (100.0%) |
Real Estate & Mortgages in Nashwauk
Real Estate and Mortgage Overview in Nashwauk
| Characteristic | Without Mortgage | With Mortgage |
| Housing Units | 211 | 191 |
| Median Property Value | $83,200 | $122,000 |
| Median Household Income | $56,141 | $26 |
| Monthly Housing Costs | $365 | $5 |
| Real Estate Taxes | $300 | $8 |
Property Value by Mortgage Status in Nashwauk
| Property Value | Without Mortgage | With Mortgage |
| Less than $50,000 | 66 (31.3%) | 5 (2.6%) |
| $50,000 to $99,999 | 60 (28.4%) | 58 (30.4%) |
| $100,000 to $299,999 | 74 (35.1%) | 94 (49.2%) |
| $300,000 to $499,999 | 11 (5.2%) | 26 (13.6%) |
| $500,000 to $749,999 | 0 (0.0%) | 3 (1.6%) |
| $750,000 to $999,999 | 0 (0.0%) | 5 (2.6%) |
| $1,000,000 or more | 0 (0.0%) | 0 (0.0%) |
| Total | 211 (100.0%) | 191 (100.0%) |
Household Income by Mortgage Status in Nashwauk
| Household Income | Without Mortgage | With Mortgage |
| Less than $10,000 | 5 (2.4%) | 0 (0.0%) |
| $10,000 to $24,999 | 19 (9.0%) | 13 (6.8%) |
| $25,000 to $34,999 | 36 (17.1%) | 4 (2.1%) |
| $35,000 to $49,999 | 25 (11.8%) | 2 (1.1%) |
| $50,000 to $74,999 | 58 (27.5%) | 17 (8.9%) |
| $75,000 to $99,999 | 11 (5.2%) | 26 (13.6%) |
| $100,000 to $149,999 | 54 (25.6%) | 57 (29.8%) |
| $150,000 or more | 3 (1.4%) | 46 (24.1%) |
| Total | 211 (100.0%) | 191 (100.0%) |
Property Value to Household Income Ratio in Nashwauk
| Value-to-Income Ratio | Without Mortgage | With Mortgage |
| Less than 2.0x | 111 (52.6%) | 87,946 (46,045.0%) |
| 2.0x to 2.9x | 86 (40.8%) | 106 (55.5%) |
| 3.0x to 3.9x | 6 (2.8%) | 25 (13.1%) |
| 4.0x or more | 8 (3.8%) | 28 (14.7%) |
| Total | 211 (100.0%) | 191 (100.0%) |
Real Estate Taxes by Mortgage Status in Nashwauk
| Property Taxes | Without Mortgage | With Mortgage |
| Less than $800 | 127 (60.2%) | 0 (0.0%) |
| $800 to $1,499 | 19 (9.0%) | 82 (42.9%) |
| $800 to $1,499 | 30 (14.2%) | 35 (18.3%) |
| Total | 211 (100.0%) | 191 (100.0%) |
Health & Disability in Nashwauk
Health Insurance Coverage by Age in Nashwauk
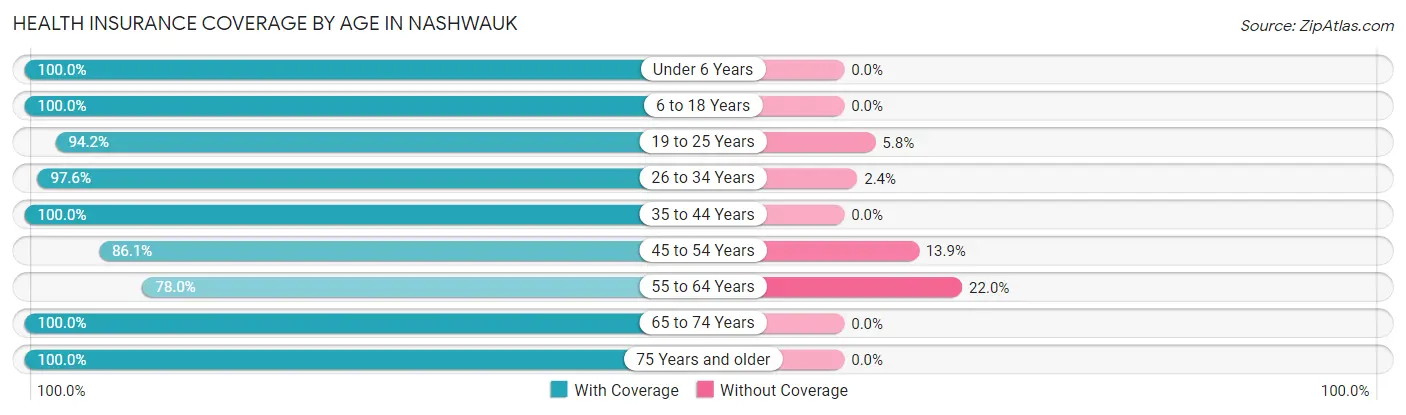
| Age Bracket | With Coverage | Without Coverage |
| Under 6 Years | 81 (100.0%) | 0 (0.0%) |
| 6 to 18 Years | 106 (100.0%) | 0 (0.0%) |
| 19 to 25 Years | 130 (94.2%) | 8 (5.8%) |
| 26 to 34 Years | 161 (97.6%) | 4 (2.4%) |
| 35 to 44 Years | 76 (100.0%) | 0 (0.0%) |
| 45 to 54 Years | 118 (86.1%) | 19 (13.9%) |
| 55 to 64 Years | 142 (78.0%) | 40 (22.0%) |
| 65 to 74 Years | 64 (100.0%) | 0 (0.0%) |
| 75 Years and older | 142 (100.0%) | 0 (0.0%) |
| Total | 1,020 (93.5%) | 71 (6.5%) |
Health Insurance Coverage by Citizenship Status in Nashwauk
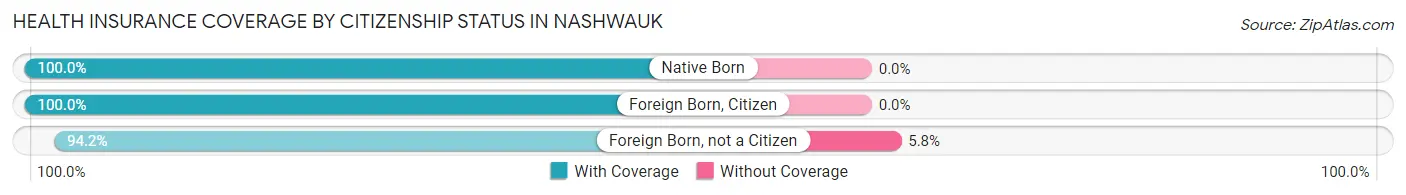
| Citizenship Status | With Coverage | Without Coverage |
| Native Born | 81 (100.0%) | 0 (0.0%) |
| Foreign Born, Citizen | 106 (100.0%) | 0 (0.0%) |
| Foreign Born, not a Citizen | 130 (94.2%) | 8 (5.8%) |
Health Insurance Coverage by Household Income in Nashwauk
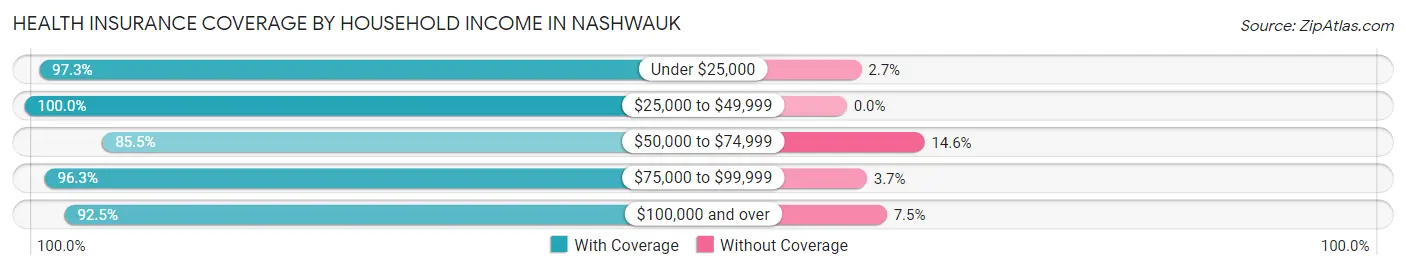
| Household Income | With Coverage | Without Coverage |
| Under $25,000 | 107 (97.3%) | 3 (2.7%) |
| $25,000 to $49,999 | 181 (100.0%) | 0 (0.0%) |
| $50,000 to $74,999 | 188 (85.5%) | 32 (14.5%) |
| $75,000 to $99,999 | 206 (96.3%) | 8 (3.7%) |
| $100,000 and over | 334 (92.5%) | 27 (7.5%) |
Public vs Private Health Insurance Coverage by Age in Nashwauk
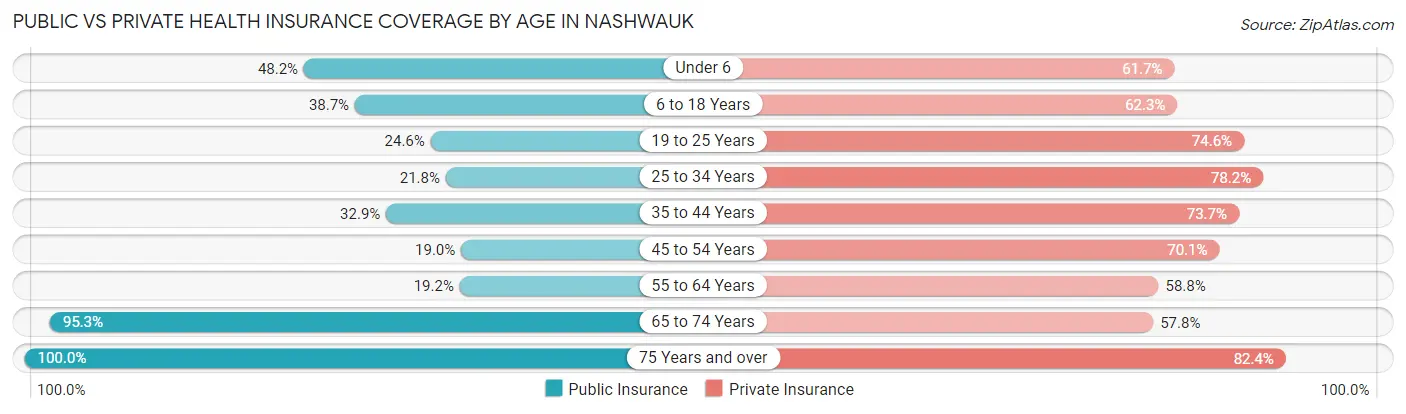
| Age Bracket | Public Insurance | Private Insurance |
| Under 6 | 39 (48.1%) | 50 (61.7%) |
| 6 to 18 Years | 41 (38.7%) | 66 (62.3%) |
| 19 to 25 Years | 34 (24.6%) | 103 (74.6%) |
| 25 to 34 Years | 36 (21.8%) | 129 (78.2%) |
| 35 to 44 Years | 25 (32.9%) | 56 (73.7%) |
| 45 to 54 Years | 26 (19.0%) | 96 (70.1%) |
| 55 to 64 Years | 35 (19.2%) | 107 (58.8%) |
| 65 to 74 Years | 61 (95.3%) | 37 (57.8%) |
| 75 Years and over | 142 (100.0%) | 117 (82.4%) |
| Total | 439 (40.2%) | 761 (69.8%) |
Disability Status by Sex by Age in Nashwauk
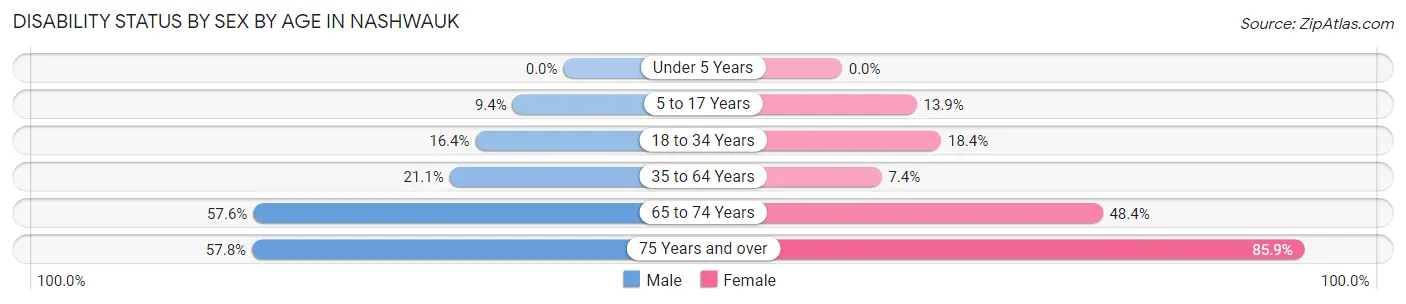
| Age Bracket | Male | Female |
| Under 5 Years | 0 (0.0%) | 0 (0.0%) |
| 5 to 17 Years | 5 (9.4%) | 5 (13.9%) |
| 18 to 34 Years | 34 (16.4%) | 21 (18.4%) |
| 35 to 64 Years | 49 (21.1%) | 12 (7.4%) |
| 65 to 74 Years | 19 (57.6%) | 15 (48.4%) |
| 75 Years and over | 37 (57.8%) | 67 (85.9%) |
Disability Class by Sex by Age in Nashwauk
Disability Class: Hearing Difficulty
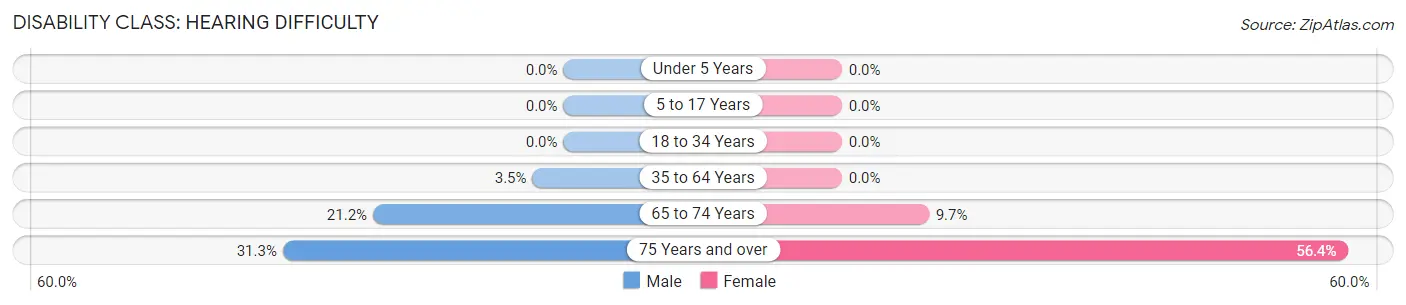
| Age Bracket | Male | Female |
| Under 5 Years | 0 (0.0%) | 0 (0.0%) |
| 5 to 17 Years | 0 (0.0%) | 0 (0.0%) |
| 18 to 34 Years | 0 (0.0%) | 0 (0.0%) |
| 35 to 64 Years | 8 (3.5%) | 0 (0.0%) |
| 65 to 74 Years | 7 (21.2%) | 3 (9.7%) |
| 75 Years and over | 20 (31.2%) | 44 (56.4%) |
Disability Class: Vision Difficulty
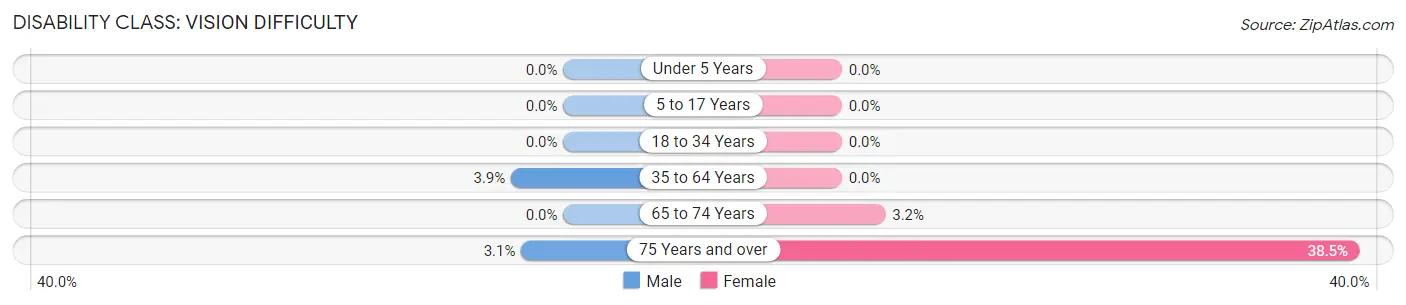
| Age Bracket | Male | Female |
| Under 5 Years | 0 (0.0%) | 0 (0.0%) |
| 5 to 17 Years | 0 (0.0%) | 0 (0.0%) |
| 18 to 34 Years | 0 (0.0%) | 0 (0.0%) |
| 35 to 64 Years | 9 (3.9%) | 0 (0.0%) |
| 65 to 74 Years | 0 (0.0%) | 1 (3.2%) |
| 75 Years and over | 2 (3.1%) | 30 (38.5%) |
Disability Class: Cognitive Difficulty
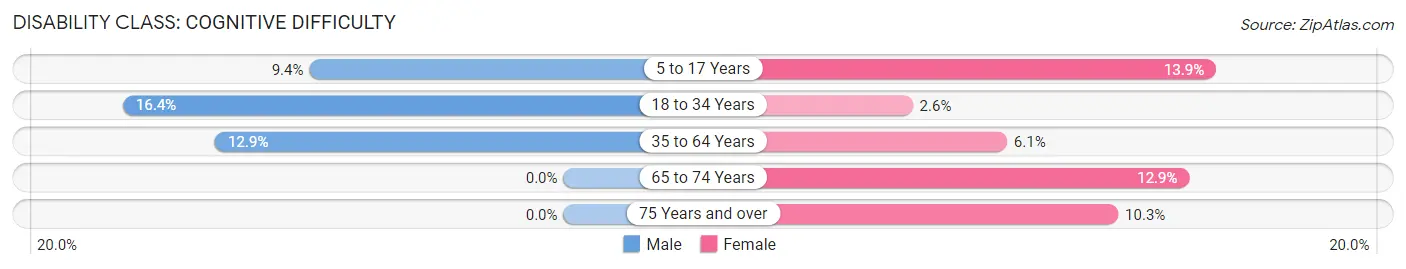
| Age Bracket | Male | Female |
| 5 to 17 Years | 5 (9.4%) | 5 (13.9%) |
| 18 to 34 Years | 34 (16.4%) | 3 (2.6%) |
| 35 to 64 Years | 30 (12.9%) | 10 (6.1%) |
| 65 to 74 Years | 0 (0.0%) | 4 (12.9%) |
| 75 Years and over | 0 (0.0%) | 8 (10.3%) |
Disability Class: Ambulatory Difficulty
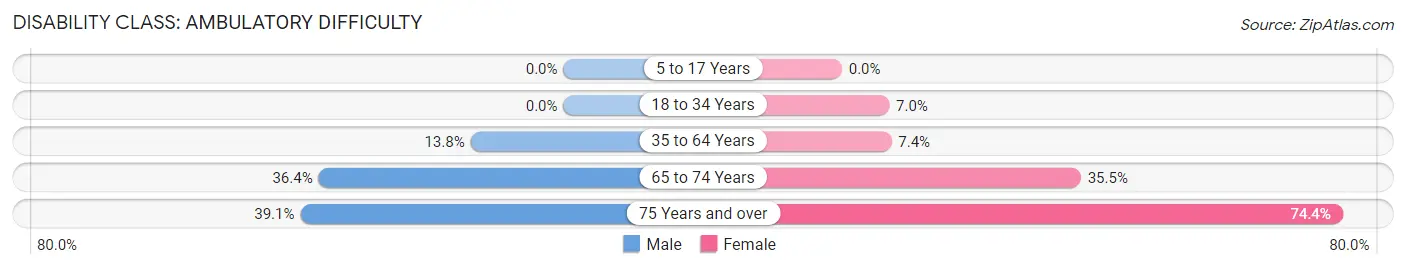
| Age Bracket | Male | Female |
| 5 to 17 Years | 0 (0.0%) | 0 (0.0%) |
| 18 to 34 Years | 0 (0.0%) | 8 (7.0%) |
| 35 to 64 Years | 32 (13.8%) | 12 (7.4%) |
| 65 to 74 Years | 12 (36.4%) | 11 (35.5%) |
| 75 Years and over | 25 (39.1%) | 58 (74.4%) |
Disability Class: Self-Care Difficulty
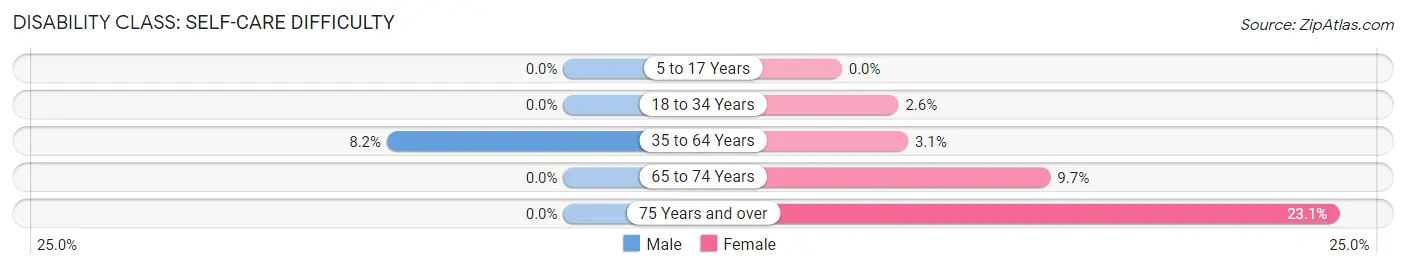
| Age Bracket | Male | Female |
| 5 to 17 Years | 0 (0.0%) | 0 (0.0%) |
| 18 to 34 Years | 0 (0.0%) | 3 (2.6%) |
| 35 to 64 Years | 19 (8.2%) | 5 (3.1%) |
| 65 to 74 Years | 0 (0.0%) | 3 (9.7%) |
| 75 Years and over | 0 (0.0%) | 18 (23.1%) |
Technology Access in Nashwauk
Computing Device Access in Nashwauk
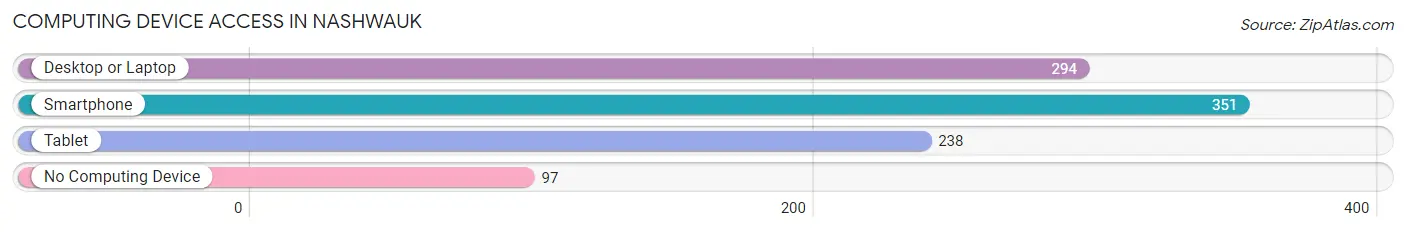
| Device Type | # Households | % Households |
| Desktop or Laptop | 294 | 61.3% |
| Smartphone | 351 | 73.1% |
| Tablet | 238 | 49.6% |
| No Computing Device | 97 | 20.2% |
| Total | 480 | 100.0% |
Internet Access in Nashwauk
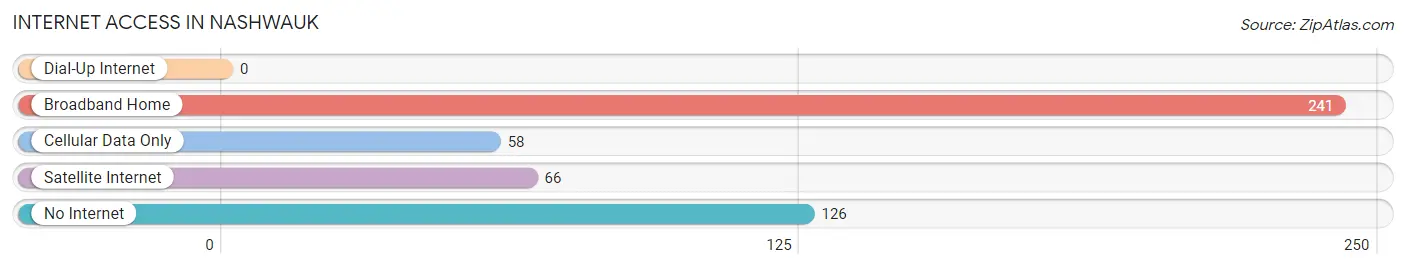
| Internet Type | # Households | % Households |
| Dial-Up Internet | 0 | 0.0% |
| Broadband Home | 241 | 50.2% |
| Cellular Data Only | 58 | 12.1% |
| Satellite Internet | 66 | 13.8% |
| No Internet | 126 | 26.3% |
| Total | 480 | 100.0% |
Nashwauk Summary
Nashwauk is a small city located in Itasca County, Minnesota. It is situated on the Mesabi Iron Range, a region of Minnesota known for its rich iron ore deposits. The city was founded in 1892 and has a population of 1,541 as of the 2010 census.
Geography
Nashwauk is located in the northern part of Minnesota, in Itasca County. It is situated on the Mesabi Iron Range, a region of Minnesota known for its rich iron ore deposits. The city is located on the south shore of Lake Winnibigoshish, a large lake in the area. The city is surrounded by forests and lakes, and is located near the Boundary Waters Canoe Area Wilderness. The city is located approximately 30 miles north of Grand Rapids, Minnesota, and is about a two-hour drive from Minneapolis.
Climate
Nashwauk has a humid continental climate, with cold winters and warm summers. The average high temperature in January is around 16°F, and the average low temperature in July is around 68°F. The city receives an average of 33 inches of precipitation per year, with the majority of it falling in the summer months.
History
Nashwauk was founded in 1892 by the Mesabi Iron Company. The company was formed to exploit the rich iron ore deposits in the area, and the city was built to house the workers. The city was named after the Nashwauk River, which flows through the area. The city quickly grew, and by 1910, it had a population of over 2,000.
The city was an important center of the iron ore industry in the region, and it was home to several large iron ore processing plants. The city was also home to a large steel mill, which was built in the early 1900s. The steel mill was the largest employer in the city, and it provided jobs for many of the city's residents.
The city experienced a decline in the late 20th century, as the iron ore industry began to decline. The steel mill closed in the 1980s, and many of the city's residents moved away. The population of the city has declined since then, and as of the 2010 census, it had a population of 1,541.
Economy
Nashwauk's economy is largely based on the iron ore industry. The city is home to several iron ore processing plants, and it is also home to a large steel mill. The steel mill is the largest employer in the city, and it provides jobs for many of the city's residents.
The city is also home to several small businesses, including restaurants, retail stores, and other services. The city is also home to a large casino, which is a major source of revenue for the city.
Demographics
As of the 2010 census, Nashwauk had a population of 1,541. The racial makeup of the city was 97.2% White, 0.3% African American, 0.2% Native American, 0.2% Asian, 0.1% Pacific Islander, 0.7% from other races, and 1.3% from two or more races. Hispanic or Latino of any race were 1.7% of the population.
The median household income in the city was $37,917, and the median family income was $45,625. The per capita income in the city was $19,945. About 11.2% of the population was below the poverty line.
Common Questions
What is Per Capita Income in Nashwauk?
Per Capita income in Nashwauk is $32,889.
What is the Median Family Income in Nashwauk?
Median Family Income in Nashwauk is $78,958.
What is the Median Household income in Nashwauk?
Median Household Income in Nashwauk is $59,615.
What is Income or Wage Gap in Nashwauk?
Income or Wage Gap in Nashwauk is 32.1%.
Women in Nashwauk earn 67.9 cents for every dollar earned by a man.
What is Family Income Deficit in Nashwauk?
Family Income Deficit in Nashwauk is $15,073.
Families that are below poverty line in Nashwauk earn $15,073 less on average than the poverty threshold level.
What is Inequality or Gini Index in Nashwauk?
Inequality or Gini Index in Nashwauk is 0.38.
What is the Total Population of Nashwauk?
Total Population of Nashwauk is 1,091.
What is the Total Male Population of Nashwauk?
Total Male Population of Nashwauk is 632.
What is the Total Female Population of Nashwauk?
Total Female Population of Nashwauk is 459.
What is the Ratio of Males per 100 Females in Nashwauk?
There are 137.69 Males per 100 Females in Nashwauk.
What is the Ratio of Females per 100 Males in Nashwauk?
There are 72.63 Females per 100 Males in Nashwauk.
What is the Median Population Age in Nashwauk?
Median Population Age in Nashwauk is 40.4 Years.
What is the Average Family Size in Nashwauk
Average Family Size in Nashwauk is 2.8 People.
What is the Average Household Size in Nashwauk
Average Household Size in Nashwauk is 2.3 People.
How Large is the Labor Force in Nashwauk?
There are 541 People in the Labor Forcein in Nashwauk.
What is the Percentage of People in the Labor Force in Nashwauk?
57.8% of People are in the Labor Force in Nashwauk.
What is the Unemployment Rate in Nashwauk?
Unemployment Rate in Nashwauk is 5.2%.