Mountain Lake, MN Map & Demographics
Mountain Lake Map
Mountain Lake Overview
$25,038
PER CAPITA INCOME
$71,964
AVG FAMILY INCOME
$54,107
AVG HOUSEHOLD INCOME
38.4%
WAGE / INCOME GAP [ % ]
61.6¢/ $1
WAGE / INCOME GAP [ $ ]
$6,510
FAMILY INCOME DEFICIT
0.39
INEQUALITY / GINI INDEX
1,900
TOTAL POPULATION
848
MALE POPULATION
1,052
FEMALE POPULATION
80.61
MALES / 100 FEMALES
124.06
FEMALES / 100 MALES
35.4
MEDIAN AGE
3.1
AVG FAMILY SIZE
2.6
AVG HOUSEHOLD SIZE
871
LABOR FORCE [ PEOPLE ]
61.1%
PERCENT IN LABOR FORCE
5.6%
UNEMPLOYMENT RATE
Mountain Lake Zip Codes
Mountain Lake Area Codes
Income in Mountain Lake
Income Overview in Mountain Lake
Per Capita Income in Mountain Lake is $25,038, while median incomes of families and households are $71,964 and $54,107 respectively.
| Characteristic | Number | Measure |
| Per Capita Income | 1,900 | $25,038 |
| Median Family Income | 491 | $71,964 |
| Mean Family Income | 491 | $76,146 |
| Median Household Income | 718 | $54,107 |
| Mean Household Income | 718 | $65,720 |
| Income Deficit | 491 | $6,510 |
| Wage / Income Gap (%) | 1,900 | 38.42% |
| Wage / Income Gap ($) | 1,900 | 61.58¢ per $1 |
| Gini / Inequality Index | 1,900 | 0.39 |
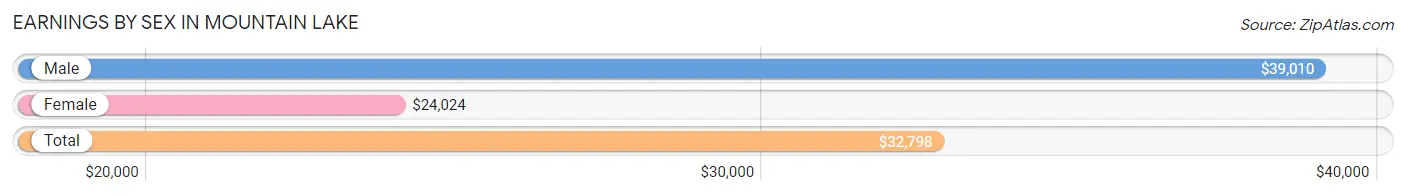
Earnings by Sex in Mountain Lake
Average Earnings in Mountain Lake are $32,798, $39,010 for men and $24,024 for women, a difference of 38.4%.
| Sex | Number | Average Earnings |
| Male | 419 (45.1%) | $39,010 |
| Female | 510 (54.9%) | $24,024 |
| Total | 929 (100.0%) | $32,798 |
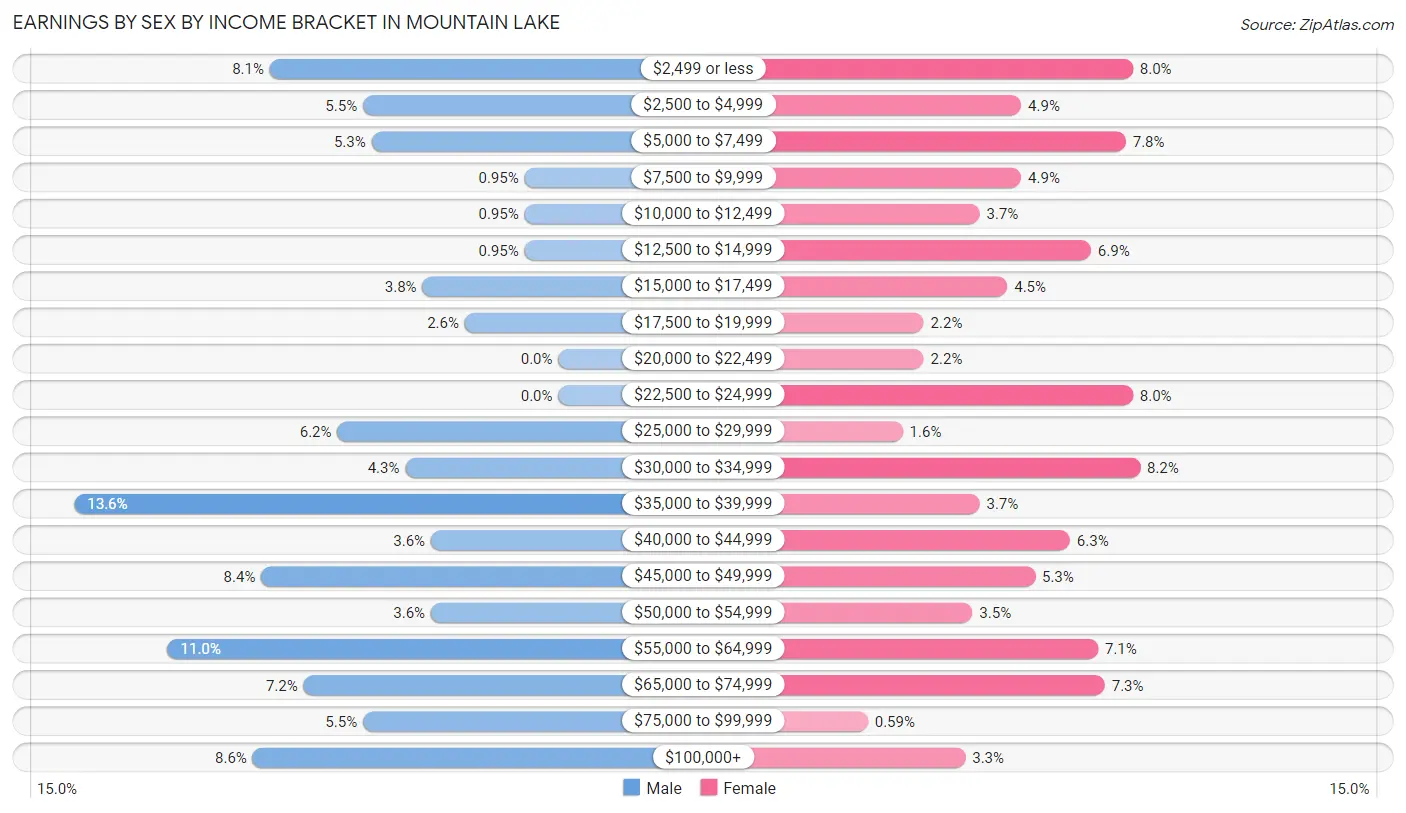
Earnings by Sex by Income Bracket in Mountain Lake
The most common earnings brackets in Mountain Lake are $35,000 to $39,999 for men (57 | 13.6%) and $30,000 to $34,999 for women (42 | 8.2%).
| Income | Male | Female |
| $2,499 or less | 34 (8.1%) | 41 (8.0%) |
| $2,500 to $4,999 | 23 (5.5%) | 25 (4.9%) |
| $5,000 to $7,499 | 22 (5.2%) | 40 (7.8%) |
| $7,500 to $9,999 | 4 (0.9%) | 25 (4.9%) |
| $10,000 to $12,499 | 4 (0.9%) | 19 (3.7%) |
| $12,500 to $14,999 | 4 (0.9%) | 35 (6.9%) |
| $15,000 to $17,499 | 16 (3.8%) | 23 (4.5%) |
| $17,500 to $19,999 | 11 (2.6%) | 11 (2.2%) |
| $20,000 to $22,499 | 0 (0.0%) | 11 (2.2%) |
| $22,500 to $24,999 | 0 (0.0%) | 41 (8.0%) |
| $25,000 to $29,999 | 26 (6.2%) | 8 (1.6%) |
| $30,000 to $34,999 | 18 (4.3%) | 42 (8.2%) |
| $35,000 to $39,999 | 57 (13.6%) | 19 (3.7%) |
| $40,000 to $44,999 | 15 (3.6%) | 32 (6.3%) |
| $45,000 to $49,999 | 35 (8.4%) | 27 (5.3%) |
| $50,000 to $54,999 | 15 (3.6%) | 18 (3.5%) |
| $55,000 to $64,999 | 46 (11.0%) | 36 (7.1%) |
| $65,000 to $74,999 | 30 (7.2%) | 37 (7.2%) |
| $75,000 to $99,999 | 23 (5.5%) | 3 (0.6%) |
| $100,000+ | 36 (8.6%) | 17 (3.3%) |
| Total | 419 (100.0%) | 510 (100.0%) |
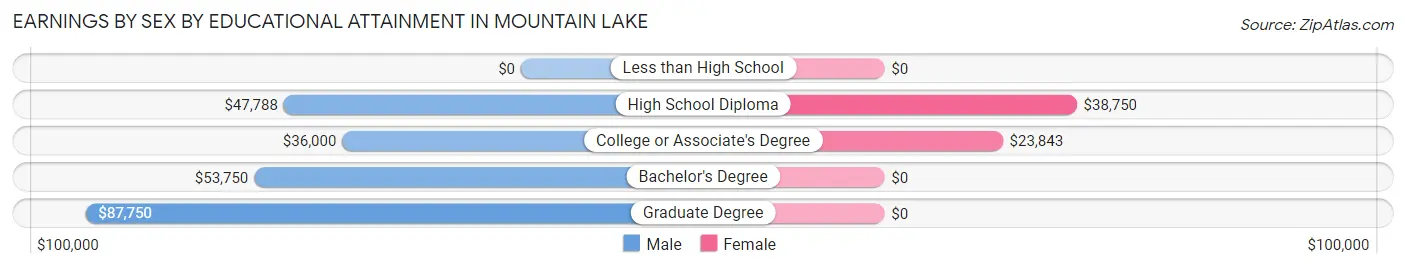
Earnings by Sex by Educational Attainment in Mountain Lake
Average earnings in Mountain Lake are $47,794 for men and $31,190 for women, a difference of 34.7%. Men with an educational attainment of graduate degree enjoy the highest average annual earnings of $87,750, while those with college or associate's degree education earn the least with $36,000. Women with an educational attainment of high school diploma earn the most with the average annual earnings of $38,750, while those with college or associate's degree education have the smallest earnings of $23,843.
| Educational Attainment | Male Income | Female Income |
| Less than High School | - | - |
| High School Diploma | $47,788 | $38,750 |
| College or Associate's Degree | $36,000 | $23,843 |
| Bachelor's Degree | $53,750 | $0 |
| Graduate Degree | $87,750 | $0 |
| Total | $47,794 | $31,190 |
Family Income in Mountain Lake
Family Income Brackets in Mountain Lake
According to the Mountain Lake family income data, there are 116 families falling into the $75,000 to $99,999 income range, which is the most common income bracket and makes up 23.6% of all families. Conversely, the $10,000 to $14,999 income bracket is the least frequent group with only 5 families (1.0%) belonging to this category.
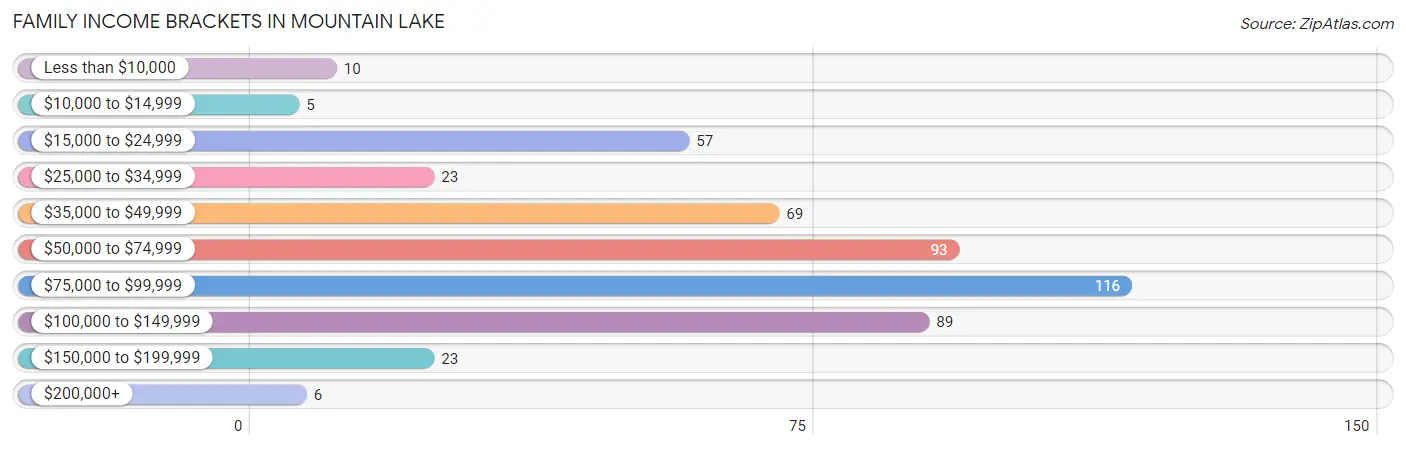
| Income Bracket | # Families | % Families |
| Less than $10,000 | 10 | 2.0% |
| $10,000 to $14,999 | 5 | 1.0% |
| $15,000 to $24,999 | 57 | 11.6% |
| $25,000 to $34,999 | 23 | 4.7% |
| $35,000 to $49,999 | 69 | 14.1% |
| $50,000 to $74,999 | 93 | 18.9% |
| $75,000 to $99,999 | 116 | 23.6% |
| $100,000 to $149,999 | 89 | 18.1% |
| $150,000 to $199,999 | 23 | 4.7% |
| $200,000+ | 6 | 1.2% |
Family Income by Famaliy Size in Mountain Lake
3-person families (117 | 23.8%) account for the highest median family income in Mountain Lake with $85,054 per family, while 2-person families (184 | 37.5%) have the highest median income of $33,214 per family member.
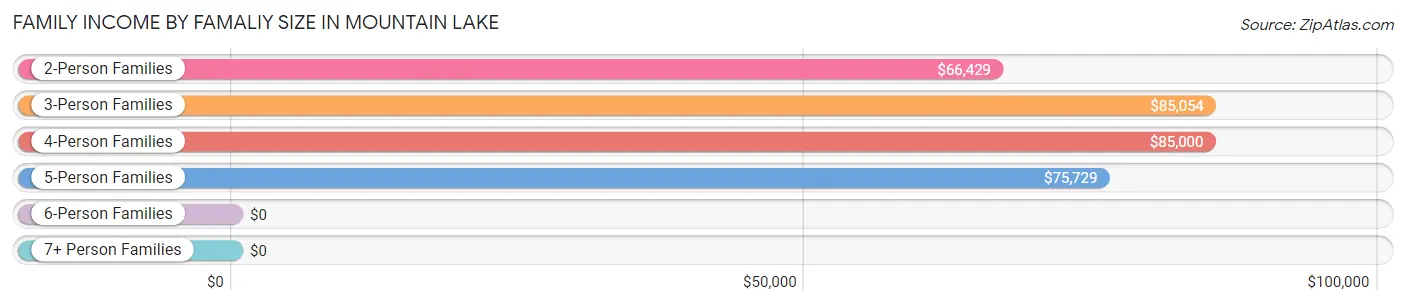
| Income Bracket | # Families | Median Income |
| 2-Person Families | 184 (37.5%) | $66,429 |
| 3-Person Families | 117 (23.8%) | $85,054 |
| 4-Person Families | 114 (23.2%) | $85,000 |
| 5-Person Families | 63 (12.8%) | $75,729 |
| 6-Person Families | 4 (0.8%) | $0 |
| 7+ Person Families | 9 (1.8%) | $0 |
| Total | 491 (100.0%) | $71,964 |
Family Income by Number of Earners in Mountain Lake
The median family income in Mountain Lake is $71,964, with families comprising 3+ earners (64) having the highest median family income of $101,667, while families with no earners (56) have the lowest median family income of $23,125, accounting for 13.0% and 11.4% of families, respectively.
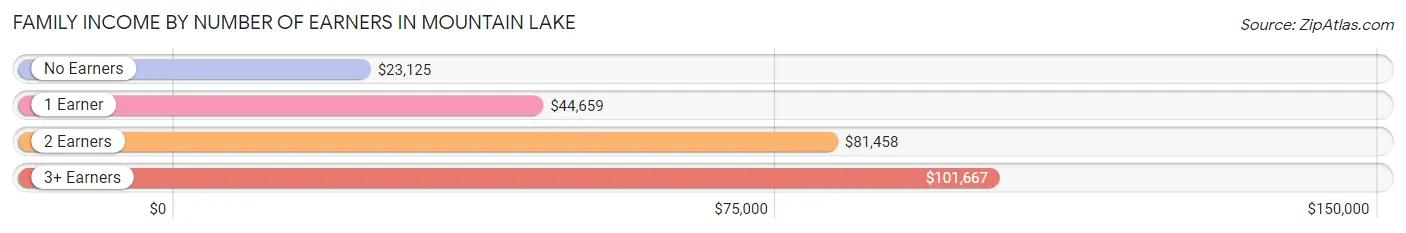
| Number of Earners | # Families | Median Income |
| No Earners | 56 (11.4%) | $23,125 |
| 1 Earner | 125 (25.5%) | $44,659 |
| 2 Earners | 246 (50.1%) | $81,458 |
| 3+ Earners | 64 (13.0%) | $101,667 |
| Total | 491 (100.0%) | $71,964 |
Household Income in Mountain Lake
Household Income Brackets in Mountain Lake
With 134 households falling in the category, the $35,000 to $49,999 income range is the most frequent in Mountain Lake, accounting for 18.7% of all households. In contrast, only 8 households (1.1%) fall into the $10,000 to $14,999 income bracket, making it the least populous group.
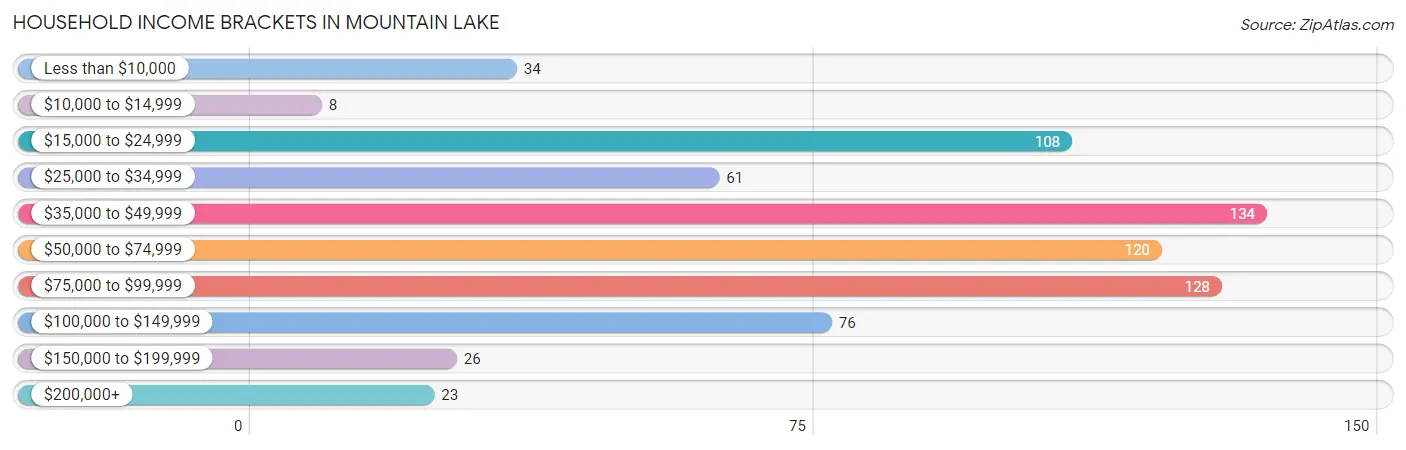
| Income Bracket | # Households | % Households |
| Less than $10,000 | 34 | 4.7% |
| $10,000 to $14,999 | 8 | 1.1% |
| $15,000 to $24,999 | 108 | 15.0% |
| $25,000 to $34,999 | 61 | 8.5% |
| $35,000 to $49,999 | 134 | 18.7% |
| $50,000 to $74,999 | 120 | 16.7% |
| $75,000 to $99,999 | 128 | 17.8% |
| $100,000 to $149,999 | 76 | 10.6% |
| $150,000 to $199,999 | 26 | 3.6% |
| $200,000+ | 23 | 3.2% |
Household Income by Householder Age in Mountain Lake
The median household income in Mountain Lake is $54,107, with the highest median household income of $70,789 found in the 25 to 44 years age bracket for the primary householder. A total of 230 households (32.0%) fall into this category. Meanwhile, the 15 to 24 years age bracket for the primary householder has the lowest median household income of $0, with 22 households (3.1%) in this group.
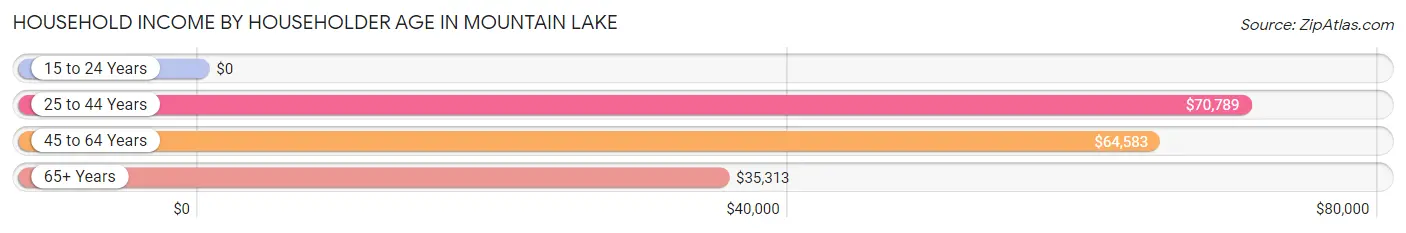
| Income Bracket | # Households | Median Income |
| 15 to 24 Years | 22 (3.1%) | $0 |
| 25 to 44 Years | 230 (32.0%) | $70,789 |
| 45 to 64 Years | 237 (33.0%) | $64,583 |
| 65+ Years | 229 (31.9%) | $35,313 |
| Total | 718 (100.0%) | $54,107 |
Poverty in Mountain Lake
Income Below Poverty by Sex and Age in Mountain Lake
With 14.4% poverty level for males and 18.3% for females among the residents of Mountain Lake, 16 and 17 year old males and 6 to 11 year old females are the most vulnerable to poverty, with 41 males (62.1%) and 46 females (47.4%) in their respective age groups living below the poverty level.
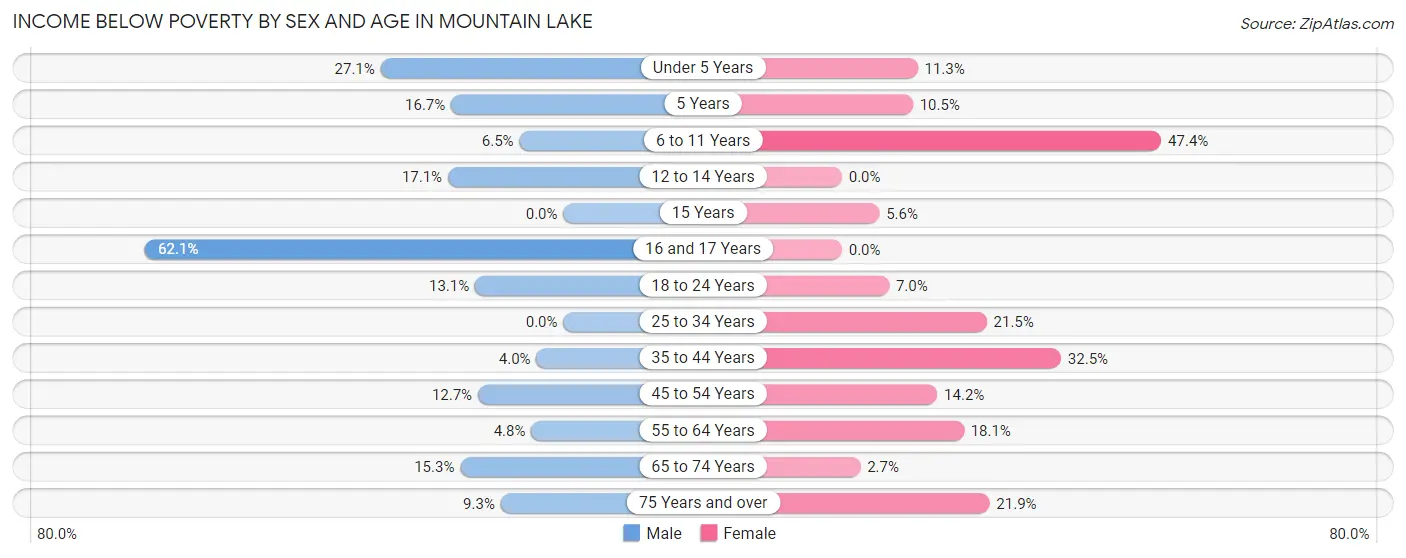
| Age Bracket | Male | Female |
| Under 5 Years | 19 (27.1%) | 9 (11.3%) |
| 5 Years | 3 (16.7%) | 2 (10.5%) |
| 6 to 11 Years | 6 (6.5%) | 46 (47.4%) |
| 12 to 14 Years | 6 (17.1%) | 0 (0.0%) |
| 15 Years | 0 (0.0%) | 2 (5.6%) |
| 16 and 17 Years | 41 (62.1%) | 0 (0.0%) |
| 18 to 24 Years | 8 (13.1%) | 7 (7.0%) |
| 25 to 34 Years | 0 (0.0%) | 23 (21.5%) |
| 35 to 44 Years | 3 (4.0%) | 41 (32.5%) |
| 45 to 54 Years | 9 (12.7%) | 16 (14.2%) |
| 55 to 64 Years | 5 (4.8%) | 21 (18.1%) |
| 65 to 74 Years | 15 (15.3%) | 2 (2.7%) |
| 75 Years and over | 4 (9.3%) | 16 (21.9%) |
| Total | 119 (14.4%) | 185 (18.3%) |
Income Above Poverty by Sex and Age in Mountain Lake
According to the poverty statistics in Mountain Lake, males aged 15 years and females aged 12 to 14 years are the age groups that are most secure financially, with 100.0% of males and 100.0% of females in these age groups living above the poverty line.
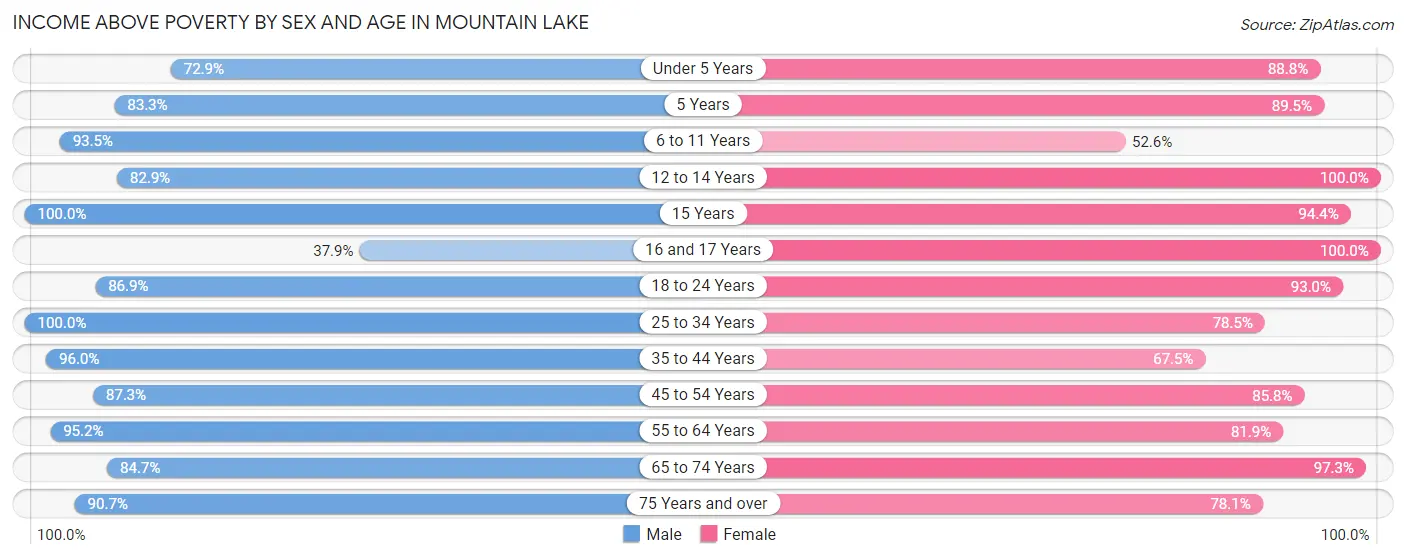
| Age Bracket | Male | Female |
| Under 5 Years | 51 (72.9%) | 71 (88.7%) |
| 5 Years | 15 (83.3%) | 17 (89.5%) |
| 6 to 11 Years | 86 (93.5%) | 51 (52.6%) |
| 12 to 14 Years | 29 (82.9%) | 14 (100.0%) |
| 15 Years | 14 (100.0%) | 34 (94.4%) |
| 16 and 17 Years | 25 (37.9%) | 58 (100.0%) |
| 18 to 24 Years | 53 (86.9%) | 93 (93.0%) |
| 25 to 34 Years | 79 (100.0%) | 84 (78.5%) |
| 35 to 44 Years | 72 (96.0%) | 85 (67.5%) |
| 45 to 54 Years | 62 (87.3%) | 97 (85.8%) |
| 55 to 64 Years | 100 (95.2%) | 95 (81.9%) |
| 65 to 74 Years | 83 (84.7%) | 71 (97.3%) |
| 75 Years and over | 39 (90.7%) | 57 (78.1%) |
| Total | 708 (85.6%) | 827 (81.7%) |
Income Below Poverty Among Married-Couple Families in Mountain Lake
The poverty statistics for married-couple families in Mountain Lake show that 5.9% or 17 of the total 288 families live below the poverty line. Families with 5 or more children have the highest poverty rate of 100.0%, comprising of 5 families. On the other hand, families with 1 or 2 children have the lowest poverty rate of 0.0%, which includes 0 families.
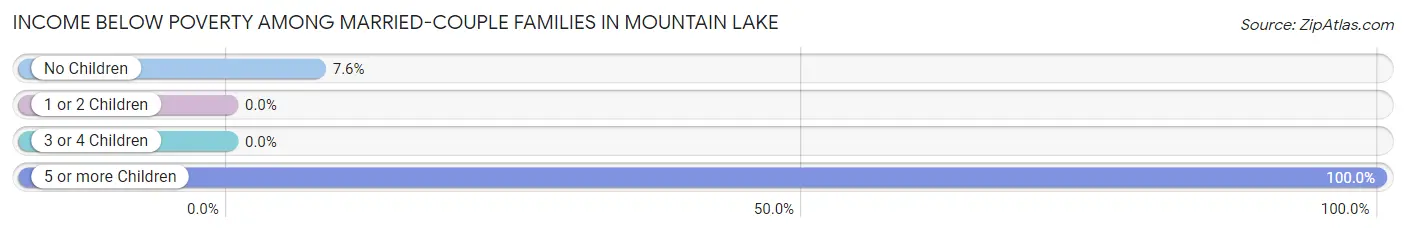
| Children | Above Poverty | Below Poverty |
| No Children | 145 (92.4%) | 12 (7.6%) |
| 1 or 2 Children | 100 (100.0%) | 0 (0.0%) |
| 3 or 4 Children | 26 (100.0%) | 0 (0.0%) |
| 5 or more Children | 0 (0.0%) | 5 (100.0%) |
| Total | 271 (94.1%) | 17 (5.9%) |
Income Below Poverty Among Single-Parent Households in Mountain Lake
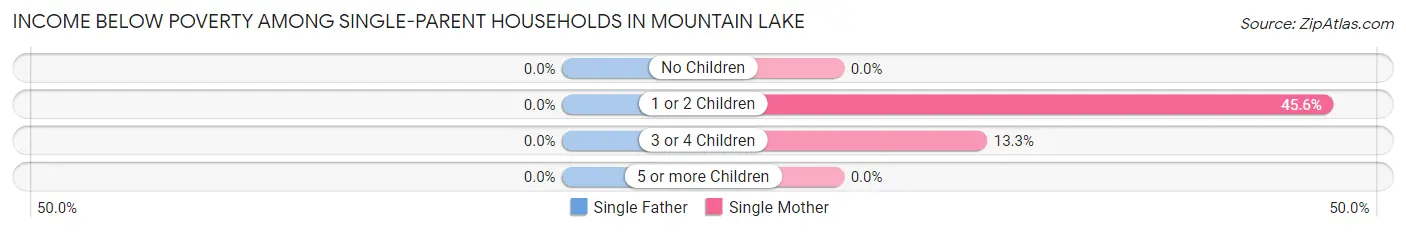
| Children | Single Father | Single Mother |
| No Children | 0 (0.0%) | 0 (0.0%) |
| 1 or 2 Children | 0 (0.0%) | 47 (45.6%) |
| 3 or 4 Children | 0 (0.0%) | 4 (13.3%) |
| 5 or more Children | 0 (0.0%) | 0 (0.0%) |
| Total | 0 (0.0%) | 51 (35.4%) |
Income Below Poverty Among Married-Couple vs Single-Parent Households in Mountain Lake
The poverty data for Mountain Lake shows that 17 of the married-couple family households (5.9%) and 51 of the single-parent households (25.1%) are living below the poverty level. Within the married-couple family households, those with 5 or more children have the highest poverty rate, with 5 households (100.0%) falling below the poverty line. Among the single-parent households, those with 1 or 2 children have the highest poverty rate, with 47 household (42.3%) living below poverty.
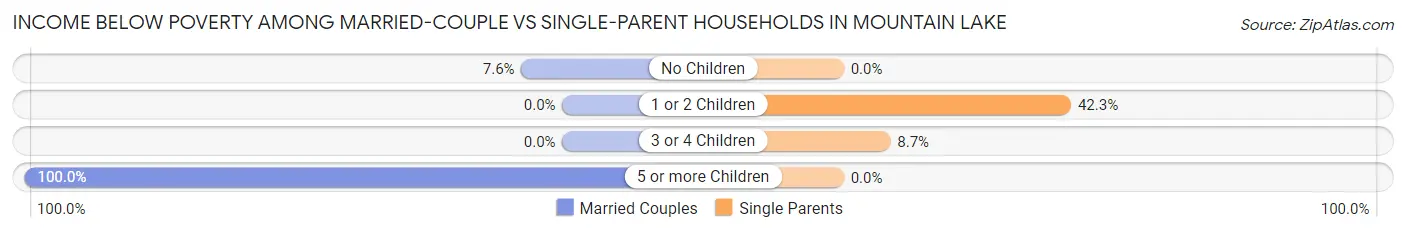
| Children | Married-Couple Families | Single-Parent Households |
| No Children | 12 (7.6%) | 0 (0.0%) |
| 1 or 2 Children | 0 (0.0%) | 47 (42.3%) |
| 3 or 4 Children | 0 (0.0%) | 4 (8.7%) |
| 5 or more Children | 5 (100.0%) | 0 (0.0%) |
| Total | 17 (5.9%) | 51 (25.1%) |
Race in Mountain Lake
The most populous races in Mountain Lake are White / Caucasian (1,369 | 72.1%), Asian (286 | 15.0%), and Hispanic or Latino (259 | 13.6%).
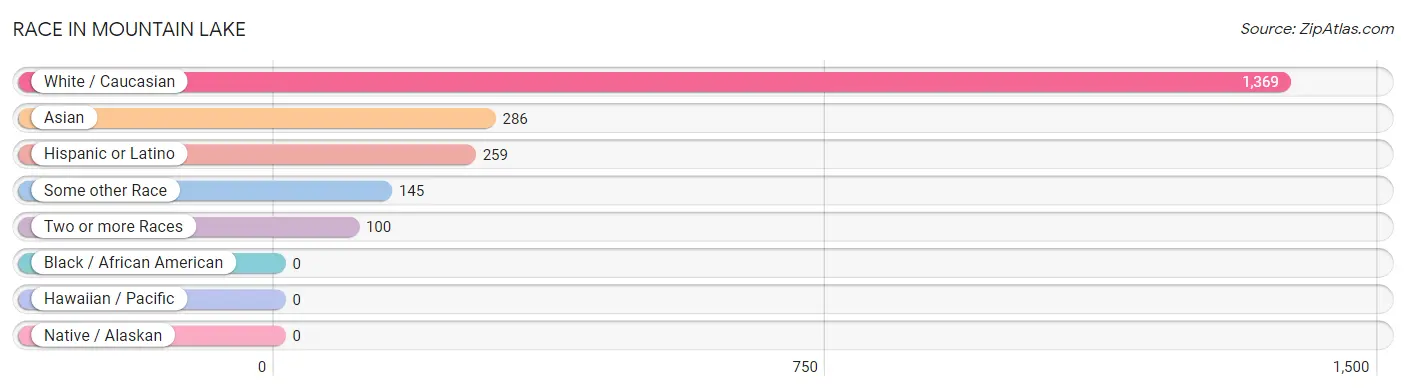
| Race | # Population | % Population |
| Asian | 286 | 15.0% |
| Black / African American | 0 | 0.0% |
| Hawaiian / Pacific | 0 | 0.0% |
| Hispanic or Latino | 259 | 13.6% |
| Native / Alaskan | 0 | 0.0% |
| White / Caucasian | 1,369 | 72.1% |
| Two or more Races | 100 | 5.3% |
| Some other Race | 145 | 7.6% |
| Total | 1,900 | 100.0% |
Ancestry in Mountain Lake
The most populous ancestries reported in Mountain Lake are German (574 | 30.2%), Malaysian (262 | 13.8%), Mexican (166 | 8.7%), Norwegian (146 | 7.7%), and Irish (142 | 7.5%), together accounting for 67.9% of all Mountain Lake residents.
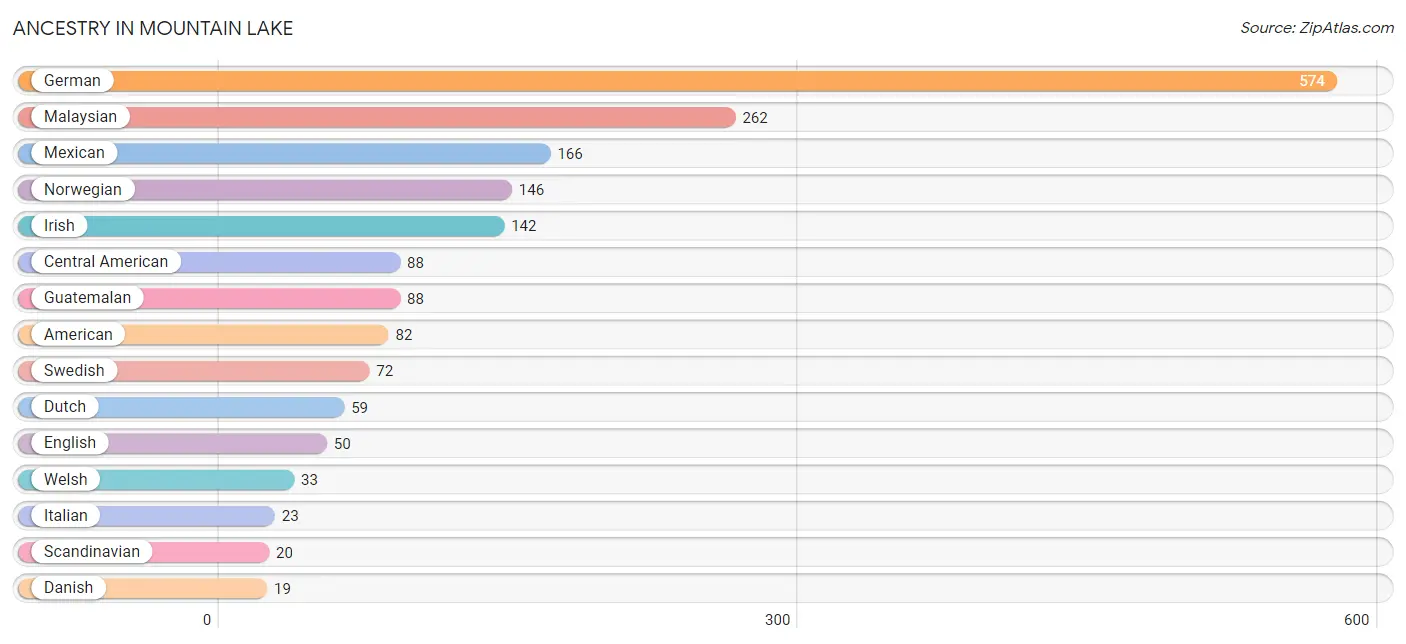
| Ancestry | # Population | % Population |
| American | 82 | 4.3% |
| Argentinean | 5 | 0.3% |
| Austrian | 3 | 0.2% |
| Belgian | 4 | 0.2% |
| Central American | 88 | 4.6% |
| Danish | 19 | 1.0% |
| Dutch | 59 | 3.1% |
| English | 50 | 2.6% |
| Finnish | 4 | 0.2% |
| French | 13 | 0.7% |
| French Canadian | 4 | 0.2% |
| German | 574 | 30.2% |
| Guatemalan | 88 | 4.6% |
| Hungarian | 9 | 0.5% |
| Irish | 142 | 7.5% |
| Italian | 23 | 1.2% |
| Korean | 11 | 0.6% |
| Malaysian | 262 | 13.8% |
| Mexican | 166 | 8.7% |
| Northern European | 3 | 0.2% |
| Norwegian | 146 | 7.7% |
| Polish | 4 | 0.2% |
| Russian | 19 | 1.0% |
| Scandinavian | 20 | 1.1% |
| Scotch-Irish | 5 | 0.3% |
| Scottish | 4 | 0.2% |
| Somali | 8 | 0.4% |
| South American | 5 | 0.3% |
| Subsaharan African | 8 | 0.4% |
| Swedish | 72 | 3.8% |
| Swiss | 9 | 0.5% |
| Welsh | 33 | 1.7% | View All 32 Rows |
Immigrants in Mountain Lake
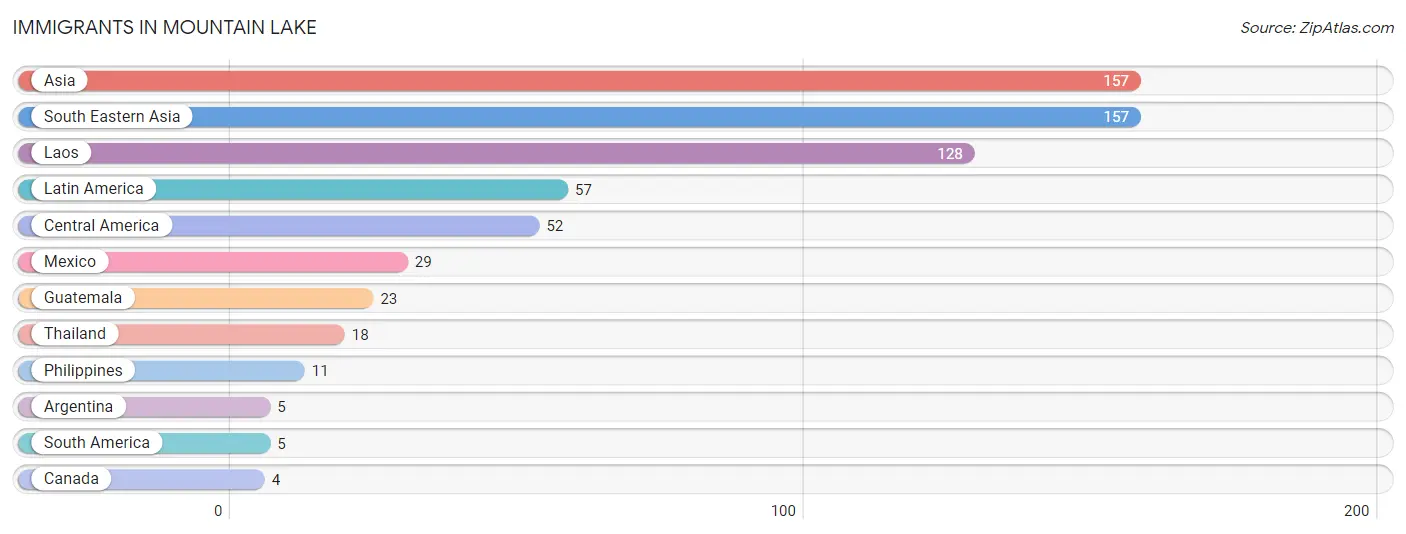
The most numerous immigrant groups reported in Mountain Lake came from Asia (157 | 8.3%), South Eastern Asia (157 | 8.3%), Laos (128 | 6.7%), Latin America (57 | 3.0%), and Central America (52 | 2.7%), together accounting for 29.0% of all Mountain Lake residents.
| Immigration Origin | # Population | % Population |
| Argentina | 5 | 0.3% |
| Asia | 157 | 8.3% |
| Canada | 4 | 0.2% |
| Central America | 52 | 2.7% |
| Guatemala | 23 | 1.2% |
| Laos | 128 | 6.7% |
| Latin America | 57 | 3.0% |
| Mexico | 29 | 1.5% |
| Philippines | 11 | 0.6% |
| South America | 5 | 0.3% |
| South Eastern Asia | 157 | 8.3% |
| Thailand | 18 | 0.9% | View All 12 Rows |
Sex and Age in Mountain Lake
Sex and Age in Mountain Lake
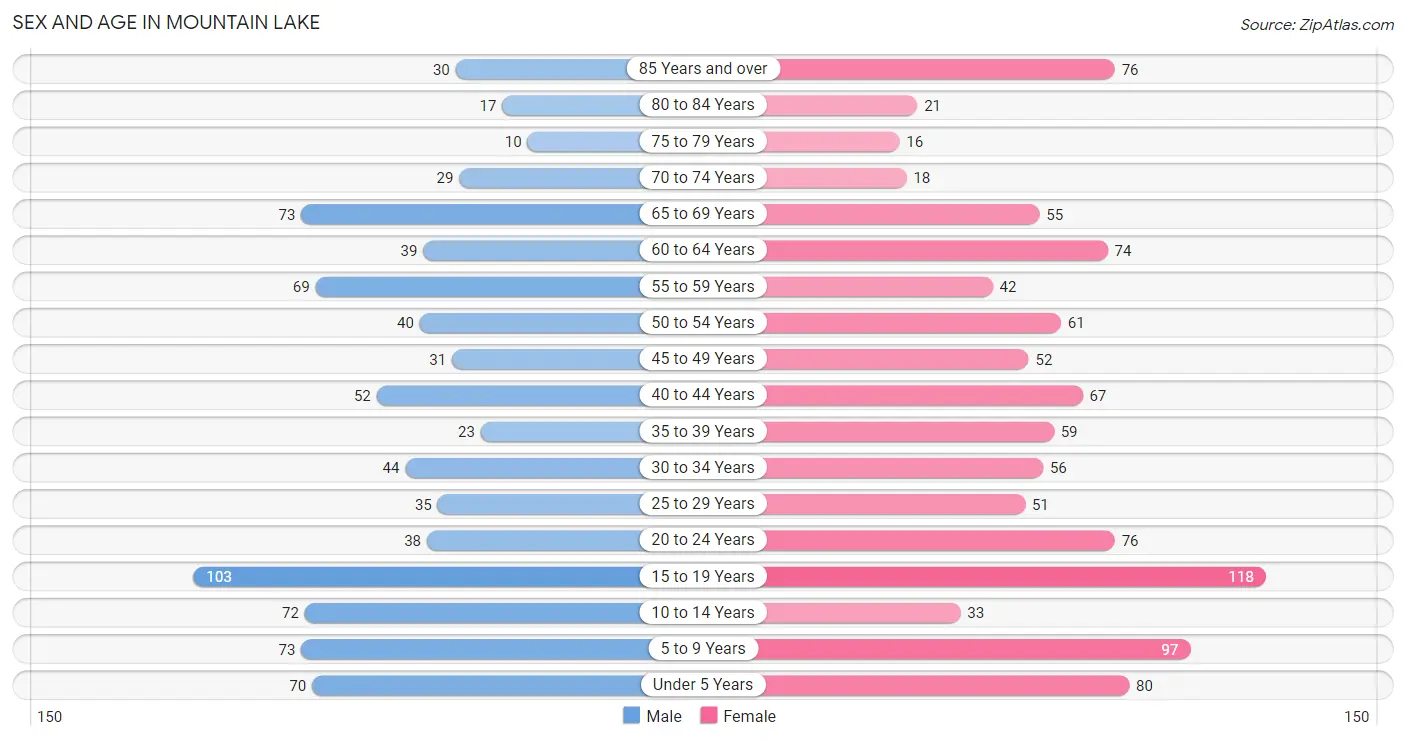
The most populous age groups in Mountain Lake are 15 to 19 Years (103 | 12.1%) for men and 15 to 19 Years (118 | 11.2%) for women.
| Age Bracket | Male | Female |
| Under 5 Years | 70 (8.3%) | 80 (7.6%) |
| 5 to 9 Years | 73 (8.6%) | 97 (9.2%) |
| 10 to 14 Years | 72 (8.5%) | 33 (3.1%) |
| 15 to 19 Years | 103 (12.1%) | 118 (11.2%) |
| 20 to 24 Years | 38 (4.5%) | 76 (7.2%) |
| 25 to 29 Years | 35 (4.1%) | 51 (4.9%) |
| 30 to 34 Years | 44 (5.2%) | 56 (5.3%) |
| 35 to 39 Years | 23 (2.7%) | 59 (5.6%) |
| 40 to 44 Years | 52 (6.1%) | 67 (6.4%) |
| 45 to 49 Years | 31 (3.7%) | 52 (4.9%) |
| 50 to 54 Years | 40 (4.7%) | 61 (5.8%) |
| 55 to 59 Years | 69 (8.1%) | 42 (4.0%) |
| 60 to 64 Years | 39 (4.6%) | 74 (7.0%) |
| 65 to 69 Years | 73 (8.6%) | 55 (5.2%) |
| 70 to 74 Years | 29 (3.4%) | 18 (1.7%) |
| 75 to 79 Years | 10 (1.2%) | 16 (1.5%) |
| 80 to 84 Years | 17 (2.0%) | 21 (2.0%) |
| 85 Years and over | 30 (3.5%) | 76 (7.2%) |
| Total | 848 (100.0%) | 1,052 (100.0%) |
Families and Households in Mountain Lake
Median Family Size in Mountain Lake
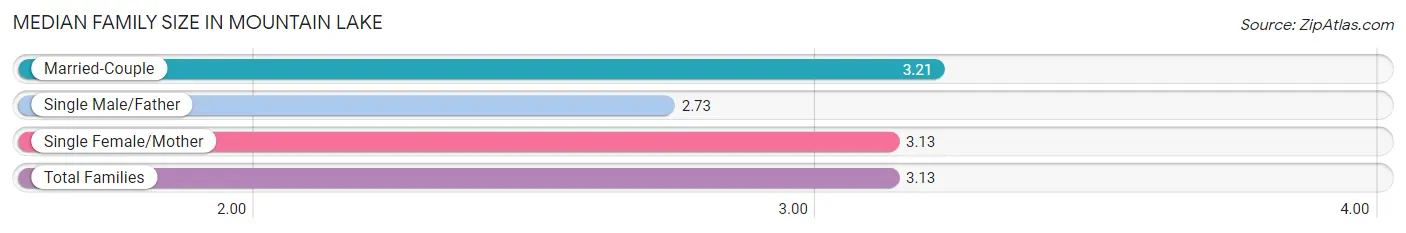
The median family size in Mountain Lake is 3.13 persons per family, with married-couple families (288 | 58.7%) accounting for the largest median family size of 3.21 persons per family. On the other hand, single male/father families (59 | 12.0%) represent the smallest median family size with 2.73 persons per family.
| Family Type | # Families | Family Size |
| Married-Couple | 288 (58.7%) | 3.21 |
| Single Male/Father | 59 (12.0%) | 2.73 |
| Single Female/Mother | 144 (29.3%) | 3.13 |
| Total Families | 491 (100.0%) | 3.13 |
Median Household Size in Mountain Lake
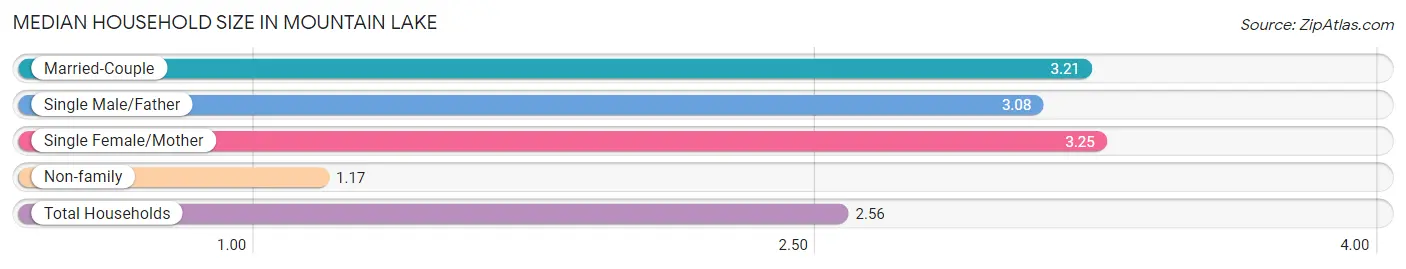
The median household size in Mountain Lake is 2.56 persons per household, with single female/mother households (144 | 20.1%) accounting for the largest median household size of 3.25 persons per household. non-family households (227 | 31.6%) represent the smallest median household size with 1.17 persons per household.
| Household Type | # Households | Household Size |
| Married-Couple | 288 (40.1%) | 3.21 |
| Single Male/Father | 59 (8.2%) | 3.08 |
| Single Female/Mother | 144 (20.1%) | 3.25 |
| Non-family | 227 (31.6%) | 1.17 |
| Total Households | 718 (100.0%) | 2.56 |
Household Size by Marriage Status in Mountain Lake
Out of a total of 718 households in Mountain Lake, 491 (68.4%) are family households, while 227 (31.6%) are nonfamily households. The most numerous type of family households are 2-person households, comprising 162, and the most common type of nonfamily households are 1-person households, comprising 188.
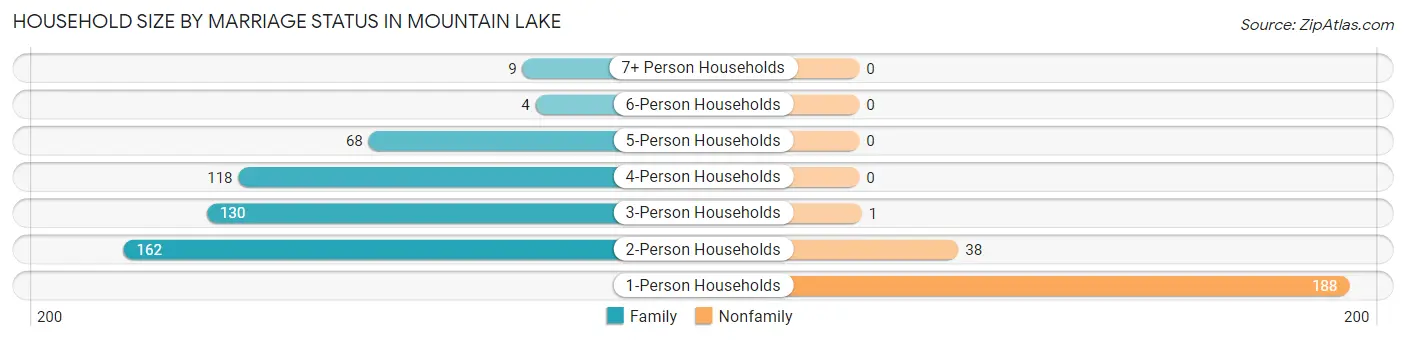
| Household Size | Family Households | Nonfamily Households |
| 1-Person Households | - | 188 (26.2%) |
| 2-Person Households | 162 (22.6%) | 38 (5.3%) |
| 3-Person Households | 130 (18.1%) | 1 (0.1%) |
| 4-Person Households | 118 (16.4%) | 0 (0.0%) |
| 5-Person Households | 68 (9.5%) | 0 (0.0%) |
| 6-Person Households | 4 (0.6%) | 0 (0.0%) |
| 7+ Person Households | 9 (1.3%) | 0 (0.0%) |
| Total | 491 (68.4%) | 227 (31.6%) |
Female Fertility in Mountain Lake
Fertility by Age in Mountain Lake
Average fertility rate in Mountain Lake is 72.0 births per 1,000 women. Women in the age bracket of 20 to 34 years have the highest fertility rate with 115.0 births per 1,000 women. Women in the age bracket of 20 to 34 years acount for 60.0% of all women with births.
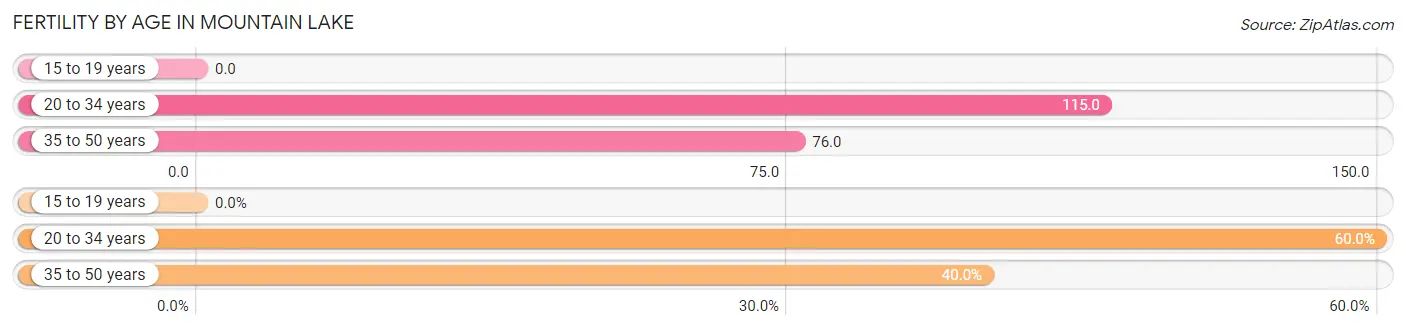
| Age Bracket | Women with Births | Births / 1,000 Women |
| 15 to 19 years | 0 (0.0%) | 0.0 |
| 20 to 34 years | 21 (60.0%) | 115.0 |
| 35 to 50 years | 14 (40.0%) | 76.0 |
| Total | 35 (100.0%) | 72.0 |
Fertility by Age by Marriage Status in Mountain Lake
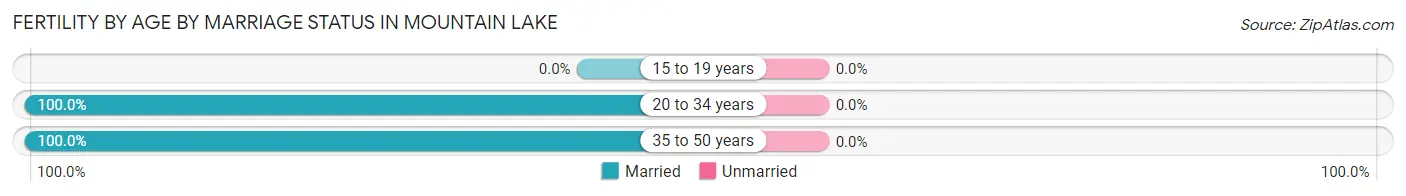
| Age Bracket | Married | Unmarried |
| 15 to 19 years | 0 (0.0%) | 0 (0.0%) |
| 20 to 34 years | 21 (100.0%) | 0 (0.0%) |
| 35 to 50 years | 14 (100.0%) | 0 (0.0%) |
| Total | 35 (100.0%) | 0 (0.0%) |
Fertility by Education in Mountain Lake
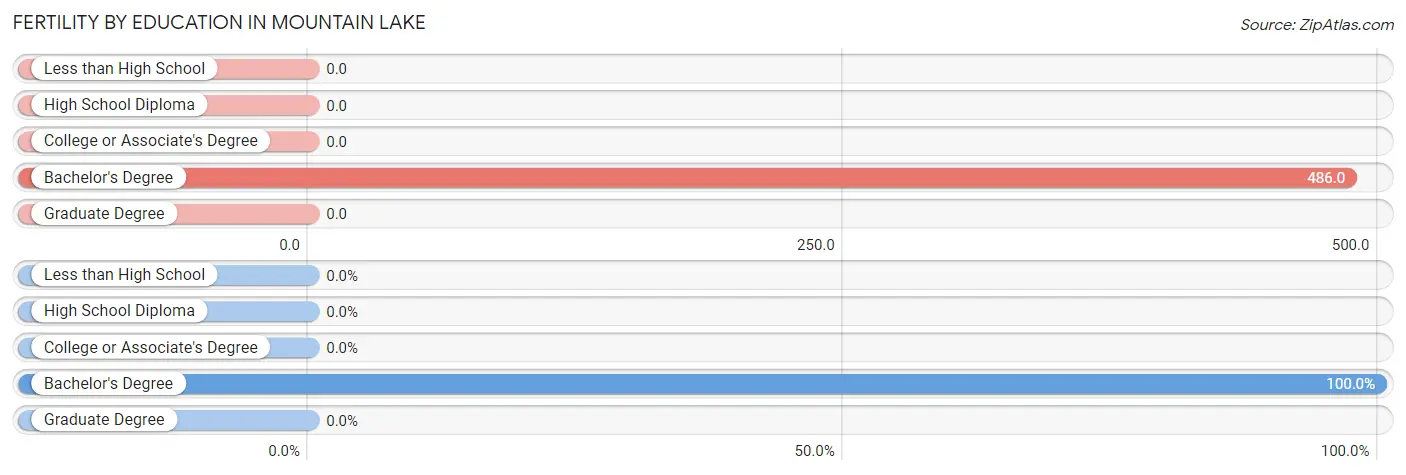
| Educational Attainment | Women with Births | Births / 1,000 Women |
| Less than High School | 0 (0.0%) | 0.0 |
| High School Diploma | 0 (0.0%) | 0.0 |
| College or Associate's Degree | 0 (0.0%) | 0.0 |
| Bachelor's Degree | 35 (100.0%) | 486.0 |
| Graduate Degree | 0 (0.0%) | 0.0 |
| Total | 35 (100.0%) | 72.0 |
Fertility by Education by Marriage Status in Mountain Lake
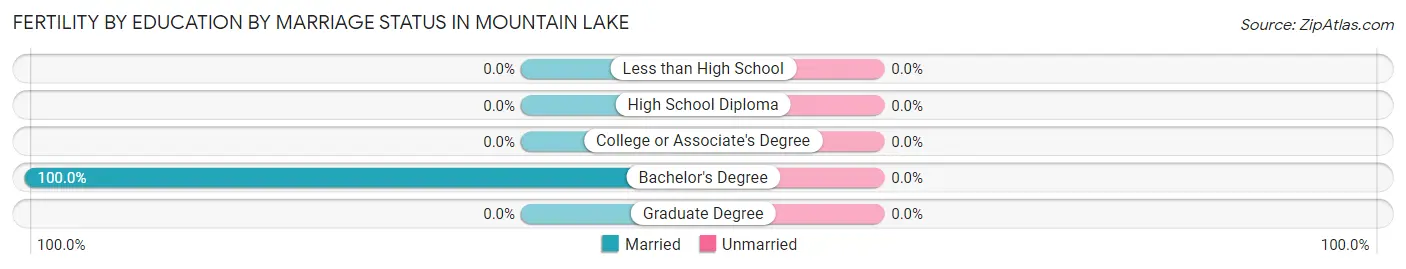
| Educational Attainment | Married | Unmarried |
| Less than High School | 0 (0.0%) | 0 (0.0%) |
| High School Diploma | 0 (0.0%) | 0 (0.0%) |
| College or Associate's Degree | 0 (0.0%) | 0 (0.0%) |
| Bachelor's Degree | 35 (100.0%) | 0 (0.0%) |
| Graduate Degree | 0 (0.0%) | 0 (0.0%) |
| Total | 35 (100.0%) | 0 (0.0%) |
Employment Characteristics in Mountain Lake
Employment by Class of Employer in Mountain Lake
Among the 758 employed individuals in Mountain Lake, private company employees (488 | 64.4%), not-for-profit organizations (123 | 16.2%), and local government employees (91 | 12.0%) make up the most common classes of employment.
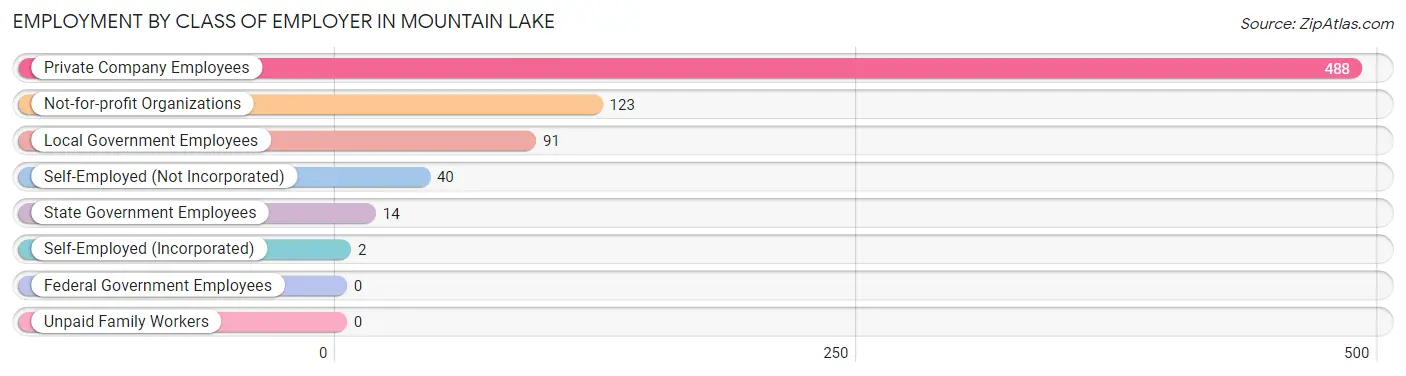
| Employer Class | # Employees | % Employees |
| Private Company Employees | 488 | 64.4% |
| Self-Employed (Incorporated) | 2 | 0.3% |
| Self-Employed (Not Incorporated) | 40 | 5.3% |
| Not-for-profit Organizations | 123 | 16.2% |
| Local Government Employees | 91 | 12.0% |
| State Government Employees | 14 | 1.8% |
| Federal Government Employees | 0 | 0.0% |
| Unpaid Family Workers | 0 | 0.0% |
| Total | 758 | 100.0% |
Employment Status by Age in Mountain Lake
According to the labor force statistics for Mountain Lake, out of the total population over 16 years of age (1,425), 61.1% or 871 individuals are in the labor force, with 5.6% or 49 of them unemployed. The age group with the highest labor force participation rate is 25 to 29 years, with 95.3% or 82 individuals in the labor force. Within the labor force, the 20 to 24 years age range has the highest percentage of unemployed individuals, with 20.7% or 19 of them being unemployed.
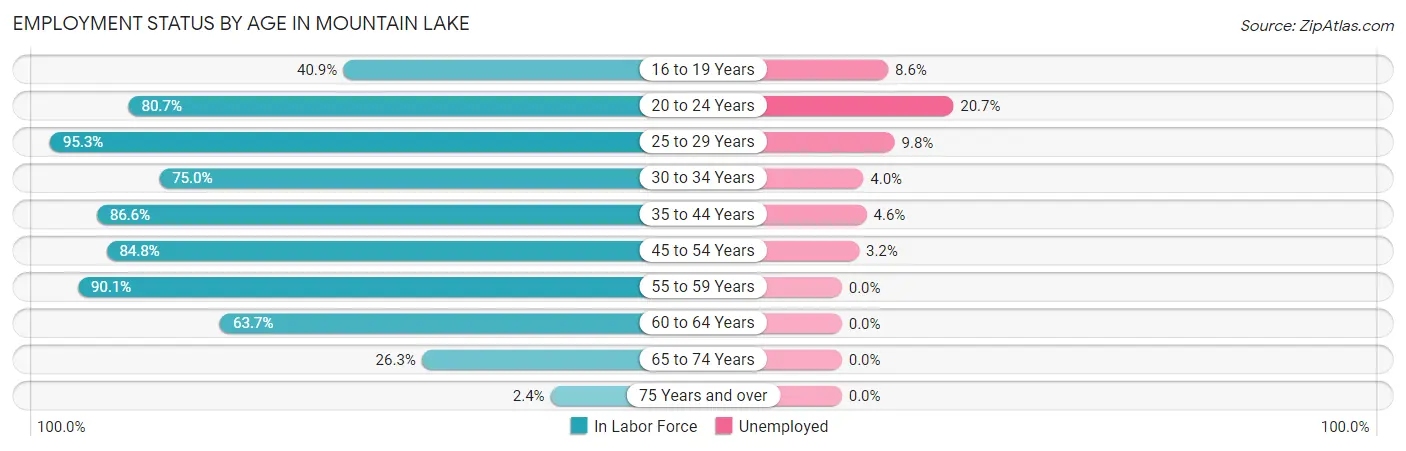
| Age Bracket | In Labor Force | Unemployed |
| 16 to 19 Years | 70 (40.9%) | 6 (8.6%) |
| 20 to 24 Years | 92 (80.7%) | 19 (20.7%) |
| 25 to 29 Years | 82 (95.3%) | 8 (9.8%) |
| 30 to 34 Years | 75 (75.0%) | 3 (4.0%) |
| 35 to 44 Years | 174 (86.6%) | 8 (4.6%) |
| 45 to 54 Years | 156 (84.8%) | 5 (3.2%) |
| 55 to 59 Years | 100 (90.1%) | 0 (0.0%) |
| 60 to 64 Years | 72 (63.7%) | 0 (0.0%) |
| 65 to 74 Years | 46 (26.3%) | 0 (0.0%) |
| 75 Years and over | 4 (2.4%) | 0 (0.0%) |
| Total | 871 (61.1%) | 49 (5.6%) |
Employment Status by Educational Attainment in Mountain Lake
According to labor force statistics for Mountain Lake, 82.9% of individuals (659) out of the total population between 25 and 64 years of age (795) are in the labor force, with 3.6% or 24 of them being unemployed. The group with the highest labor force participation rate are those with the educational attainment of college / associate degree, with 88.7% or 211 individuals in the labor force. Within the labor force, individuals with high school diploma education have the highest percentage of unemployment, with 6.5% or 16 of them being unemployed.
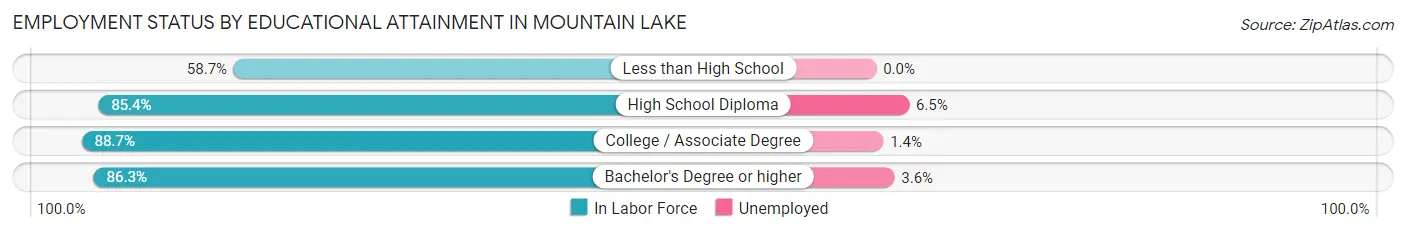
| Educational Attainment | In Labor Force | Unemployed |
| Less than High School | 64 (58.7%) | 0 (0.0%) |
| High School Diploma | 245 (85.4%) | 19 (6.5%) |
| College / Associate Degree | 211 (88.7%) | 3 (1.4%) |
| Bachelor's Degree or higher | 139 (86.3%) | 6 (3.6%) |
| Total | 659 (82.9%) | 29 (3.6%) |
Employment Occupations by Sex in Mountain Lake
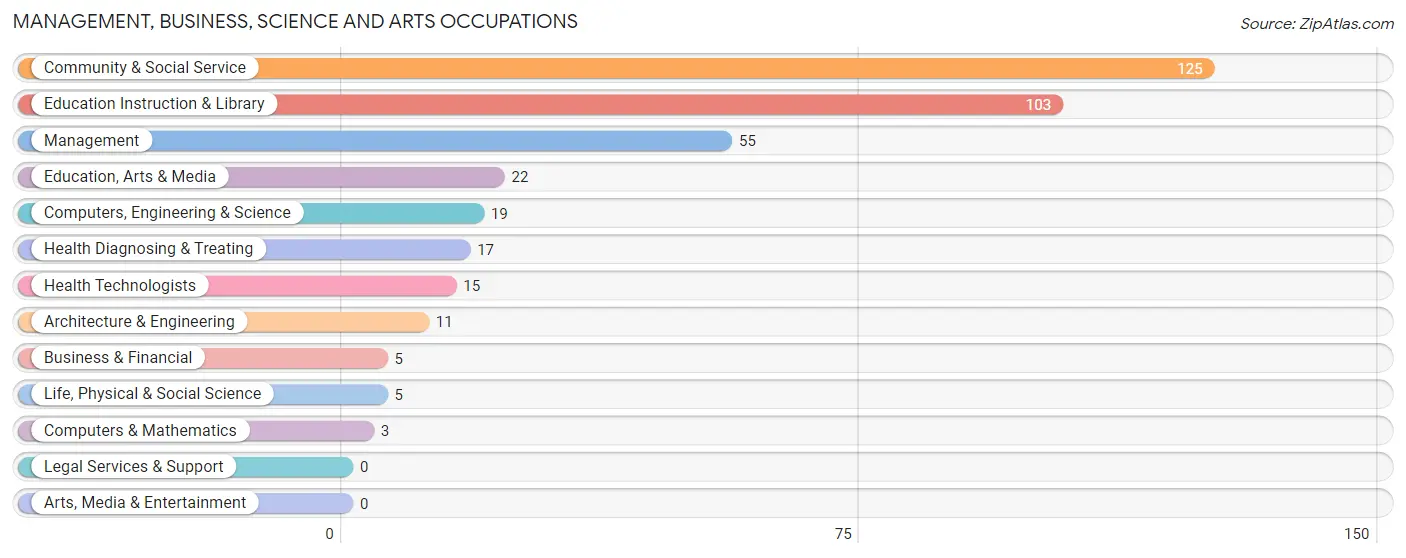
Management, Business, Science and Arts Occupations
The most common Management, Business, Science and Arts occupations in Mountain Lake are Community & Social Service (125 | 15.2%), Education Instruction & Library (103 | 12.5%), Management (55 | 6.7%), Education, Arts & Media (22 | 2.7%), and Computers, Engineering & Science (19 | 2.3%).
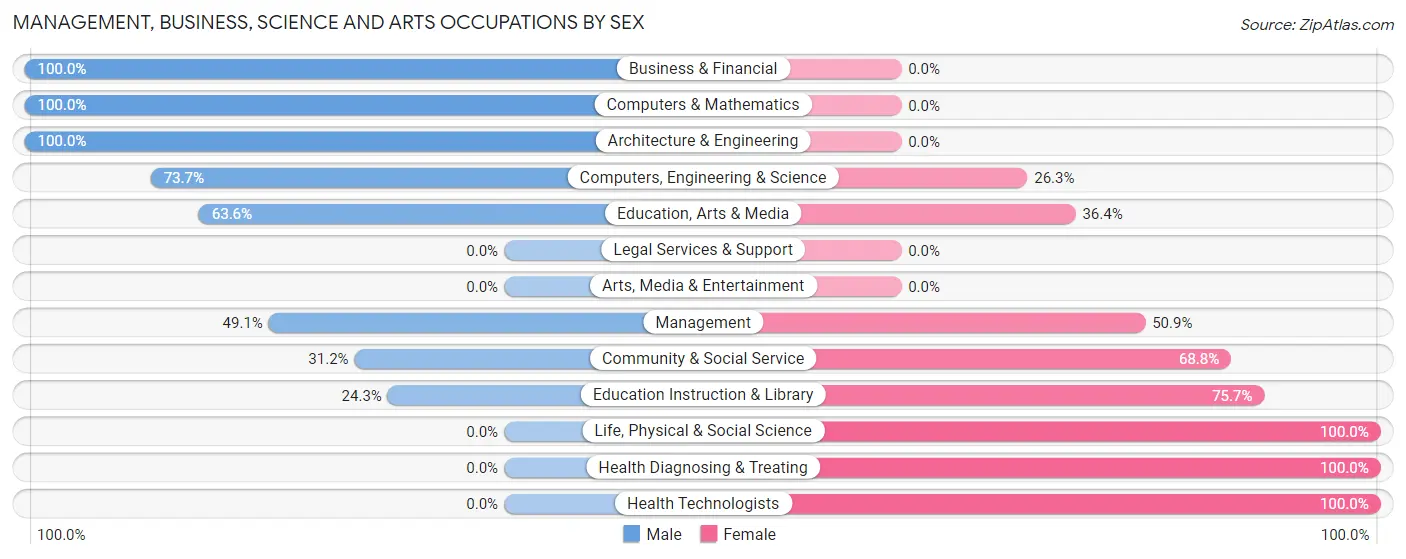
Management, Business, Science and Arts Occupations by Sex
Within the Management, Business, Science and Arts occupations in Mountain Lake, the most male-oriented occupations are Business & Financial (100.0%), Computers & Mathematics (100.0%), and Architecture & Engineering (100.0%), while the most female-oriented occupations are Life, Physical & Social Science (100.0%), Health Diagnosing & Treating (100.0%), and Health Technologists (100.0%).
| Occupation | Male | Female |
| Management | 27 (49.1%) | 28 (50.9%) |
| Business & Financial | 5 (100.0%) | 0 (0.0%) |
| Computers, Engineering & Science | 14 (73.7%) | 5 (26.3%) |
| Computers & Mathematics | 3 (100.0%) | 0 (0.0%) |
| Architecture & Engineering | 11 (100.0%) | 0 (0.0%) |
| Life, Physical & Social Science | 0 (0.0%) | 5 (100.0%) |
| Community & Social Service | 39 (31.2%) | 86 (68.8%) |
| Education, Arts & Media | 14 (63.6%) | 8 (36.4%) |
| Legal Services & Support | 0 (0.0%) | 0 (0.0%) |
| Education Instruction & Library | 25 (24.3%) | 78 (75.7%) |
| Arts, Media & Entertainment | 0 (0.0%) | 0 (0.0%) |
| Health Diagnosing & Treating | 0 (0.0%) | 17 (100.0%) |
| Health Technologists | 0 (0.0%) | 15 (100.0%) |
| Total (Category) | 85 (38.5%) | 136 (61.5%) |
| Total (Overall) | 381 (46.4%) | 441 (53.6%) |
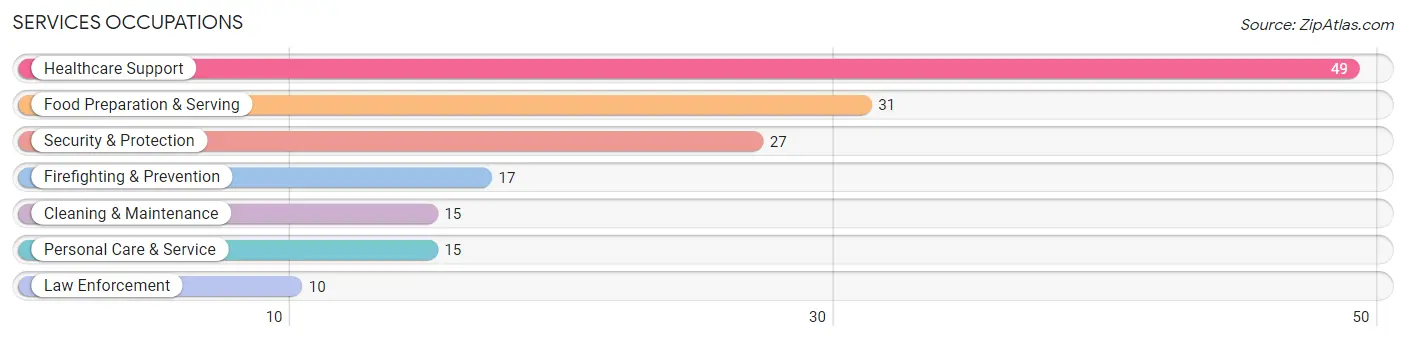
Services Occupations
The most common Services occupations in Mountain Lake are Healthcare Support (49 | 6.0%), Food Preparation & Serving (31 | 3.8%), Security & Protection (27 | 3.3%), Firefighting & Prevention (17 | 2.1%), and Cleaning & Maintenance (15 | 1.8%).
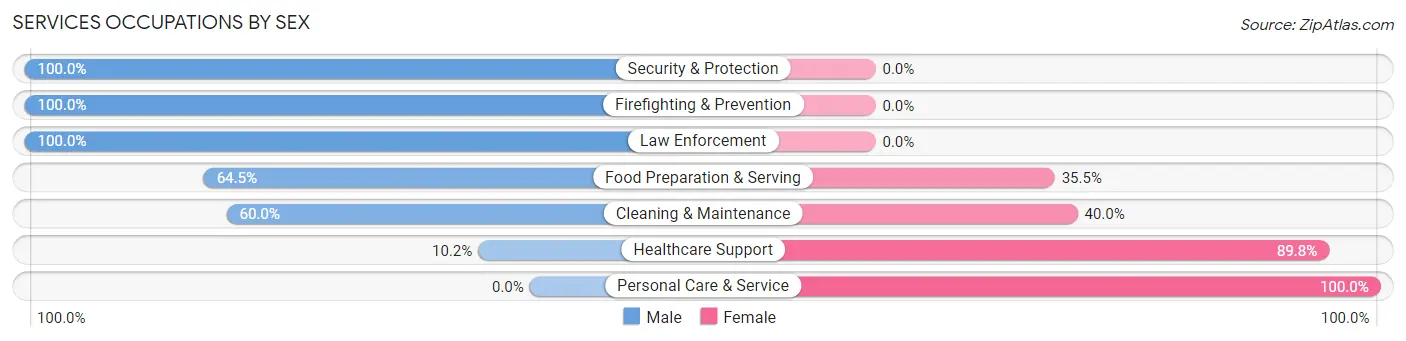
Services Occupations by Sex
Within the Services occupations in Mountain Lake, the most male-oriented occupations are Security & Protection (100.0%), Firefighting & Prevention (100.0%), and Law Enforcement (100.0%), while the most female-oriented occupations are Personal Care & Service (100.0%), Healthcare Support (89.8%), and Cleaning & Maintenance (40.0%).
| Occupation | Male | Female |
| Healthcare Support | 5 (10.2%) | 44 (89.8%) |
| Security & Protection | 27 (100.0%) | 0 (0.0%) |
| Firefighting & Prevention | 17 (100.0%) | 0 (0.0%) |
| Law Enforcement | 10 (100.0%) | 0 (0.0%) |
| Food Preparation & Serving | 20 (64.5%) | 11 (35.5%) |
| Cleaning & Maintenance | 9 (60.0%) | 6 (40.0%) |
| Personal Care & Service | 0 (0.0%) | 15 (100.0%) |
| Total (Category) | 61 (44.5%) | 76 (55.5%) |
| Total (Overall) | 381 (46.4%) | 441 (53.6%) |
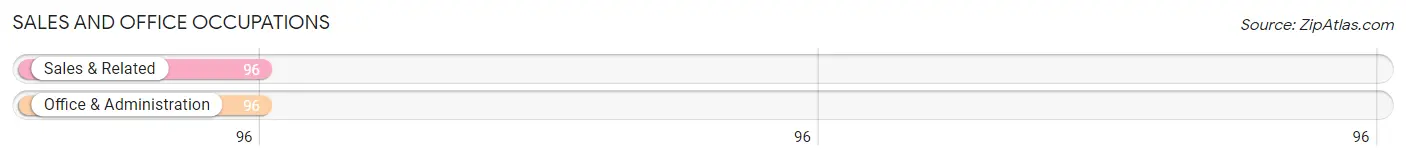
Sales and Office Occupations
The most common Sales and Office occupations in Mountain Lake are Sales & Related (96 | 11.7%), and Office & Administration (96 | 11.7%).
Sales and Office Occupations by Sex
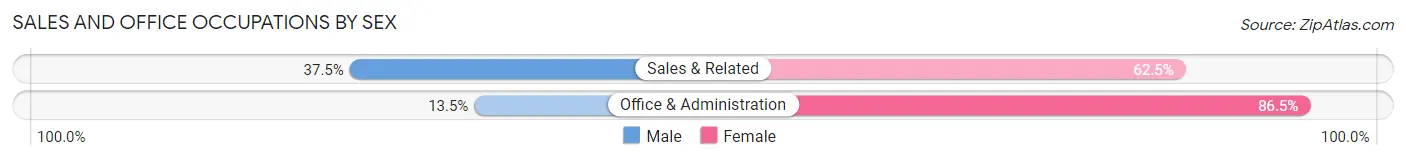
| Occupation | Male | Female |
| Sales & Related | 36 (37.5%) | 60 (62.5%) |
| Office & Administration | 13 (13.5%) | 83 (86.5%) |
| Total (Category) | 49 (25.5%) | 143 (74.5%) |
| Total (Overall) | 381 (46.4%) | 441 (53.6%) |
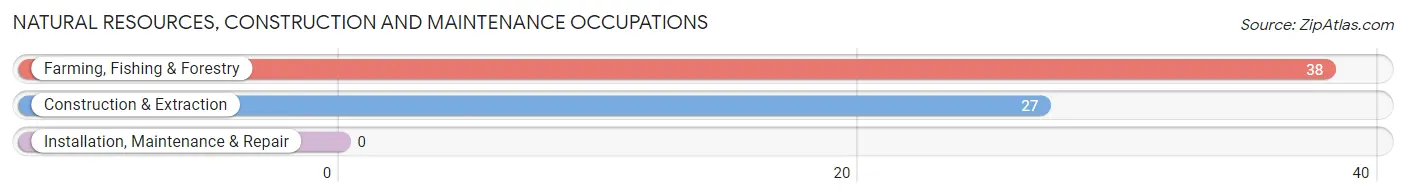
Natural Resources, Construction and Maintenance Occupations
The most common Natural Resources, Construction and Maintenance occupations in Mountain Lake are Farming, Fishing & Forestry (38 | 4.6%), and Construction & Extraction (27 | 3.3%).
Natural Resources, Construction and Maintenance Occupations by Sex
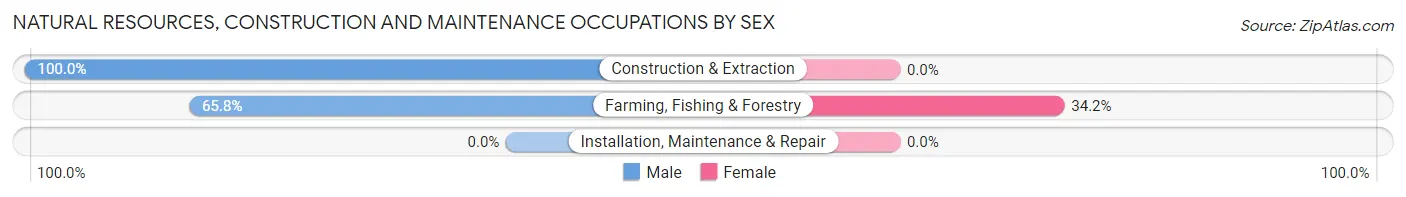
| Occupation | Male | Female |
| Farming, Fishing & Forestry | 25 (65.8%) | 13 (34.2%) |
| Construction & Extraction | 27 (100.0%) | 0 (0.0%) |
| Installation, Maintenance & Repair | 0 (0.0%) | 0 (0.0%) |
| Total (Category) | 52 (80.0%) | 13 (20.0%) |
| Total (Overall) | 381 (46.4%) | 441 (53.6%) |
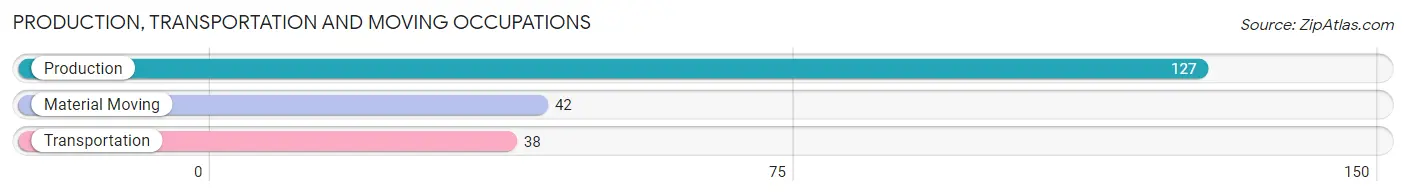
Production, Transportation and Moving Occupations
The most common Production, Transportation and Moving occupations in Mountain Lake are Production (127 | 15.4%), Material Moving (42 | 5.1%), and Transportation (38 | 4.6%).
Production, Transportation and Moving Occupations by Sex
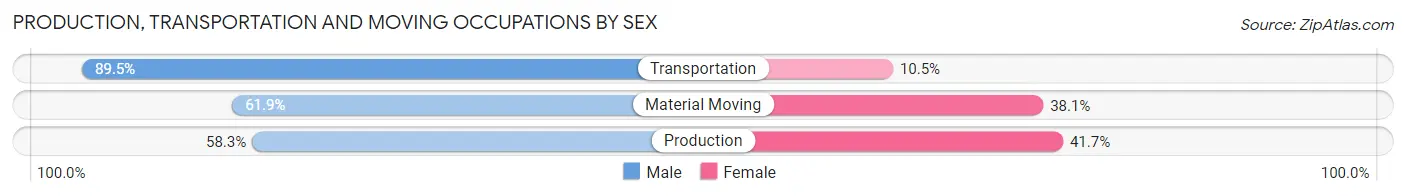
| Occupation | Male | Female |
| Production | 74 (58.3%) | 53 (41.7%) |
| Transportation | 34 (89.5%) | 4 (10.5%) |
| Material Moving | 26 (61.9%) | 16 (38.1%) |
| Total (Category) | 134 (64.7%) | 73 (35.3%) |
| Total (Overall) | 381 (46.4%) | 441 (53.6%) |
Employment Industries by Sex in Mountain Lake
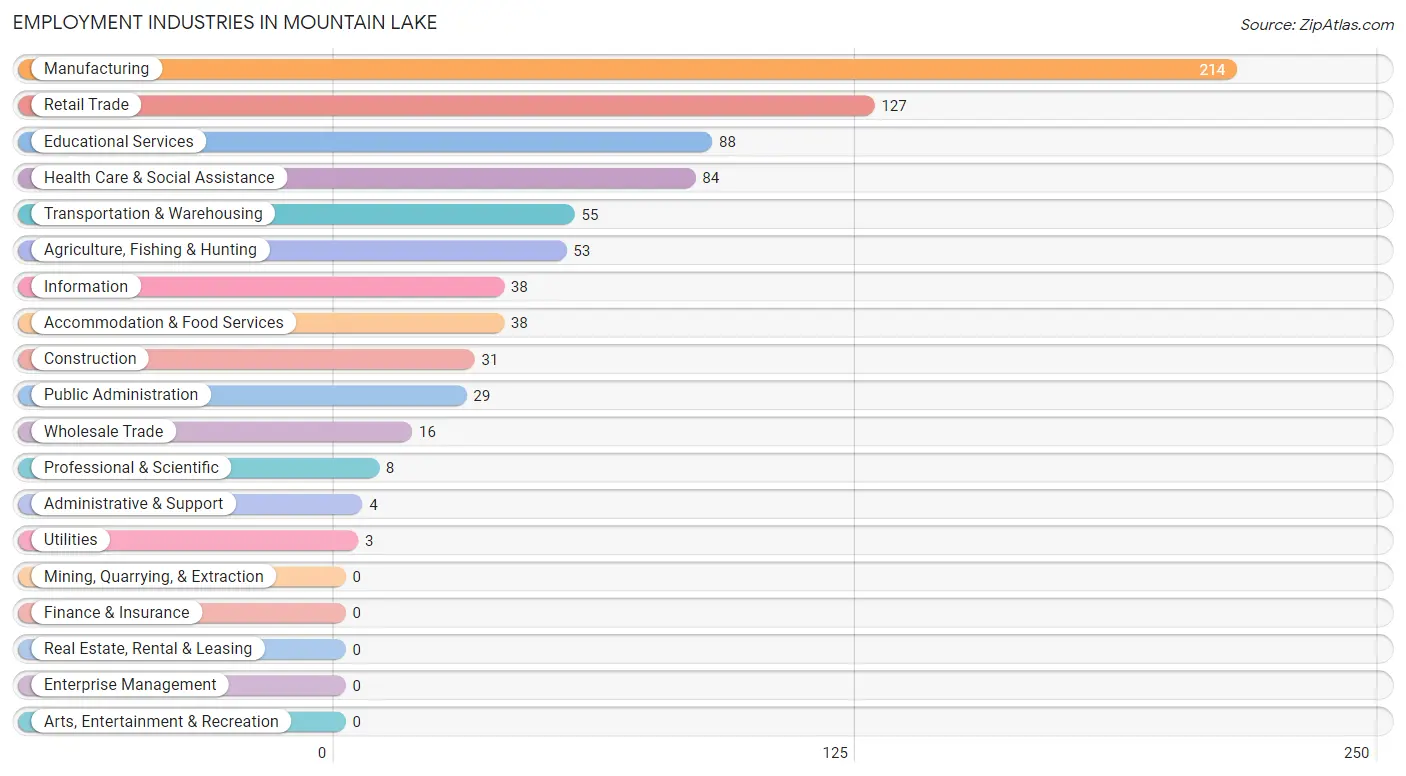
Employment Industries in Mountain Lake
The major employment industries in Mountain Lake include Manufacturing (214 | 26.0%), Retail Trade (127 | 15.4%), Educational Services (88 | 10.7%), Health Care & Social Assistance (84 | 10.2%), and Transportation & Warehousing (55 | 6.7%).
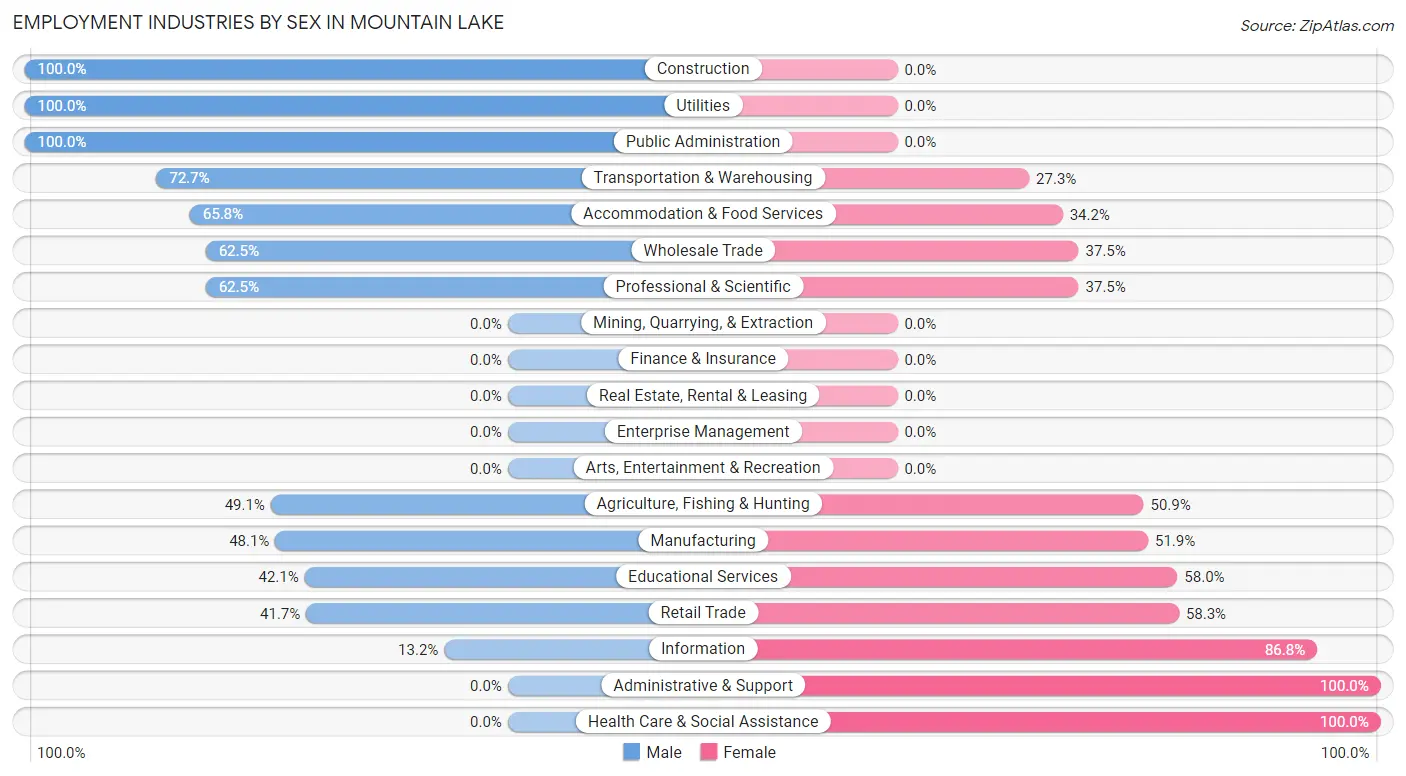
Employment Industries by Sex in Mountain Lake
The Mountain Lake industries that see more men than women are Construction (100.0%), Utilities (100.0%), and Public Administration (100.0%), whereas the industries that tend to have a higher number of women are Administrative & Support (100.0%), Health Care & Social Assistance (100.0%), and Information (86.8%).
| Industry | Male | Female |
| Agriculture, Fishing & Hunting | 26 (49.1%) | 27 (50.9%) |
| Mining, Quarrying, & Extraction | 0 (0.0%) | 0 (0.0%) |
| Construction | 31 (100.0%) | 0 (0.0%) |
| Manufacturing | 103 (48.1%) | 111 (51.9%) |
| Wholesale Trade | 10 (62.5%) | 6 (37.5%) |
| Retail Trade | 53 (41.7%) | 74 (58.3%) |
| Transportation & Warehousing | 40 (72.7%) | 15 (27.3%) |
| Utilities | 3 (100.0%) | 0 (0.0%) |
| Information | 5 (13.2%) | 33 (86.8%) |
| Finance & Insurance | 0 (0.0%) | 0 (0.0%) |
| Real Estate, Rental & Leasing | 0 (0.0%) | 0 (0.0%) |
| Professional & Scientific | 5 (62.5%) | 3 (37.5%) |
| Enterprise Management | 0 (0.0%) | 0 (0.0%) |
| Administrative & Support | 0 (0.0%) | 4 (100.0%) |
| Educational Services | 37 (42.0%) | 51 (58.0%) |
| Health Care & Social Assistance | 0 (0.0%) | 84 (100.0%) |
| Arts, Entertainment & Recreation | 0 (0.0%) | 0 (0.0%) |
| Accommodation & Food Services | 25 (65.8%) | 13 (34.2%) |
| Public Administration | 29 (100.0%) | 0 (0.0%) |
| Total | 381 (46.4%) | 441 (53.6%) |
Education in Mountain Lake
School Enrollment in Mountain Lake
The most common levels of schooling among the 550 students in Mountain Lake are high school (201 | 36.5%), elementary school (129 | 23.4%), and middle school (105 | 19.1%).
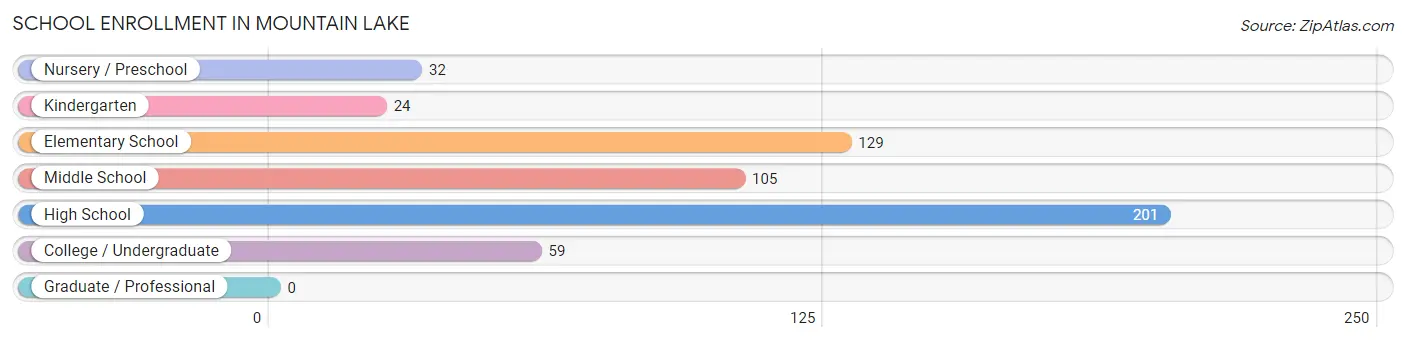
| School Level | # Students | % Students |
| Nursery / Preschool | 32 | 5.8% |
| Kindergarten | 24 | 4.4% |
| Elementary School | 129 | 23.4% |
| Middle School | 105 | 19.1% |
| High School | 201 | 36.5% |
| College / Undergraduate | 59 | 10.7% |
| Graduate / Professional | 0 | 0.0% |
| Total | 550 | 100.0% |
School Enrollment by Age by Funding Source in Mountain Lake
Out of a total of 550 students who are enrolled in schools in Mountain Lake, 71 (12.9%) attend a private institution, while the remaining 479 (87.1%) are enrolled in public schools. The age group of 35 years and over has the highest likelihood of being enrolled in private schools, with 12 (100.0% in the age bracket) enrolled. Conversely, the age group of 3 to 4 year olds has the lowest likelihood of being enrolled in a private school, with 15 (100.0% in the age bracket) attending a public institution.
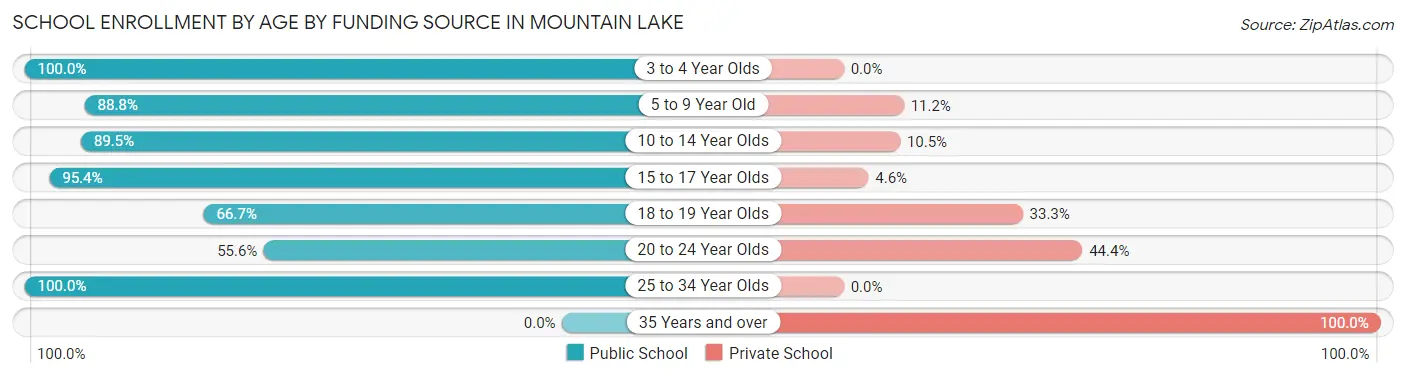
| Age Bracket | Public School | Private School |
| 3 to 4 Year Olds | 15 (100.0%) | 0 (0.0%) |
| 5 to 9 Year Old | 151 (88.8%) | 19 (11.2%) |
| 10 to 14 Year Olds | 94 (89.5%) | 11 (10.5%) |
| 15 to 17 Year Olds | 166 (95.4%) | 8 (4.6%) |
| 18 to 19 Year Olds | 26 (66.7%) | 13 (33.3%) |
| 20 to 24 Year Olds | 10 (55.6%) | 8 (44.4%) |
| 25 to 34 Year Olds | 17 (100.0%) | 0 (0.0%) |
| 35 Years and over | 0 (0.0%) | 12 (100.0%) |
| Total | 479 (87.1%) | 71 (12.9%) |
Educational Attainment by Field of Study in Mountain Lake
Education (90 | 34.9%), bio, nature & agricultural (34 | 13.2%), business (30 | 11.6%), liberal arts & history (24 | 9.3%), and multidisciplinary studies (16 | 6.2%) are the most common fields of study among 258 individuals in Mountain Lake who have obtained a bachelor's degree or higher.
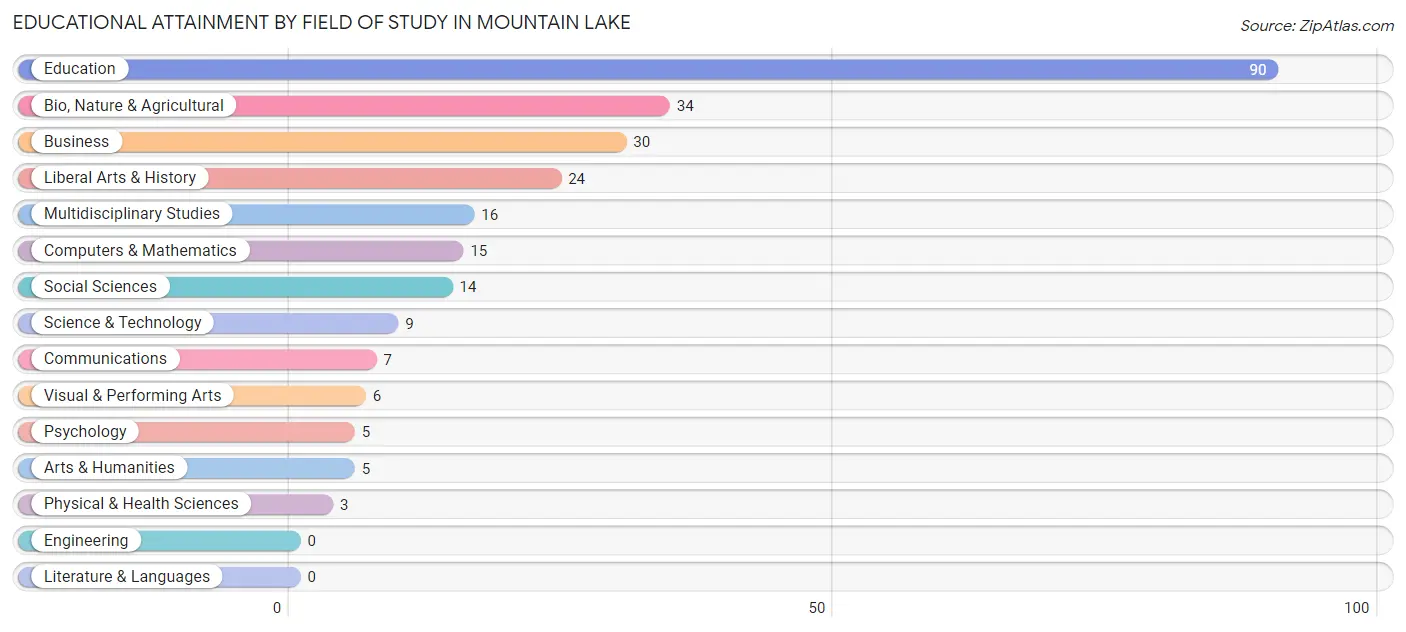
| Field of Study | # Graduates | % Graduates |
| Computers & Mathematics | 15 | 5.8% |
| Bio, Nature & Agricultural | 34 | 13.2% |
| Physical & Health Sciences | 3 | 1.2% |
| Psychology | 5 | 1.9% |
| Social Sciences | 14 | 5.4% |
| Engineering | 0 | 0.0% |
| Multidisciplinary Studies | 16 | 6.2% |
| Science & Technology | 9 | 3.5% |
| Business | 30 | 11.6% |
| Education | 90 | 34.9% |
| Literature & Languages | 0 | 0.0% |
| Liberal Arts & History | 24 | 9.3% |
| Visual & Performing Arts | 6 | 2.3% |
| Communications | 7 | 2.7% |
| Arts & Humanities | 5 | 1.9% |
| Total | 258 | 100.0% |
Transportation & Commute in Mountain Lake
Vehicle Availability by Sex in Mountain Lake
The most prevalent vehicle ownership categories in Mountain Lake are males with 2 vehicles (140, accounting for 40.4%) and females with 2 vehicles (186, making up 34.1%).
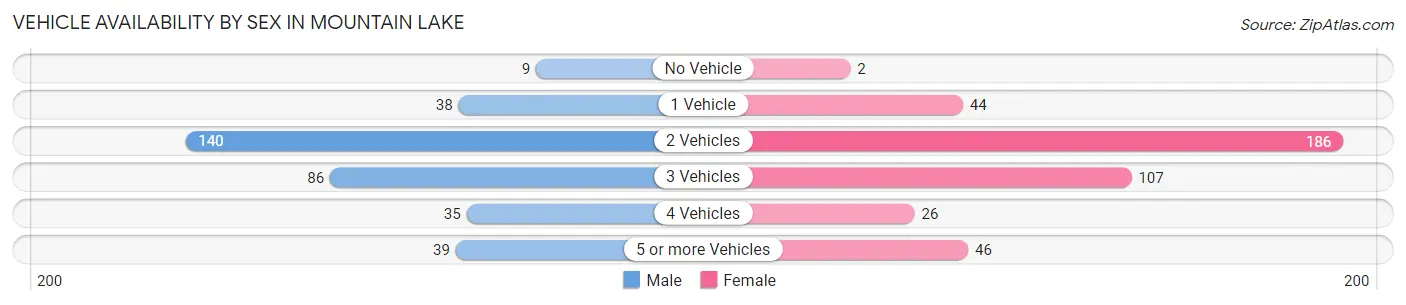
| Vehicles Available | Male | Female |
| No Vehicle | 9 (2.6%) | 2 (0.5%) |
| 1 Vehicle | 38 (11.0%) | 44 (10.7%) |
| 2 Vehicles | 140 (40.4%) | 186 (45.3%) |
| 3 Vehicles | 86 (24.8%) | 107 (26.0%) |
| 4 Vehicles | 35 (10.1%) | 26 (6.3%) |
| 5 or more Vehicles | 39 (11.2%) | 46 (11.2%) |
| Total | 347 (100.0%) | 411 (100.0%) |
Commute Time in Mountain Lake
The most frequently occuring commute durations in Mountain Lake are less than 5 minutes (177 commuters, 26.5%), 5 to 9 minutes (131 commuters, 19.6%), and 10 to 14 minutes (122 commuters, 18.3%).
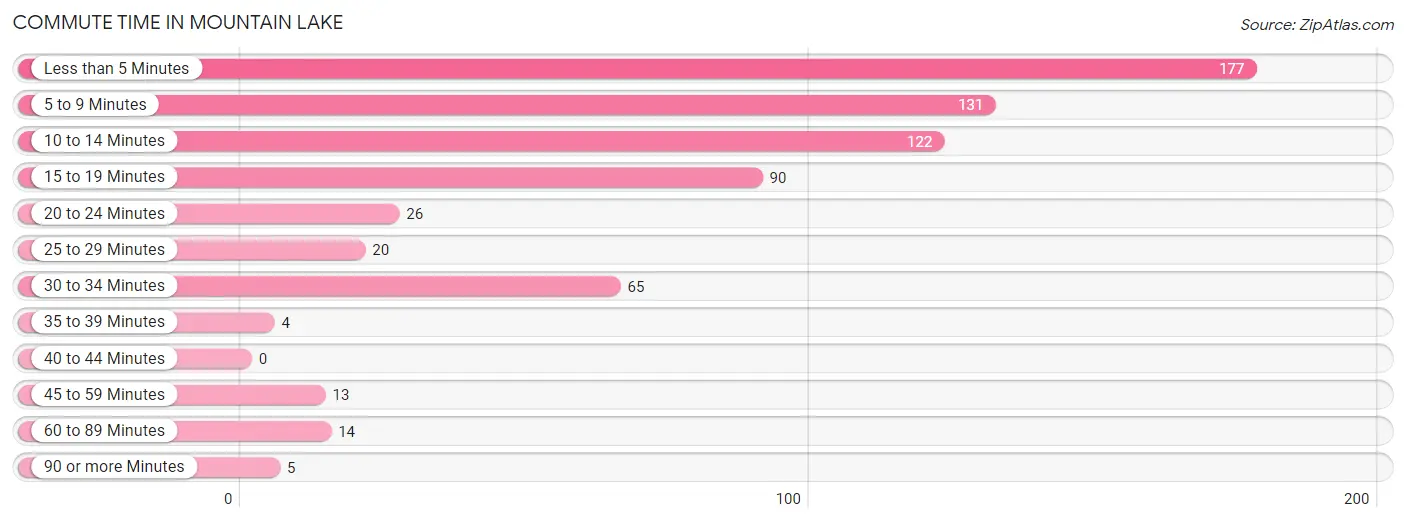
| Commute Time | # Commuters | % Commuters |
| Less than 5 Minutes | 177 | 26.5% |
| 5 to 9 Minutes | 131 | 19.6% |
| 10 to 14 Minutes | 122 | 18.3% |
| 15 to 19 Minutes | 90 | 13.5% |
| 20 to 24 Minutes | 26 | 3.9% |
| 25 to 29 Minutes | 20 | 3.0% |
| 30 to 34 Minutes | 65 | 9.8% |
| 35 to 39 Minutes | 4 | 0.6% |
| 40 to 44 Minutes | 0 | 0.0% |
| 45 to 59 Minutes | 13 | 1.9% |
| 60 to 89 Minutes | 14 | 2.1% |
| 90 or more Minutes | 5 | 0.7% |
Commute Time by Sex in Mountain Lake
The most common commute times in Mountain Lake are 10 to 14 minutes (82 commuters, 25.7%) for males and less than 5 minutes (105 commuters, 30.2%) for females.
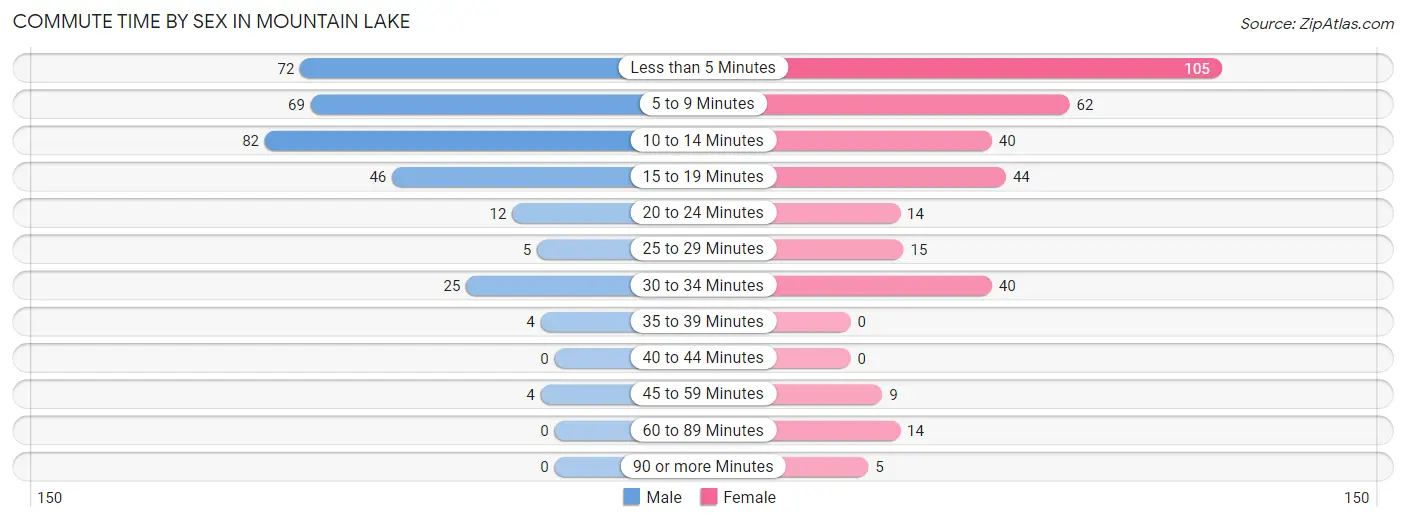
| Commute Time | Male | Female |
| Less than 5 Minutes | 72 (22.6%) | 105 (30.2%) |
| 5 to 9 Minutes | 69 (21.6%) | 62 (17.8%) |
| 10 to 14 Minutes | 82 (25.7%) | 40 (11.5%) |
| 15 to 19 Minutes | 46 (14.4%) | 44 (12.6%) |
| 20 to 24 Minutes | 12 (3.8%) | 14 (4.0%) |
| 25 to 29 Minutes | 5 (1.6%) | 15 (4.3%) |
| 30 to 34 Minutes | 25 (7.8%) | 40 (11.5%) |
| 35 to 39 Minutes | 4 (1.3%) | 0 (0.0%) |
| 40 to 44 Minutes | 0 (0.0%) | 0 (0.0%) |
| 45 to 59 Minutes | 4 (1.3%) | 9 (2.6%) |
| 60 to 89 Minutes | 0 (0.0%) | 14 (4.0%) |
| 90 or more Minutes | 0 (0.0%) | 5 (1.4%) |
Time of Departure to Work by Sex in Mountain Lake
The most frequent times of departure to work in Mountain Lake are 6:00 AM to 6:29 AM (57, 17.9%) for males and 7:30 AM to 7:59 AM (72, 20.7%) for females.
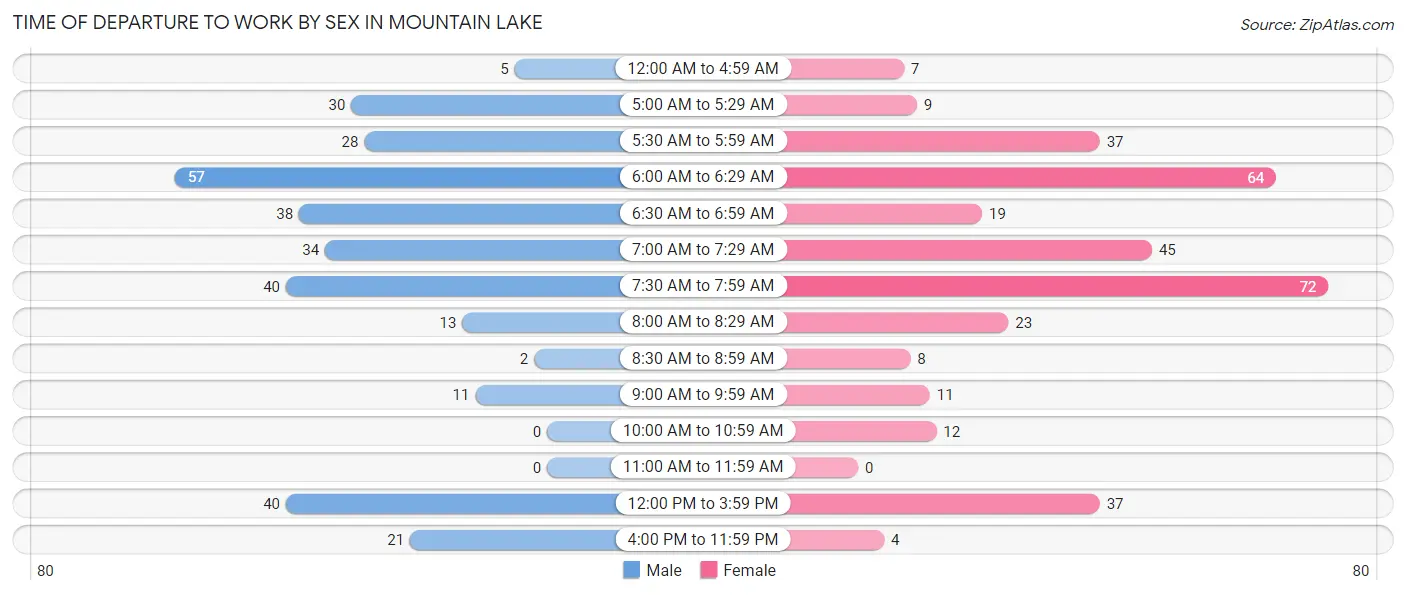
| Time of Departure | Male | Female |
| 12:00 AM to 4:59 AM | 5 (1.6%) | 7 (2.0%) |
| 5:00 AM to 5:29 AM | 30 (9.4%) | 9 (2.6%) |
| 5:30 AM to 5:59 AM | 28 (8.8%) | 37 (10.6%) |
| 6:00 AM to 6:29 AM | 57 (17.9%) | 64 (18.4%) |
| 6:30 AM to 6:59 AM | 38 (11.9%) | 19 (5.5%) |
| 7:00 AM to 7:29 AM | 34 (10.7%) | 45 (12.9%) |
| 7:30 AM to 7:59 AM | 40 (12.5%) | 72 (20.7%) |
| 8:00 AM to 8:29 AM | 13 (4.1%) | 23 (6.6%) |
| 8:30 AM to 8:59 AM | 2 (0.6%) | 8 (2.3%) |
| 9:00 AM to 9:59 AM | 11 (3.5%) | 11 (3.2%) |
| 10:00 AM to 10:59 AM | 0 (0.0%) | 12 (3.5%) |
| 11:00 AM to 11:59 AM | 0 (0.0%) | 0 (0.0%) |
| 12:00 PM to 3:59 PM | 40 (12.5%) | 37 (10.6%) |
| 4:00 PM to 11:59 PM | 21 (6.6%) | 4 (1.1%) |
| Total | 319 (100.0%) | 348 (100.0%) |
Housing Occupancy in Mountain Lake
Occupancy by Ownership in Mountain Lake
Of the total 718 dwellings in Mountain Lake, owner-occupied units account for 522 (72.7%), while renter-occupied units make up 196 (27.3%).
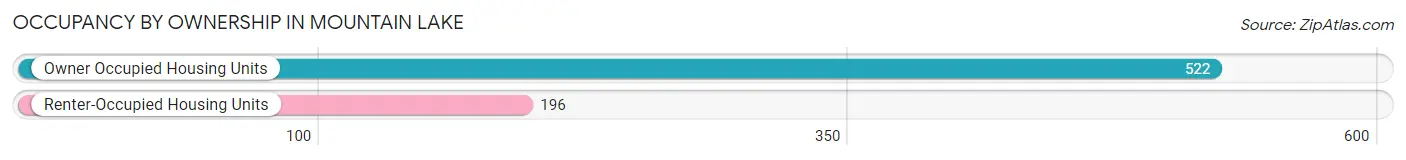
| Occupancy | # Housing Units | % Housing Units |
| Owner Occupied Housing Units | 522 | 72.7% |
| Renter-Occupied Housing Units | 196 | 27.3% |
| Total Occupied Housing Units | 718 | 100.0% |
Occupancy by Household Size in Mountain Lake
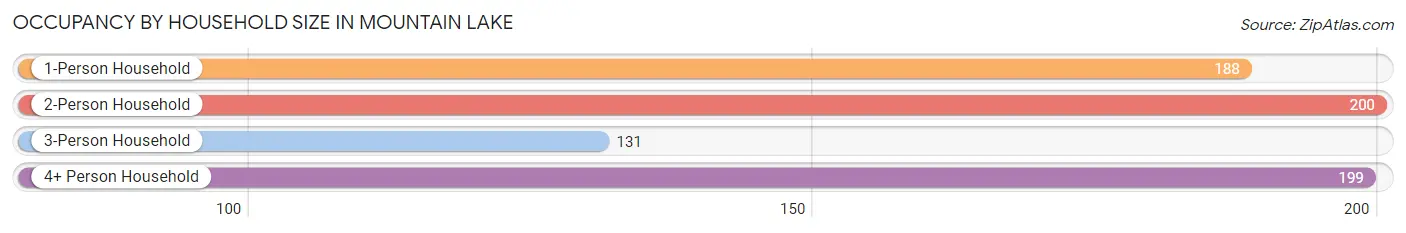
| Household Size | # Housing Units | % Housing Units |
| 1-Person Household | 188 | 26.2% |
| 2-Person Household | 200 | 27.9% |
| 3-Person Household | 131 | 18.2% |
| 4+ Person Household | 199 | 27.7% |
| Total Housing Units | 718 | 100.0% |
Occupancy by Ownership by Household Size in Mountain Lake
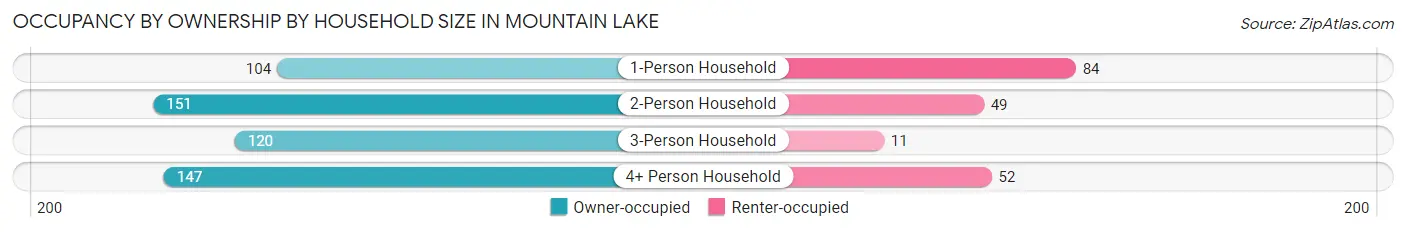
| Household Size | Owner-occupied | Renter-occupied |
| 1-Person Household | 104 (55.3%) | 84 (44.7%) |
| 2-Person Household | 151 (75.5%) | 49 (24.5%) |
| 3-Person Household | 120 (91.6%) | 11 (8.4%) |
| 4+ Person Household | 147 (73.9%) | 52 (26.1%) |
| Total Housing Units | 522 (72.7%) | 196 (27.3%) |
Occupancy by Educational Attainment in Mountain Lake
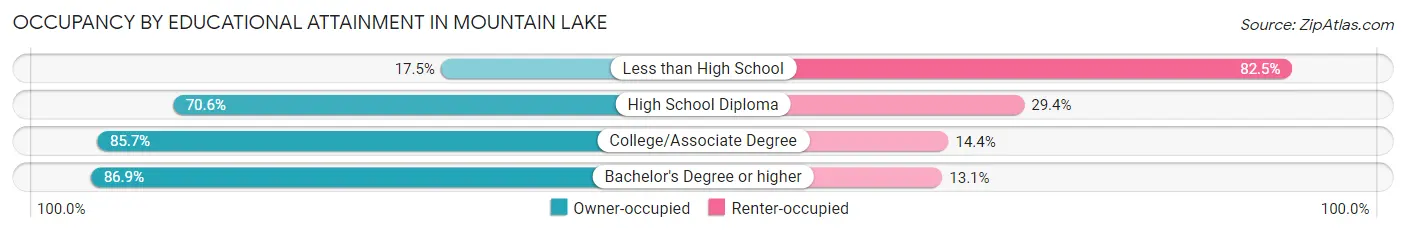
| Household Size | Owner-occupied | Renter-occupied |
| Less than High School | 14 (17.5%) | 66 (82.5%) |
| High School Diploma | 190 (70.6%) | 79 (29.4%) |
| College/Associate Degree | 179 (85.7%) | 30 (14.3%) |
| Bachelor's Degree or higher | 139 (86.9%) | 21 (13.1%) |
Occupancy by Age of Householder in Mountain Lake
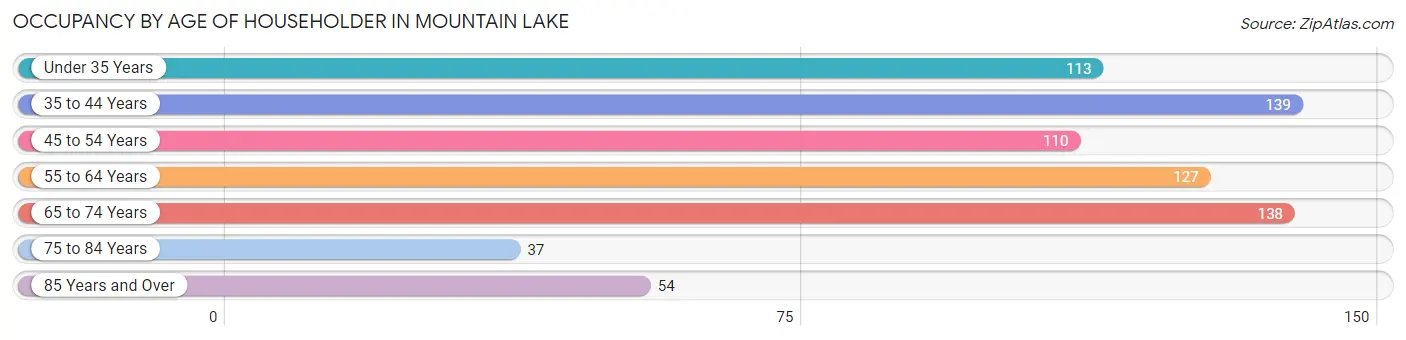
| Age Bracket | # Households | % Households |
| Under 35 Years | 113 | 15.7% |
| 35 to 44 Years | 139 | 19.4% |
| 45 to 54 Years | 110 | 15.3% |
| 55 to 64 Years | 127 | 17.7% |
| 65 to 74 Years | 138 | 19.2% |
| 75 to 84 Years | 37 | 5.1% |
| 85 Years and Over | 54 | 7.5% |
| Total | 718 | 100.0% |
Housing Finances in Mountain Lake
Median Income by Occupancy in Mountain Lake
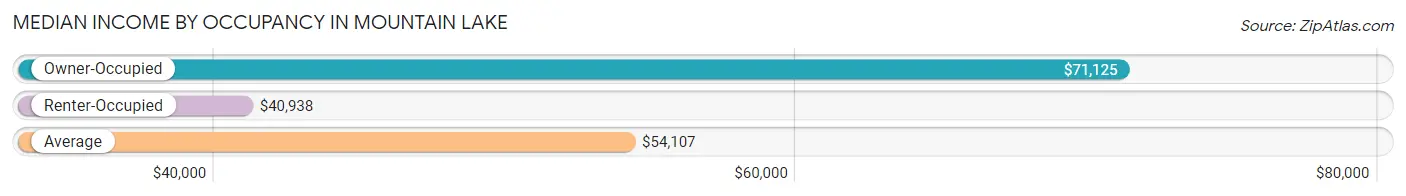
| Occupancy Type | # Households | Median Income |
| Owner-Occupied | 522 (72.7%) | $71,125 |
| Renter-Occupied | 196 (27.3%) | $40,938 |
| Average | 718 (100.0%) | $54,107 |
Occupancy by Householder Income Bracket in Mountain Lake
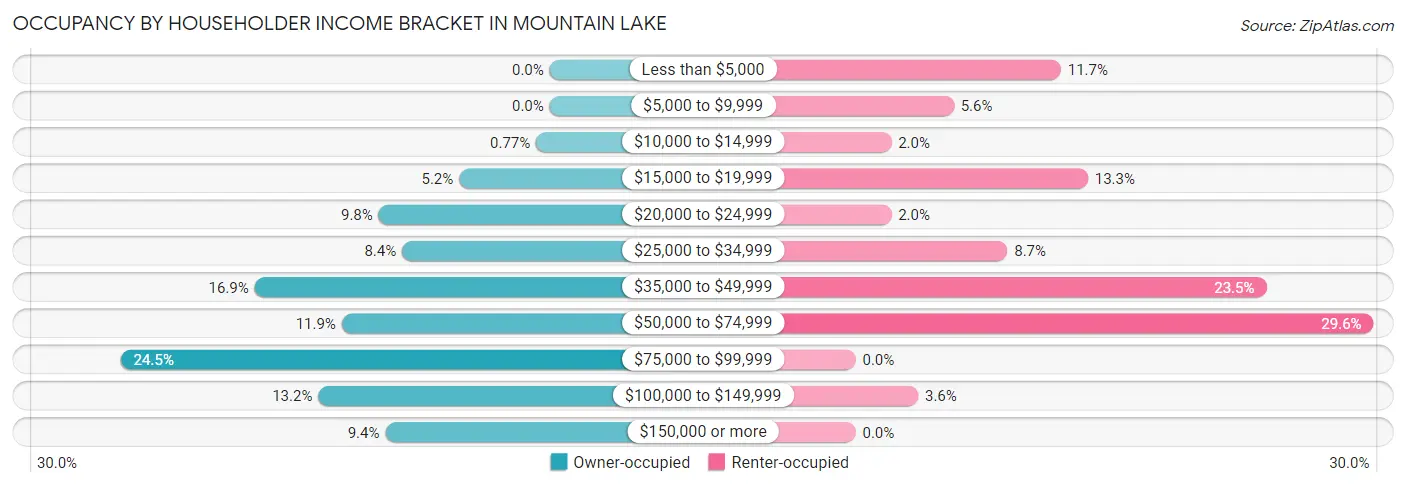
| Income Bracket | Owner-occupied | Renter-occupied |
| Less than $5,000 | 0 (0.0%) | 23 (11.7%) |
| $5,000 to $9,999 | 0 (0.0%) | 11 (5.6%) |
| $10,000 to $14,999 | 4 (0.8%) | 4 (2.0%) |
| $15,000 to $19,999 | 27 (5.2%) | 26 (13.3%) |
| $20,000 to $24,999 | 51 (9.8%) | 4 (2.0%) |
| $25,000 to $34,999 | 44 (8.4%) | 17 (8.7%) |
| $35,000 to $49,999 | 88 (16.9%) | 46 (23.5%) |
| $50,000 to $74,999 | 62 (11.9%) | 58 (29.6%) |
| $75,000 to $99,999 | 128 (24.5%) | 0 (0.0%) |
| $100,000 to $149,999 | 69 (13.2%) | 7 (3.6%) |
| $150,000 or more | 49 (9.4%) | 0 (0.0%) |
| Total | 522 (100.0%) | 196 (100.0%) |
Monthly Housing Cost Tiers in Mountain Lake
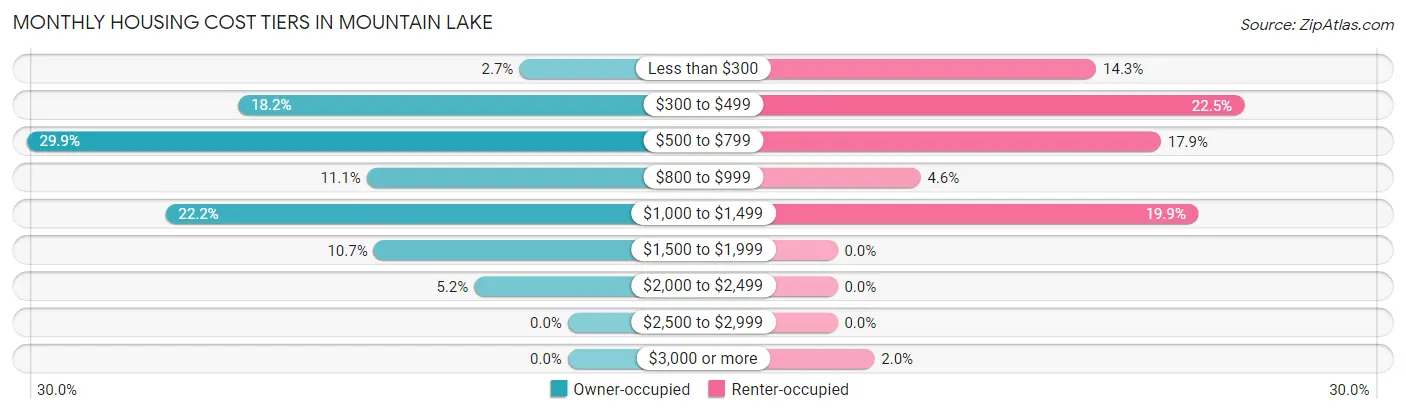
| Monthly Cost | Owner-occupied | Renter-occupied |
| Less than $300 | 14 (2.7%) | 28 (14.3%) |
| $300 to $499 | 95 (18.2%) | 44 (22.5%) |
| $500 to $799 | 156 (29.9%) | 35 (17.9%) |
| $800 to $999 | 58 (11.1%) | 9 (4.6%) |
| $1,000 to $1,499 | 116 (22.2%) | 39 (19.9%) |
| $1,500 to $1,999 | 56 (10.7%) | 0 (0.0%) |
| $2,000 to $2,499 | 27 (5.2%) | 0 (0.0%) |
| $2,500 to $2,999 | 0 (0.0%) | 0 (0.0%) |
| $3,000 or more | 0 (0.0%) | 4 (2.0%) |
| Total | 522 (100.0%) | 196 (100.0%) |
Physical Housing Characteristics in Mountain Lake
Housing Structures in Mountain Lake
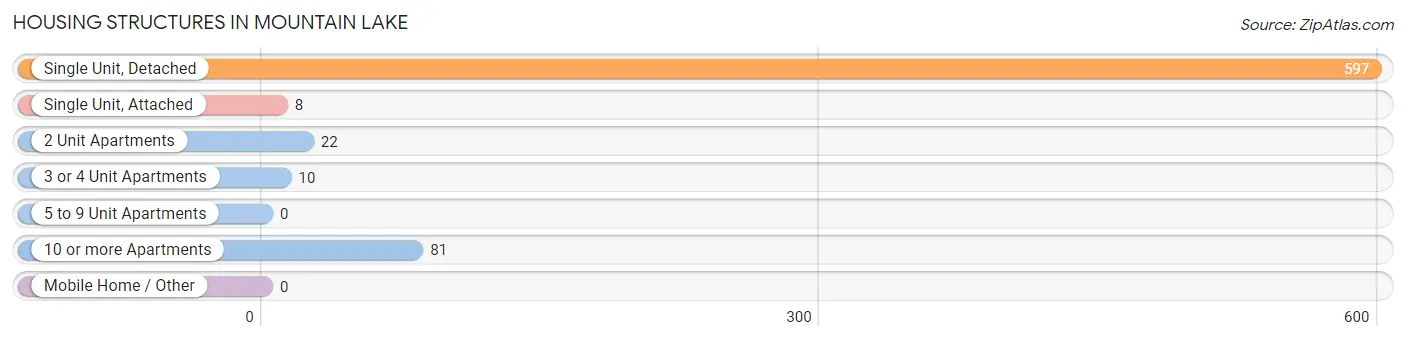
| Structure Type | # Housing Units | % Housing Units |
| Single Unit, Detached | 597 | 83.2% |
| Single Unit, Attached | 8 | 1.1% |
| 2 Unit Apartments | 22 | 3.1% |
| 3 or 4 Unit Apartments | 10 | 1.4% |
| 5 to 9 Unit Apartments | 0 | 0.0% |
| 10 or more Apartments | 81 | 11.3% |
| Mobile Home / Other | 0 | 0.0% |
| Total | 718 | 100.0% |
Housing Structures by Occupancy in Mountain Lake
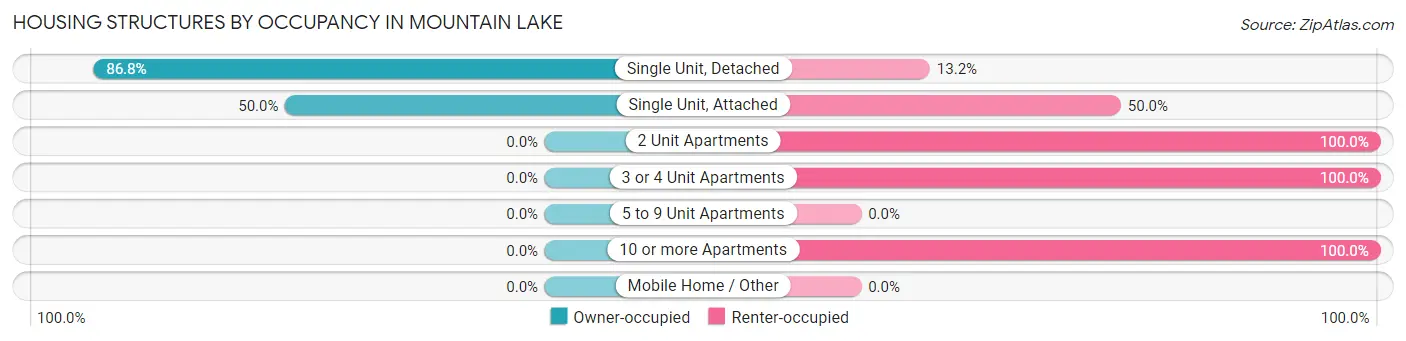
| Structure Type | Owner-occupied | Renter-occupied |
| Single Unit, Detached | 518 (86.8%) | 79 (13.2%) |
| Single Unit, Attached | 4 (50.0%) | 4 (50.0%) |
| 2 Unit Apartments | 0 (0.0%) | 22 (100.0%) |
| 3 or 4 Unit Apartments | 0 (0.0%) | 10 (100.0%) |
| 5 to 9 Unit Apartments | 0 (0.0%) | 0 (0.0%) |
| 10 or more Apartments | 0 (0.0%) | 81 (100.0%) |
| Mobile Home / Other | 0 (0.0%) | 0 (0.0%) |
| Total | 522 (72.7%) | 196 (27.3%) |
Housing Structures by Number of Rooms in Mountain Lake
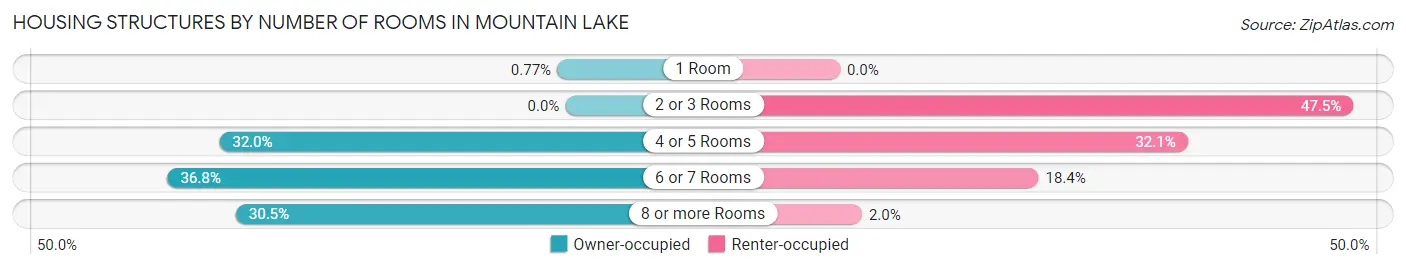
| Number of Rooms | Owner-occupied | Renter-occupied |
| 1 Room | 4 (0.8%) | 0 (0.0%) |
| 2 or 3 Rooms | 0 (0.0%) | 93 (47.4%) |
| 4 or 5 Rooms | 167 (32.0%) | 63 (32.1%) |
| 6 or 7 Rooms | 192 (36.8%) | 36 (18.4%) |
| 8 or more Rooms | 159 (30.5%) | 4 (2.0%) |
| Total | 522 (100.0%) | 196 (100.0%) |
Housing Structure by Heating Type in Mountain Lake
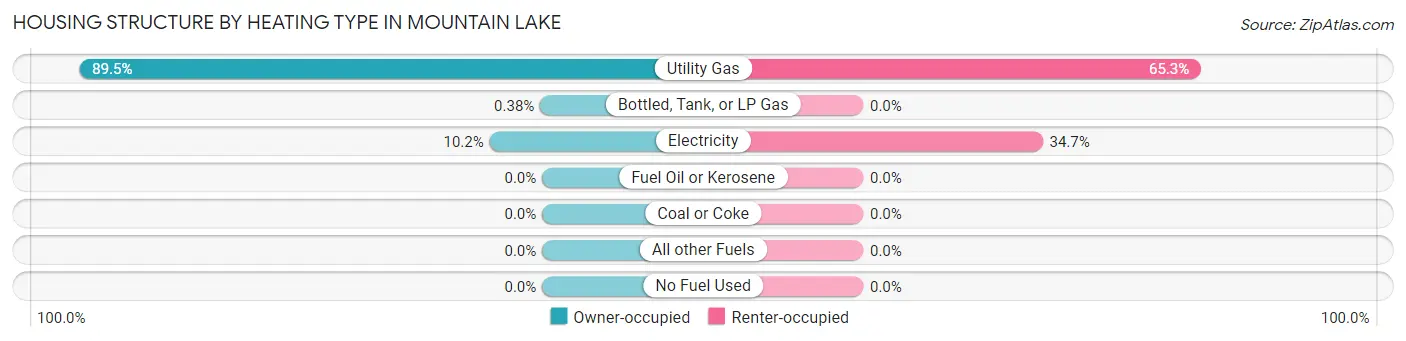
| Heating Type | Owner-occupied | Renter-occupied |
| Utility Gas | 467 (89.5%) | 128 (65.3%) |
| Bottled, Tank, or LP Gas | 2 (0.4%) | 0 (0.0%) |
| Electricity | 53 (10.2%) | 68 (34.7%) |
| Fuel Oil or Kerosene | 0 (0.0%) | 0 (0.0%) |
| Coal or Coke | 0 (0.0%) | 0 (0.0%) |
| All other Fuels | 0 (0.0%) | 0 (0.0%) |
| No Fuel Used | 0 (0.0%) | 0 (0.0%) |
| Total | 522 (100.0%) | 196 (100.0%) |
Household Vehicle Usage in Mountain Lake
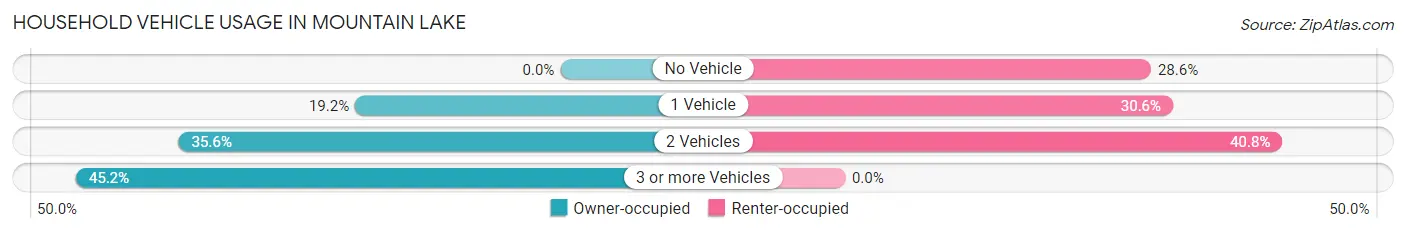
| Vehicles per Household | Owner-occupied | Renter-occupied |
| No Vehicle | 0 (0.0%) | 56 (28.6%) |
| 1 Vehicle | 100 (19.2%) | 60 (30.6%) |
| 2 Vehicles | 186 (35.6%) | 80 (40.8%) |
| 3 or more Vehicles | 236 (45.2%) | 0 (0.0%) |
| Total | 522 (100.0%) | 196 (100.0%) |
Real Estate & Mortgages in Mountain Lake
Real Estate and Mortgage Overview in Mountain Lake
| Characteristic | Without Mortgage | With Mortgage |
| Housing Units | 241 | 281 |
| Median Property Value | $97,500 | $138,700 |
| Median Household Income | $38,466 | $46 |
| Monthly Housing Costs | $526 | $0 |
| Real Estate Taxes | $1,350 | $13 |
Property Value by Mortgage Status in Mountain Lake
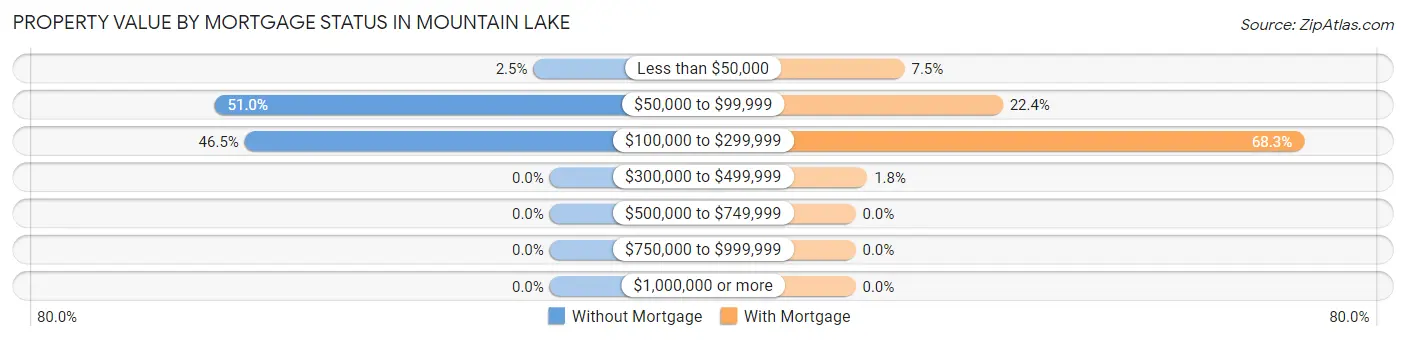
| Property Value | Without Mortgage | With Mortgage |
| Less than $50,000 | 6 (2.5%) | 21 (7.5%) |
| $50,000 to $99,999 | 123 (51.0%) | 63 (22.4%) |
| $100,000 to $299,999 | 112 (46.5%) | 192 (68.3%) |
| $300,000 to $499,999 | 0 (0.0%) | 5 (1.8%) |
| $500,000 to $749,999 | 0 (0.0%) | 0 (0.0%) |
| $750,000 to $999,999 | 0 (0.0%) | 0 (0.0%) |
| $1,000,000 or more | 0 (0.0%) | 0 (0.0%) |
| Total | 241 (100.0%) | 281 (100.0%) |
Household Income by Mortgage Status in Mountain Lake
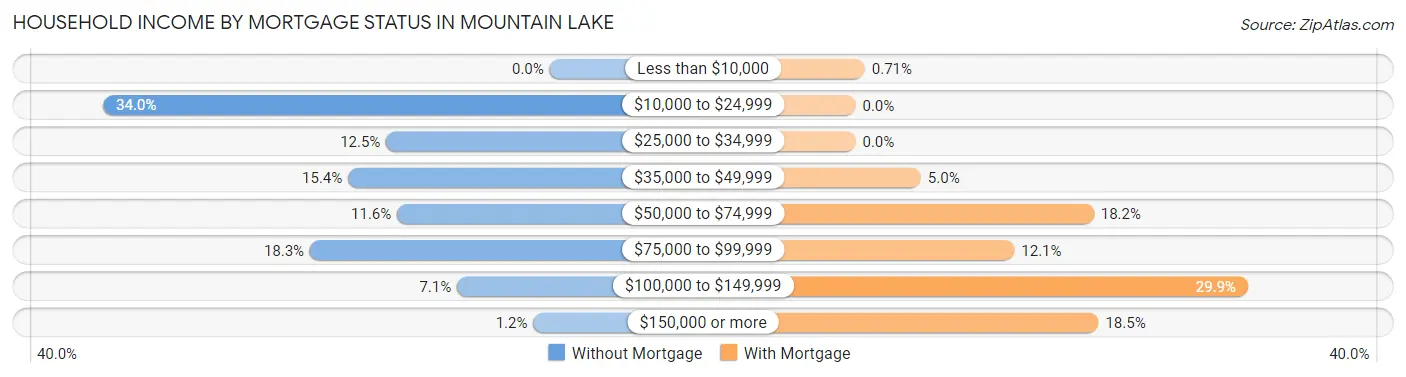
| Household Income | Without Mortgage | With Mortgage |
| Less than $10,000 | 0 (0.0%) | 2 (0.7%) |
| $10,000 to $24,999 | 82 (34.0%) | 0 (0.0%) |
| $25,000 to $34,999 | 30 (12.4%) | 0 (0.0%) |
| $35,000 to $49,999 | 37 (15.3%) | 14 (5.0%) |
| $50,000 to $74,999 | 28 (11.6%) | 51 (18.1%) |
| $75,000 to $99,999 | 44 (18.3%) | 34 (12.1%) |
| $100,000 to $149,999 | 17 (7.0%) | 84 (29.9%) |
| $150,000 or more | 3 (1.2%) | 52 (18.5%) |
| Total | 241 (100.0%) | 281 (100.0%) |
Property Value to Household Income Ratio in Mountain Lake
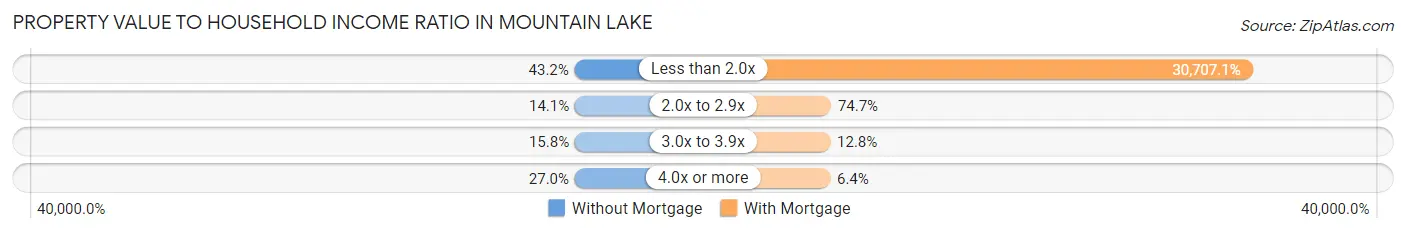
| Value-to-Income Ratio | Without Mortgage | With Mortgage |
| Less than 2.0x | 104 (43.1%) | 86,287 (30,707.1%) |
| 2.0x to 2.9x | 34 (14.1%) | 210 (74.7%) |
| 3.0x to 3.9x | 38 (15.8%) | 36 (12.8%) |
| 4.0x or more | 65 (27.0%) | 18 (6.4%) |
| Total | 241 (100.0%) | 281 (100.0%) |
Real Estate Taxes by Mortgage Status in Mountain Lake
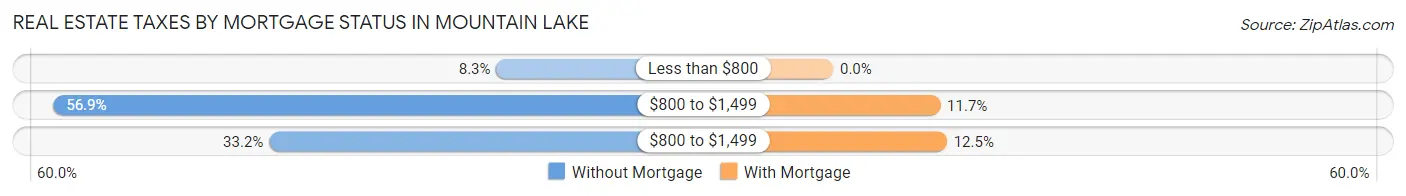
| Property Taxes | Without Mortgage | With Mortgage |
| Less than $800 | 20 (8.3%) | 0 (0.0%) |
| $800 to $1,499 | 137 (56.9%) | 33 (11.7%) |
| $800 to $1,499 | 80 (33.2%) | 35 (12.5%) |
| Total | 241 (100.0%) | 281 (100.0%) |
Health & Disability in Mountain Lake
Health Insurance Coverage by Age in Mountain Lake
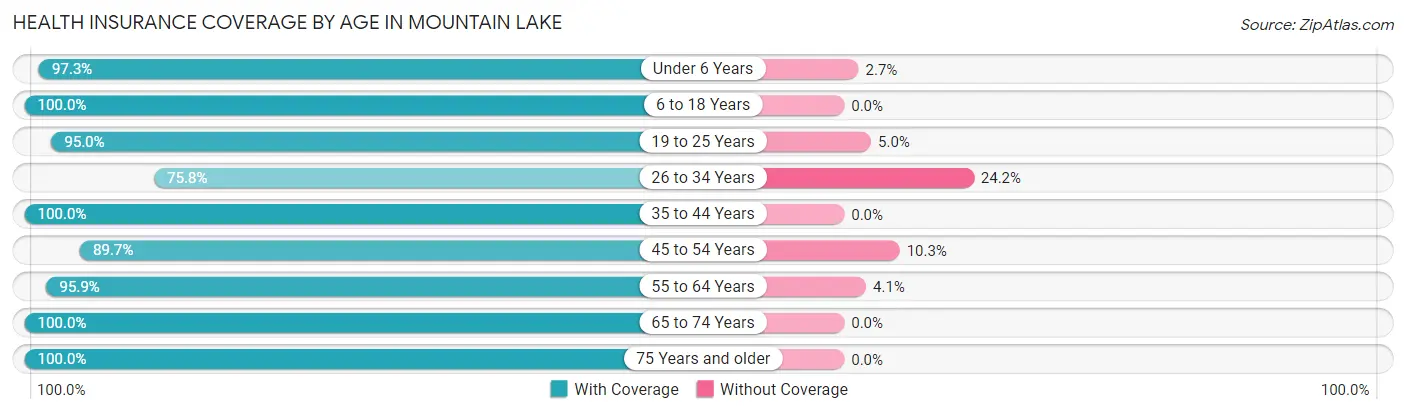
| Age Bracket | With Coverage | Without Coverage |
| Under 6 Years | 182 (97.3%) | 5 (2.7%) |
| 6 to 18 Years | 430 (100.0%) | 0 (0.0%) |
| 19 to 25 Years | 171 (95.0%) | 9 (5.0%) |
| 26 to 34 Years | 113 (75.8%) | 36 (24.2%) |
| 35 to 44 Years | 201 (100.0%) | 0 (0.0%) |
| 45 to 54 Years | 165 (89.7%) | 19 (10.3%) |
| 55 to 64 Years | 212 (95.9%) | 9 (4.1%) |
| 65 to 74 Years | 171 (100.0%) | 0 (0.0%) |
| 75 Years and older | 116 (100.0%) | 0 (0.0%) |
| Total | 1,761 (95.8%) | 78 (4.2%) |
Health Insurance Coverage by Citizenship Status in Mountain Lake
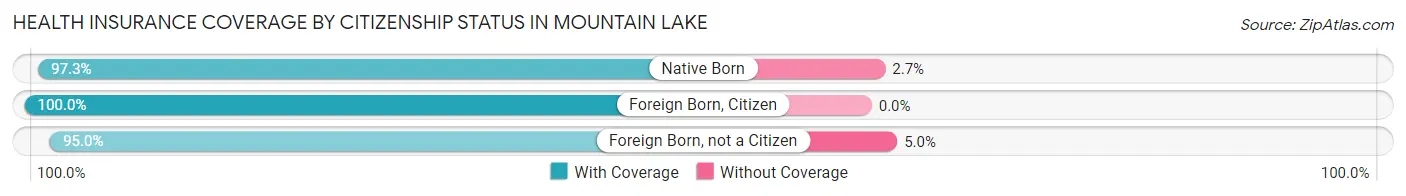
| Citizenship Status | With Coverage | Without Coverage |
| Native Born | 182 (97.3%) | 5 (2.7%) |
| Foreign Born, Citizen | 430 (100.0%) | 0 (0.0%) |
| Foreign Born, not a Citizen | 171 (95.0%) | 9 (5.0%) |
Health Insurance Coverage by Household Income in Mountain Lake
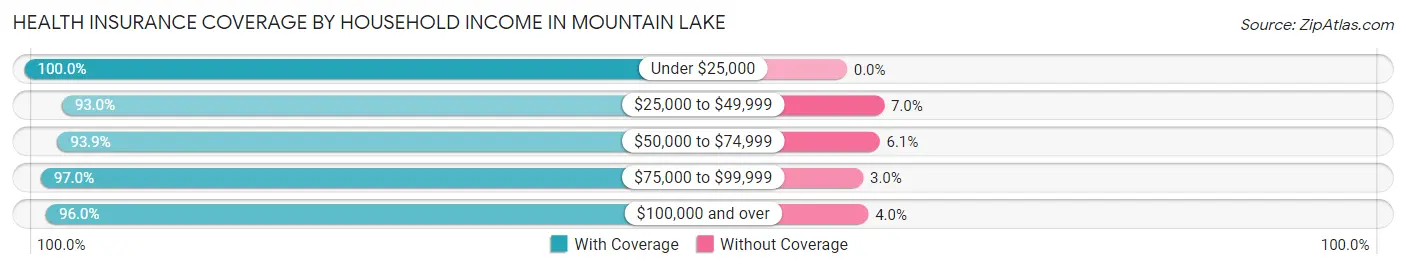
| Household Income | With Coverage | Without Coverage |
| Under $25,000 | 270 (100.0%) | 0 (0.0%) |
| $25,000 to $49,999 | 427 (93.0%) | 32 (7.0%) |
| $50,000 to $74,999 | 260 (93.9%) | 17 (6.1%) |
| $75,000 to $99,999 | 446 (97.0%) | 14 (3.0%) |
| $100,000 and over | 358 (96.0%) | 15 (4.0%) |
Public vs Private Health Insurance Coverage by Age in Mountain Lake
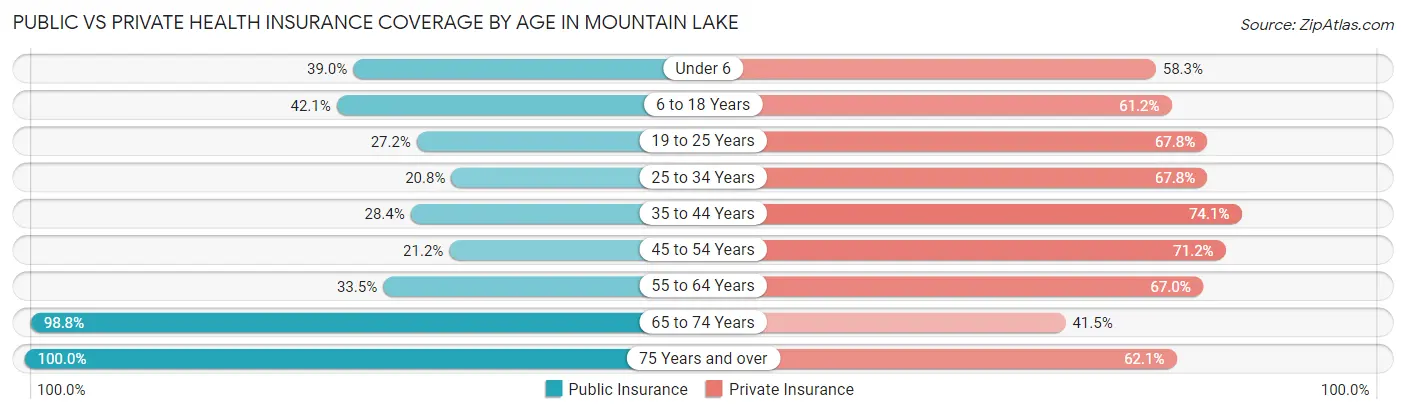
| Age Bracket | Public Insurance | Private Insurance |
| Under 6 | 73 (39.0%) | 109 (58.3%) |
| 6 to 18 Years | 181 (42.1%) | 263 (61.2%) |
| 19 to 25 Years | 49 (27.2%) | 122 (67.8%) |
| 25 to 34 Years | 31 (20.8%) | 101 (67.8%) |
| 35 to 44 Years | 57 (28.4%) | 149 (74.1%) |
| 45 to 54 Years | 39 (21.2%) | 131 (71.2%) |
| 55 to 64 Years | 74 (33.5%) | 148 (67.0%) |
| 65 to 74 Years | 169 (98.8%) | 71 (41.5%) |
| 75 Years and over | 116 (100.0%) | 72 (62.1%) |
| Total | 789 (42.9%) | 1,166 (63.4%) |
Disability Status by Sex by Age in Mountain Lake
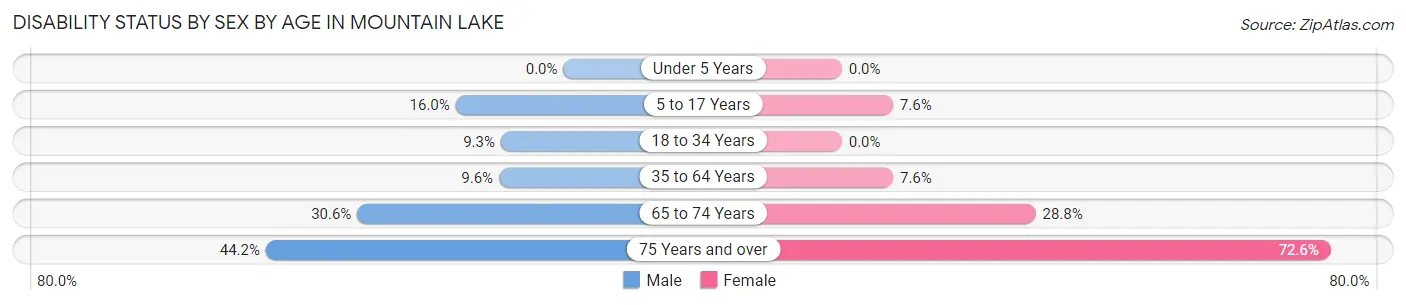
| Age Bracket | Male | Female |
| Under 5 Years | 0 (0.0%) | 0 (0.0%) |
| 5 to 17 Years | 36 (16.0%) | 17 (7.6%) |
| 18 to 34 Years | 13 (9.3%) | 0 (0.0%) |
| 35 to 64 Years | 24 (9.6%) | 27 (7.6%) |
| 65 to 74 Years | 30 (30.6%) | 21 (28.8%) |
| 75 Years and over | 19 (44.2%) | 53 (72.6%) |
Disability Class by Sex by Age in Mountain Lake
Disability Class: Hearing Difficulty
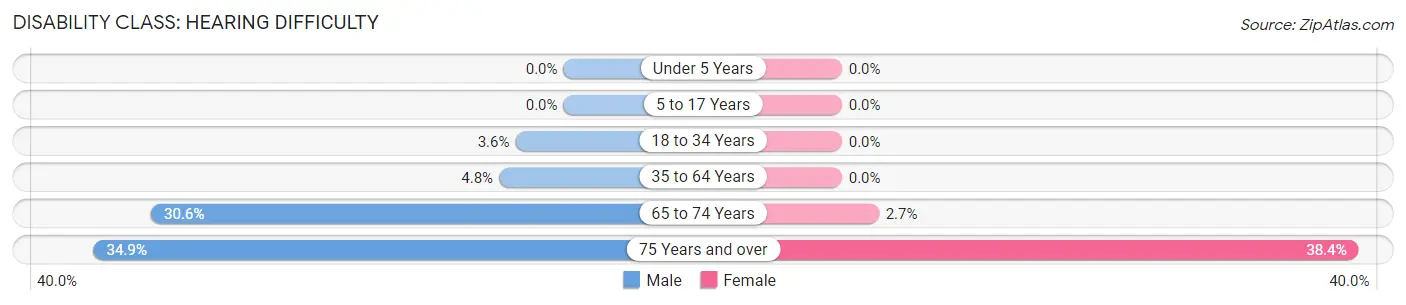
| Age Bracket | Male | Female |
| Under 5 Years | 0 (0.0%) | 0 (0.0%) |
| 5 to 17 Years | 0 (0.0%) | 0 (0.0%) |
| 18 to 34 Years | 5 (3.6%) | 0 (0.0%) |
| 35 to 64 Years | 12 (4.8%) | 0 (0.0%) |
| 65 to 74 Years | 30 (30.6%) | 2 (2.7%) |
| 75 Years and over | 15 (34.9%) | 28 (38.4%) |
Disability Class: Vision Difficulty
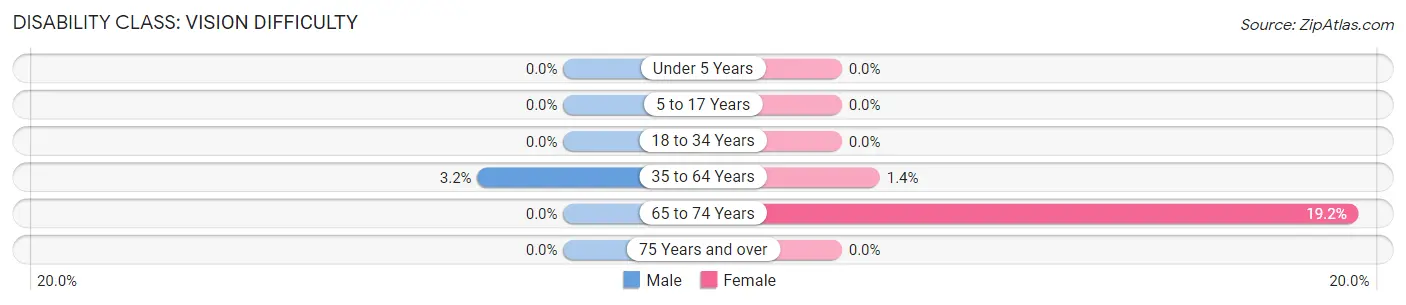
| Age Bracket | Male | Female |
| Under 5 Years | 0 (0.0%) | 0 (0.0%) |
| 5 to 17 Years | 0 (0.0%) | 0 (0.0%) |
| 18 to 34 Years | 0 (0.0%) | 0 (0.0%) |
| 35 to 64 Years | 8 (3.2%) | 5 (1.4%) |
| 65 to 74 Years | 0 (0.0%) | 14 (19.2%) |
| 75 Years and over | 0 (0.0%) | 0 (0.0%) |
Disability Class: Cognitive Difficulty
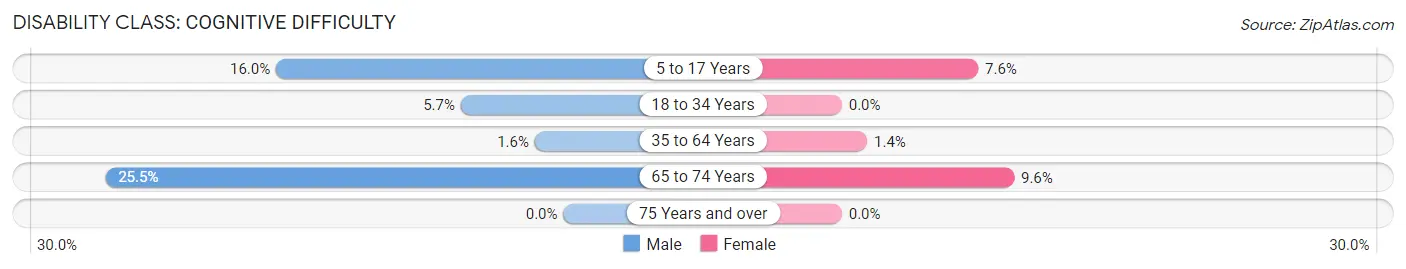
| Age Bracket | Male | Female |
| 5 to 17 Years | 36 (16.0%) | 17 (7.6%) |
| 18 to 34 Years | 8 (5.7%) | 0 (0.0%) |
| 35 to 64 Years | 4 (1.6%) | 5 (1.4%) |
| 65 to 74 Years | 25 (25.5%) | 7 (9.6%) |
| 75 Years and over | 0 (0.0%) | 0 (0.0%) |
Disability Class: Ambulatory Difficulty
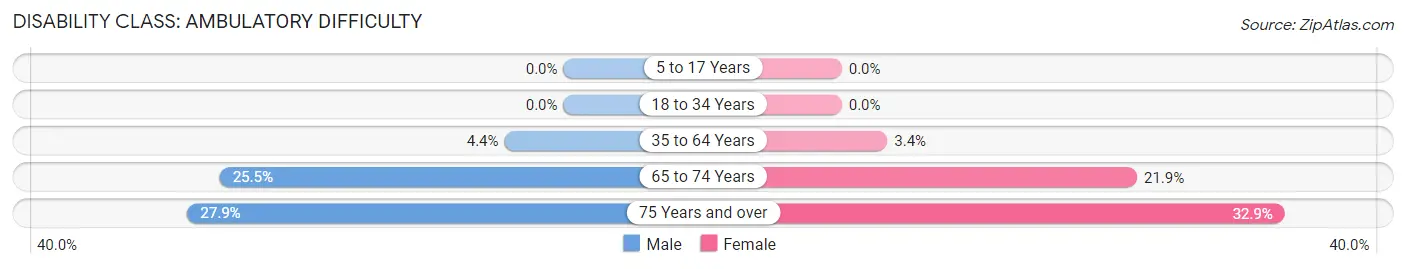
| Age Bracket | Male | Female |
| 5 to 17 Years | 0 (0.0%) | 0 (0.0%) |
| 18 to 34 Years | 0 (0.0%) | 0 (0.0%) |
| 35 to 64 Years | 11 (4.4%) | 12 (3.4%) |
| 65 to 74 Years | 25 (25.5%) | 16 (21.9%) |
| 75 Years and over | 12 (27.9%) | 24 (32.9%) |
Disability Class: Self-Care Difficulty
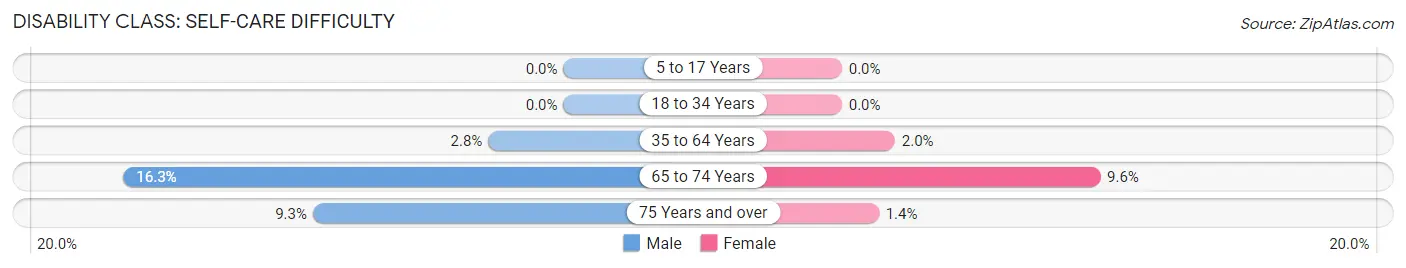
| Age Bracket | Male | Female |
| 5 to 17 Years | 0 (0.0%) | 0 (0.0%) |
| 18 to 34 Years | 0 (0.0%) | 0 (0.0%) |
| 35 to 64 Years | 7 (2.8%) | 7 (2.0%) |
| 65 to 74 Years | 16 (16.3%) | 7 (9.6%) |
| 75 Years and over | 4 (9.3%) | 1 (1.4%) |
Technology Access in Mountain Lake
Computing Device Access in Mountain Lake
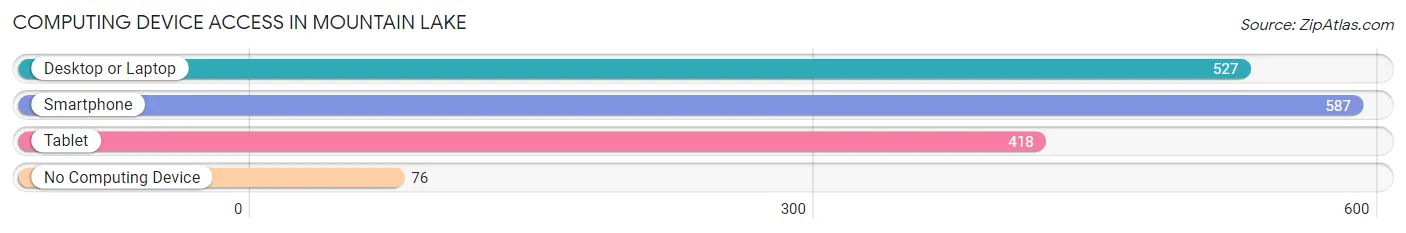
| Device Type | # Households | % Households |
| Desktop or Laptop | 527 | 73.4% |
| Smartphone | 587 | 81.8% |
| Tablet | 418 | 58.2% |
| No Computing Device | 76 | 10.6% |
| Total | 718 | 100.0% |
Internet Access in Mountain Lake
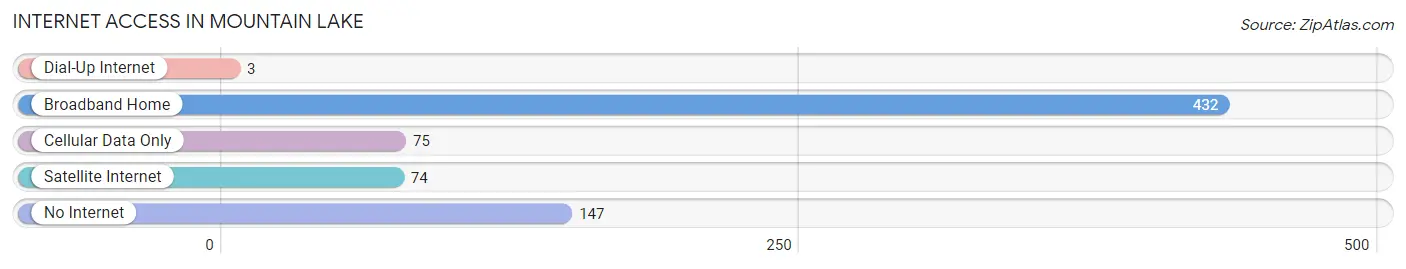
| Internet Type | # Households | % Households |
| Dial-Up Internet | 3 | 0.4% |
| Broadband Home | 432 | 60.2% |
| Cellular Data Only | 75 | 10.4% |
| Satellite Internet | 74 | 10.3% |
| No Internet | 147 | 20.5% |
| Total | 718 | 100.0% |
Mountain Lake Summary
Mountain Lake is a city in Cottonwood County, Minnesota, United States. The population was 2,104 at the 2010 census. It is the county seat of Cottonwood County.
History
Mountain Lake was founded in 1872 by a group of German immigrants. The city was named after the nearby lake of the same name. The lake was named by the Dakota Indians who lived in the area. The city was incorporated in 1887.
Geography
Mountain Lake is located at the intersection of U.S. Route 71 and Minnesota State Highway 60. The city is situated on the western edge of the Minnesota River Valley, and is surrounded by rolling hills and prairies. The city is located approximately 30 miles south of the city of Marshall, and about 50 miles west of the city of Mankato.
The city of Mountain Lake covers an area of 2.2 square miles, and has an elevation of 1,092 feet above sea level. The city is located in the Central Hardwood Forest ecoregion.
Economy
Mountain Lake is a small rural community with a diverse economy. The city is home to a variety of businesses, including manufacturing, retail, and service industries. The city is also home to a number of agricultural operations, including dairy farms, grain farms, and livestock operations.
The city is also home to a number of educational institutions, including the Mountain Lake Public School District, which serves students in grades K-12. The city is also home to a branch of the Minnesota State University system, which offers a variety of degree programs.
Demographics
As of the 2010 census, there were 2,104 people, 845 households, and 545 families residing in the city. The population density was 945.2 people per square mile. The racial makeup of the city was 97.2% White, 0.2% African American, 0.2% Native American, 0.4% Asian, 0.1% Pacific Islander, 0.7% from other races, and 1.2% from two or more races. Hispanic or Latino of any race were 1.7% of the population.
The median age in the city was 41.2 years. 22.3% of residents were under the age of 18; 8.2% were between the ages of 18 and 24; 22.7% were from 25 to 44; 28.2% were from 45 to 64; and 18.6% were 65 years of age or older. The gender makeup of the city was 49.2% male and 50.8% female.
The median income for a household in the city was $41,964, and the median income for a family was $50,938. The per capita income for the city was $20,945. About 8.2% of families and 11.2% of the population were below the poverty line, including 16.2% of those under age 18 and 8.2% of those age 65 or over.
Common Questions
What is Per Capita Income in Mountain Lake?
Per Capita income in Mountain Lake is $25,038.
What is the Median Family Income in Mountain Lake?
Median Family Income in Mountain Lake is $71,964.
What is the Median Household income in Mountain Lake?
Median Household Income in Mountain Lake is $54,107.
What is Income or Wage Gap in Mountain Lake?
Income or Wage Gap in Mountain Lake is 38.4%.
Women in Mountain Lake earn 61.6 cents for every dollar earned by a man.
What is Family Income Deficit in Mountain Lake?
Family Income Deficit in Mountain Lake is $6,510.
Families that are below poverty line in Mountain Lake earn $6,510 less on average than the poverty threshold level.
What is Inequality or Gini Index in Mountain Lake?
Inequality or Gini Index in Mountain Lake is 0.39.
What is the Total Population of Mountain Lake?
Total Population of Mountain Lake is 1,900.
What is the Total Male Population of Mountain Lake?
Total Male Population of Mountain Lake is 848.
What is the Total Female Population of Mountain Lake?
Total Female Population of Mountain Lake is 1,052.
What is the Ratio of Males per 100 Females in Mountain Lake?
There are 80.61 Males per 100 Females in Mountain Lake.
What is the Ratio of Females per 100 Males in Mountain Lake?
There are 124.06 Females per 100 Males in Mountain Lake.
What is the Median Population Age in Mountain Lake?
Median Population Age in Mountain Lake is 35.4 Years.
What is the Average Family Size in Mountain Lake
Average Family Size in Mountain Lake is 3.1 People.
What is the Average Household Size in Mountain Lake
Average Household Size in Mountain Lake is 2.6 People.
How Large is the Labor Force in Mountain Lake?
There are 871 People in the Labor Forcein in Mountain Lake.
What is the Percentage of People in the Labor Force in Mountain Lake?
61.1% of People are in the Labor Force in Mountain Lake.
What is the Unemployment Rate in Mountain Lake?
Unemployment Rate in Mountain Lake is 5.6%.