Morton, MN Map & Demographics
Morton Map
Morton Overview
$28,426
PER CAPITA INCOME
$79,904
AVG FAMILY INCOME
$62,083
AVG HOUSEHOLD INCOME
5.5%
WAGE / INCOME GAP [ % ]
94.5¢/ $1
WAGE / INCOME GAP [ $ ]
0.33
INEQUALITY / GINI INDEX
370
TOTAL POPULATION
194
MALE POPULATION
176
FEMALE POPULATION
110.23
MALES / 100 FEMALES
90.72
FEMALES / 100 MALES
42.0
MEDIAN AGE
3.2
AVG FAMILY SIZE
2.5
AVG HOUSEHOLD SIZE
176
LABOR FORCE [ PEOPLE ]
57.5%
PERCENT IN LABOR FORCE
1.1%
UNEMPLOYMENT RATE
Morton Zip Codes
Morton Area Codes
Income in Morton
Income Overview in Morton
Per Capita Income in Morton is $28,426, while median incomes of families and households are $79,904 and $62,083 respectively.
| Characteristic | Number | Measure |
| Per Capita Income | 370 | $28,426 |
| Median Family Income | 83 | $79,904 |
| Mean Family Income | 83 | $82,734 |
| Median Household Income | 148 | $62,083 |
| Mean Household Income | 148 | $66,350 |
| Income Deficit | 83 | $0 |
| Wage / Income Gap (%) | 370 | 5.54% |
| Wage / Income Gap ($) | 370 | 94.46¢ per $1 |
| Gini / Inequality Index | 370 | 0.33 |
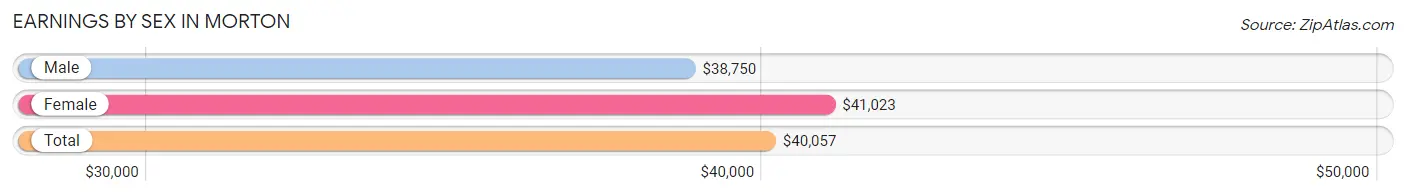
Earnings by Sex in Morton
Average Earnings in Morton are $40,057, $38,750 for men and $41,023 for women, a difference of 5.5%.
| Sex | Number | Average Earnings |
| Male | 106 (52.7%) | $38,750 |
| Female | 95 (47.3%) | $41,023 |
| Total | 201 (100.0%) | $40,057 |
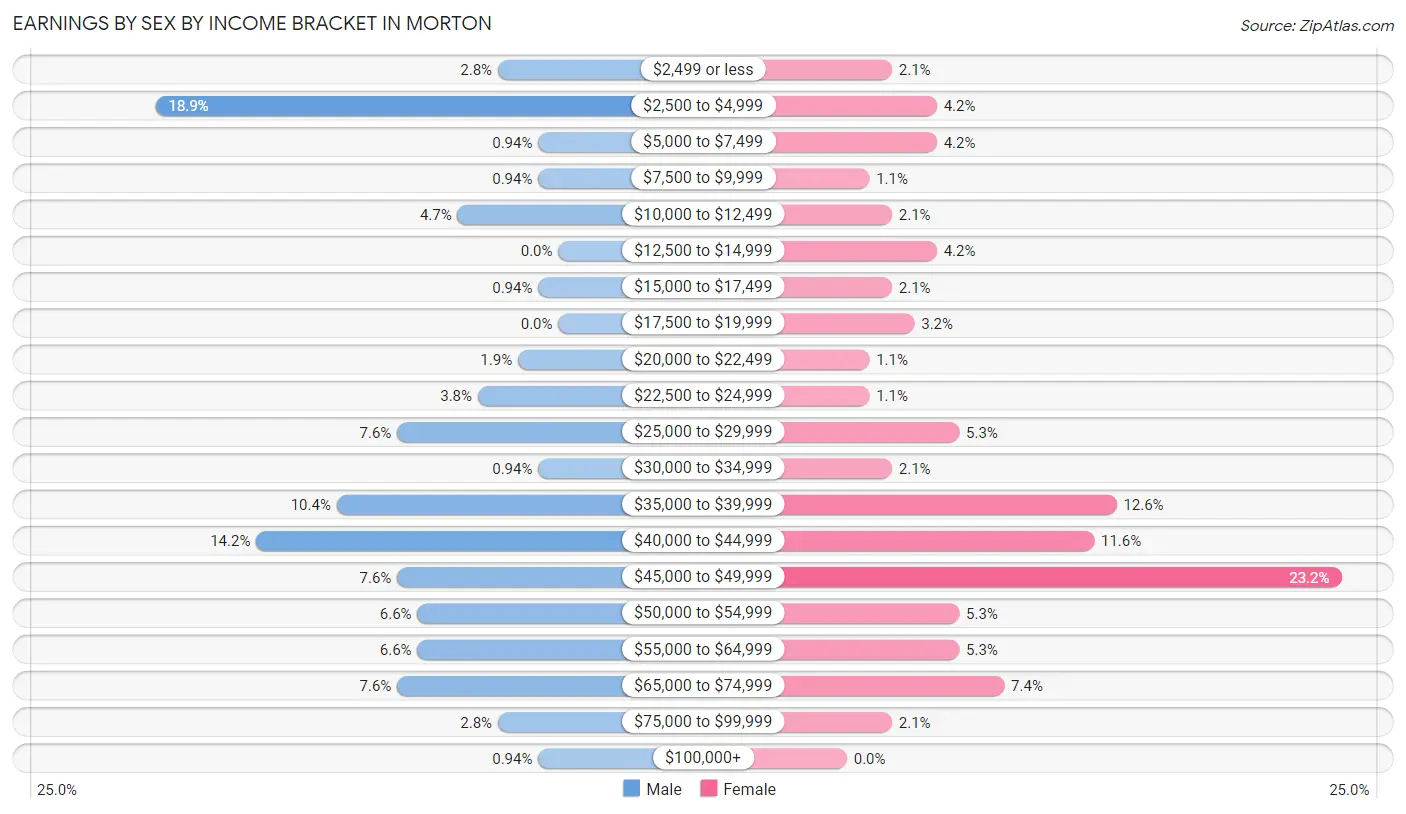
Earnings by Sex by Income Bracket in Morton
The most common earnings brackets in Morton are $2,500 to $4,999 for men (20 | 18.9%) and $45,000 to $49,999 for women (22 | 23.2%).
| Income | Male | Female |
| $2,499 or less | 3 (2.8%) | 2 (2.1%) |
| $2,500 to $4,999 | 20 (18.9%) | 4 (4.2%) |
| $5,000 to $7,499 | 1 (0.9%) | 4 (4.2%) |
| $7,500 to $9,999 | 1 (0.9%) | 1 (1.1%) |
| $10,000 to $12,499 | 5 (4.7%) | 2 (2.1%) |
| $12,500 to $14,999 | 0 (0.0%) | 4 (4.2%) |
| $15,000 to $17,499 | 1 (0.9%) | 2 (2.1%) |
| $17,500 to $19,999 | 0 (0.0%) | 3 (3.2%) |
| $20,000 to $22,499 | 2 (1.9%) | 1 (1.1%) |
| $22,500 to $24,999 | 4 (3.8%) | 1 (1.1%) |
| $25,000 to $29,999 | 8 (7.5%) | 5 (5.3%) |
| $30,000 to $34,999 | 1 (0.9%) | 2 (2.1%) |
| $35,000 to $39,999 | 11 (10.4%) | 12 (12.6%) |
| $40,000 to $44,999 | 15 (14.1%) | 11 (11.6%) |
| $45,000 to $49,999 | 8 (7.5%) | 22 (23.2%) |
| $50,000 to $54,999 | 7 (6.6%) | 5 (5.3%) |
| $55,000 to $64,999 | 7 (6.6%) | 5 (5.3%) |
| $65,000 to $74,999 | 8 (7.5%) | 7 (7.4%) |
| $75,000 to $99,999 | 3 (2.8%) | 2 (2.1%) |
| $100,000+ | 1 (0.9%) | 0 (0.0%) |
| Total | 106 (100.0%) | 95 (100.0%) |
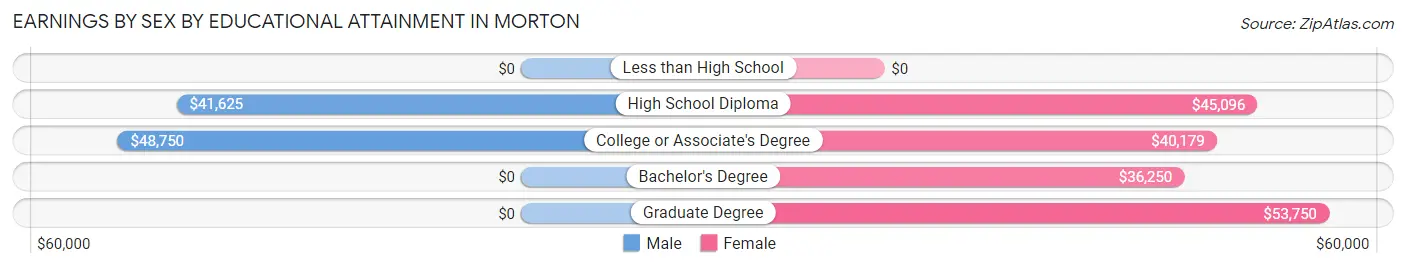
Earnings by Sex by Educational Attainment in Morton
Average earnings in Morton are $41,705 for men and $41,818 for women, a difference of 0.3%. Men with an educational attainment of college or associate's degree enjoy the highest average annual earnings of $48,750, while those with high school diploma education earn the least with $41,625. Women with an educational attainment of graduate degree earn the most with the average annual earnings of $53,750, while those with bachelor's degree education have the smallest earnings of $36,250.
| Educational Attainment | Male Income | Female Income |
| Less than High School | - | - |
| High School Diploma | $41,625 | $45,096 |
| College or Associate's Degree | $48,750 | $40,179 |
| Bachelor's Degree | - | - |
| Graduate Degree | - | - |
| Total | $41,705 | $41,818 |
Family Income in Morton
Family Income Brackets in Morton
According to the Morton family income data, there are 37 families falling into the $75,000 to $99,999 income range, which is the most common income bracket and makes up 44.6% of all families. Conversely, the $25,000 to $34,999 income bracket is the least frequent group with only 1 families (1.2%) belonging to this category.
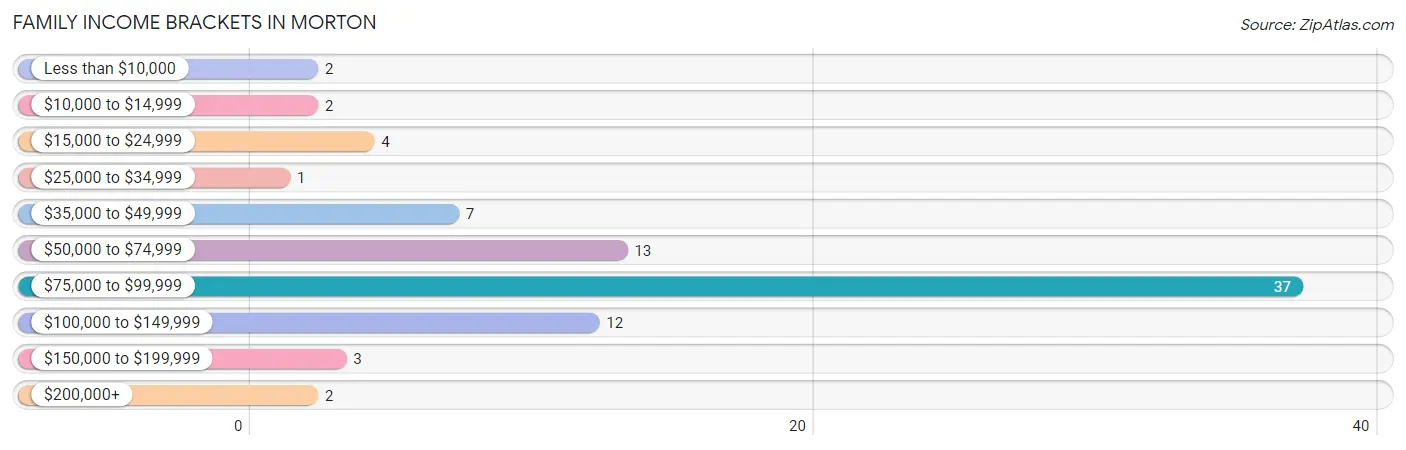
| Income Bracket | # Families | % Families |
| Less than $10,000 | 2 | 2.4% |
| $10,000 to $14,999 | 2 | 2.4% |
| $15,000 to $24,999 | 4 | 4.8% |
| $25,000 to $34,999 | 1 | 1.2% |
| $35,000 to $49,999 | 7 | 8.4% |
| $50,000 to $74,999 | 13 | 15.7% |
| $75,000 to $99,999 | 37 | 44.6% |
| $100,000 to $149,999 | 12 | 14.5% |
| $150,000 to $199,999 | 3 | 3.6% |
| $200,000+ | 2 | 2.4% |
Family Income by Famaliy Size in Morton
5-person families (7 | 8.4%) account for the highest median family income in Morton with $126,250 per family, while 2-person families (39 | 47.0%) have the highest median income of $38,840 per family member.
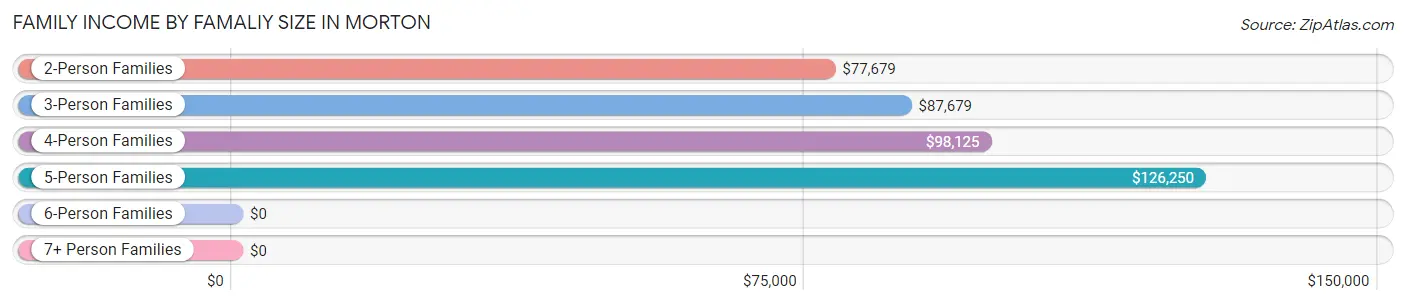
| Income Bracket | # Families | Median Income |
| 2-Person Families | 39 (47.0%) | $77,679 |
| 3-Person Families | 25 (30.1%) | $87,679 |
| 4-Person Families | 10 (12.0%) | $98,125 |
| 5-Person Families | 7 (8.4%) | $126,250 |
| 6-Person Families | 0 (0.0%) | $0 |
| 7+ Person Families | 2 (2.4%) | $0 |
| Total | 83 (100.0%) | $79,904 |
Family Income by Number of Earners in Morton
The median family income in Morton is $79,904, with families comprising 3+ earners (13) having the highest median family income of $89,821, while families with 1 earner (22) have the lowest median family income of $63,750, accounting for 15.7% and 26.5% of families, respectively.
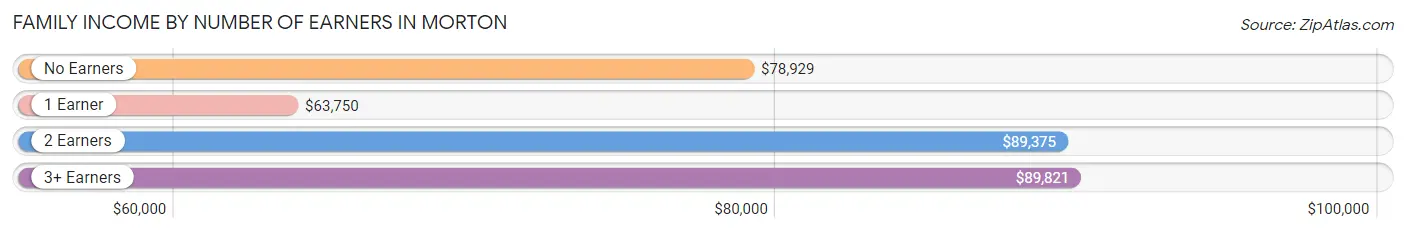
| Number of Earners | # Families | Median Income |
| No Earners | 18 (21.7%) | $78,929 |
| 1 Earner | 22 (26.5%) | $63,750 |
| 2 Earners | 30 (36.1%) | $89,375 |
| 3+ Earners | 13 (15.7%) | $89,821 |
| Total | 83 (100.0%) | $79,904 |
Household Income in Morton
Household Income Brackets in Morton
With 41 households falling in the category, the $75,000 to $99,999 income range is the most frequent in Morton, accounting for 27.7% of all households. In contrast, only 2 households (1.3%) fall into the $200,000+ income bracket, making it the least populous group.
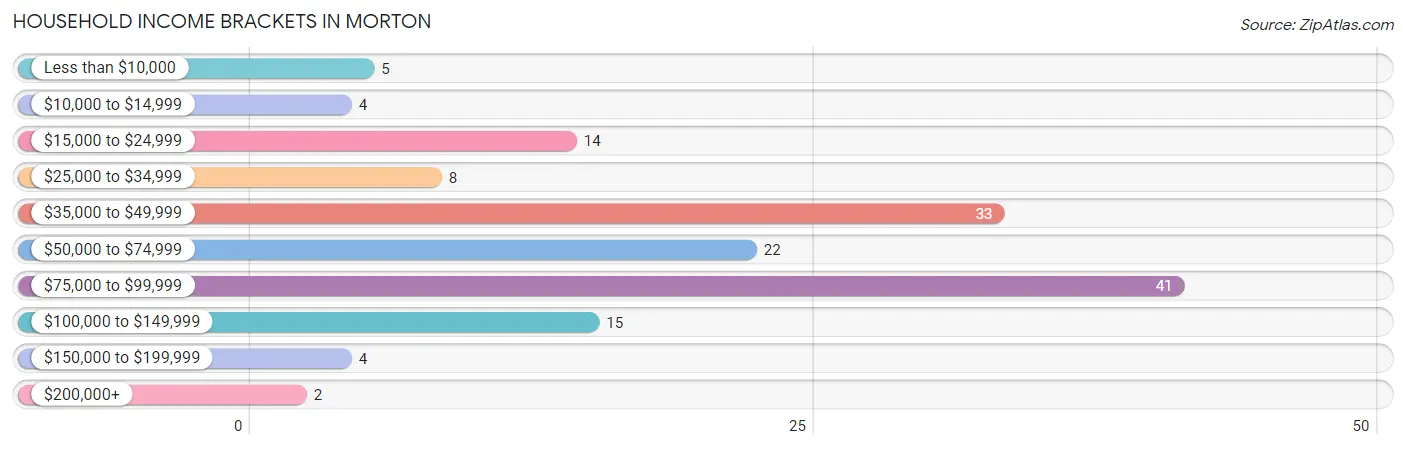
| Income Bracket | # Households | % Households |
| Less than $10,000 | 5 | 3.4% |
| $10,000 to $14,999 | 4 | 2.7% |
| $15,000 to $24,999 | 14 | 9.5% |
| $25,000 to $34,999 | 8 | 5.4% |
| $35,000 to $49,999 | 33 | 22.3% |
| $50,000 to $74,999 | 22 | 14.9% |
| $75,000 to $99,999 | 41 | 27.7% |
| $100,000 to $149,999 | 15 | 10.1% |
| $150,000 to $199,999 | 4 | 2.7% |
| $200,000+ | 2 | 1.4% |
Household Income by Householder Age in Morton
The median household income in Morton is $62,083, with the highest median household income of $78,750 found in the 25 to 44 years age bracket for the primary householder. A total of 43 households (29.0%) fall into this category. Meanwhile, the 15 to 24 years age bracket for the primary householder has the lowest median household income of $0, with 2 households (1.3%) in this group.
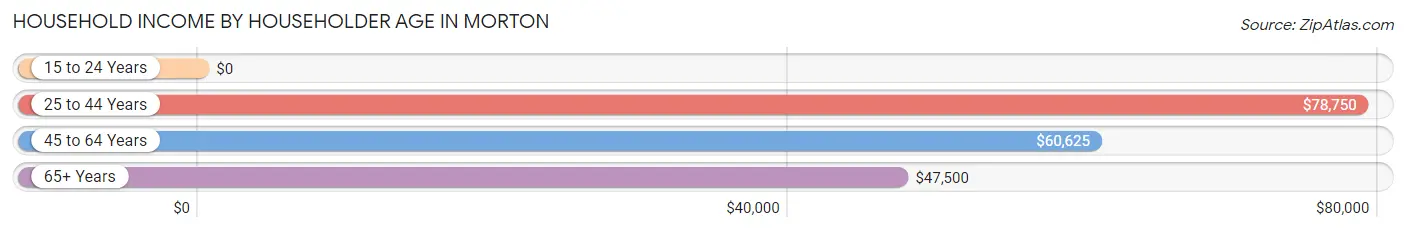
| Income Bracket | # Households | Median Income |
| 15 to 24 Years | 2 (1.3%) | $0 |
| 25 to 44 Years | 43 (29.0%) | $78,750 |
| 45 to 64 Years | 55 (37.2%) | $60,625 |
| 65+ Years | 48 (32.4%) | $47,500 |
| Total | 148 (100.0%) | $62,083 |
Poverty in Morton
Income Below Poverty by Sex and Age in Morton
With 9.3% poverty level for males and 8.0% for females among the residents of Morton, 55 to 64 year old males and 18 to 24 year old females are the most vulnerable to poverty, with 14 males (37.8%) and 3 females (37.5%) in their respective age groups living below the poverty level.
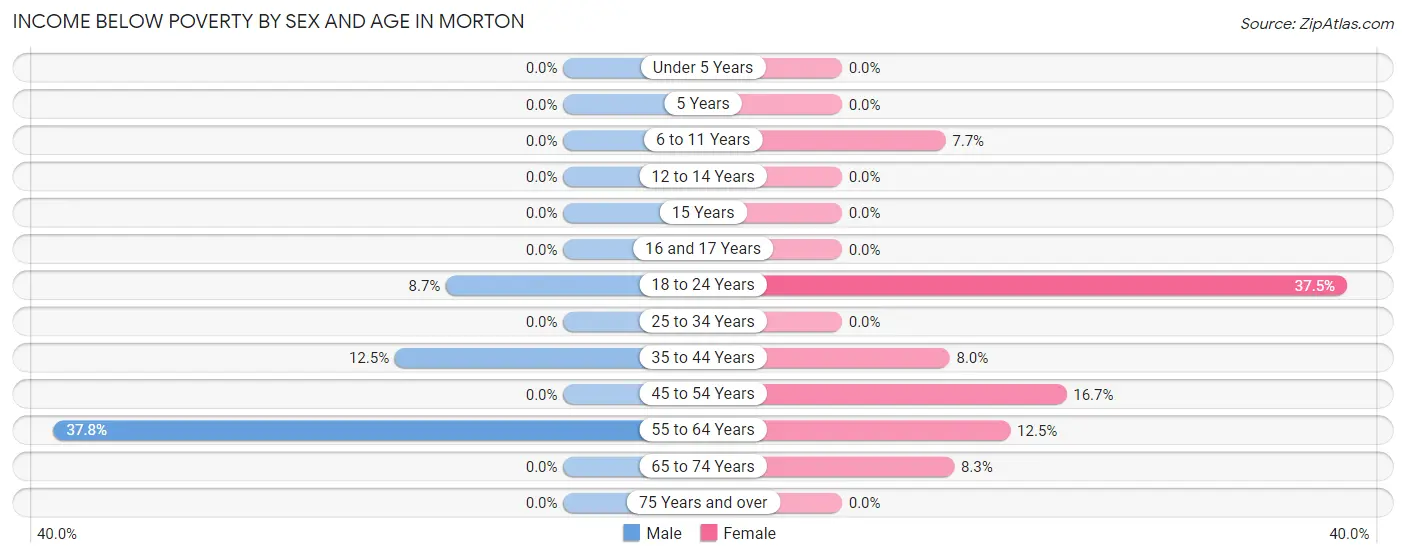
| Age Bracket | Male | Female |
| Under 5 Years | 0 (0.0%) | 0 (0.0%) |
| 5 Years | 0 (0.0%) | 0 (0.0%) |
| 6 to 11 Years | 0 (0.0%) | 1 (7.7%) |
| 12 to 14 Years | 0 (0.0%) | 0 (0.0%) |
| 15 Years | 0 (0.0%) | 0 (0.0%) |
| 16 and 17 Years | 0 (0.0%) | 0 (0.0%) |
| 18 to 24 Years | 2 (8.7%) | 3 (37.5%) |
| 25 to 34 Years | 0 (0.0%) | 0 (0.0%) |
| 35 to 44 Years | 2 (12.5%) | 2 (8.0%) |
| 45 to 54 Years | 0 (0.0%) | 2 (16.7%) |
| 55 to 64 Years | 14 (37.8%) | 3 (12.5%) |
| 65 to 74 Years | 0 (0.0%) | 2 (8.3%) |
| 75 Years and over | 0 (0.0%) | 0 (0.0%) |
| Total | 18 (9.3%) | 13 (8.0%) |
Income Above Poverty by Sex and Age in Morton
According to the poverty statistics in Morton, males aged under 5 years and females aged under 5 years are the age groups that are most secure financially, with 100.0% of males and 100.0% of females in these age groups living above the poverty line.
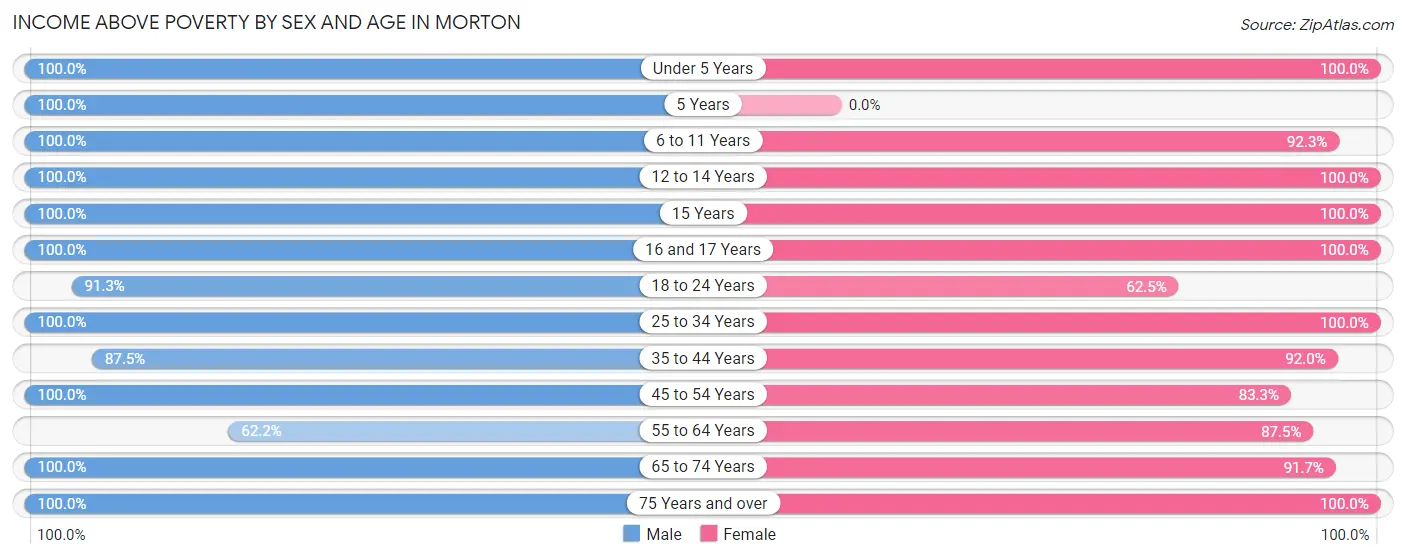
| Age Bracket | Male | Female |
| Under 5 Years | 8 (100.0%) | 7 (100.0%) |
| 5 Years | 5 (100.0%) | 0 (0.0%) |
| 6 to 11 Years | 9 (100.0%) | 12 (92.3%) |
| 12 to 14 Years | 3 (100.0%) | 2 (100.0%) |
| 15 Years | 1 (100.0%) | 2 (100.0%) |
| 16 and 17 Years | 6 (100.0%) | 4 (100.0%) |
| 18 to 24 Years | 21 (91.3%) | 5 (62.5%) |
| 25 to 34 Years | 17 (100.0%) | 28 (100.0%) |
| 35 to 44 Years | 14 (87.5%) | 23 (92.0%) |
| 45 to 54 Years | 28 (100.0%) | 10 (83.3%) |
| 55 to 64 Years | 23 (62.2%) | 21 (87.5%) |
| 65 to 74 Years | 32 (100.0%) | 22 (91.7%) |
| 75 Years and over | 9 (100.0%) | 13 (100.0%) |
| Total | 176 (90.7%) | 149 (92.0%) |
Income Below Poverty Among Married-Couple Families in Morton
The poverty statistics for married-couple families in Morton show that 5.8% or 4 of the total 69 families live below the poverty line. Families with no children have the highest poverty rate of 9.1%, comprising of 4 families. On the other hand, families with 1 or 2 children have the lowest poverty rate of 0.0%, which includes 0 families.
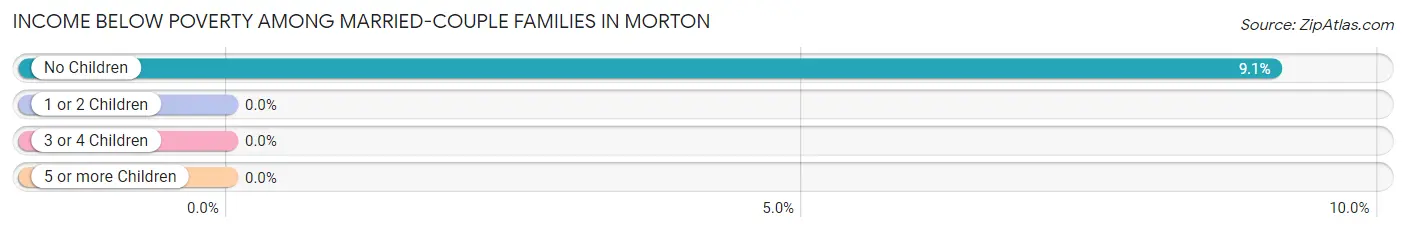
| Children | Above Poverty | Below Poverty |
| No Children | 40 (90.9%) | 4 (9.1%) |
| 1 or 2 Children | 22 (100.0%) | 0 (0.0%) |
| 3 or 4 Children | 3 (100.0%) | 0 (0.0%) |
| 5 or more Children | 0 (0.0%) | 0 (0.0%) |
| Total | 65 (94.2%) | 4 (5.8%) |
Income Below Poverty Among Single-Parent Households in Morton
According to the poverty data in Morton, 14.3% or 1 single-father households and 28.6% or 2 single-mother households are living below the poverty line. Among single-father households, those with no children have the highest poverty rate, with 1 households (25.0%) experiencing poverty. Likewise, among single-mother households, those with 1 or 2 children have the highest poverty rate, with 2 households (28.6%) falling below the poverty line.
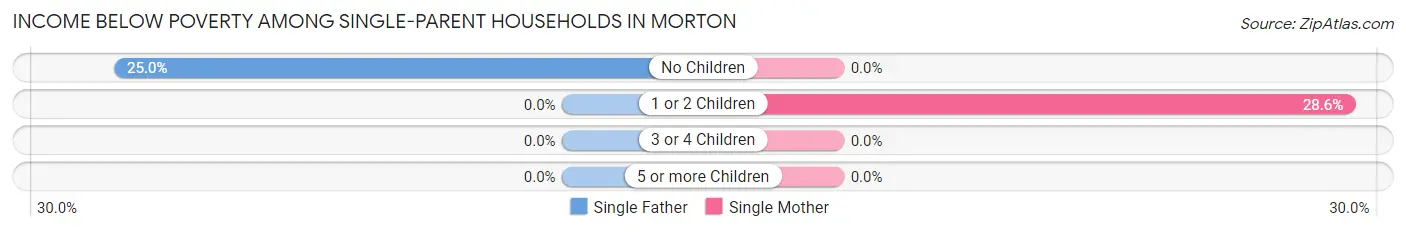
| Children | Single Father | Single Mother |
| No Children | 1 (25.0%) | 0 (0.0%) |
| 1 or 2 Children | 0 (0.0%) | 2 (28.6%) |
| 3 or 4 Children | 0 (0.0%) | 0 (0.0%) |
| 5 or more Children | 0 (0.0%) | 0 (0.0%) |
| Total | 1 (14.3%) | 2 (28.6%) |
Income Below Poverty Among Married-Couple vs Single-Parent Households in Morton
The poverty data for Morton shows that 4 of the married-couple family households (5.8%) and 3 of the single-parent households (21.4%) are living below the poverty level. Within the married-couple family households, those with no children have the highest poverty rate, with 4 households (9.1%) falling below the poverty line. Among the single-parent households, those with no children have the highest poverty rate, with 1 household (25.0%) living below poverty.
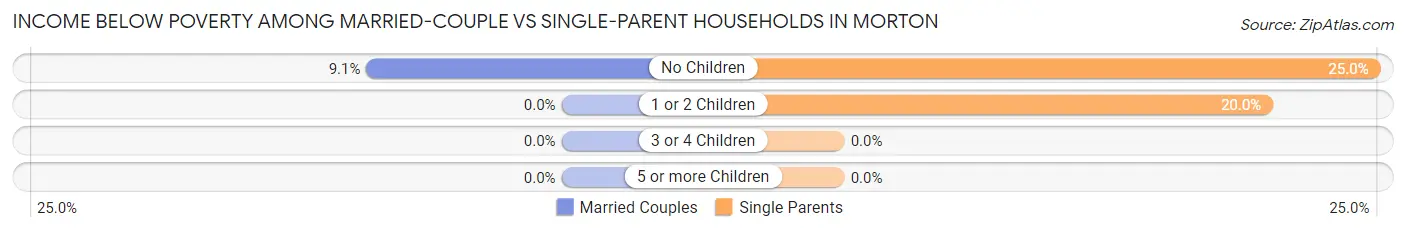
| Children | Married-Couple Families | Single-Parent Households |
| No Children | 4 (9.1%) | 1 (25.0%) |
| 1 or 2 Children | 0 (0.0%) | 2 (20.0%) |
| 3 or 4 Children | 0 (0.0%) | 0 (0.0%) |
| 5 or more Children | 0 (0.0%) | 0 (0.0%) |
| Total | 4 (5.8%) | 3 (21.4%) |
Race in Morton
The most populous races in Morton are White / Caucasian (321 | 86.8%), Native / Alaskan (18 | 4.9%), and Asian (13 | 3.5%).
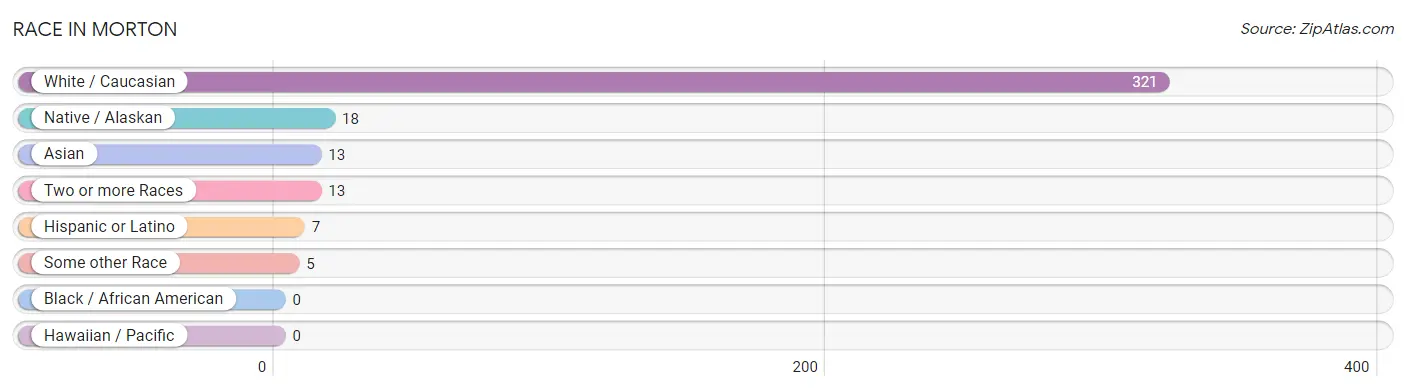
| Race | # Population | % Population |
| Asian | 13 | 3.5% |
| Black / African American | 0 | 0.0% |
| Hawaiian / Pacific | 0 | 0.0% |
| Hispanic or Latino | 7 | 1.9% |
| Native / Alaskan | 18 | 4.9% |
| White / Caucasian | 321 | 86.8% |
| Two or more Races | 13 | 3.5% |
| Some other Race | 5 | 1.3% |
| Total | 370 | 100.0% |
Ancestry in Morton
The most populous ancestries reported in Morton are German (187 | 50.5%), Norwegian (60 | 16.2%), Irish (43 | 11.6%), Czech (24 | 6.5%), and Sioux (17 | 4.6%), together accounting for 89.5% of all Morton residents.
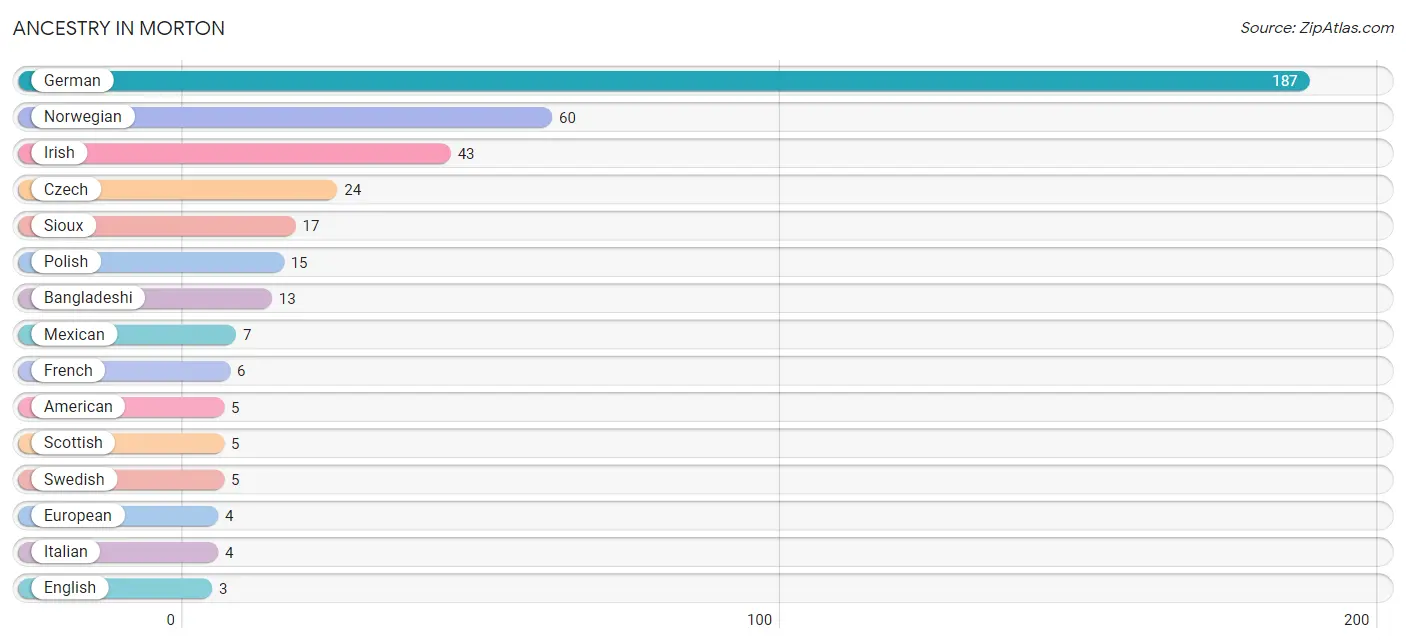
| Ancestry | # Population | % Population |
| American | 5 | 1.3% |
| Austrian | 1 | 0.3% |
| Bangladeshi | 13 | 3.5% |
| Burmese | 2 | 0.5% |
| Cherokee | 1 | 0.3% |
| Czech | 24 | 6.5% |
| Dutch | 1 | 0.3% |
| Eastern European | 1 | 0.3% |
| English | 3 | 0.8% |
| European | 4 | 1.1% |
| French | 6 | 1.6% |
| German | 187 | 50.5% |
| Irish | 43 | 11.6% |
| Italian | 4 | 1.1% |
| Korean | 1 | 0.3% |
| Mexican | 7 | 1.9% |
| Norwegian | 60 | 16.2% |
| Polish | 15 | 4.1% |
| Scottish | 5 | 1.3% |
| Sioux | 17 | 4.6% |
| Swedish | 5 | 1.3% | View All 21 Rows |
Immigrants in Morton
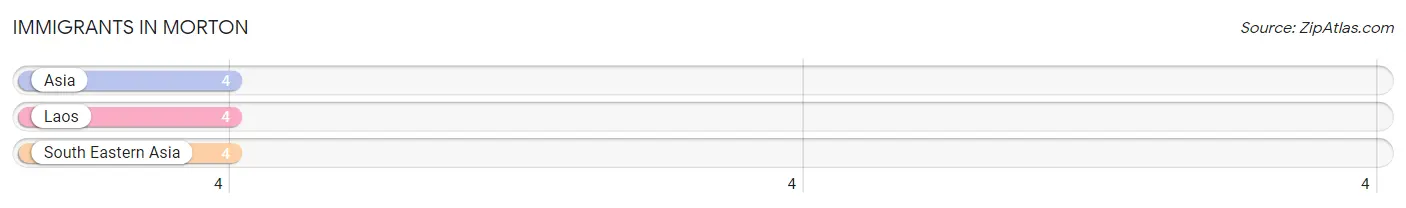
The most numerous immigrant groups reported in Morton came from Asia (4 | 1.1%), Laos (4 | 1.1%), and South Eastern Asia (4 | 1.1%), together accounting for 3.2% of all Morton residents.
| Immigration Origin | # Population | % Population |
| Asia | 4 | 1.1% |
| Laos | 4 | 1.1% |
| South Eastern Asia | 4 | 1.1% | View All 3 Rows |
Sex and Age in Morton
Sex and Age in Morton
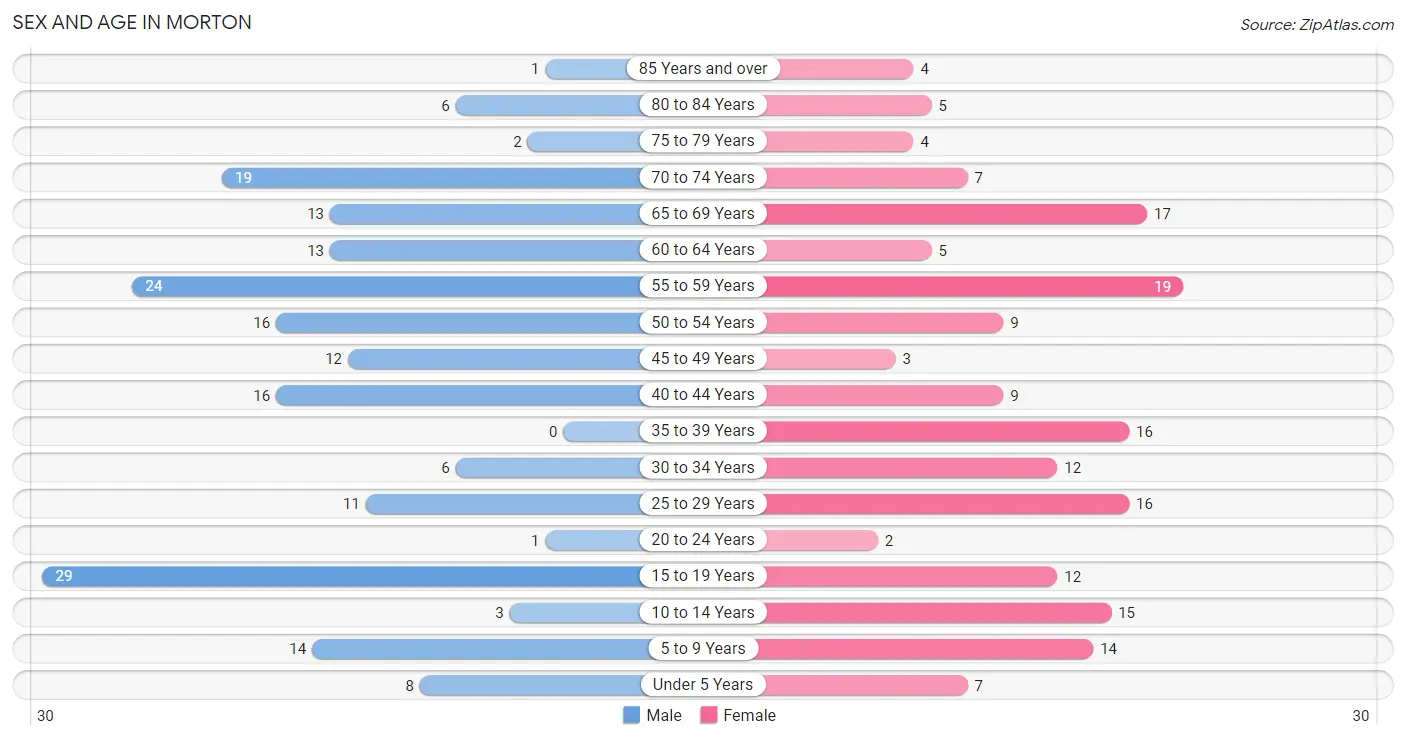
The most populous age groups in Morton are 15 to 19 Years (29 | 14.9%) for men and 55 to 59 Years (19 | 10.8%) for women.
| Age Bracket | Male | Female |
| Under 5 Years | 8 (4.1%) | 7 (4.0%) |
| 5 to 9 Years | 14 (7.2%) | 14 (8.0%) |
| 10 to 14 Years | 3 (1.5%) | 15 (8.5%) |
| 15 to 19 Years | 29 (14.9%) | 12 (6.8%) |
| 20 to 24 Years | 1 (0.5%) | 2 (1.1%) |
| 25 to 29 Years | 11 (5.7%) | 16 (9.1%) |
| 30 to 34 Years | 6 (3.1%) | 12 (6.8%) |
| 35 to 39 Years | 0 (0.0%) | 16 (9.1%) |
| 40 to 44 Years | 16 (8.3%) | 9 (5.1%) |
| 45 to 49 Years | 12 (6.2%) | 3 (1.7%) |
| 50 to 54 Years | 16 (8.3%) | 9 (5.1%) |
| 55 to 59 Years | 24 (12.4%) | 19 (10.8%) |
| 60 to 64 Years | 13 (6.7%) | 5 (2.8%) |
| 65 to 69 Years | 13 (6.7%) | 17 (9.7%) |
| 70 to 74 Years | 19 (9.8%) | 7 (4.0%) |
| 75 to 79 Years | 2 (1.0%) | 4 (2.3%) |
| 80 to 84 Years | 6 (3.1%) | 5 (2.8%) |
| 85 Years and over | 1 (0.5%) | 4 (2.3%) |
| Total | 194 (100.0%) | 176 (100.0%) |
Families and Households in Morton
Median Family Size in Morton
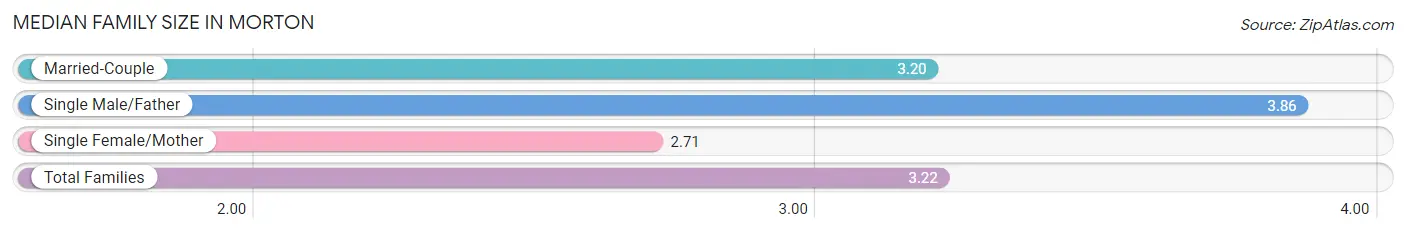
The median family size in Morton is 3.22 persons per family, with single male/father families (7 | 8.4%) accounting for the largest median family size of 3.86 persons per family. On the other hand, single female/mother families (7 | 8.4%) represent the smallest median family size with 2.71 persons per family.
| Family Type | # Families | Family Size |
| Married-Couple | 69 (83.1%) | 3.20 |
| Single Male/Father | 7 (8.4%) | 3.86 |
| Single Female/Mother | 7 (8.4%) | 2.71 |
| Total Families | 83 (100.0%) | 3.22 |
Median Household Size in Morton
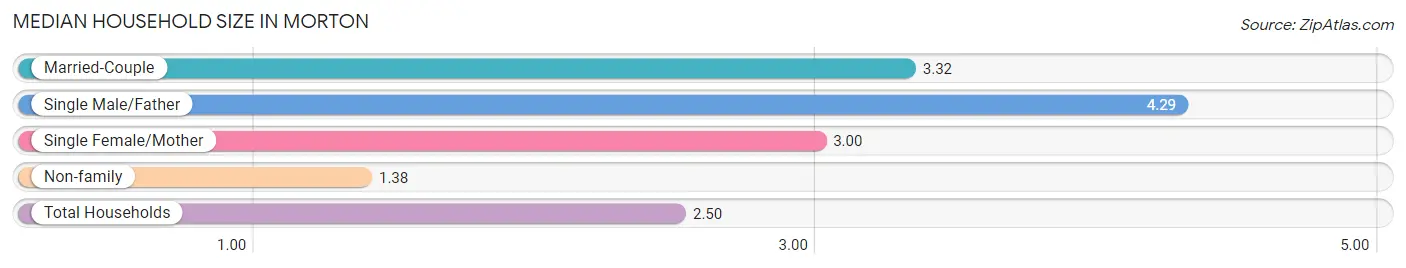
The median household size in Morton is 2.50 persons per household, with single male/father households (7 | 4.7%) accounting for the largest median household size of 4.29 persons per household. non-family households (65 | 43.9%) represent the smallest median household size with 1.38 persons per household.
| Household Type | # Households | Household Size |
| Married-Couple | 69 (46.6%) | 3.32 |
| Single Male/Father | 7 (4.7%) | 4.29 |
| Single Female/Mother | 7 (4.7%) | 3.00 |
| Non-family | 65 (43.9%) | 1.38 |
| Total Households | 148 (100.0%) | 2.50 |
Household Size by Marriage Status in Morton
Out of a total of 148 households in Morton, 83 (56.1%) are family households, while 65 (43.9%) are nonfamily households. The most numerous type of family households are 2-person households, comprising 37, and the most common type of nonfamily households are 1-person households, comprising 52.
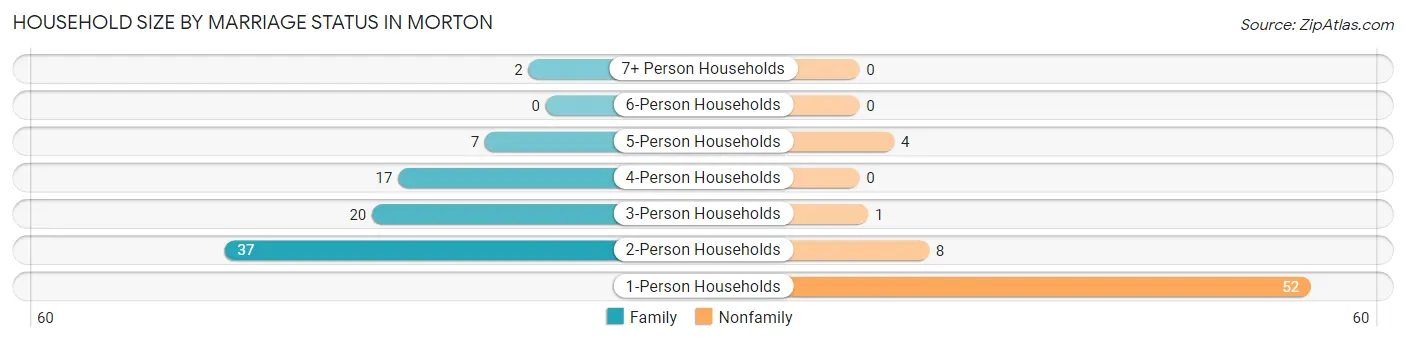
| Household Size | Family Households | Nonfamily Households |
| 1-Person Households | - | 52 (35.1%) |
| 2-Person Households | 37 (25.0%) | 8 (5.4%) |
| 3-Person Households | 20 (13.5%) | 1 (0.7%) |
| 4-Person Households | 17 (11.5%) | 0 (0.0%) |
| 5-Person Households | 7 (4.7%) | 4 (2.7%) |
| 6-Person Households | 0 (0.0%) | 0 (0.0%) |
| 7+ Person Households | 2 (1.3%) | 0 (0.0%) |
| Total | 83 (56.1%) | 65 (43.9%) |
Female Fertility in Morton
Fertility by Age in Morton
Average fertility rate in Morton is 111.0 births per 1,000 women. Women in the age bracket of 20 to 34 years have the highest fertility rate with 233.0 births per 1,000 women. Women in the age bracket of 20 to 34 years acount for 87.5% of all women with births.
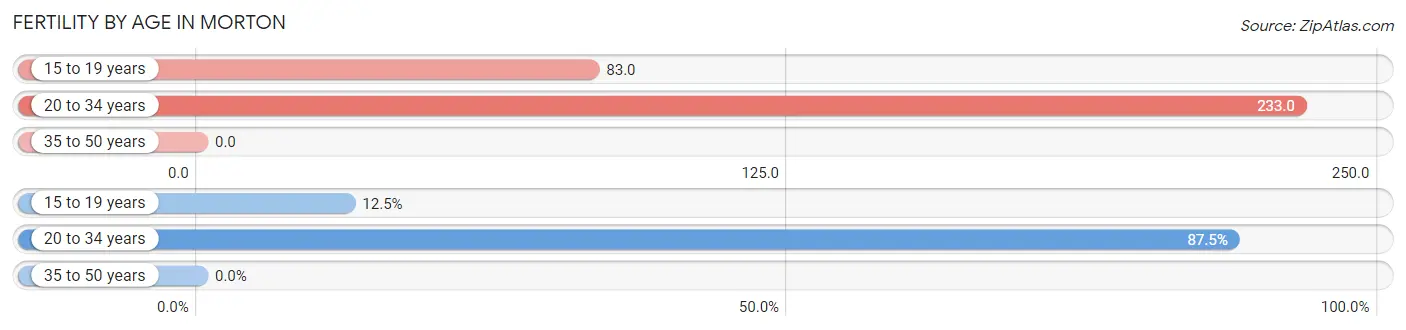
| Age Bracket | Women with Births | Births / 1,000 Women |
| 15 to 19 years | 1 (12.5%) | 83.0 |
| 20 to 34 years | 7 (87.5%) | 233.0 |
| 35 to 50 years | 0 (0.0%) | 0.0 |
| Total | 8 (100.0%) | 111.0 |
Fertility by Age by Marriage Status in Morton
62.5% of women with births (8) in Morton are married. The highest percentage of unmarried women with births falls into 15 to 19 years age bracket with 100.0% of them unmarried at the time of birth, while the lowest percentage of unmarried women with births belong to 20 to 34 years age bracket with 28.6% of them unmarried.
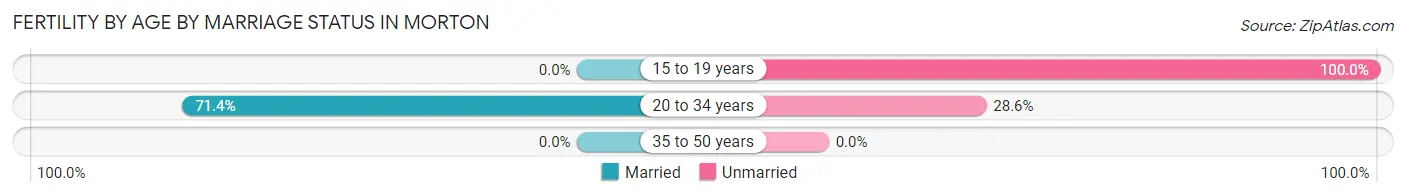
| Age Bracket | Married | Unmarried |
| 15 to 19 years | 0 (0.0%) | 1 (100.0%) |
| 20 to 34 years | 5 (71.4%) | 2 (28.6%) |
| 35 to 50 years | 0 (0.0%) | 0 (0.0%) |
| Total | 5 (62.5%) | 3 (37.5%) |
Fertility by Education in Morton
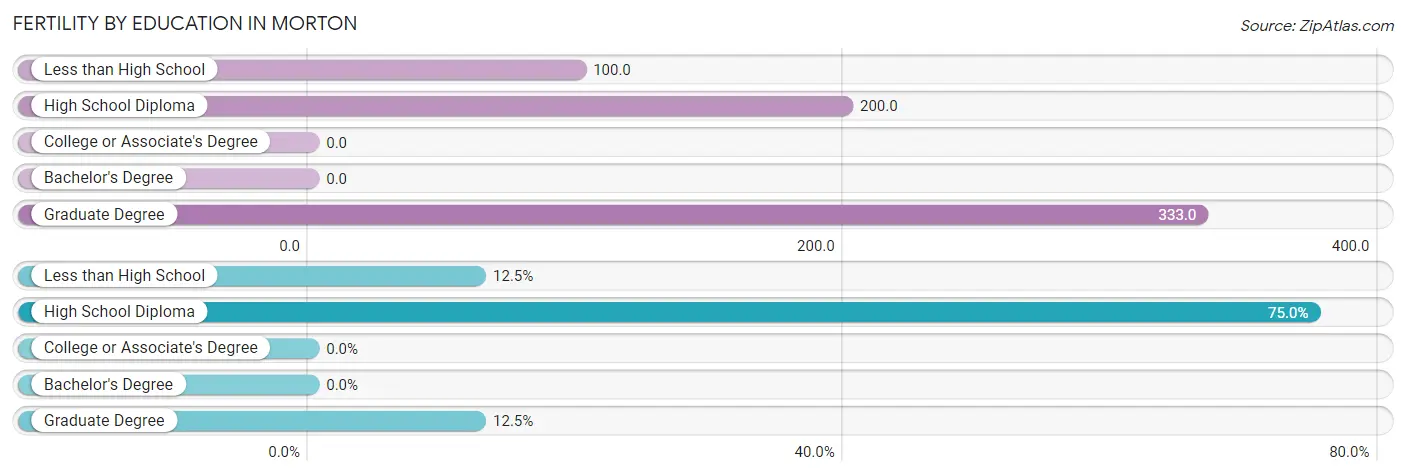
| Educational Attainment | Women with Births | Births / 1,000 Women |
| Less than High School | 1 (12.5%) | 100.0 |
| High School Diploma | 6 (75.0%) | 200.0 |
| College or Associate's Degree | 0 (0.0%) | 0.0 |
| Bachelor's Degree | 0 (0.0%) | 0.0 |
| Graduate Degree | 1 (12.5%) | 333.0 |
| Total | 8 (100.0%) | 111.0 |
Fertility by Education by Marriage Status in Morton
37.5% of women with births in Morton are unmarried. Women with the educational attainment of graduate degree are most likely to be married with 100.0% of them married at childbirth, while women with the educational attainment of less than high school are least likely to be married with 100.0% of them unmarried at childbirth.
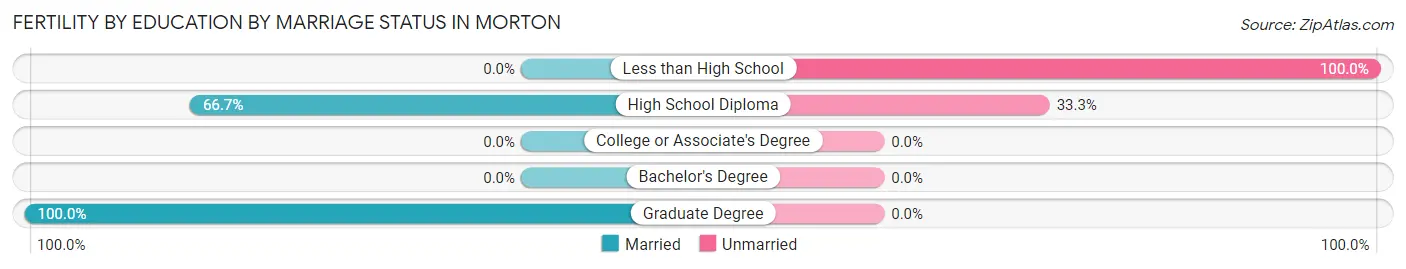
| Educational Attainment | Married | Unmarried |
| Less than High School | 0 (0.0%) | 1 (100.0%) |
| High School Diploma | 4 (66.7%) | 2 (33.3%) |
| College or Associate's Degree | 0 (0.0%) | 0 (0.0%) |
| Bachelor's Degree | 0 (0.0%) | 0 (0.0%) |
| Graduate Degree | 1 (100.0%) | 0 (0.0%) |
| Total | 5 (62.5%) | 3 (37.5%) |
Employment Characteristics in Morton
Employment by Class of Employer in Morton
Among the 173 employed individuals in Morton, private company employees (115 | 66.5%), not-for-profit organizations (25 | 14.4%), and local government employees (16 | 9.2%) make up the most common classes of employment.
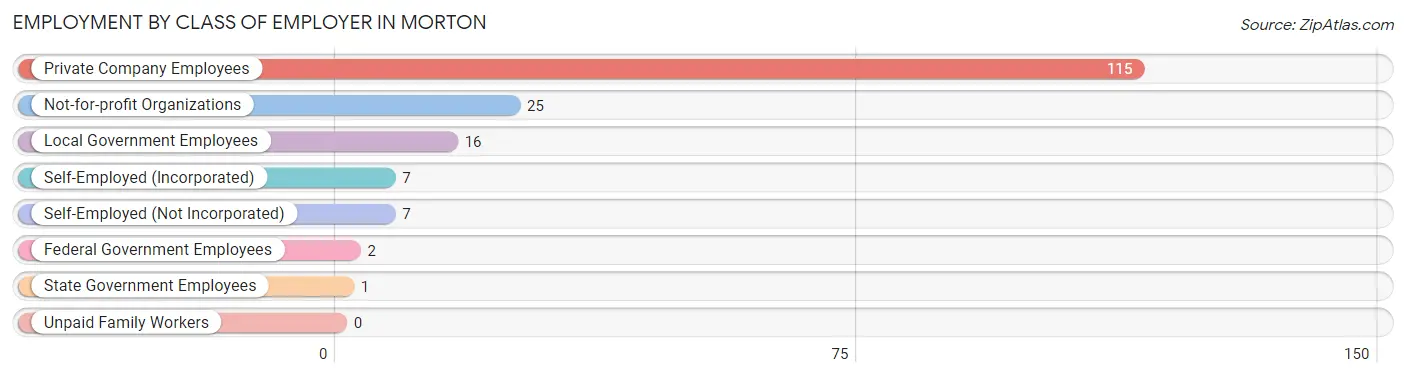
| Employer Class | # Employees | % Employees |
| Private Company Employees | 115 | 66.5% |
| Self-Employed (Incorporated) | 7 | 4.1% |
| Self-Employed (Not Incorporated) | 7 | 4.1% |
| Not-for-profit Organizations | 25 | 14.4% |
| Local Government Employees | 16 | 9.2% |
| State Government Employees | 1 | 0.6% |
| Federal Government Employees | 2 | 1.2% |
| Unpaid Family Workers | 0 | 0.0% |
| Total | 173 | 100.0% |
Employment Status by Age in Morton
According to the labor force statistics for Morton, out of the total population over 16 years of age (306), 57.5% or 176 individuals are in the labor force, with 1.1% or 2 of them unemployed. The age group with the highest labor force participation rate is 30 to 34 years, with 100.0% or 18 individuals in the labor force. Within the labor force, the 20 to 24 years age range has the highest percentage of unemployed individuals, with 100.0% or 1 of them being unemployed.
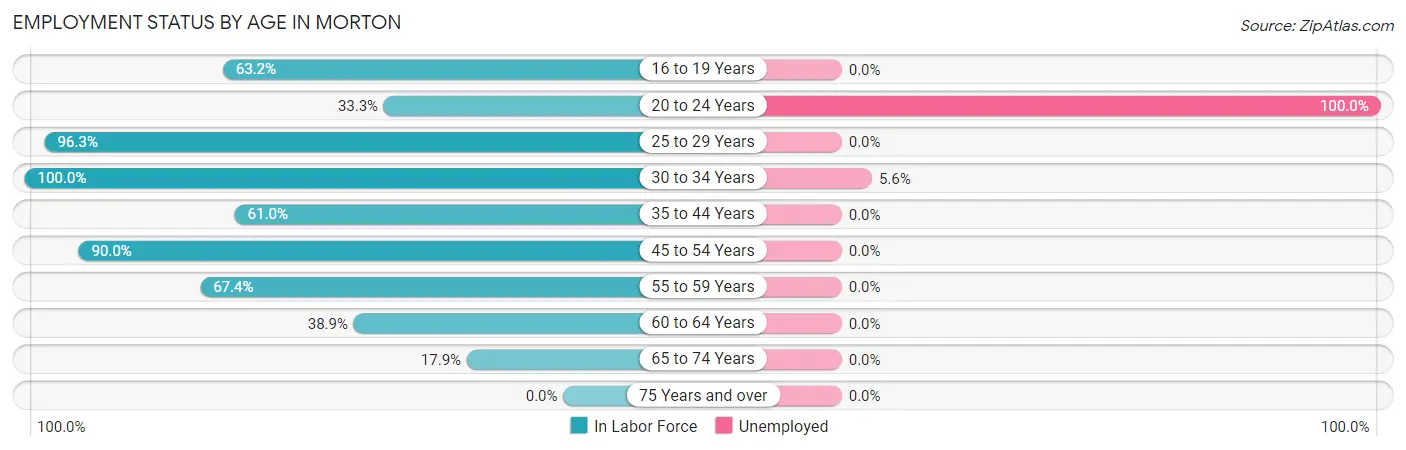
| Age Bracket | In Labor Force | Unemployed |
| 16 to 19 Years | 24 (63.2%) | 0 (0.0%) |
| 20 to 24 Years | 1 (33.3%) | 1 (100.0%) |
| 25 to 29 Years | 26 (96.3%) | 0 (0.0%) |
| 30 to 34 Years | 18 (100.0%) | 1 (5.6%) |
| 35 to 44 Years | 25 (61.0%) | 0 (0.0%) |
| 45 to 54 Years | 36 (90.0%) | 0 (0.0%) |
| 55 to 59 Years | 29 (67.4%) | 0 (0.0%) |
| 60 to 64 Years | 7 (38.9%) | 0 (0.0%) |
| 65 to 74 Years | 10 (17.9%) | 0 (0.0%) |
| 75 Years and over | 0 (0.0%) | 0 (0.0%) |
| Total | 176 (57.5%) | 2 (1.1%) |
Employment Status by Educational Attainment in Morton
According to labor force statistics for Morton, 75.4% of individuals (141) out of the total population between 25 and 64 years of age (187) are in the labor force, with 0.7% or 1 of them being unemployed. The group with the highest labor force participation rate are those with the educational attainment of bachelor's degree or higher, with 100.0% or 23 individuals in the labor force. Within the labor force, individuals with high school diploma education have the highest percentage of unemployment, with 1.5% or 1 of them being unemployed.
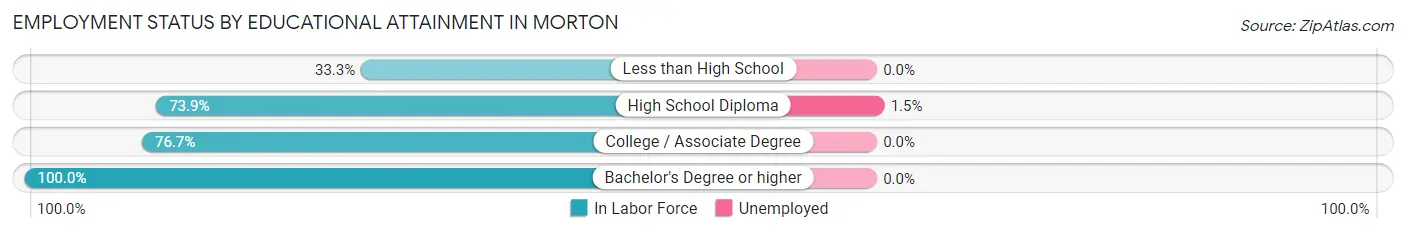
| Educational Attainment | In Labor Force | Unemployed |
| Less than High School | 4 (33.3%) | 0 (0.0%) |
| High School Diploma | 68 (73.9%) | 1 (1.5%) |
| College / Associate Degree | 46 (76.7%) | 0 (0.0%) |
| Bachelor's Degree or higher | 23 (100.0%) | 0 (0.0%) |
| Total | 141 (75.4%) | 1 (0.7%) |
Employment Occupations by Sex in Morton
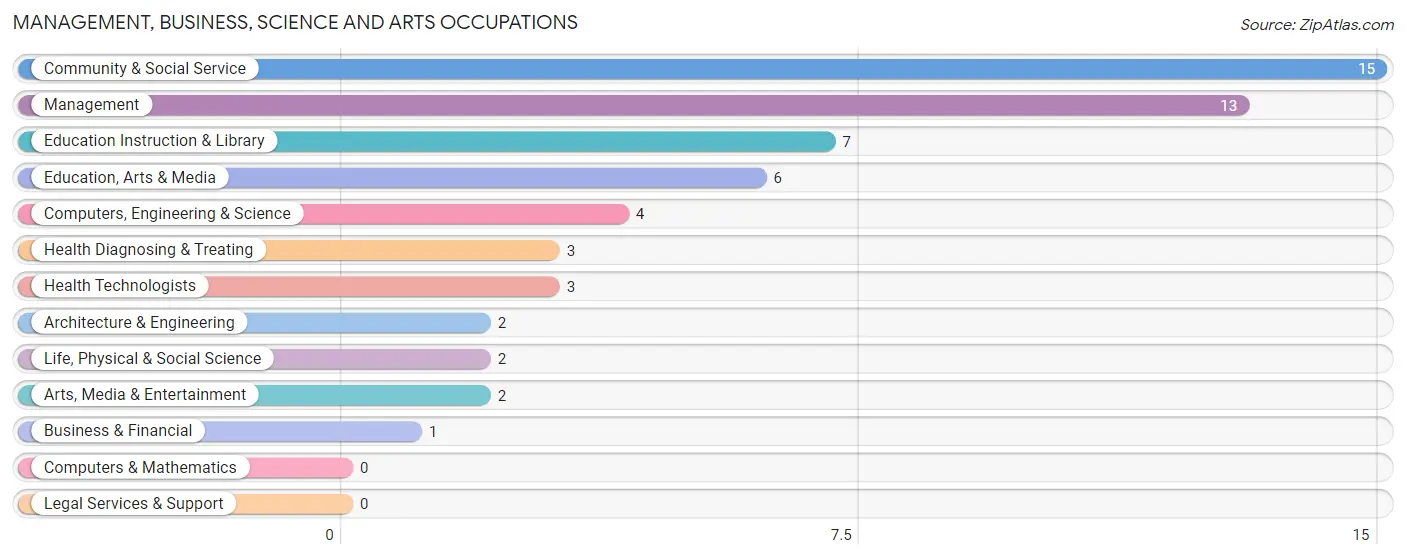
Management, Business, Science and Arts Occupations
The most common Management, Business, Science and Arts occupations in Morton are Community & Social Service (15 | 8.6%), Management (13 | 7.5%), Education Instruction & Library (7 | 4.0%), Education, Arts & Media (6 | 3.5%), and Computers, Engineering & Science (4 | 2.3%).
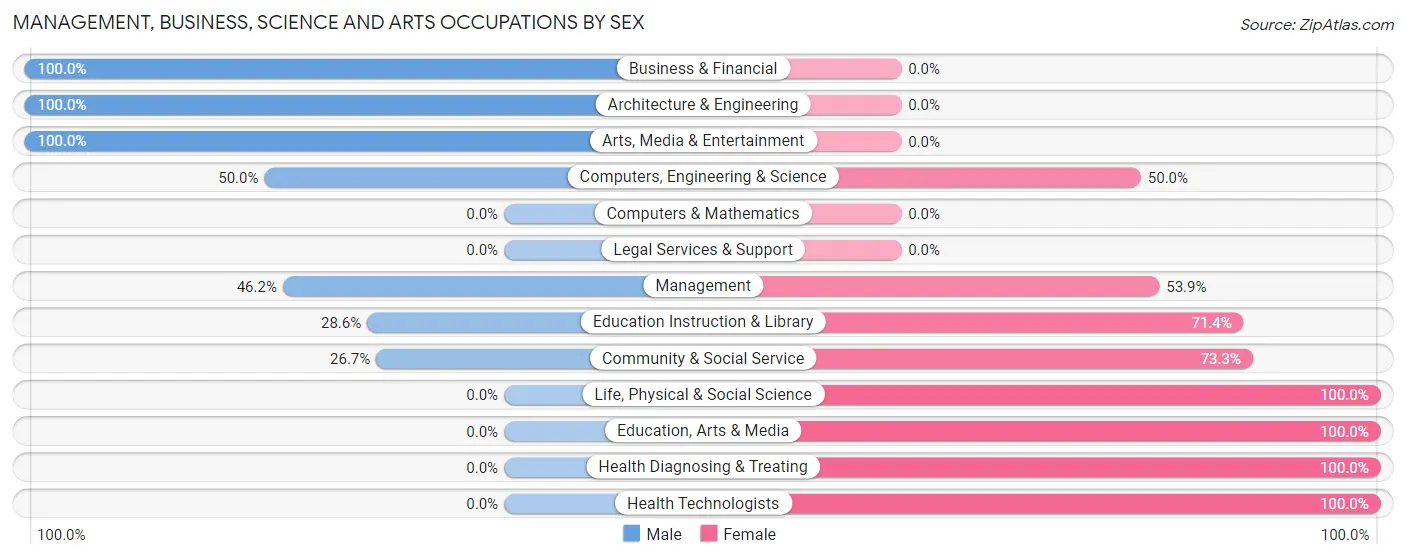
Management, Business, Science and Arts Occupations by Sex
Within the Management, Business, Science and Arts occupations in Morton, the most male-oriented occupations are Business & Financial (100.0%), Architecture & Engineering (100.0%), and Arts, Media & Entertainment (100.0%), while the most female-oriented occupations are Life, Physical & Social Science (100.0%), Education, Arts & Media (100.0%), and Health Diagnosing & Treating (100.0%).
| Occupation | Male | Female |
| Management | 6 (46.2%) | 7 (53.8%) |
| Business & Financial | 1 (100.0%) | 0 (0.0%) |
| Computers, Engineering & Science | 2 (50.0%) | 2 (50.0%) |
| Computers & Mathematics | 0 (0.0%) | 0 (0.0%) |
| Architecture & Engineering | 2 (100.0%) | 0 (0.0%) |
| Life, Physical & Social Science | 0 (0.0%) | 2 (100.0%) |
| Community & Social Service | 4 (26.7%) | 11 (73.3%) |
| Education, Arts & Media | 0 (0.0%) | 6 (100.0%) |
| Legal Services & Support | 0 (0.0%) | 0 (0.0%) |
| Education Instruction & Library | 2 (28.6%) | 5 (71.4%) |
| Arts, Media & Entertainment | 2 (100.0%) | 0 (0.0%) |
| Health Diagnosing & Treating | 0 (0.0%) | 3 (100.0%) |
| Health Technologists | 0 (0.0%) | 3 (100.0%) |
| Total (Category) | 13 (36.1%) | 23 (63.9%) |
| Total (Overall) | 100 (57.5%) | 74 (42.5%) |
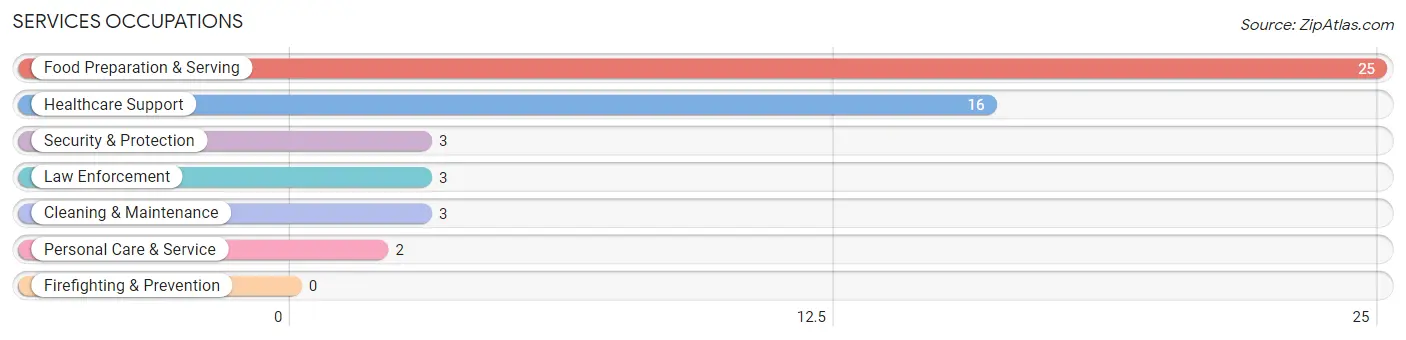
Services Occupations
The most common Services occupations in Morton are Food Preparation & Serving (25 | 14.4%), Healthcare Support (16 | 9.2%), Security & Protection (3 | 1.7%), Law Enforcement (3 | 1.7%), and Cleaning & Maintenance (3 | 1.7%).
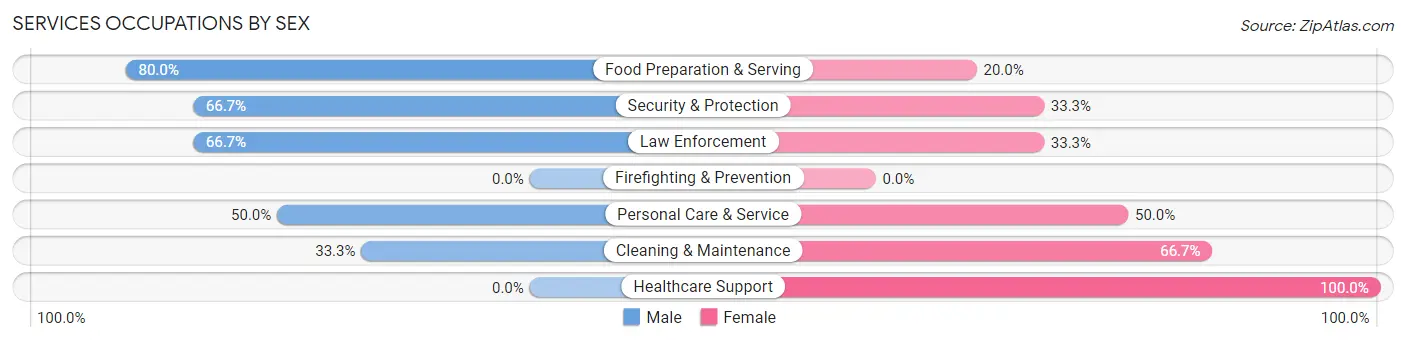
Services Occupations by Sex
Within the Services occupations in Morton, the most male-oriented occupations are Food Preparation & Serving (80.0%), Security & Protection (66.7%), and Law Enforcement (66.7%), while the most female-oriented occupations are Healthcare Support (100.0%), Cleaning & Maintenance (66.7%), and Personal Care & Service (50.0%).
| Occupation | Male | Female |
| Healthcare Support | 0 (0.0%) | 16 (100.0%) |
| Security & Protection | 2 (66.7%) | 1 (33.3%) |
| Firefighting & Prevention | 0 (0.0%) | 0 (0.0%) |
| Law Enforcement | 2 (66.7%) | 1 (33.3%) |
| Food Preparation & Serving | 20 (80.0%) | 5 (20.0%) |
| Cleaning & Maintenance | 1 (33.3%) | 2 (66.7%) |
| Personal Care & Service | 1 (50.0%) | 1 (50.0%) |
| Total (Category) | 24 (49.0%) | 25 (51.0%) |
| Total (Overall) | 100 (57.5%) | 74 (42.5%) |
Sales and Office Occupations
The most common Sales and Office occupations in Morton are Sales & Related (14 | 8.1%), and Office & Administration (11 | 6.3%).
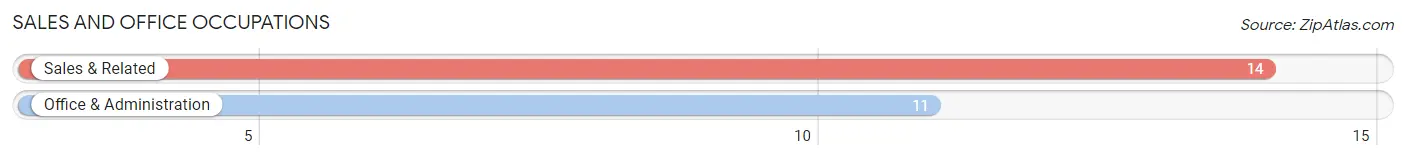
Sales and Office Occupations by Sex
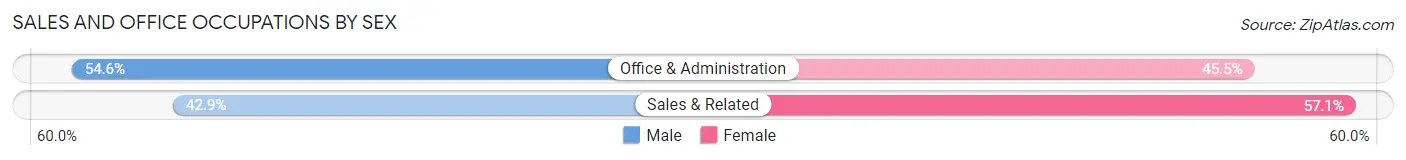
| Occupation | Male | Female |
| Sales & Related | 6 (42.9%) | 8 (57.1%) |
| Office & Administration | 6 (54.5%) | 5 (45.5%) |
| Total (Category) | 12 (48.0%) | 13 (52.0%) |
| Total (Overall) | 100 (57.5%) | 74 (42.5%) |
Natural Resources, Construction and Maintenance Occupations
The most common Natural Resources, Construction and Maintenance occupations in Morton are Construction & Extraction (14 | 8.1%), Farming, Fishing & Forestry (6 | 3.5%), and Installation, Maintenance & Repair (1 | 0.6%).
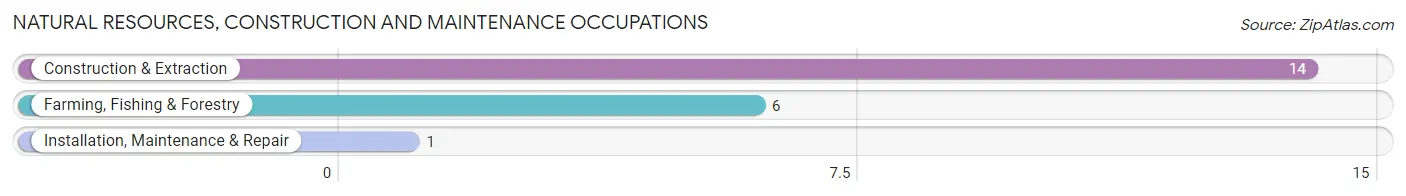
Natural Resources, Construction and Maintenance Occupations by Sex
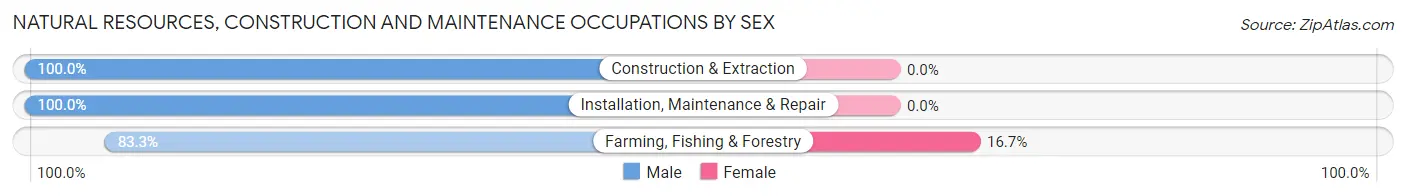
| Occupation | Male | Female |
| Farming, Fishing & Forestry | 5 (83.3%) | 1 (16.7%) |
| Construction & Extraction | 14 (100.0%) | 0 (0.0%) |
| Installation, Maintenance & Repair | 1 (100.0%) | 0 (0.0%) |
| Total (Category) | 20 (95.2%) | 1 (4.8%) |
| Total (Overall) | 100 (57.5%) | 74 (42.5%) |
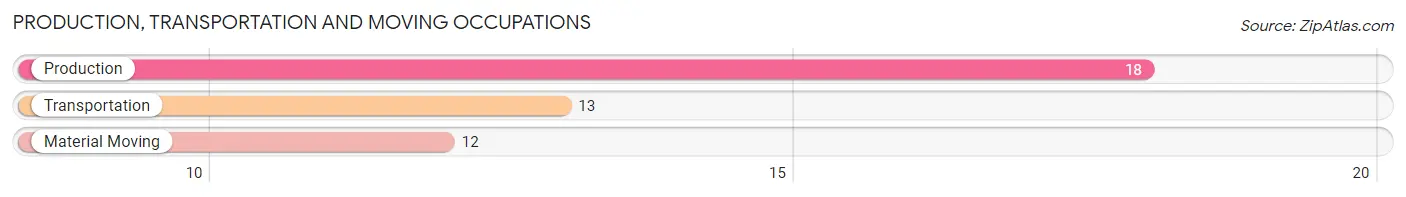
Production, Transportation and Moving Occupations
The most common Production, Transportation and Moving occupations in Morton are Production (18 | 10.3%), Transportation (13 | 7.5%), and Material Moving (12 | 6.9%).
Production, Transportation and Moving Occupations by Sex
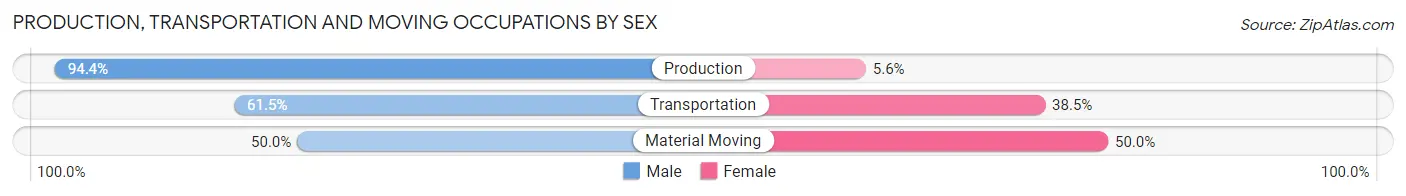
| Occupation | Male | Female |
| Production | 17 (94.4%) | 1 (5.6%) |
| Transportation | 8 (61.5%) | 5 (38.5%) |
| Material Moving | 6 (50.0%) | 6 (50.0%) |
| Total (Category) | 31 (72.1%) | 12 (27.9%) |
| Total (Overall) | 100 (57.5%) | 74 (42.5%) |
Employment Industries by Sex in Morton
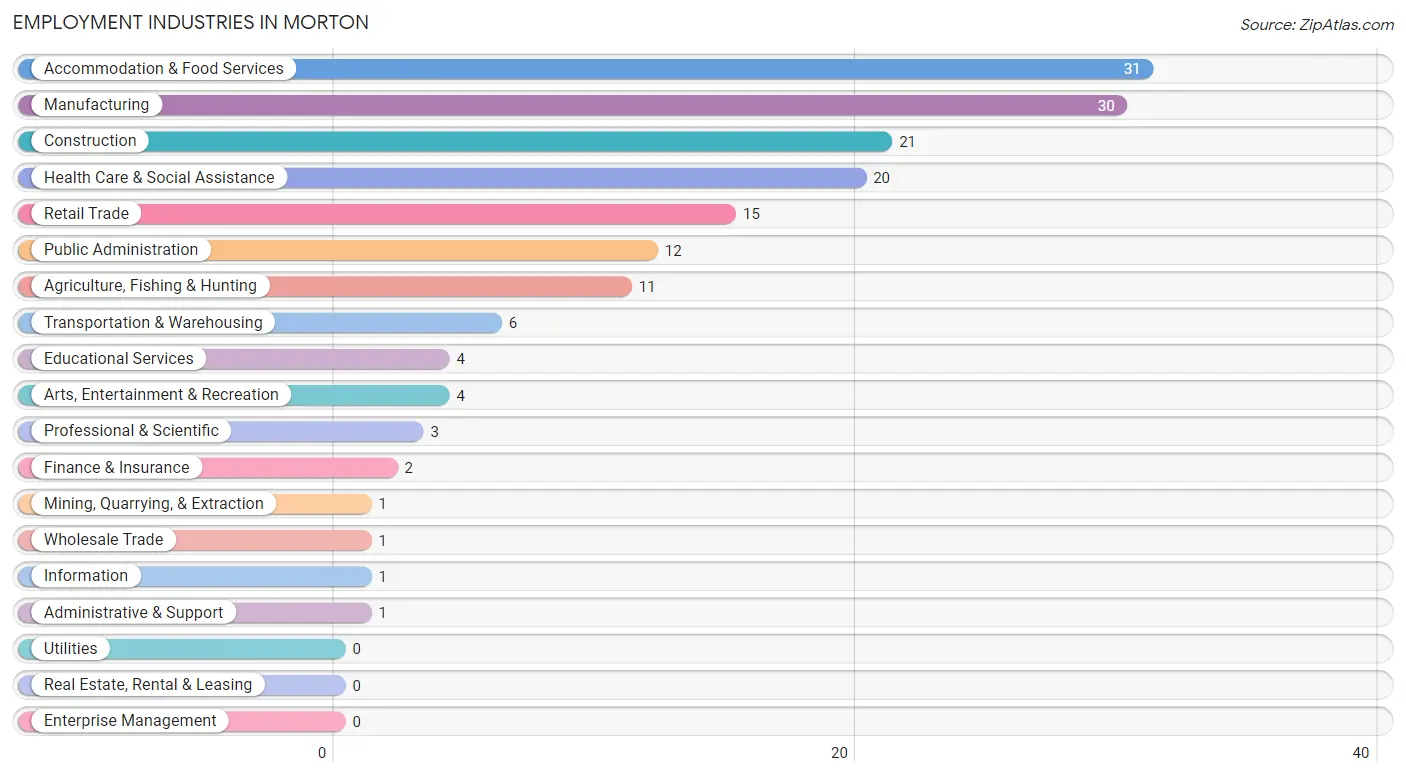
Employment Industries in Morton
The major employment industries in Morton include Accommodation & Food Services (31 | 17.8%), Manufacturing (30 | 17.2%), Construction (21 | 12.1%), Health Care & Social Assistance (20 | 11.5%), and Retail Trade (15 | 8.6%).
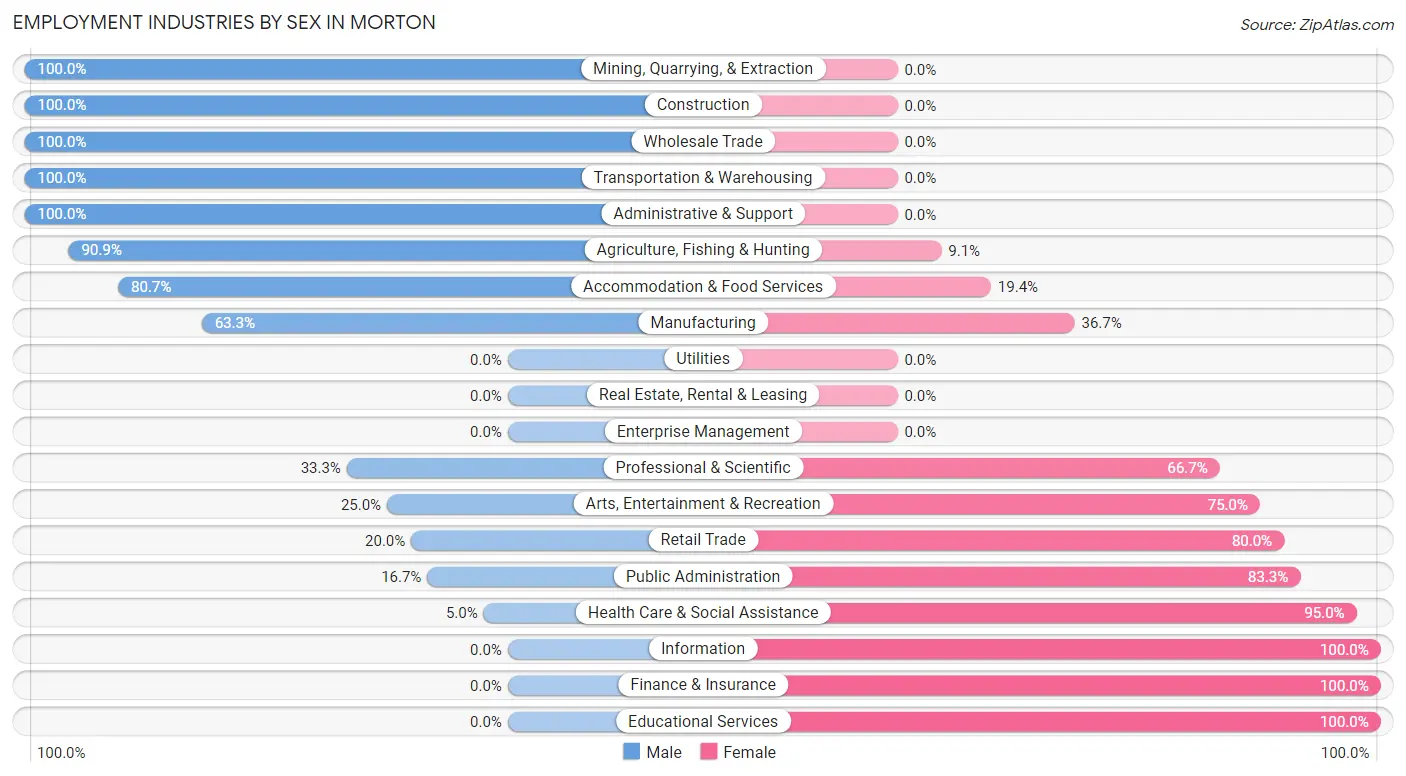
Employment Industries by Sex in Morton
The Morton industries that see more men than women are Mining, Quarrying, & Extraction (100.0%), Construction (100.0%), and Wholesale Trade (100.0%), whereas the industries that tend to have a higher number of women are Information (100.0%), Finance & Insurance (100.0%), and Educational Services (100.0%).
| Industry | Male | Female |
| Agriculture, Fishing & Hunting | 10 (90.9%) | 1 (9.1%) |
| Mining, Quarrying, & Extraction | 1 (100.0%) | 0 (0.0%) |
| Construction | 21 (100.0%) | 0 (0.0%) |
| Manufacturing | 19 (63.3%) | 11 (36.7%) |
| Wholesale Trade | 1 (100.0%) | 0 (0.0%) |
| Retail Trade | 3 (20.0%) | 12 (80.0%) |
| Transportation & Warehousing | 6 (100.0%) | 0 (0.0%) |
| Utilities | 0 (0.0%) | 0 (0.0%) |
| Information | 0 (0.0%) | 1 (100.0%) |
| Finance & Insurance | 0 (0.0%) | 2 (100.0%) |
| Real Estate, Rental & Leasing | 0 (0.0%) | 0 (0.0%) |
| Professional & Scientific | 1 (33.3%) | 2 (66.7%) |
| Enterprise Management | 0 (0.0%) | 0 (0.0%) |
| Administrative & Support | 1 (100.0%) | 0 (0.0%) |
| Educational Services | 0 (0.0%) | 4 (100.0%) |
| Health Care & Social Assistance | 1 (5.0%) | 19 (95.0%) |
| Arts, Entertainment & Recreation | 1 (25.0%) | 3 (75.0%) |
| Accommodation & Food Services | 25 (80.6%) | 6 (19.4%) |
| Public Administration | 2 (16.7%) | 10 (83.3%) |
| Total | 100 (57.5%) | 74 (42.5%) |
Education in Morton
School Enrollment in Morton
The most common levels of schooling among the 76 students in Morton are elementary school (30 | 39.5%), high school (17 | 22.4%), and nursery / preschool (9 | 11.8%).
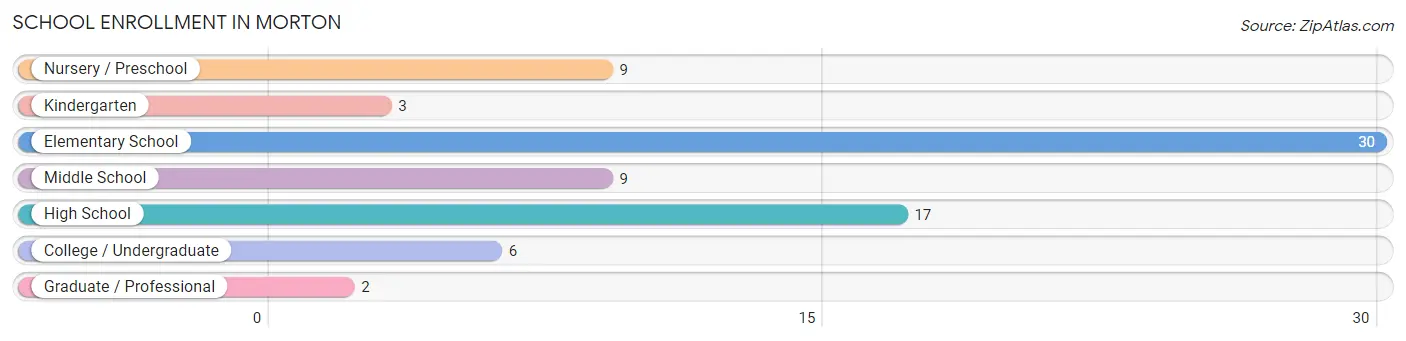
| School Level | # Students | % Students |
| Nursery / Preschool | 9 | 11.8% |
| Kindergarten | 3 | 4.0% |
| Elementary School | 30 | 39.5% |
| Middle School | 9 | 11.8% |
| High School | 17 | 22.4% |
| College / Undergraduate | 6 | 7.9% |
| Graduate / Professional | 2 | 2.6% |
| Total | 76 | 100.0% |
School Enrollment by Age by Funding Source in Morton
Out of a total of 76 students who are enrolled in schools in Morton, 1 (1.3%) attend a private institution, while the remaining 75 (98.7%) are enrolled in public schools. The age group of 15 to 17 year olds has the highest likelihood of being enrolled in private schools, with 1 (7.7% in the age bracket) enrolled. Conversely, the age group of 3 to 4 year olds has the lowest likelihood of being enrolled in a private school, with 5 (100.0% in the age bracket) attending a public institution.
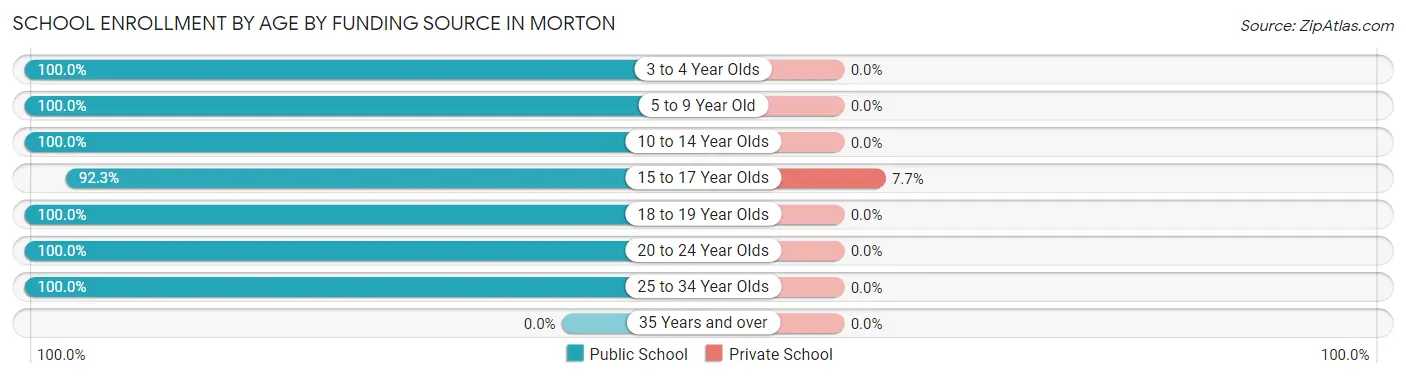
| Age Bracket | Public School | Private School |
| 3 to 4 Year Olds | 5 (100.0%) | 0 (0.0%) |
| 5 to 9 Year Old | 28 (100.0%) | 0 (0.0%) |
| 10 to 14 Year Olds | 18 (100.0%) | 0 (0.0%) |
| 15 to 17 Year Olds | 12 (92.3%) | 1 (7.7%) |
| 18 to 19 Year Olds | 6 (100.0%) | 0 (0.0%) |
| 20 to 24 Year Olds | 3 (100.0%) | 0 (0.0%) |
| 25 to 34 Year Olds | 3 (100.0%) | 0 (0.0%) |
| 35 Years and over | 0 (0.0%) | 0 (0.0%) |
| Total | 75 (98.7%) | 1 (1.3%) |
Educational Attainment by Field of Study in Morton
Science & technology (6 | 18.8%), education (5 | 15.6%), arts & humanities (5 | 15.6%), social sciences (4 | 12.5%), and business (4 | 12.5%) are the most common fields of study among 32 individuals in Morton who have obtained a bachelor's degree or higher.
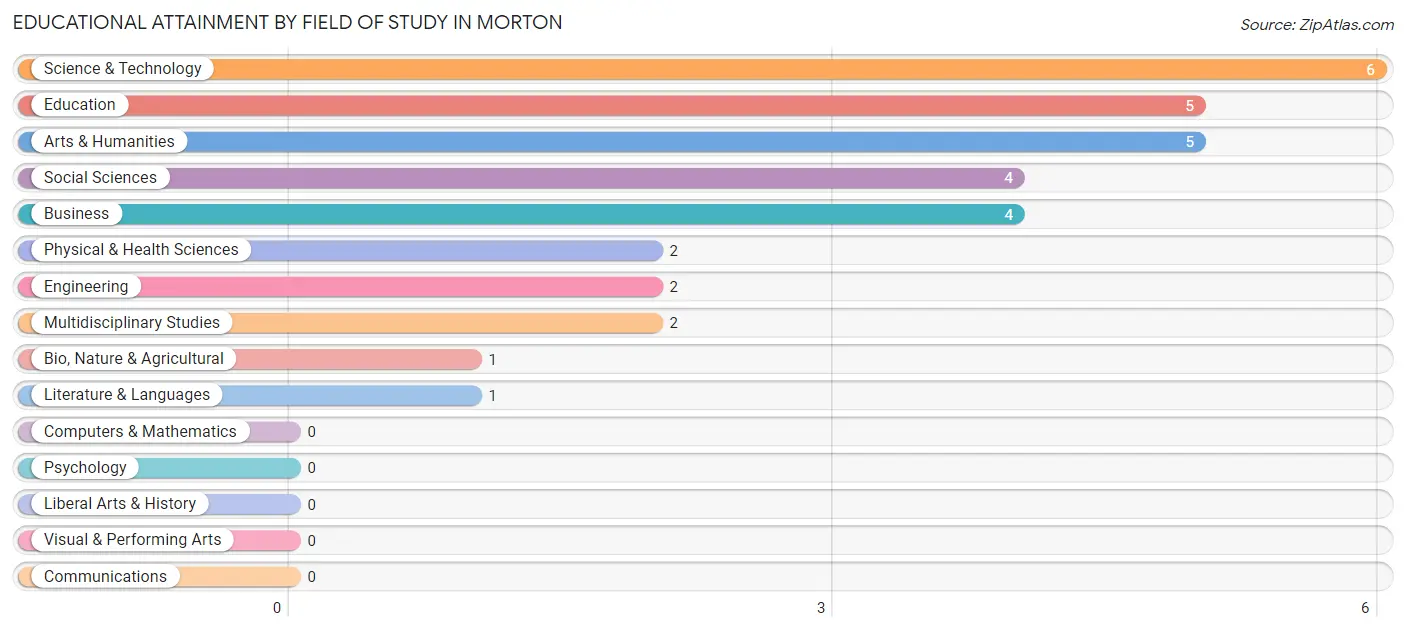
| Field of Study | # Graduates | % Graduates |
| Computers & Mathematics | 0 | 0.0% |
| Bio, Nature & Agricultural | 1 | 3.1% |
| Physical & Health Sciences | 2 | 6.2% |
| Psychology | 0 | 0.0% |
| Social Sciences | 4 | 12.5% |
| Engineering | 2 | 6.2% |
| Multidisciplinary Studies | 2 | 6.2% |
| Science & Technology | 6 | 18.8% |
| Business | 4 | 12.5% |
| Education | 5 | 15.6% |
| Literature & Languages | 1 | 3.1% |
| Liberal Arts & History | 0 | 0.0% |
| Visual & Performing Arts | 0 | 0.0% |
| Communications | 0 | 0.0% |
| Arts & Humanities | 5 | 15.6% |
| Total | 32 | 100.0% |
Transportation & Commute in Morton
Vehicle Availability by Sex in Morton
The most prevalent vehicle ownership categories in Morton are males with 3 vehicles (33, accounting for 33.0%) and females with 3 vehicles (3, making up 45.2%).
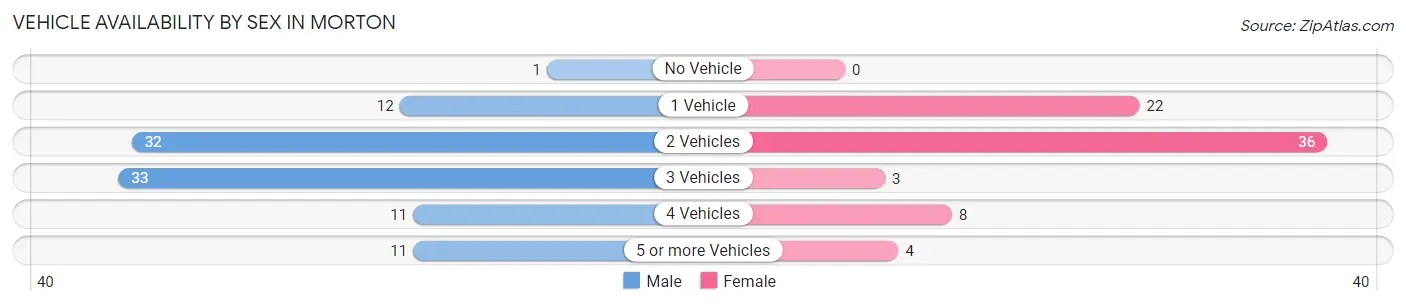
| Vehicles Available | Male | Female |
| No Vehicle | 1 (1.0%) | 0 (0.0%) |
| 1 Vehicle | 12 (12.0%) | 22 (30.1%) |
| 2 Vehicles | 32 (32.0%) | 36 (49.3%) |
| 3 Vehicles | 33 (33.0%) | 3 (4.1%) |
| 4 Vehicles | 11 (11.0%) | 8 (11.0%) |
| 5 or more Vehicles | 11 (11.0%) | 4 (5.5%) |
| Total | 100 (100.0%) | 73 (100.0%) |
Commute Time in Morton
The most frequently occuring commute durations in Morton are 10 to 14 minutes (49 commuters, 30.6%), 5 to 9 minutes (43 commuters, 26.9%), and 45 to 59 minutes (32 commuters, 20.0%).
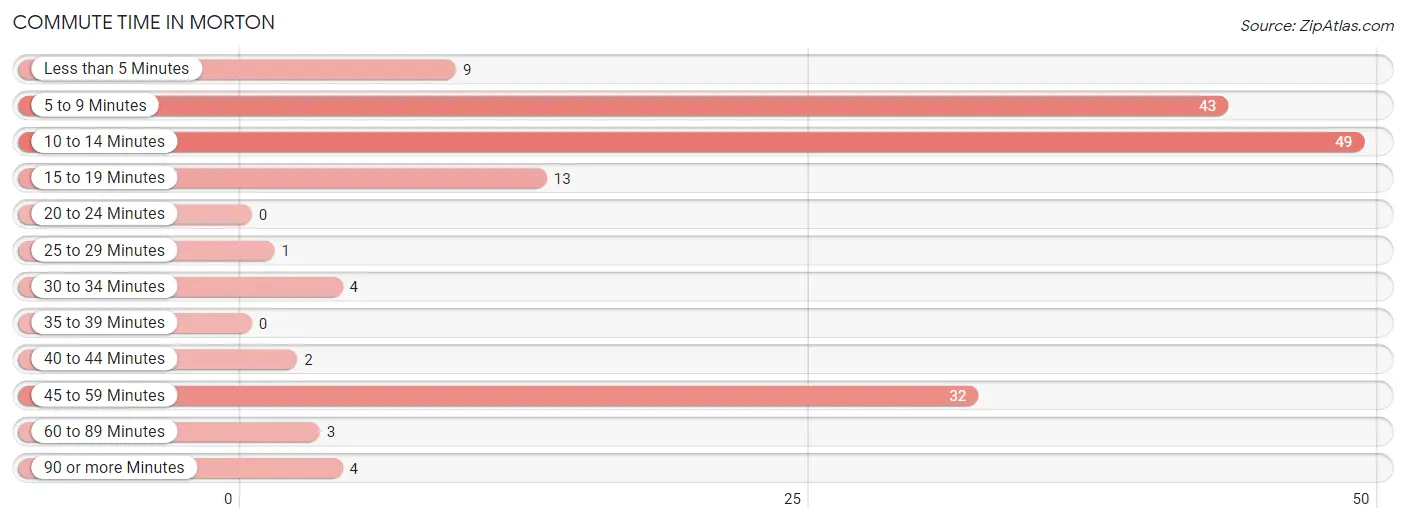
| Commute Time | # Commuters | % Commuters |
| Less than 5 Minutes | 9 | 5.6% |
| 5 to 9 Minutes | 43 | 26.9% |
| 10 to 14 Minutes | 49 | 30.6% |
| 15 to 19 Minutes | 13 | 8.1% |
| 20 to 24 Minutes | 0 | 0.0% |
| 25 to 29 Minutes | 1 | 0.6% |
| 30 to 34 Minutes | 4 | 2.5% |
| 35 to 39 Minutes | 0 | 0.0% |
| 40 to 44 Minutes | 2 | 1.3% |
| 45 to 59 Minutes | 32 | 20.0% |
| 60 to 89 Minutes | 3 | 1.9% |
| 90 or more Minutes | 4 | 2.5% |
Commute Time by Sex in Morton
The most common commute times in Morton are 5 to 9 minutes (29 commuters, 31.5%) for males and 10 to 14 minutes (32 commuters, 47.1%) for females.
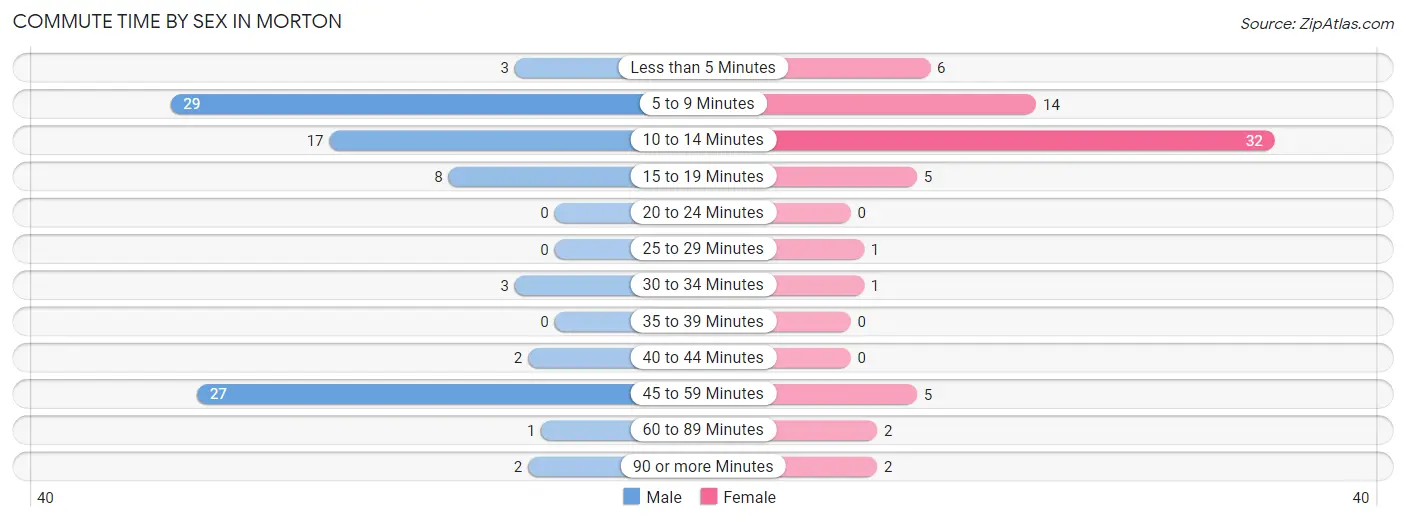
| Commute Time | Male | Female |
| Less than 5 Minutes | 3 (3.3%) | 6 (8.8%) |
| 5 to 9 Minutes | 29 (31.5%) | 14 (20.6%) |
| 10 to 14 Minutes | 17 (18.5%) | 32 (47.1%) |
| 15 to 19 Minutes | 8 (8.7%) | 5 (7.3%) |
| 20 to 24 Minutes | 0 (0.0%) | 0 (0.0%) |
| 25 to 29 Minutes | 0 (0.0%) | 1 (1.5%) |
| 30 to 34 Minutes | 3 (3.3%) | 1 (1.5%) |
| 35 to 39 Minutes | 0 (0.0%) | 0 (0.0%) |
| 40 to 44 Minutes | 2 (2.2%) | 0 (0.0%) |
| 45 to 59 Minutes | 27 (29.3%) | 5 (7.3%) |
| 60 to 89 Minutes | 1 (1.1%) | 2 (2.9%) |
| 90 or more Minutes | 2 (2.2%) | 2 (2.9%) |
Time of Departure to Work by Sex in Morton
The most frequent times of departure to work in Morton are 6:00 AM to 6:29 AM (31, 33.7%) for males and 6:30 AM to 6:59 AM (16, 23.5%) for females.
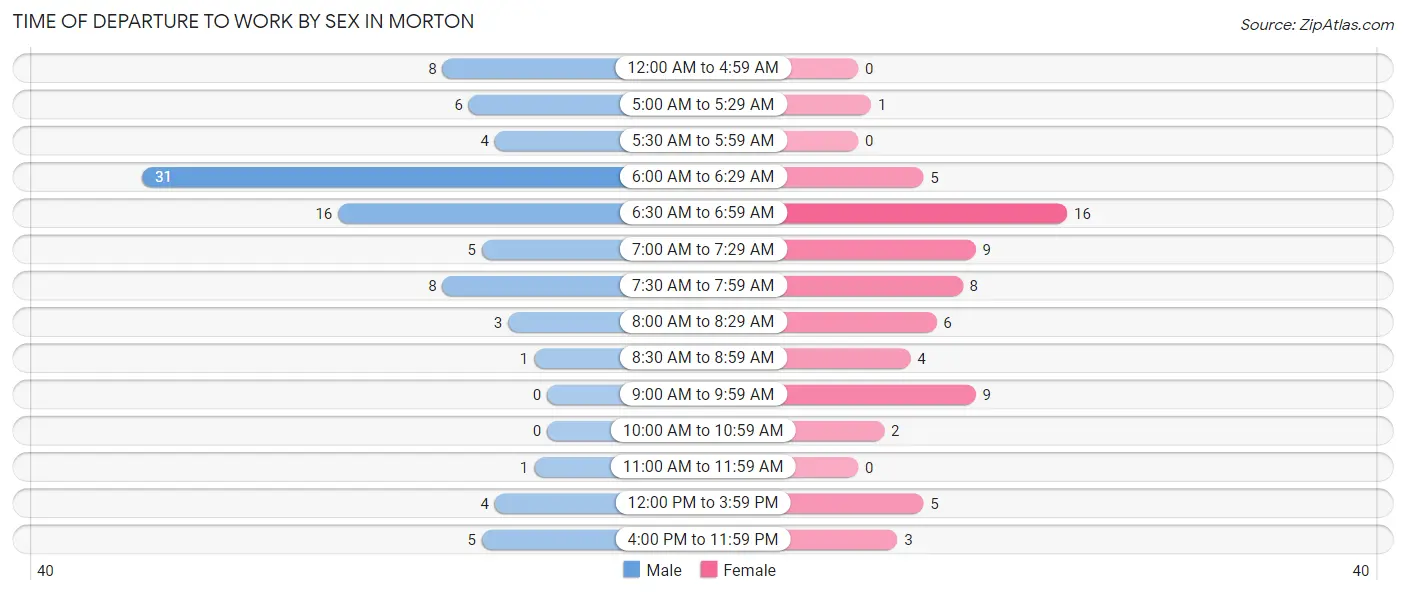
| Time of Departure | Male | Female |
| 12:00 AM to 4:59 AM | 8 (8.7%) | 0 (0.0%) |
| 5:00 AM to 5:29 AM | 6 (6.5%) | 1 (1.5%) |
| 5:30 AM to 5:59 AM | 4 (4.3%) | 0 (0.0%) |
| 6:00 AM to 6:29 AM | 31 (33.7%) | 5 (7.3%) |
| 6:30 AM to 6:59 AM | 16 (17.4%) | 16 (23.5%) |
| 7:00 AM to 7:29 AM | 5 (5.4%) | 9 (13.2%) |
| 7:30 AM to 7:59 AM | 8 (8.7%) | 8 (11.8%) |
| 8:00 AM to 8:29 AM | 3 (3.3%) | 6 (8.8%) |
| 8:30 AM to 8:59 AM | 1 (1.1%) | 4 (5.9%) |
| 9:00 AM to 9:59 AM | 0 (0.0%) | 9 (13.2%) |
| 10:00 AM to 10:59 AM | 0 (0.0%) | 2 (2.9%) |
| 11:00 AM to 11:59 AM | 1 (1.1%) | 0 (0.0%) |
| 12:00 PM to 3:59 PM | 4 (4.3%) | 5 (7.3%) |
| 4:00 PM to 11:59 PM | 5 (5.4%) | 3 (4.4%) |
| Total | 92 (100.0%) | 68 (100.0%) |
Housing Occupancy in Morton
Occupancy by Ownership in Morton
Of the total 148 dwellings in Morton, owner-occupied units account for 132 (89.2%), while renter-occupied units make up 16 (10.8%).
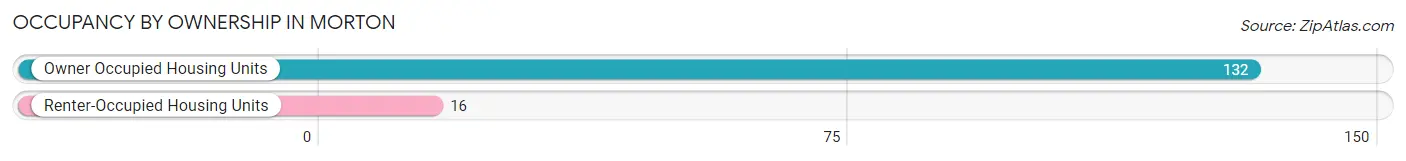
| Occupancy | # Housing Units | % Housing Units |
| Owner Occupied Housing Units | 132 | 89.2% |
| Renter-Occupied Housing Units | 16 | 10.8% |
| Total Occupied Housing Units | 148 | 100.0% |
Occupancy by Household Size in Morton
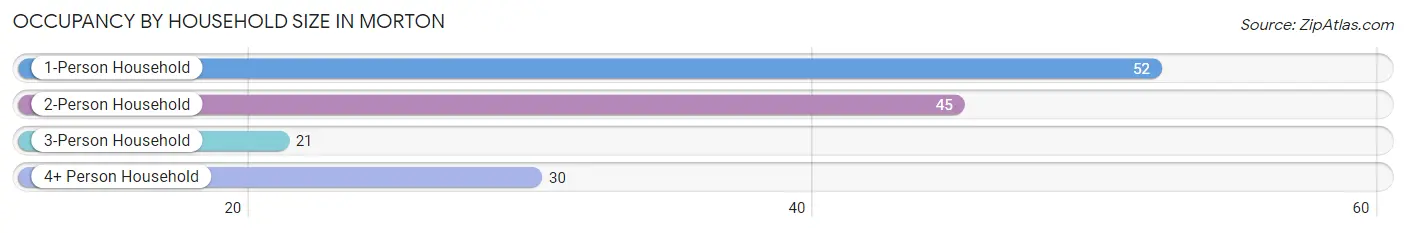
| Household Size | # Housing Units | % Housing Units |
| 1-Person Household | 52 | 35.1% |
| 2-Person Household | 45 | 30.4% |
| 3-Person Household | 21 | 14.2% |
| 4+ Person Household | 30 | 20.3% |
| Total Housing Units | 148 | 100.0% |
Occupancy by Ownership by Household Size in Morton
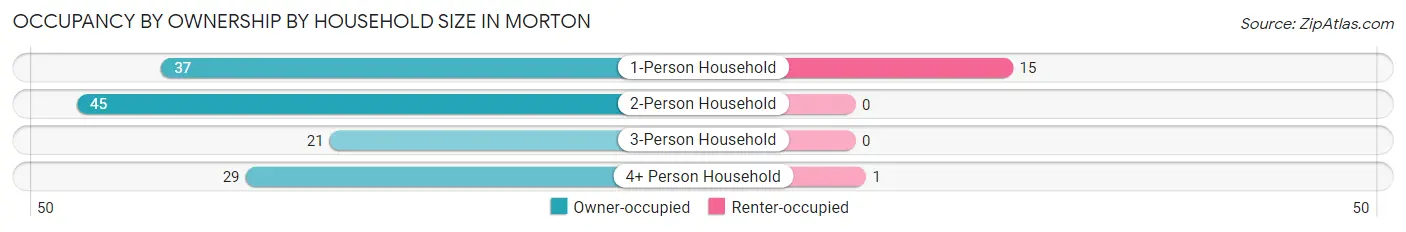
| Household Size | Owner-occupied | Renter-occupied |
| 1-Person Household | 37 (71.2%) | 15 (28.8%) |
| 2-Person Household | 45 (100.0%) | 0 (0.0%) |
| 3-Person Household | 21 (100.0%) | 0 (0.0%) |
| 4+ Person Household | 29 (96.7%) | 1 (3.3%) |
| Total Housing Units | 132 (89.2%) | 16 (10.8%) |
Occupancy by Educational Attainment in Morton
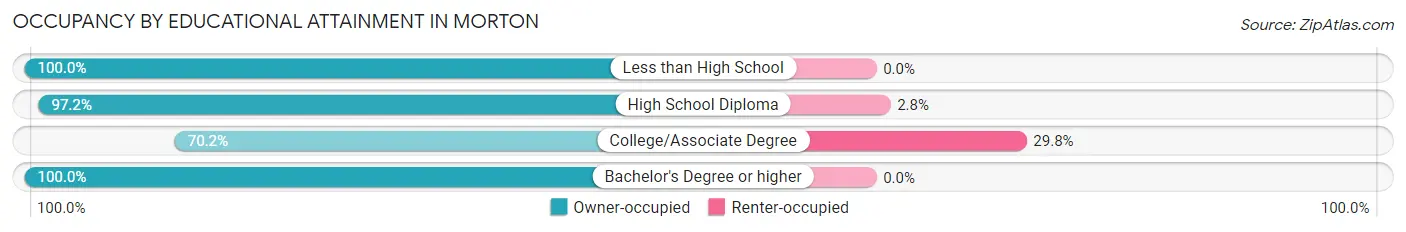
| Household Size | Owner-occupied | Renter-occupied |
| Less than High School | 7 (100.0%) | 0 (0.0%) |
| High School Diploma | 70 (97.2%) | 2 (2.8%) |
| College/Associate Degree | 33 (70.2%) | 14 (29.8%) |
| Bachelor's Degree or higher | 22 (100.0%) | 0 (0.0%) |
Occupancy by Age of Householder in Morton
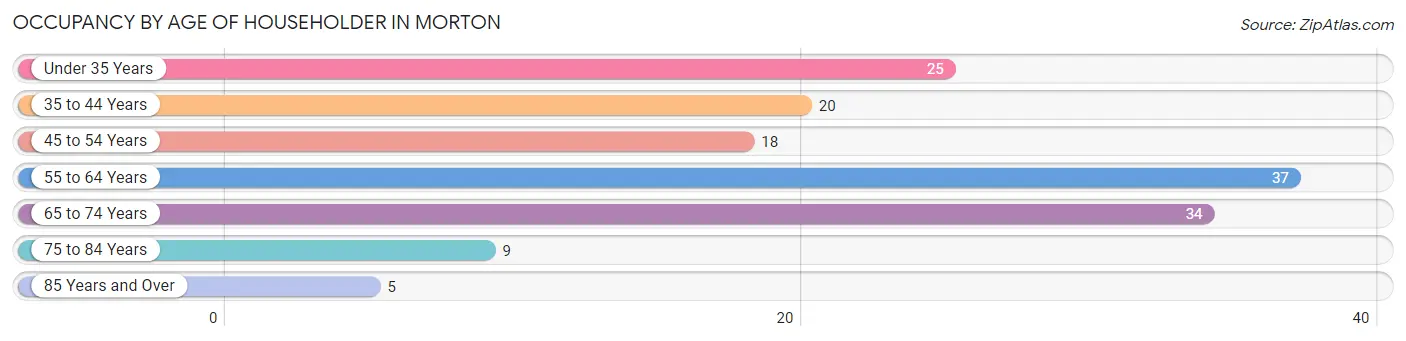
| Age Bracket | # Households | % Households |
| Under 35 Years | 25 | 16.9% |
| 35 to 44 Years | 20 | 13.5% |
| 45 to 54 Years | 18 | 12.2% |
| 55 to 64 Years | 37 | 25.0% |
| 65 to 74 Years | 34 | 23.0% |
| 75 to 84 Years | 9 | 6.1% |
| 85 Years and Over | 5 | 3.4% |
| Total | 148 | 100.0% |
Housing Finances in Morton
Median Income by Occupancy in Morton
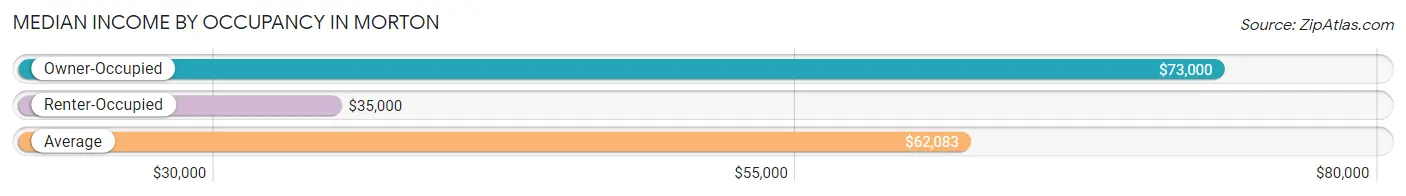
| Occupancy Type | # Households | Median Income |
| Owner-Occupied | 132 (89.2%) | $73,000 |
| Renter-Occupied | 16 (10.8%) | $35,000 |
| Average | 148 (100.0%) | $62,083 |
Occupancy by Householder Income Bracket in Morton
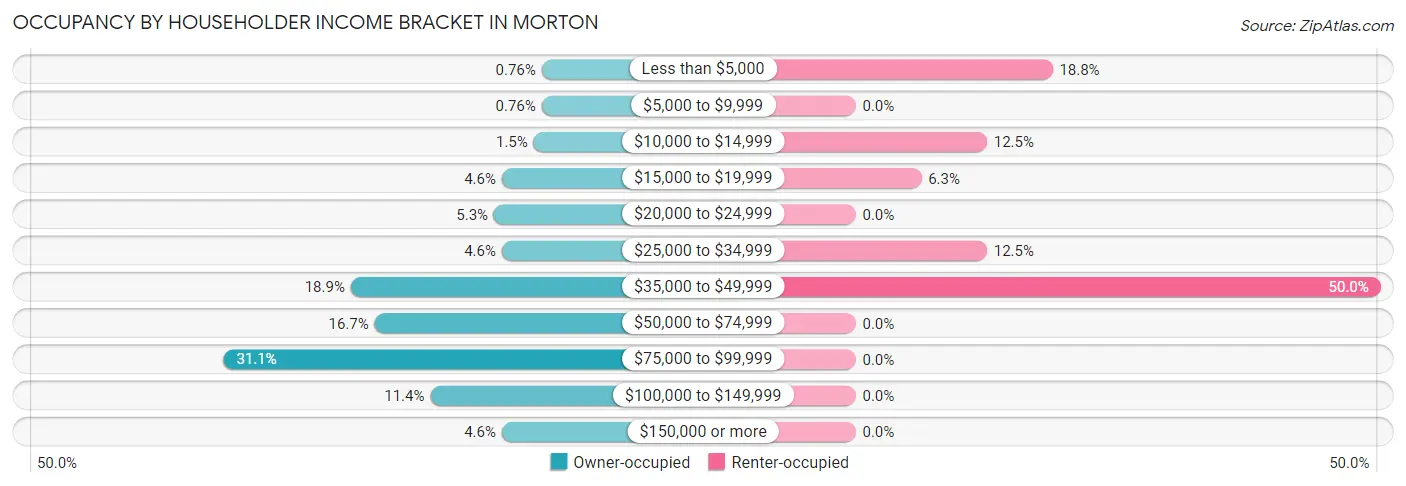
| Income Bracket | Owner-occupied | Renter-occupied |
| Less than $5,000 | 1 (0.8%) | 3 (18.8%) |
| $5,000 to $9,999 | 1 (0.8%) | 0 (0.0%) |
| $10,000 to $14,999 | 2 (1.5%) | 2 (12.5%) |
| $15,000 to $19,999 | 6 (4.5%) | 1 (6.2%) |
| $20,000 to $24,999 | 7 (5.3%) | 0 (0.0%) |
| $25,000 to $34,999 | 6 (4.5%) | 2 (12.5%) |
| $35,000 to $49,999 | 25 (18.9%) | 8 (50.0%) |
| $50,000 to $74,999 | 22 (16.7%) | 0 (0.0%) |
| $75,000 to $99,999 | 41 (31.1%) | 0 (0.0%) |
| $100,000 to $149,999 | 15 (11.4%) | 0 (0.0%) |
| $150,000 or more | 6 (4.5%) | 0 (0.0%) |
| Total | 132 (100.0%) | 16 (100.0%) |
Monthly Housing Cost Tiers in Morton
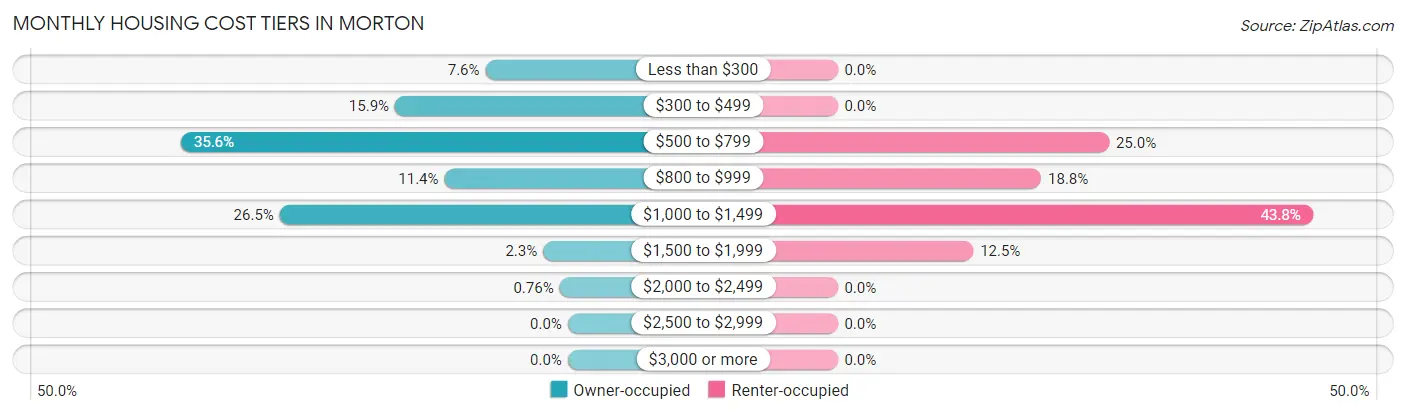
| Monthly Cost | Owner-occupied | Renter-occupied |
| Less than $300 | 10 (7.6%) | 0 (0.0%) |
| $300 to $499 | 21 (15.9%) | 0 (0.0%) |
| $500 to $799 | 47 (35.6%) | 4 (25.0%) |
| $800 to $999 | 15 (11.4%) | 3 (18.8%) |
| $1,000 to $1,499 | 35 (26.5%) | 7 (43.8%) |
| $1,500 to $1,999 | 3 (2.3%) | 2 (12.5%) |
| $2,000 to $2,499 | 1 (0.8%) | 0 (0.0%) |
| $2,500 to $2,999 | 0 (0.0%) | 0 (0.0%) |
| $3,000 or more | 0 (0.0%) | 0 (0.0%) |
| Total | 132 (100.0%) | 16 (100.0%) |
Physical Housing Characteristics in Morton
Housing Structures in Morton
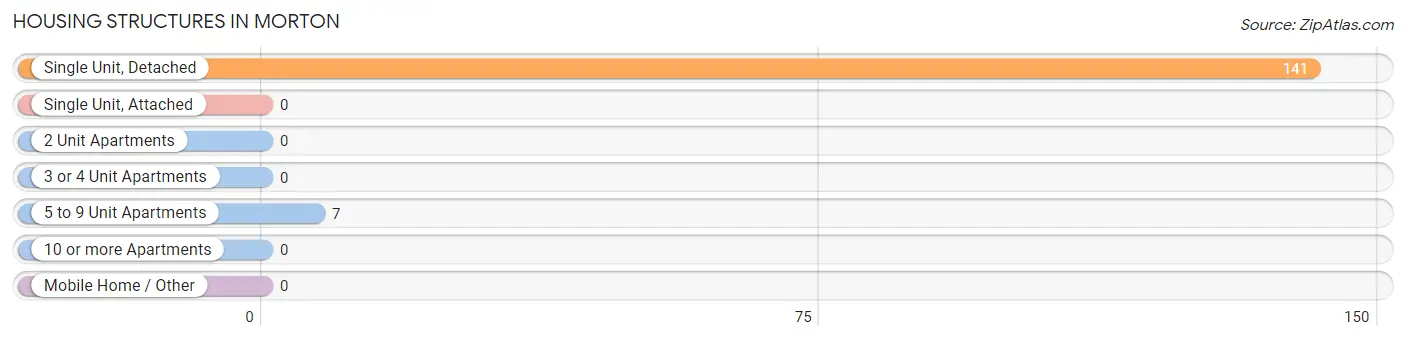
| Structure Type | # Housing Units | % Housing Units |
| Single Unit, Detached | 141 | 95.3% |
| Single Unit, Attached | 0 | 0.0% |
| 2 Unit Apartments | 0 | 0.0% |
| 3 or 4 Unit Apartments | 0 | 0.0% |
| 5 to 9 Unit Apartments | 7 | 4.7% |
| 10 or more Apartments | 0 | 0.0% |
| Mobile Home / Other | 0 | 0.0% |
| Total | 148 | 100.0% |
Housing Structures by Occupancy in Morton
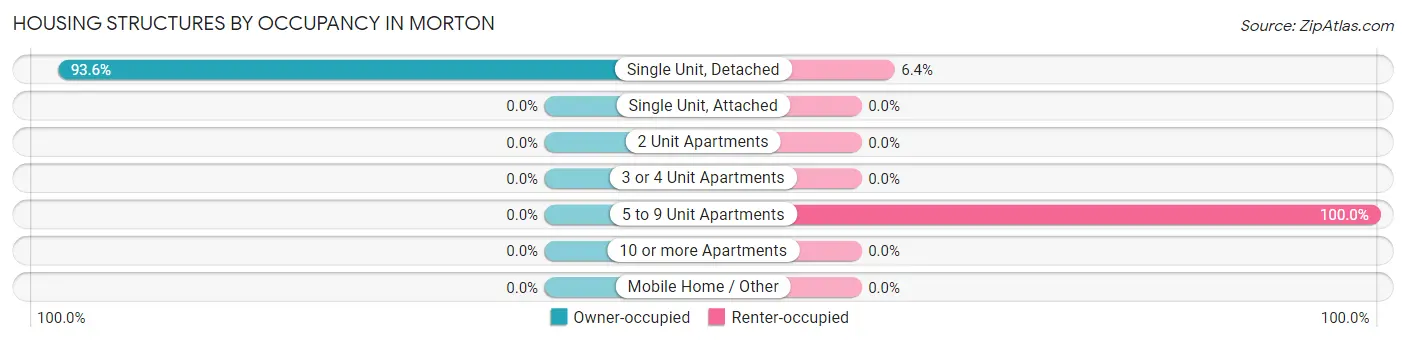
| Structure Type | Owner-occupied | Renter-occupied |
| Single Unit, Detached | 132 (93.6%) | 9 (6.4%) |
| Single Unit, Attached | 0 (0.0%) | 0 (0.0%) |
| 2 Unit Apartments | 0 (0.0%) | 0 (0.0%) |
| 3 or 4 Unit Apartments | 0 (0.0%) | 0 (0.0%) |
| 5 to 9 Unit Apartments | 0 (0.0%) | 7 (100.0%) |
| 10 or more Apartments | 0 (0.0%) | 0 (0.0%) |
| Mobile Home / Other | 0 (0.0%) | 0 (0.0%) |
| Total | 132 (89.2%) | 16 (10.8%) |
Housing Structures by Number of Rooms in Morton
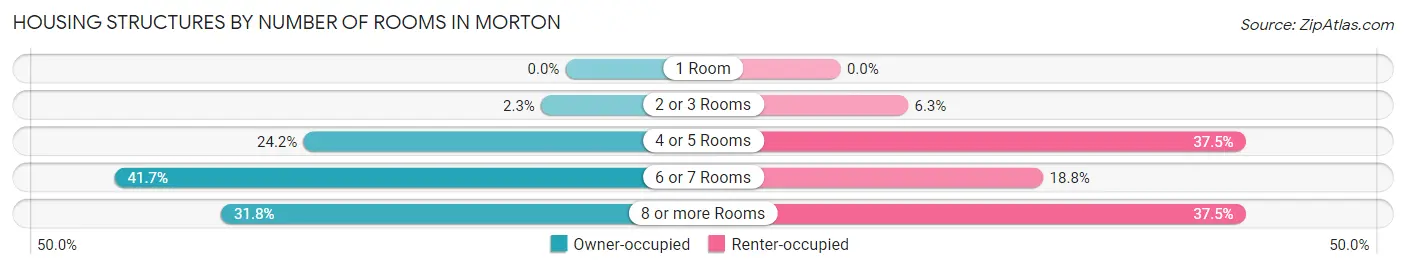
| Number of Rooms | Owner-occupied | Renter-occupied |
| 1 Room | 0 (0.0%) | 0 (0.0%) |
| 2 or 3 Rooms | 3 (2.3%) | 1 (6.2%) |
| 4 or 5 Rooms | 32 (24.2%) | 6 (37.5%) |
| 6 or 7 Rooms | 55 (41.7%) | 3 (18.8%) |
| 8 or more Rooms | 42 (31.8%) | 6 (37.5%) |
| Total | 132 (100.0%) | 16 (100.0%) |
Housing Structure by Heating Type in Morton
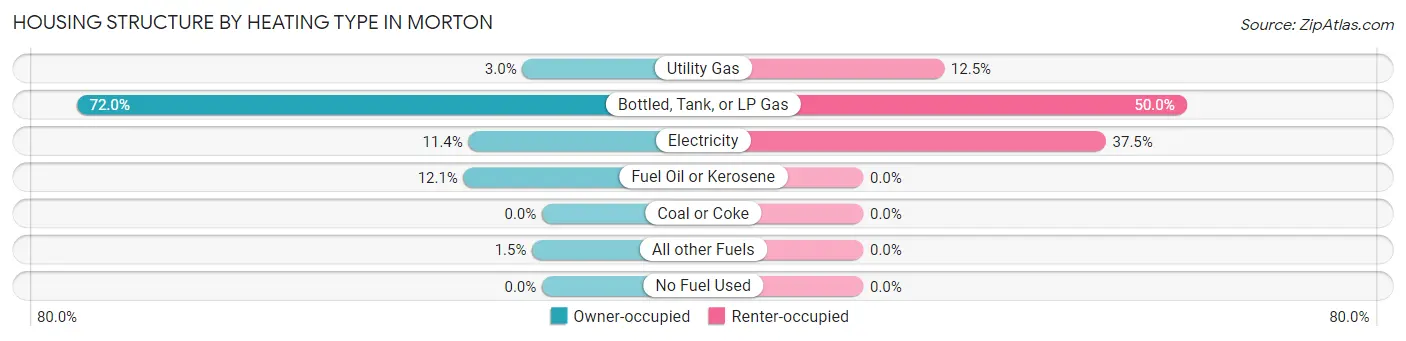
| Heating Type | Owner-occupied | Renter-occupied |
| Utility Gas | 4 (3.0%) | 2 (12.5%) |
| Bottled, Tank, or LP Gas | 95 (72.0%) | 8 (50.0%) |
| Electricity | 15 (11.4%) | 6 (37.5%) |
| Fuel Oil or Kerosene | 16 (12.1%) | 0 (0.0%) |
| Coal or Coke | 0 (0.0%) | 0 (0.0%) |
| All other Fuels | 2 (1.5%) | 0 (0.0%) |
| No Fuel Used | 0 (0.0%) | 0 (0.0%) |
| Total | 132 (100.0%) | 16 (100.0%) |
Household Vehicle Usage in Morton
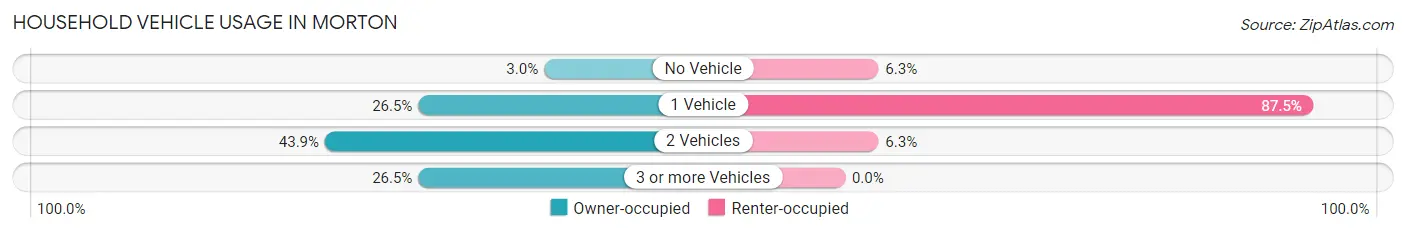
| Vehicles per Household | Owner-occupied | Renter-occupied |
| No Vehicle | 4 (3.0%) | 1 (6.2%) |
| 1 Vehicle | 35 (26.5%) | 14 (87.5%) |
| 2 Vehicles | 58 (43.9%) | 1 (6.2%) |
| 3 or more Vehicles | 35 (26.5%) | 0 (0.0%) |
| Total | 132 (100.0%) | 16 (100.0%) |
Real Estate & Mortgages in Morton
Real Estate and Mortgage Overview in Morton
| Characteristic | Without Mortgage | With Mortgage |
| Housing Units | 67 | 65 |
| Median Property Value | $71,400 | $74,200 |
| Median Household Income | $51,250 | $1 |
| Monthly Housing Costs | $522 | $0 |
| Real Estate Taxes | $870 | $0 |
Property Value by Mortgage Status in Morton
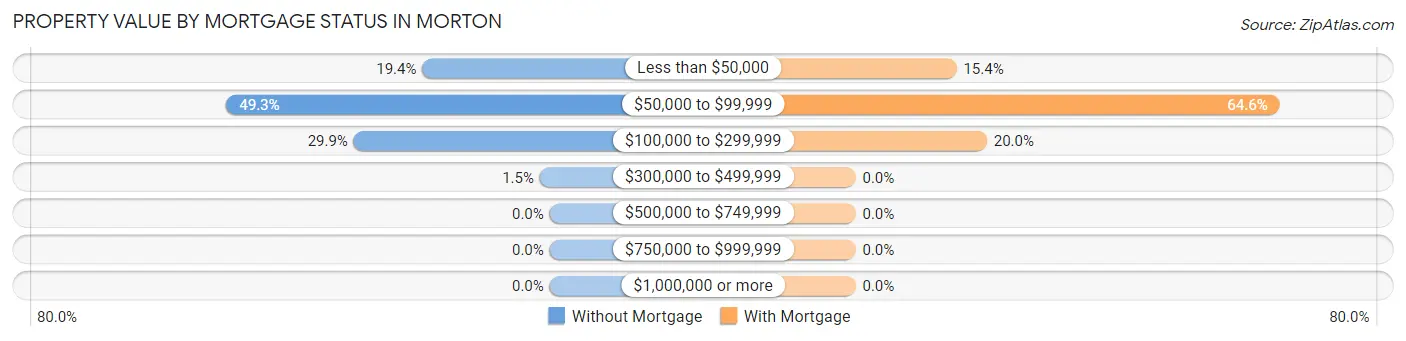
| Property Value | Without Mortgage | With Mortgage |
| Less than $50,000 | 13 (19.4%) | 10 (15.4%) |
| $50,000 to $99,999 | 33 (49.2%) | 42 (64.6%) |
| $100,000 to $299,999 | 20 (29.8%) | 13 (20.0%) |
| $300,000 to $499,999 | 1 (1.5%) | 0 (0.0%) |
| $500,000 to $749,999 | 0 (0.0%) | 0 (0.0%) |
| $750,000 to $999,999 | 0 (0.0%) | 0 (0.0%) |
| $1,000,000 or more | 0 (0.0%) | 0 (0.0%) |
| Total | 67 (100.0%) | 65 (100.0%) |
Household Income by Mortgage Status in Morton
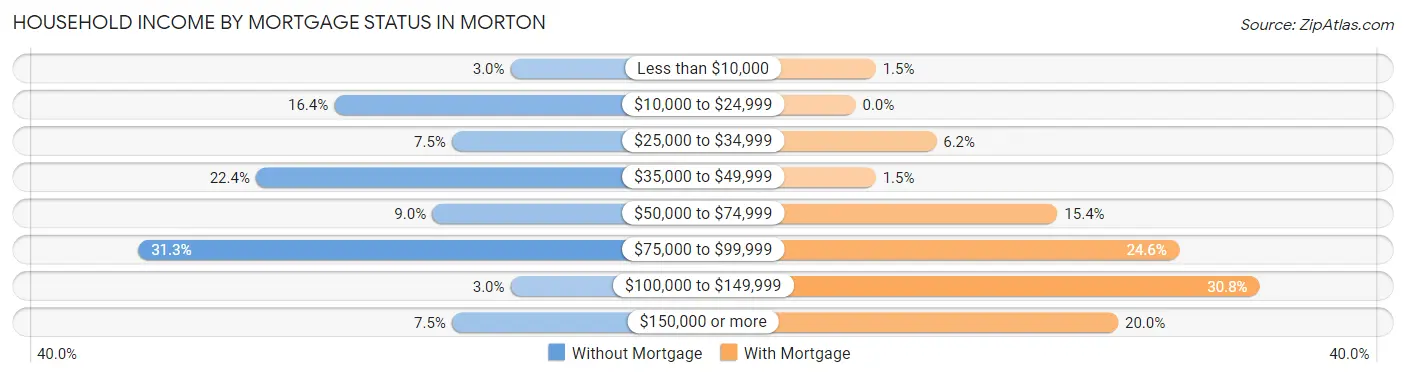
| Household Income | Without Mortgage | With Mortgage |
| Less than $10,000 | 2 (3.0%) | 1 (1.5%) |
| $10,000 to $24,999 | 11 (16.4%) | 0 (0.0%) |
| $25,000 to $34,999 | 5 (7.5%) | 4 (6.1%) |
| $35,000 to $49,999 | 15 (22.4%) | 1 (1.5%) |
| $50,000 to $74,999 | 6 (9.0%) | 10 (15.4%) |
| $75,000 to $99,999 | 21 (31.3%) | 16 (24.6%) |
| $100,000 to $149,999 | 2 (3.0%) | 20 (30.8%) |
| $150,000 or more | 5 (7.5%) | 13 (20.0%) |
| Total | 67 (100.0%) | 65 (100.0%) |
Property Value to Household Income Ratio in Morton
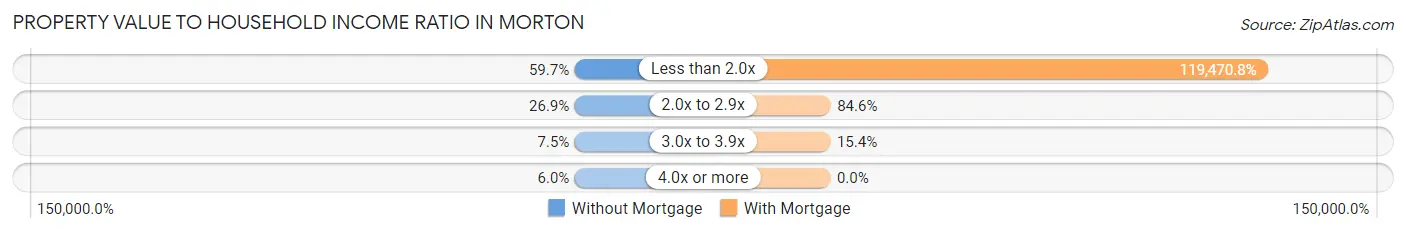
| Value-to-Income Ratio | Without Mortgage | With Mortgage |
| Less than 2.0x | 40 (59.7%) | 77,656 (119,470.8%) |
| 2.0x to 2.9x | 18 (26.9%) | 55 (84.6%) |
| 3.0x to 3.9x | 5 (7.5%) | 10 (15.4%) |
| 4.0x or more | 4 (6.0%) | 0 (0.0%) |
| Total | 67 (100.0%) | 65 (100.0%) |
Real Estate Taxes by Mortgage Status in Morton
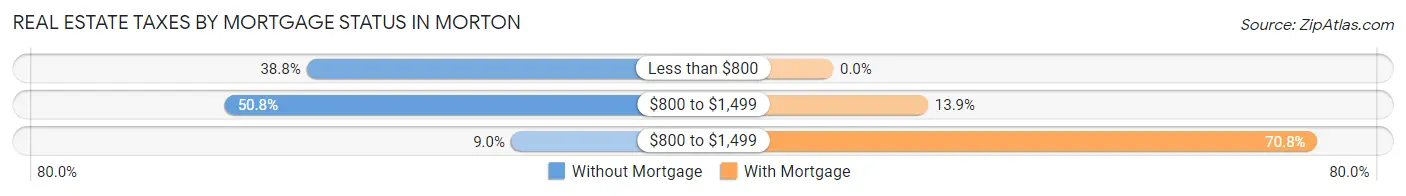
| Property Taxes | Without Mortgage | With Mortgage |
| Less than $800 | 26 (38.8%) | 0 (0.0%) |
| $800 to $1,499 | 34 (50.7%) | 9 (13.9%) |
| $800 to $1,499 | 6 (9.0%) | 46 (70.8%) |
| Total | 67 (100.0%) | 65 (100.0%) |
Health & Disability in Morton
Health Insurance Coverage by Age in Morton
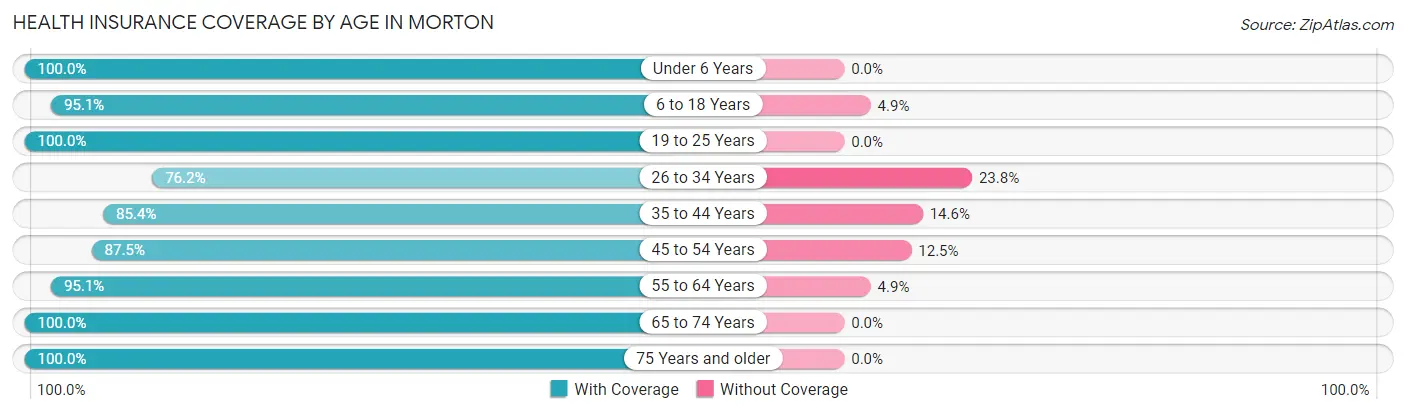
| Age Bracket | With Coverage | Without Coverage |
| Under 6 Years | 20 (100.0%) | 0 (0.0%) |
| 6 to 18 Years | 58 (95.1%) | 3 (4.9%) |
| 19 to 25 Years | 27 (100.0%) | 0 (0.0%) |
| 26 to 34 Years | 32 (76.2%) | 10 (23.8%) |
| 35 to 44 Years | 35 (85.4%) | 6 (14.6%) |
| 45 to 54 Years | 35 (87.5%) | 5 (12.5%) |
| 55 to 64 Years | 58 (95.1%) | 3 (4.9%) |
| 65 to 74 Years | 56 (100.0%) | 0 (0.0%) |
| 75 Years and older | 22 (100.0%) | 0 (0.0%) |
| Total | 343 (92.7%) | 27 (7.3%) |
Health Insurance Coverage by Citizenship Status in Morton
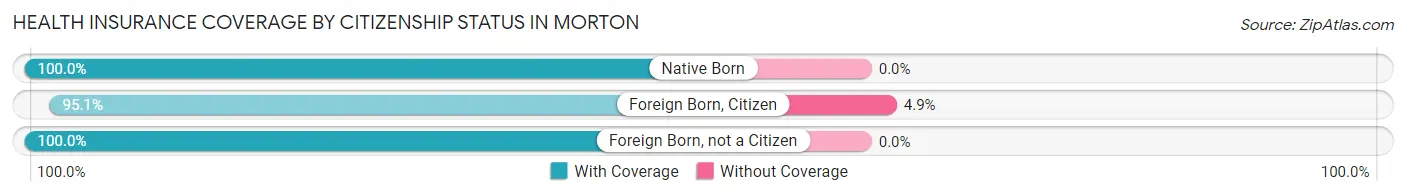
| Citizenship Status | With Coverage | Without Coverage |
| Native Born | 20 (100.0%) | 0 (0.0%) |
| Foreign Born, Citizen | 58 (95.1%) | 3 (4.9%) |
| Foreign Born, not a Citizen | 27 (100.0%) | 0 (0.0%) |
Health Insurance Coverage by Household Income in Morton
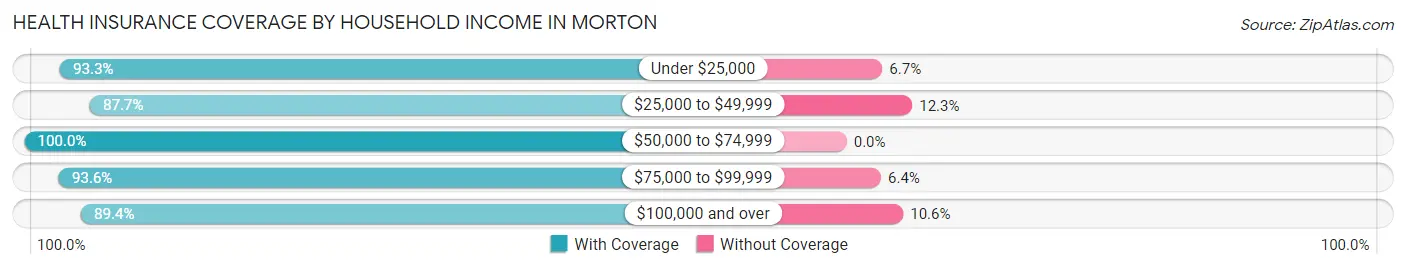
| Household Income | With Coverage | Without Coverage |
| Under $25,000 | 28 (93.3%) | 2 (6.7%) |
| $25,000 to $49,999 | 50 (87.7%) | 7 (12.3%) |
| $50,000 to $74,999 | 58 (100.0%) | 0 (0.0%) |
| $75,000 to $99,999 | 131 (93.6%) | 9 (6.4%) |
| $100,000 and over | 76 (89.4%) | 9 (10.6%) |
Public vs Private Health Insurance Coverage by Age in Morton
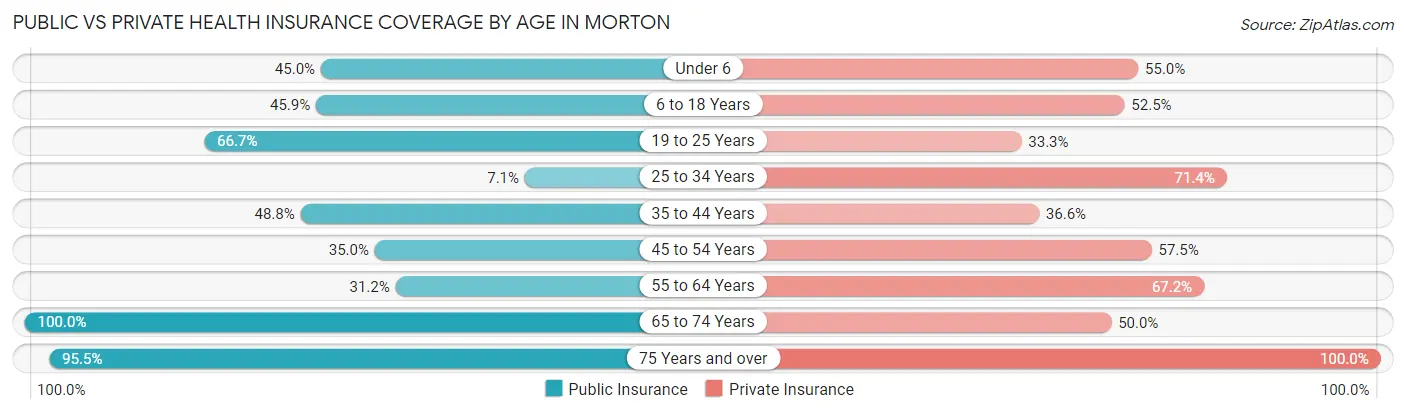
| Age Bracket | Public Insurance | Private Insurance |
| Under 6 | 9 (45.0%) | 11 (55.0%) |
| 6 to 18 Years | 28 (45.9%) | 32 (52.5%) |
| 19 to 25 Years | 18 (66.7%) | 9 (33.3%) |
| 25 to 34 Years | 3 (7.1%) | 30 (71.4%) |
| 35 to 44 Years | 20 (48.8%) | 15 (36.6%) |
| 45 to 54 Years | 14 (35.0%) | 23 (57.5%) |
| 55 to 64 Years | 19 (31.1%) | 41 (67.2%) |
| 65 to 74 Years | 56 (100.0%) | 28 (50.0%) |
| 75 Years and over | 21 (95.5%) | 22 (100.0%) |
| Total | 188 (50.8%) | 211 (57.0%) |
Disability Status by Sex by Age in Morton
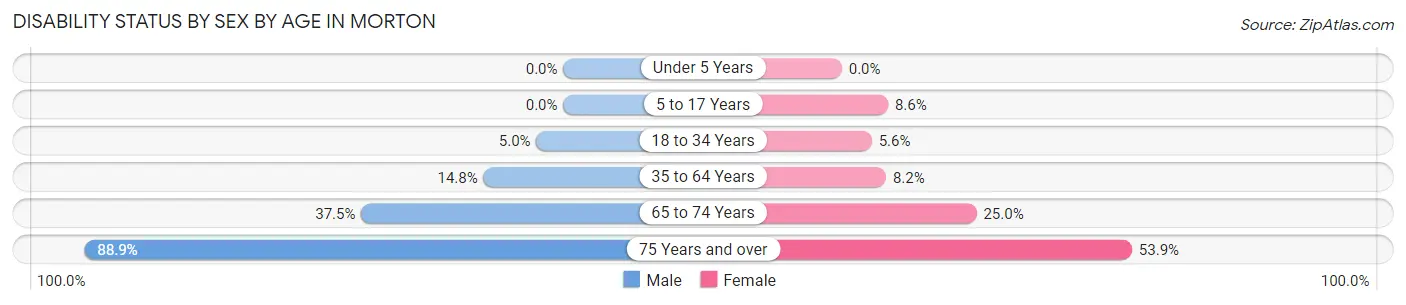
| Age Bracket | Male | Female |
| Under 5 Years | 0 (0.0%) | 0 (0.0%) |
| 5 to 17 Years | 0 (0.0%) | 3 (8.6%) |
| 18 to 34 Years | 2 (5.0%) | 2 (5.6%) |
| 35 to 64 Years | 12 (14.8%) | 5 (8.2%) |
| 65 to 74 Years | 12 (37.5%) | 6 (25.0%) |
| 75 Years and over | 8 (88.9%) | 7 (53.8%) |
Disability Class by Sex by Age in Morton
Disability Class: Hearing Difficulty
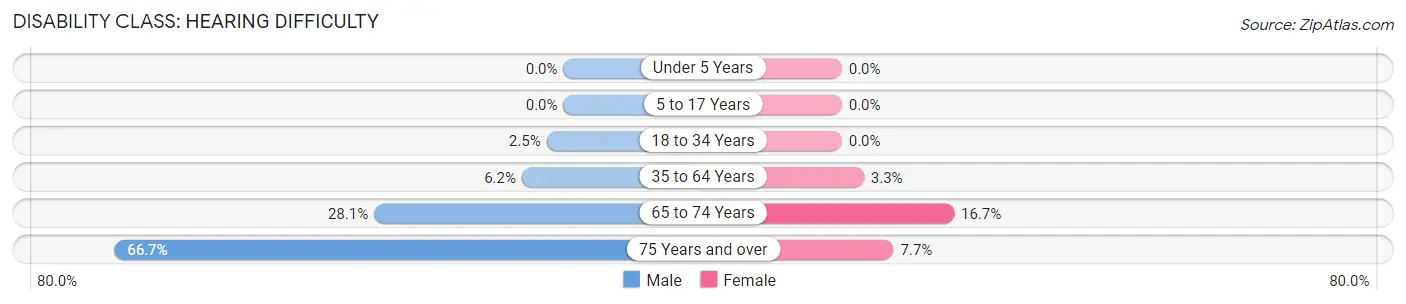
| Age Bracket | Male | Female |
| Under 5 Years | 0 (0.0%) | 0 (0.0%) |
| 5 to 17 Years | 0 (0.0%) | 0 (0.0%) |
| 18 to 34 Years | 1 (2.5%) | 0 (0.0%) |
| 35 to 64 Years | 5 (6.2%) | 2 (3.3%) |
| 65 to 74 Years | 9 (28.1%) | 4 (16.7%) |
| 75 Years and over | 6 (66.7%) | 1 (7.7%) |
Disability Class: Vision Difficulty
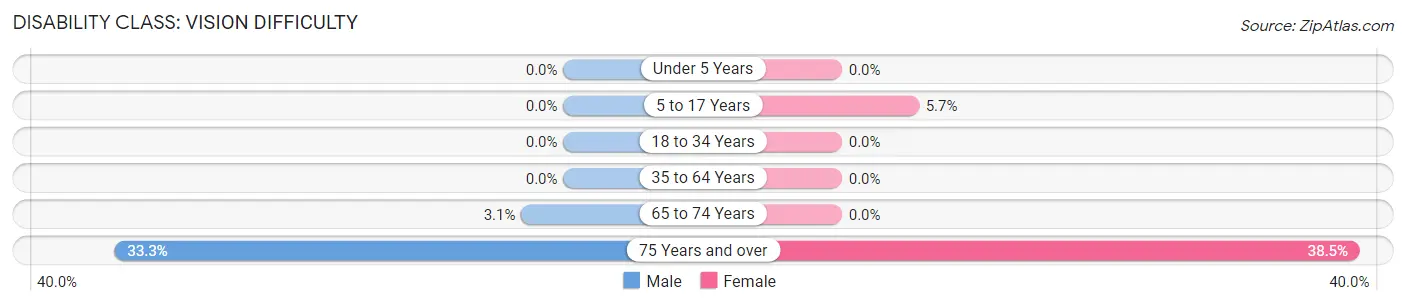
| Age Bracket | Male | Female |
| Under 5 Years | 0 (0.0%) | 0 (0.0%) |
| 5 to 17 Years | 0 (0.0%) | 2 (5.7%) |
| 18 to 34 Years | 0 (0.0%) | 0 (0.0%) |
| 35 to 64 Years | 0 (0.0%) | 0 (0.0%) |
| 65 to 74 Years | 1 (3.1%) | 0 (0.0%) |
| 75 Years and over | 3 (33.3%) | 5 (38.5%) |
Disability Class: Cognitive Difficulty
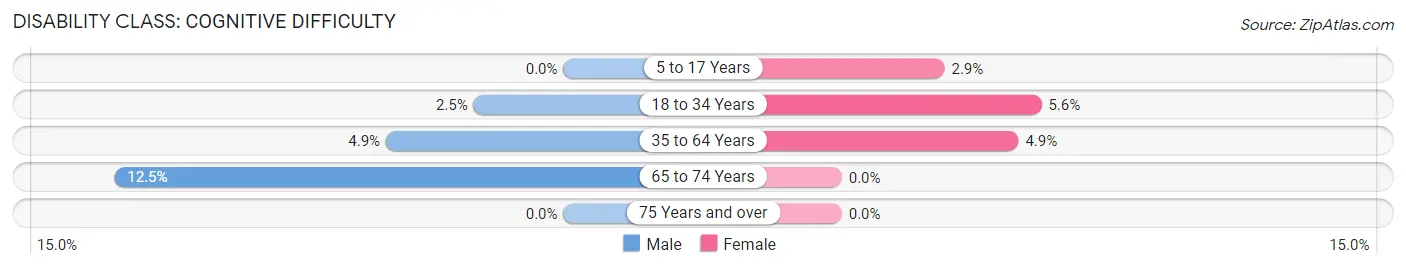
| Age Bracket | Male | Female |
| 5 to 17 Years | 0 (0.0%) | 1 (2.9%) |
| 18 to 34 Years | 1 (2.5%) | 2 (5.6%) |
| 35 to 64 Years | 4 (4.9%) | 3 (4.9%) |
| 65 to 74 Years | 4 (12.5%) | 0 (0.0%) |
| 75 Years and over | 0 (0.0%) | 0 (0.0%) |
Disability Class: Ambulatory Difficulty
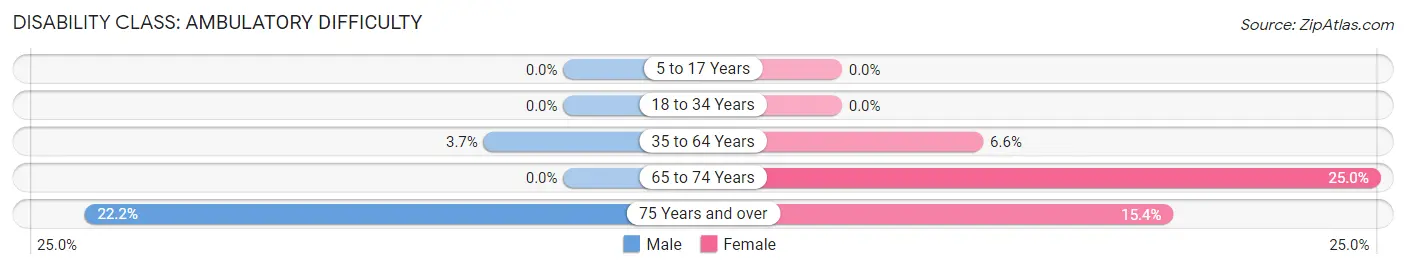
| Age Bracket | Male | Female |
| 5 to 17 Years | 0 (0.0%) | 0 (0.0%) |
| 18 to 34 Years | 0 (0.0%) | 0 (0.0%) |
| 35 to 64 Years | 3 (3.7%) | 4 (6.6%) |
| 65 to 74 Years | 0 (0.0%) | 6 (25.0%) |
| 75 Years and over | 2 (22.2%) | 2 (15.4%) |
Disability Class: Self-Care Difficulty
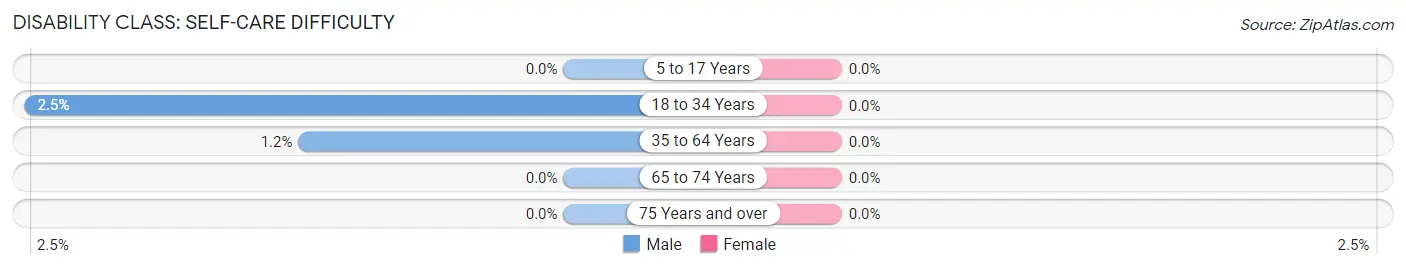
| Age Bracket | Male | Female |
| 5 to 17 Years | 0 (0.0%) | 0 (0.0%) |
| 18 to 34 Years | 1 (2.5%) | 0 (0.0%) |
| 35 to 64 Years | 1 (1.2%) | 0 (0.0%) |
| 65 to 74 Years | 0 (0.0%) | 0 (0.0%) |
| 75 Years and over | 0 (0.0%) | 0 (0.0%) |
Technology Access in Morton
Computing Device Access in Morton
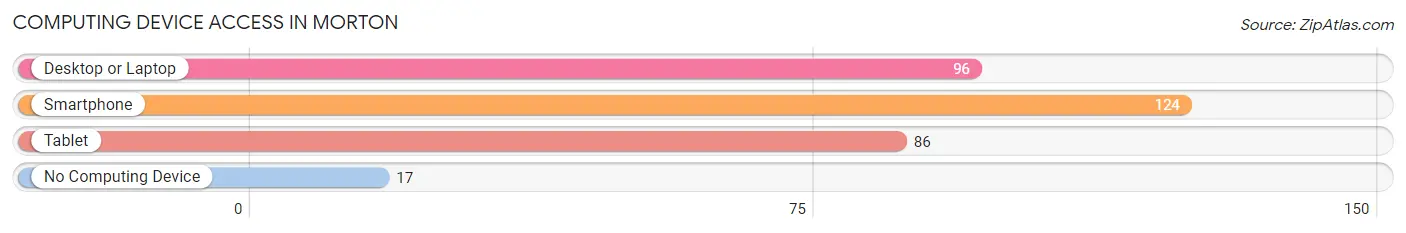
| Device Type | # Households | % Households |
| Desktop or Laptop | 96 | 64.9% |
| Smartphone | 124 | 83.8% |
| Tablet | 86 | 58.1% |
| No Computing Device | 17 | 11.5% |
| Total | 148 | 100.0% |
Internet Access in Morton
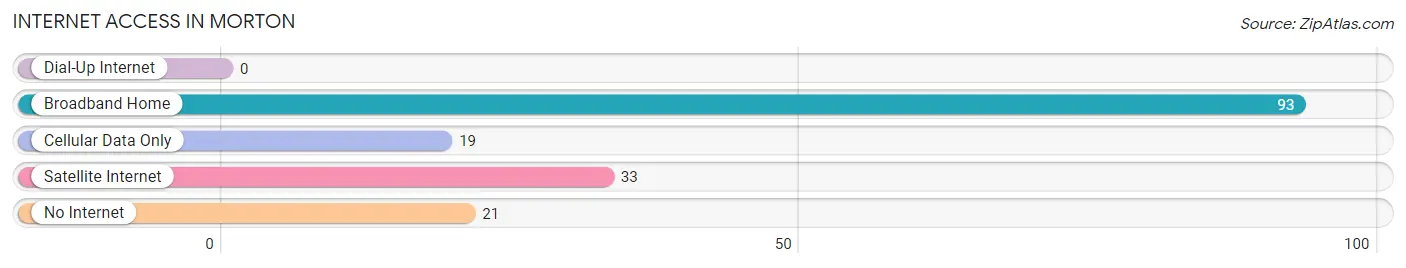
| Internet Type | # Households | % Households |
| Dial-Up Internet | 0 | 0.0% |
| Broadband Home | 93 | 62.8% |
| Cellular Data Only | 19 | 12.8% |
| Satellite Internet | 33 | 22.3% |
| No Internet | 21 | 14.2% |
| Total | 148 | 100.0% |
Morton Summary
Morton, Minnesota is a small city located in Renville County, in the southwestern part of the state. It is situated on the banks of the Minnesota River, about 25 miles northwest of the city of Willmar. The city has a population of 1,845 people, according to the 2010 census.
Morton was founded in 1871 by a group of settlers from the nearby town of Morton Grove. The town was named after the Morton family, who had settled in the area in the early 1800s. The town was originally a farming community, but in the late 19th century, it became a center for the lumber industry. The lumber industry was the main source of employment for the town until the early 20th century, when the industry began to decline.
The economy of Morton is now largely based on agriculture and tourism. The city is home to several small businesses, including a grocery store, a hardware store, and a few restaurants. The city also has a small airport, which serves as a hub for private and commercial flights.
Geographically, Morton is located in the Minnesota River Valley, which is part of the Central Plains region of the United States. The city is surrounded by rolling hills and prairies, and is located near the confluence of the Minnesota and Chippewa Rivers. The city is located about 25 miles northwest of Willmar, and about 50 miles south of Minneapolis.
The climate in Morton is typical of the Central Plains region, with hot summers and cold winters. The average temperature in the summer is around 75 degrees Fahrenheit, and the average temperature in the winter is around 20 degrees Fahrenheit. The city receives an average of 30 inches of precipitation per year.
Demographically, Morton is a predominantly white city, with a population that is 94.3% white, according to the 2010 census. The median household income in the city is $41,944, and the median age is 37.7 years. The city has a low unemployment rate, with only 4.2% of the population unemployed.
Morton is a small city with a rich history and a vibrant economy. It is a great place to live, work, and raise a family. The city is home to a variety of businesses, and offers a variety of recreational activities. The city is also home to a number of historical sites, including the Morton Historical Society Museum, which houses artifacts from the city's past.
Common Questions
What is Per Capita Income in Morton?
Per Capita income in Morton is $28,426.
What is the Median Family Income in Morton?
Median Family Income in Morton is $79,904.
What is the Median Household income in Morton?
Median Household Income in Morton is $62,083.
What is Income or Wage Gap in Morton?
Income or Wage Gap in Morton is 5.5%.
Women in Morton earn 94.5 cents for every dollar earned by a man.
What is Inequality or Gini Index in Morton?
Inequality or Gini Index in Morton is 0.33.
What is the Total Population of Morton?
Total Population of Morton is 370.
What is the Total Male Population of Morton?
Total Male Population of Morton is 194.
What is the Total Female Population of Morton?
Total Female Population of Morton is 176.
What is the Ratio of Males per 100 Females in Morton?
There are 110.23 Males per 100 Females in Morton.
What is the Ratio of Females per 100 Males in Morton?
There are 90.72 Females per 100 Males in Morton.
What is the Median Population Age in Morton?
Median Population Age in Morton is 42.0 Years.
What is the Average Family Size in Morton
Average Family Size in Morton is 3.2 People.
What is the Average Household Size in Morton
Average Household Size in Morton is 2.5 People.
How Large is the Labor Force in Morton?
There are 176 People in the Labor Forcein in Morton.
What is the Percentage of People in the Labor Force in Morton?
57.5% of People are in the Labor Force in Morton.
What is the Unemployment Rate in Morton?
Unemployment Rate in Morton is 1.1%.