Morris, MN Map & Demographics
Morris Map
Morris Overview
$37,655
PER CAPITA INCOME
$91,842
AVG FAMILY INCOME
$59,261
AVG HOUSEHOLD INCOME
59.1%
WAGE / INCOME GAP [ % ]
40.9¢/ $1
WAGE / INCOME GAP [ $ ]
0.52
INEQUALITY / GINI INDEX
5,094
TOTAL POPULATION
2,483
MALE POPULATION
2,611
FEMALE POPULATION
95.10
MALES / 100 FEMALES
105.16
FEMALES / 100 MALES
31.4
MEDIAN AGE
3.1
AVG FAMILY SIZE
2.2
AVG HOUSEHOLD SIZE
2,745
LABOR FORCE [ PEOPLE ]
65.1%
PERCENT IN LABOR FORCE
0.4%
UNEMPLOYMENT RATE
Morris Zip Codes
Morris Area Codes
Income in Morris
Income Overview in Morris
Per Capita Income in Morris is $37,655, while median incomes of families and households are $91,842 and $59,261 respectively.
| Characteristic | Number | Measure |
| Per Capita Income | 5,094 | $37,655 |
| Median Family Income | 1,050 | $91,842 |
| Mean Family Income | 1,050 | $137,631 |
| Median Household Income | 2,110 | $59,261 |
| Mean Household Income | 2,110 | $88,920 |
| Income Deficit | 1,050 | $0 |
| Wage / Income Gap (%) | 5,094 | 59.11% |
| Wage / Income Gap ($) | 5,094 | 40.89¢ per $1 |
| Gini / Inequality Index | 5,094 | 0.52 |
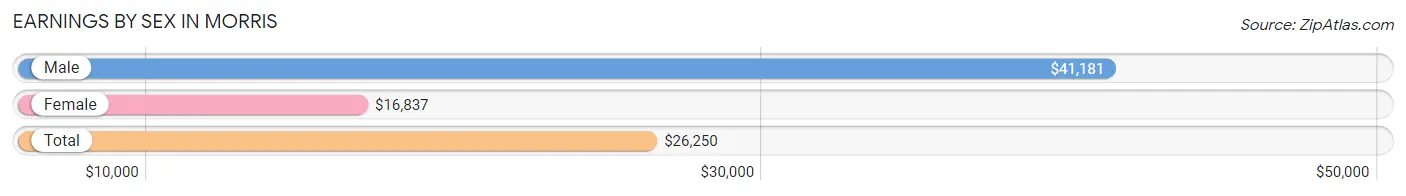
Earnings by Sex in Morris
Average Earnings in Morris are $26,250, $41,181 for men and $16,837 for women, a difference of 59.1%.
| Sex | Number | Average Earnings |
| Male | 1,484 (49.7%) | $41,181 |
| Female | 1,504 (50.3%) | $16,837 |
| Total | 2,988 (100.0%) | $26,250 |
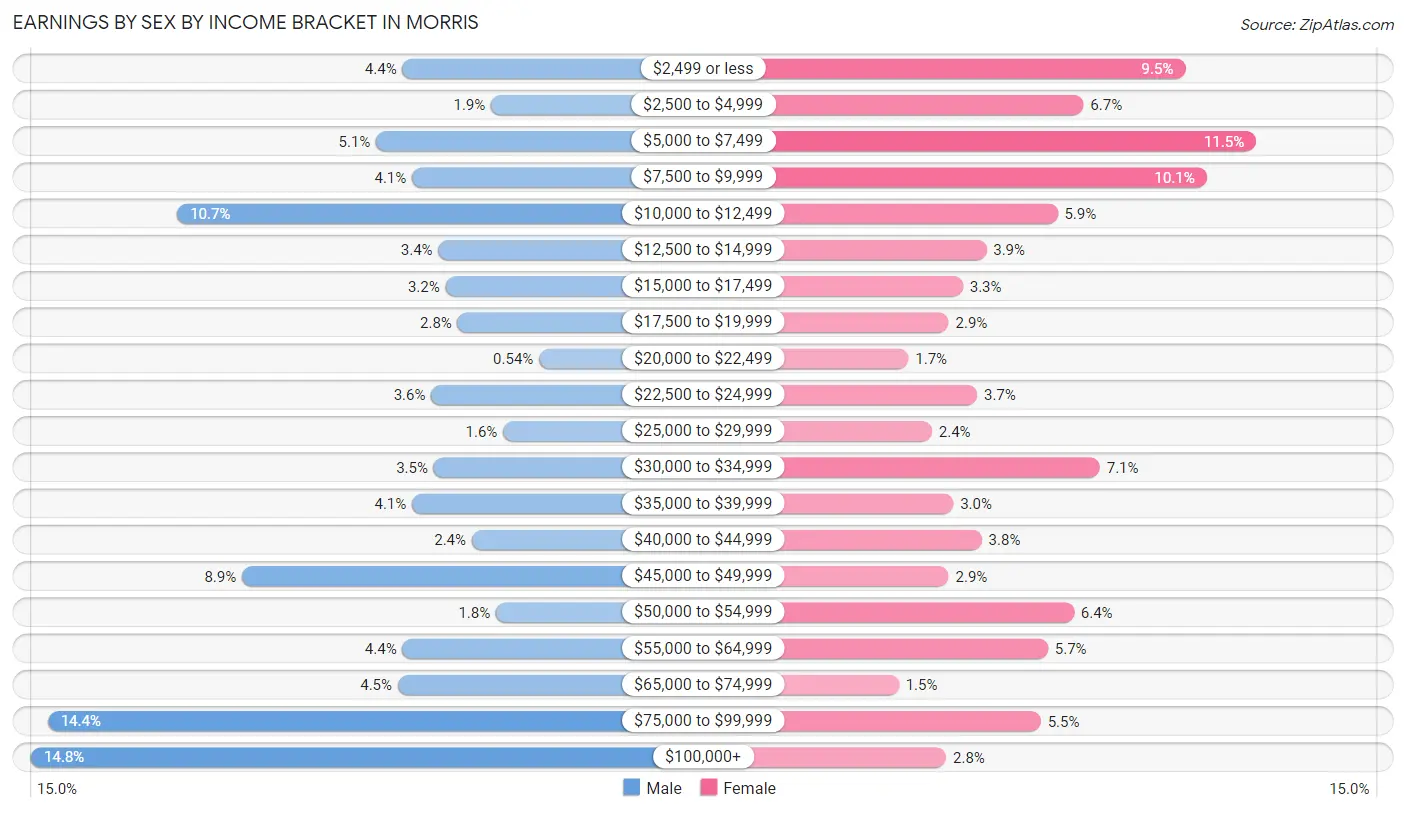
Earnings by Sex by Income Bracket in Morris
The most common earnings brackets in Morris are $100,000+ for men (220 | 14.8%) and $5,000 to $7,499 for women (173 | 11.5%).
| Income | Male | Female |
| $2,499 or less | 65 (4.4%) | 143 (9.5%) |
| $2,500 to $4,999 | 28 (1.9%) | 100 (6.7%) |
| $5,000 to $7,499 | 76 (5.1%) | 173 (11.5%) |
| $7,500 to $9,999 | 61 (4.1%) | 152 (10.1%) |
| $10,000 to $12,499 | 159 (10.7%) | 89 (5.9%) |
| $12,500 to $14,999 | 50 (3.4%) | 59 (3.9%) |
| $15,000 to $17,499 | 47 (3.2%) | 49 (3.3%) |
| $17,500 to $19,999 | 42 (2.8%) | 43 (2.9%) |
| $20,000 to $22,499 | 8 (0.5%) | 26 (1.7%) |
| $22,500 to $24,999 | 53 (3.6%) | 55 (3.7%) |
| $25,000 to $29,999 | 23 (1.5%) | 36 (2.4%) |
| $30,000 to $34,999 | 52 (3.5%) | 107 (7.1%) |
| $35,000 to $39,999 | 61 (4.1%) | 45 (3.0%) |
| $40,000 to $44,999 | 36 (2.4%) | 57 (3.8%) |
| $45,000 to $49,999 | 132 (8.9%) | 43 (2.9%) |
| $50,000 to $54,999 | 26 (1.8%) | 96 (6.4%) |
| $55,000 to $64,999 | 65 (4.4%) | 85 (5.7%) |
| $65,000 to $74,999 | 67 (4.5%) | 22 (1.5%) |
| $75,000 to $99,999 | 213 (14.3%) | 82 (5.4%) |
| $100,000+ | 220 (14.8%) | 42 (2.8%) |
| Total | 1,484 (100.0%) | 1,504 (100.0%) |
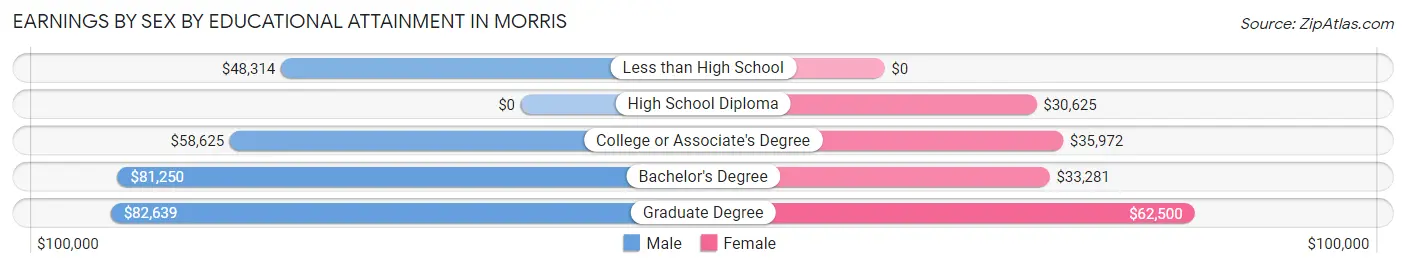
Earnings by Sex by Educational Attainment in Morris
Average earnings in Morris are $60,938 for men and $33,950 for women, a difference of 44.3%. Men with an educational attainment of graduate degree enjoy the highest average annual earnings of $82,639, while those with less than high school education earn the least with $48,314. Women with an educational attainment of graduate degree earn the most with the average annual earnings of $62,500, while those with high school diploma education have the smallest earnings of $30,625.
| Educational Attainment | Male Income | Female Income |
| Less than High School | $48,314 | $0 |
| High School Diploma | - | - |
| College or Associate's Degree | $58,625 | $35,972 |
| Bachelor's Degree | $81,250 | $33,281 |
| Graduate Degree | $82,639 | $62,500 |
| Total | $60,938 | $33,950 |
Family Income in Morris
Family Income Brackets in Morris
According to the Morris family income data, there are 222 families falling into the $75,000 to $99,999 income range, which is the most common income bracket and makes up 21.1% of all families. Conversely, the $15,000 to $24,999 income bracket is the least frequent group with only 16 families (1.5%) belonging to this category.
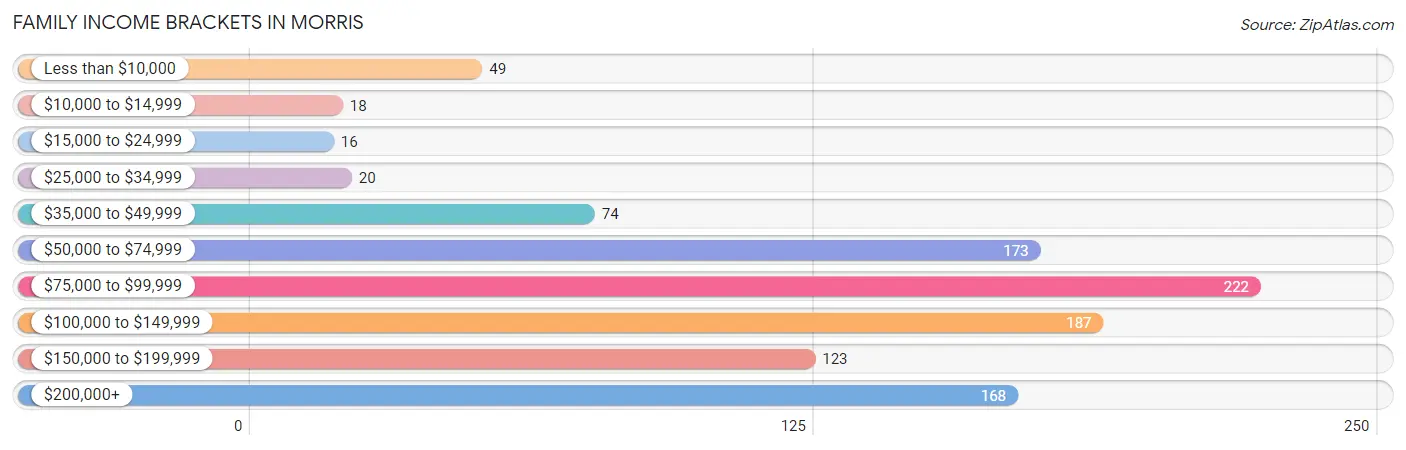
| Income Bracket | # Families | % Families |
| Less than $10,000 | 49 | 4.7% |
| $10,000 to $14,999 | 18 | 1.7% |
| $15,000 to $24,999 | 16 | 1.5% |
| $25,000 to $34,999 | 20 | 1.9% |
| $35,000 to $49,999 | 74 | 7.0% |
| $50,000 to $74,999 | 173 | 16.5% |
| $75,000 to $99,999 | 222 | 21.1% |
| $100,000 to $149,999 | 187 | 17.8% |
| $150,000 to $199,999 | 123 | 11.7% |
| $200,000+ | 168 | 16.0% |
Family Income by Famaliy Size in Morris
3-person families (199 | 19.0%) account for the highest median family income in Morris with $122,386 per family, while 2-person families (463 | 44.1%) have the highest median income of $43,525 per family member.
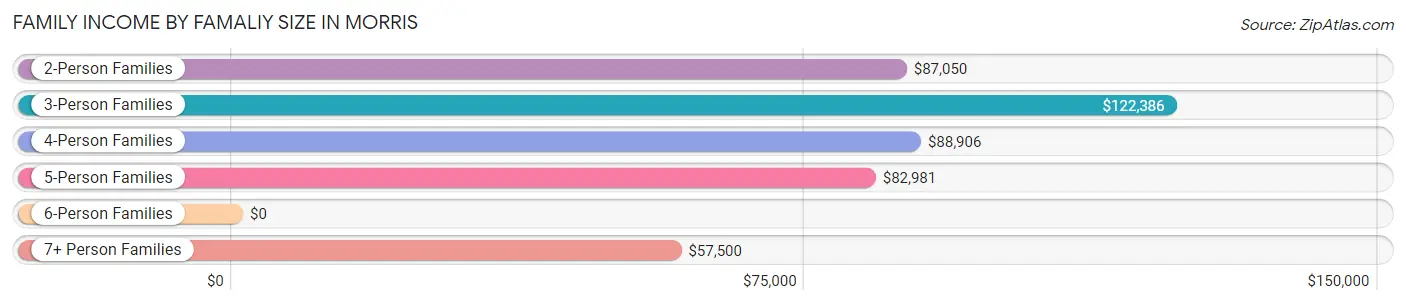
| Income Bracket | # Families | Median Income |
| 2-Person Families | 463 (44.1%) | $87,050 |
| 3-Person Families | 199 (19.0%) | $122,386 |
| 4-Person Families | 191 (18.2%) | $88,906 |
| 5-Person Families | 163 (15.5%) | $82,981 |
| 6-Person Families | 0 (0.0%) | $0 |
| 7+ Person Families | 34 (3.2%) | $57,500 |
| Total | 1,050 (100.0%) | $91,842 |
Family Income by Number of Earners in Morris
The median family income in Morris is $91,842, with families comprising 3+ earners (85) having the highest median family income of $120,893, while families with 1 earner (254) have the lowest median family income of $65,000, accounting for 8.1% and 24.2% of families, respectively.
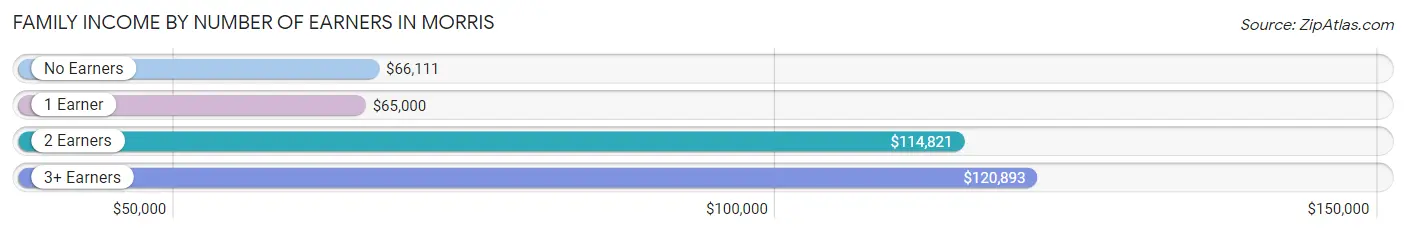
| Number of Earners | # Families | Median Income |
| No Earners | 164 (15.6%) | $66,111 |
| 1 Earner | 254 (24.2%) | $65,000 |
| 2 Earners | 547 (52.1%) | $114,821 |
| 3+ Earners | 85 (8.1%) | $120,893 |
| Total | 1,050 (100.0%) | $91,842 |
Household Income in Morris
Household Income Brackets in Morris
With 333 households falling in the category, the $50,000 to $74,999 income range is the most frequent in Morris, accounting for 15.8% of all households. In contrast, only 122 households (5.8%) fall into the $150,000 to $199,999 income bracket, making it the least populous group.
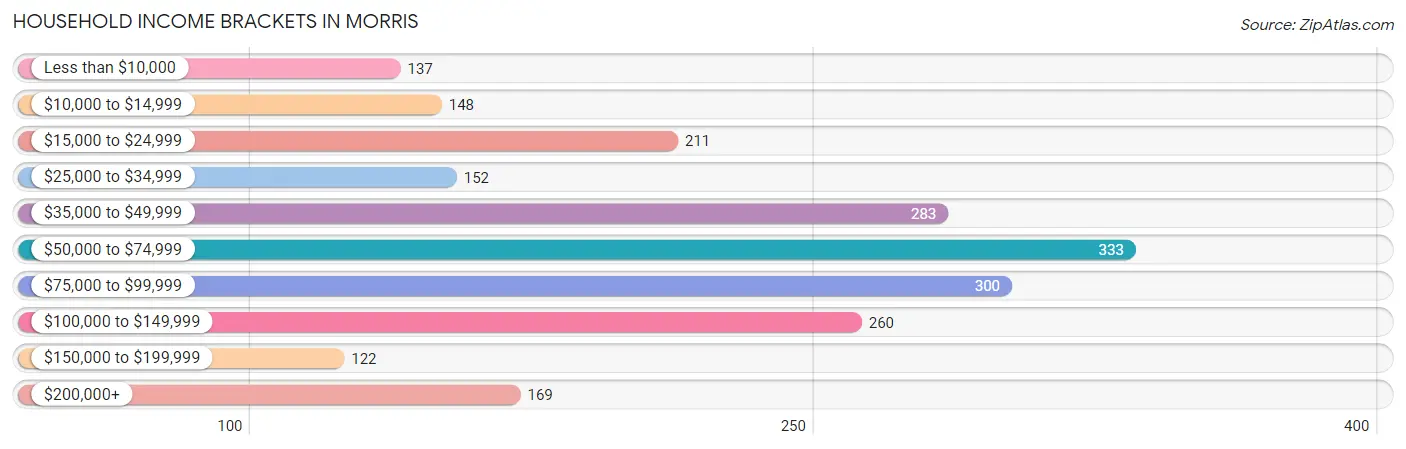
| Income Bracket | # Households | % Households |
| Less than $10,000 | 137 | 6.5% |
| $10,000 to $14,999 | 148 | 7.0% |
| $15,000 to $24,999 | 211 | 10.0% |
| $25,000 to $34,999 | 152 | 7.2% |
| $35,000 to $49,999 | 283 | 13.4% |
| $50,000 to $74,999 | 333 | 15.8% |
| $75,000 to $99,999 | 300 | 14.2% |
| $100,000 to $149,999 | 260 | 12.3% |
| $150,000 to $199,999 | 122 | 5.8% |
| $200,000+ | 169 | 8.0% |
Household Income by Householder Age in Morris
The median household income in Morris is $59,261, with the highest median household income of $85,769 found in the 25 to 44 years age bracket for the primary householder. A total of 640 households (30.3%) fall into this category. Meanwhile, the 15 to 24 years age bracket for the primary householder has the lowest median household income of $30,833, with 338 households (16.0%) in this group.
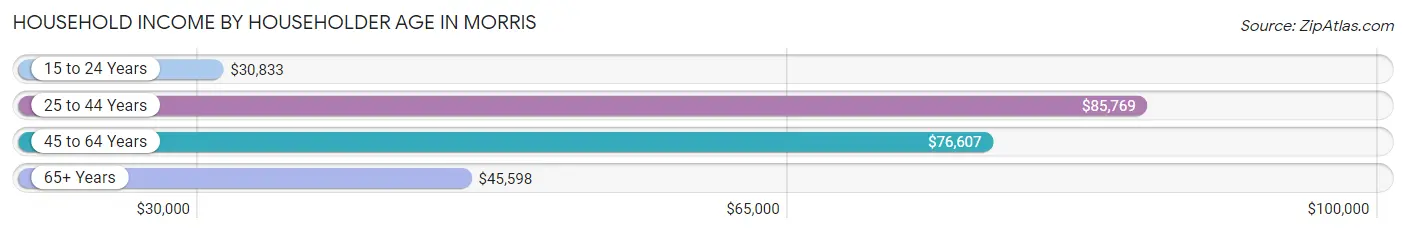
| Income Bracket | # Households | Median Income |
| 15 to 24 Years | 338 (16.0%) | $30,833 |
| 25 to 44 Years | 640 (30.3%) | $85,769 |
| 45 to 64 Years | 601 (28.5%) | $76,607 |
| 65+ Years | 531 (25.2%) | $45,598 |
| Total | 2,110 (100.0%) | $59,261 |
Poverty in Morris
Income Below Poverty by Sex and Age in Morris
With 14.1% poverty level for males and 19.4% for females among the residents of Morris, 12 to 14 year old males and 18 to 24 year old females are the most vulnerable to poverty, with 60 males (47.6%) and 266 females (46.8%) in their respective age groups living below the poverty level.
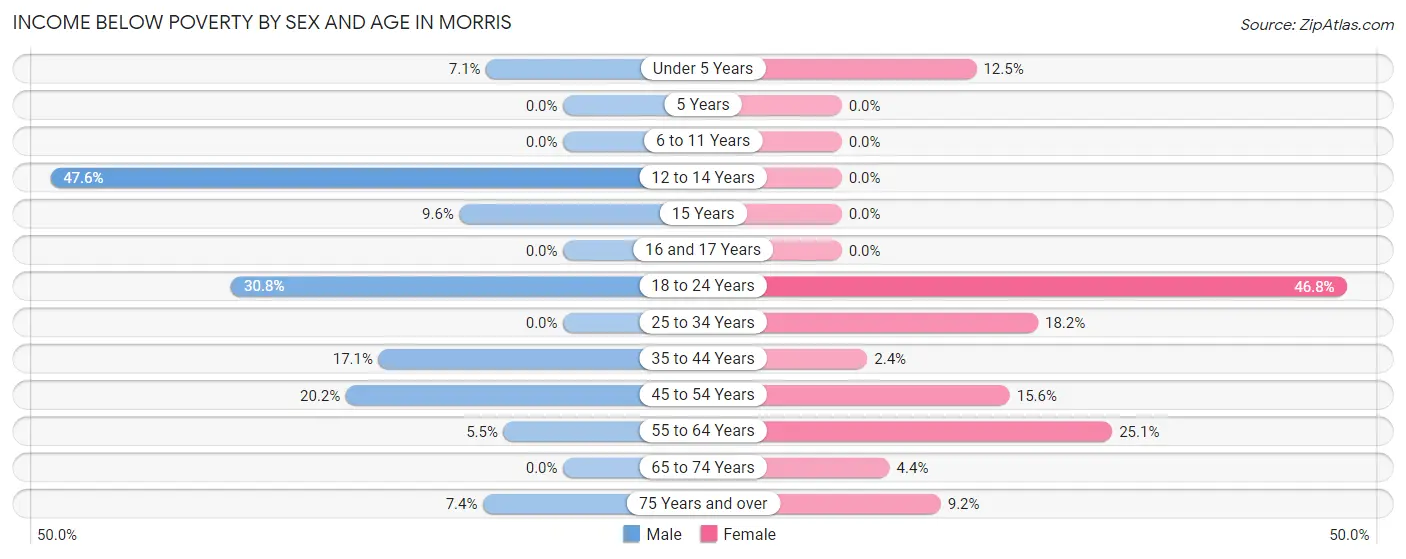
| Age Bracket | Male | Female |
| Under 5 Years | 13 (7.1%) | 16 (12.5%) |
| 5 Years | 0 (0.0%) | 0 (0.0%) |
| 6 to 11 Years | 0 (0.0%) | 0 (0.0%) |
| 12 to 14 Years | 60 (47.6%) | 0 (0.0%) |
| 15 Years | 5 (9.6%) | 0 (0.0%) |
| 16 and 17 Years | 0 (0.0%) | 0 (0.0%) |
| 18 to 24 Years | 119 (30.8%) | 266 (46.8%) |
| 25 to 34 Years | 0 (0.0%) | 59 (18.2%) |
| 35 to 44 Years | 62 (17.1%) | 5 (2.4%) |
| 45 to 54 Years | 50 (20.2%) | 29 (15.6%) |
| 55 to 64 Years | 12 (5.5%) | 62 (25.1%) |
| 65 to 74 Years | 0 (0.0%) | 8 (4.4%) |
| 75 Years and over | 11 (7.4%) | 25 (9.2%) |
| Total | 332 (14.1%) | 470 (19.4%) |
Income Above Poverty by Sex and Age in Morris
According to the poverty statistics in Morris, males aged 5 years and females aged 5 years are the age groups that are most secure financially, with 100.0% of males and 100.0% of females in these age groups living above the poverty line.
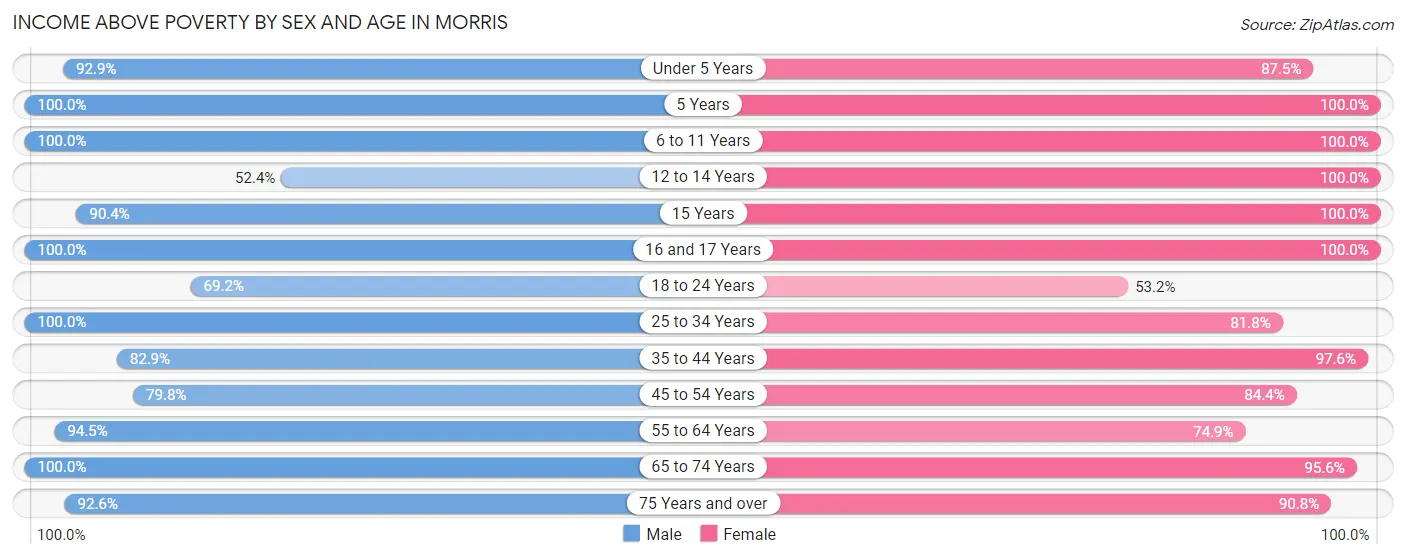
| Age Bracket | Male | Female |
| Under 5 Years | 169 (92.9%) | 112 (87.5%) |
| 5 Years | 19 (100.0%) | 31 (100.0%) |
| 6 to 11 Years | 119 (100.0%) | 93 (100.0%) |
| 12 to 14 Years | 66 (52.4%) | 112 (100.0%) |
| 15 Years | 47 (90.4%) | 14 (100.0%) |
| 16 and 17 Years | 63 (100.0%) | 53 (100.0%) |
| 18 to 24 Years | 267 (69.2%) | 302 (53.2%) |
| 25 to 34 Years | 276 (100.0%) | 265 (81.8%) |
| 35 to 44 Years | 300 (82.9%) | 206 (97.6%) |
| 45 to 54 Years | 198 (79.8%) | 157 (84.4%) |
| 55 to 64 Years | 205 (94.5%) | 185 (74.9%) |
| 65 to 74 Years | 156 (100.0%) | 172 (95.6%) |
| 75 Years and over | 137 (92.6%) | 247 (90.8%) |
| Total | 2,022 (85.9%) | 1,949 (80.6%) |
Income Below Poverty Among Married-Couple Families in Morris
The poverty statistics for married-couple families in Morris show that 3.0% or 26 of the total 855 families live below the poverty line. Families with 1 or 2 children have the highest poverty rate of 6.7%, comprising of 18 families. On the other hand, families with 3 or 4 children have the lowest poverty rate of 0.0%, which includes 0 families.
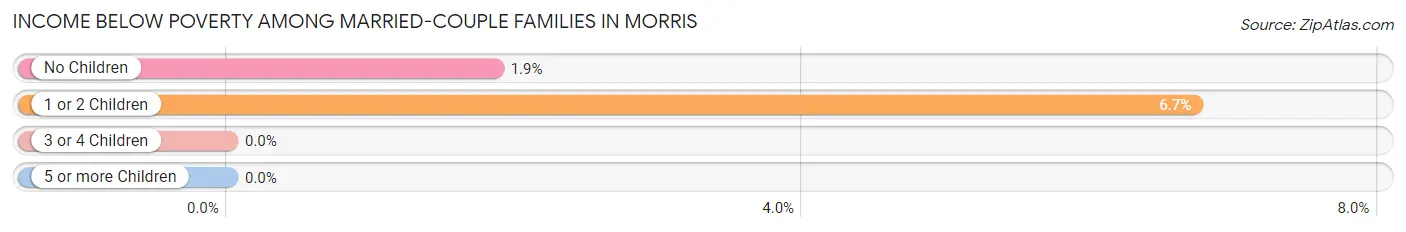
| Children | Above Poverty | Below Poverty |
| No Children | 425 (98.2%) | 8 (1.8%) |
| 1 or 2 Children | 250 (93.3%) | 18 (6.7%) |
| 3 or 4 Children | 147 (100.0%) | 0 (0.0%) |
| 5 or more Children | 7 (100.0%) | 0 (0.0%) |
| Total | 829 (97.0%) | 26 (3.0%) |
Income Below Poverty Among Single-Parent Households in Morris
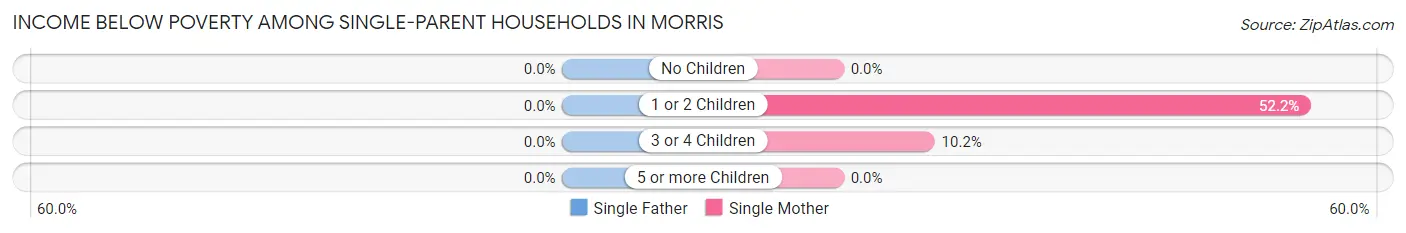
| Children | Single Father | Single Mother |
| No Children | 0 (0.0%) | 0 (0.0%) |
| 1 or 2 Children | 0 (0.0%) | 35 (52.2%) |
| 3 or 4 Children | 0 (0.0%) | 6 (10.2%) |
| 5 or more Children | 0 (0.0%) | 0 (0.0%) |
| Total | 0 (0.0%) | 41 (25.2%) |
Income Below Poverty Among Married-Couple vs Single-Parent Households in Morris
The poverty data for Morris shows that 26 of the married-couple family households (3.0%) and 41 of the single-parent households (21.0%) are living below the poverty level. Within the married-couple family households, those with 1 or 2 children have the highest poverty rate, with 18 households (6.7%) falling below the poverty line. Among the single-parent households, those with 1 or 2 children have the highest poverty rate, with 35 household (52.2%) living below poverty.
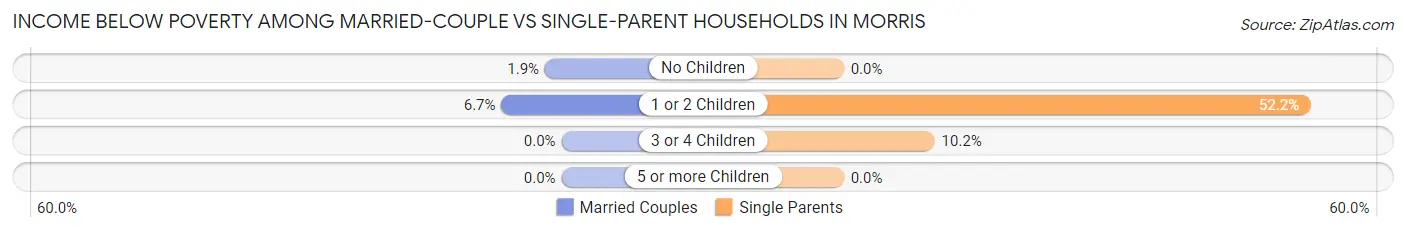
| Children | Married-Couple Families | Single-Parent Households |
| No Children | 8 (1.8%) | 0 (0.0%) |
| 1 or 2 Children | 18 (6.7%) | 35 (52.2%) |
| 3 or 4 Children | 0 (0.0%) | 6 (10.2%) |
| 5 or more Children | 0 (0.0%) | 0 (0.0%) |
| Total | 26 (3.0%) | 41 (21.0%) |
Race in Morris
The most populous races in Morris are White / Caucasian (4,100 | 80.5%), Hispanic or Latino (465 | 9.1%), and Two or more Races (375 | 7.4%).
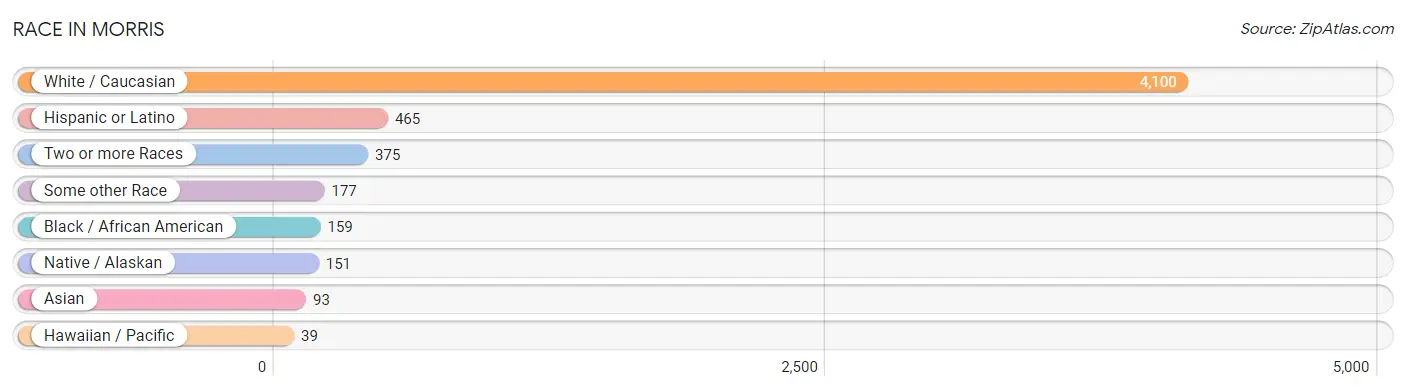
| Race | # Population | % Population |
| Asian | 93 | 1.8% |
| Black / African American | 159 | 3.1% |
| Hawaiian / Pacific | 39 | 0.8% |
| Hispanic or Latino | 465 | 9.1% |
| Native / Alaskan | 151 | 3.0% |
| White / Caucasian | 4,100 | 80.5% |
| Two or more Races | 375 | 7.4% |
| Some other Race | 177 | 3.5% |
| Total | 5,094 | 100.0% |
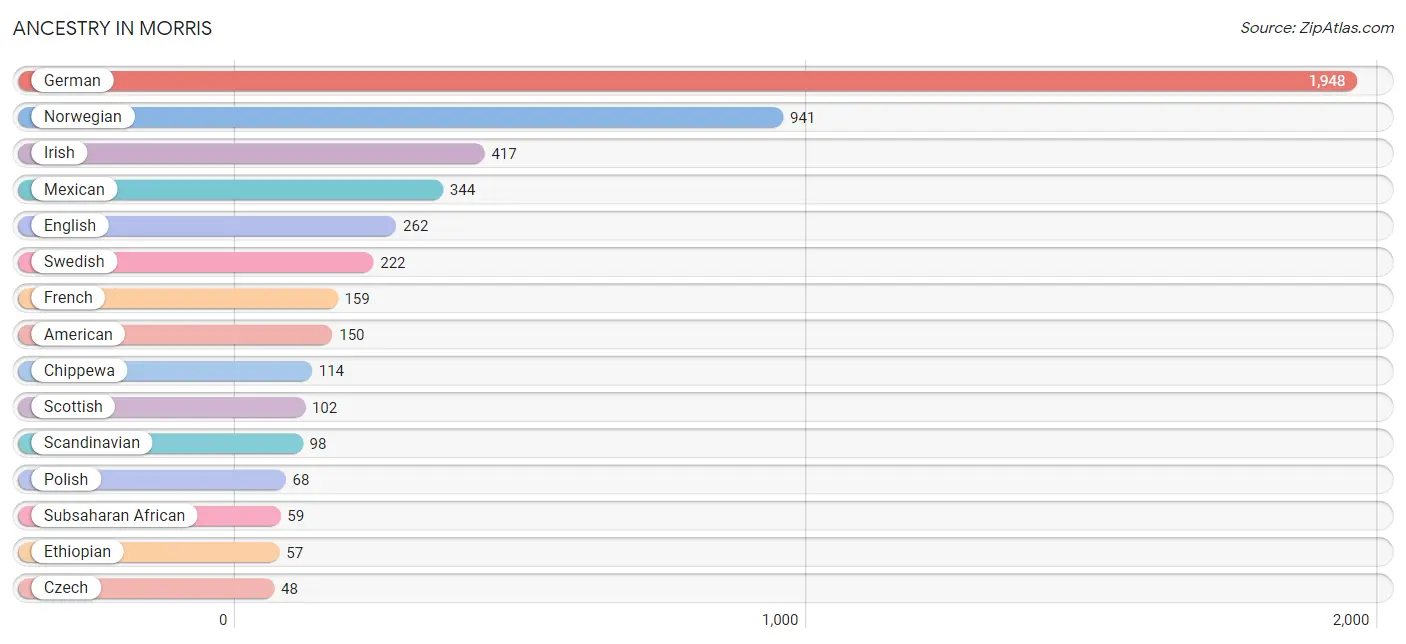
Ancestry in Morris
The most populous ancestries reported in Morris are German (1,948 | 38.2%), Norwegian (941 | 18.5%), Irish (417 | 8.2%), Mexican (344 | 6.8%), and English (262 | 5.1%), together accounting for 76.8% of all Morris residents.
| Ancestry | # Population | % Population |
| American | 150 | 2.9% |
| Arab | 2 | 0.0% |
| Austrian | 8 | 0.2% |
| Bangladeshi | 47 | 0.9% |
| Bhutanese | 2 | 0.0% |
| Blackfeet | 15 | 0.3% |
| Cajun | 8 | 0.2% |
| Canadian | 1 | 0.0% |
| Central American | 35 | 0.7% |
| Central American Indian | 10 | 0.2% |
| Chippewa | 114 | 2.2% |
| Colombian | 45 | 0.9% |
| Cree | 7 | 0.1% |
| Creek | 45 | 0.9% |
| Cuban | 11 | 0.2% |
| Czech | 48 | 0.9% |
| Danish | 22 | 0.4% |
| Dutch | 42 | 0.8% |
| English | 262 | 5.1% |
| Ethiopian | 57 | 1.1% |
| European | 3 | 0.1% |
| Finnish | 30 | 0.6% |
| French | 159 | 3.1% |
| French American Indian | 8 | 0.2% |
| German | 1,948 | 38.2% |
| Greek | 14 | 0.3% |
| Guamanian / Chamorro | 21 | 0.4% |
| Guatemalan | 23 | 0.4% |
| Indian (Asian) | 33 | 0.6% |
| Indonesian | 11 | 0.2% |
| Irish | 417 | 8.2% |
| Italian | 37 | 0.7% |
| Jordanian | 2 | 0.0% |
| Liberian | 2 | 0.0% |
| Menominee | 2 | 0.0% |
| Mexican | 344 | 6.8% |
| Mongolian | 1 | 0.0% |
| Nicaraguan | 12 | 0.2% |
| Norwegian | 941 | 18.5% |
| Polish | 68 | 1.3% |
| Pueblo | 1 | 0.0% |
| Puerto Rican | 24 | 0.5% |
| Russian | 43 | 0.8% |
| Scandinavian | 98 | 1.9% |
| Scotch-Irish | 8 | 0.2% |
| Scottish | 102 | 2.0% |
| Sioux | 19 | 0.4% |
| Slovene | 21 | 0.4% |
| South American | 45 | 0.9% |
| Spaniard | 5 | 0.1% |
| Spanish | 1 | 0.0% |
| Subsaharan African | 59 | 1.2% |
| Swedish | 222 | 4.4% |
| Swiss | 39 | 0.8% |
| Turkish | 21 | 0.4% |
| Welsh | 7 | 0.1% | View All 56 Rows |
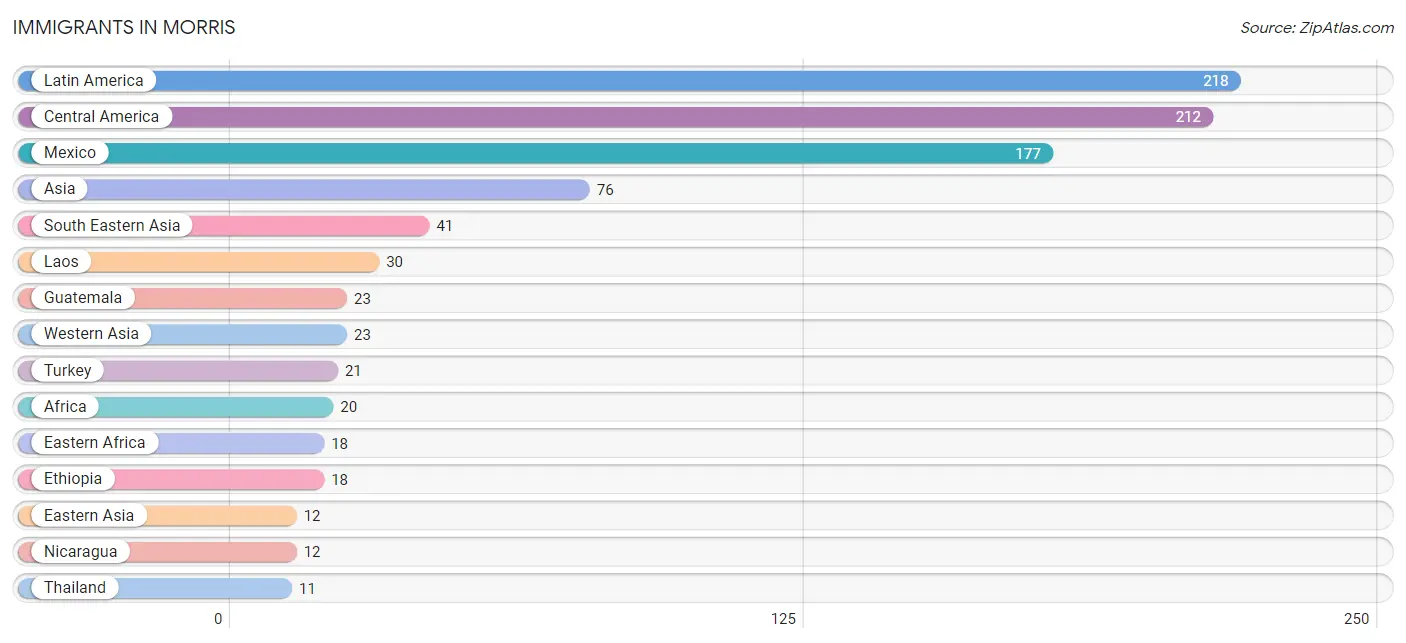
Immigrants in Morris
The most numerous immigrant groups reported in Morris came from Latin America (218 | 4.3%), Central America (212 | 4.2%), Mexico (177 | 3.5%), Asia (76 | 1.5%), and South Eastern Asia (41 | 0.8%), together accounting for 14.2% of all Morris residents.
| Immigration Origin | # Population | % Population |
| Africa | 20 | 0.4% |
| Asia | 76 | 1.5% |
| Canada | 2 | 0.0% |
| Central America | 212 | 4.2% |
| China | 10 | 0.2% |
| Colombia | 6 | 0.1% |
| Eastern Africa | 18 | 0.4% |
| Eastern Asia | 12 | 0.2% |
| Ethiopia | 18 | 0.4% |
| Europe | 9 | 0.2% |
| Guatemala | 23 | 0.4% |
| Japan | 2 | 0.0% |
| Jordan | 2 | 0.0% |
| Laos | 30 | 0.6% |
| Latin America | 218 | 4.3% |
| Liberia | 2 | 0.0% |
| Mexico | 177 | 3.5% |
| Nicaragua | 12 | 0.2% |
| Northern Europe | 9 | 0.2% |
| Norway | 9 | 0.2% |
| South America | 6 | 0.1% |
| South Eastern Asia | 41 | 0.8% |
| Thailand | 11 | 0.2% |
| Turkey | 21 | 0.4% |
| Western Africa | 2 | 0.0% |
| Western Asia | 23 | 0.4% | View All 26 Rows |
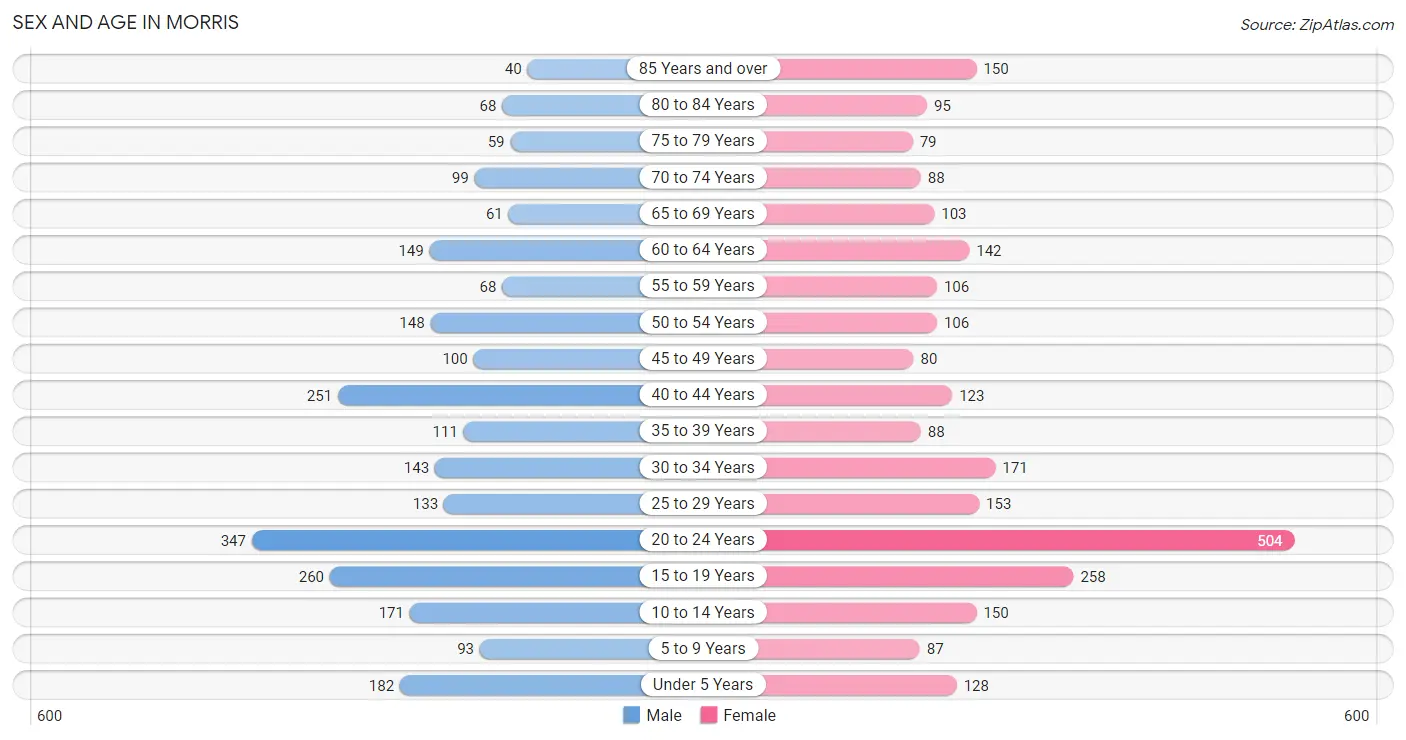
Sex and Age in Morris
Sex and Age in Morris
The most populous age groups in Morris are 20 to 24 Years (347 | 14.0%) for men and 20 to 24 Years (504 | 19.3%) for women.
| Age Bracket | Male | Female |
| Under 5 Years | 182 (7.3%) | 128 (4.9%) |
| 5 to 9 Years | 93 (3.7%) | 87 (3.3%) |
| 10 to 14 Years | 171 (6.9%) | 150 (5.7%) |
| 15 to 19 Years | 260 (10.5%) | 258 (9.9%) |
| 20 to 24 Years | 347 (14.0%) | 504 (19.3%) |
| 25 to 29 Years | 133 (5.4%) | 153 (5.9%) |
| 30 to 34 Years | 143 (5.8%) | 171 (6.6%) |
| 35 to 39 Years | 111 (4.5%) | 88 (3.4%) |
| 40 to 44 Years | 251 (10.1%) | 123 (4.7%) |
| 45 to 49 Years | 100 (4.0%) | 80 (3.1%) |
| 50 to 54 Years | 148 (6.0%) | 106 (4.1%) |
| 55 to 59 Years | 68 (2.7%) | 106 (4.1%) |
| 60 to 64 Years | 149 (6.0%) | 142 (5.4%) |
| 65 to 69 Years | 61 (2.5%) | 103 (3.9%) |
| 70 to 74 Years | 99 (4.0%) | 88 (3.4%) |
| 75 to 79 Years | 59 (2.4%) | 79 (3.0%) |
| 80 to 84 Years | 68 (2.7%) | 95 (3.6%) |
| 85 Years and over | 40 (1.6%) | 150 (5.7%) |
| Total | 2,483 (100.0%) | 2,611 (100.0%) |
Families and Households in Morris
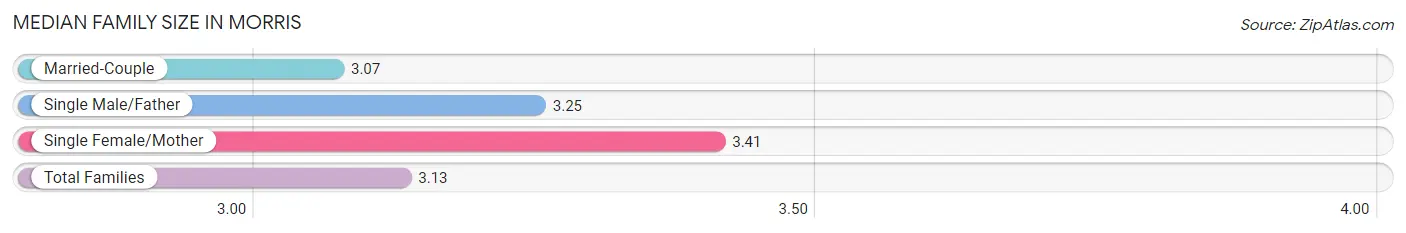
Median Family Size in Morris
The median family size in Morris is 3.13 persons per family, with single female/mother families (163 | 15.5%) accounting for the largest median family size of 3.41 persons per family. On the other hand, married-couple families (855 | 81.4%) represent the smallest median family size with 3.07 persons per family.
| Family Type | # Families | Family Size |
| Married-Couple | 855 (81.4%) | 3.07 |
| Single Male/Father | 32 (3.0%) | 3.25 |
| Single Female/Mother | 163 (15.5%) | 3.41 |
| Total Families | 1,050 (100.0%) | 3.13 |
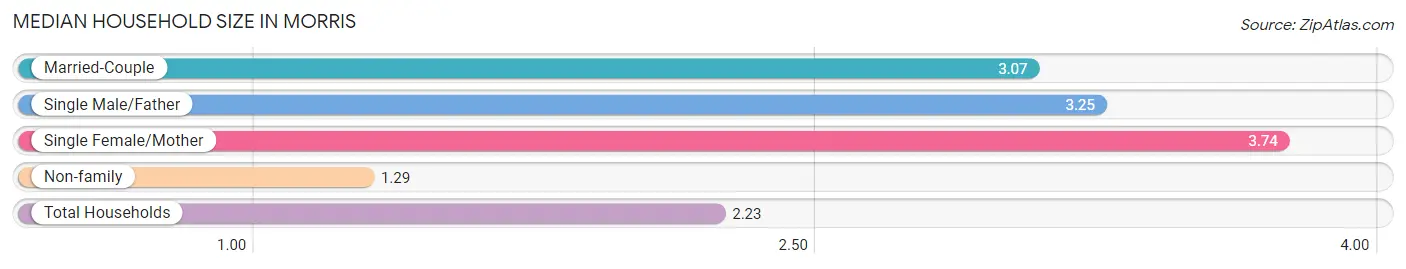
Median Household Size in Morris
The median household size in Morris is 2.23 persons per household, with single female/mother households (163 | 7.7%) accounting for the largest median household size of 3.74 persons per household. non-family households (1,060 | 50.2%) represent the smallest median household size with 1.29 persons per household.
| Household Type | # Households | Household Size |
| Married-Couple | 855 (40.5%) | 3.07 |
| Single Male/Father | 32 (1.5%) | 3.25 |
| Single Female/Mother | 163 (7.7%) | 3.74 |
| Non-family | 1,060 (50.2%) | 1.29 |
| Total Households | 2,110 (100.0%) | 2.23 |
Household Size by Marriage Status in Morris
Out of a total of 2,110 households in Morris, 1,050 (49.8%) are family households, while 1,060 (50.2%) are nonfamily households. The most numerous type of family households are 2-person households, comprising 463, and the most common type of nonfamily households are 1-person households, comprising 788.
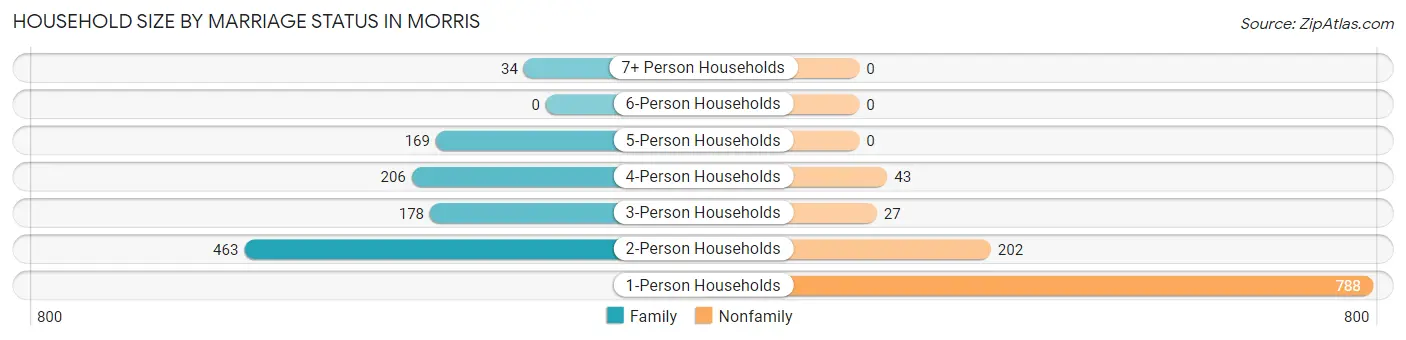
| Household Size | Family Households | Nonfamily Households |
| 1-Person Households | - | 788 (37.3%) |
| 2-Person Households | 463 (21.9%) | 202 (9.6%) |
| 3-Person Households | 178 (8.4%) | 27 (1.3%) |
| 4-Person Households | 206 (9.8%) | 43 (2.0%) |
| 5-Person Households | 169 (8.0%) | 0 (0.0%) |
| 6-Person Households | 0 (0.0%) | 0 (0.0%) |
| 7+ Person Households | 34 (1.6%) | 0 (0.0%) |
| Total | 1,050 (49.8%) | 1,060 (50.2%) |
Female Fertility in Morris
Fertility by Age in Morris
Average fertility rate in Morris is 66.0 births per 1,000 women. Women in the age bracket of 20 to 34 years have the highest fertility rate with 91.0 births per 1,000 women. Women in the age bracket of 20 to 34 years acount for 82.4% of all women with births.
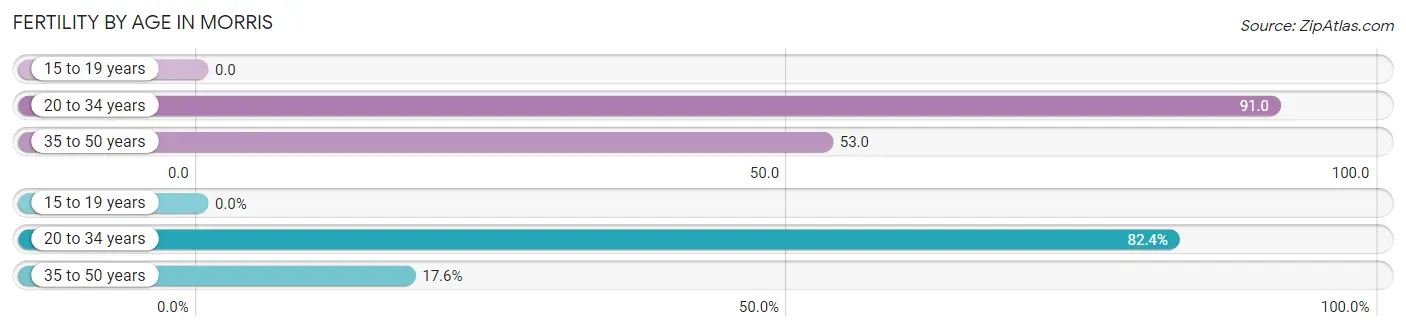
| Age Bracket | Women with Births | Births / 1,000 Women |
| 15 to 19 years | 0 (0.0%) | 0.0 |
| 20 to 34 years | 75 (82.4%) | 91.0 |
| 35 to 50 years | 16 (17.6%) | 53.0 |
| Total | 91 (100.0%) | 66.0 |
Fertility by Age by Marriage Status in Morris
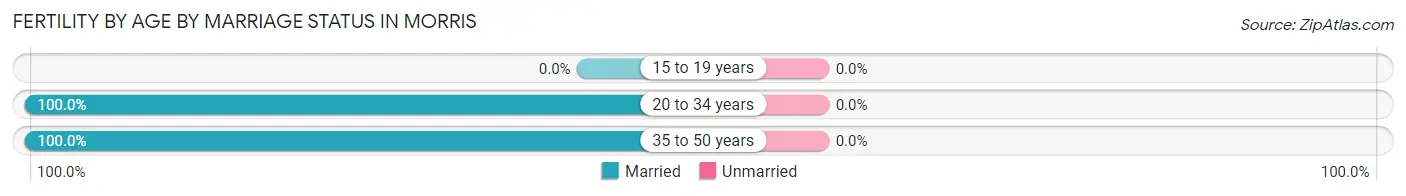
| Age Bracket | Married | Unmarried |
| 15 to 19 years | 0 (0.0%) | 0 (0.0%) |
| 20 to 34 years | 75 (100.0%) | 0 (0.0%) |
| 35 to 50 years | 16 (100.0%) | 0 (0.0%) |
| Total | 91 (100.0%) | 0 (0.0%) |
Fertility by Education in Morris
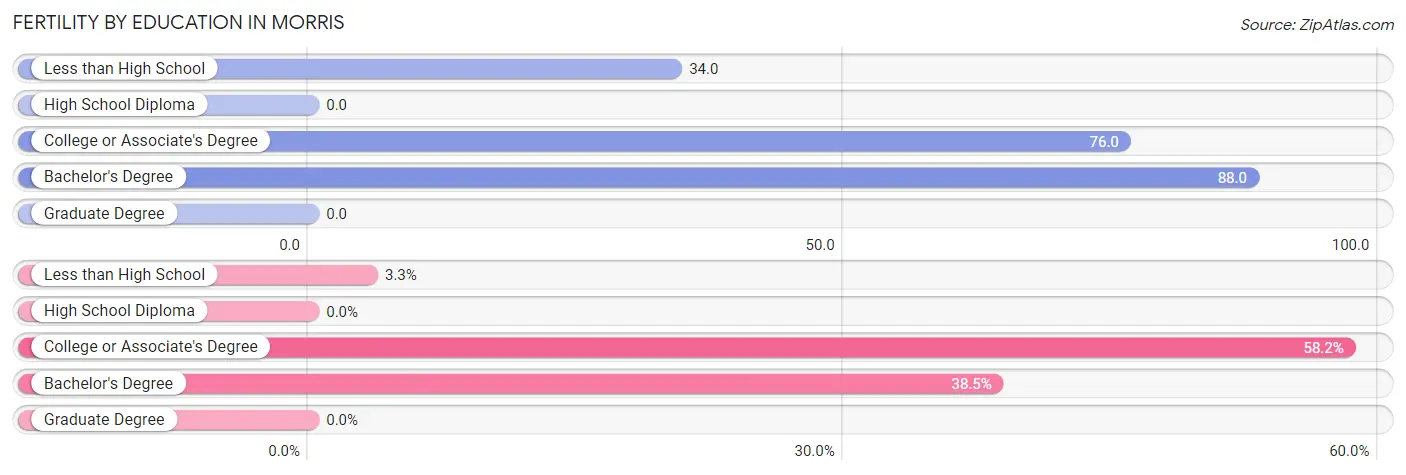
| Educational Attainment | Women with Births | Births / 1,000 Women |
| Less than High School | 3 (3.3%) | 34.0 |
| High School Diploma | 0 (0.0%) | 0.0 |
| College or Associate's Degree | 53 (58.2%) | 76.0 |
| Bachelor's Degree | 35 (38.5%) | 88.0 |
| Graduate Degree | 0 (0.0%) | 0.0 |
| Total | 91 (100.0%) | 66.0 |
Fertility by Education by Marriage Status in Morris
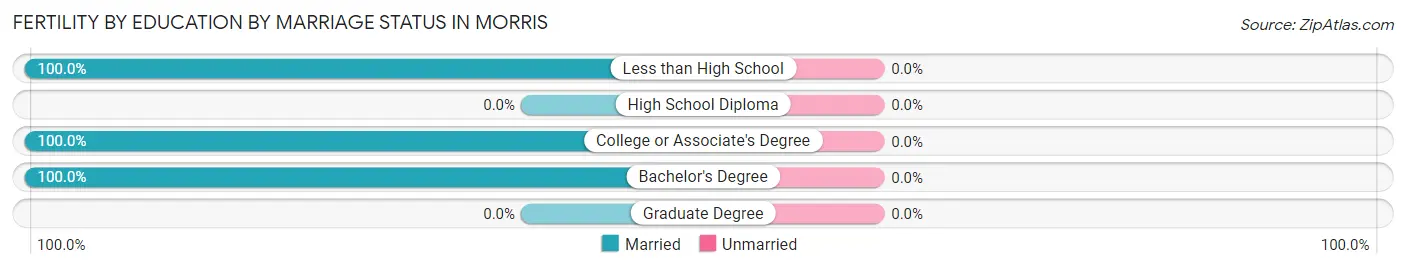
| Educational Attainment | Married | Unmarried |
| Less than High School | 3 (100.0%) | 0 (0.0%) |
| High School Diploma | 0 (0.0%) | 0 (0.0%) |
| College or Associate's Degree | 53 (100.0%) | 0 (0.0%) |
| Bachelor's Degree | 35 (100.0%) | 0 (0.0%) |
| Graduate Degree | 0 (0.0%) | 0 (0.0%) |
| Total | 91 (100.0%) | 0 (0.0%) |
Employment Characteristics in Morris
Employment by Class of Employer in Morris
Among the 2,603 employed individuals in Morris, private company employees (1,474 | 56.6%), not-for-profit organizations (356 | 13.7%), and state government employees (269 | 10.3%) make up the most common classes of employment.
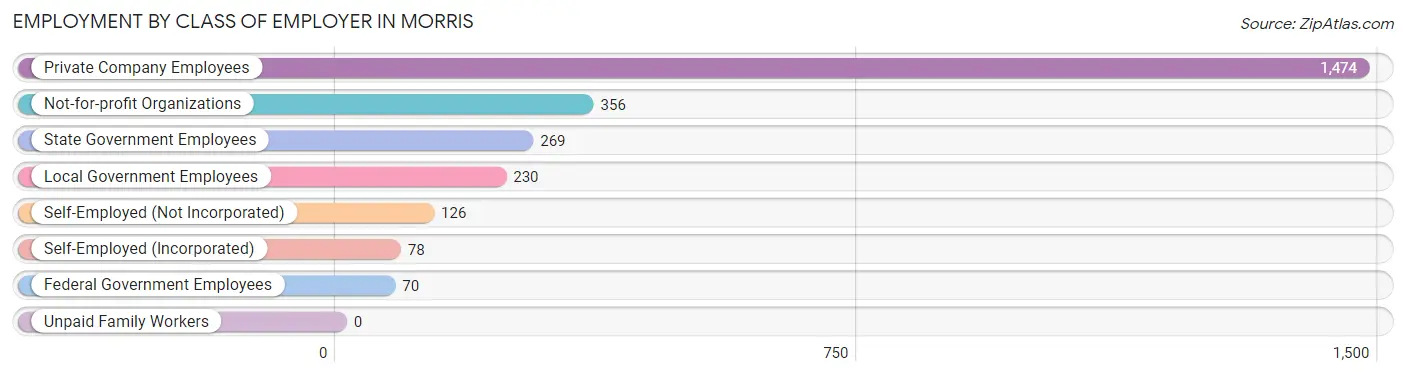
| Employer Class | # Employees | % Employees |
| Private Company Employees | 1,474 | 56.6% |
| Self-Employed (Incorporated) | 78 | 3.0% |
| Self-Employed (Not Incorporated) | 126 | 4.8% |
| Not-for-profit Organizations | 356 | 13.7% |
| Local Government Employees | 230 | 8.8% |
| State Government Employees | 269 | 10.3% |
| Federal Government Employees | 70 | 2.7% |
| Unpaid Family Workers | 0 | 0.0% |
| Total | 2,603 | 100.0% |
Employment Status by Age in Morris
According to the labor force statistics for Morris, out of the total population over 16 years of age (4,217), 65.1% or 2,745 individuals are in the labor force, with 0.4% or 11 of them unemployed. The age group with the highest labor force participation rate is 35 to 44 years, with 91.3% or 523 individuals in the labor force. Within the labor force, the 16 to 19 years age range has the highest percentage of unemployed individuals, with 2.5% or 5 of them being unemployed.
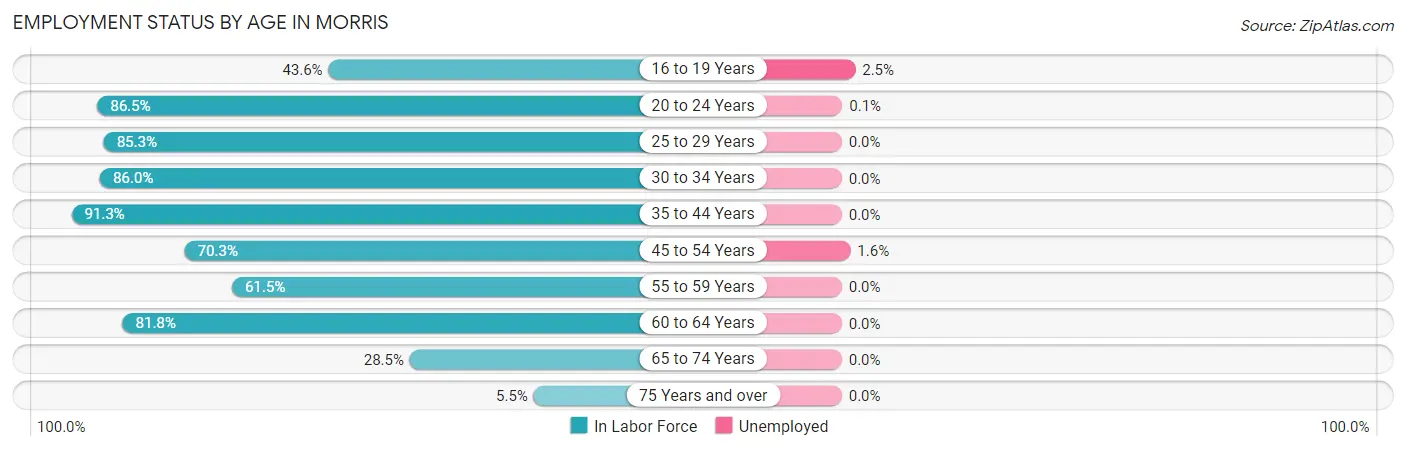
| Age Bracket | In Labor Force | Unemployed |
| 16 to 19 Years | 197 (43.6%) | 5 (2.5%) |
| 20 to 24 Years | 736 (86.5%) | 1 (0.1%) |
| 25 to 29 Years | 244 (85.3%) | 0 (0.0%) |
| 30 to 34 Years | 270 (86.0%) | 0 (0.0%) |
| 35 to 44 Years | 523 (91.3%) | 0 (0.0%) |
| 45 to 54 Years | 305 (70.3%) | 5 (1.6%) |
| 55 to 59 Years | 107 (61.5%) | 0 (0.0%) |
| 60 to 64 Years | 238 (81.8%) | 0 (0.0%) |
| 65 to 74 Years | 100 (28.5%) | 0 (0.0%) |
| 75 Years and over | 27 (5.5%) | 0 (0.0%) |
| Total | 2,745 (65.1%) | 11 (0.4%) |
Employment Status by Educational Attainment in Morris
According to labor force statistics for Morris, 81.4% of individuals (1,687) out of the total population between 25 and 64 years of age (2,072) are in the labor force, with 0.3% or 5 of them being unemployed. The group with the highest labor force participation rate are those with the educational attainment of bachelor's degree or higher, with 91.7% or 673 individuals in the labor force. Within the labor force, individuals with college / associate degree education have the highest percentage of unemployment, with 0.9% or 5 of them being unemployed.
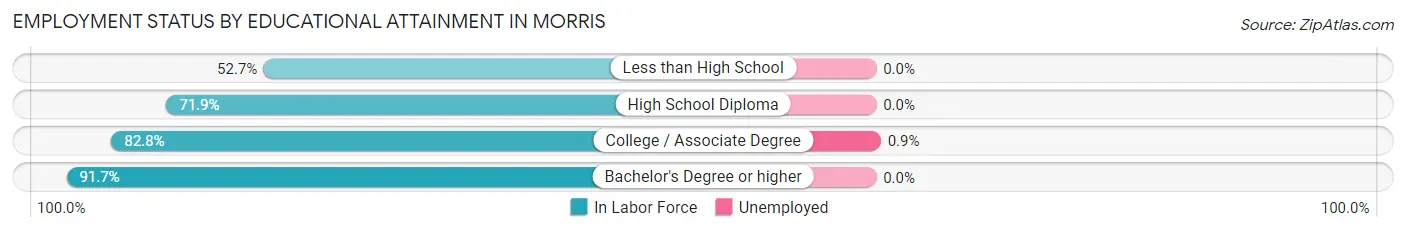
| Educational Attainment | In Labor Force | Unemployed |
| Less than High School | 68 (52.7%) | 0 (0.0%) |
| High School Diploma | 360 (71.9%) | 0 (0.0%) |
| College / Associate Degree | 586 (82.8%) | 6 (0.9%) |
| Bachelor's Degree or higher | 673 (91.7%) | 0 (0.0%) |
| Total | 1,687 (81.4%) | 6 (0.3%) |
Employment Occupations by Sex in Morris
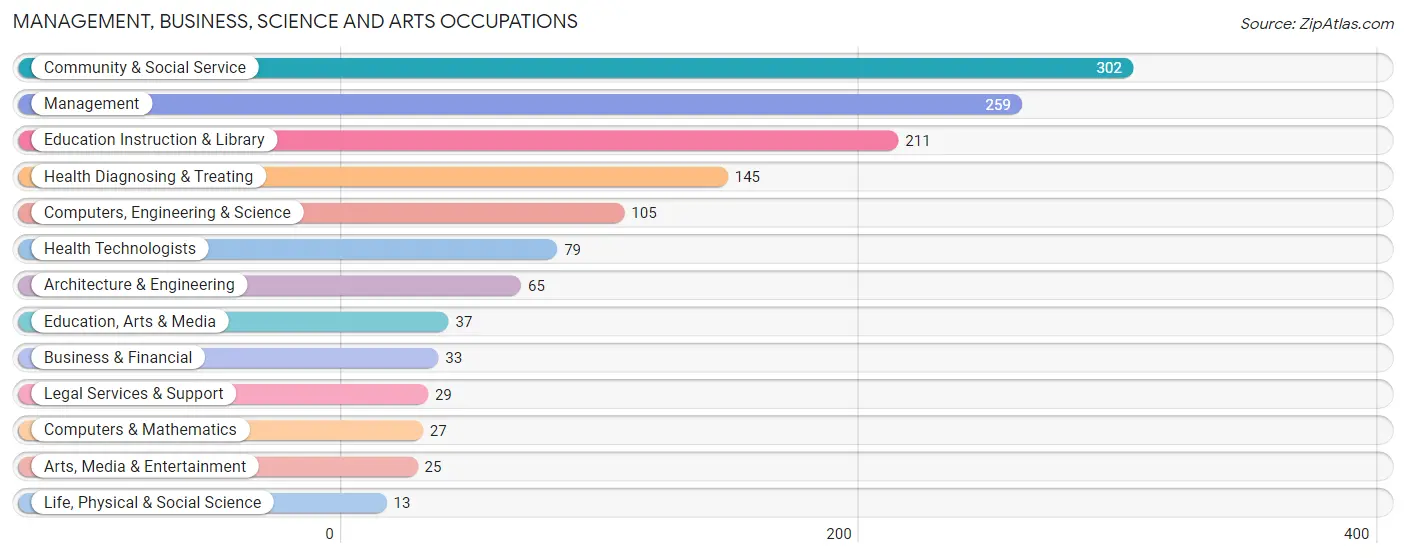
Management, Business, Science and Arts Occupations
The most common Management, Business, Science and Arts occupations in Morris are Community & Social Service (302 | 11.0%), Management (259 | 9.5%), Education Instruction & Library (211 | 7.7%), Health Diagnosing & Treating (145 | 5.3%), and Computers, Engineering & Science (105 | 3.8%).
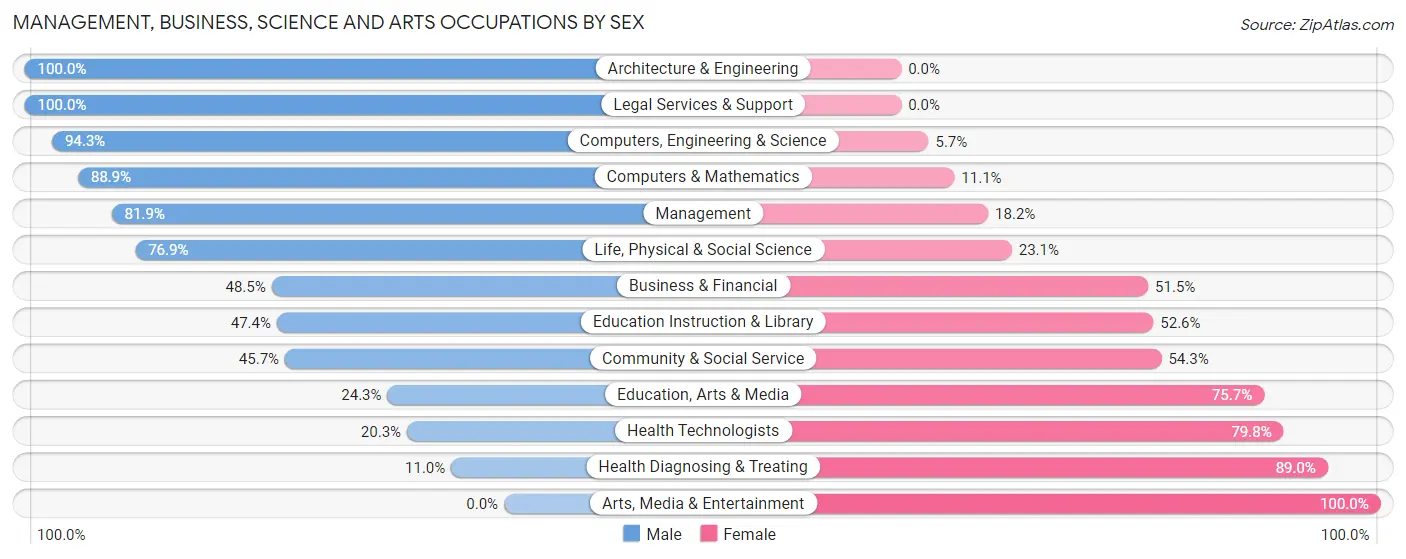
Management, Business, Science and Arts Occupations by Sex
Within the Management, Business, Science and Arts occupations in Morris, the most male-oriented occupations are Architecture & Engineering (100.0%), Legal Services & Support (100.0%), and Computers, Engineering & Science (94.3%), while the most female-oriented occupations are Arts, Media & Entertainment (100.0%), Health Diagnosing & Treating (89.0%), and Health Technologists (79.7%).
| Occupation | Male | Female |
| Management | 212 (81.9%) | 47 (18.1%) |
| Business & Financial | 16 (48.5%) | 17 (51.5%) |
| Computers, Engineering & Science | 99 (94.3%) | 6 (5.7%) |
| Computers & Mathematics | 24 (88.9%) | 3 (11.1%) |
| Architecture & Engineering | 65 (100.0%) | 0 (0.0%) |
| Life, Physical & Social Science | 10 (76.9%) | 3 (23.1%) |
| Community & Social Service | 138 (45.7%) | 164 (54.3%) |
| Education, Arts & Media | 9 (24.3%) | 28 (75.7%) |
| Legal Services & Support | 29 (100.0%) | 0 (0.0%) |
| Education Instruction & Library | 100 (47.4%) | 111 (52.6%) |
| Arts, Media & Entertainment | 0 (0.0%) | 25 (100.0%) |
| Health Diagnosing & Treating | 16 (11.0%) | 129 (89.0%) |
| Health Technologists | 16 (20.3%) | 63 (79.7%) |
| Total (Category) | 481 (57.0%) | 363 (43.0%) |
| Total (Overall) | 1,365 (49.9%) | 1,371 (50.1%) |
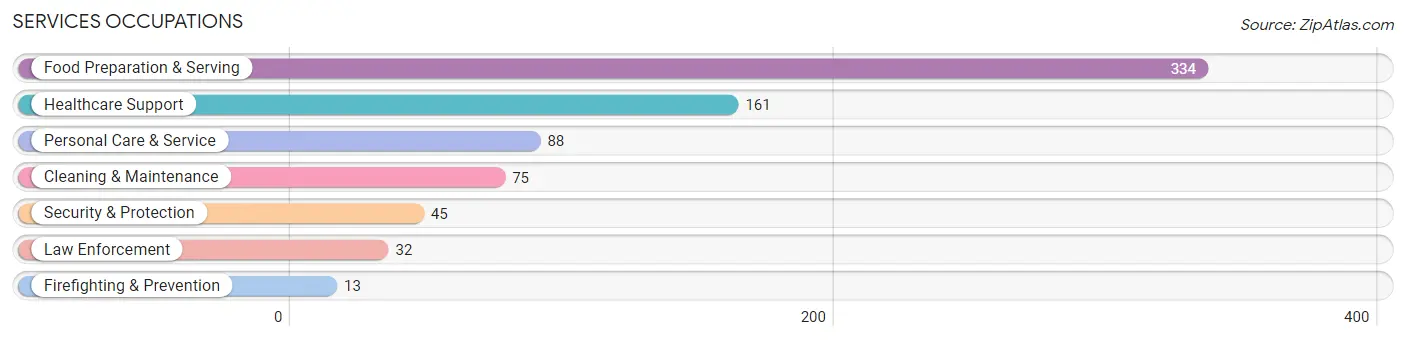
Services Occupations
The most common Services occupations in Morris are Food Preparation & Serving (334 | 12.2%), Healthcare Support (161 | 5.9%), Personal Care & Service (88 | 3.2%), Cleaning & Maintenance (75 | 2.7%), and Security & Protection (45 | 1.6%).
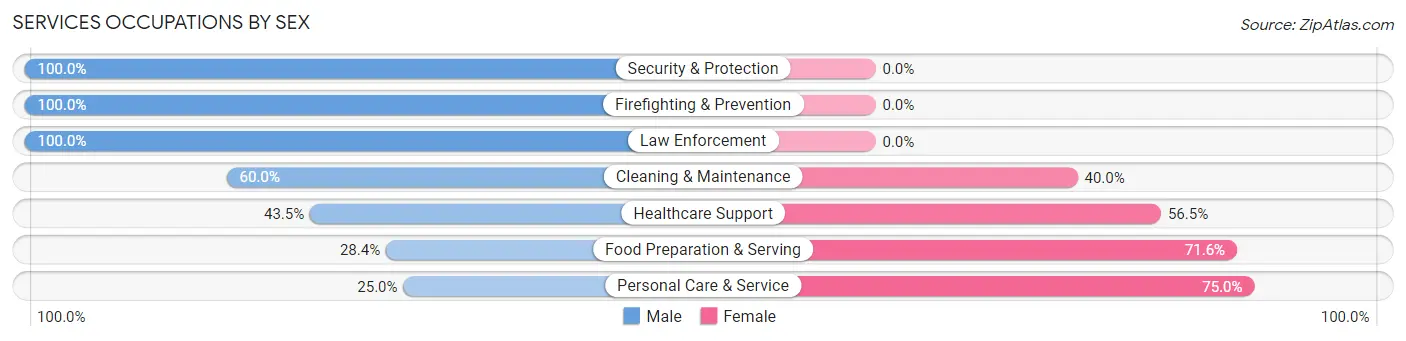
Services Occupations by Sex
Within the Services occupations in Morris, the most male-oriented occupations are Security & Protection (100.0%), Firefighting & Prevention (100.0%), and Law Enforcement (100.0%), while the most female-oriented occupations are Personal Care & Service (75.0%), Food Preparation & Serving (71.6%), and Healthcare Support (56.5%).
| Occupation | Male | Female |
| Healthcare Support | 70 (43.5%) | 91 (56.5%) |
| Security & Protection | 45 (100.0%) | 0 (0.0%) |
| Firefighting & Prevention | 13 (100.0%) | 0 (0.0%) |
| Law Enforcement | 32 (100.0%) | 0 (0.0%) |
| Food Preparation & Serving | 95 (28.4%) | 239 (71.6%) |
| Cleaning & Maintenance | 45 (60.0%) | 30 (40.0%) |
| Personal Care & Service | 22 (25.0%) | 66 (75.0%) |
| Total (Category) | 277 (39.4%) | 426 (60.6%) |
| Total (Overall) | 1,365 (49.9%) | 1,371 (50.1%) |
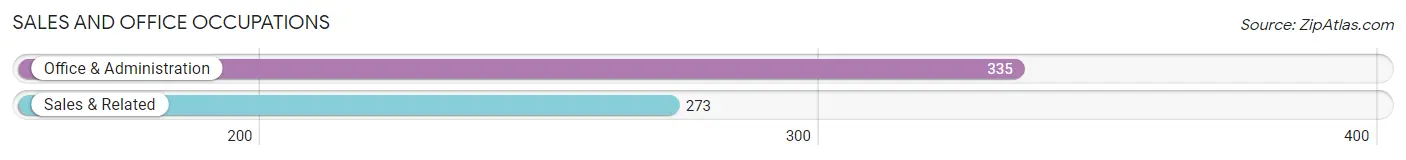
Sales and Office Occupations
The most common Sales and Office occupations in Morris are Office & Administration (335 | 12.2%), and Sales & Related (273 | 10.0%).
Sales and Office Occupations by Sex
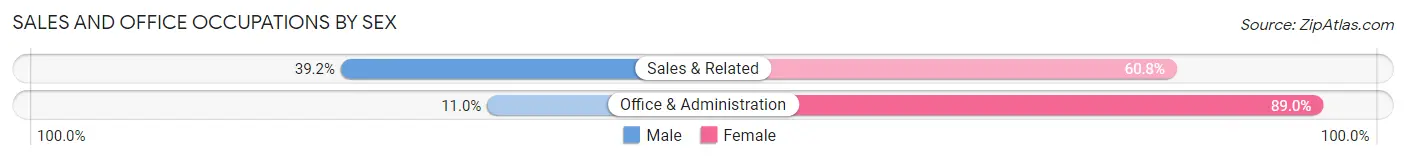
| Occupation | Male | Female |
| Sales & Related | 107 (39.2%) | 166 (60.8%) |
| Office & Administration | 37 (11.0%) | 298 (89.0%) |
| Total (Category) | 144 (23.7%) | 464 (76.3%) |
| Total (Overall) | 1,365 (49.9%) | 1,371 (50.1%) |
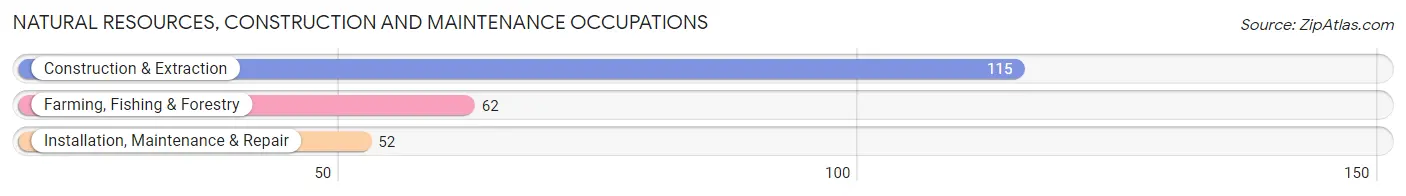
Natural Resources, Construction and Maintenance Occupations
The most common Natural Resources, Construction and Maintenance occupations in Morris are Construction & Extraction (115 | 4.2%), Farming, Fishing & Forestry (62 | 2.3%), and Installation, Maintenance & Repair (52 | 1.9%).
Natural Resources, Construction and Maintenance Occupations by Sex
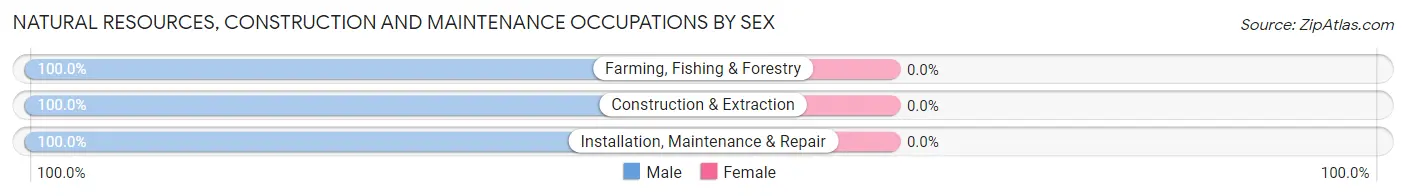
| Occupation | Male | Female |
| Farming, Fishing & Forestry | 62 (100.0%) | 0 (0.0%) |
| Construction & Extraction | 115 (100.0%) | 0 (0.0%) |
| Installation, Maintenance & Repair | 52 (100.0%) | 0 (0.0%) |
| Total (Category) | 229 (100.0%) | 0 (0.0%) |
| Total (Overall) | 1,365 (49.9%) | 1,371 (50.1%) |
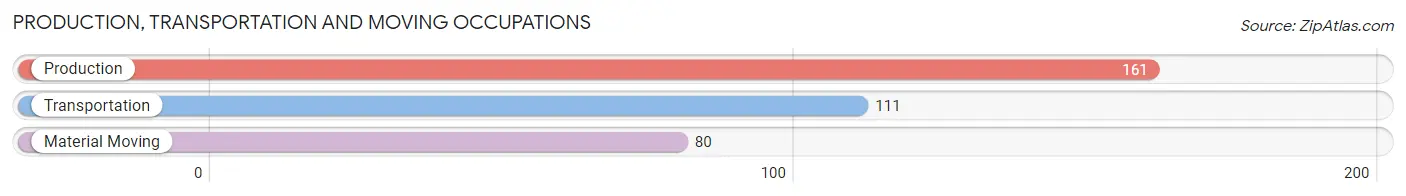
Production, Transportation and Moving Occupations
The most common Production, Transportation and Moving occupations in Morris are Production (161 | 5.9%), Transportation (111 | 4.1%), and Material Moving (80 | 2.9%).
Production, Transportation and Moving Occupations by Sex
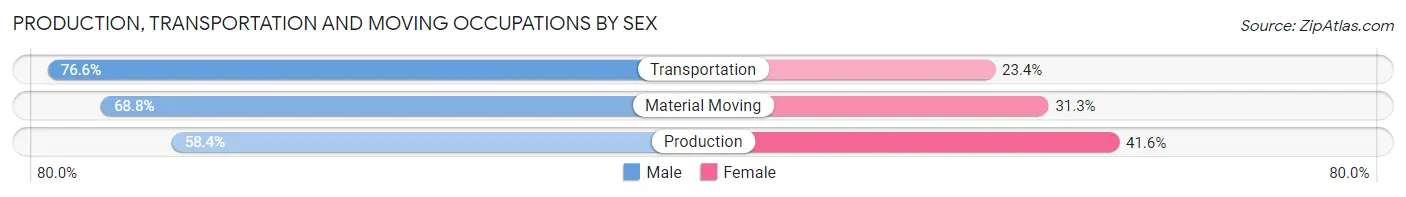
| Occupation | Male | Female |
| Production | 94 (58.4%) | 67 (41.6%) |
| Transportation | 85 (76.6%) | 26 (23.4%) |
| Material Moving | 55 (68.8%) | 25 (31.2%) |
| Total (Category) | 234 (66.5%) | 118 (33.5%) |
| Total (Overall) | 1,365 (49.9%) | 1,371 (50.1%) |
Employment Industries by Sex in Morris
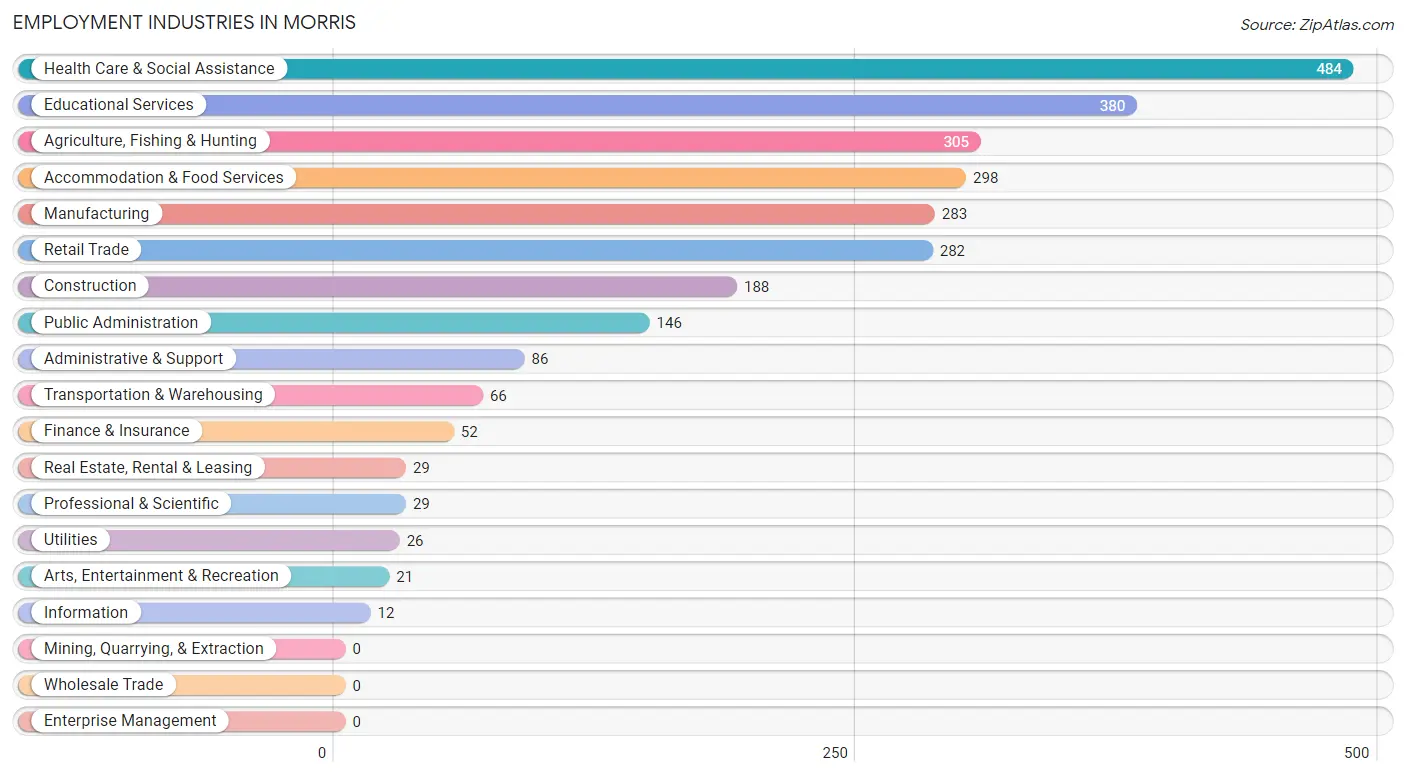
Employment Industries in Morris
The major employment industries in Morris include Health Care & Social Assistance (484 | 17.7%), Educational Services (380 | 13.9%), Agriculture, Fishing & Hunting (305 | 11.2%), Accommodation & Food Services (298 | 10.9%), and Manufacturing (283 | 10.3%).
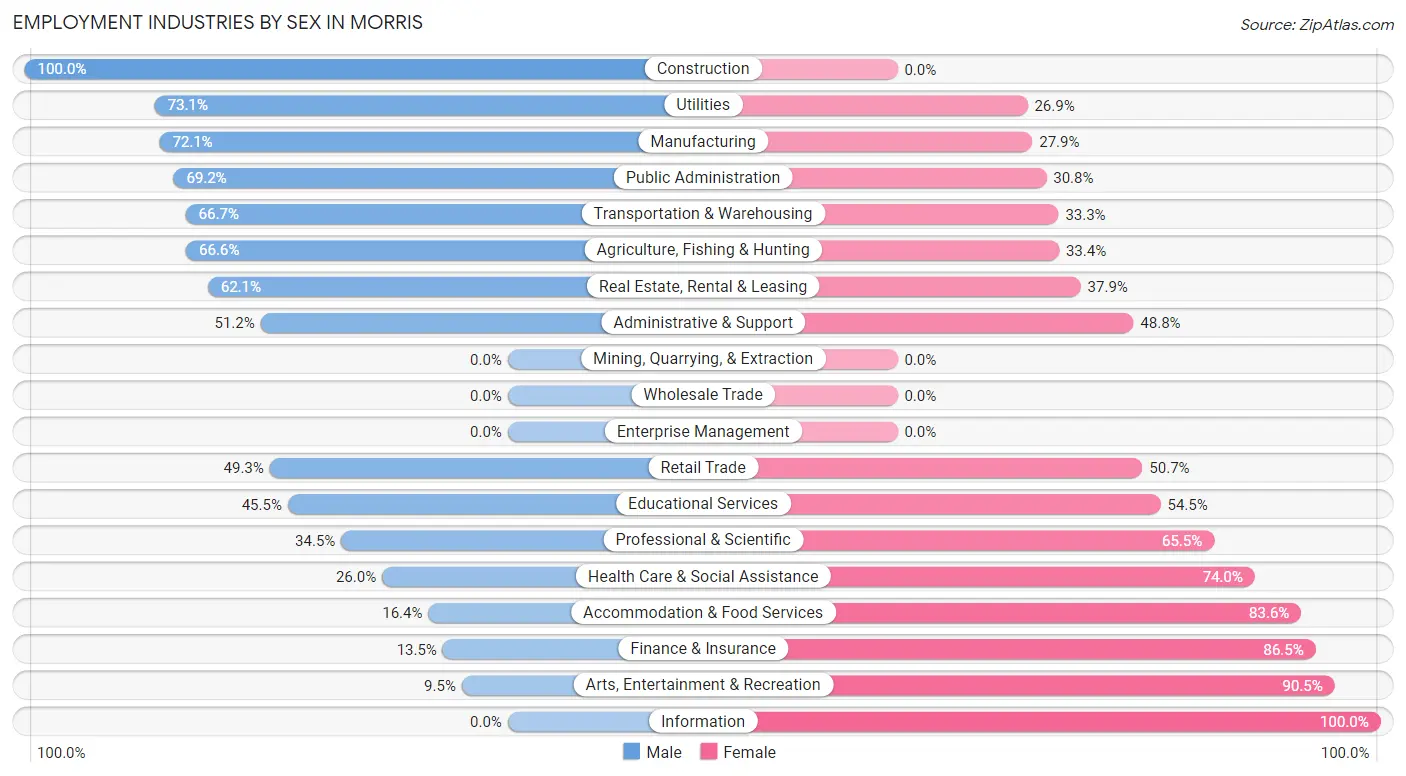
Employment Industries by Sex in Morris
The Morris industries that see more men than women are Construction (100.0%), Utilities (73.1%), and Manufacturing (72.1%), whereas the industries that tend to have a higher number of women are Information (100.0%), Arts, Entertainment & Recreation (90.5%), and Finance & Insurance (86.5%).
| Industry | Male | Female |
| Agriculture, Fishing & Hunting | 203 (66.6%) | 102 (33.4%) |
| Mining, Quarrying, & Extraction | 0 (0.0%) | 0 (0.0%) |
| Construction | 188 (100.0%) | 0 (0.0%) |
| Manufacturing | 204 (72.1%) | 79 (27.9%) |
| Wholesale Trade | 0 (0.0%) | 0 (0.0%) |
| Retail Trade | 139 (49.3%) | 143 (50.7%) |
| Transportation & Warehousing | 44 (66.7%) | 22 (33.3%) |
| Utilities | 19 (73.1%) | 7 (26.9%) |
| Information | 0 (0.0%) | 12 (100.0%) |
| Finance & Insurance | 7 (13.5%) | 45 (86.5%) |
| Real Estate, Rental & Leasing | 18 (62.1%) | 11 (37.9%) |
| Professional & Scientific | 10 (34.5%) | 19 (65.5%) |
| Enterprise Management | 0 (0.0%) | 0 (0.0%) |
| Administrative & Support | 44 (51.2%) | 42 (48.8%) |
| Educational Services | 173 (45.5%) | 207 (54.5%) |
| Health Care & Social Assistance | 126 (26.0%) | 358 (74.0%) |
| Arts, Entertainment & Recreation | 2 (9.5%) | 19 (90.5%) |
| Accommodation & Food Services | 49 (16.4%) | 249 (83.6%) |
| Public Administration | 101 (69.2%) | 45 (30.8%) |
| Total | 1,365 (49.9%) | 1,371 (50.1%) |
Education in Morris
School Enrollment in Morris
The most common levels of schooling among the 1,779 students in Morris are college / undergraduate (1,002 | 56.3%), middle school (253 | 14.2%), and high school (223 | 12.5%).
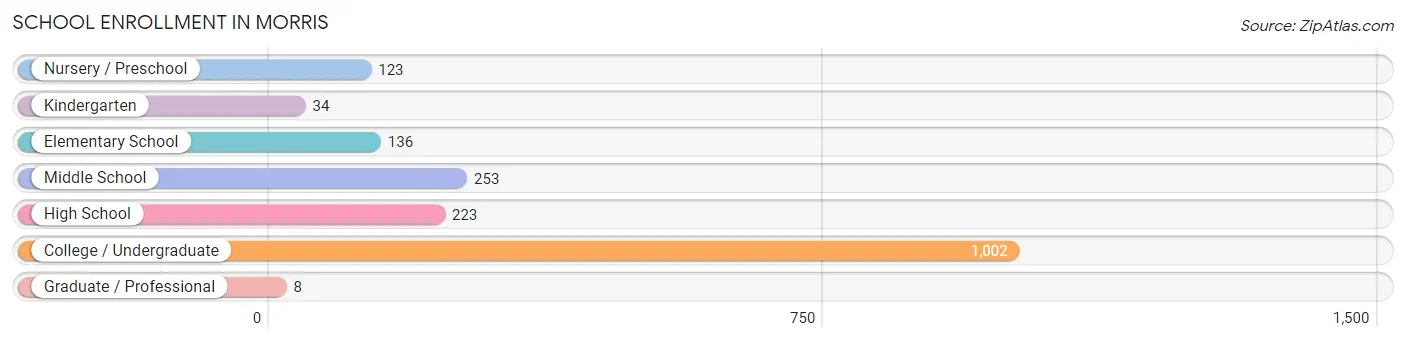
| School Level | # Students | % Students |
| Nursery / Preschool | 123 | 6.9% |
| Kindergarten | 34 | 1.9% |
| Elementary School | 136 | 7.6% |
| Middle School | 253 | 14.2% |
| High School | 223 | 12.5% |
| College / Undergraduate | 1,002 | 56.3% |
| Graduate / Professional | 8 | 0.4% |
| Total | 1,779 | 100.0% |
School Enrollment by Age by Funding Source in Morris
Out of a total of 1,779 students who are enrolled in schools in Morris, 68 (3.8%) attend a private institution, while the remaining 1,711 (96.2%) are enrolled in public schools. The age group of 5 to 9 year old has the highest likelihood of being enrolled in private schools, with 40 (22.2% in the age bracket) enrolled. Conversely, the age group of 15 to 17 year olds has the lowest likelihood of being enrolled in a private school, with 172 (100.0% in the age bracket) attending a public institution.
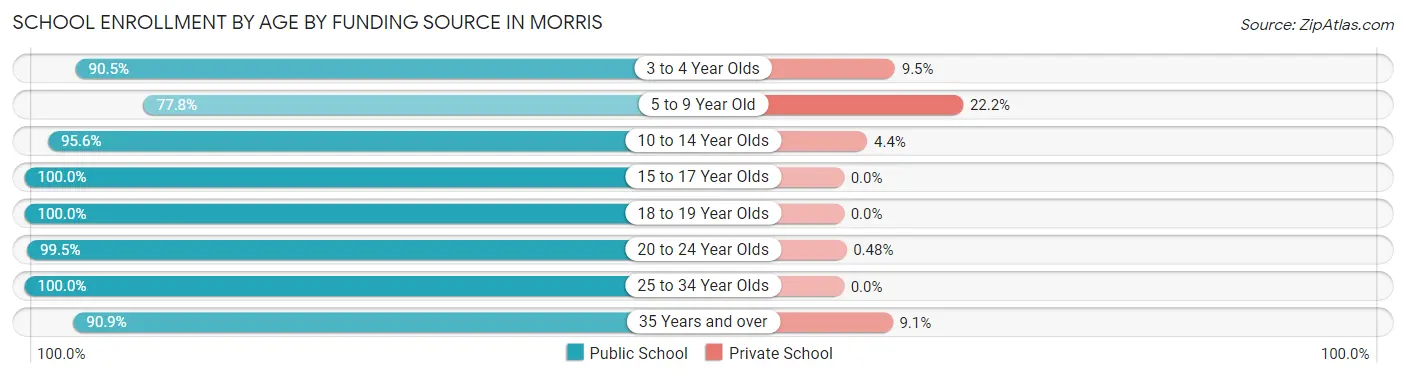
| Age Bracket | Public School | Private School |
| 3 to 4 Year Olds | 76 (90.5%) | 8 (9.5%) |
| 5 to 9 Year Old | 140 (77.8%) | 40 (22.2%) |
| 10 to 14 Year Olds | 307 (95.6%) | 14 (4.4%) |
| 15 to 17 Year Olds | 172 (100.0%) | 0 (0.0%) |
| 18 to 19 Year Olds | 336 (100.0%) | 0 (0.0%) |
| 20 to 24 Year Olds | 628 (99.5%) | 3 (0.5%) |
| 25 to 34 Year Olds | 33 (100.0%) | 0 (0.0%) |
| 35 Years and over | 20 (90.9%) | 2 (9.1%) |
| Total | 1,711 (96.2%) | 68 (3.8%) |
Educational Attainment by Field of Study in Morris
Education (128 | 12.4%), engineering (123 | 11.9%), science & technology (116 | 11.2%), business (111 | 10.7%), and literature & languages (94 | 9.1%) are the most common fields of study among 1,035 individuals in Morris who have obtained a bachelor's degree or higher.
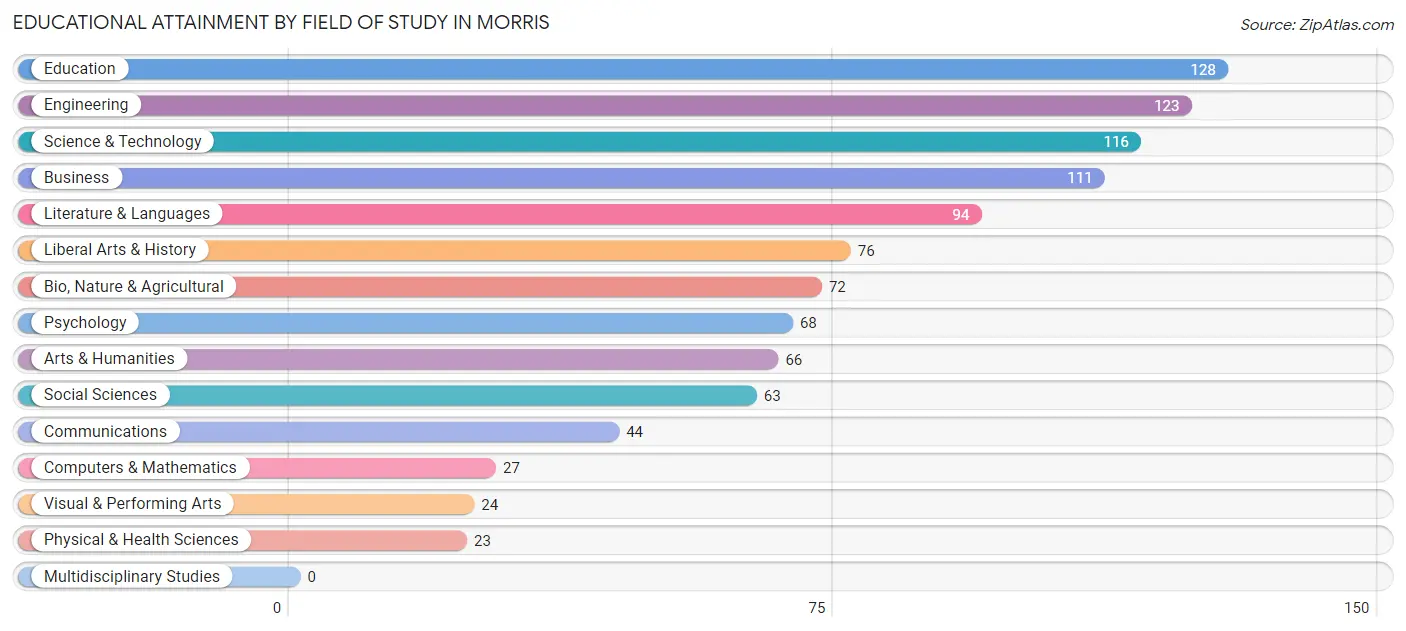
| Field of Study | # Graduates | % Graduates |
| Computers & Mathematics | 27 | 2.6% |
| Bio, Nature & Agricultural | 72 | 7.0% |
| Physical & Health Sciences | 23 | 2.2% |
| Psychology | 68 | 6.6% |
| Social Sciences | 63 | 6.1% |
| Engineering | 123 | 11.9% |
| Multidisciplinary Studies | 0 | 0.0% |
| Science & Technology | 116 | 11.2% |
| Business | 111 | 10.7% |
| Education | 128 | 12.4% |
| Literature & Languages | 94 | 9.1% |
| Liberal Arts & History | 76 | 7.3% |
| Visual & Performing Arts | 24 | 2.3% |
| Communications | 44 | 4.3% |
| Arts & Humanities | 66 | 6.4% |
| Total | 1,035 | 100.0% |
Transportation & Commute in Morris
Vehicle Availability by Sex in Morris
The most prevalent vehicle ownership categories in Morris are males with 2 vehicles (517, accounting for 39.3%) and females with 2 vehicles (376, making up 42.9%).
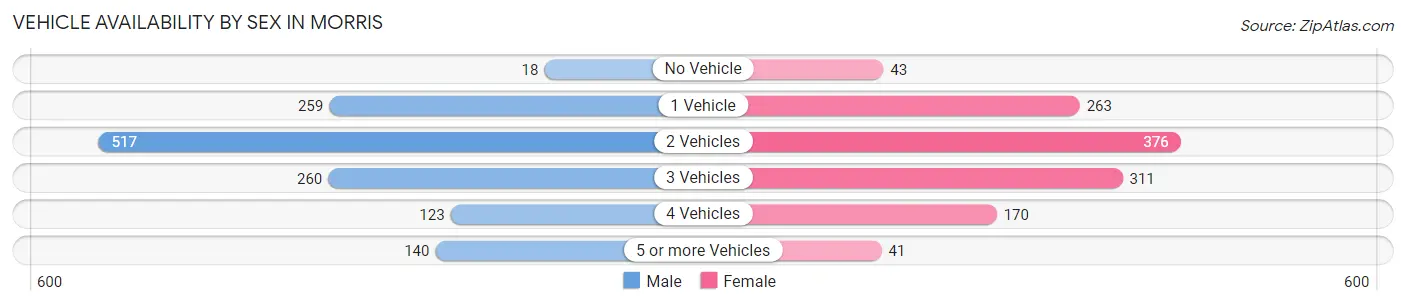
| Vehicles Available | Male | Female |
| No Vehicle | 18 (1.4%) | 43 (3.6%) |
| 1 Vehicle | 259 (19.7%) | 263 (21.8%) |
| 2 Vehicles | 517 (39.3%) | 376 (31.2%) |
| 3 Vehicles | 260 (19.7%) | 311 (25.8%) |
| 4 Vehicles | 123 (9.3%) | 170 (14.1%) |
| 5 or more Vehicles | 140 (10.6%) | 41 (3.4%) |
| Total | 1,317 (100.0%) | 1,204 (100.0%) |
Commute Time in Morris
The most frequently occuring commute durations in Morris are 5 to 9 minutes (953 commuters, 39.4%), 10 to 14 minutes (502 commuters, 20.7%), and less than 5 minutes (447 commuters, 18.5%).
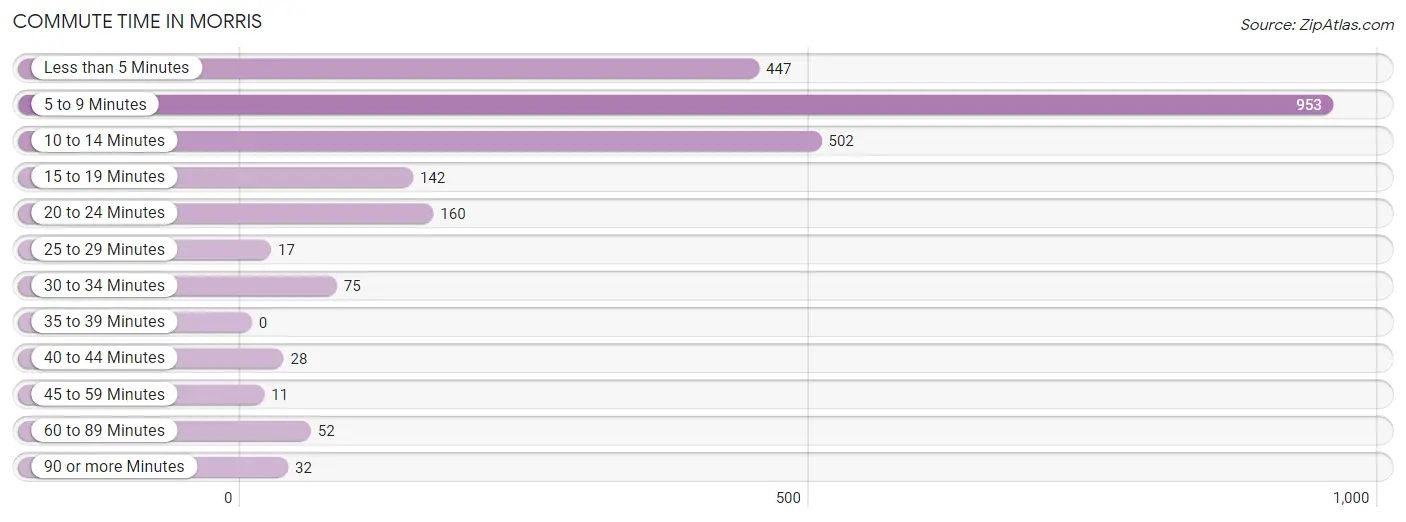
| Commute Time | # Commuters | % Commuters |
| Less than 5 Minutes | 447 | 18.5% |
| 5 to 9 Minutes | 953 | 39.4% |
| 10 to 14 Minutes | 502 | 20.7% |
| 15 to 19 Minutes | 142 | 5.9% |
| 20 to 24 Minutes | 160 | 6.6% |
| 25 to 29 Minutes | 17 | 0.7% |
| 30 to 34 Minutes | 75 | 3.1% |
| 35 to 39 Minutes | 0 | 0.0% |
| 40 to 44 Minutes | 28 | 1.2% |
| 45 to 59 Minutes | 11 | 0.4% |
| 60 to 89 Minutes | 52 | 2.1% |
| 90 or more Minutes | 32 | 1.3% |
Commute Time by Sex in Morris
The most common commute times in Morris are 5 to 9 minutes (518 commuters, 41.1%) for males and 5 to 9 minutes (435 commuters, 37.6%) for females.
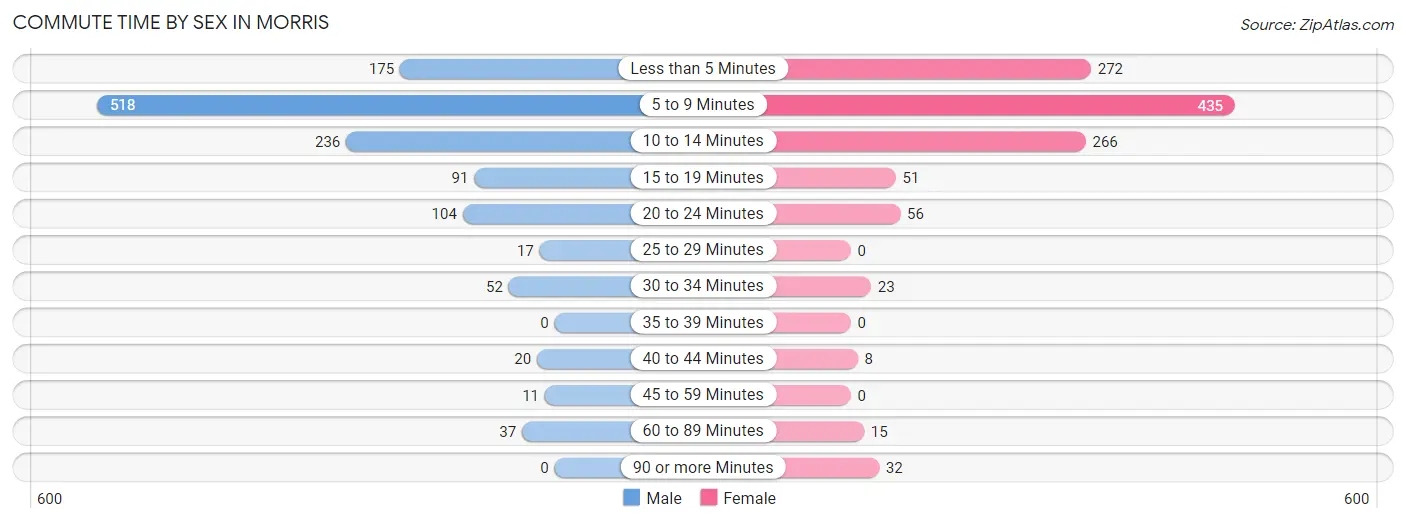
| Commute Time | Male | Female |
| Less than 5 Minutes | 175 (13.9%) | 272 (23.5%) |
| 5 to 9 Minutes | 518 (41.1%) | 435 (37.6%) |
| 10 to 14 Minutes | 236 (18.7%) | 266 (23.0%) |
| 15 to 19 Minutes | 91 (7.2%) | 51 (4.4%) |
| 20 to 24 Minutes | 104 (8.3%) | 56 (4.8%) |
| 25 to 29 Minutes | 17 (1.3%) | 0 (0.0%) |
| 30 to 34 Minutes | 52 (4.1%) | 23 (2.0%) |
| 35 to 39 Minutes | 0 (0.0%) | 0 (0.0%) |
| 40 to 44 Minutes | 20 (1.6%) | 8 (0.7%) |
| 45 to 59 Minutes | 11 (0.9%) | 0 (0.0%) |
| 60 to 89 Minutes | 37 (2.9%) | 15 (1.3%) |
| 90 or more Minutes | 0 (0.0%) | 32 (2.8%) |
Time of Departure to Work by Sex in Morris
The most frequent times of departure to work in Morris are 5:30 AM to 5:59 AM (175, 13.9%) for males and 7:30 AM to 7:59 AM (237, 20.5%) for females.
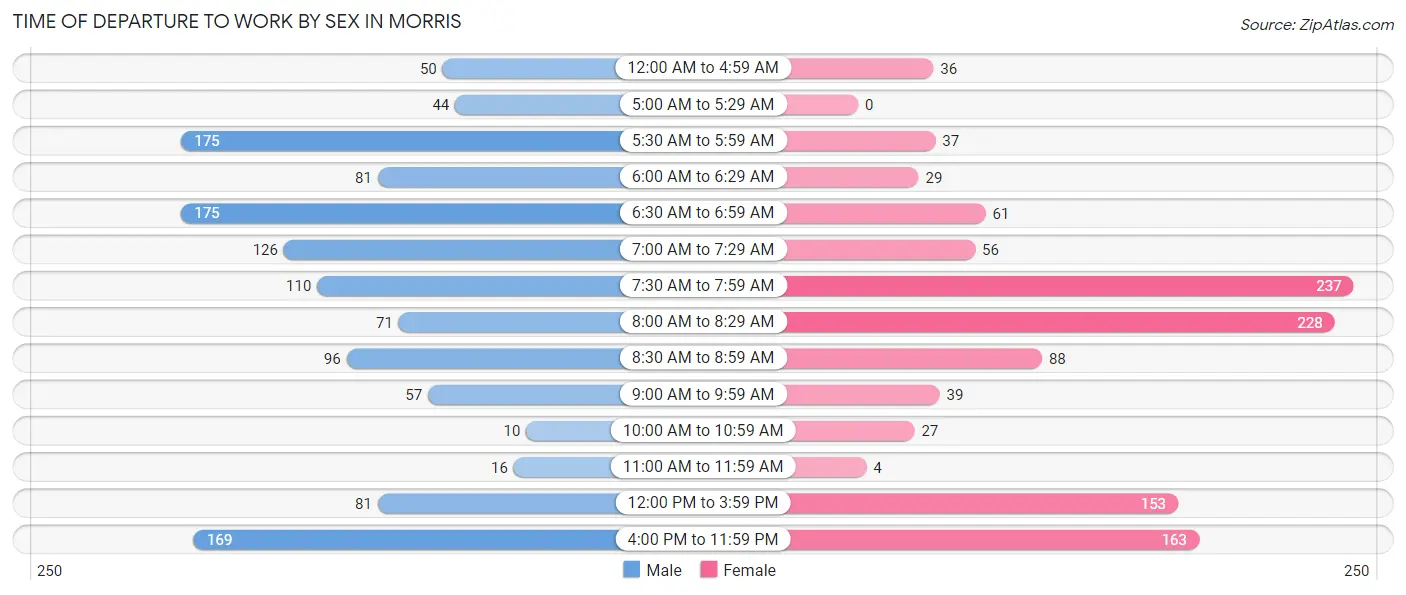
| Time of Departure | Male | Female |
| 12:00 AM to 4:59 AM | 50 (4.0%) | 36 (3.1%) |
| 5:00 AM to 5:29 AM | 44 (3.5%) | 0 (0.0%) |
| 5:30 AM to 5:59 AM | 175 (13.9%) | 37 (3.2%) |
| 6:00 AM to 6:29 AM | 81 (6.4%) | 29 (2.5%) |
| 6:30 AM to 6:59 AM | 175 (13.9%) | 61 (5.3%) |
| 7:00 AM to 7:29 AM | 126 (10.0%) | 56 (4.8%) |
| 7:30 AM to 7:59 AM | 110 (8.7%) | 237 (20.5%) |
| 8:00 AM to 8:29 AM | 71 (5.6%) | 228 (19.7%) |
| 8:30 AM to 8:59 AM | 96 (7.6%) | 88 (7.6%) |
| 9:00 AM to 9:59 AM | 57 (4.5%) | 39 (3.4%) |
| 10:00 AM to 10:59 AM | 10 (0.8%) | 27 (2.3%) |
| 11:00 AM to 11:59 AM | 16 (1.3%) | 4 (0.4%) |
| 12:00 PM to 3:59 PM | 81 (6.4%) | 153 (13.2%) |
| 4:00 PM to 11:59 PM | 169 (13.4%) | 163 (14.1%) |
| Total | 1,261 (100.0%) | 1,158 (100.0%) |
Housing Occupancy in Morris
Occupancy by Ownership in Morris
Of the total 2,110 dwellings in Morris, owner-occupied units account for 1,187 (56.3%), while renter-occupied units make up 923 (43.7%).
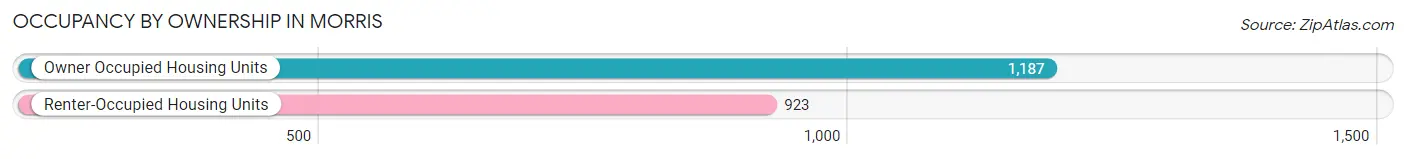
| Occupancy | # Housing Units | % Housing Units |
| Owner Occupied Housing Units | 1,187 | 56.3% |
| Renter-Occupied Housing Units | 923 | 43.7% |
| Total Occupied Housing Units | 2,110 | 100.0% |
Occupancy by Household Size in Morris
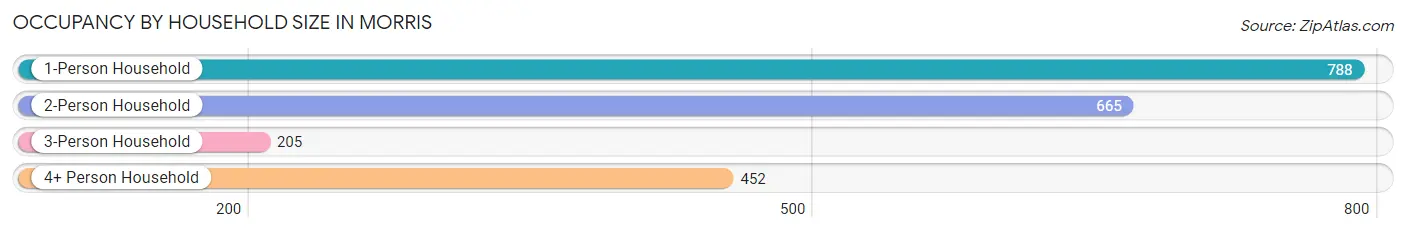
| Household Size | # Housing Units | % Housing Units |
| 1-Person Household | 788 | 37.3% |
| 2-Person Household | 665 | 31.5% |
| 3-Person Household | 205 | 9.7% |
| 4+ Person Household | 452 | 21.4% |
| Total Housing Units | 2,110 | 100.0% |
Occupancy by Ownership by Household Size in Morris
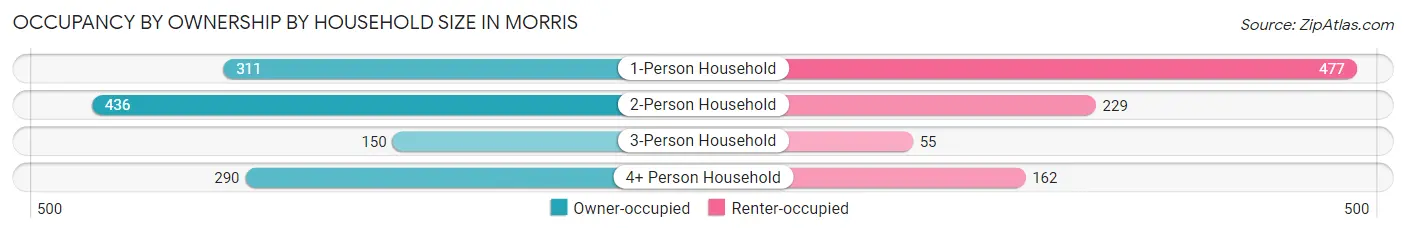
| Household Size | Owner-occupied | Renter-occupied |
| 1-Person Household | 311 (39.5%) | 477 (60.5%) |
| 2-Person Household | 436 (65.6%) | 229 (34.4%) |
| 3-Person Household | 150 (73.2%) | 55 (26.8%) |
| 4+ Person Household | 290 (64.2%) | 162 (35.8%) |
| Total Housing Units | 1,187 (56.3%) | 923 (43.7%) |
Occupancy by Educational Attainment in Morris
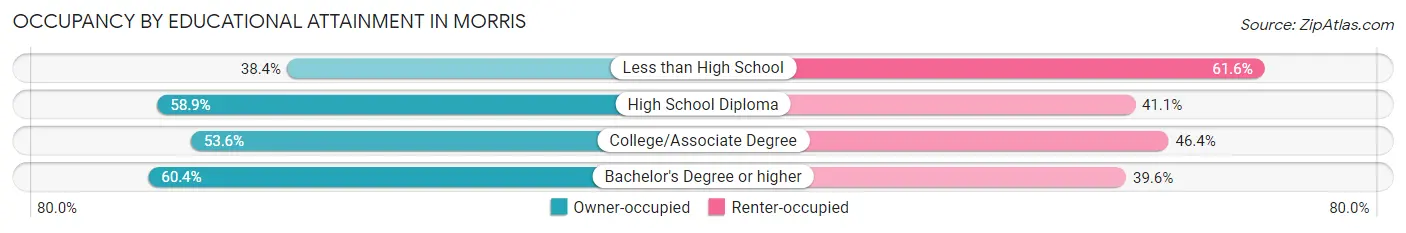
| Household Size | Owner-occupied | Renter-occupied |
| Less than High School | 48 (38.4%) | 77 (61.6%) |
| High School Diploma | 290 (58.9%) | 202 (41.1%) |
| College/Associate Degree | 415 (53.6%) | 359 (46.4%) |
| Bachelor's Degree or higher | 434 (60.4%) | 285 (39.6%) |
Occupancy by Age of Householder in Morris
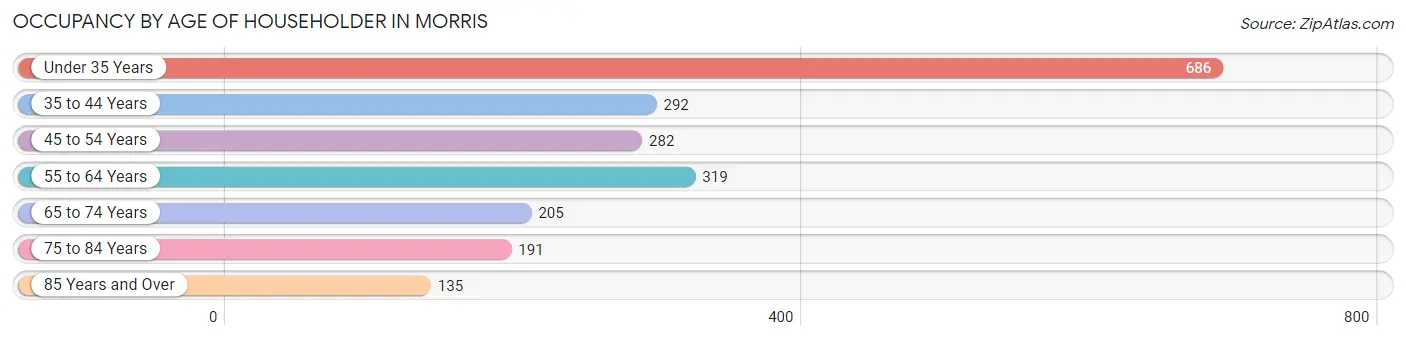
| Age Bracket | # Households | % Households |
| Under 35 Years | 686 | 32.5% |
| 35 to 44 Years | 292 | 13.8% |
| 45 to 54 Years | 282 | 13.4% |
| 55 to 64 Years | 319 | 15.1% |
| 65 to 74 Years | 205 | 9.7% |
| 75 to 84 Years | 191 | 9.0% |
| 85 Years and Over | 135 | 6.4% |
| Total | 2,110 | 100.0% |
Housing Finances in Morris
Median Income by Occupancy in Morris
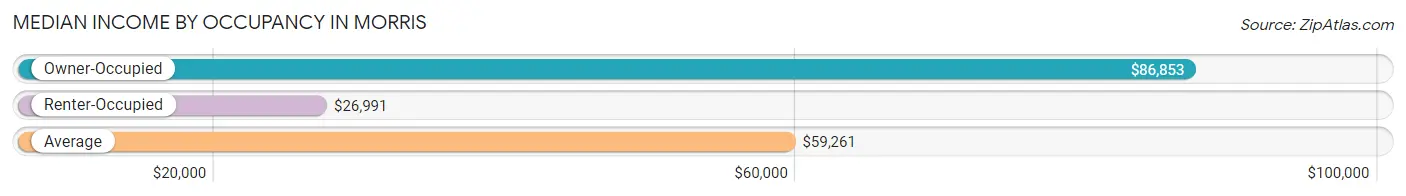
| Occupancy Type | # Households | Median Income |
| Owner-Occupied | 1,187 (56.3%) | $86,853 |
| Renter-Occupied | 923 (43.7%) | $26,991 |
| Average | 2,110 (100.0%) | $59,261 |
Occupancy by Householder Income Bracket in Morris
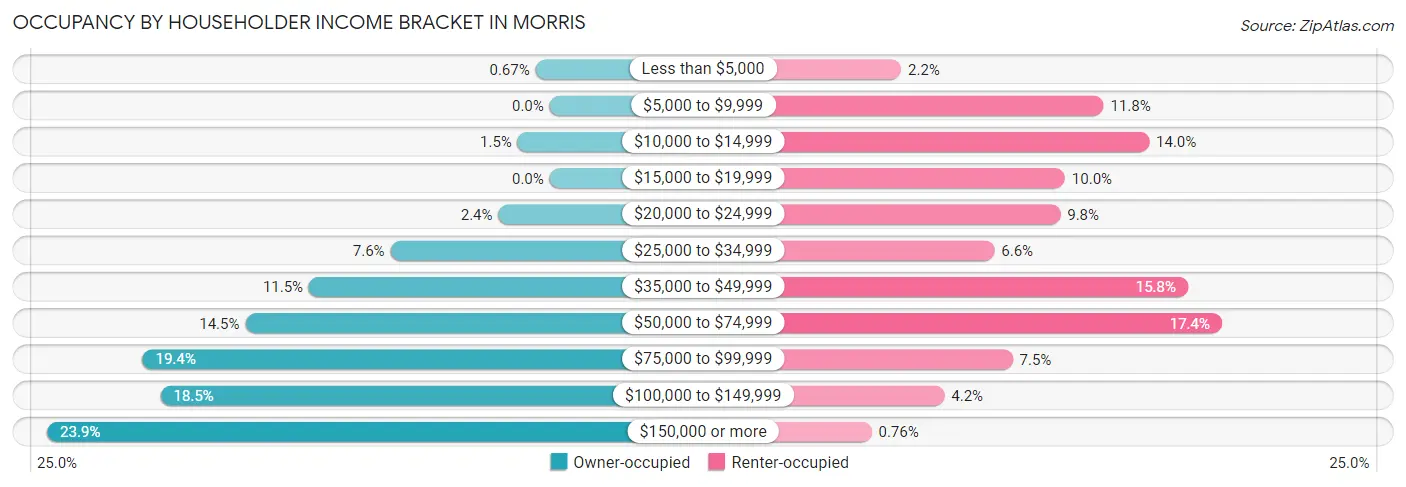
| Income Bracket | Owner-occupied | Renter-occupied |
| Less than $5,000 | 8 (0.7%) | 20 (2.2%) |
| $5,000 to $9,999 | 0 (0.0%) | 109 (11.8%) |
| $10,000 to $14,999 | 18 (1.5%) | 129 (14.0%) |
| $15,000 to $19,999 | 0 (0.0%) | 92 (10.0%) |
| $20,000 to $24,999 | 29 (2.4%) | 90 (9.8%) |
| $25,000 to $34,999 | 90 (7.6%) | 61 (6.6%) |
| $35,000 to $49,999 | 136 (11.5%) | 146 (15.8%) |
| $50,000 to $74,999 | 172 (14.5%) | 161 (17.4%) |
| $75,000 to $99,999 | 230 (19.4%) | 69 (7.5%) |
| $100,000 to $149,999 | 220 (18.5%) | 39 (4.2%) |
| $150,000 or more | 284 (23.9%) | 7 (0.8%) |
| Total | 1,187 (100.0%) | 923 (100.0%) |
Monthly Housing Cost Tiers in Morris
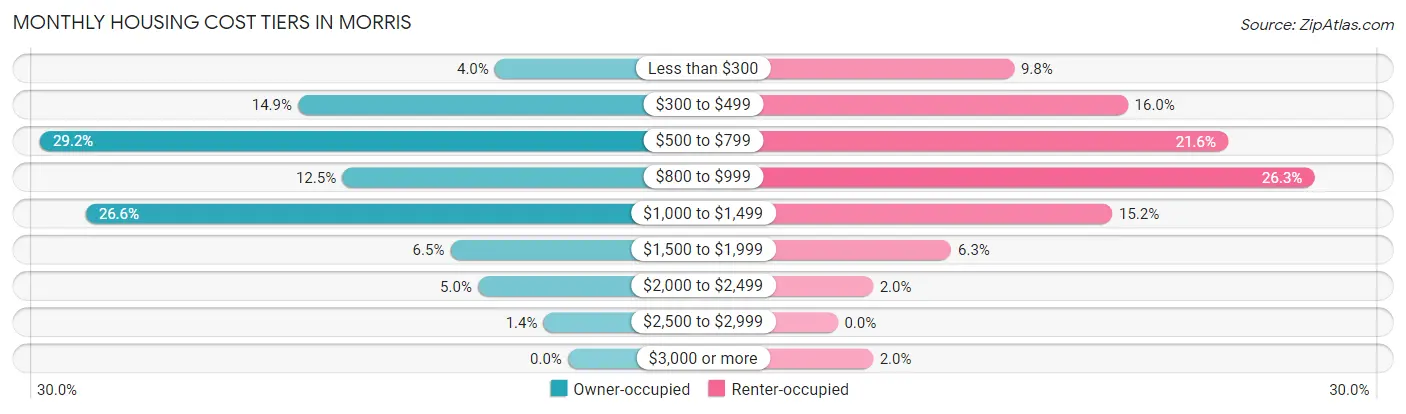
| Monthly Cost | Owner-occupied | Renter-occupied |
| Less than $300 | 48 (4.0%) | 90 (9.8%) |
| $300 to $499 | 177 (14.9%) | 148 (16.0%) |
| $500 to $799 | 346 (29.1%) | 199 (21.6%) |
| $800 to $999 | 148 (12.5%) | 243 (26.3%) |
| $1,000 to $1,499 | 316 (26.6%) | 140 (15.2%) |
| $1,500 to $1,999 | 77 (6.5%) | 58 (6.3%) |
| $2,000 to $2,499 | 59 (5.0%) | 18 (1.9%) |
| $2,500 to $2,999 | 16 (1.3%) | 0 (0.0%) |
| $3,000 or more | 0 (0.0%) | 18 (1.9%) |
| Total | 1,187 (100.0%) | 923 (100.0%) |
Physical Housing Characteristics in Morris
Housing Structures in Morris
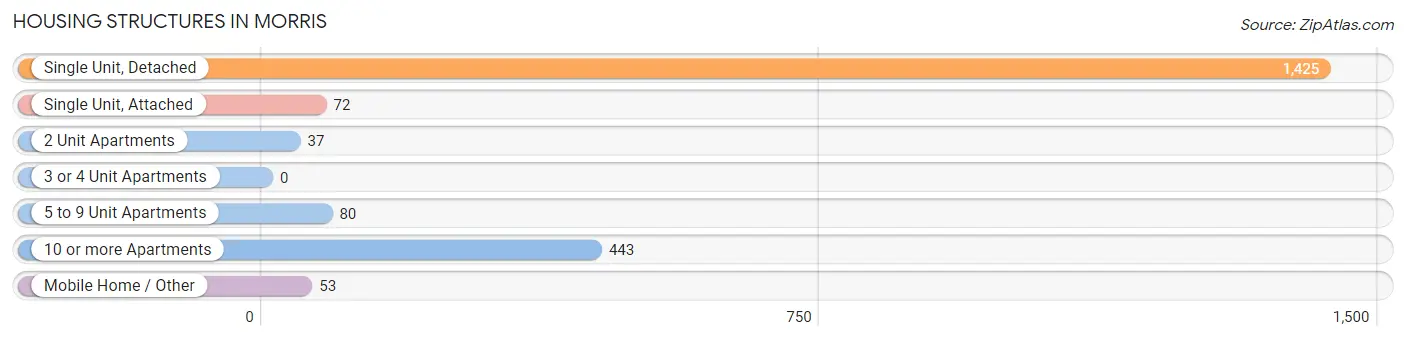
| Structure Type | # Housing Units | % Housing Units |
| Single Unit, Detached | 1,425 | 67.5% |
| Single Unit, Attached | 72 | 3.4% |
| 2 Unit Apartments | 37 | 1.8% |
| 3 or 4 Unit Apartments | 0 | 0.0% |
| 5 to 9 Unit Apartments | 80 | 3.8% |
| 10 or more Apartments | 443 | 21.0% |
| Mobile Home / Other | 53 | 2.5% |
| Total | 2,110 | 100.0% |
Housing Structures by Occupancy in Morris
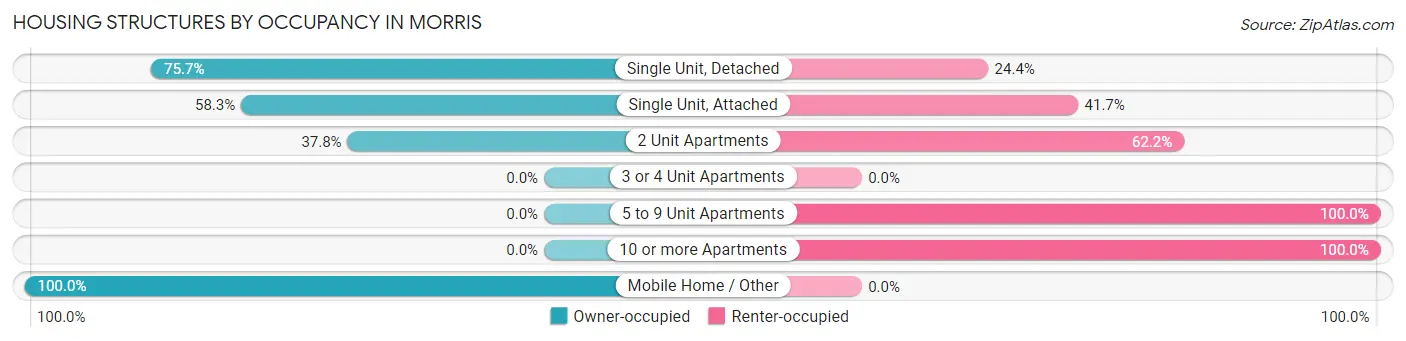
| Structure Type | Owner-occupied | Renter-occupied |
| Single Unit, Detached | 1,078 (75.6%) | 347 (24.3%) |
| Single Unit, Attached | 42 (58.3%) | 30 (41.7%) |
| 2 Unit Apartments | 14 (37.8%) | 23 (62.2%) |
| 3 or 4 Unit Apartments | 0 (0.0%) | 0 (0.0%) |
| 5 to 9 Unit Apartments | 0 (0.0%) | 80 (100.0%) |
| 10 or more Apartments | 0 (0.0%) | 443 (100.0%) |
| Mobile Home / Other | 53 (100.0%) | 0 (0.0%) |
| Total | 1,187 (56.3%) | 923 (43.7%) |
Housing Structures by Number of Rooms in Morris
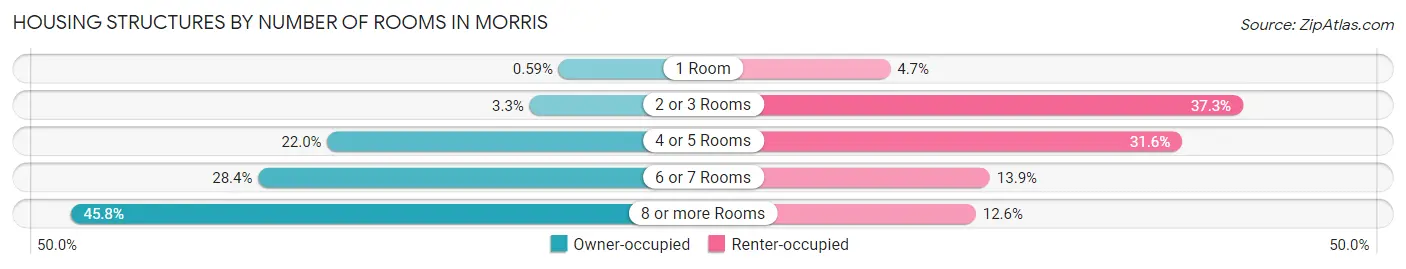
| Number of Rooms | Owner-occupied | Renter-occupied |
| 1 Room | 7 (0.6%) | 43 (4.7%) |
| 2 or 3 Rooms | 39 (3.3%) | 344 (37.3%) |
| 4 or 5 Rooms | 261 (22.0%) | 292 (31.6%) |
| 6 or 7 Rooms | 337 (28.4%) | 128 (13.9%) |
| 8 or more Rooms | 543 (45.8%) | 116 (12.6%) |
| Total | 1,187 (100.0%) | 923 (100.0%) |
Housing Structure by Heating Type in Morris
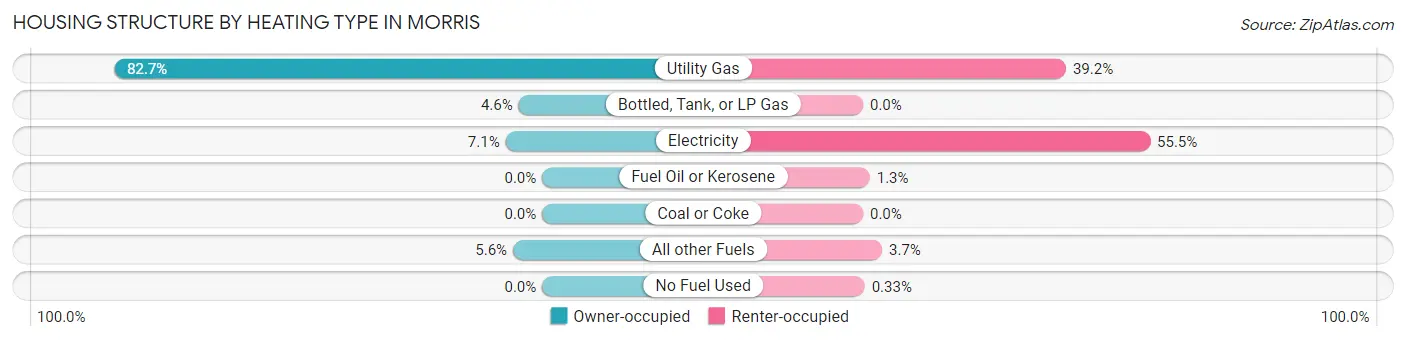
| Heating Type | Owner-occupied | Renter-occupied |
| Utility Gas | 982 (82.7%) | 362 (39.2%) |
| Bottled, Tank, or LP Gas | 54 (4.5%) | 0 (0.0%) |
| Electricity | 84 (7.1%) | 512 (55.5%) |
| Fuel Oil or Kerosene | 0 (0.0%) | 12 (1.3%) |
| Coal or Coke | 0 (0.0%) | 0 (0.0%) |
| All other Fuels | 67 (5.6%) | 34 (3.7%) |
| No Fuel Used | 0 (0.0%) | 3 (0.3%) |
| Total | 1,187 (100.0%) | 923 (100.0%) |
Household Vehicle Usage in Morris
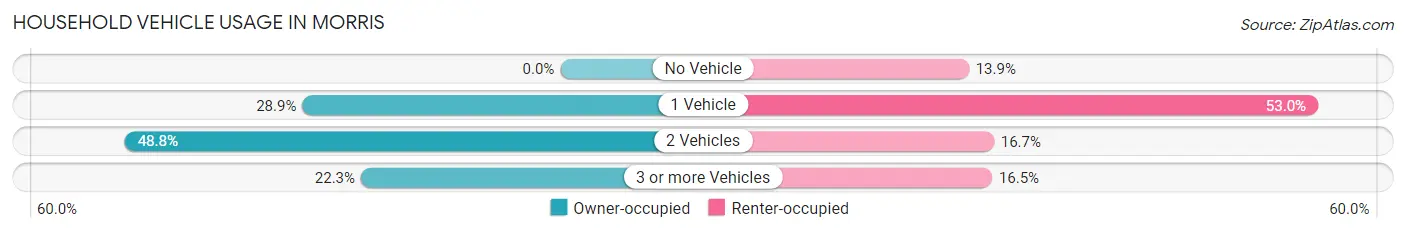
| Vehicles per Household | Owner-occupied | Renter-occupied |
| No Vehicle | 0 (0.0%) | 128 (13.9%) |
| 1 Vehicle | 343 (28.9%) | 489 (53.0%) |
| 2 Vehicles | 579 (48.8%) | 154 (16.7%) |
| 3 or more Vehicles | 265 (22.3%) | 152 (16.5%) |
| Total | 1,187 (100.0%) | 923 (100.0%) |
Real Estate & Mortgages in Morris
Real Estate and Mortgage Overview in Morris
| Characteristic | Without Mortgage | With Mortgage |
| Housing Units | 547 | 640 |
| Median Property Value | $207,600 | $166,100 |
| Median Household Income | $76,940 | $137 |
| Monthly Housing Costs | $595 | $0 |
| Real Estate Taxes | $2,507 | $11 |
Property Value by Mortgage Status in Morris
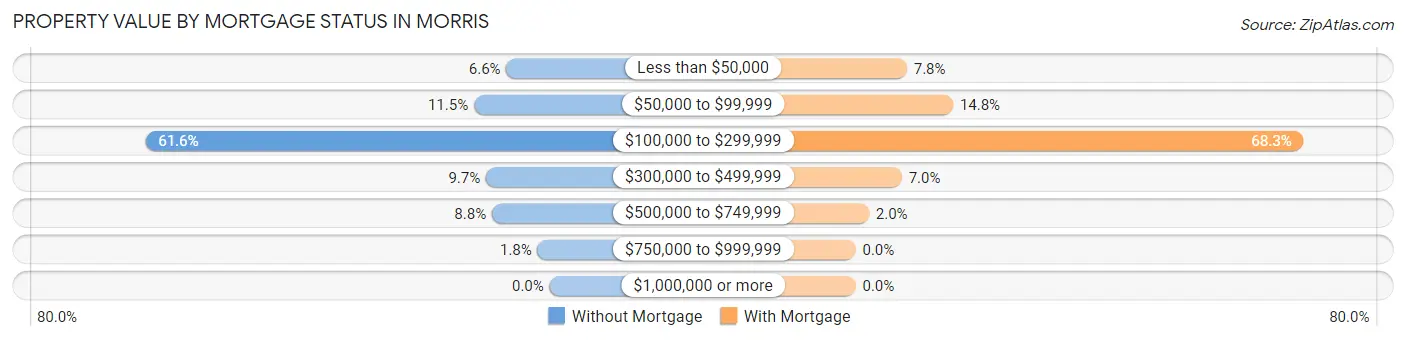
| Property Value | Without Mortgage | With Mortgage |
| Less than $50,000 | 36 (6.6%) | 50 (7.8%) |
| $50,000 to $99,999 | 63 (11.5%) | 95 (14.8%) |
| $100,000 to $299,999 | 337 (61.6%) | 437 (68.3%) |
| $300,000 to $499,999 | 53 (9.7%) | 45 (7.0%) |
| $500,000 to $749,999 | 48 (8.8%) | 13 (2.0%) |
| $750,000 to $999,999 | 10 (1.8%) | 0 (0.0%) |
| $1,000,000 or more | 0 (0.0%) | 0 (0.0%) |
| Total | 547 (100.0%) | 640 (100.0%) |
Household Income by Mortgage Status in Morris
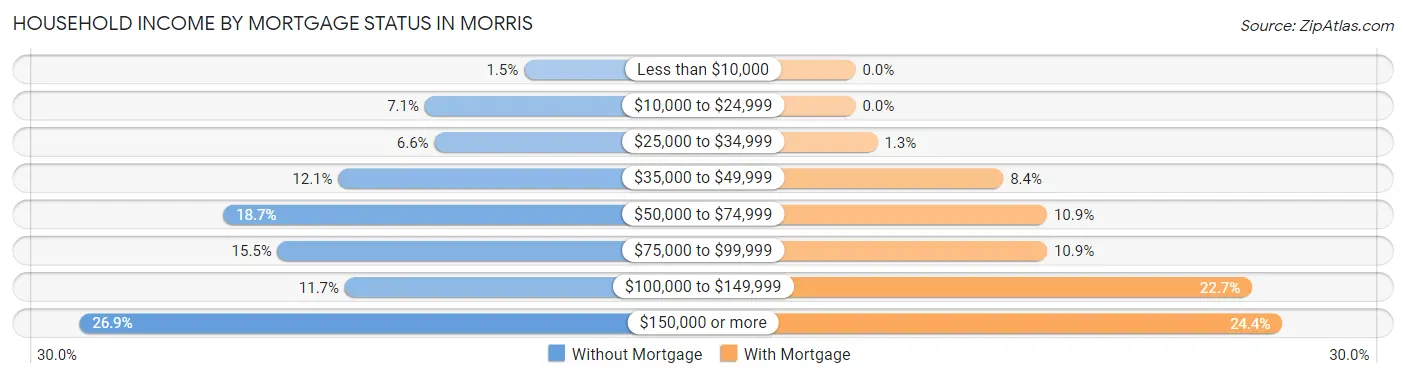
| Household Income | Without Mortgage | With Mortgage |
| Less than $10,000 | 8 (1.5%) | 0 (0.0%) |
| $10,000 to $24,999 | 39 (7.1%) | 0 (0.0%) |
| $25,000 to $34,999 | 36 (6.6%) | 8 (1.3%) |
| $35,000 to $49,999 | 66 (12.1%) | 54 (8.4%) |
| $50,000 to $74,999 | 102 (18.6%) | 70 (10.9%) |
| $75,000 to $99,999 | 85 (15.5%) | 70 (10.9%) |
| $100,000 to $149,999 | 64 (11.7%) | 145 (22.7%) |
| $150,000 or more | 147 (26.9%) | 156 (24.4%) |
| Total | 547 (100.0%) | 640 (100.0%) |
Property Value to Household Income Ratio in Morris
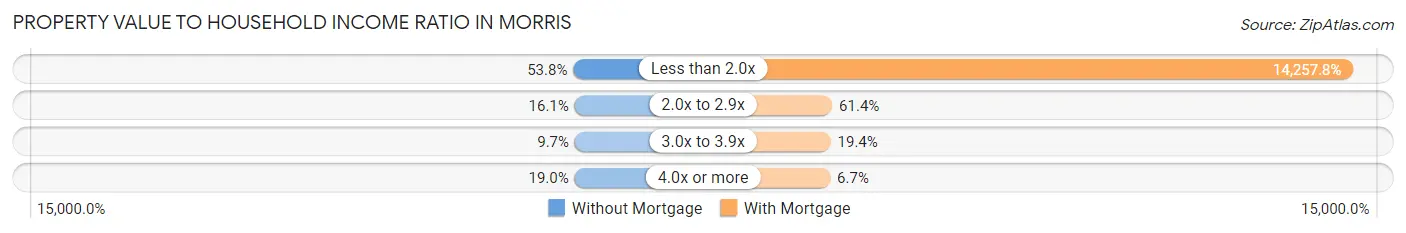
| Value-to-Income Ratio | Without Mortgage | With Mortgage |
| Less than 2.0x | 294 (53.7%) | 91,250 (14,257.8%) |
| 2.0x to 2.9x | 88 (16.1%) | 393 (61.4%) |
| 3.0x to 3.9x | 53 (9.7%) | 124 (19.4%) |
| 4.0x or more | 104 (19.0%) | 43 (6.7%) |
| Total | 547 (100.0%) | 640 (100.0%) |
Real Estate Taxes by Mortgage Status in Morris
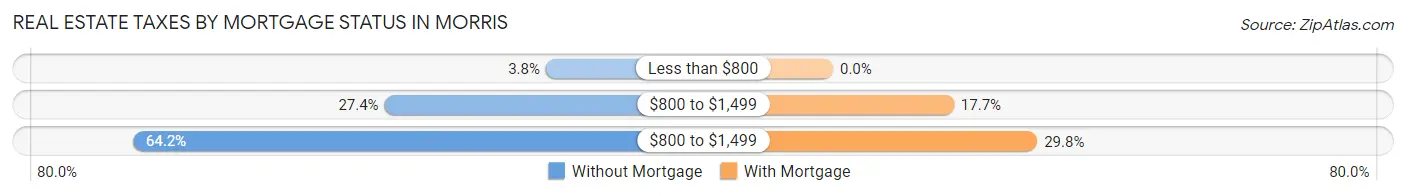
| Property Taxes | Without Mortgage | With Mortgage |
| Less than $800 | 21 (3.8%) | 0 (0.0%) |
| $800 to $1,499 | 150 (27.4%) | 113 (17.7%) |
| $800 to $1,499 | 351 (64.2%) | 191 (29.8%) |
| Total | 547 (100.0%) | 640 (100.0%) |
Health & Disability in Morris
Health Insurance Coverage by Age in Morris
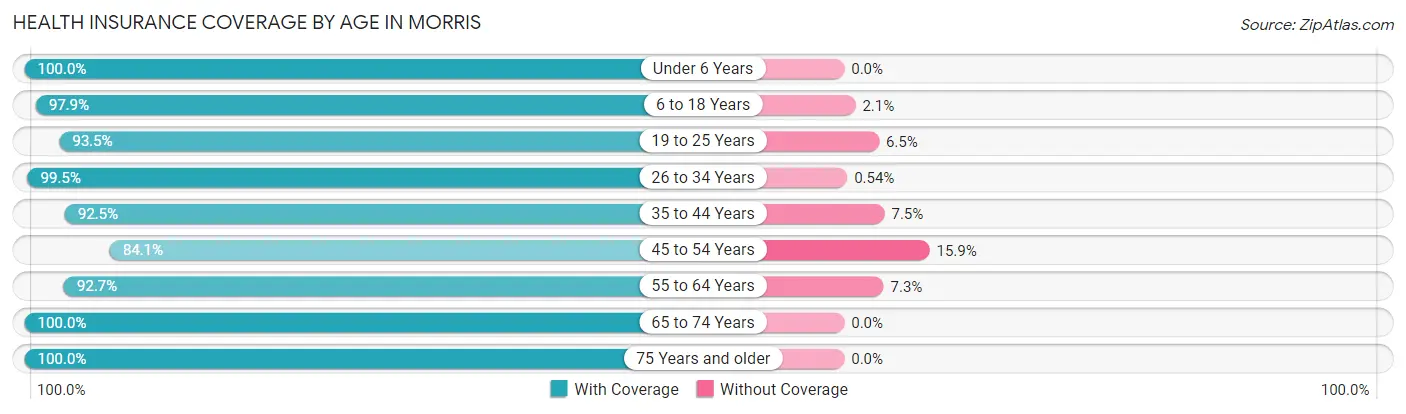
| Age Bracket | With Coverage | Without Coverage |
| Under 6 Years | 360 (100.0%) | 0 (0.0%) |
| 6 to 18 Years | 890 (97.9%) | 19 (2.1%) |
| 19 to 25 Years | 896 (93.5%) | 62 (6.5%) |
| 26 to 34 Years | 550 (99.5%) | 3 (0.5%) |
| 35 to 44 Years | 530 (92.5%) | 43 (7.5%) |
| 45 to 54 Years | 365 (84.1%) | 69 (15.9%) |
| 55 to 64 Years | 430 (92.7%) | 34 (7.3%) |
| 65 to 74 Years | 336 (100.0%) | 0 (0.0%) |
| 75 Years and older | 420 (100.0%) | 0 (0.0%) |
| Total | 4,777 (95.4%) | 230 (4.6%) |
Health Insurance Coverage by Citizenship Status in Morris
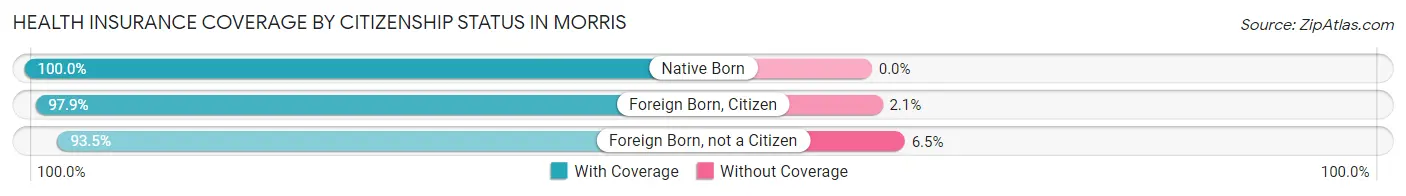
| Citizenship Status | With Coverage | Without Coverage |
| Native Born | 360 (100.0%) | 0 (0.0%) |
| Foreign Born, Citizen | 890 (97.9%) | 19 (2.1%) |
| Foreign Born, not a Citizen | 896 (93.5%) | 62 (6.5%) |
Health Insurance Coverage by Household Income in Morris
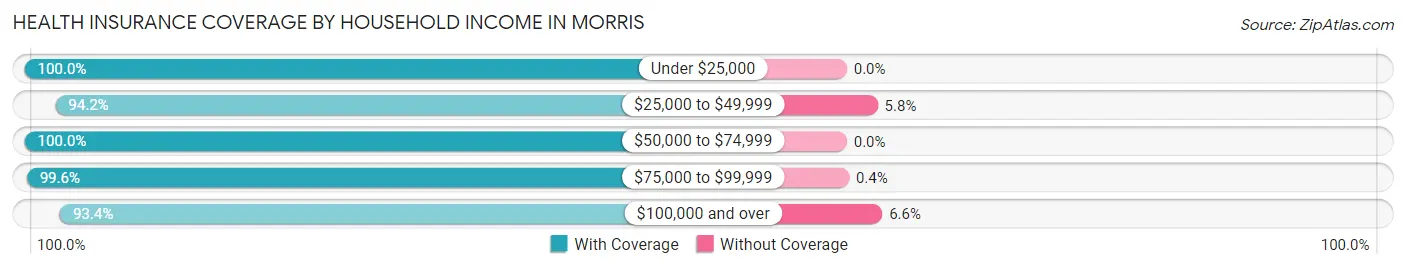
| Household Income | With Coverage | Without Coverage |
| Under $25,000 | 695 (100.0%) | 0 (0.0%) |
| $25,000 to $49,999 | 734 (94.2%) | 45 (5.8%) |
| $50,000 to $74,999 | 675 (100.0%) | 0 (0.0%) |
| $75,000 to $99,999 | 748 (99.6%) | 3 (0.4%) |
| $100,000 and over | 1,687 (93.4%) | 120 (6.6%) |
Public vs Private Health Insurance Coverage by Age in Morris
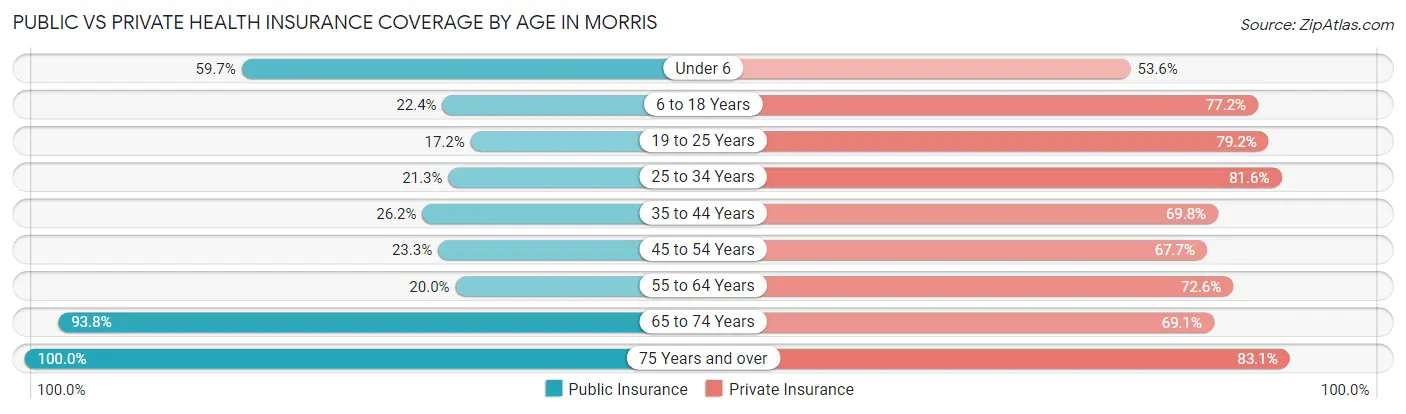
| Age Bracket | Public Insurance | Private Insurance |
| Under 6 | 215 (59.7%) | 193 (53.6%) |
| 6 to 18 Years | 204 (22.4%) | 702 (77.2%) |
| 19 to 25 Years | 165 (17.2%) | 759 (79.2%) |
| 25 to 34 Years | 118 (21.3%) | 451 (81.6%) |
| 35 to 44 Years | 150 (26.2%) | 400 (69.8%) |
| 45 to 54 Years | 101 (23.3%) | 294 (67.7%) |
| 55 to 64 Years | 93 (20.0%) | 337 (72.6%) |
| 65 to 74 Years | 315 (93.8%) | 232 (69.1%) |
| 75 Years and over | 420 (100.0%) | 349 (83.1%) |
| Total | 1,781 (35.6%) | 3,717 (74.2%) |
Disability Status by Sex by Age in Morris
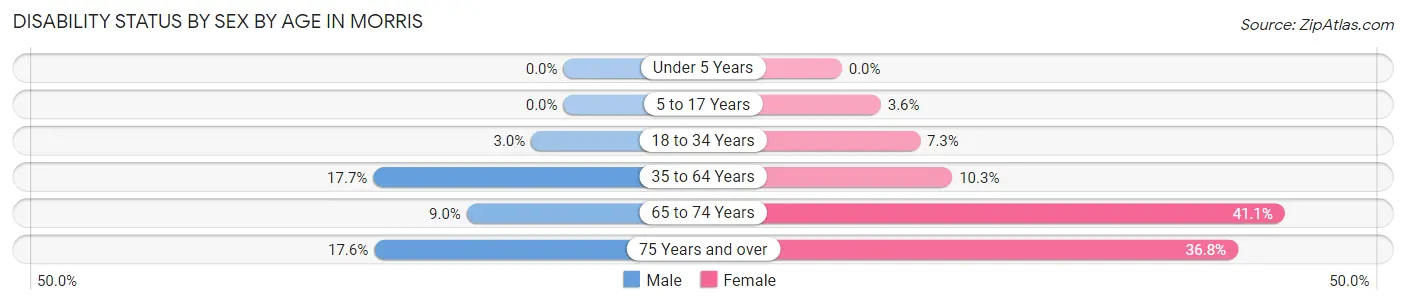
| Age Bracket | Male | Female |
| Under 5 Years | 0 (0.0%) | 0 (0.0%) |
| 5 to 17 Years | 0 (0.0%) | 11 (3.6%) |
| 18 to 34 Years | 23 (3.0%) | 74 (7.3%) |
| 35 to 64 Years | 146 (17.6%) | 66 (10.2%) |
| 65 to 74 Years | 14 (9.0%) | 74 (41.1%) |
| 75 Years and over | 26 (17.6%) | 100 (36.8%) |
Disability Class by Sex by Age in Morris
Disability Class: Hearing Difficulty
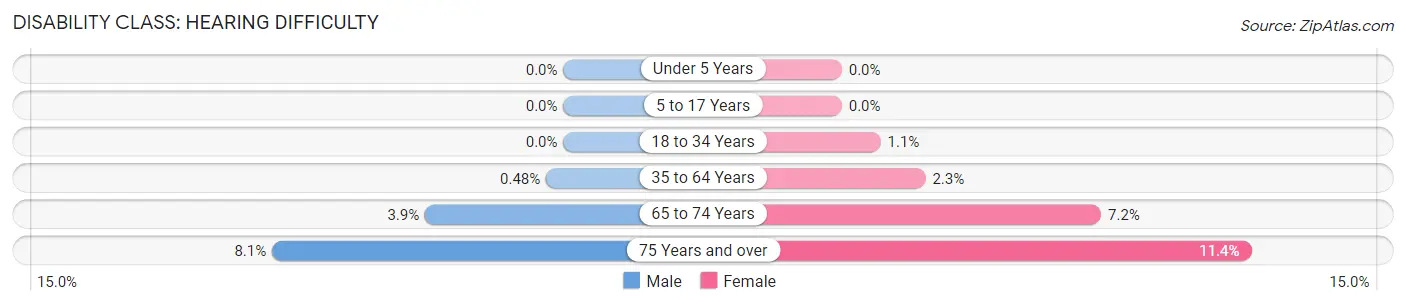
| Age Bracket | Male | Female |
| Under 5 Years | 0 (0.0%) | 0 (0.0%) |
| 5 to 17 Years | 0 (0.0%) | 0 (0.0%) |
| 18 to 34 Years | 0 (0.0%) | 11 (1.1%) |
| 35 to 64 Years | 4 (0.5%) | 15 (2.3%) |
| 65 to 74 Years | 6 (3.8%) | 13 (7.2%) |
| 75 Years and over | 12 (8.1%) | 31 (11.4%) |
Disability Class: Vision Difficulty
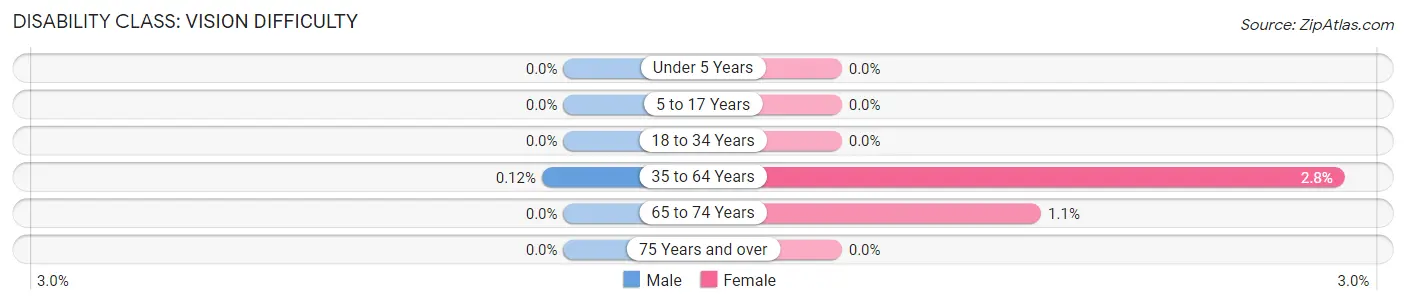
| Age Bracket | Male | Female |
| Under 5 Years | 0 (0.0%) | 0 (0.0%) |
| 5 to 17 Years | 0 (0.0%) | 0 (0.0%) |
| 18 to 34 Years | 0 (0.0%) | 0 (0.0%) |
| 35 to 64 Years | 1 (0.1%) | 18 (2.8%) |
| 65 to 74 Years | 0 (0.0%) | 2 (1.1%) |
| 75 Years and over | 0 (0.0%) | 0 (0.0%) |
Disability Class: Cognitive Difficulty
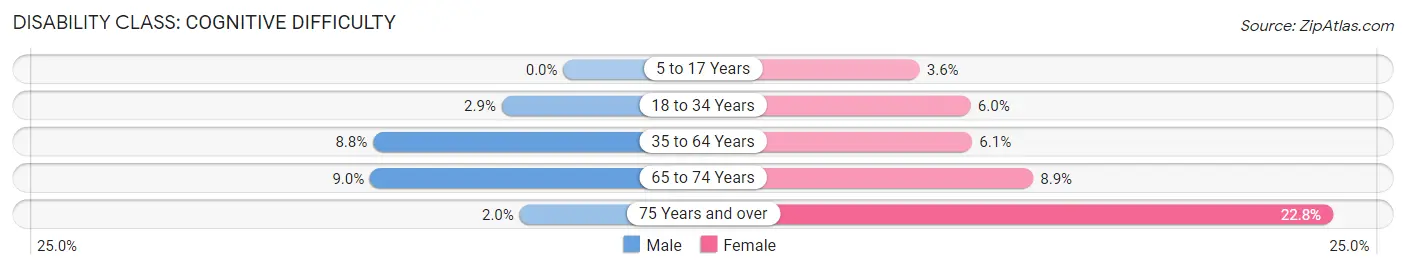
| Age Bracket | Male | Female |
| 5 to 17 Years | 0 (0.0%) | 11 (3.6%) |
| 18 to 34 Years | 22 (2.9%) | 61 (6.0%) |
| 35 to 64 Years | 73 (8.8%) | 39 (6.1%) |
| 65 to 74 Years | 14 (9.0%) | 16 (8.9%) |
| 75 Years and over | 3 (2.0%) | 62 (22.8%) |
Disability Class: Ambulatory Difficulty
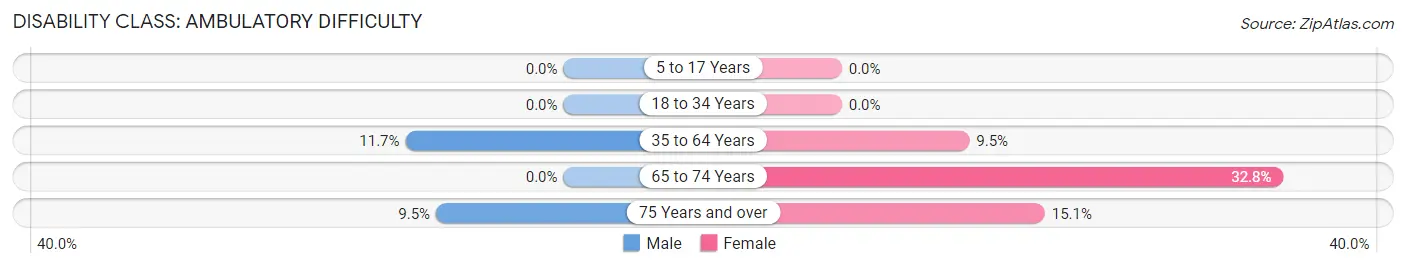
| Age Bracket | Male | Female |
| 5 to 17 Years | 0 (0.0%) | 0 (0.0%) |
| 18 to 34 Years | 0 (0.0%) | 0 (0.0%) |
| 35 to 64 Years | 97 (11.7%) | 61 (9.5%) |
| 65 to 74 Years | 0 (0.0%) | 59 (32.8%) |
| 75 Years and over | 14 (9.5%) | 41 (15.1%) |
Disability Class: Self-Care Difficulty
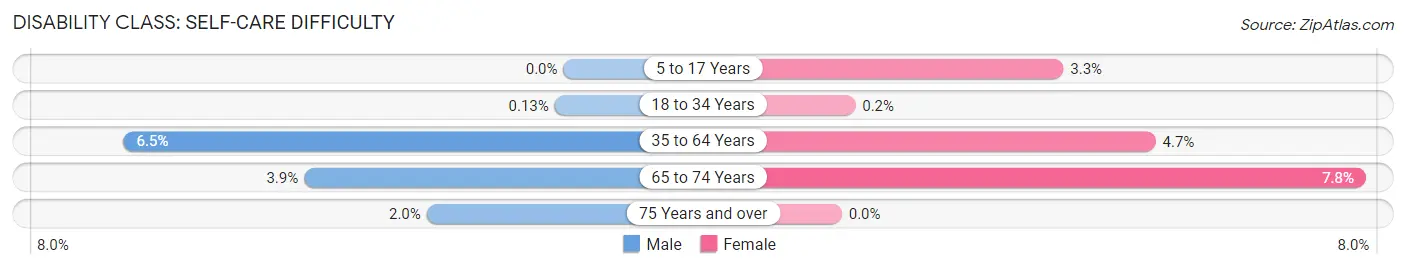
| Age Bracket | Male | Female |
| 5 to 17 Years | 0 (0.0%) | 10 (3.3%) |
| 18 to 34 Years | 1 (0.1%) | 2 (0.2%) |
| 35 to 64 Years | 54 (6.5%) | 30 (4.7%) |
| 65 to 74 Years | 6 (3.8%) | 14 (7.8%) |
| 75 Years and over | 3 (2.0%) | 0 (0.0%) |
Technology Access in Morris
Computing Device Access in Morris
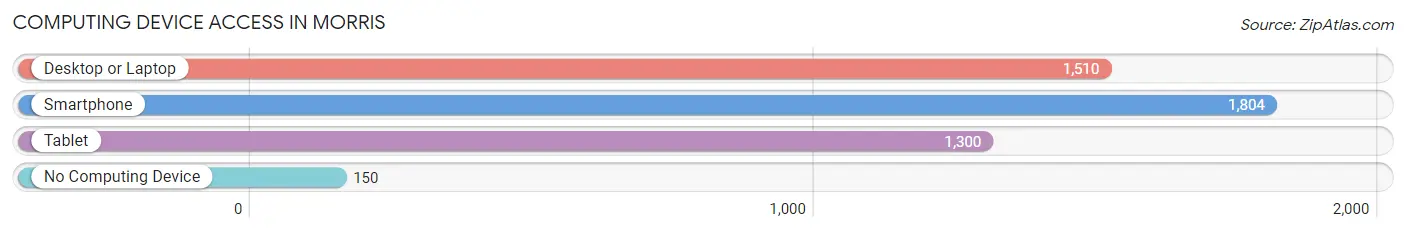
| Device Type | # Households | % Households |
| Desktop or Laptop | 1,510 | 71.6% |
| Smartphone | 1,804 | 85.5% |
| Tablet | 1,300 | 61.6% |
| No Computing Device | 150 | 7.1% |
| Total | 2,110 | 100.0% |
Internet Access in Morris
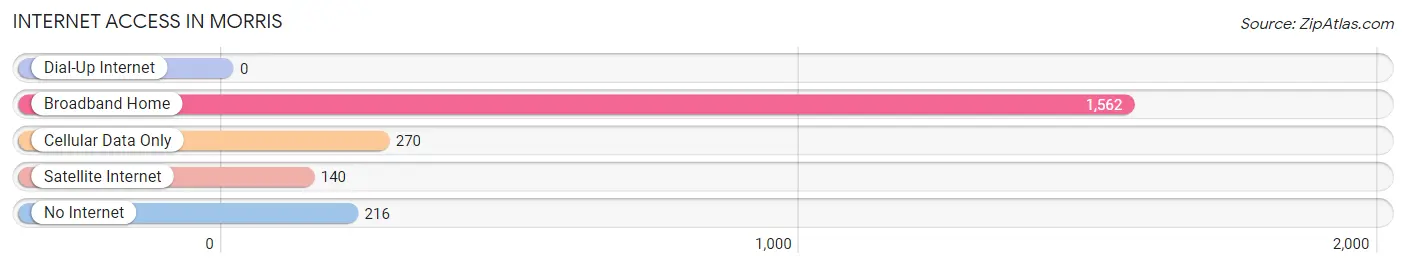
| Internet Type | # Households | % Households |
| Dial-Up Internet | 0 | 0.0% |
| Broadband Home | 1,562 | 74.0% |
| Cellular Data Only | 270 | 12.8% |
| Satellite Internet | 140 | 6.6% |
| No Internet | 216 | 10.2% |
| Total | 2,110 | 100.0% |
Morris Summary
Morris, Minnesota is a city located in Stevens County in the west-central part of the state. It is the county seat and the largest city in Stevens County. The city is located along the Pomme de Terre River and is home to the University of Minnesota Morris. The city has a population of 5,286 as of the 2010 census.
History
The area that is now Morris was first settled in 1864 by a group of Norwegian immigrants. The city was named after Charles A. Morris, a railroad official. The city was incorporated in 1887 and was designated as the county seat of Stevens County in 1889.
In the early 1900s, Morris was a major center for the production of wheat and other grains. The city was also home to a number of manufacturing businesses, including a flour mill, a creamery, a canning factory, and a brickyard.
In the 1950s, the University of Minnesota Morris was established in the city. The university has since become a major employer in the city and has helped to diversify the local economy.
Geography
Morris is located in west-central Minnesota, about 90 miles west of Minneapolis. The city is situated along the Pomme de Terre River and is surrounded by rolling hills and farmland. The city has a total area of 4.2 square miles, all of which is land.
Climate
Morris has a humid continental climate, with cold winters and warm summers. The average annual temperature is 45°F, with an average high of 63°F in July and an average low of 27°F in January. The average annual precipitation is 28 inches, with the most precipitation occurring in June and July.
Economy
The economy of Morris is largely based on agriculture and education. The University of Minnesota Morris is the largest employer in the city, with over 1,000 employees. Other major employers include the Stevens County government, the Morris Hospital and Clinics, and the Morris Public Schools.
Agriculture is also an important part of the local economy. The city is home to a number of farms that produce a variety of crops, including wheat, corn, soybeans, and alfalfa.
Demographics
As of the 2010 census, there were 5,286 people, 1,945 households, and 1,093 families living in Morris. The population density was 1,258.3 people per square mile. The racial makeup of the city was 94.2% White, 0.7% African American, 0.4% Native American, 2.2% Asian, 0.1% Pacific Islander, 0.9% from other races, and 1.5% from two or more races. Hispanic or Latino of any race were 2.7% of the population.
The median age in Morris was 22.7 years, with 19.2% of the population under the age of 18, 57.2% between the ages of 18 and 24, 11.2% between the ages of 25 and 44, 8.2% between the ages of 45 and 64, and 4.2% over the age of 65. The median household income was $37,917, and the median family income was $50,938.
Conclusion
Morris, Minnesota is a city located in Stevens County in the west-central part of the state. It is the county seat and the largest city in Stevens County. The city is home to the University of Minnesota Morris and has a population of 5,286 as of the 2010 census. The economy of Morris is largely based on agriculture and education, with the University of Minnesota Morris being the largest employer in the city. The city has a humid continental climate, with cold winters and warm summers. The racial makeup of the city is 94.2% White, 0.7% African American, 0.4% Native American, 2.2% Asian, 0.1% Pacific Islander, 0.9% from other races, and 1.5% from two or more races. The median household income was $37,917, and the median family income was $50,938.
Common Questions
What is Per Capita Income in Morris?
Per Capita income in Morris is $37,655.
What is the Median Family Income in Morris?
Median Family Income in Morris is $91,842.
What is the Median Household income in Morris?
Median Household Income in Morris is $59,261.
What is Income or Wage Gap in Morris?
Income or Wage Gap in Morris is 59.1%.
Women in Morris earn 40.9 cents for every dollar earned by a man.
What is Inequality or Gini Index in Morris?
Inequality or Gini Index in Morris is 0.52.
What is the Total Population of Morris?
Total Population of Morris is 5,094.
What is the Total Male Population of Morris?
Total Male Population of Morris is 2,483.
What is the Total Female Population of Morris?
Total Female Population of Morris is 2,611.
What is the Ratio of Males per 100 Females in Morris?
There are 95.10 Males per 100 Females in Morris.
What is the Ratio of Females per 100 Males in Morris?
There are 105.16 Females per 100 Males in Morris.
What is the Median Population Age in Morris?
Median Population Age in Morris is 31.4 Years.
What is the Average Family Size in Morris
Average Family Size in Morris is 3.1 People.
What is the Average Household Size in Morris
Average Household Size in Morris is 2.2 People.
How Large is the Labor Force in Morris?
There are 2,745 People in the Labor Forcein in Morris.
What is the Percentage of People in the Labor Force in Morris?
65.1% of People are in the Labor Force in Morris.
What is the Unemployment Rate in Morris?
Unemployment Rate in Morris is 0.4%.