Menahga, MN Map & Demographics
Menahga Map
Menahga Overview
$25,301
PER CAPITA INCOME
$73,661
AVG FAMILY INCOME
$54,167
AVG HOUSEHOLD INCOME
24.4%
WAGE / INCOME GAP [ % ]
75.6¢/ $1
WAGE / INCOME GAP [ $ ]
$7,651
FAMILY INCOME DEFICIT
0.40
INEQUALITY / GINI INDEX
1,218
TOTAL POPULATION
578
MALE POPULATION
640
FEMALE POPULATION
90.31
MALES / 100 FEMALES
110.73
FEMALES / 100 MALES
44.2
MEDIAN AGE
3.6
AVG FAMILY SIZE
2.3
AVG HOUSEHOLD SIZE
433
LABOR FORCE [ PEOPLE ]
46.6%
PERCENT IN LABOR FORCE
2.8%
UNEMPLOYMENT RATE
Menahga Zip Codes
Menahga Area Codes
Income in Menahga
Income Overview in Menahga
Per Capita Income in Menahga is $25,301, while median incomes of families and households are $73,661 and $54,167 respectively.
| Characteristic | Number | Measure |
| Per Capita Income | 1,218 | $25,301 |
| Median Family Income | 233 | $73,661 |
| Mean Family Income | 233 | $77,663 |
| Median Household Income | 490 | $54,167 |
| Mean Household Income | 490 | $62,632 |
| Income Deficit | 233 | $7,651 |
| Wage / Income Gap (%) | 1,218 | 24.41% |
| Wage / Income Gap ($) | 1,218 | 75.59¢ per $1 |
| Gini / Inequality Index | 1,218 | 0.40 |
Earnings by Sex in Menahga
Average Earnings in Menahga are $41,638, $53,177 for men and $40,194 for women, a difference of 24.4%.
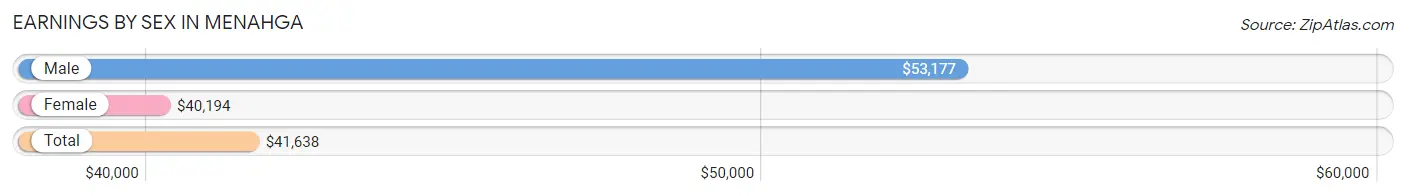
| Sex | Number | Average Earnings |
| Male | 215 (45.0%) | $53,177 |
| Female | 263 (55.0%) | $40,194 |
| Total | 478 (100.0%) | $41,638 |
Earnings by Sex by Income Bracket in Menahga
The most common earnings brackets in Menahga are $55,000 to $64,999 for men (40 | 18.6%) and $40,000 to $44,999 for women (58 | 22.1%).
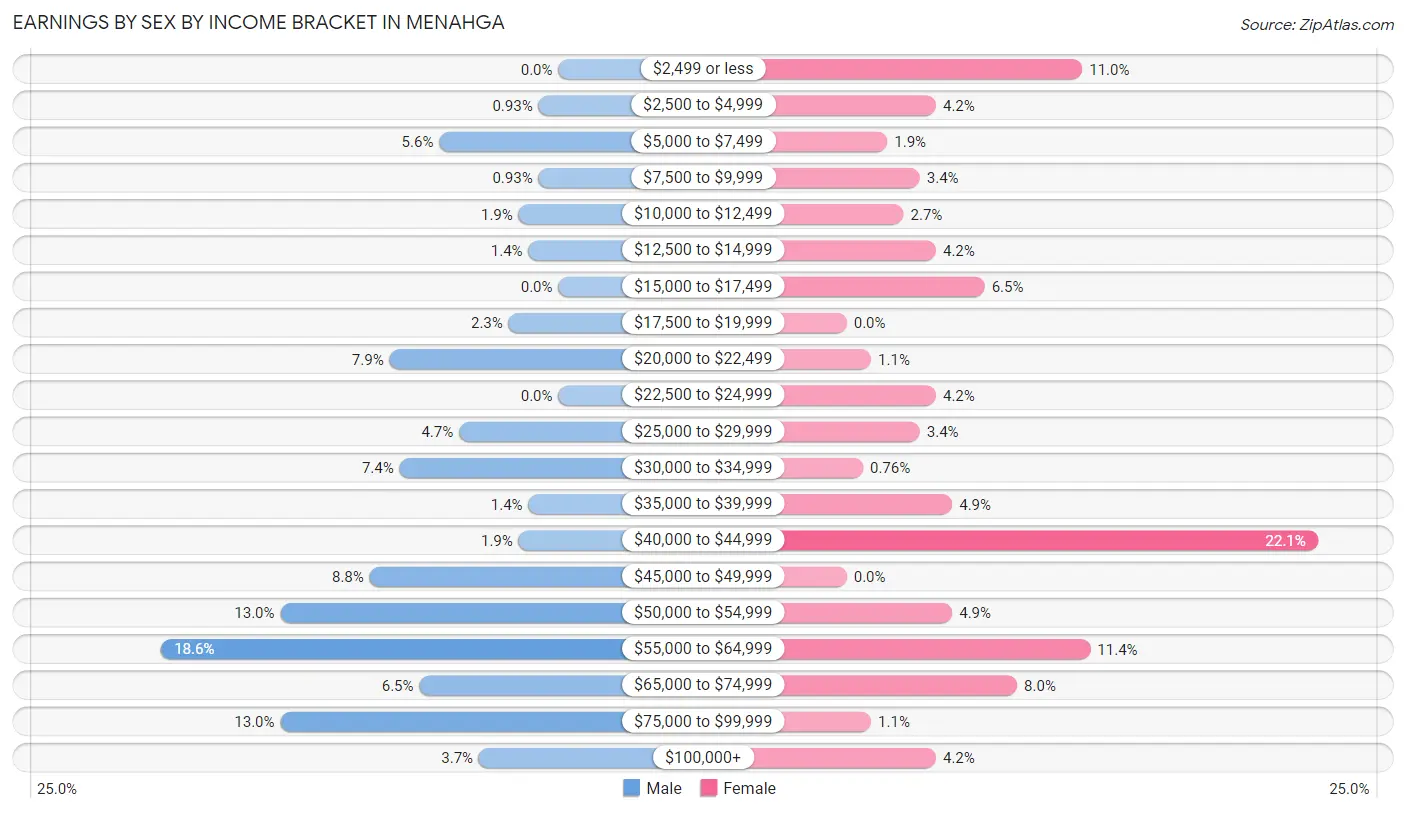
| Income | Male | Female |
| $2,499 or less | 0 (0.0%) | 29 (11.0%) |
| $2,500 to $4,999 | 2 (0.9%) | 11 (4.2%) |
| $5,000 to $7,499 | 12 (5.6%) | 5 (1.9%) |
| $7,500 to $9,999 | 2 (0.9%) | 9 (3.4%) |
| $10,000 to $12,499 | 4 (1.9%) | 7 (2.7%) |
| $12,500 to $14,999 | 3 (1.4%) | 11 (4.2%) |
| $15,000 to $17,499 | 0 (0.0%) | 17 (6.5%) |
| $17,500 to $19,999 | 5 (2.3%) | 0 (0.0%) |
| $20,000 to $22,499 | 17 (7.9%) | 3 (1.1%) |
| $22,500 to $24,999 | 0 (0.0%) | 11 (4.2%) |
| $25,000 to $29,999 | 10 (4.6%) | 9 (3.4%) |
| $30,000 to $34,999 | 16 (7.4%) | 2 (0.8%) |
| $35,000 to $39,999 | 3 (1.4%) | 13 (4.9%) |
| $40,000 to $44,999 | 4 (1.9%) | 58 (22.1%) |
| $45,000 to $49,999 | 19 (8.8%) | 0 (0.0%) |
| $50,000 to $54,999 | 28 (13.0%) | 13 (4.9%) |
| $55,000 to $64,999 | 40 (18.6%) | 30 (11.4%) |
| $65,000 to $74,999 | 14 (6.5%) | 21 (8.0%) |
| $75,000 to $99,999 | 28 (13.0%) | 3 (1.1%) |
| $100,000+ | 8 (3.7%) | 11 (4.2%) |
| Total | 215 (100.0%) | 263 (100.0%) |
Earnings by Sex by Educational Attainment in Menahga
Average earnings in Menahga are $56,607 for men and $40,711 for women, a difference of 28.1%. Men with an educational attainment of college or associate's degree enjoy the highest average annual earnings of $65,313, while those with bachelor's degree education earn the least with $53,203. Women with an educational attainment of bachelor's degree earn the most with the average annual earnings of $42,298, while those with college or associate's degree education have the smallest earnings of $39,000.
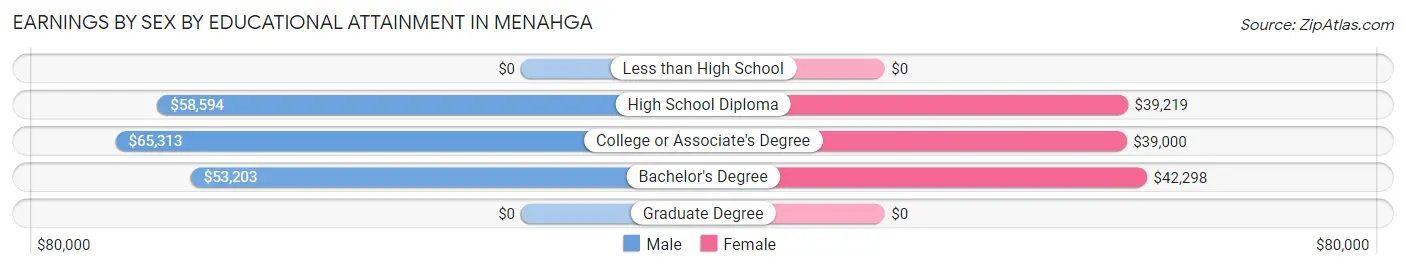
| Educational Attainment | Male Income | Female Income |
| Less than High School | - | - |
| High School Diploma | $58,594 | $39,219 |
| College or Associate's Degree | $65,313 | $39,000 |
| Bachelor's Degree | $53,203 | $42,298 |
| Graduate Degree | - | - |
| Total | $56,607 | $40,711 |
Family Income in Menahga
Family Income Brackets in Menahga
According to the Menahga family income data, there are 57 families falling into the $50,000 to $74,999 income range, which is the most common income bracket and makes up 24.5% of all families.
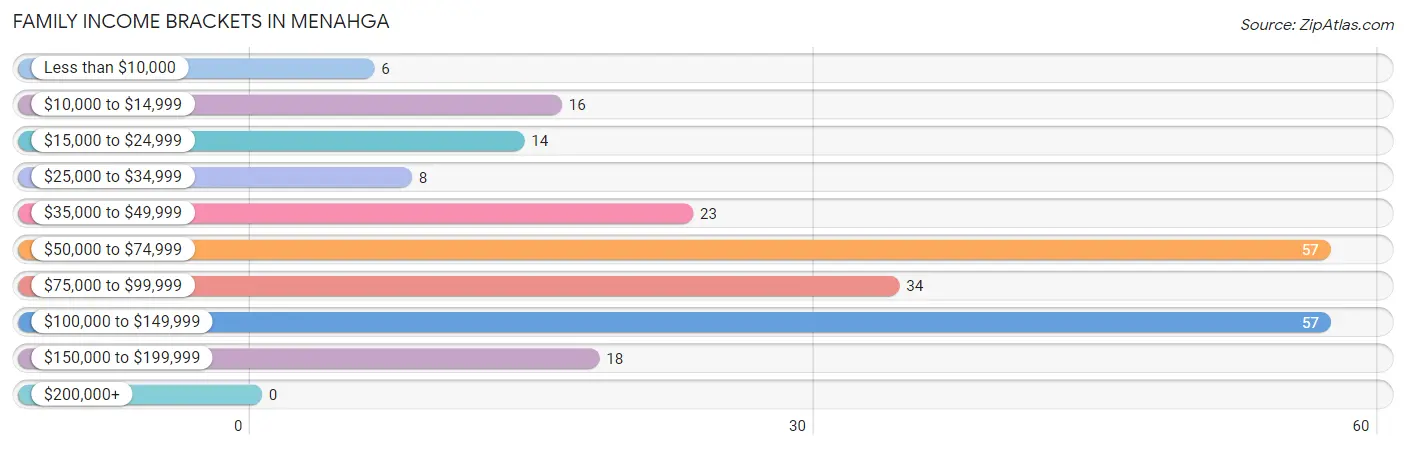
| Income Bracket | # Families | % Families |
| Less than $10,000 | 6 | 2.6% |
| $10,000 to $14,999 | 16 | 6.9% |
| $15,000 to $24,999 | 14 | 6.0% |
| $25,000 to $34,999 | 8 | 3.4% |
| $35,000 to $49,999 | 23 | 9.9% |
| $50,000 to $74,999 | 57 | 24.5% |
| $75,000 to $99,999 | 34 | 14.6% |
| $100,000 to $149,999 | 57 | 24.5% |
| $150,000 to $199,999 | 18 | 7.7% |
| $200,000+ | 0 | 0.0% |
Family Income by Famaliy Size in Menahga
4-person families (46 | 19.7%) account for the highest median family income in Menahga with $100,750 per family, while 2-person families (103 | 44.2%) have the highest median income of $33,958 per family member.
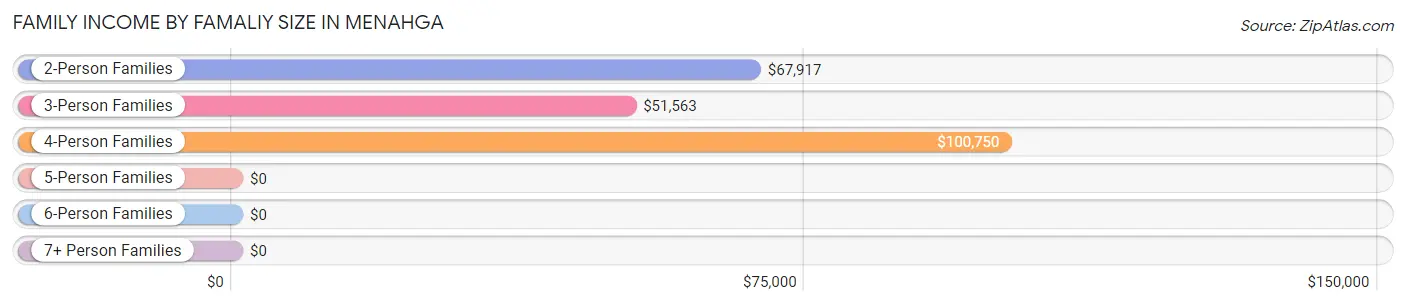
| Income Bracket | # Families | Median Income |
| 2-Person Families | 103 (44.2%) | $67,917 |
| 3-Person Families | 40 (17.2%) | $51,563 |
| 4-Person Families | 46 (19.7%) | $100,750 |
| 5-Person Families | 4 (1.7%) | $0 |
| 6-Person Families | 24 (10.3%) | $0 |
| 7+ Person Families | 16 (6.9%) | $0 |
| Total | 233 (100.0%) | $73,661 |
Family Income by Number of Earners in Menahga
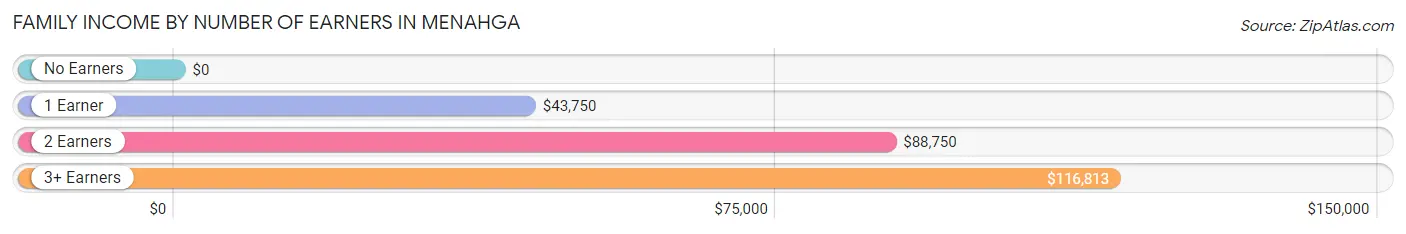
| Number of Earners | # Families | Median Income |
| No Earners | 67 (28.8%) | $0 |
| 1 Earner | 48 (20.6%) | $43,750 |
| 2 Earners | 85 (36.5%) | $88,750 |
| 3+ Earners | 33 (14.2%) | $116,813 |
| Total | 233 (100.0%) | $73,661 |
Household Income in Menahga
Household Income Brackets in Menahga
With 93 households falling in the category, the $50,000 to $74,999 income range is the most frequent in Menahga, accounting for 19.0% of all households.
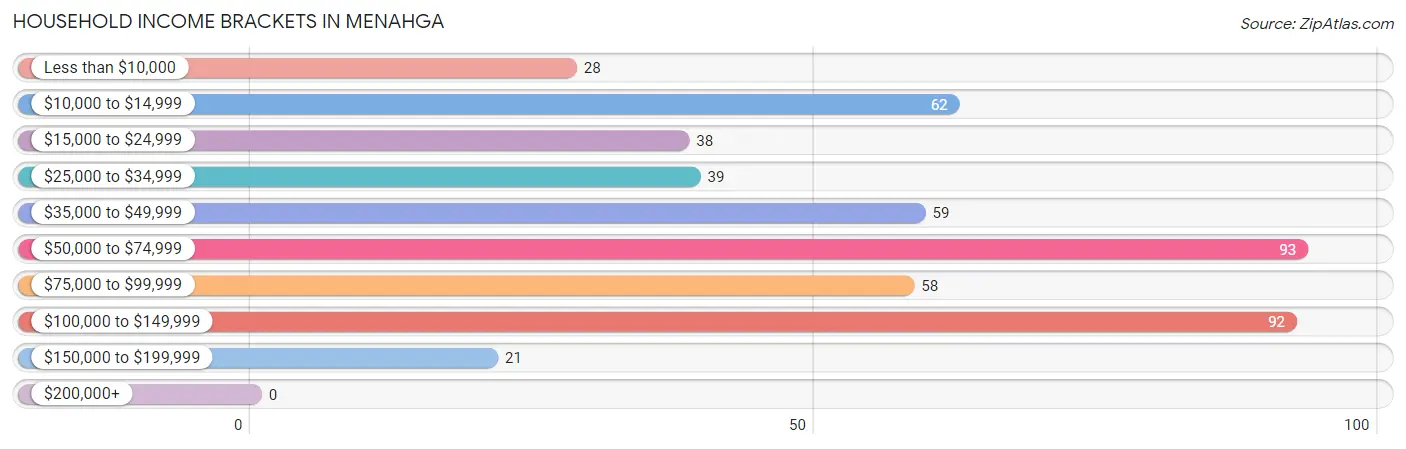
| Income Bracket | # Households | % Households |
| Less than $10,000 | 28 | 5.7% |
| $10,000 to $14,999 | 62 | 12.7% |
| $15,000 to $24,999 | 38 | 7.8% |
| $25,000 to $34,999 | 39 | 8.0% |
| $35,000 to $49,999 | 59 | 12.0% |
| $50,000 to $74,999 | 93 | 19.0% |
| $75,000 to $99,999 | 58 | 11.8% |
| $100,000 to $149,999 | 92 | 18.8% |
| $150,000 to $199,999 | 21 | 4.3% |
| $200,000+ | 0 | 0.0% |
Household Income by Householder Age in Menahga
The median household income in Menahga is $54,167, with the highest median household income of $93,906 found in the 25 to 44 years age bracket for the primary householder. A total of 131 households (26.7%) fall into this category. Meanwhile, the 15 to 24 years age bracket for the primary householder has the lowest median household income of $0, with 9 households (1.8%) in this group.
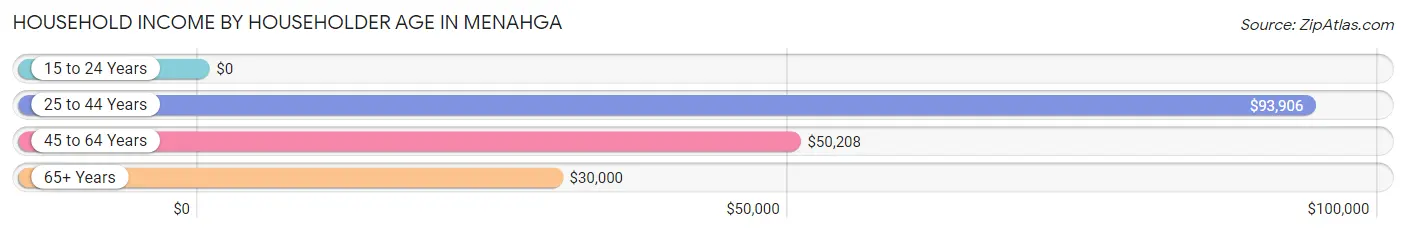
| Income Bracket | # Households | Median Income |
| 15 to 24 Years | 9 (1.8%) | $0 |
| 25 to 44 Years | 131 (26.7%) | $93,906 |
| 45 to 64 Years | 186 (38.0%) | $50,208 |
| 65+ Years | 164 (33.5%) | $30,000 |
| Total | 490 (100.0%) | $54,167 |
Poverty in Menahga
Income Below Poverty by Sex and Age in Menahga
With 17.8% poverty level for males and 20.5% for females among the residents of Menahga, 45 to 54 year old males and 15 year old females are the most vulnerable to poverty, with 30 males (37.5%) and 14 females (100.0%) in their respective age groups living below the poverty level.
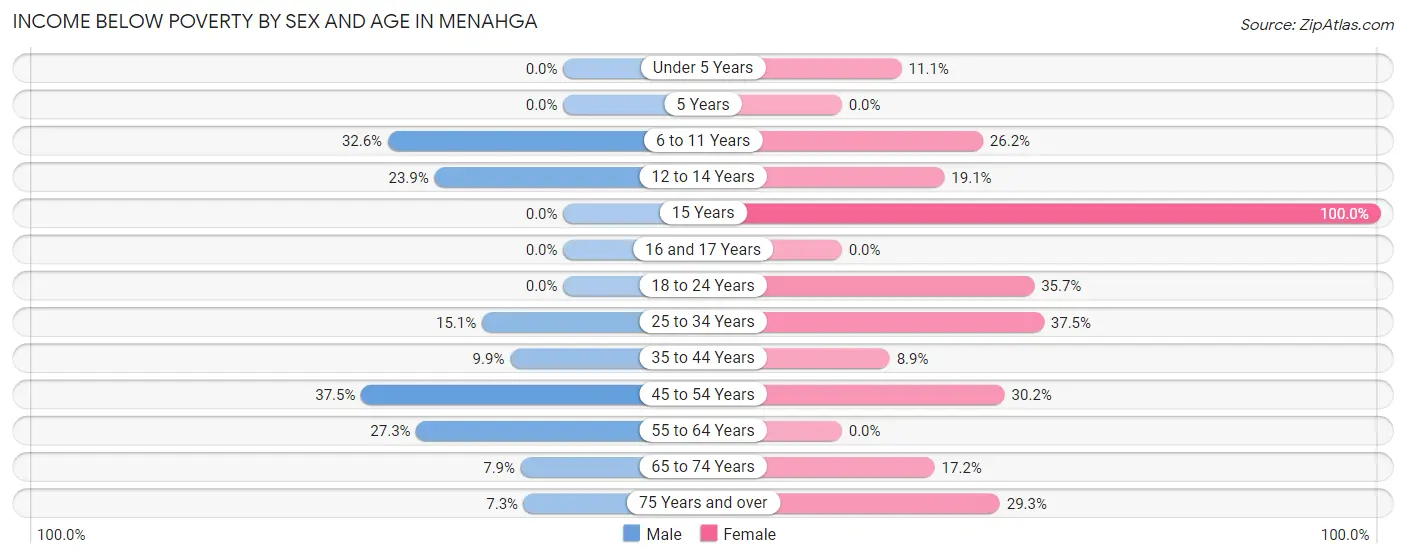
| Age Bracket | Male | Female |
| Under 5 Years | 0 (0.0%) | 5 (11.1%) |
| 5 Years | 0 (0.0%) | 0 (0.0%) |
| 6 to 11 Years | 14 (32.6%) | 11 (26.2%) |
| 12 to 14 Years | 11 (23.9%) | 8 (19.1%) |
| 15 Years | 0 (0.0%) | 14 (100.0%) |
| 16 and 17 Years | 0 (0.0%) | 0 (0.0%) |
| 18 to 24 Years | 0 (0.0%) | 5 (35.7%) |
| 25 to 34 Years | 8 (15.1%) | 24 (37.5%) |
| 35 to 44 Years | 7 (9.9%) | 4 (8.9%) |
| 45 to 54 Years | 30 (37.5%) | 13 (30.2%) |
| 55 to 64 Years | 24 (27.3%) | 0 (0.0%) |
| 65 to 74 Years | 3 (7.9%) | 10 (17.2%) |
| 75 Years and over | 3 (7.3%) | 22 (29.3%) |
| Total | 100 (17.8%) | 116 (20.5%) |
Income Above Poverty by Sex and Age in Menahga
According to the poverty statistics in Menahga, males aged under 5 years and females aged 5 years are the age groups that are most secure financially, with 100.0% of males and 100.0% of females in these age groups living above the poverty line.
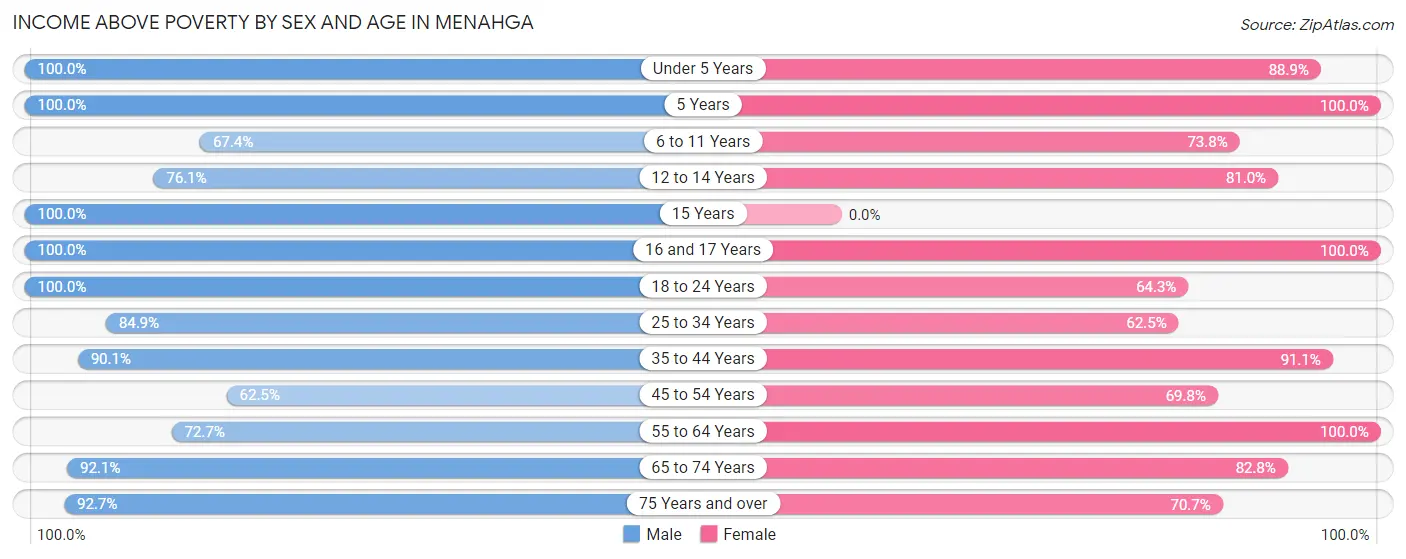
| Age Bracket | Male | Female |
| Under 5 Years | 13 (100.0%) | 40 (88.9%) |
| 5 Years | 26 (100.0%) | 4 (100.0%) |
| 6 to 11 Years | 29 (67.4%) | 31 (73.8%) |
| 12 to 14 Years | 35 (76.1%) | 34 (80.9%) |
| 15 Years | 3 (100.0%) | 0 (0.0%) |
| 16 and 17 Years | 17 (100.0%) | 21 (100.0%) |
| 18 to 24 Years | 44 (100.0%) | 9 (64.3%) |
| 25 to 34 Years | 45 (84.9%) | 40 (62.5%) |
| 35 to 44 Years | 64 (90.1%) | 41 (91.1%) |
| 45 to 54 Years | 50 (62.5%) | 30 (69.8%) |
| 55 to 64 Years | 64 (72.7%) | 100 (100.0%) |
| 65 to 74 Years | 35 (92.1%) | 48 (82.8%) |
| 75 Years and over | 38 (92.7%) | 53 (70.7%) |
| Total | 463 (82.2%) | 451 (79.5%) |
Income Below Poverty Among Married-Couple Families in Menahga
The poverty statistics for married-couple families in Menahga show that 11.9% or 21 of the total 177 families live below the poverty line. Families with 5 or more children have the highest poverty rate of 68.8%, comprising of 11 families. On the other hand, families with 3 or 4 children have the lowest poverty rate of 0.0%, which includes 0 families.
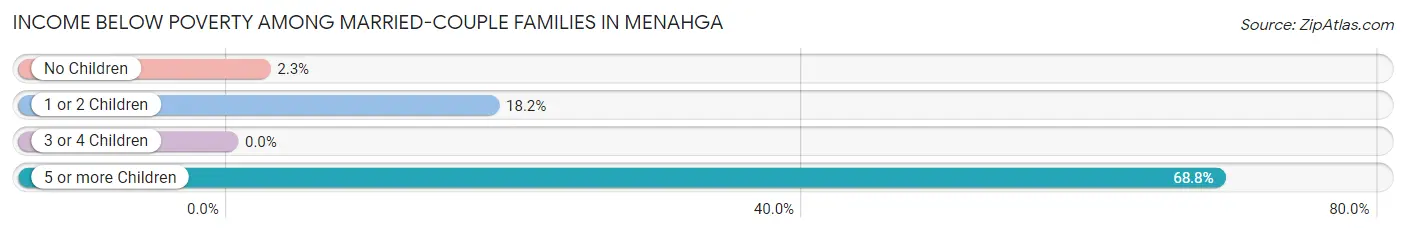
| Children | Above Poverty | Below Poverty |
| No Children | 87 (97.8%) | 2 (2.2%) |
| 1 or 2 Children | 36 (81.8%) | 8 (18.2%) |
| 3 or 4 Children | 28 (100.0%) | 0 (0.0%) |
| 5 or more Children | 5 (31.2%) | 11 (68.8%) |
| Total | 156 (88.1%) | 21 (11.9%) |
Income Below Poverty Among Single-Parent Households in Menahga
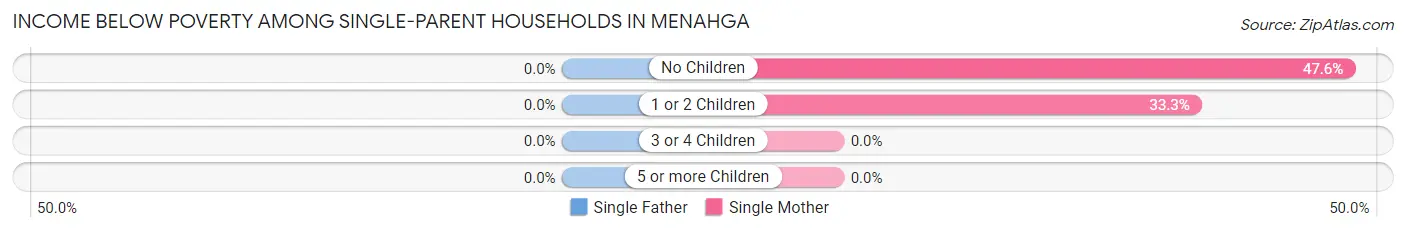
| Children | Single Father | Single Mother |
| No Children | 0 (0.0%) | 10 (47.6%) |
| 1 or 2 Children | 0 (0.0%) | 4 (33.3%) |
| 3 or 4 Children | 0 (0.0%) | 0 (0.0%) |
| 5 or more Children | 0 (0.0%) | 0 (0.0%) |
| Total | 0 (0.0%) | 14 (42.4%) |
Income Below Poverty Among Married-Couple vs Single-Parent Households in Menahga
The poverty data for Menahga shows that 21 of the married-couple family households (11.9%) and 14 of the single-parent households (25.0%) are living below the poverty level. Within the married-couple family households, those with 5 or more children have the highest poverty rate, with 11 households (68.8%) falling below the poverty line. Among the single-parent households, those with no children have the highest poverty rate, with 10 household (35.7%) living below poverty.
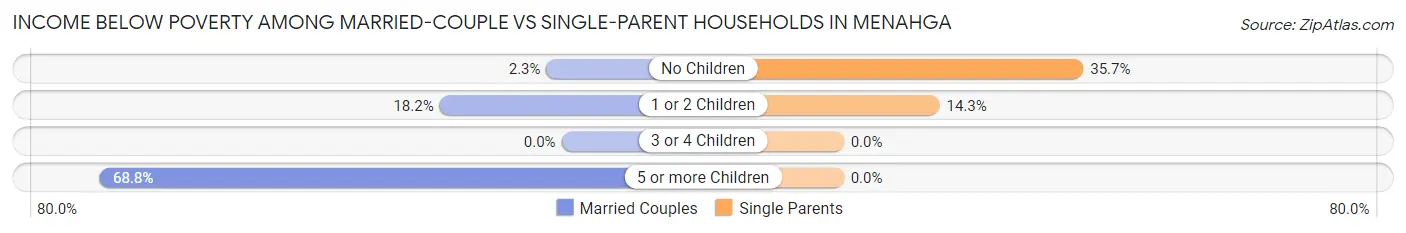
| Children | Married-Couple Families | Single-Parent Households |
| No Children | 2 (2.2%) | 10 (35.7%) |
| 1 or 2 Children | 8 (18.2%) | 4 (14.3%) |
| 3 or 4 Children | 0 (0.0%) | 0 (0.0%) |
| 5 or more Children | 11 (68.8%) | 0 (0.0%) |
| Total | 21 (11.9%) | 14 (25.0%) |
Race in Menahga
The most populous races in Menahga are White / Caucasian (1,147 | 94.2%), Two or more Races (43 | 3.5%), and Asian (23 | 1.9%).
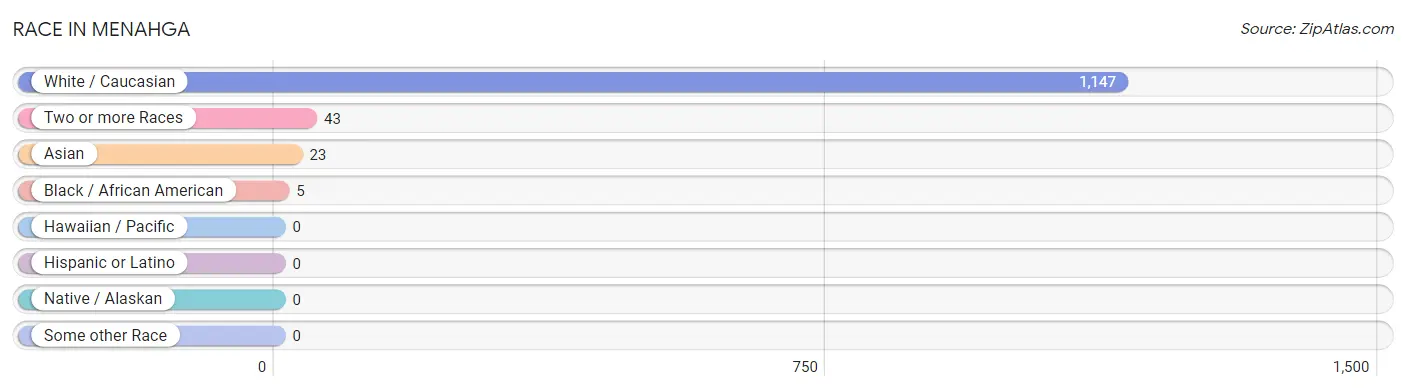
| Race | # Population | % Population |
| Asian | 23 | 1.9% |
| Black / African American | 5 | 0.4% |
| Hawaiian / Pacific | 0 | 0.0% |
| Hispanic or Latino | 0 | 0.0% |
| Native / Alaskan | 0 | 0.0% |
| White / Caucasian | 1,147 | 94.2% |
| Two or more Races | 43 | 3.5% |
| Some other Race | 0 | 0.0% |
| Total | 1,218 | 100.0% |
Ancestry in Menahga
The most populous ancestries reported in Menahga are Finnish (313 | 25.7%), German (238 | 19.5%), Norwegian (130 | 10.7%), English (69 | 5.7%), and Polish (55 | 4.5%), together accounting for 66.1% of all Menahga residents.
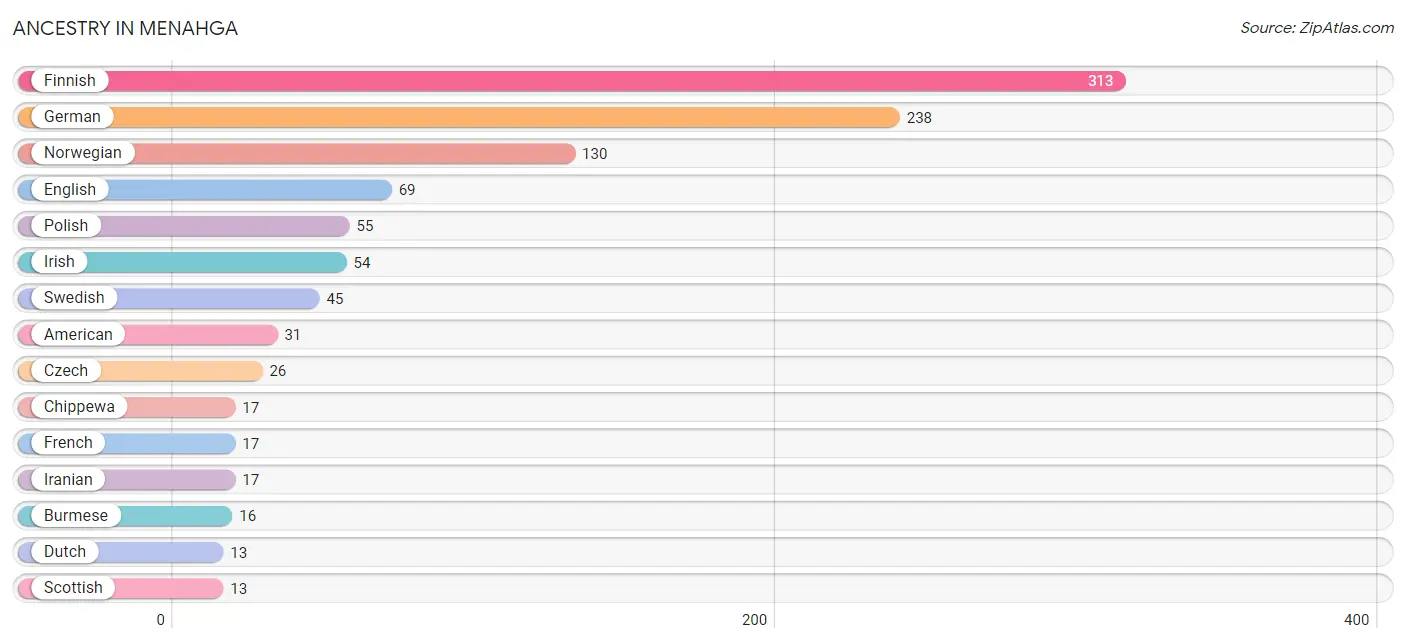
| Ancestry | # Population | % Population |
| American | 31 | 2.5% |
| Burmese | 16 | 1.3% |
| Chippewa | 17 | 1.4% |
| Croatian | 6 | 0.5% |
| Czech | 26 | 2.1% |
| Czechoslovakian | 3 | 0.3% |
| Dutch | 13 | 1.1% |
| English | 69 | 5.7% |
| European | 6 | 0.5% |
| Finnish | 313 | 25.7% |
| French | 17 | 1.4% |
| French Canadian | 3 | 0.3% |
| German | 238 | 19.5% |
| Iranian | 17 | 1.4% |
| Irish | 54 | 4.4% |
| Italian | 6 | 0.5% |
| Korean | 7 | 0.6% |
| Norwegian | 130 | 10.7% |
| Polish | 55 | 4.5% |
| Scotch-Irish | 8 | 0.7% |
| Scottish | 13 | 1.1% |
| Swedish | 45 | 3.7% |
| Swiss | 4 | 0.3% |
| Ukrainian | 2 | 0.2% | View All 24 Rows |
Immigrants in Menahga
The most numerous immigrant groups reported in Menahga came from Asia (23 | 1.9%), Eastern Asia (16 | 1.3%), Korea (16 | 1.3%), South Eastern Asia (7 | 0.6%), and Thailand (7 | 0.6%), together accounting for 5.6% of all Menahga residents.
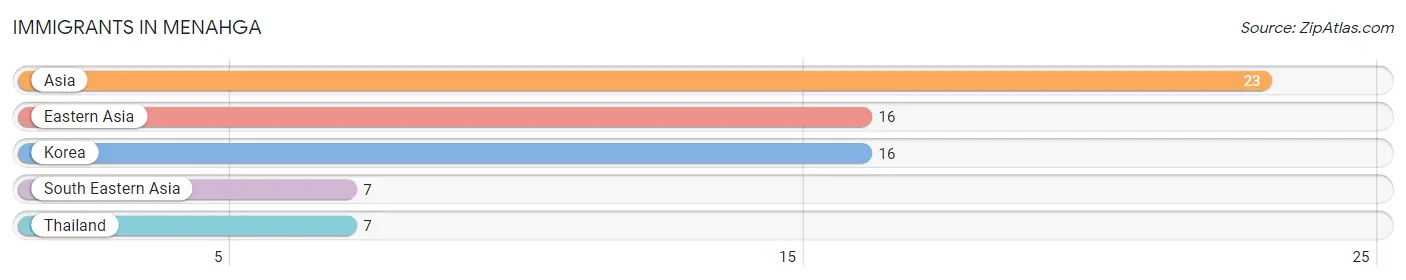
| Immigration Origin | # Population | % Population |
| Asia | 23 | 1.9% |
| Eastern Asia | 16 | 1.3% |
| Korea | 16 | 1.3% |
| South Eastern Asia | 7 | 0.6% |
| Thailand | 7 | 0.6% | View All 5 Rows |
Sex and Age in Menahga
Sex and Age in Menahga
The most populous age groups in Menahga are 50 to 54 Years (65 | 11.3%) for men and 60 to 64 Years (84 | 13.1%) for women.
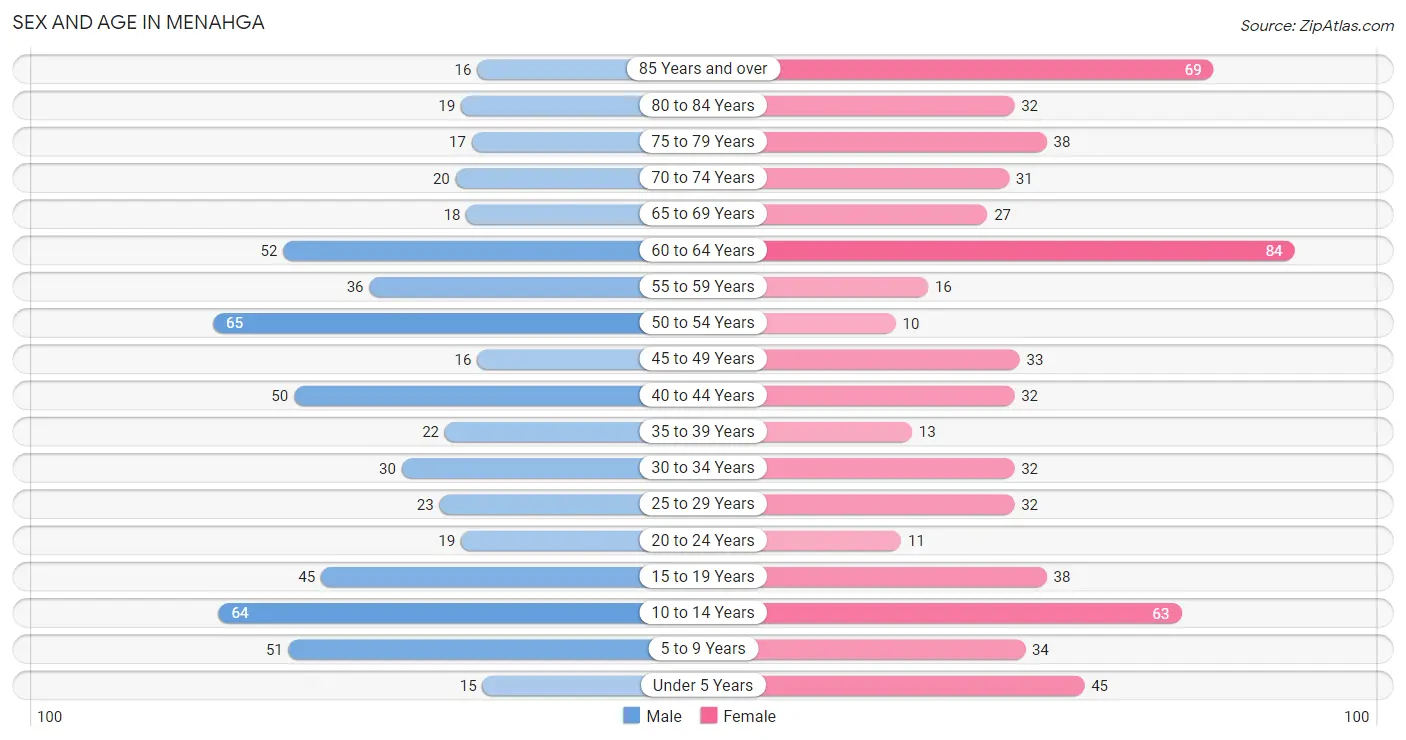
| Age Bracket | Male | Female |
| Under 5 Years | 15 (2.6%) | 45 (7.0%) |
| 5 to 9 Years | 51 (8.8%) | 34 (5.3%) |
| 10 to 14 Years | 64 (11.1%) | 63 (9.8%) |
| 15 to 19 Years | 45 (7.8%) | 38 (5.9%) |
| 20 to 24 Years | 19 (3.3%) | 11 (1.7%) |
| 25 to 29 Years | 23 (4.0%) | 32 (5.0%) |
| 30 to 34 Years | 30 (5.2%) | 32 (5.0%) |
| 35 to 39 Years | 22 (3.8%) | 13 (2.0%) |
| 40 to 44 Years | 50 (8.6%) | 32 (5.0%) |
| 45 to 49 Years | 16 (2.8%) | 33 (5.2%) |
| 50 to 54 Years | 65 (11.3%) | 10 (1.6%) |
| 55 to 59 Years | 36 (6.2%) | 16 (2.5%) |
| 60 to 64 Years | 52 (9.0%) | 84 (13.1%) |
| 65 to 69 Years | 18 (3.1%) | 27 (4.2%) |
| 70 to 74 Years | 20 (3.5%) | 31 (4.8%) |
| 75 to 79 Years | 17 (2.9%) | 38 (5.9%) |
| 80 to 84 Years | 19 (3.3%) | 32 (5.0%) |
| 85 Years and over | 16 (2.8%) | 69 (10.8%) |
| Total | 578 (100.0%) | 640 (100.0%) |
Families and Households in Menahga
Median Family Size in Menahga
The median family size in Menahga is 3.57 persons per family, with married-couple families (177 | 76.0%) accounting for the largest median family size of 3.9 persons per family. On the other hand, single female/mother families (33 | 14.2%) represent the smallest median family size with 2.42 persons per family.
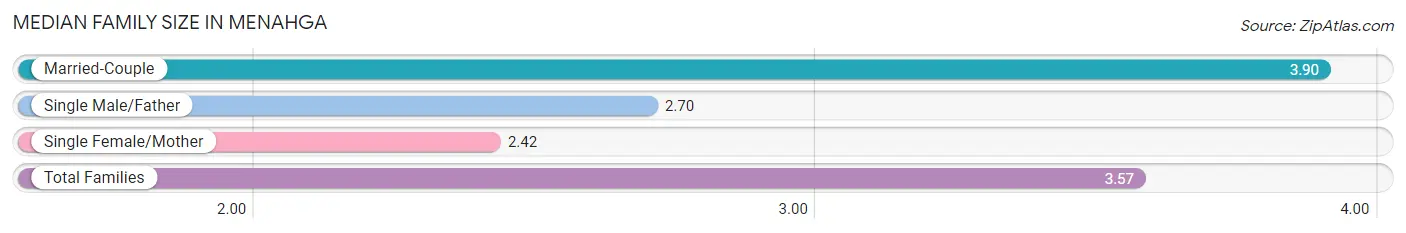
| Family Type | # Families | Family Size |
| Married-Couple | 177 (76.0%) | 3.90 |
| Single Male/Father | 23 (9.9%) | 2.70 |
| Single Female/Mother | 33 (14.2%) | 2.42 |
| Total Families | 233 (100.0%) | 3.57 |
Median Household Size in Menahga
The median household size in Menahga is 2.33 persons per household, with married-couple households (177 | 36.1%) accounting for the largest median household size of 3.92 persons per household. non-family households (257 | 52.4%) represent the smallest median household size with 1.17 persons per household.
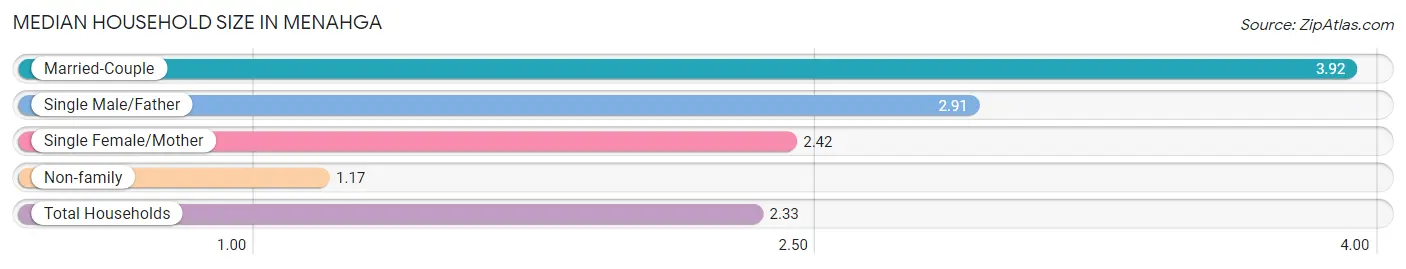
| Household Type | # Households | Household Size |
| Married-Couple | 177 (36.1%) | 3.92 |
| Single Male/Father | 23 (4.7%) | 2.91 |
| Single Female/Mother | 33 (6.7%) | 2.42 |
| Non-family | 257 (52.4%) | 1.17 |
| Total Households | 490 (100.0%) | 2.33 |
Household Size by Marriage Status in Menahga
Out of a total of 490 households in Menahga, 233 (47.5%) are family households, while 257 (52.4%) are nonfamily households. The most numerous type of family households are 2-person households, comprising 103, and the most common type of nonfamily households are 1-person households, comprising 200.
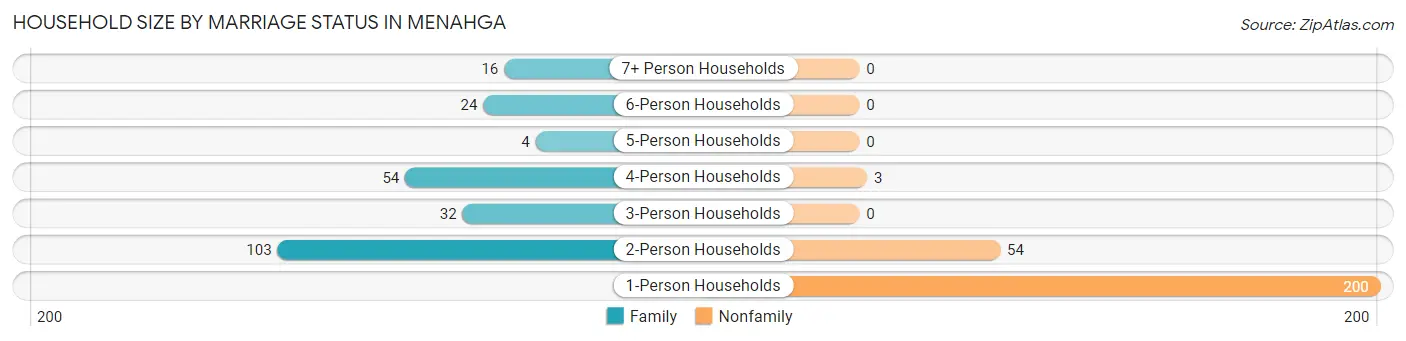
| Household Size | Family Households | Nonfamily Households |
| 1-Person Households | - | 200 (40.8%) |
| 2-Person Households | 103 (21.0%) | 54 (11.0%) |
| 3-Person Households | 32 (6.5%) | 0 (0.0%) |
| 4-Person Households | 54 (11.0%) | 3 (0.6%) |
| 5-Person Households | 4 (0.8%) | 0 (0.0%) |
| 6-Person Households | 24 (4.9%) | 0 (0.0%) |
| 7+ Person Households | 16 (3.3%) | 0 (0.0%) |
| Total | 233 (47.5%) | 257 (52.4%) |
Female Fertility in Menahga
Fertility by Age in Menahga
Average fertility rate in Menahga is 21.0 births per 1,000 women. Women in the age bracket of 20 to 34 years have the highest fertility rate with 53.0 births per 1,000 women. Women in the age bracket of 20 to 34 years acount for 100.0% of all women with births.
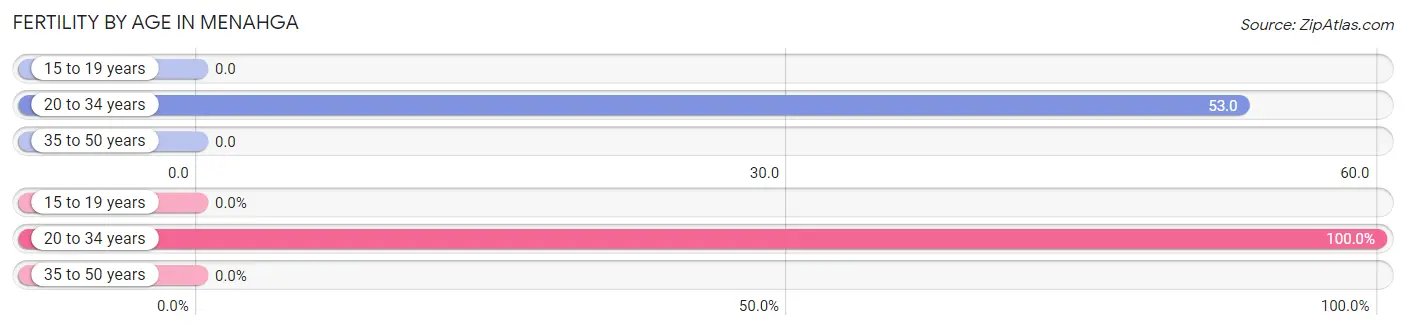
| Age Bracket | Women with Births | Births / 1,000 Women |
| 15 to 19 years | 0 (0.0%) | 0.0 |
| 20 to 34 years | 4 (100.0%) | 53.0 |
| 35 to 50 years | 0 (0.0%) | 0.0 |
| Total | 4 (100.0%) | 21.0 |
Fertility by Age by Marriage Status in Menahga
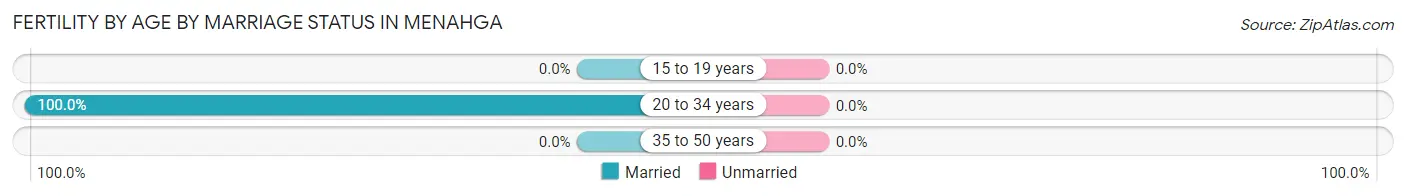
| Age Bracket | Married | Unmarried |
| 15 to 19 years | 0 (0.0%) | 0 (0.0%) |
| 20 to 34 years | 4 (100.0%) | 0 (0.0%) |
| 35 to 50 years | 0 (0.0%) | 0 (0.0%) |
| Total | 4 (100.0%) | 0 (0.0%) |
Fertility by Education in Menahga
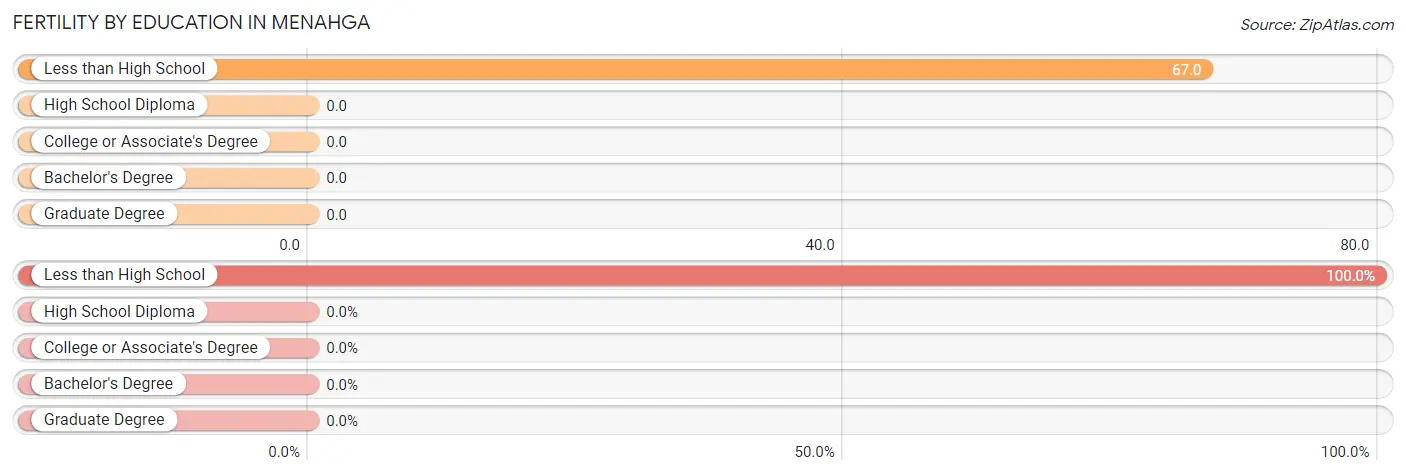
| Educational Attainment | Women with Births | Births / 1,000 Women |
| Less than High School | 4 (100.0%) | 67.0 |
| High School Diploma | 0 (0.0%) | 0.0 |
| College or Associate's Degree | 0 (0.0%) | 0.0 |
| Bachelor's Degree | 0 (0.0%) | 0.0 |
| Graduate Degree | 0 (0.0%) | 0.0 |
| Total | 4 (100.0%) | 21.0 |
Fertility by Education by Marriage Status in Menahga
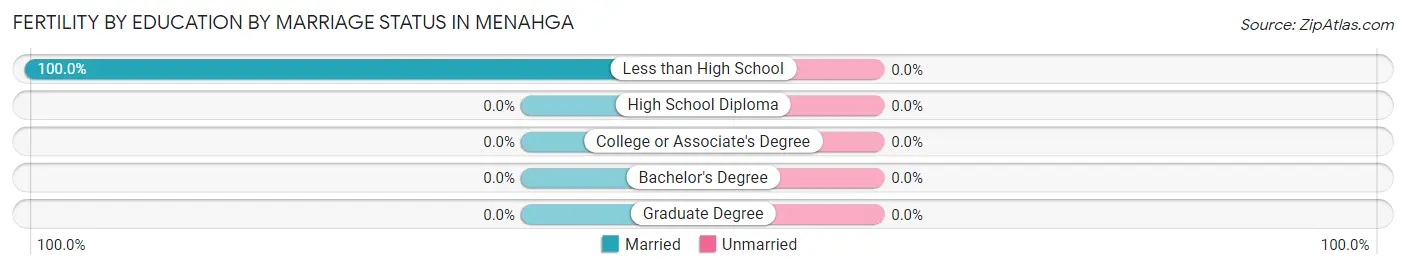
| Educational Attainment | Married | Unmarried |
| Less than High School | 4 (100.0%) | 0 (0.0%) |
| High School Diploma | 0 (0.0%) | 0 (0.0%) |
| College or Associate's Degree | 0 (0.0%) | 0 (0.0%) |
| Bachelor's Degree | 0 (0.0%) | 0 (0.0%) |
| Graduate Degree | 0 (0.0%) | 0 (0.0%) |
| Total | 4 (100.0%) | 0 (0.0%) |
Employment Characteristics in Menahga
Employment by Class of Employer in Menahga
Among the 411 employed individuals in Menahga, private company employees (274 | 66.7%), local government employees (73 | 17.8%), and not-for-profit organizations (25 | 6.1%) make up the most common classes of employment.
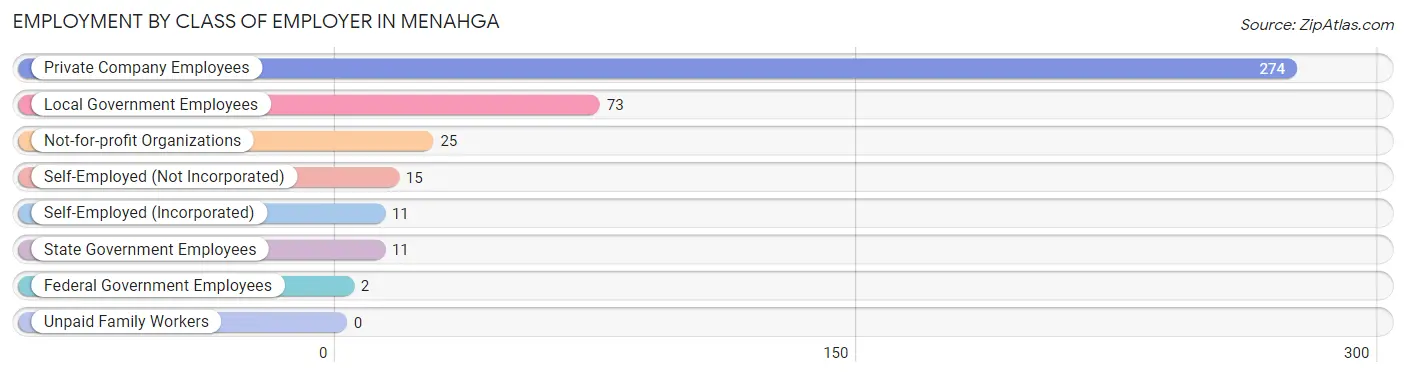
| Employer Class | # Employees | % Employees |
| Private Company Employees | 274 | 66.7% |
| Self-Employed (Incorporated) | 11 | 2.7% |
| Self-Employed (Not Incorporated) | 15 | 3.6% |
| Not-for-profit Organizations | 25 | 6.1% |
| Local Government Employees | 73 | 17.8% |
| State Government Employees | 11 | 2.7% |
| Federal Government Employees | 2 | 0.5% |
| Unpaid Family Workers | 0 | 0.0% |
| Total | 411 | 100.0% |
Employment Status by Age in Menahga
According to the labor force statistics for Menahga, out of the total population over 16 years of age (929), 46.6% or 433 individuals are in the labor force, with 2.8% or 12 of them unemployed. The age group with the highest labor force participation rate is 30 to 34 years, with 93.5% or 58 individuals in the labor force. Within the labor force, the 20 to 24 years age range has the highest percentage of unemployed individuals, with 47.4% or 9 of them being unemployed.
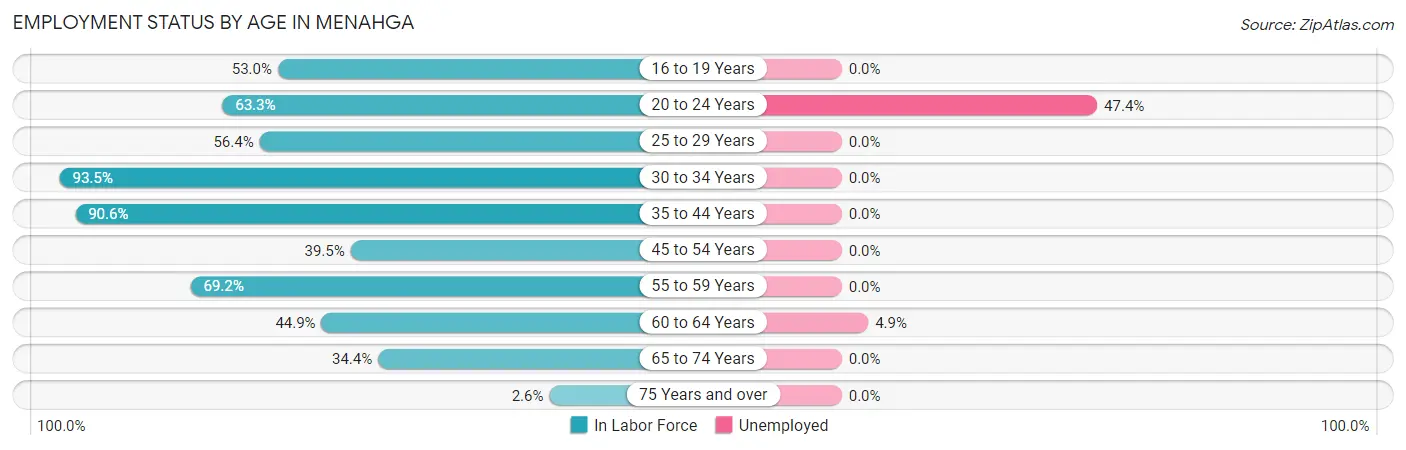
| Age Bracket | In Labor Force | Unemployed |
| 16 to 19 Years | 35 (53.0%) | 0 (0.0%) |
| 20 to 24 Years | 19 (63.3%) | 9 (47.4%) |
| 25 to 29 Years | 31 (56.4%) | 0 (0.0%) |
| 30 to 34 Years | 58 (93.5%) | 0 (0.0%) |
| 35 to 44 Years | 106 (90.6%) | 0 (0.0%) |
| 45 to 54 Years | 49 (39.5%) | 0 (0.0%) |
| 55 to 59 Years | 36 (69.2%) | 0 (0.0%) |
| 60 to 64 Years | 61 (44.9%) | 3 (4.9%) |
| 65 to 74 Years | 33 (34.4%) | 0 (0.0%) |
| 75 Years and over | 5 (2.6%) | 0 (0.0%) |
| Total | 433 (46.6%) | 12 (2.8%) |
Employment Status by Educational Attainment in Menahga
According to labor force statistics for Menahga, 62.5% of individuals (341) out of the total population between 25 and 64 years of age (546) are in the labor force, with 0.9% or 3 of them being unemployed. The group with the highest labor force participation rate are those with the educational attainment of high school diploma, with 75.7% or 143 individuals in the labor force. Within the labor force, individuals with high school diploma education have the highest percentage of unemployment, with 2.1% or 3 of them being unemployed.
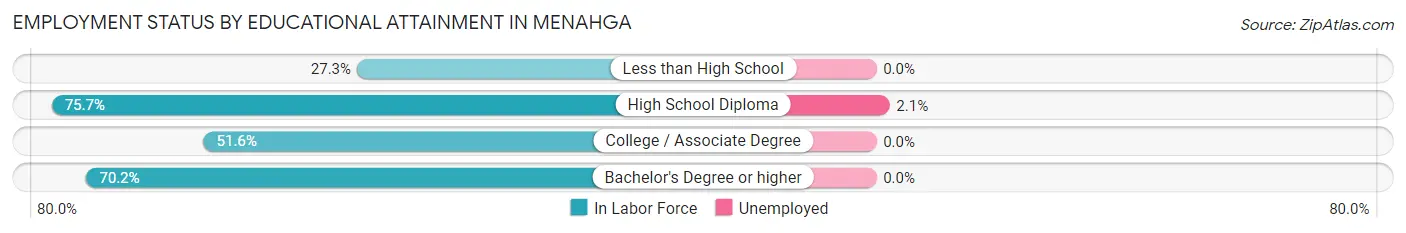
| Educational Attainment | In Labor Force | Unemployed |
| Less than High School | 12 (27.3%) | 0 (0.0%) |
| High School Diploma | 143 (75.7%) | 4 (2.1%) |
| College / Associate Degree | 94 (51.6%) | 0 (0.0%) |
| Bachelor's Degree or higher | 92 (70.2%) | 0 (0.0%) |
| Total | 341 (62.5%) | 5 (0.9%) |
Employment Occupations by Sex in Menahga
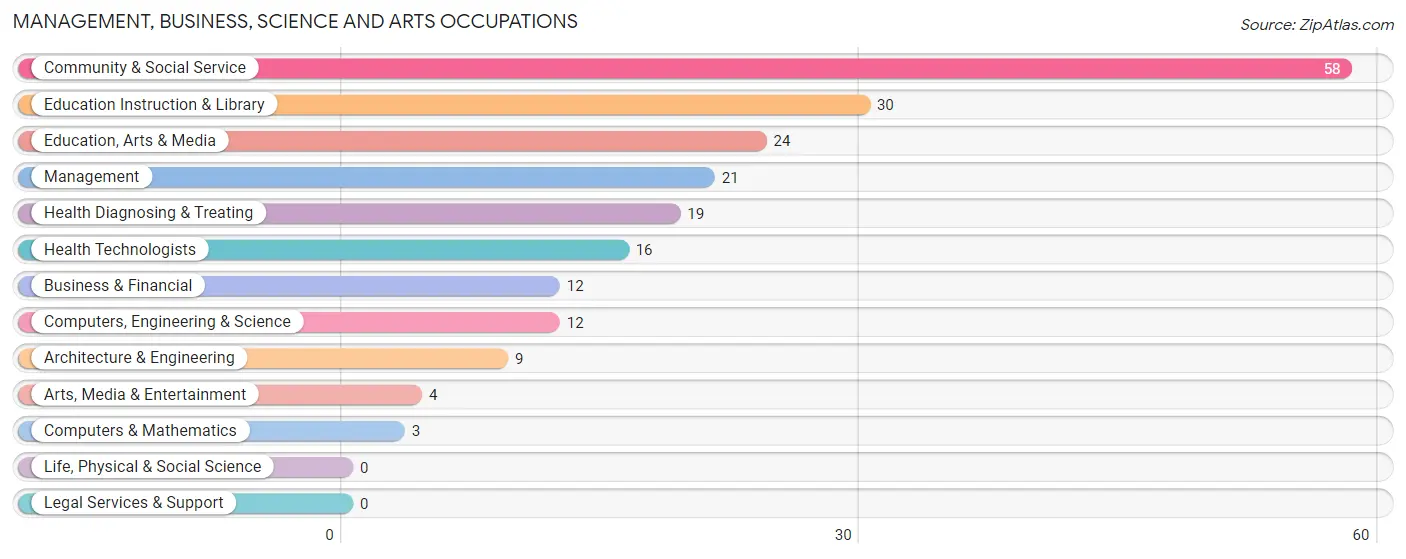
Management, Business, Science and Arts Occupations
The most common Management, Business, Science and Arts occupations in Menahga are Community & Social Service (58 | 13.8%), Education Instruction & Library (30 | 7.1%), Education, Arts & Media (24 | 5.7%), Management (21 | 5.0%), and Health Diagnosing & Treating (19 | 4.5%).
Management, Business, Science and Arts Occupations by Sex
Within the Management, Business, Science and Arts occupations in Menahga, the most male-oriented occupations are Computers, Engineering & Science (100.0%), Computers & Mathematics (100.0%), and Architecture & Engineering (100.0%), while the most female-oriented occupations are Business & Financial (100.0%), Education, Arts & Media (100.0%), and Community & Social Service (79.3%).
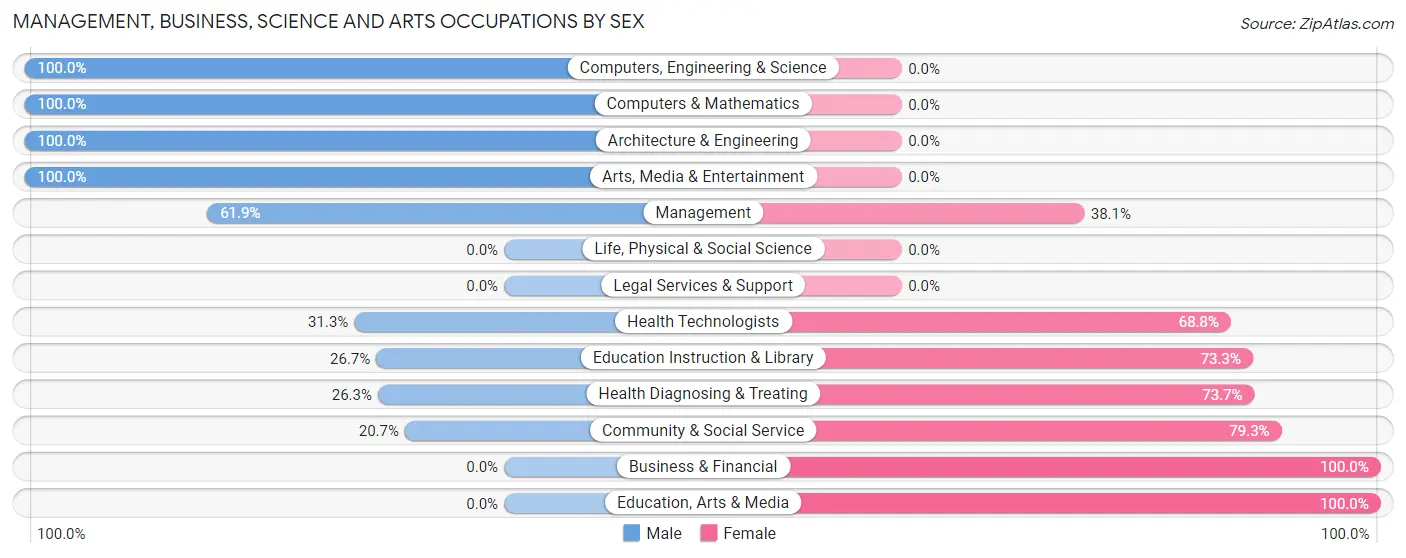
| Occupation | Male | Female |
| Management | 13 (61.9%) | 8 (38.1%) |
| Business & Financial | 0 (0.0%) | 12 (100.0%) |
| Computers, Engineering & Science | 12 (100.0%) | 0 (0.0%) |
| Computers & Mathematics | 3 (100.0%) | 0 (0.0%) |
| Architecture & Engineering | 9 (100.0%) | 0 (0.0%) |
| Life, Physical & Social Science | 0 (0.0%) | 0 (0.0%) |
| Community & Social Service | 12 (20.7%) | 46 (79.3%) |
| Education, Arts & Media | 0 (0.0%) | 24 (100.0%) |
| Legal Services & Support | 0 (0.0%) | 0 (0.0%) |
| Education Instruction & Library | 8 (26.7%) | 22 (73.3%) |
| Arts, Media & Entertainment | 4 (100.0%) | 0 (0.0%) |
| Health Diagnosing & Treating | 5 (26.3%) | 14 (73.7%) |
| Health Technologists | 5 (31.2%) | 11 (68.8%) |
| Total (Category) | 42 (34.4%) | 80 (65.6%) |
| Total (Overall) | 202 (48.0%) | 219 (52.0%) |
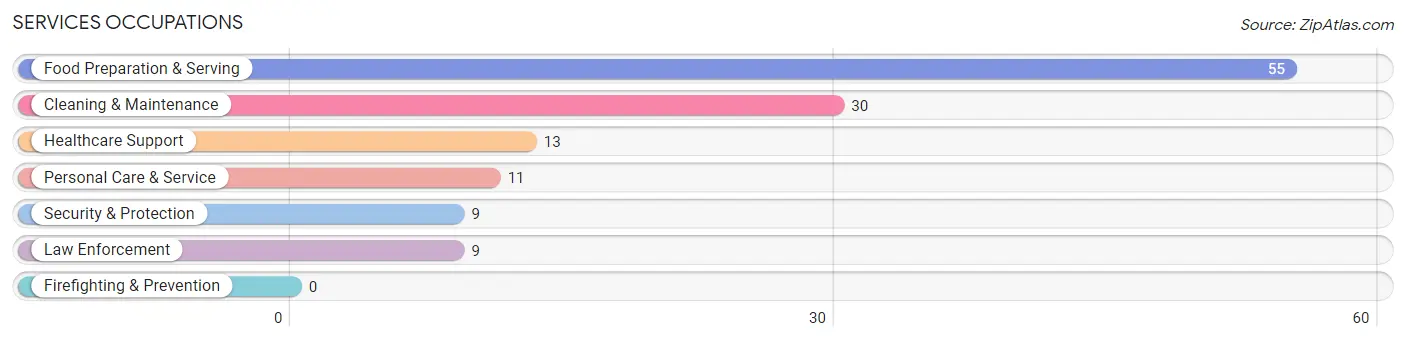
Services Occupations
The most common Services occupations in Menahga are Food Preparation & Serving (55 | 13.1%), Cleaning & Maintenance (30 | 7.1%), Healthcare Support (13 | 3.1%), Personal Care & Service (11 | 2.6%), and Security & Protection (9 | 2.1%).
Services Occupations by Sex
Within the Services occupations in Menahga, the most male-oriented occupations are Security & Protection (66.7%), Law Enforcement (66.7%), and Food Preparation & Serving (20.0%), while the most female-oriented occupations are Healthcare Support (100.0%), Personal Care & Service (100.0%), and Food Preparation & Serving (80.0%).
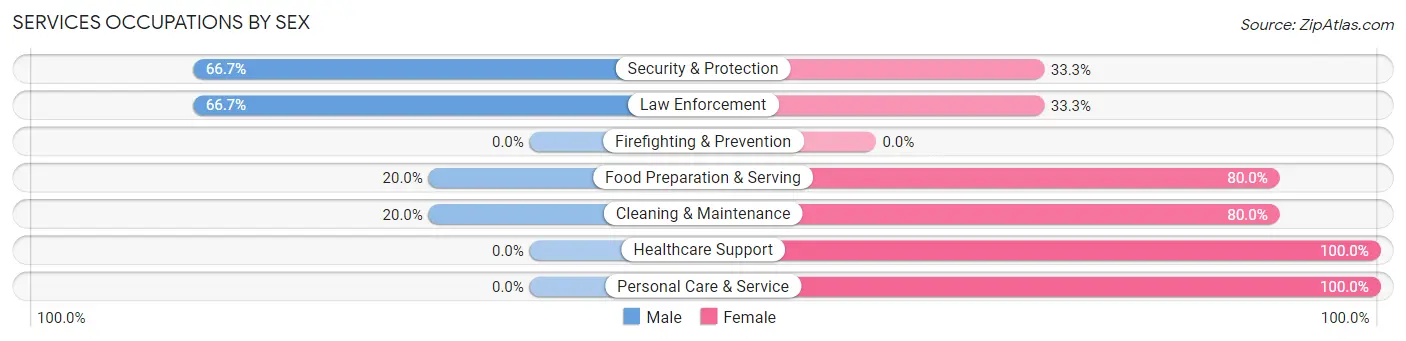
| Occupation | Male | Female |
| Healthcare Support | 0 (0.0%) | 13 (100.0%) |
| Security & Protection | 6 (66.7%) | 3 (33.3%) |
| Firefighting & Prevention | 0 (0.0%) | 0 (0.0%) |
| Law Enforcement | 6 (66.7%) | 3 (33.3%) |
| Food Preparation & Serving | 11 (20.0%) | 44 (80.0%) |
| Cleaning & Maintenance | 6 (20.0%) | 24 (80.0%) |
| Personal Care & Service | 0 (0.0%) | 11 (100.0%) |
| Total (Category) | 23 (19.5%) | 95 (80.5%) |
| Total (Overall) | 202 (48.0%) | 219 (52.0%) |
Sales and Office Occupations
The most common Sales and Office occupations in Menahga are Sales & Related (53 | 12.6%), and Office & Administration (17 | 4.0%).
Sales and Office Occupations by Sex
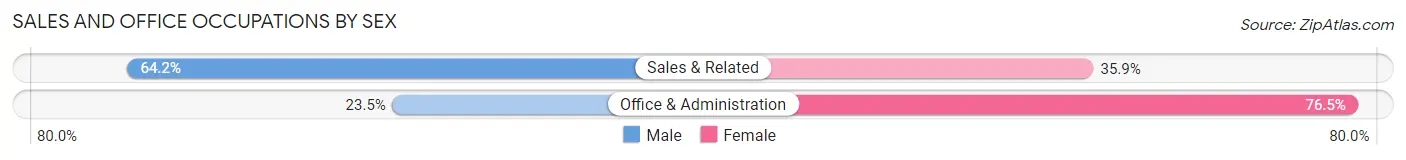
| Occupation | Male | Female |
| Sales & Related | 34 (64.1%) | 19 (35.8%) |
| Office & Administration | 4 (23.5%) | 13 (76.5%) |
| Total (Category) | 38 (54.3%) | 32 (45.7%) |
| Total (Overall) | 202 (48.0%) | 219 (52.0%) |
Natural Resources, Construction and Maintenance Occupations
The most common Natural Resources, Construction and Maintenance occupations in Menahga are Construction & Extraction (40 | 9.5%), Farming, Fishing & Forestry (14 | 3.3%), and Installation, Maintenance & Repair (11 | 2.6%).
Natural Resources, Construction and Maintenance Occupations by Sex
| Occupation | Male | Female |
| Farming, Fishing & Forestry | 10 (71.4%) | 4 (28.6%) |
| Construction & Extraction | 40 (100.0%) | 0 (0.0%) |
| Installation, Maintenance & Repair | 11 (100.0%) | 0 (0.0%) |
| Total (Category) | 61 (93.9%) | 4 (6.1%) |
| Total (Overall) | 202 (48.0%) | 219 (52.0%) |
Production, Transportation and Moving Occupations
The most common Production, Transportation and Moving occupations in Menahga are Production (22 | 5.2%), Material Moving (14 | 3.3%), and Transportation (10 | 2.4%).
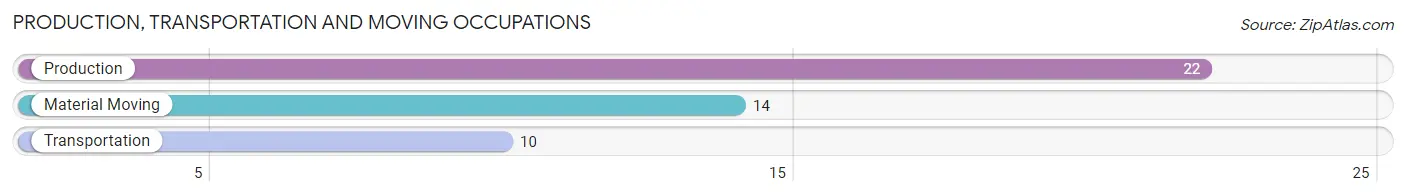
Production, Transportation and Moving Occupations by Sex
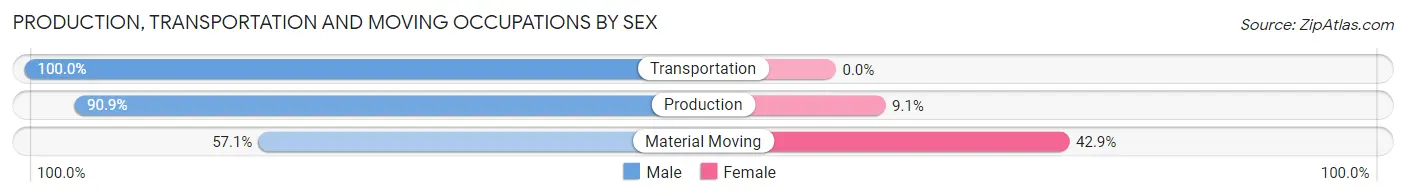
| Occupation | Male | Female |
| Production | 20 (90.9%) | 2 (9.1%) |
| Transportation | 10 (100.0%) | 0 (0.0%) |
| Material Moving | 8 (57.1%) | 6 (42.9%) |
| Total (Category) | 38 (82.6%) | 8 (17.4%) |
| Total (Overall) | 202 (48.0%) | 219 (52.0%) |
Employment Industries by Sex in Menahga
Employment Industries in Menahga
The major employment industries in Menahga include Health Care & Social Assistance (86 | 20.4%), Retail Trade (59 | 14.0%), Manufacturing (44 | 10.4%), Accommodation & Food Services (39 | 9.3%), and Public Administration (38 | 9.0%).
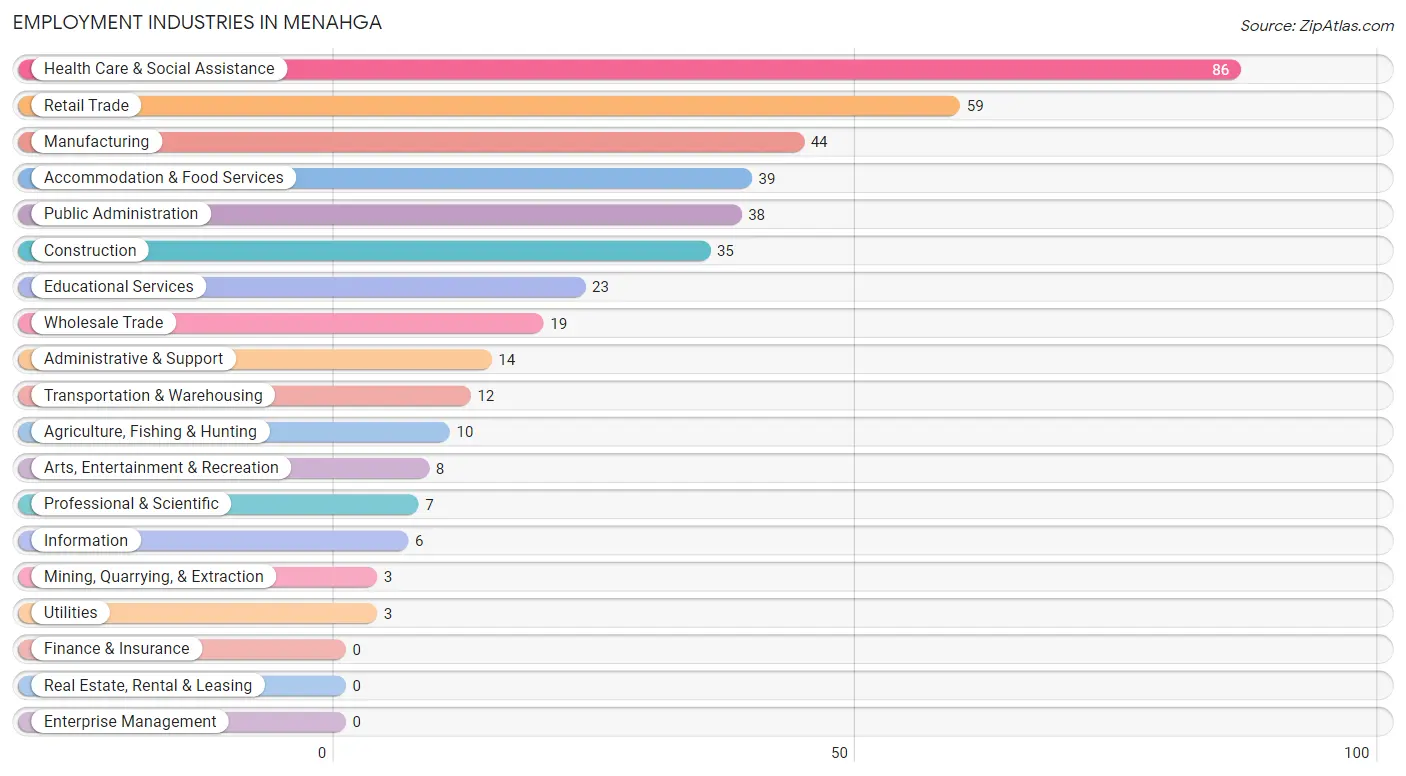
Employment Industries by Sex in Menahga
The Menahga industries that see more men than women are Mining, Quarrying, & Extraction (100.0%), Construction (100.0%), and Transportation & Warehousing (100.0%), whereas the industries that tend to have a higher number of women are Information (100.0%), Administrative & Support (100.0%), and Health Care & Social Assistance (83.7%).
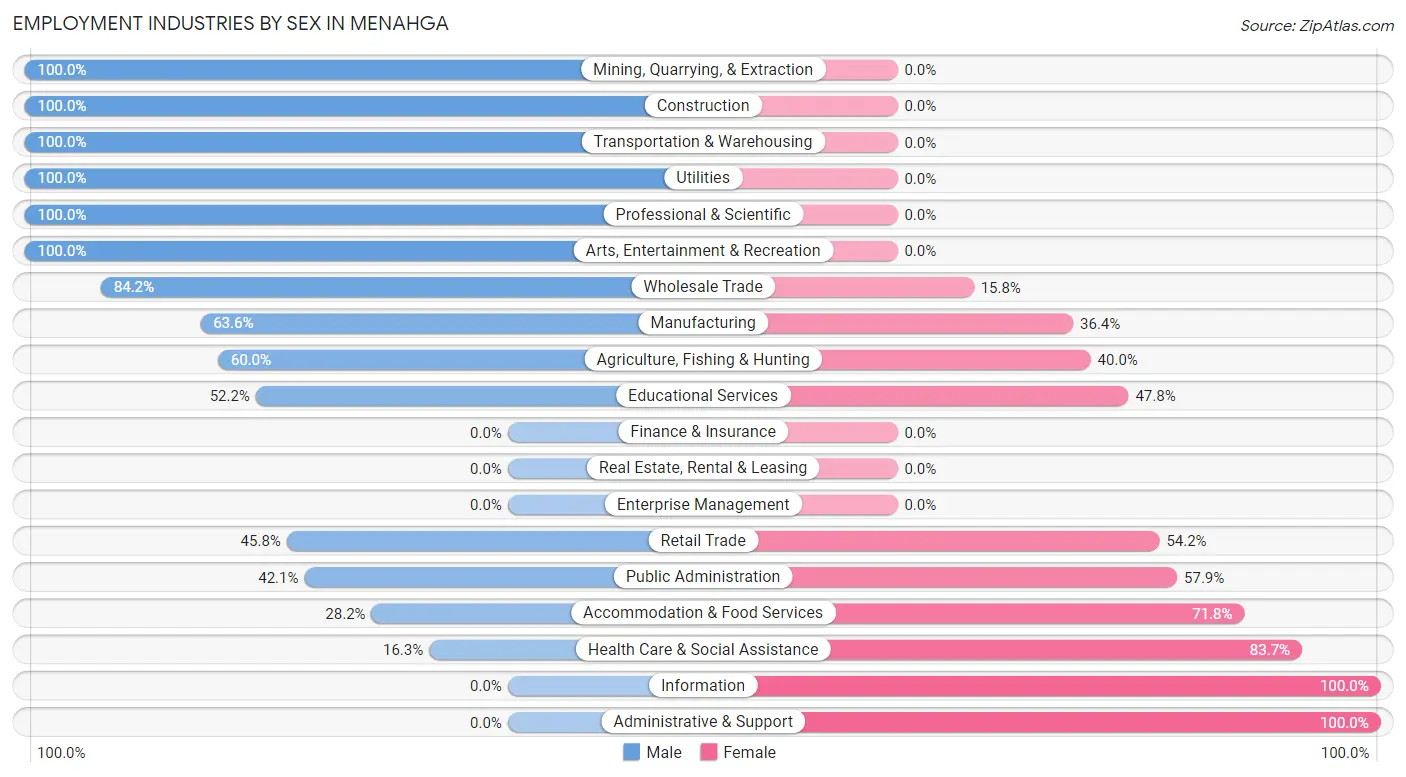
| Industry | Male | Female |
| Agriculture, Fishing & Hunting | 6 (60.0%) | 4 (40.0%) |
| Mining, Quarrying, & Extraction | 3 (100.0%) | 0 (0.0%) |
| Construction | 35 (100.0%) | 0 (0.0%) |
| Manufacturing | 28 (63.6%) | 16 (36.4%) |
| Wholesale Trade | 16 (84.2%) | 3 (15.8%) |
| Retail Trade | 27 (45.8%) | 32 (54.2%) |
| Transportation & Warehousing | 12 (100.0%) | 0 (0.0%) |
| Utilities | 3 (100.0%) | 0 (0.0%) |
| Information | 0 (0.0%) | 6 (100.0%) |
| Finance & Insurance | 0 (0.0%) | 0 (0.0%) |
| Real Estate, Rental & Leasing | 0 (0.0%) | 0 (0.0%) |
| Professional & Scientific | 7 (100.0%) | 0 (0.0%) |
| Enterprise Management | 0 (0.0%) | 0 (0.0%) |
| Administrative & Support | 0 (0.0%) | 14 (100.0%) |
| Educational Services | 12 (52.2%) | 11 (47.8%) |
| Health Care & Social Assistance | 14 (16.3%) | 72 (83.7%) |
| Arts, Entertainment & Recreation | 8 (100.0%) | 0 (0.0%) |
| Accommodation & Food Services | 11 (28.2%) | 28 (71.8%) |
| Public Administration | 16 (42.1%) | 22 (57.9%) |
| Total | 202 (48.0%) | 219 (52.0%) |
Education in Menahga
School Enrollment in Menahga
The most common levels of schooling among the 294 students in Menahga are middle school (108 | 36.7%), high school (73 | 24.8%), and elementary school (57 | 19.4%).
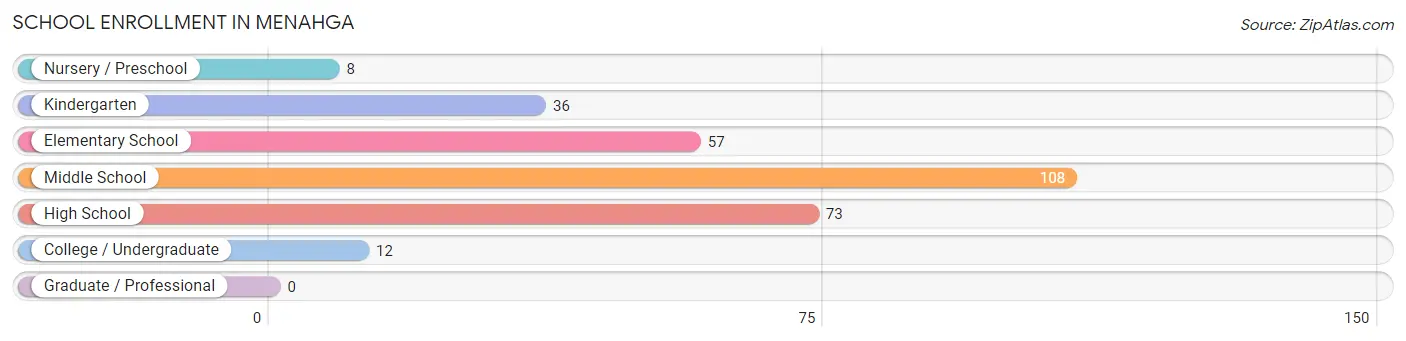
| School Level | # Students | % Students |
| Nursery / Preschool | 8 | 2.7% |
| Kindergarten | 36 | 12.2% |
| Elementary School | 57 | 19.4% |
| Middle School | 108 | 36.7% |
| High School | 73 | 24.8% |
| College / Undergraduate | 12 | 4.1% |
| Graduate / Professional | 0 | 0.0% |
| Total | 294 | 100.0% |
School Enrollment by Age by Funding Source in Menahga
Out of a total of 294 students who are enrolled in schools in Menahga, 7 (2.4%) attend a private institution, while the remaining 287 (97.6%) are enrolled in public schools. The age group of 10 to 14 year olds has the highest likelihood of being enrolled in private schools, with 7 (5.5% in the age bracket) enrolled. Conversely, the age group of 3 to 4 year olds has the lowest likelihood of being enrolled in a private school, with 8 (100.0% in the age bracket) attending a public institution.
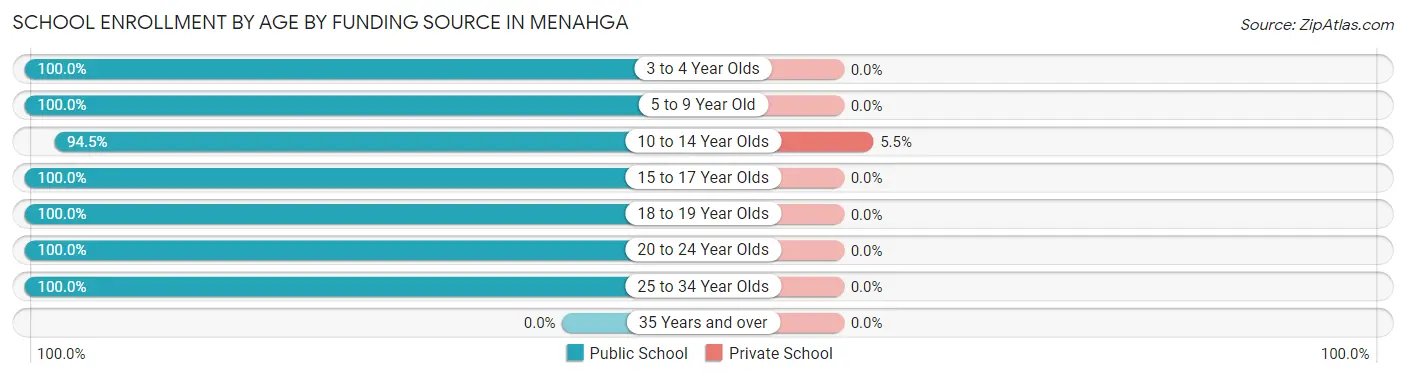
| Age Bracket | Public School | Private School |
| 3 to 4 Year Olds | 8 (100.0%) | 0 (0.0%) |
| 5 to 9 Year Old | 85 (100.0%) | 0 (0.0%) |
| 10 to 14 Year Olds | 120 (94.5%) | 7 (5.5%) |
| 15 to 17 Year Olds | 55 (100.0%) | 0 (0.0%) |
| 18 to 19 Year Olds | 3 (100.0%) | 0 (0.0%) |
| 20 to 24 Year Olds | 6 (100.0%) | 0 (0.0%) |
| 25 to 34 Year Olds | 10 (100.0%) | 0 (0.0%) |
| 35 Years and over | 0 (0.0%) | 0 (0.0%) |
| Total | 287 (97.6%) | 7 (2.4%) |
Educational Attainment by Field of Study in Menahga
Education (78 | 35.6%), arts & humanities (33 | 15.1%), business (29 | 13.2%), visual & performing arts (28 | 12.8%), and engineering (23 | 10.5%) are the most common fields of study among 219 individuals in Menahga who have obtained a bachelor's degree or higher.
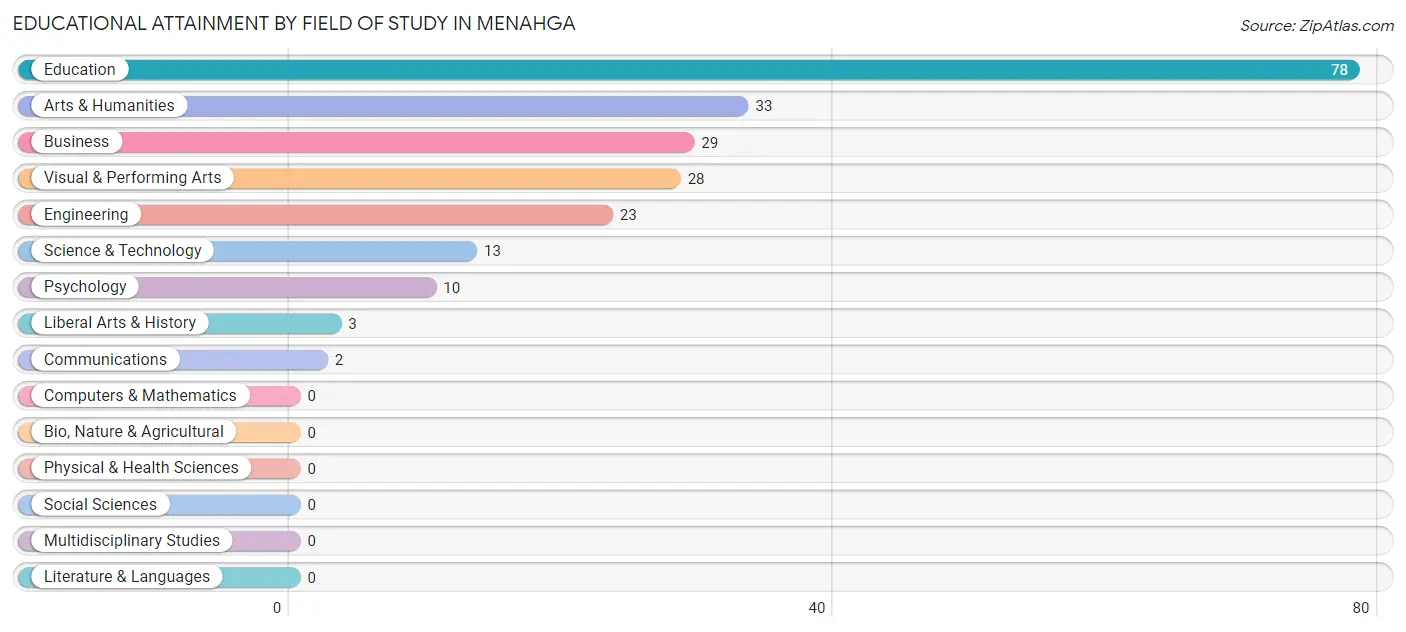
| Field of Study | # Graduates | % Graduates |
| Computers & Mathematics | 0 | 0.0% |
| Bio, Nature & Agricultural | 0 | 0.0% |
| Physical & Health Sciences | 0 | 0.0% |
| Psychology | 10 | 4.6% |
| Social Sciences | 0 | 0.0% |
| Engineering | 23 | 10.5% |
| Multidisciplinary Studies | 0 | 0.0% |
| Science & Technology | 13 | 5.9% |
| Business | 29 | 13.2% |
| Education | 78 | 35.6% |
| Literature & Languages | 0 | 0.0% |
| Liberal Arts & History | 3 | 1.4% |
| Visual & Performing Arts | 28 | 12.8% |
| Communications | 2 | 0.9% |
| Arts & Humanities | 33 | 15.1% |
| Total | 219 | 100.0% |
Transportation & Commute in Menahga
Vehicle Availability by Sex in Menahga
The most prevalent vehicle ownership categories in Menahga are males with 2 vehicles (113, accounting for 56.8%) and females with 2 vehicles (117, making up 53.3%).
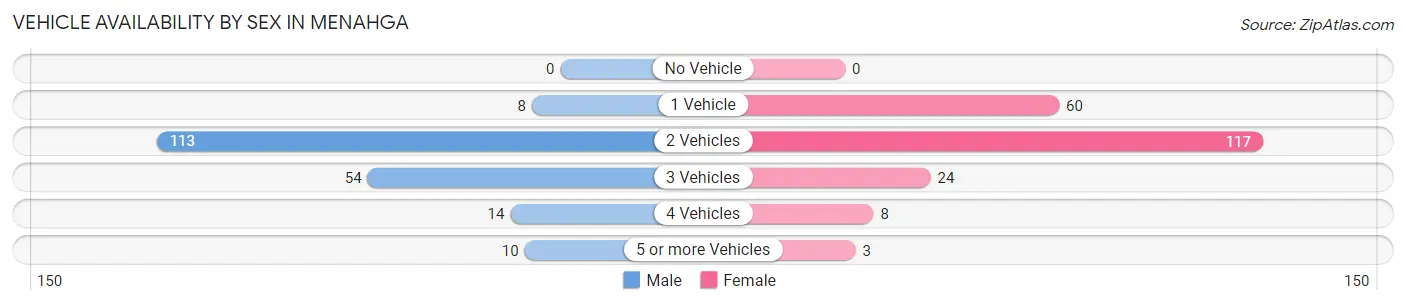
| Vehicles Available | Male | Female |
| No Vehicle | 0 (0.0%) | 0 (0.0%) |
| 1 Vehicle | 8 (4.0%) | 60 (28.3%) |
| 2 Vehicles | 113 (56.8%) | 117 (55.2%) |
| 3 Vehicles | 54 (27.1%) | 24 (11.3%) |
| 4 Vehicles | 14 (7.0%) | 8 (3.8%) |
| 5 or more Vehicles | 10 (5.0%) | 3 (1.4%) |
| Total | 199 (100.0%) | 212 (100.0%) |
Commute Time in Menahga
The most frequently occuring commute durations in Menahga are 15 to 19 minutes (86 commuters, 22.7%), 20 to 24 minutes (60 commuters, 15.8%), and 5 to 9 minutes (58 commuters, 15.3%).
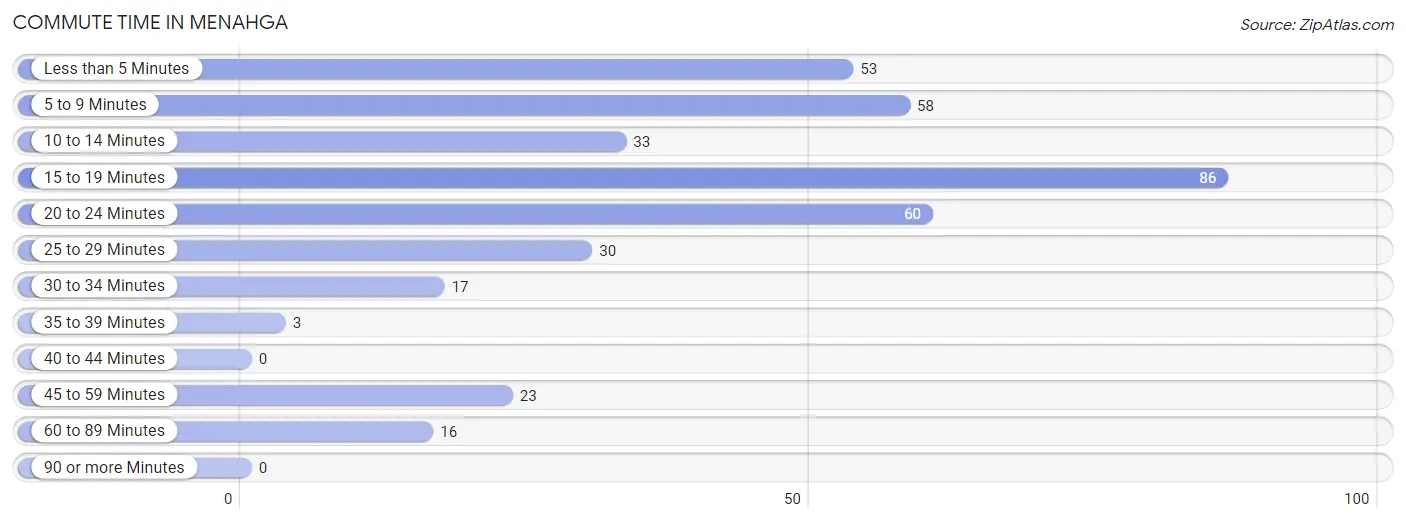
| Commute Time | # Commuters | % Commuters |
| Less than 5 Minutes | 53 | 14.0% |
| 5 to 9 Minutes | 58 | 15.3% |
| 10 to 14 Minutes | 33 | 8.7% |
| 15 to 19 Minutes | 86 | 22.7% |
| 20 to 24 Minutes | 60 | 15.8% |
| 25 to 29 Minutes | 30 | 7.9% |
| 30 to 34 Minutes | 17 | 4.5% |
| 35 to 39 Minutes | 3 | 0.8% |
| 40 to 44 Minutes | 0 | 0.0% |
| 45 to 59 Minutes | 23 | 6.1% |
| 60 to 89 Minutes | 16 | 4.2% |
| 90 or more Minutes | 0 | 0.0% |
Commute Time by Sex in Menahga
The most common commute times in Menahga are 5 to 9 minutes (42 commuters, 23.1%) for males and 15 to 19 minutes (67 commuters, 34.0%) for females.
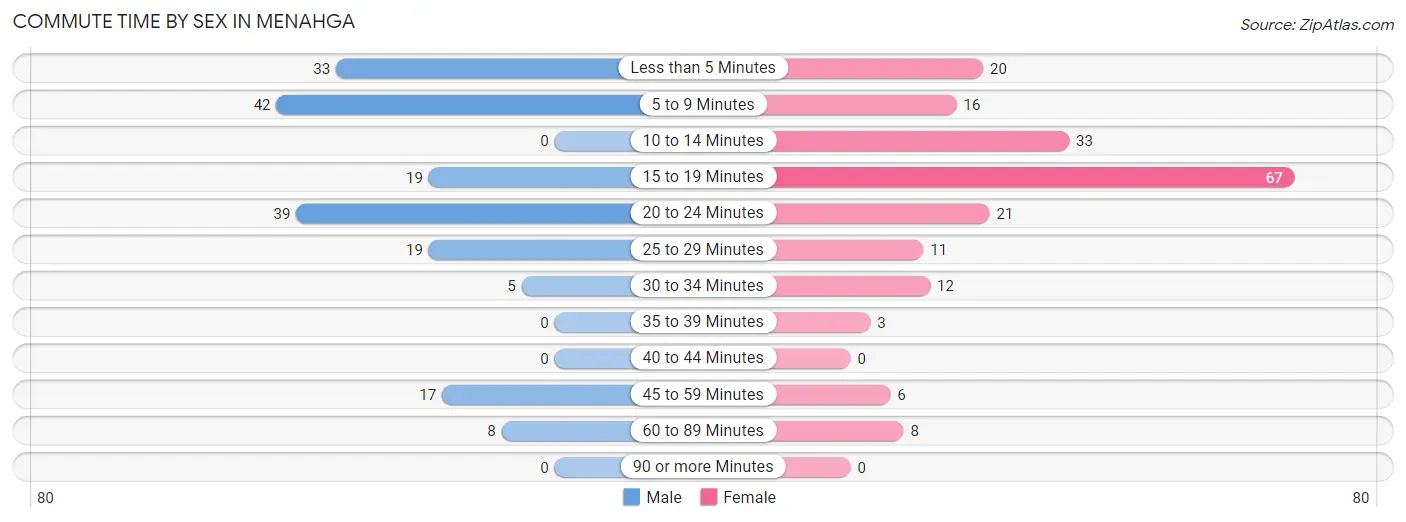
| Commute Time | Male | Female |
| Less than 5 Minutes | 33 (18.1%) | 20 (10.2%) |
| 5 to 9 Minutes | 42 (23.1%) | 16 (8.1%) |
| 10 to 14 Minutes | 0 (0.0%) | 33 (16.8%) |
| 15 to 19 Minutes | 19 (10.4%) | 67 (34.0%) |
| 20 to 24 Minutes | 39 (21.4%) | 21 (10.7%) |
| 25 to 29 Minutes | 19 (10.4%) | 11 (5.6%) |
| 30 to 34 Minutes | 5 (2.8%) | 12 (6.1%) |
| 35 to 39 Minutes | 0 (0.0%) | 3 (1.5%) |
| 40 to 44 Minutes | 0 (0.0%) | 0 (0.0%) |
| 45 to 59 Minutes | 17 (9.3%) | 6 (3.0%) |
| 60 to 89 Minutes | 8 (4.4%) | 8 (4.1%) |
| 90 or more Minutes | 0 (0.0%) | 0 (0.0%) |
Time of Departure to Work by Sex in Menahga
The most frequent times of departure to work in Menahga are 6:30 AM to 6:59 AM (47, 25.8%) for males and 7:30 AM to 7:59 AM (67, 34.0%) for females.
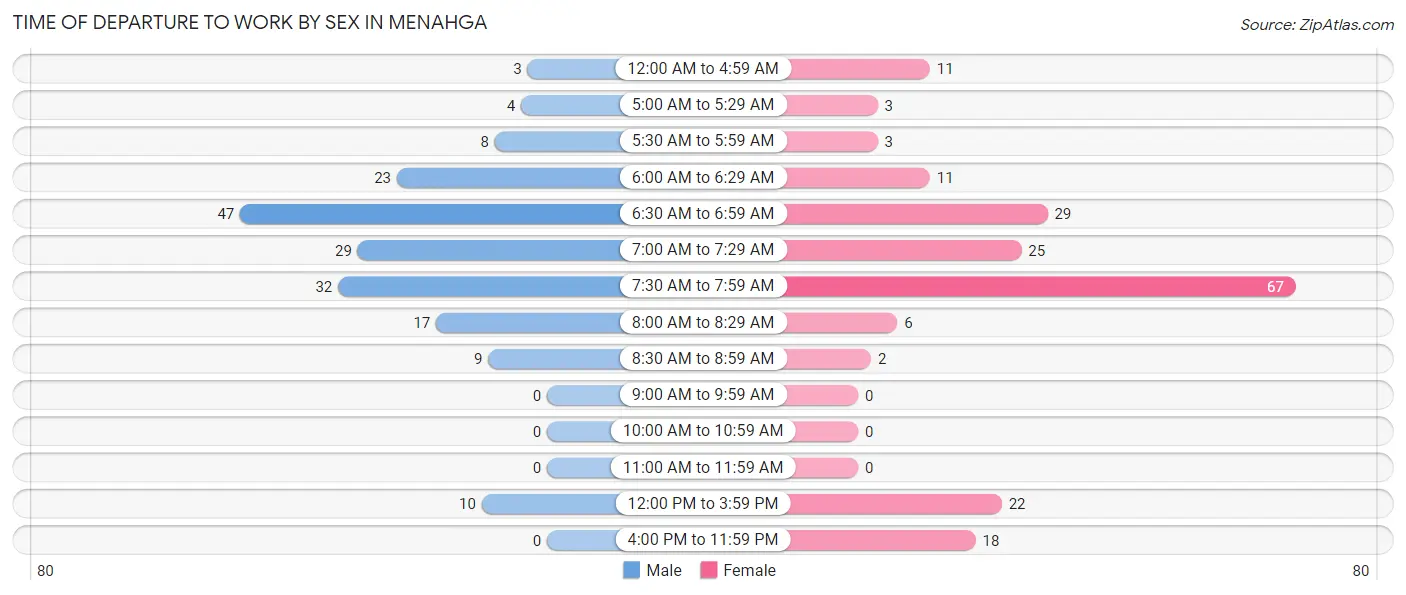
| Time of Departure | Male | Female |
| 12:00 AM to 4:59 AM | 3 (1.7%) | 11 (5.6%) |
| 5:00 AM to 5:29 AM | 4 (2.2%) | 3 (1.5%) |
| 5:30 AM to 5:59 AM | 8 (4.4%) | 3 (1.5%) |
| 6:00 AM to 6:29 AM | 23 (12.6%) | 11 (5.6%) |
| 6:30 AM to 6:59 AM | 47 (25.8%) | 29 (14.7%) |
| 7:00 AM to 7:29 AM | 29 (15.9%) | 25 (12.7%) |
| 7:30 AM to 7:59 AM | 32 (17.6%) | 67 (34.0%) |
| 8:00 AM to 8:29 AM | 17 (9.3%) | 6 (3.0%) |
| 8:30 AM to 8:59 AM | 9 (5.0%) | 2 (1.0%) |
| 9:00 AM to 9:59 AM | 0 (0.0%) | 0 (0.0%) |
| 10:00 AM to 10:59 AM | 0 (0.0%) | 0 (0.0%) |
| 11:00 AM to 11:59 AM | 0 (0.0%) | 0 (0.0%) |
| 12:00 PM to 3:59 PM | 10 (5.5%) | 22 (11.2%) |
| 4:00 PM to 11:59 PM | 0 (0.0%) | 18 (9.1%) |
| Total | 182 (100.0%) | 197 (100.0%) |
Housing Occupancy in Menahga
Occupancy by Ownership in Menahga
Of the total 490 dwellings in Menahga, owner-occupied units account for 323 (65.9%), while renter-occupied units make up 167 (34.1%).
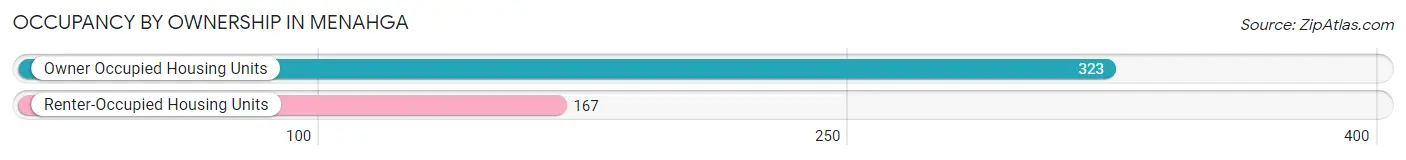
| Occupancy | # Housing Units | % Housing Units |
| Owner Occupied Housing Units | 323 | 65.9% |
| Renter-Occupied Housing Units | 167 | 34.1% |
| Total Occupied Housing Units | 490 | 100.0% |
Occupancy by Household Size in Menahga
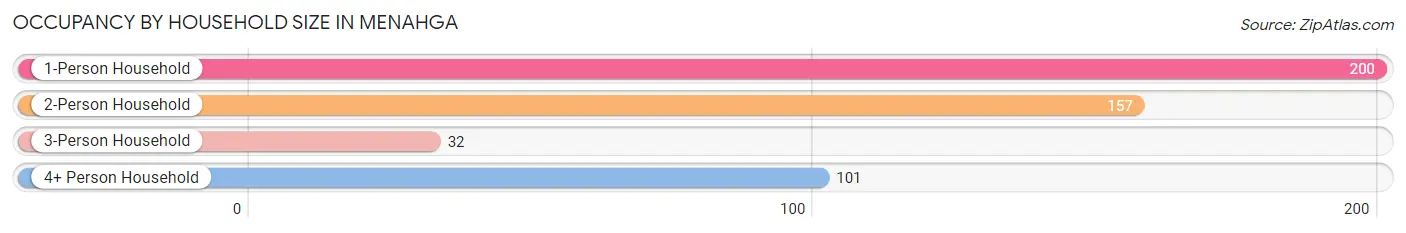
| Household Size | # Housing Units | % Housing Units |
| 1-Person Household | 200 | 40.8% |
| 2-Person Household | 157 | 32.0% |
| 3-Person Household | 32 | 6.5% |
| 4+ Person Household | 101 | 20.6% |
| Total Housing Units | 490 | 100.0% |
Occupancy by Ownership by Household Size in Menahga
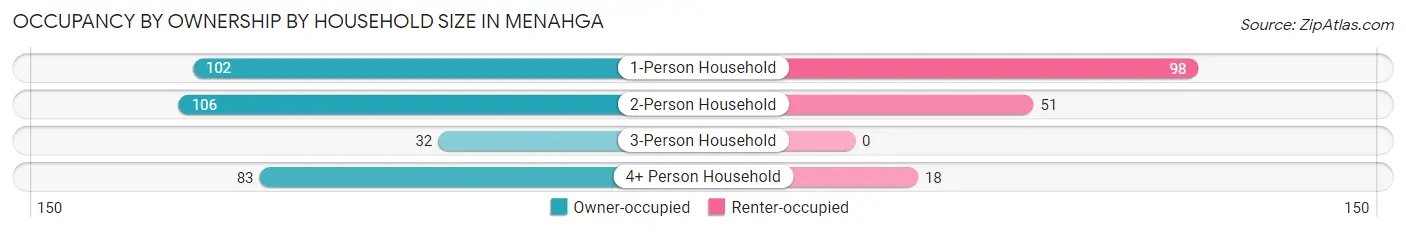
| Household Size | Owner-occupied | Renter-occupied |
| 1-Person Household | 102 (51.0%) | 98 (49.0%) |
| 2-Person Household | 106 (67.5%) | 51 (32.5%) |
| 3-Person Household | 32 (100.0%) | 0 (0.0%) |
| 4+ Person Household | 83 (82.2%) | 18 (17.8%) |
| Total Housing Units | 323 (65.9%) | 167 (34.1%) |
Occupancy by Educational Attainment in Menahga
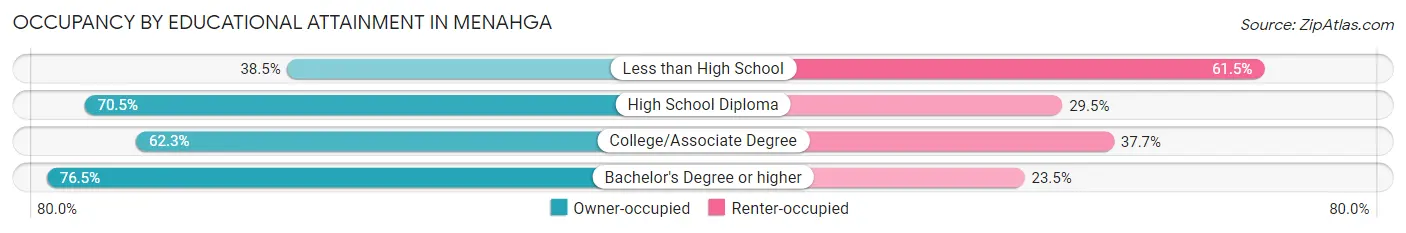
| Household Size | Owner-occupied | Renter-occupied |
| Less than High School | 15 (38.5%) | 24 (61.5%) |
| High School Diploma | 129 (70.5%) | 54 (29.5%) |
| College/Associate Degree | 114 (62.3%) | 69 (37.7%) |
| Bachelor's Degree or higher | 65 (76.5%) | 20 (23.5%) |
Occupancy by Age of Householder in Menahga
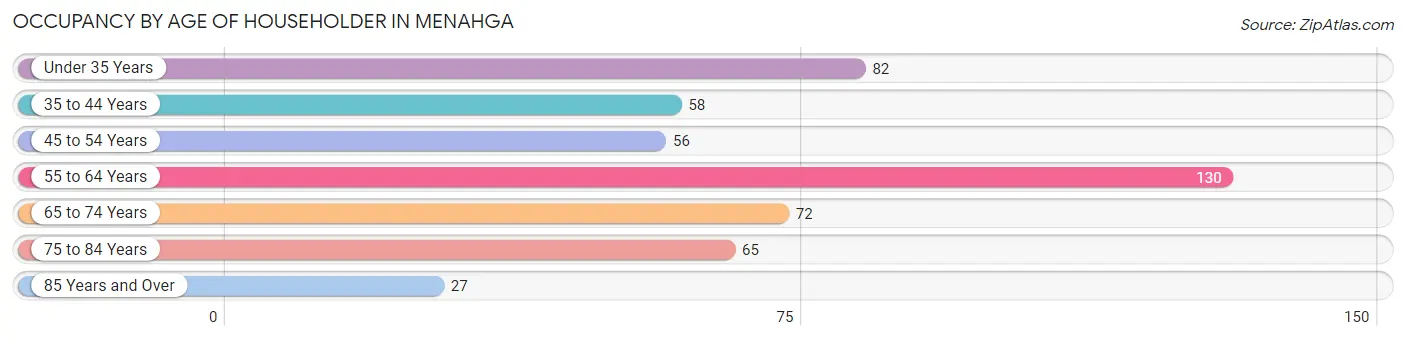
| Age Bracket | # Households | % Households |
| Under 35 Years | 82 | 16.7% |
| 35 to 44 Years | 58 | 11.8% |
| 45 to 54 Years | 56 | 11.4% |
| 55 to 64 Years | 130 | 26.5% |
| 65 to 74 Years | 72 | 14.7% |
| 75 to 84 Years | 65 | 13.3% |
| 85 Years and Over | 27 | 5.5% |
| Total | 490 | 100.0% |
Housing Finances in Menahga
Median Income by Occupancy in Menahga
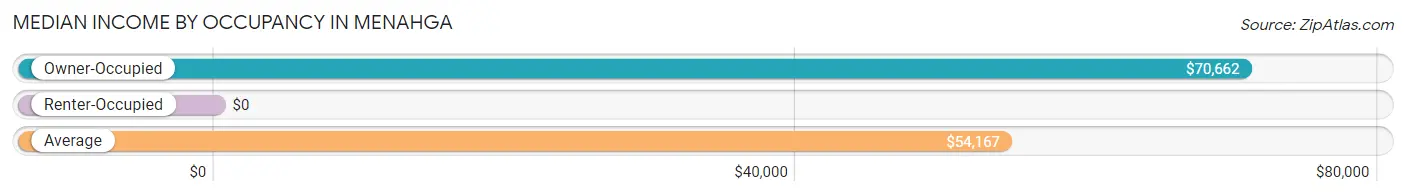
| Occupancy Type | # Households | Median Income |
| Owner-Occupied | 323 (65.9%) | $70,662 |
| Renter-Occupied | 167 (34.1%) | $0 |
| Average | 490 (100.0%) | $54,167 |
Occupancy by Householder Income Bracket in Menahga
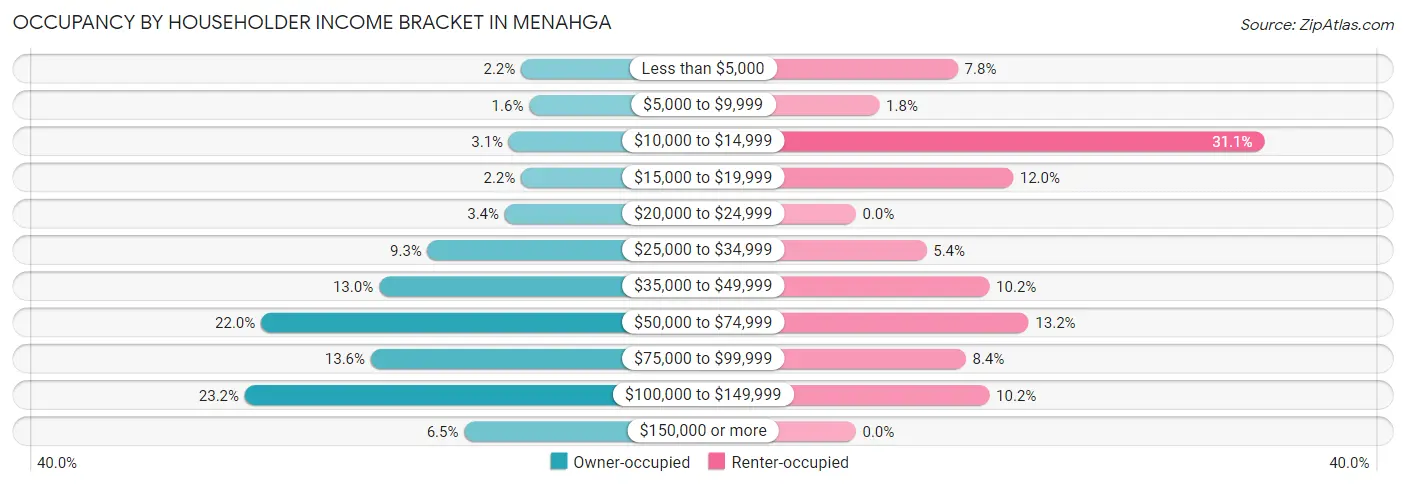
| Income Bracket | Owner-occupied | Renter-occupied |
| Less than $5,000 | 7 (2.2%) | 13 (7.8%) |
| $5,000 to $9,999 | 5 (1.5%) | 3 (1.8%) |
| $10,000 to $14,999 | 10 (3.1%) | 52 (31.1%) |
| $15,000 to $19,999 | 7 (2.2%) | 20 (12.0%) |
| $20,000 to $24,999 | 11 (3.4%) | 0 (0.0%) |
| $25,000 to $34,999 | 30 (9.3%) | 9 (5.4%) |
| $35,000 to $49,999 | 42 (13.0%) | 17 (10.2%) |
| $50,000 to $74,999 | 71 (22.0%) | 22 (13.2%) |
| $75,000 to $99,999 | 44 (13.6%) | 14 (8.4%) |
| $100,000 to $149,999 | 75 (23.2%) | 17 (10.2%) |
| $150,000 or more | 21 (6.5%) | 0 (0.0%) |
| Total | 323 (100.0%) | 167 (100.0%) |
Monthly Housing Cost Tiers in Menahga
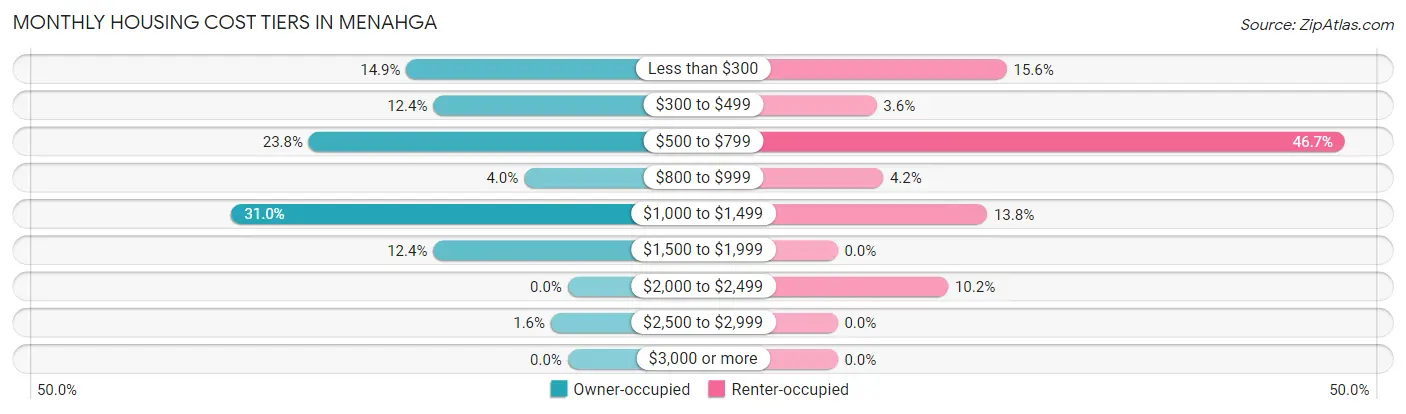
| Monthly Cost | Owner-occupied | Renter-occupied |
| Less than $300 | 48 (14.9%) | 26 (15.6%) |
| $300 to $499 | 40 (12.4%) | 6 (3.6%) |
| $500 to $799 | 77 (23.8%) | 78 (46.7%) |
| $800 to $999 | 13 (4.0%) | 7 (4.2%) |
| $1,000 to $1,499 | 100 (31.0%) | 23 (13.8%) |
| $1,500 to $1,999 | 40 (12.4%) | 0 (0.0%) |
| $2,000 to $2,499 | 0 (0.0%) | 17 (10.2%) |
| $2,500 to $2,999 | 5 (1.5%) | 0 (0.0%) |
| $3,000 or more | 0 (0.0%) | 0 (0.0%) |
| Total | 323 (100.0%) | 167 (100.0%) |
Physical Housing Characteristics in Menahga
Housing Structures in Menahga
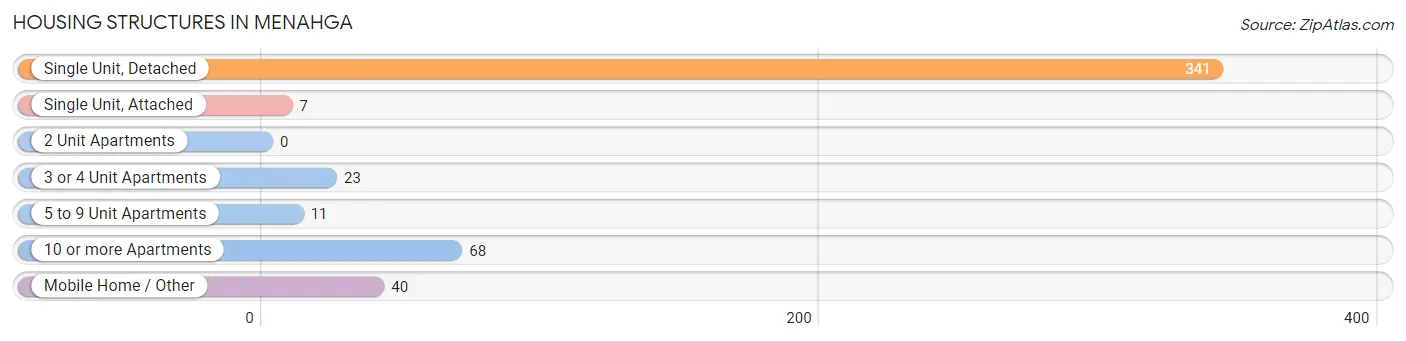
| Structure Type | # Housing Units | % Housing Units |
| Single Unit, Detached | 341 | 69.6% |
| Single Unit, Attached | 7 | 1.4% |
| 2 Unit Apartments | 0 | 0.0% |
| 3 or 4 Unit Apartments | 23 | 4.7% |
| 5 to 9 Unit Apartments | 11 | 2.2% |
| 10 or more Apartments | 68 | 13.9% |
| Mobile Home / Other | 40 | 8.2% |
| Total | 490 | 100.0% |
Housing Structures by Occupancy in Menahga
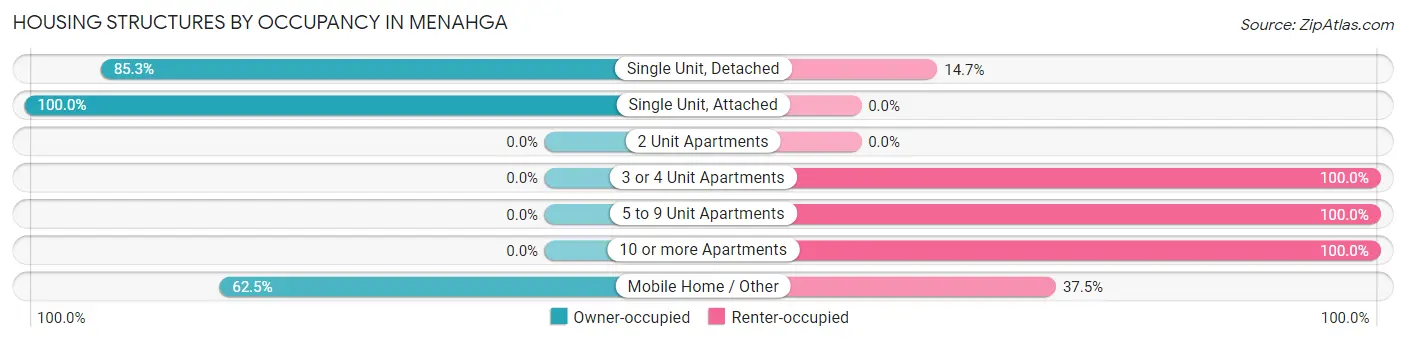
| Structure Type | Owner-occupied | Renter-occupied |
| Single Unit, Detached | 291 (85.3%) | 50 (14.7%) |
| Single Unit, Attached | 7 (100.0%) | 0 (0.0%) |
| 2 Unit Apartments | 0 (0.0%) | 0 (0.0%) |
| 3 or 4 Unit Apartments | 0 (0.0%) | 23 (100.0%) |
| 5 to 9 Unit Apartments | 0 (0.0%) | 11 (100.0%) |
| 10 or more Apartments | 0 (0.0%) | 68 (100.0%) |
| Mobile Home / Other | 25 (62.5%) | 15 (37.5%) |
| Total | 323 (65.9%) | 167 (34.1%) |
Housing Structures by Number of Rooms in Menahga
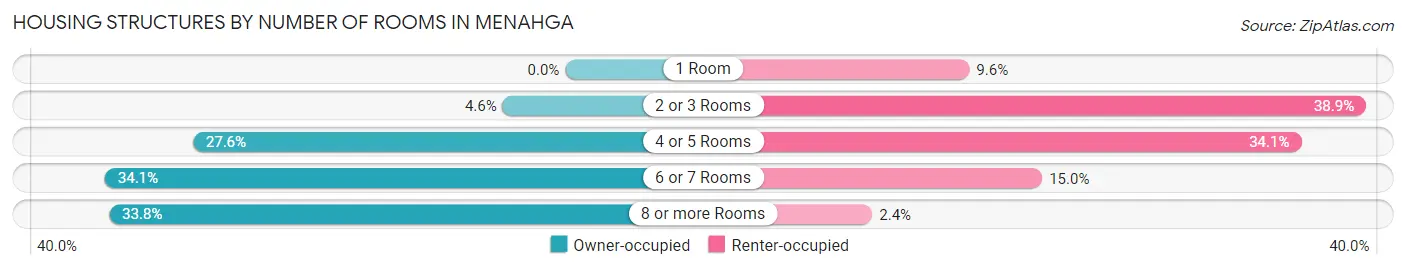
| Number of Rooms | Owner-occupied | Renter-occupied |
| 1 Room | 0 (0.0%) | 16 (9.6%) |
| 2 or 3 Rooms | 15 (4.6%) | 65 (38.9%) |
| 4 or 5 Rooms | 89 (27.6%) | 57 (34.1%) |
| 6 or 7 Rooms | 110 (34.1%) | 25 (15.0%) |
| 8 or more Rooms | 109 (33.8%) | 4 (2.4%) |
| Total | 323 (100.0%) | 167 (100.0%) |
Housing Structure by Heating Type in Menahga
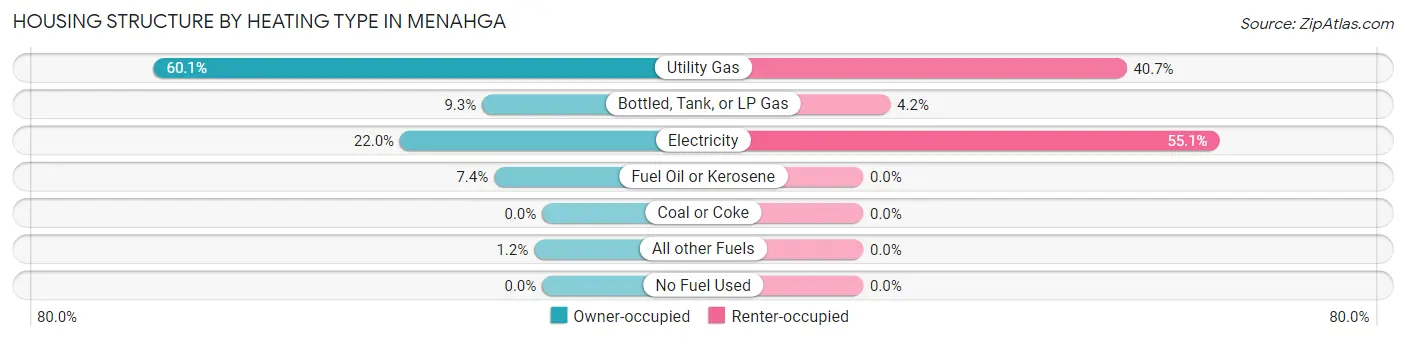
| Heating Type | Owner-occupied | Renter-occupied |
| Utility Gas | 194 (60.1%) | 68 (40.7%) |
| Bottled, Tank, or LP Gas | 30 (9.3%) | 7 (4.2%) |
| Electricity | 71 (22.0%) | 92 (55.1%) |
| Fuel Oil or Kerosene | 24 (7.4%) | 0 (0.0%) |
| Coal or Coke | 0 (0.0%) | 0 (0.0%) |
| All other Fuels | 4 (1.2%) | 0 (0.0%) |
| No Fuel Used | 0 (0.0%) | 0 (0.0%) |
| Total | 323 (100.0%) | 167 (100.0%) |
Household Vehicle Usage in Menahga
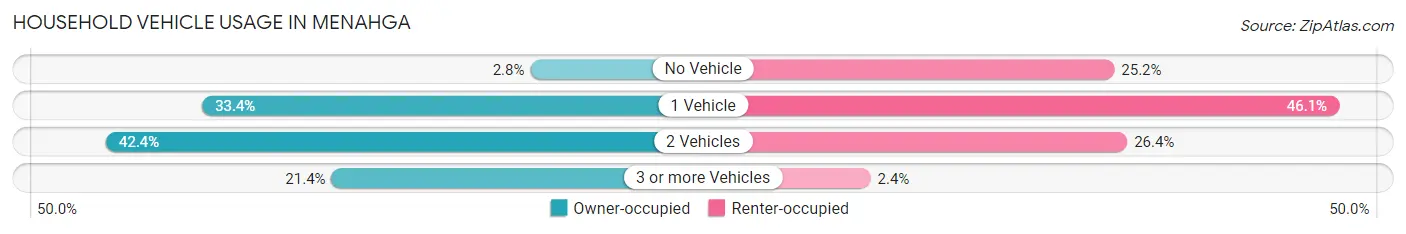
| Vehicles per Household | Owner-occupied | Renter-occupied |
| No Vehicle | 9 (2.8%) | 42 (25.2%) |
| 1 Vehicle | 108 (33.4%) | 77 (46.1%) |
| 2 Vehicles | 137 (42.4%) | 44 (26.4%) |
| 3 or more Vehicles | 69 (21.4%) | 4 (2.4%) |
| Total | 323 (100.0%) | 167 (100.0%) |
Real Estate & Mortgages in Menahga
Real Estate and Mortgage Overview in Menahga
| Characteristic | Without Mortgage | With Mortgage |
| Housing Units | 112 | 211 |
| Median Property Value | $157,100 | $134,200 |
| Median Household Income | $40,536 | $21 |
| Monthly Housing Costs | $437 | $0 |
| Real Estate Taxes | $1,920 | $0 |
Property Value by Mortgage Status in Menahga
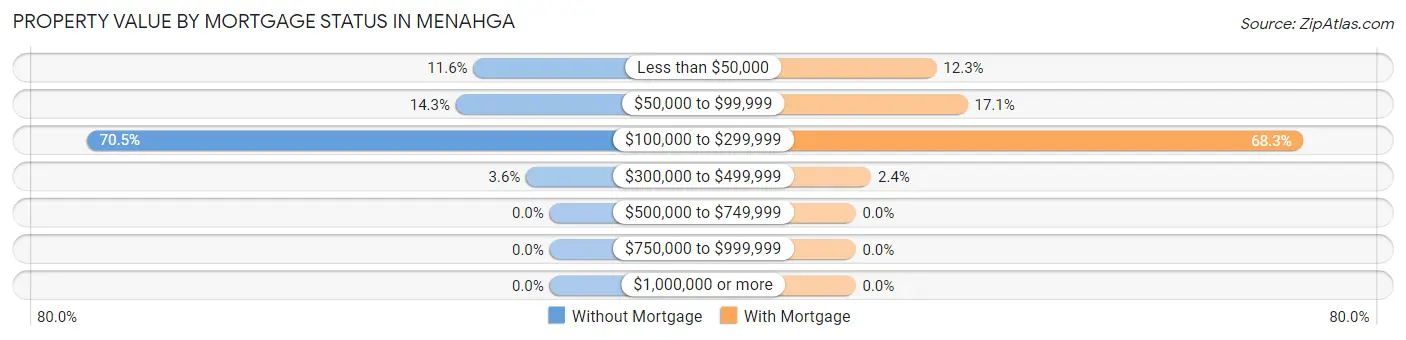
| Property Value | Without Mortgage | With Mortgage |
| Less than $50,000 | 13 (11.6%) | 26 (12.3%) |
| $50,000 to $99,999 | 16 (14.3%) | 36 (17.1%) |
| $100,000 to $299,999 | 79 (70.5%) | 144 (68.2%) |
| $300,000 to $499,999 | 4 (3.6%) | 5 (2.4%) |
| $500,000 to $749,999 | 0 (0.0%) | 0 (0.0%) |
| $750,000 to $999,999 | 0 (0.0%) | 0 (0.0%) |
| $1,000,000 or more | 0 (0.0%) | 0 (0.0%) |
| Total | 112 (100.0%) | 211 (100.0%) |
Household Income by Mortgage Status in Menahga
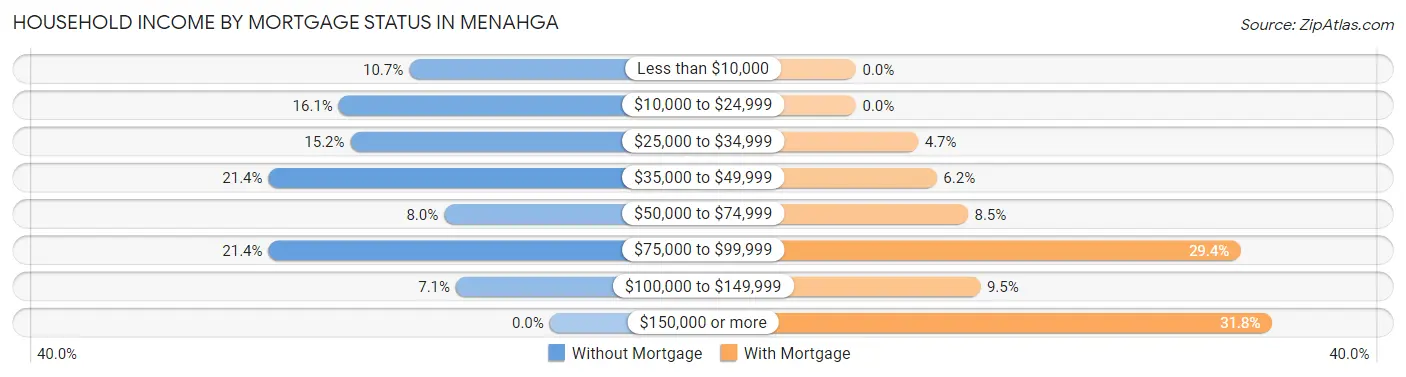
| Household Income | Without Mortgage | With Mortgage |
| Less than $10,000 | 12 (10.7%) | 0 (0.0%) |
| $10,000 to $24,999 | 18 (16.1%) | 0 (0.0%) |
| $25,000 to $34,999 | 17 (15.2%) | 10 (4.7%) |
| $35,000 to $49,999 | 24 (21.4%) | 13 (6.2%) |
| $50,000 to $74,999 | 9 (8.0%) | 18 (8.5%) |
| $75,000 to $99,999 | 24 (21.4%) | 62 (29.4%) |
| $100,000 to $149,999 | 8 (7.1%) | 20 (9.5%) |
| $150,000 or more | 0 (0.0%) | 67 (31.8%) |
| Total | 112 (100.0%) | 211 (100.0%) |
Property Value to Household Income Ratio in Menahga
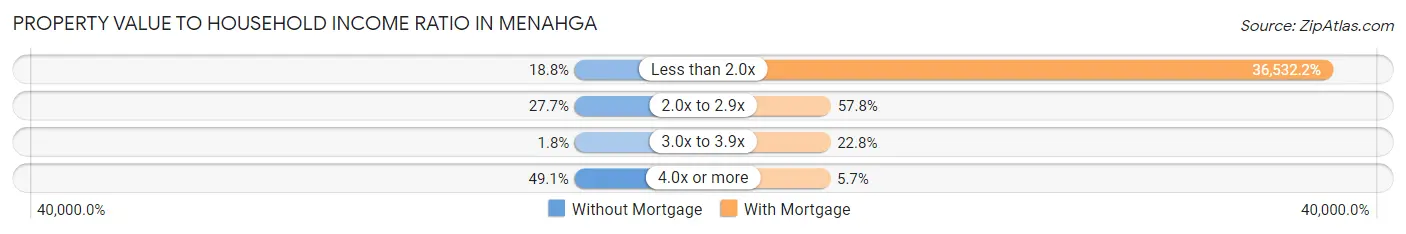
| Value-to-Income Ratio | Without Mortgage | With Mortgage |
| Less than 2.0x | 21 (18.8%) | 77,083 (36,532.2%) |
| 2.0x to 2.9x | 31 (27.7%) | 122 (57.8%) |
| 3.0x to 3.9x | 2 (1.8%) | 48 (22.8%) |
| 4.0x or more | 55 (49.1%) | 12 (5.7%) |
| Total | 112 (100.0%) | 211 (100.0%) |
Real Estate Taxes by Mortgage Status in Menahga
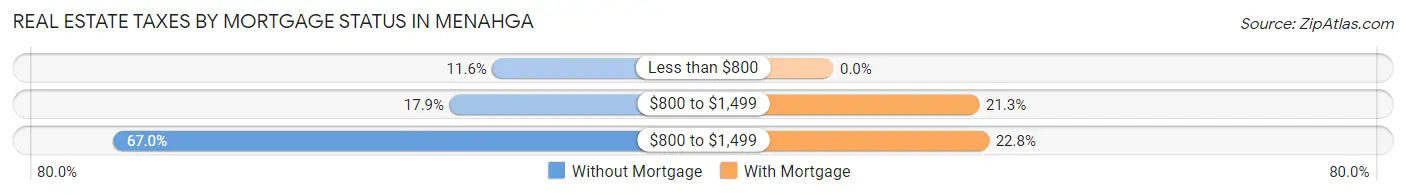
| Property Taxes | Without Mortgage | With Mortgage |
| Less than $800 | 13 (11.6%) | 0 (0.0%) |
| $800 to $1,499 | 20 (17.9%) | 45 (21.3%) |
| $800 to $1,499 | 75 (67.0%) | 48 (22.8%) |
| Total | 112 (100.0%) | 211 (100.0%) |
Health & Disability in Menahga
Health Insurance Coverage by Age in Menahga
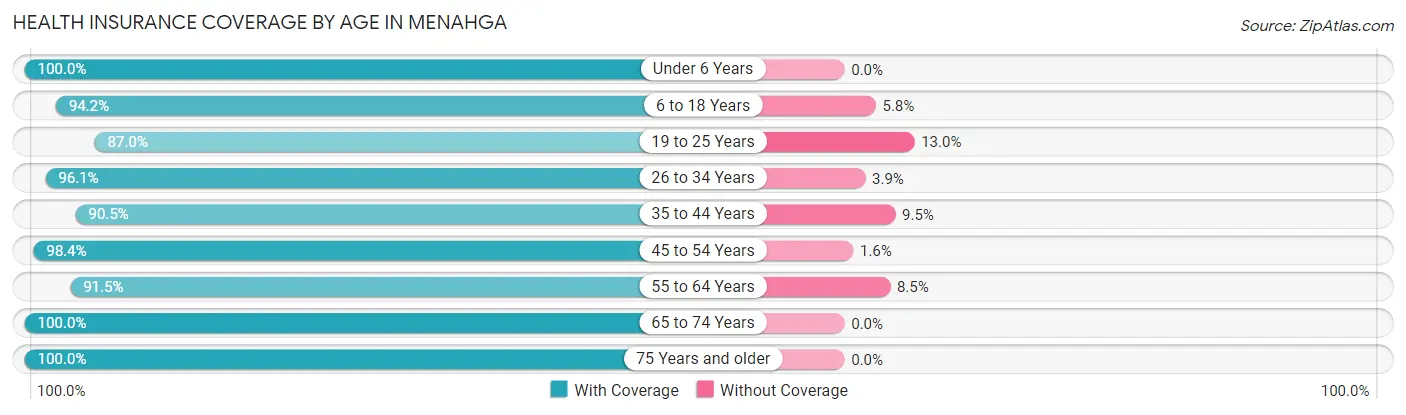
| Age Bracket | With Coverage | Without Coverage |
| Under 6 Years | 90 (100.0%) | 0 (0.0%) |
| 6 to 18 Years | 226 (94.2%) | 14 (5.8%) |
| 19 to 25 Years | 60 (87.0%) | 9 (13.0%) |
| 26 to 34 Years | 99 (96.1%) | 4 (3.9%) |
| 35 to 44 Years | 105 (90.5%) | 11 (9.5%) |
| 45 to 54 Years | 121 (98.4%) | 2 (1.6%) |
| 55 to 64 Years | 172 (91.5%) | 16 (8.5%) |
| 65 to 74 Years | 96 (100.0%) | 0 (0.0%) |
| 75 Years and older | 116 (100.0%) | 0 (0.0%) |
| Total | 1,085 (95.1%) | 56 (4.9%) |
Health Insurance Coverage by Citizenship Status in Menahga
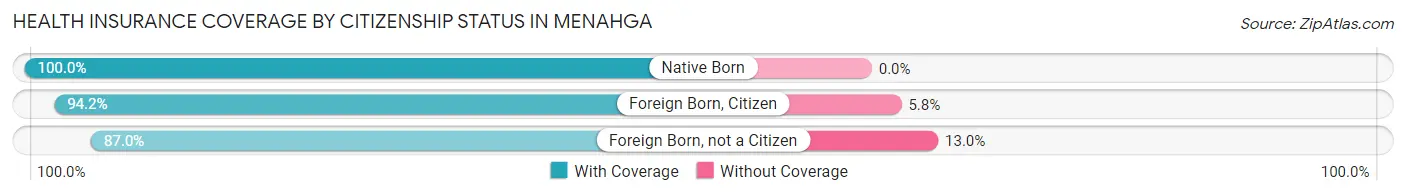
| Citizenship Status | With Coverage | Without Coverage |
| Native Born | 90 (100.0%) | 0 (0.0%) |
| Foreign Born, Citizen | 226 (94.2%) | 14 (5.8%) |
| Foreign Born, not a Citizen | 60 (87.0%) | 9 (13.0%) |
Health Insurance Coverage by Household Income in Menahga
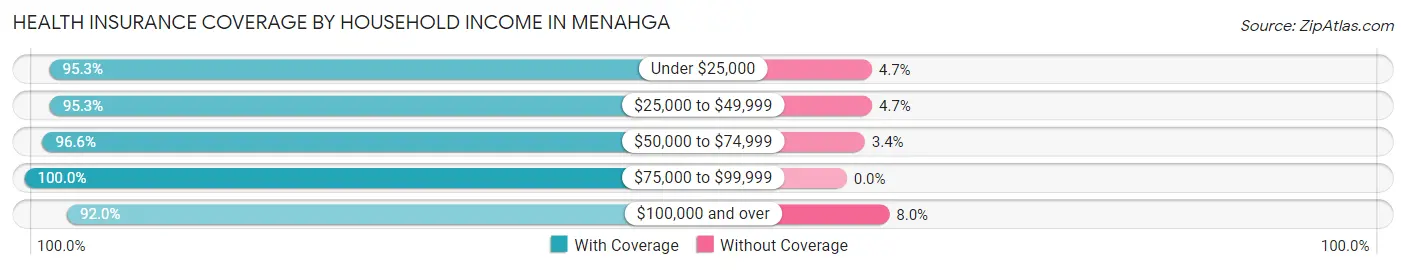
| Household Income | With Coverage | Without Coverage |
| Under $25,000 | 183 (95.3%) | 9 (4.7%) |
| $25,000 to $49,999 | 181 (95.3%) | 9 (4.7%) |
| $50,000 to $74,999 | 200 (96.6%) | 7 (3.4%) |
| $75,000 to $99,999 | 163 (100.0%) | 0 (0.0%) |
| $100,000 and over | 358 (92.0%) | 31 (8.0%) |
Public vs Private Health Insurance Coverage by Age in Menahga
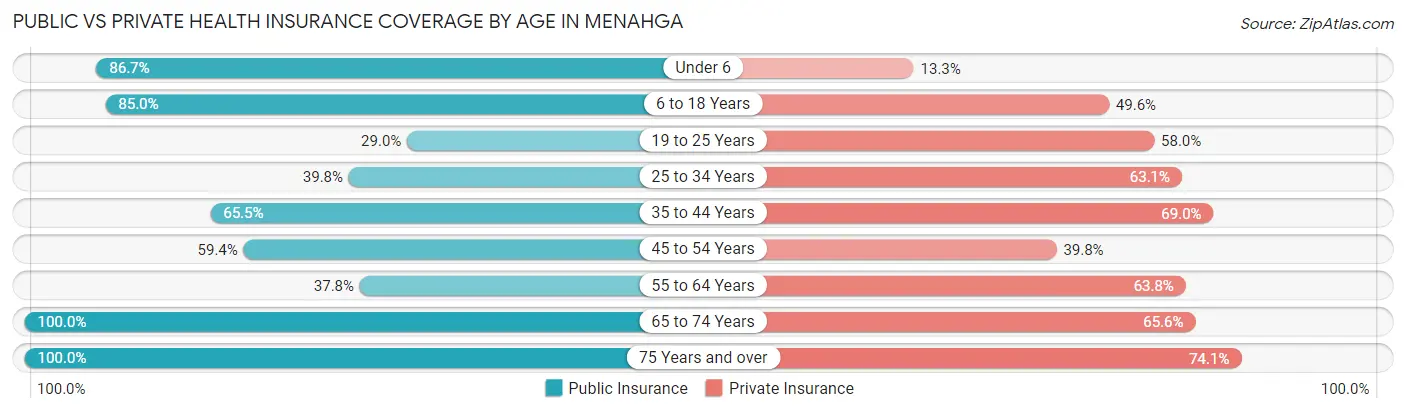
| Age Bracket | Public Insurance | Private Insurance |
| Under 6 | 78 (86.7%) | 12 (13.3%) |
| 6 to 18 Years | 204 (85.0%) | 119 (49.6%) |
| 19 to 25 Years | 20 (29.0%) | 40 (58.0%) |
| 25 to 34 Years | 41 (39.8%) | 65 (63.1%) |
| 35 to 44 Years | 76 (65.5%) | 80 (69.0%) |
| 45 to 54 Years | 73 (59.4%) | 49 (39.8%) |
| 55 to 64 Years | 71 (37.8%) | 120 (63.8%) |
| 65 to 74 Years | 96 (100.0%) | 63 (65.6%) |
| 75 Years and over | 116 (100.0%) | 86 (74.1%) |
| Total | 775 (67.9%) | 634 (55.6%) |
Disability Status by Sex by Age in Menahga
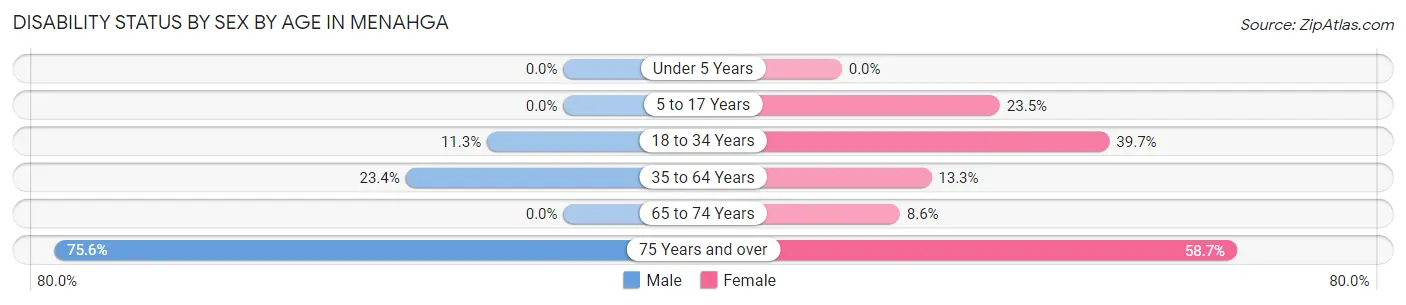
| Age Bracket | Male | Female |
| Under 5 Years | 0 (0.0%) | 0 (0.0%) |
| 5 to 17 Years | 0 (0.0%) | 31 (23.5%) |
| 18 to 34 Years | 11 (11.3%) | 31 (39.7%) |
| 35 to 64 Years | 56 (23.4%) | 25 (13.3%) |
| 65 to 74 Years | 0 (0.0%) | 5 (8.6%) |
| 75 Years and over | 31 (75.6%) | 44 (58.7%) |
Disability Class by Sex by Age in Menahga
Disability Class: Hearing Difficulty
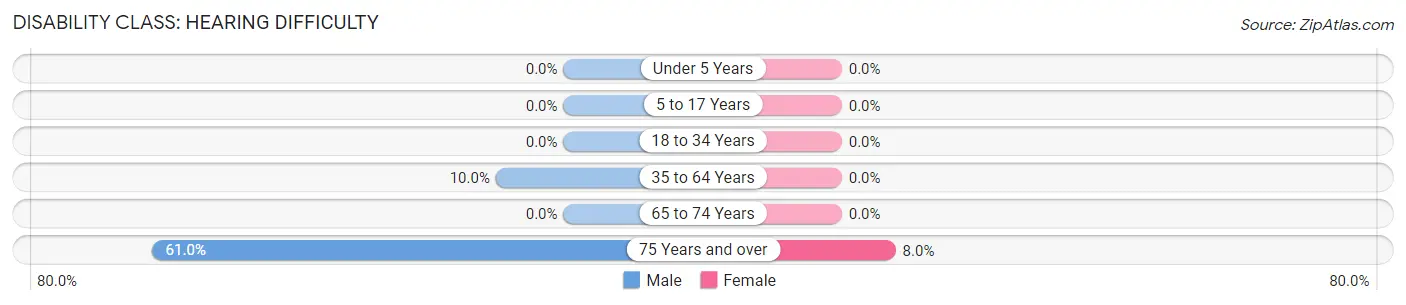
| Age Bracket | Male | Female |
| Under 5 Years | 0 (0.0%) | 0 (0.0%) |
| 5 to 17 Years | 0 (0.0%) | 0 (0.0%) |
| 18 to 34 Years | 0 (0.0%) | 0 (0.0%) |
| 35 to 64 Years | 24 (10.0%) | 0 (0.0%) |
| 65 to 74 Years | 0 (0.0%) | 0 (0.0%) |
| 75 Years and over | 25 (61.0%) | 6 (8.0%) |
Disability Class: Vision Difficulty
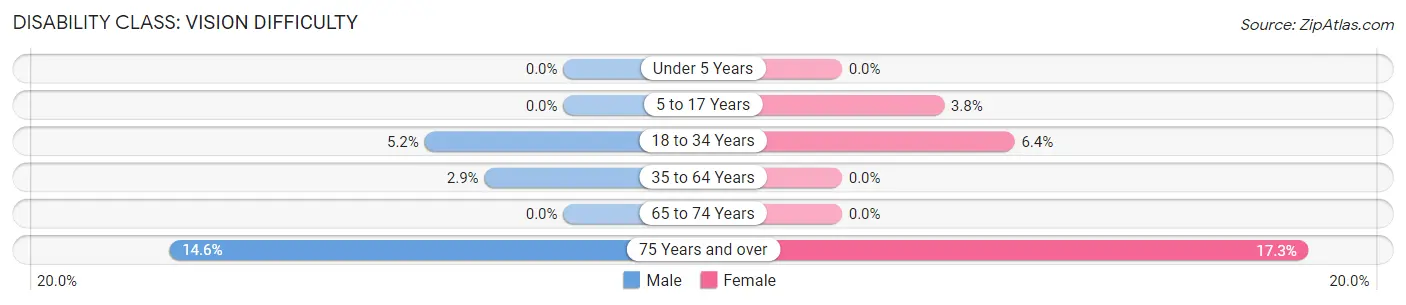
| Age Bracket | Male | Female |
| Under 5 Years | 0 (0.0%) | 0 (0.0%) |
| 5 to 17 Years | 0 (0.0%) | 5 (3.8%) |
| 18 to 34 Years | 5 (5.1%) | 5 (6.4%) |
| 35 to 64 Years | 7 (2.9%) | 0 (0.0%) |
| 65 to 74 Years | 0 (0.0%) | 0 (0.0%) |
| 75 Years and over | 6 (14.6%) | 13 (17.3%) |
Disability Class: Cognitive Difficulty
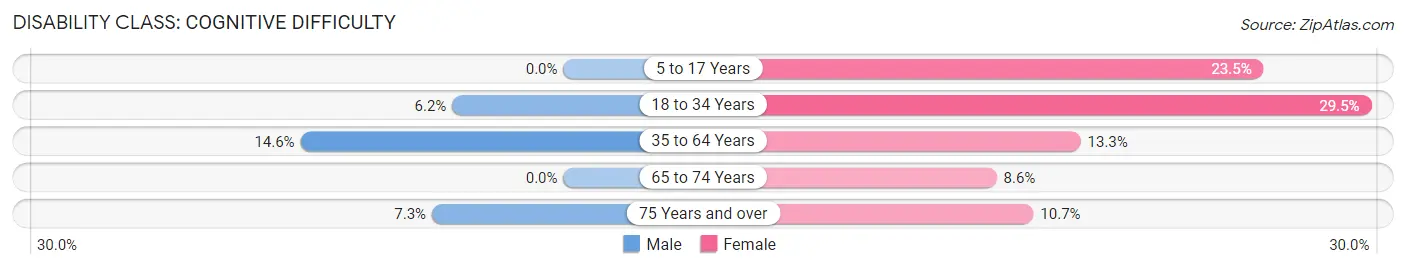
| Age Bracket | Male | Female |
| 5 to 17 Years | 0 (0.0%) | 31 (23.5%) |
| 18 to 34 Years | 6 (6.2%) | 23 (29.5%) |
| 35 to 64 Years | 35 (14.6%) | 25 (13.3%) |
| 65 to 74 Years | 0 (0.0%) | 5 (8.6%) |
| 75 Years and over | 3 (7.3%) | 8 (10.7%) |
Disability Class: Ambulatory Difficulty
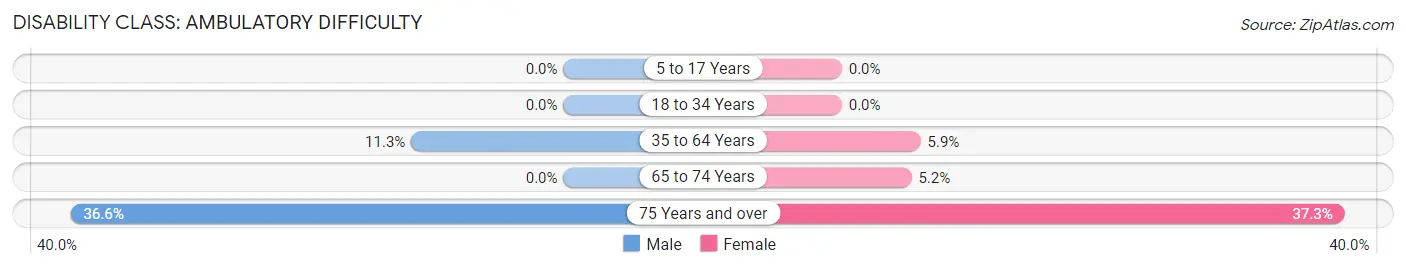
| Age Bracket | Male | Female |
| 5 to 17 Years | 0 (0.0%) | 0 (0.0%) |
| 18 to 34 Years | 0 (0.0%) | 0 (0.0%) |
| 35 to 64 Years | 27 (11.3%) | 11 (5.9%) |
| 65 to 74 Years | 0 (0.0%) | 3 (5.2%) |
| 75 Years and over | 15 (36.6%) | 28 (37.3%) |
Disability Class: Self-Care Difficulty
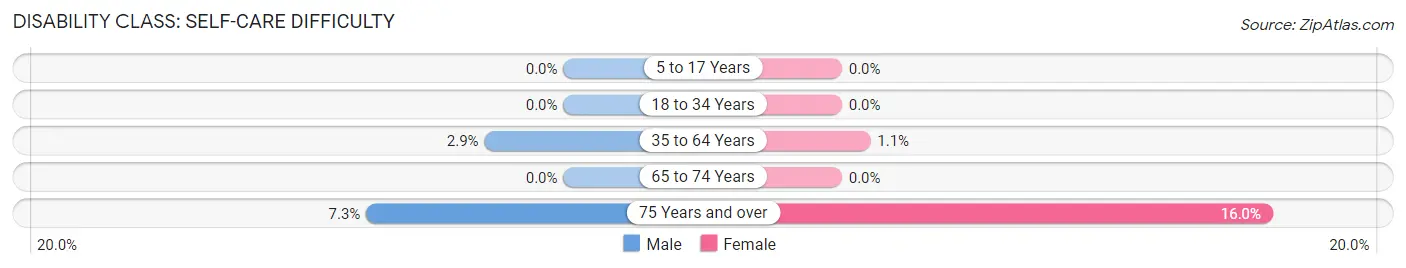
| Age Bracket | Male | Female |
| 5 to 17 Years | 0 (0.0%) | 0 (0.0%) |
| 18 to 34 Years | 0 (0.0%) | 0 (0.0%) |
| 35 to 64 Years | 7 (2.9%) | 2 (1.1%) |
| 65 to 74 Years | 0 (0.0%) | 0 (0.0%) |
| 75 Years and over | 3 (7.3%) | 12 (16.0%) |
Technology Access in Menahga
Computing Device Access in Menahga
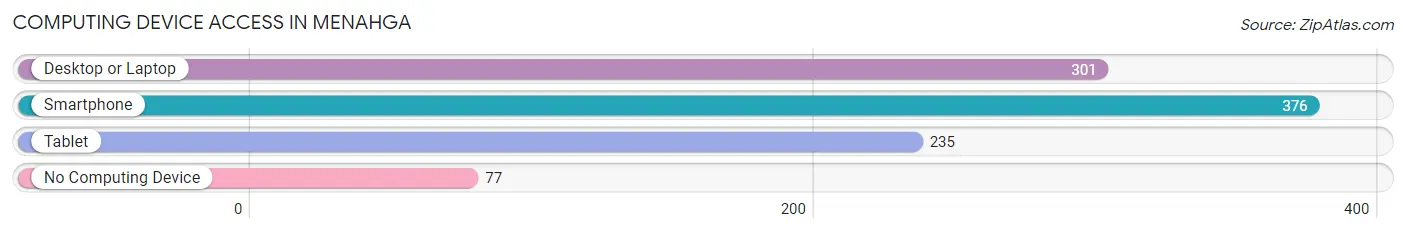
| Device Type | # Households | % Households |
| Desktop or Laptop | 301 | 61.4% |
| Smartphone | 376 | 76.7% |
| Tablet | 235 | 48.0% |
| No Computing Device | 77 | 15.7% |
| Total | 490 | 100.0% |
Internet Access in Menahga
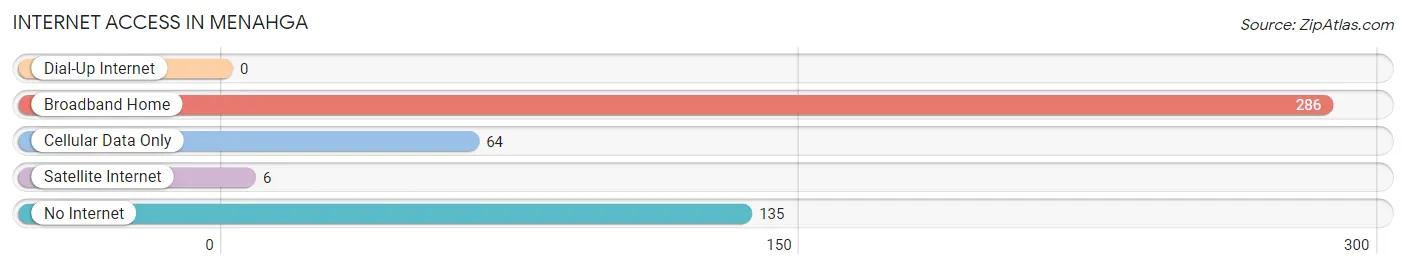
| Internet Type | # Households | % Households |
| Dial-Up Internet | 0 | 0.0% |
| Broadband Home | 286 | 58.4% |
| Cellular Data Only | 64 | 13.1% |
| Satellite Internet | 6 | 1.2% |
| No Internet | 135 | 27.6% |
| Total | 490 | 100.0% |
Menahga Summary
Menahga, Minnesota is a small city located in the northwestern part of the state. It is situated in Wadena County, and is part of the Brainerd Micropolitan Statistical Area. The city has a population of 1,521 people, according to the 2010 census.
History
Menahga was founded in 1881 by a group of Finnish settlers. The city was named after the Menahga River, which was named after the Menominee Indians who once lived in the area. The city was incorporated in 1887.
In the early 1900s, Menahga was a thriving logging and farming community. The city was also home to a number of sawmills and other businesses. In the 1920s, the city was home to a number of resorts, which attracted tourists from all over the country.
Geography
Menahga is located in northwestern Minnesota, in Wadena County. The city is situated on the Menahga River, which flows through the city. The city is surrounded by forests and lakes, and is located near the Chippewa National Forest.
The city has a total area of 1.2 square miles, all of which is land. The city is located at an elevation of 1,072 feet above sea level.
Economy
The economy of Menahga is largely based on tourism and agriculture. The city is home to a number of resorts, which attract visitors from all over the country. The city is also home to a number of farms, which produce a variety of crops, including corn, soybeans, and wheat.
The city is also home to a number of small businesses, including restaurants, retail stores, and service providers. The city is also home to a number of manufacturing companies, which produce a variety of products, including furniture, clothing, and electronics.
Demographics
According to the 2010 census, the population of Menahga was 1,521 people. The racial makeup of the city was 97.2% White, 0.3% African American, 0.2% Native American, 0.2% Asian, 0.1% Pacific Islander, 0.7% from other races, and 1.3% from two or more races. Hispanic or Latino of any race were 1.7% of the population.
The median household income in Menahga was $37,917, and the median family income was $45,625. The per capita income for the city was $19,945. About 11.2% of families and 14.2% of the population were below the poverty line, including 18.2% of those under age 18 and 8.3% of those age 65 or over.
Common Questions
What is Per Capita Income in Menahga?
Per Capita income in Menahga is $25,301.
What is the Median Family Income in Menahga?
Median Family Income in Menahga is $73,661.
What is the Median Household income in Menahga?
Median Household Income in Menahga is $54,167.
What is Income or Wage Gap in Menahga?
Income or Wage Gap in Menahga is 24.4%.
Women in Menahga earn 75.6 cents for every dollar earned by a man.
What is Family Income Deficit in Menahga?
Family Income Deficit in Menahga is $7,651.
Families that are below poverty line in Menahga earn $7,651 less on average than the poverty threshold level.
What is Inequality or Gini Index in Menahga?
Inequality or Gini Index in Menahga is 0.40.
What is the Total Population of Menahga?
Total Population of Menahga is 1,218.
What is the Total Male Population of Menahga?
Total Male Population of Menahga is 578.
What is the Total Female Population of Menahga?
Total Female Population of Menahga is 640.
What is the Ratio of Males per 100 Females in Menahga?
There are 90.31 Males per 100 Females in Menahga.
What is the Ratio of Females per 100 Males in Menahga?
There are 110.73 Females per 100 Males in Menahga.
What is the Median Population Age in Menahga?
Median Population Age in Menahga is 44.2 Years.
What is the Average Family Size in Menahga
Average Family Size in Menahga is 3.6 People.
What is the Average Household Size in Menahga
Average Household Size in Menahga is 2.3 People.
How Large is the Labor Force in Menahga?
There are 433 People in the Labor Forcein in Menahga.
What is the Percentage of People in the Labor Force in Menahga?
46.6% of People are in the Labor Force in Menahga.
What is the Unemployment Rate in Menahga?
Unemployment Rate in Menahga is 2.8%.