Marble, MN Map & Demographics
Marble Map
Marble Overview
$26,326
PER CAPITA INCOME
$74,583
AVG FAMILY INCOME
$51,094
AVG HOUSEHOLD INCOME
21.8%
WAGE / INCOME GAP [ % ]
78.2¢/ $1
WAGE / INCOME GAP [ $ ]
0.40
INEQUALITY / GINI INDEX
614
TOTAL POPULATION
344
MALE POPULATION
270
FEMALE POPULATION
127.41
MALES / 100 FEMALES
78.49
FEMALES / 100 MALES
33.6
MEDIAN AGE
3.0
AVG FAMILY SIZE
2.4
AVG HOUSEHOLD SIZE
328
LABOR FORCE [ PEOPLE ]
62.6%
PERCENT IN LABOR FORCE
7.3%
UNEMPLOYMENT RATE
Marble Zip Codes
Marble Area Codes
Income in Marble
Income Overview in Marble
Per Capita Income in Marble is $26,326, while median incomes of families and households are $74,583 and $51,094 respectively.
| Characteristic | Number | Measure |
| Per Capita Income | 614 | $26,326 |
| Median Family Income | 149 | $74,583 |
| Mean Family Income | 149 | $78,326 |
| Median Household Income | 251 | $51,094 |
| Mean Household Income | 251 | $63,831 |
| Income Deficit | 149 | $0 |
| Wage / Income Gap (%) | 614 | 21.85% |
| Wage / Income Gap ($) | 614 | 78.15¢ per $1 |
| Gini / Inequality Index | 614 | 0.40 |
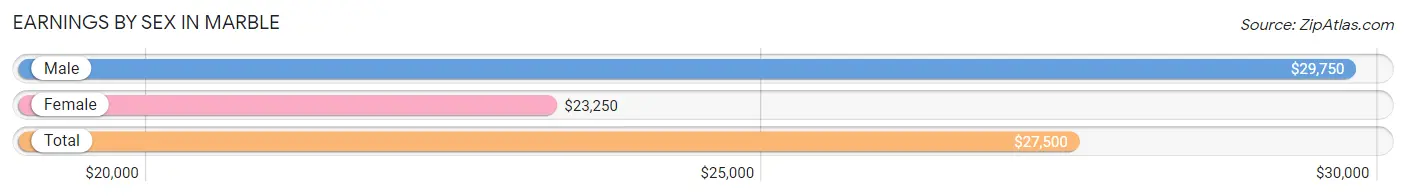
Earnings by Sex in Marble
Average Earnings in Marble are $27,500, $29,750 for men and $23,250 for women, a difference of 21.8%.
| Sex | Number | Average Earnings |
| Male | 171 (50.3%) | $29,750 |
| Female | 169 (49.7%) | $23,250 |
| Total | 340 (100.0%) | $27,500 |
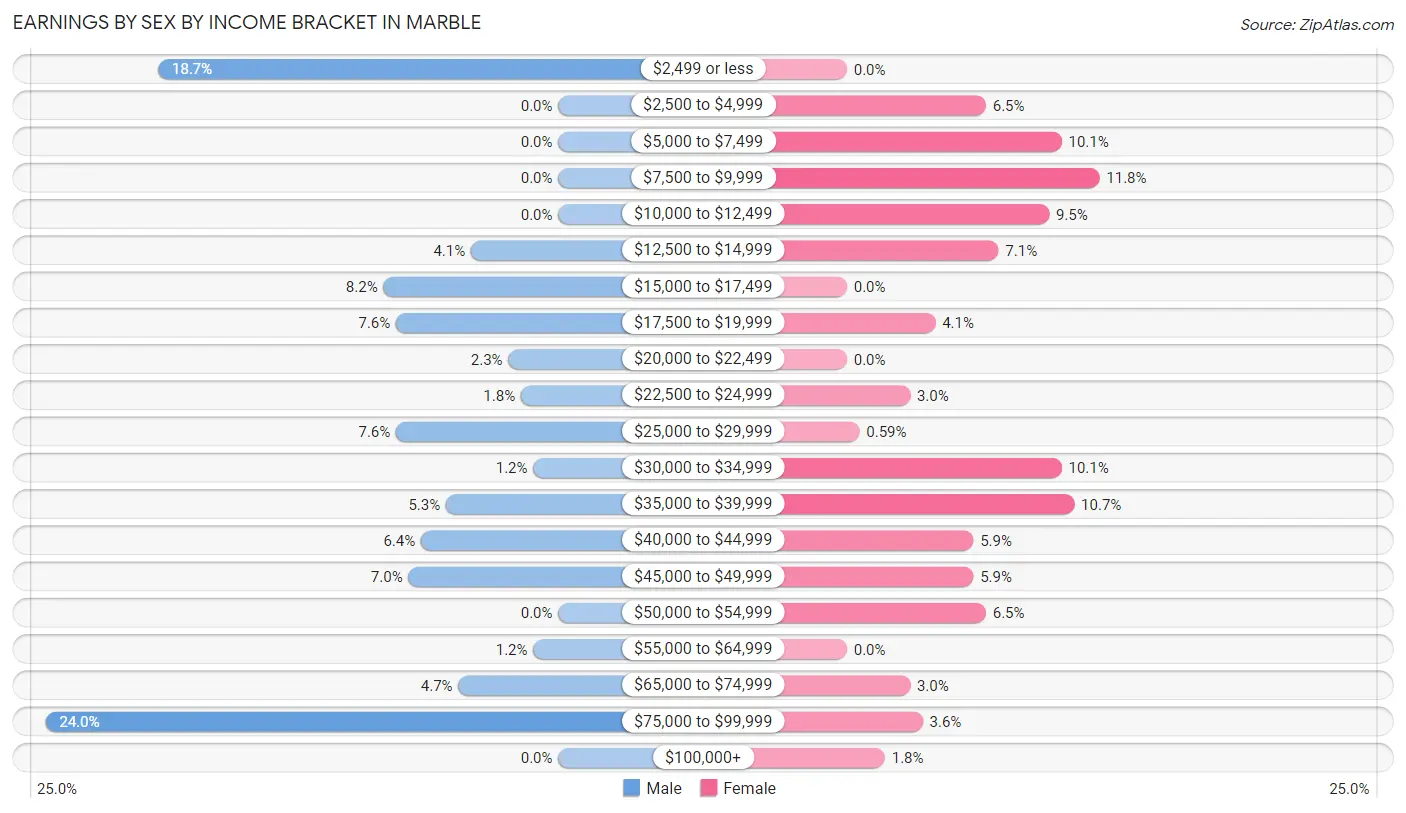
Earnings by Sex by Income Bracket in Marble
The most common earnings brackets in Marble are $75,000 to $99,999 for men (41 | 24.0%) and $7,500 to $9,999 for women (20 | 11.8%).
| Income | Male | Female |
| $2,499 or less | 32 (18.7%) | 0 (0.0%) |
| $2,500 to $4,999 | 0 (0.0%) | 11 (6.5%) |
| $5,000 to $7,499 | 0 (0.0%) | 17 (10.1%) |
| $7,500 to $9,999 | 0 (0.0%) | 20 (11.8%) |
| $10,000 to $12,499 | 0 (0.0%) | 16 (9.5%) |
| $12,500 to $14,999 | 7 (4.1%) | 12 (7.1%) |
| $15,000 to $17,499 | 14 (8.2%) | 0 (0.0%) |
| $17,500 to $19,999 | 13 (7.6%) | 7 (4.1%) |
| $20,000 to $22,499 | 4 (2.3%) | 0 (0.0%) |
| $22,500 to $24,999 | 3 (1.8%) | 5 (3.0%) |
| $25,000 to $29,999 | 13 (7.6%) | 1 (0.6%) |
| $30,000 to $34,999 | 2 (1.2%) | 17 (10.1%) |
| $35,000 to $39,999 | 9 (5.3%) | 18 (10.6%) |
| $40,000 to $44,999 | 11 (6.4%) | 10 (5.9%) |
| $45,000 to $49,999 | 12 (7.0%) | 10 (5.9%) |
| $50,000 to $54,999 | 0 (0.0%) | 11 (6.5%) |
| $55,000 to $64,999 | 2 (1.2%) | 0 (0.0%) |
| $65,000 to $74,999 | 8 (4.7%) | 5 (3.0%) |
| $75,000 to $99,999 | 41 (24.0%) | 6 (3.5%) |
| $100,000+ | 0 (0.0%) | 3 (1.8%) |
| Total | 171 (100.0%) | 169 (100.0%) |
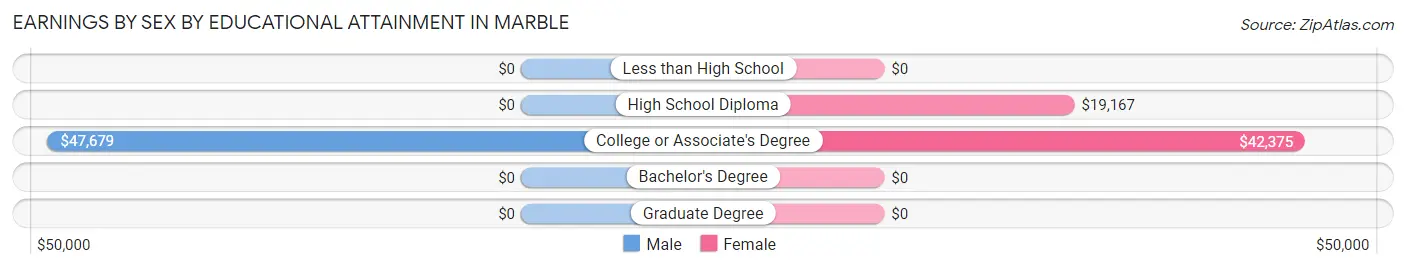
Earnings by Sex by Educational Attainment in Marble
Average earnings in Marble are $36,528 for men and $34,327 for women, a difference of 6.0%. Men with an educational attainment of college or associate's degree enjoy the highest average annual earnings of $47,679, while those with college or associate's degree education earn the least with $47,679. Women with an educational attainment of college or associate's degree earn the most with the average annual earnings of $42,375, while those with high school diploma education have the smallest earnings of $19,167.
| Educational Attainment | Male Income | Female Income |
| Less than High School | - | - |
| High School Diploma | - | - |
| College or Associate's Degree | $47,679 | $42,375 |
| Bachelor's Degree | - | - |
| Graduate Degree | - | - |
| Total | $36,528 | $34,327 |
Family Income in Marble
Family Income Brackets in Marble
According to the Marble family income data, there are 39 families falling into the $75,000 to $99,999 income range, which is the most common income bracket and makes up 26.2% of all families.
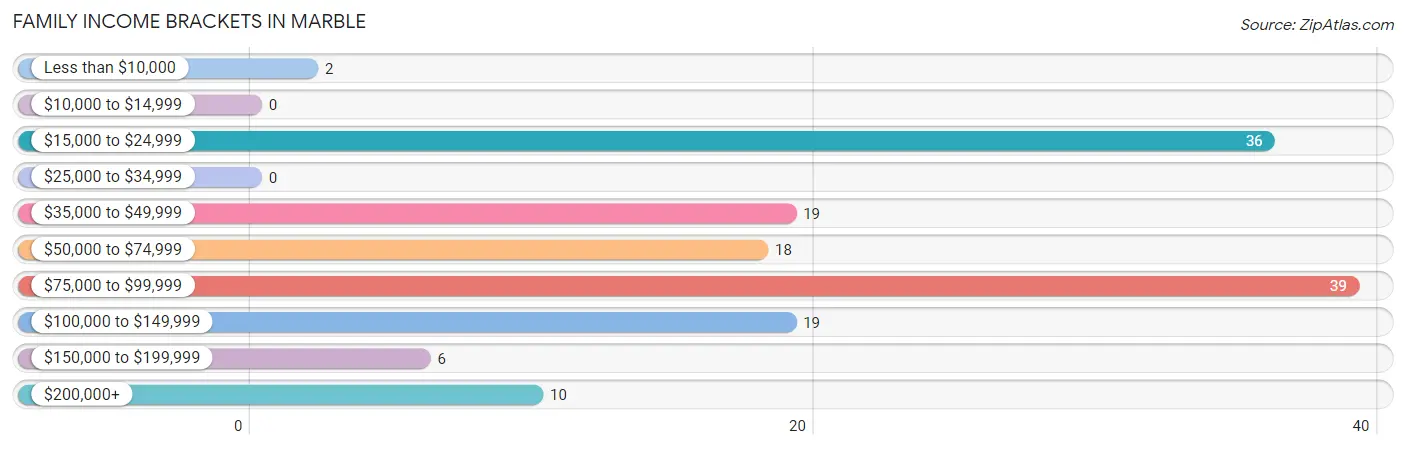
| Income Bracket | # Families | % Families |
| Less than $10,000 | 2 | 1.3% |
| $10,000 to $14,999 | 0 | 0.0% |
| $15,000 to $24,999 | 36 | 24.2% |
| $25,000 to $34,999 | 0 | 0.0% |
| $35,000 to $49,999 | 19 | 12.8% |
| $50,000 to $74,999 | 18 | 12.1% |
| $75,000 to $99,999 | 39 | 26.2% |
| $100,000 to $149,999 | 19 | 12.8% |
| $150,000 to $199,999 | 6 | 4.0% |
| $200,000+ | 10 | 6.7% |
Family Income by Famaliy Size in Marble
3-person families (41 | 27.5%) account for the highest median family income in Marble with $85,662 per family, while 3-person families (41 | 27.5%) have the highest median income of $28,554 per family member.
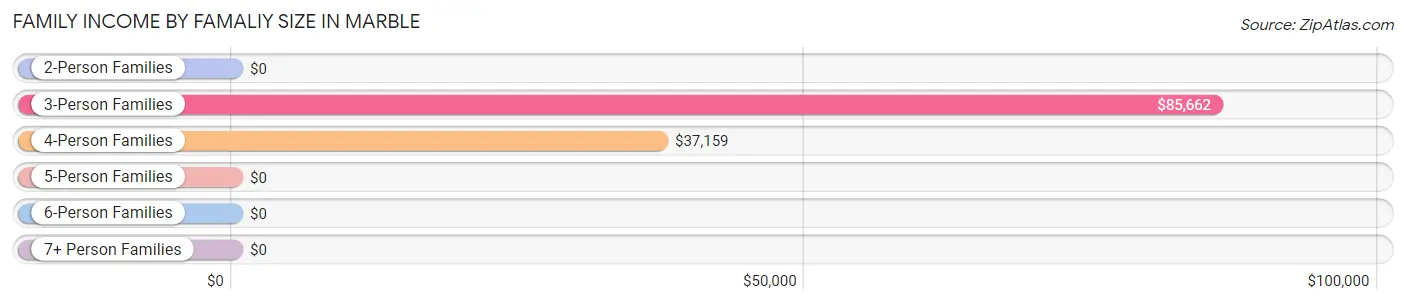
| Income Bracket | # Families | Median Income |
| 2-Person Families | 73 (49.0%) | $0 |
| 3-Person Families | 41 (27.5%) | $85,662 |
| 4-Person Families | 23 (15.4%) | $37,159 |
| 5-Person Families | 12 (8.1%) | $0 |
| 6-Person Families | 0 (0.0%) | $0 |
| 7+ Person Families | 0 (0.0%) | $0 |
| Total | 149 (100.0%) | $74,583 |
Family Income by Number of Earners in Marble
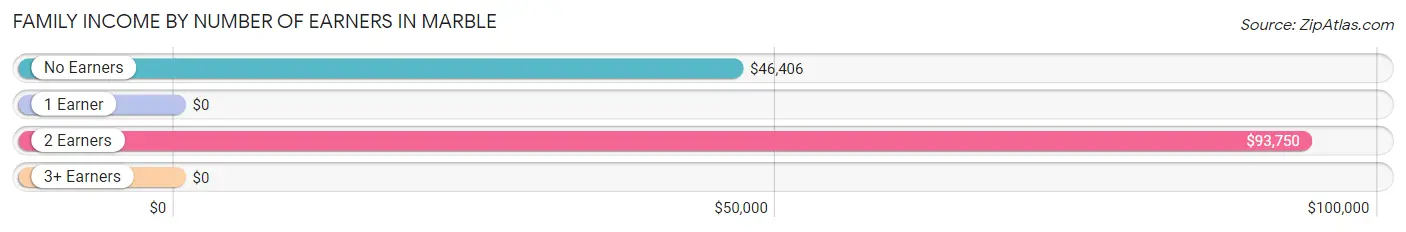
| Number of Earners | # Families | Median Income |
| No Earners | 21 (14.1%) | $46,406 |
| 1 Earner | 40 (26.9%) | $0 |
| 2 Earners | 61 (40.9%) | $93,750 |
| 3+ Earners | 27 (18.1%) | $0 |
| Total | 149 (100.0%) | $74,583 |
Household Income in Marble
Household Income Brackets in Marble
With 47 households falling in the category, the $50,000 to $74,999 income range is the most frequent in Marble, accounting for 18.7% of all households. In contrast, only 6 households (2.4%) fall into the $150,000 to $199,999 income bracket, making it the least populous group.
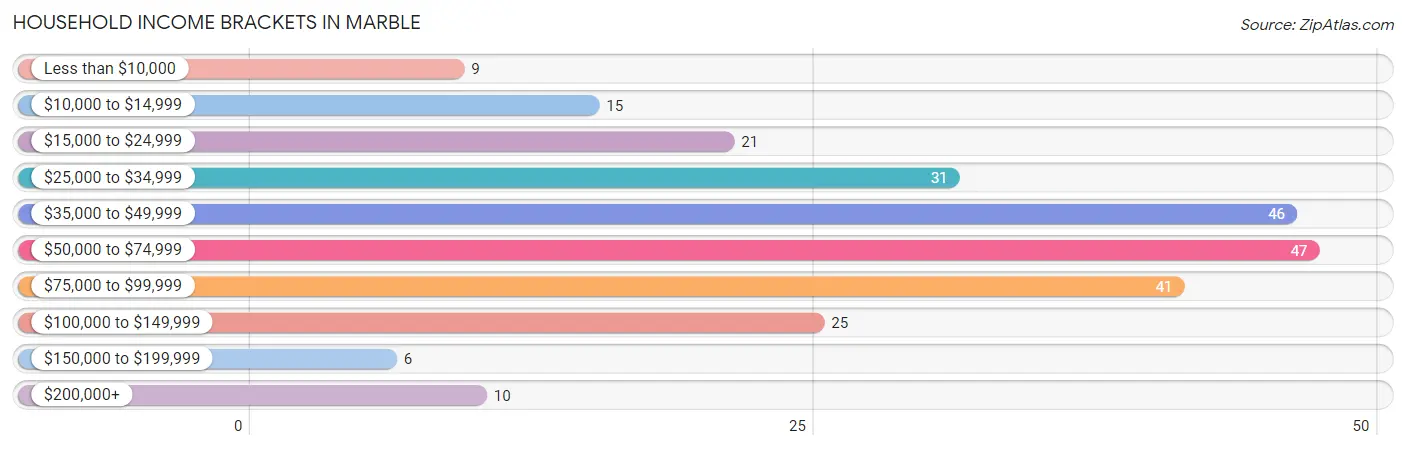
| Income Bracket | # Households | % Households |
| Less than $10,000 | 9 | 3.6% |
| $10,000 to $14,999 | 15 | 6.0% |
| $15,000 to $24,999 | 21 | 8.4% |
| $25,000 to $34,999 | 31 | 12.4% |
| $35,000 to $49,999 | 46 | 18.3% |
| $50,000 to $74,999 | 47 | 18.7% |
| $75,000 to $99,999 | 41 | 16.3% |
| $100,000 to $149,999 | 25 | 10.0% |
| $150,000 to $199,999 | 6 | 2.4% |
| $200,000+ | 10 | 4.0% |
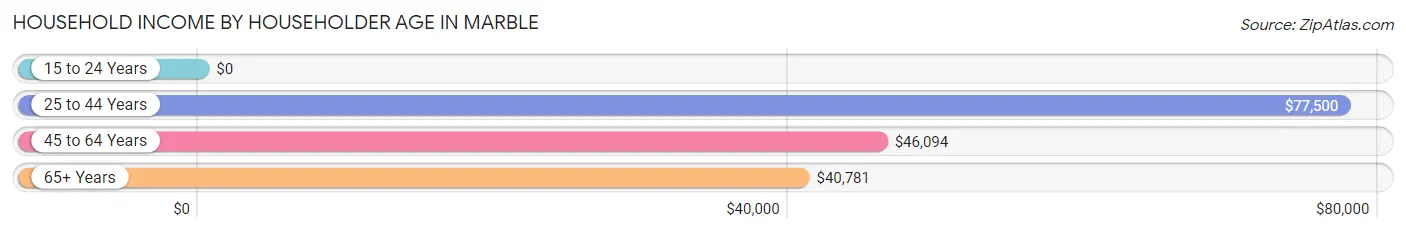
Household Income by Householder Age in Marble
The median household income in Marble is $51,094, with the highest median household income of $77,500 found in the 25 to 44 years age bracket for the primary householder. A total of 74 households (29.5%) fall into this category.
| Income Bracket | # Households | Median Income |
| 15 to 24 Years | 0 (0.0%) | $0 |
| 25 to 44 Years | 74 (29.5%) | $77,500 |
| 45 to 64 Years | 126 (50.2%) | $46,094 |
| 65+ Years | 51 (20.3%) | $40,781 |
| Total | 251 (100.0%) | $51,094 |
Poverty in Marble
Income Below Poverty by Sex and Age in Marble
With 19.5% poverty level for males and 23.0% for females among the residents of Marble, 12 to 14 year old males and under 5 year old females are the most vulnerable to poverty, with 9 males (42.9%) and 11 females (100.0%) in their respective age groups living below the poverty level.
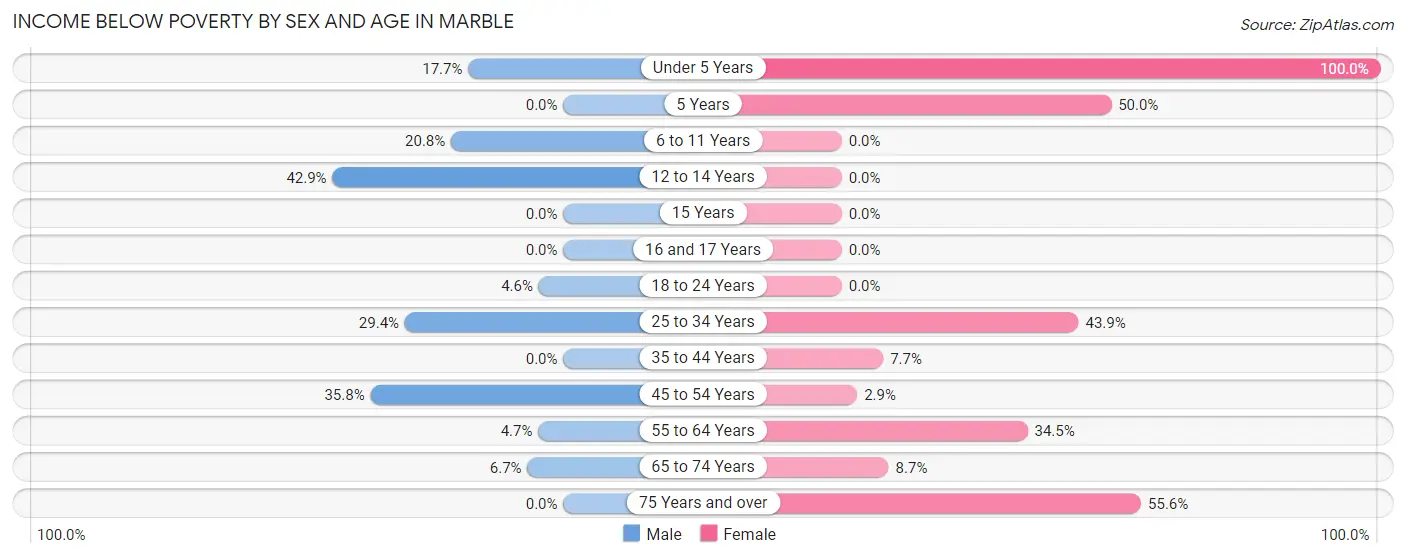
| Age Bracket | Male | Female |
| Under 5 Years | 3 (17.6%) | 11 (100.0%) |
| 5 Years | 0 (0.0%) | 2 (50.0%) |
| 6 to 11 Years | 5 (20.8%) | 0 (0.0%) |
| 12 to 14 Years | 9 (42.9%) | 0 (0.0%) |
| 15 Years | 0 (0.0%) | 0 (0.0%) |
| 16 and 17 Years | 0 (0.0%) | 0 (0.0%) |
| 18 to 24 Years | 2 (4.5%) | 0 (0.0%) |
| 25 to 34 Years | 15 (29.4%) | 29 (43.9%) |
| 35 to 44 Years | 0 (0.0%) | 2 (7.7%) |
| 45 to 54 Years | 29 (35.8%) | 1 (2.9%) |
| 55 to 64 Years | 2 (4.6%) | 10 (34.5%) |
| 65 to 74 Years | 2 (6.7%) | 2 (8.7%) |
| 75 Years and over | 0 (0.0%) | 5 (55.6%) |
| Total | 67 (19.5%) | 62 (23.0%) |
Income Above Poverty by Sex and Age in Marble
According to the poverty statistics in Marble, males aged 15 years and females aged 6 to 11 years are the age groups that are most secure financially, with 100.0% of males and 100.0% of females in these age groups living above the poverty line.
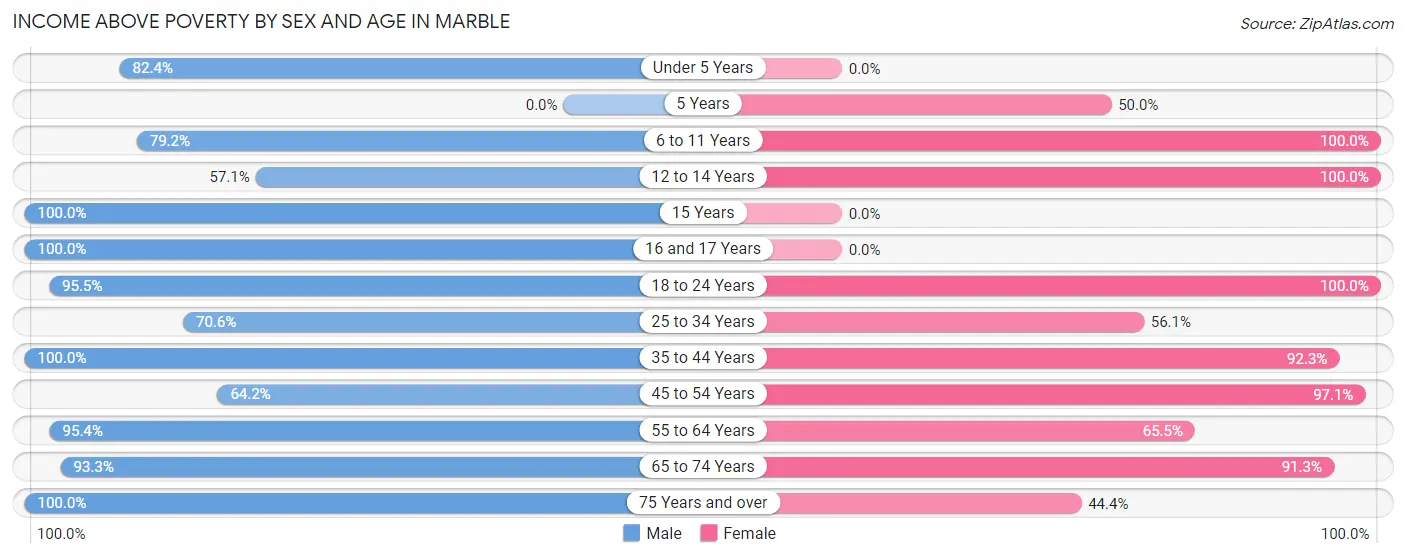
| Age Bracket | Male | Female |
| Under 5 Years | 14 (82.4%) | 0 (0.0%) |
| 5 Years | 0 (0.0%) | 2 (50.0%) |
| 6 to 11 Years | 19 (79.2%) | 6 (100.0%) |
| 12 to 14 Years | 12 (57.1%) | 2 (100.0%) |
| 15 Years | 5 (100.0%) | 0 (0.0%) |
| 16 and 17 Years | 3 (100.0%) | 0 (0.0%) |
| 18 to 24 Years | 42 (95.5%) | 59 (100.0%) |
| 25 to 34 Years | 36 (70.6%) | 37 (56.1%) |
| 35 to 44 Years | 15 (100.0%) | 24 (92.3%) |
| 45 to 54 Years | 52 (64.2%) | 34 (97.1%) |
| 55 to 64 Years | 41 (95.4%) | 19 (65.5%) |
| 65 to 74 Years | 28 (93.3%) | 21 (91.3%) |
| 75 Years and over | 10 (100.0%) | 4 (44.4%) |
| Total | 277 (80.5%) | 208 (77.0%) |
Income Below Poverty Among Married-Couple Families in Marble
The poverty statistics for married-couple families in Marble show that 2.1% or 2 of the total 96 families live below the poverty line. Families with no children have the highest poverty rate of 3.1%, comprising of 2 families. On the other hand, families with 1 or 2 children have the lowest poverty rate of 0.0%, which includes 0 families.
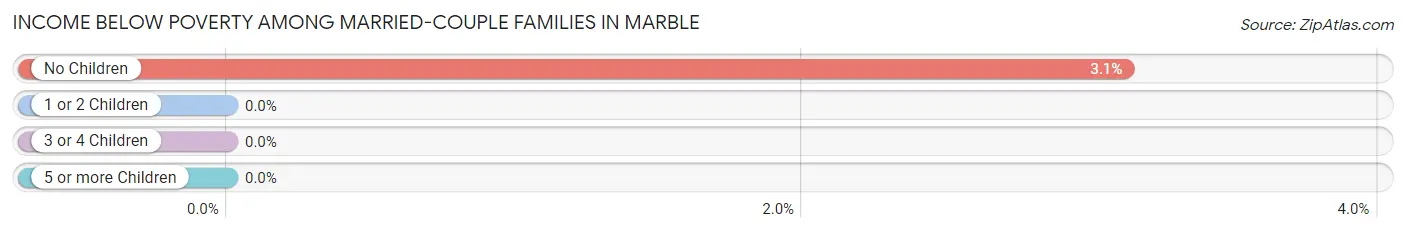
| Children | Above Poverty | Below Poverty |
| No Children | 62 (96.9%) | 2 (3.1%) |
| 1 or 2 Children | 30 (100.0%) | 0 (0.0%) |
| 3 or 4 Children | 2 (100.0%) | 0 (0.0%) |
| 5 or more Children | 0 (0.0%) | 0 (0.0%) |
| Total | 94 (97.9%) | 2 (2.1%) |
Income Below Poverty Among Single-Parent Households in Marble
According to the poverty data in Marble, 35.3% or 12 single-father households and 47.4% or 9 single-mother households are living below the poverty line. Among single-father households, those with no children have the highest poverty rate, with 9 households (36.0%) experiencing poverty. Likewise, among single-mother households, those with 3 or 4 children have the highest poverty rate, with 2 households (100.0%) falling below the poverty line.
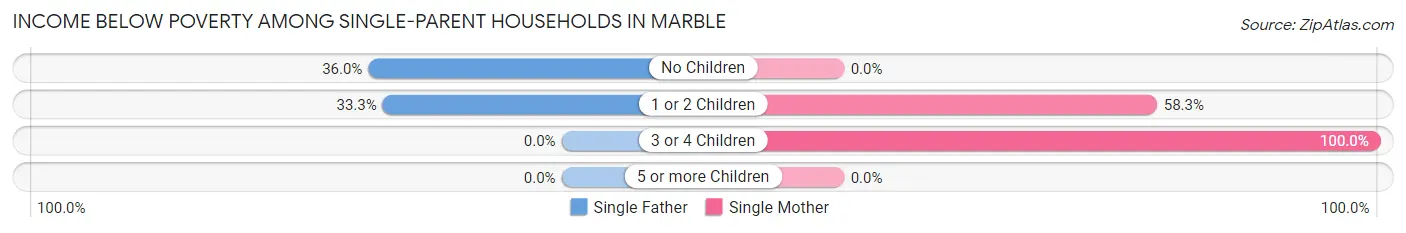
| Children | Single Father | Single Mother |
| No Children | 9 (36.0%) | 0 (0.0%) |
| 1 or 2 Children | 3 (33.3%) | 7 (58.3%) |
| 3 or 4 Children | 0 (0.0%) | 2 (100.0%) |
| 5 or more Children | 0 (0.0%) | 0 (0.0%) |
| Total | 12 (35.3%) | 9 (47.4%) |
Income Below Poverty Among Married-Couple vs Single-Parent Households in Marble
The poverty data for Marble shows that 2 of the married-couple family households (2.1%) and 21 of the single-parent households (39.6%) are living below the poverty level. Within the married-couple family households, those with no children have the highest poverty rate, with 2 households (3.1%) falling below the poverty line. Among the single-parent households, those with 3 or 4 children have the highest poverty rate, with 2 household (100.0%) living below poverty.
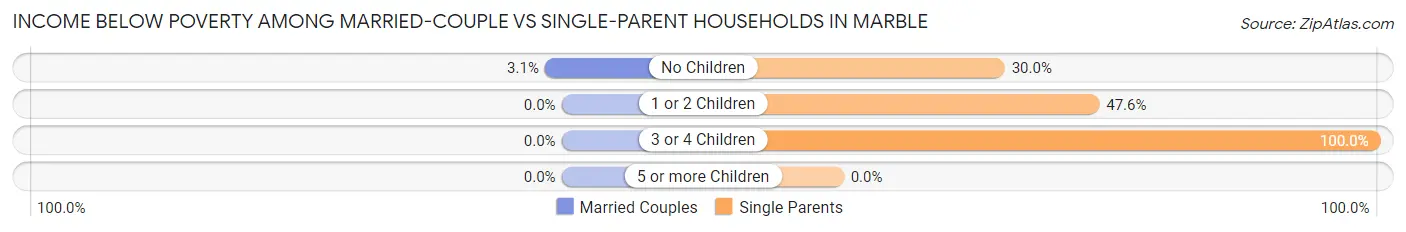
| Children | Married-Couple Families | Single-Parent Households |
| No Children | 2 (3.1%) | 9 (30.0%) |
| 1 or 2 Children | 0 (0.0%) | 10 (47.6%) |
| 3 or 4 Children | 0 (0.0%) | 2 (100.0%) |
| 5 or more Children | 0 (0.0%) | 0 (0.0%) |
| Total | 2 (2.1%) | 21 (39.6%) |
Race in Marble
The most populous races in Marble are White / Caucasian (551 | 89.7%), Two or more Races (27 | 4.4%), and Asian (14 | 2.3%).
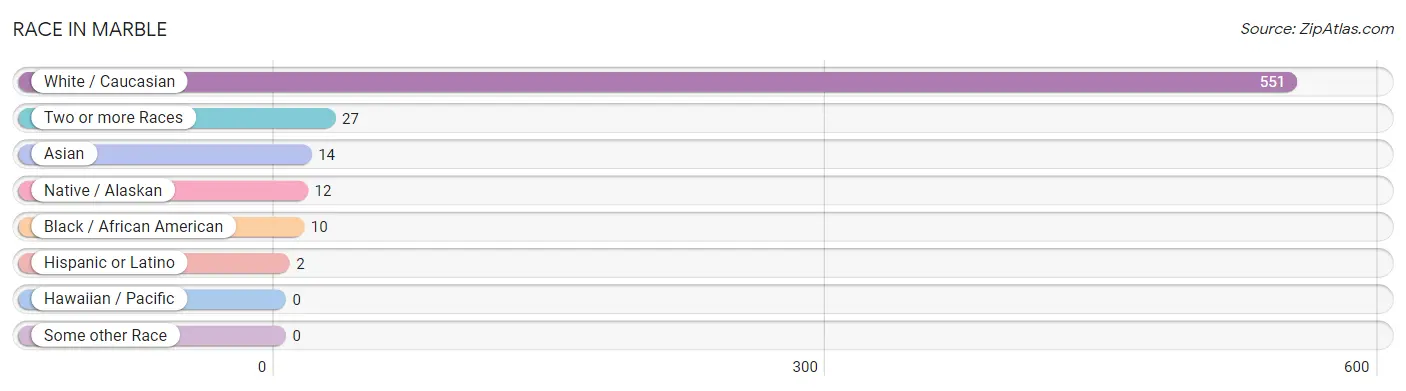
| Race | # Population | % Population |
| Asian | 14 | 2.3% |
| Black / African American | 10 | 1.6% |
| Hawaiian / Pacific | 0 | 0.0% |
| Hispanic or Latino | 2 | 0.3% |
| Native / Alaskan | 12 | 1.9% |
| White / Caucasian | 551 | 89.7% |
| Two or more Races | 27 | 4.4% |
| Some other Race | 0 | 0.0% |
| Total | 614 | 100.0% |
Ancestry in Marble
The most populous ancestries reported in Marble are German (162 | 26.4%), English (74 | 12.0%), American (63 | 10.3%), Norwegian (55 | 9.0%), and Finnish (52 | 8.5%), together accounting for 66.1% of all Marble residents.
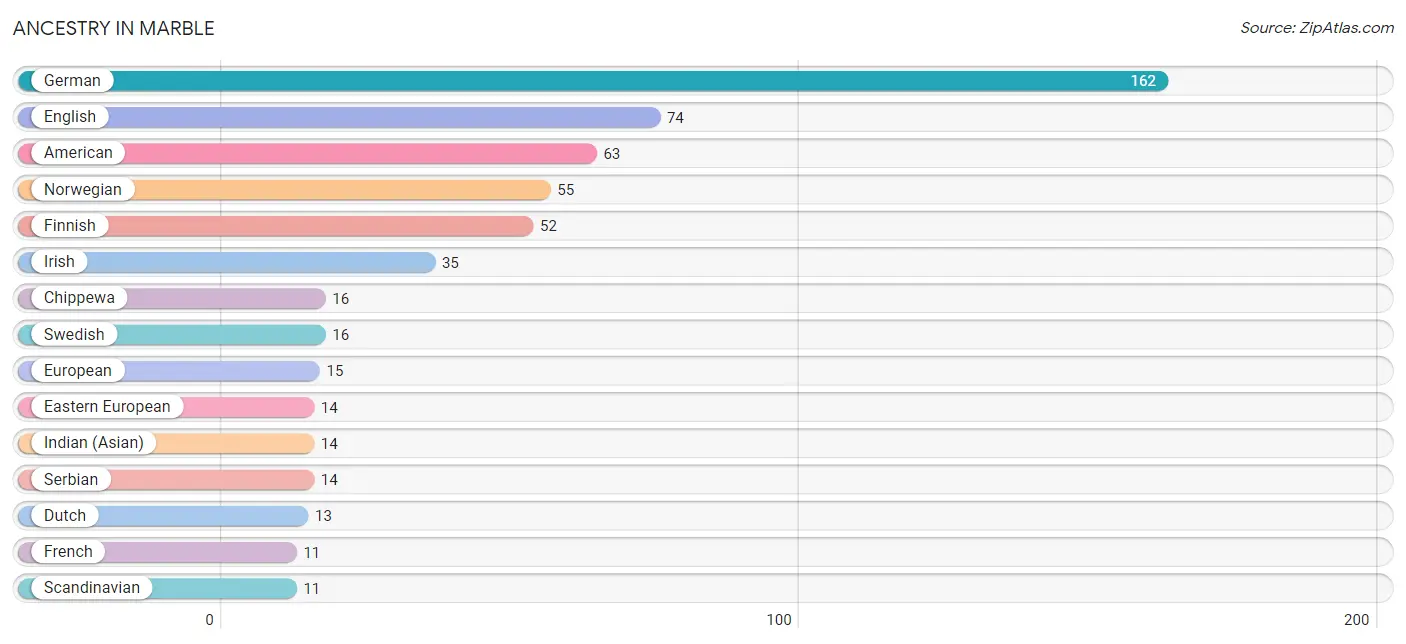
| Ancestry | # Population | % Population |
| American | 63 | 10.3% |
| Austrian | 4 | 0.6% |
| Chippewa | 16 | 2.6% |
| Croatian | 6 | 1.0% |
| Czech | 2 | 0.3% |
| Dutch | 13 | 2.1% |
| Eastern European | 14 | 2.3% |
| English | 74 | 12.0% |
| European | 15 | 2.4% |
| Finnish | 52 | 8.5% |
| French | 11 | 1.8% |
| German | 162 | 26.4% |
| Indian (Asian) | 14 | 2.3% |
| Iranian | 2 | 0.3% |
| Irish | 35 | 5.7% |
| Italian | 10 | 1.6% |
| Mexican | 2 | 0.3% |
| Norwegian | 55 | 9.0% |
| Russian | 5 | 0.8% |
| Scandinavian | 11 | 1.8% |
| Serbian | 14 | 2.3% |
| Swedish | 16 | 2.6% |
| Swiss | 6 | 1.0% |
| Welsh | 9 | 1.5% | View All 24 Rows |
Immigrants in Marble

| Immigration Origin | # Population | % Population | View All 0 Rows |
Sex and Age in Marble
Sex and Age in Marble
The most populous age groups in Marble are 50 to 54 Years (59 | 17.2%) for men and 25 to 29 Years (49 | 18.1%) for women.
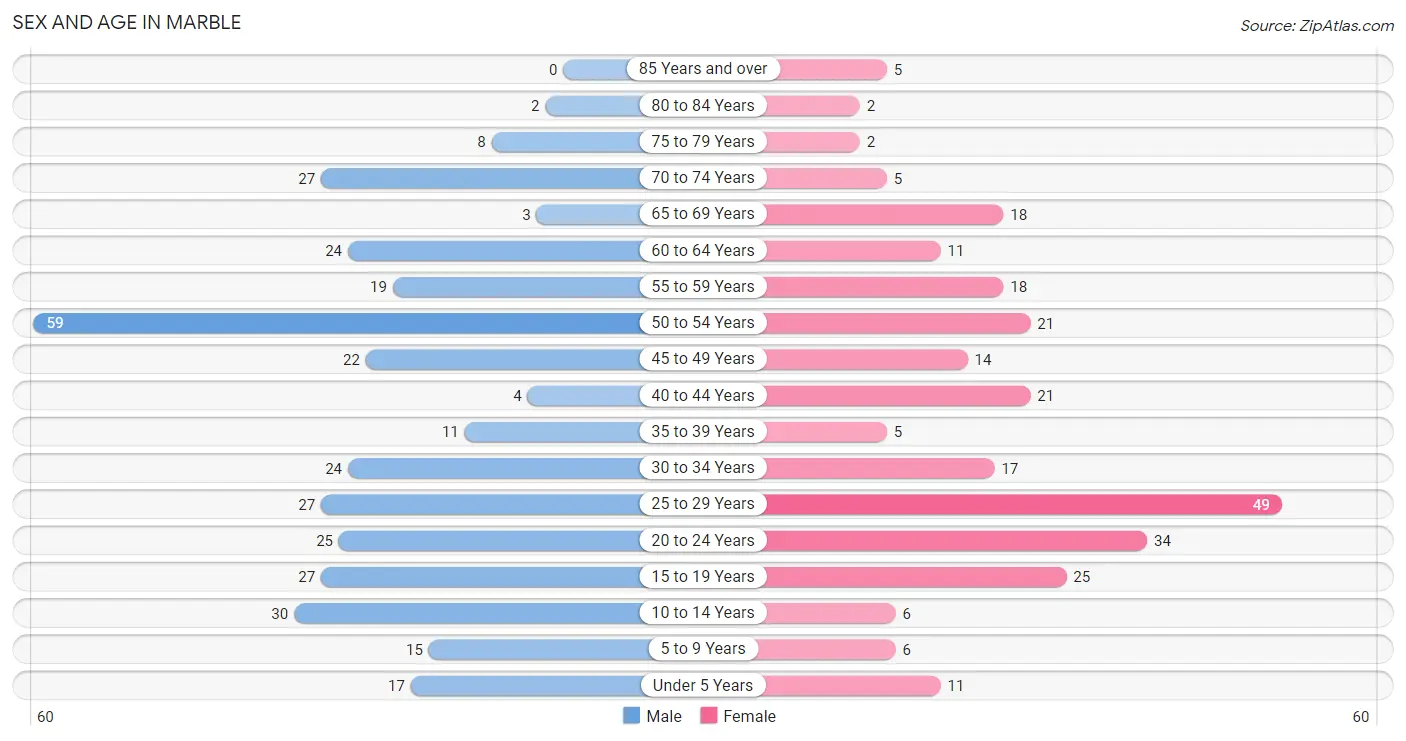
| Age Bracket | Male | Female |
| Under 5 Years | 17 (4.9%) | 11 (4.1%) |
| 5 to 9 Years | 15 (4.4%) | 6 (2.2%) |
| 10 to 14 Years | 30 (8.7%) | 6 (2.2%) |
| 15 to 19 Years | 27 (7.9%) | 25 (9.3%) |
| 20 to 24 Years | 25 (7.3%) | 34 (12.6%) |
| 25 to 29 Years | 27 (7.9%) | 49 (18.1%) |
| 30 to 34 Years | 24 (7.0%) | 17 (6.3%) |
| 35 to 39 Years | 11 (3.2%) | 5 (1.8%) |
| 40 to 44 Years | 4 (1.2%) | 21 (7.8%) |
| 45 to 49 Years | 22 (6.4%) | 14 (5.2%) |
| 50 to 54 Years | 59 (17.2%) | 21 (7.8%) |
| 55 to 59 Years | 19 (5.5%) | 18 (6.7%) |
| 60 to 64 Years | 24 (7.0%) | 11 (4.1%) |
| 65 to 69 Years | 3 (0.9%) | 18 (6.7%) |
| 70 to 74 Years | 27 (7.9%) | 5 (1.8%) |
| 75 to 79 Years | 8 (2.3%) | 2 (0.7%) |
| 80 to 84 Years | 2 (0.6%) | 2 (0.7%) |
| 85 Years and over | 0 (0.0%) | 5 (1.8%) |
| Total | 344 (100.0%) | 270 (100.0%) |
Families and Households in Marble
Median Family Size in Marble
The median family size in Marble is 2.98 persons per family, with single female/mother families (19 | 12.8%) accounting for the largest median family size of 3.68 persons per family. On the other hand, married-couple families (96 | 64.4%) represent the smallest median family size with 2.83 persons per family.
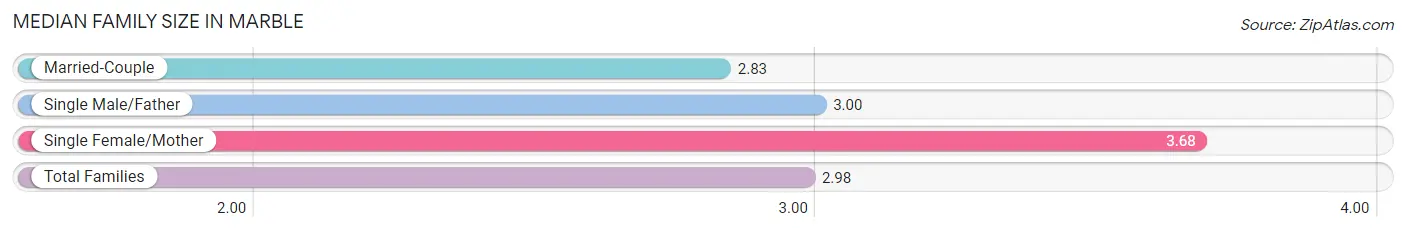
| Family Type | # Families | Family Size |
| Married-Couple | 96 (64.4%) | 2.83 |
| Single Male/Father | 34 (22.8%) | 3.00 |
| Single Female/Mother | 19 (12.8%) | 3.68 |
| Total Families | 149 (100.0%) | 2.98 |
Median Household Size in Marble
The median household size in Marble is 2.43 persons per household, with single female/mother households (19 | 7.6%) accounting for the largest median household size of 4.58 persons per household. non-family households (102 | 40.6%) represent the smallest median household size with 1.21 persons per household.
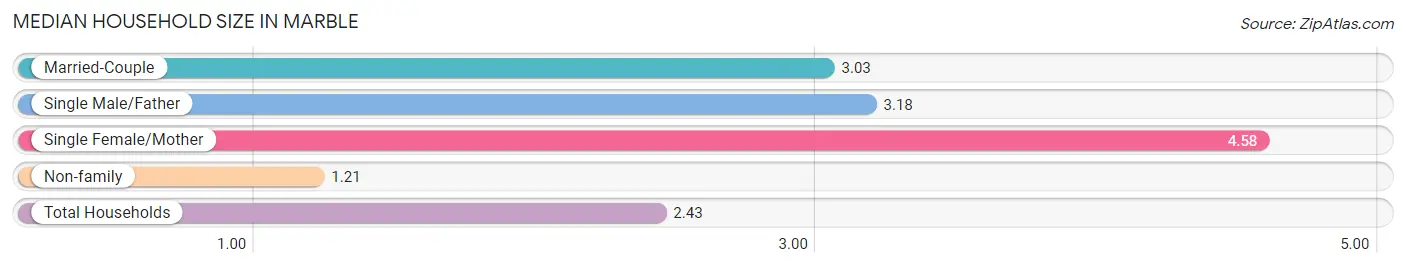
| Household Type | # Households | Household Size |
| Married-Couple | 96 (38.3%) | 3.03 |
| Single Male/Father | 34 (13.6%) | 3.18 |
| Single Female/Mother | 19 (7.6%) | 4.58 |
| Non-family | 102 (40.6%) | 1.21 |
| Total Households | 251 (100.0%) | 2.43 |
Household Size by Marriage Status in Marble
Out of a total of 251 households in Marble, 149 (59.4%) are family households, while 102 (40.6%) are nonfamily households. The most numerous type of family households are 2-person households, comprising 60, and the most common type of nonfamily households are 1-person households, comprising 83.
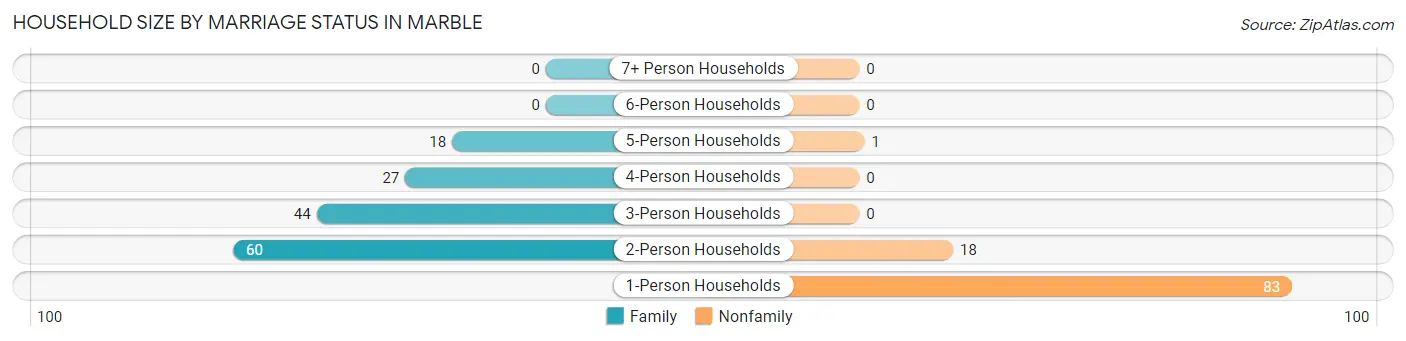
| Household Size | Family Households | Nonfamily Households |
| 1-Person Households | - | 83 (33.1%) |
| 2-Person Households | 60 (23.9%) | 18 (7.2%) |
| 3-Person Households | 44 (17.5%) | 0 (0.0%) |
| 4-Person Households | 27 (10.8%) | 0 (0.0%) |
| 5-Person Households | 18 (7.2%) | 1 (0.4%) |
| 6-Person Households | 0 (0.0%) | 0 (0.0%) |
| 7+ Person Households | 0 (0.0%) | 0 (0.0%) |
| Total | 149 (59.4%) | 102 (40.6%) |
Female Fertility in Marble
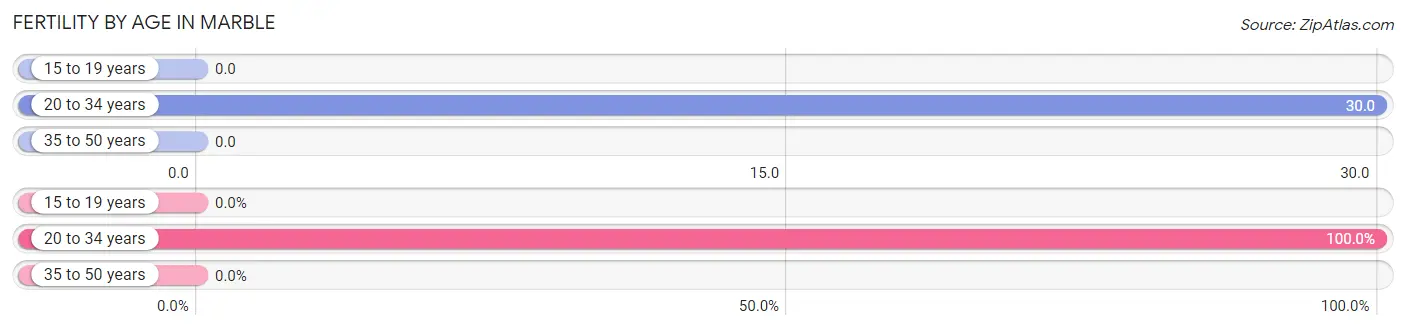
Fertility by Age in Marble
Average fertility rate in Marble is 17.0 births per 1,000 women. Women in the age bracket of 20 to 34 years have the highest fertility rate with 30.0 births per 1,000 women. Women in the age bracket of 20 to 34 years acount for 100.0% of all women with births.
| Age Bracket | Women with Births | Births / 1,000 Women |
| 15 to 19 years | 0 (0.0%) | 0.0 |
| 20 to 34 years | 3 (100.0%) | 30.0 |
| 35 to 50 years | 0 (0.0%) | 0.0 |
| Total | 3 (100.0%) | 17.0 |
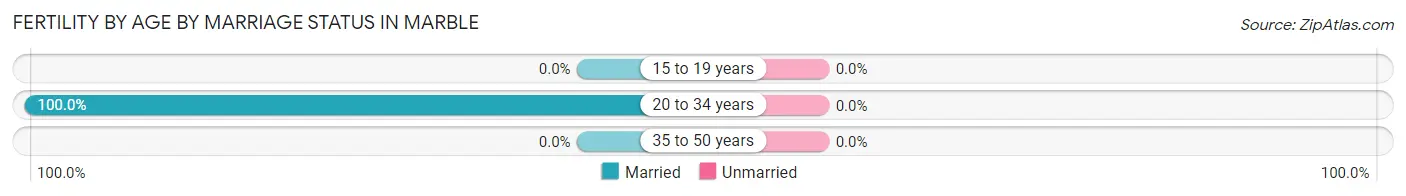
Fertility by Age by Marriage Status in Marble
| Age Bracket | Married | Unmarried |
| 15 to 19 years | 0 (0.0%) | 0 (0.0%) |
| 20 to 34 years | 3 (100.0%) | 0 (0.0%) |
| 35 to 50 years | 0 (0.0%) | 0 (0.0%) |
| Total | 3 (100.0%) | 0 (0.0%) |
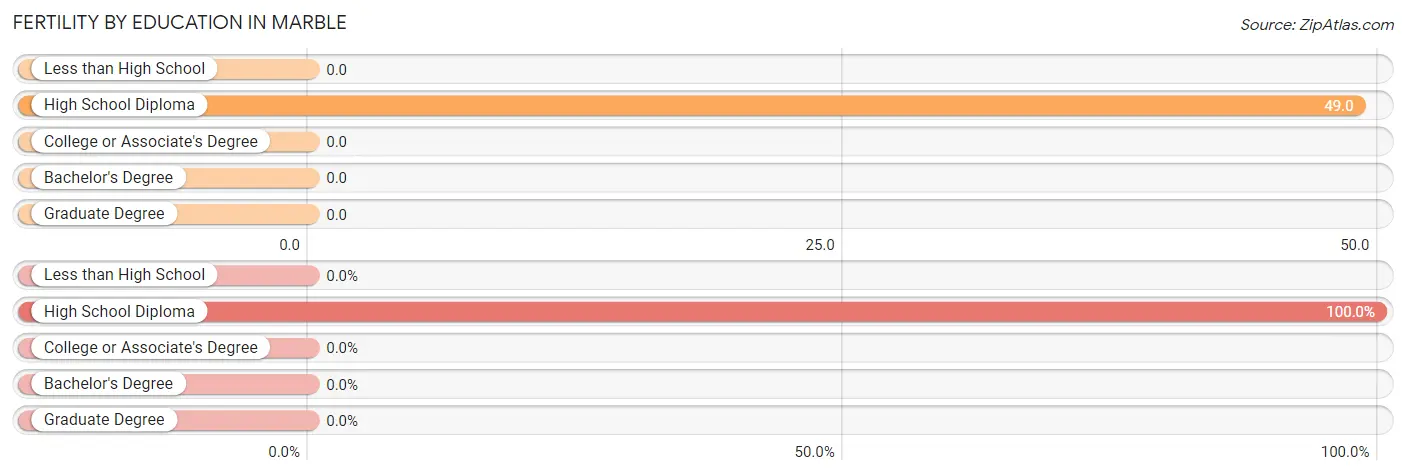
Fertility by Education in Marble
| Educational Attainment | Women with Births | Births / 1,000 Women |
| Less than High School | 0 (0.0%) | 0.0 |
| High School Diploma | 3 (100.0%) | 49.0 |
| College or Associate's Degree | 0 (0.0%) | 0.0 |
| Bachelor's Degree | 0 (0.0%) | 0.0 |
| Graduate Degree | 0 (0.0%) | 0.0 |
| Total | 3 (100.0%) | 17.0 |
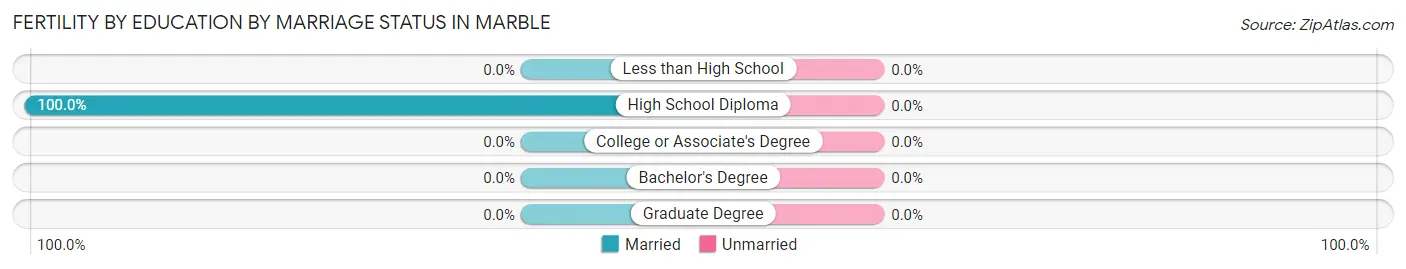
Fertility by Education by Marriage Status in Marble
| Educational Attainment | Married | Unmarried |
| Less than High School | 0 (0.0%) | 0 (0.0%) |
| High School Diploma | 3 (100.0%) | 0 (0.0%) |
| College or Associate's Degree | 0 (0.0%) | 0 (0.0%) |
| Bachelor's Degree | 0 (0.0%) | 0 (0.0%) |
| Graduate Degree | 0 (0.0%) | 0 (0.0%) |
| Total | 3 (100.0%) | 0 (0.0%) |
Employment Characteristics in Marble
Employment by Class of Employer in Marble
Among the 290 employed individuals in Marble, private company employees (208 | 71.7%), not-for-profit organizations (23 | 7.9%), and federal government employees (21 | 7.2%) make up the most common classes of employment.
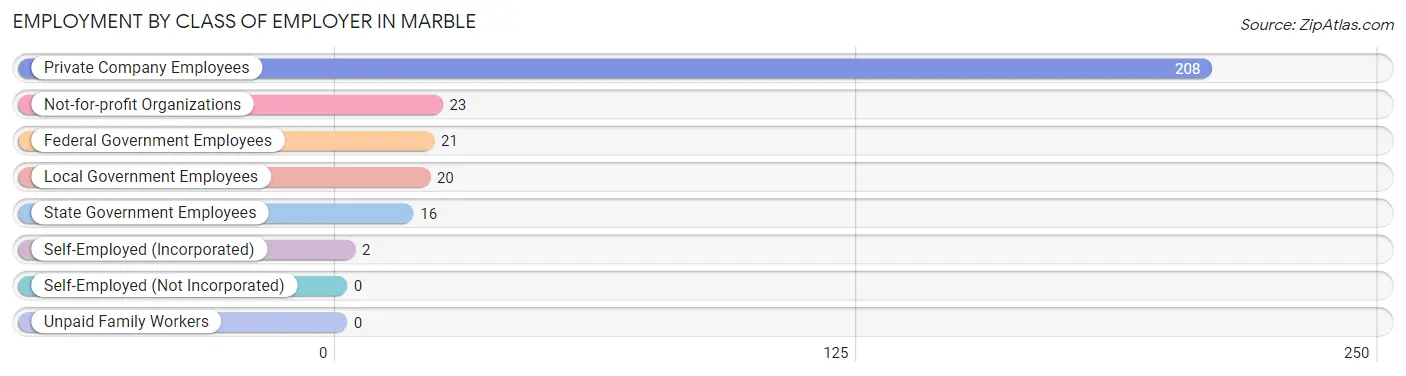
| Employer Class | # Employees | % Employees |
| Private Company Employees | 208 | 71.7% |
| Self-Employed (Incorporated) | 2 | 0.7% |
| Self-Employed (Not Incorporated) | 0 | 0.0% |
| Not-for-profit Organizations | 23 | 7.9% |
| Local Government Employees | 20 | 6.9% |
| State Government Employees | 16 | 5.5% |
| Federal Government Employees | 21 | 7.2% |
| Unpaid Family Workers | 0 | 0.0% |
| Total | 290 | 100.0% |
Employment Status by Age in Marble
According to the labor force statistics for Marble, out of the total population over 16 years of age (524), 62.6% or 328 individuals are in the labor force, with 7.3% or 24 of them unemployed. The age group with the highest labor force participation rate is 30 to 34 years, with 100.0% or 41 individuals in the labor force. Within the labor force, the 20 to 24 years age range has the highest percentage of unemployed individuals, with 22.8% or 13 of them being unemployed.
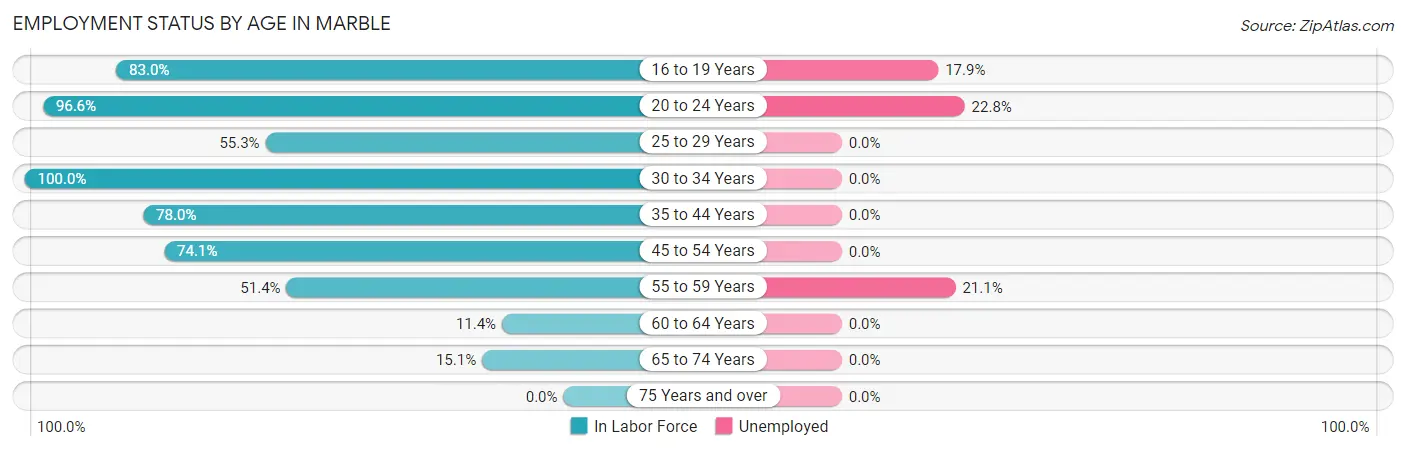
| Age Bracket | In Labor Force | Unemployed |
| 16 to 19 Years | 39 (83.0%) | 7 (17.9%) |
| 20 to 24 Years | 57 (96.6%) | 13 (22.8%) |
| 25 to 29 Years | 42 (55.3%) | 0 (0.0%) |
| 30 to 34 Years | 41 (100.0%) | 0 (0.0%) |
| 35 to 44 Years | 32 (78.0%) | 0 (0.0%) |
| 45 to 54 Years | 86 (74.1%) | 0 (0.0%) |
| 55 to 59 Years | 19 (51.4%) | 4 (21.1%) |
| 60 to 64 Years | 4 (11.4%) | 0 (0.0%) |
| 65 to 74 Years | 8 (15.1%) | 0 (0.0%) |
| 75 Years and over | 0 (0.0%) | 0 (0.0%) |
| Total | 328 (62.6%) | 24 (7.3%) |
Employment Status by Educational Attainment in Marble
According to labor force statistics for Marble, 64.7% of individuals (224) out of the total population between 25 and 64 years of age (346) are in the labor force, with 1.8% or 4 of them being unemployed. The group with the highest labor force participation rate are those with the educational attainment of bachelor's degree or higher, with 100.0% or 21 individuals in the labor force. Within the labor force, individuals with bachelor's degree or higher education have the highest percentage of unemployment, with 19.0% or 4 of them being unemployed.
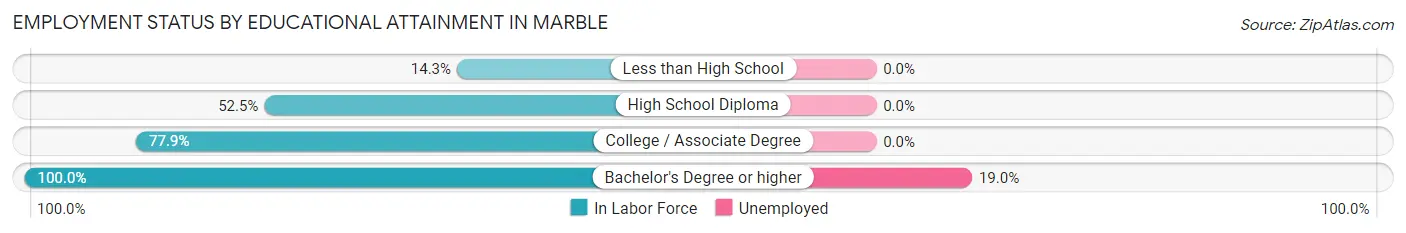
| Educational Attainment | In Labor Force | Unemployed |
| Less than High School | 2 (14.3%) | 0 (0.0%) |
| High School Diploma | 85 (52.5%) | 0 (0.0%) |
| College / Associate Degree | 116 (77.9%) | 0 (0.0%) |
| Bachelor's Degree or higher | 21 (100.0%) | 4 (19.0%) |
| Total | 224 (64.7%) | 6 (1.8%) |
Employment Occupations by Sex in Marble
Management, Business, Science and Arts Occupations
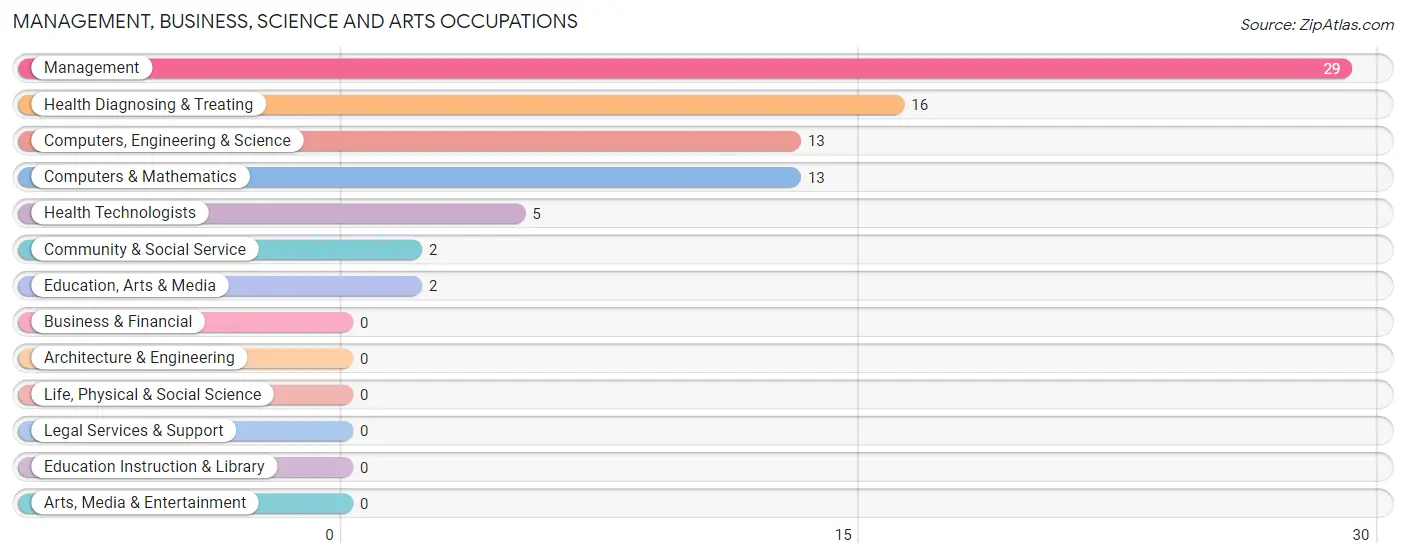
The most common Management, Business, Science and Arts occupations in Marble are Management (29 | 9.5%), Health Diagnosing & Treating (16 | 5.3%), Computers, Engineering & Science (13 | 4.3%), Computers & Mathematics (13 | 4.3%), and Health Technologists (5 | 1.6%).
Management, Business, Science and Arts Occupations by Sex
Within the Management, Business, Science and Arts occupations in Marble, the most male-oriented occupations are Computers, Engineering & Science (100.0%), Computers & Mathematics (100.0%), and Management (51.7%), while the most female-oriented occupations are Community & Social Service (100.0%), Education, Arts & Media (100.0%), and Health Diagnosing & Treating (100.0%).
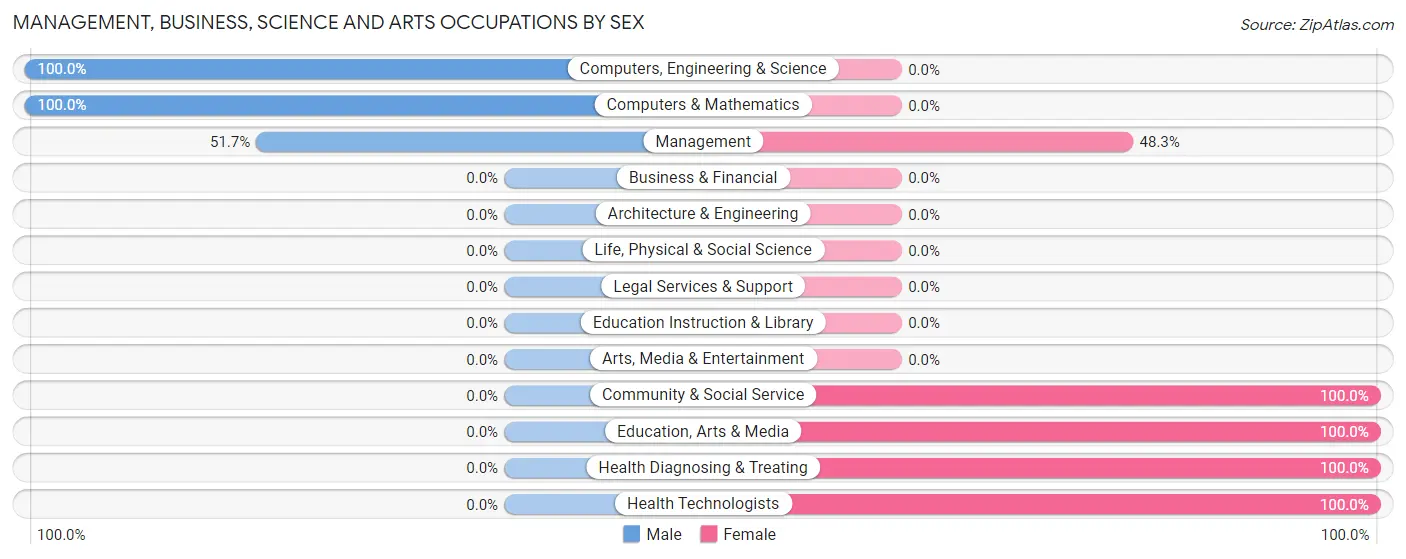
| Occupation | Male | Female |
| Management | 15 (51.7%) | 14 (48.3%) |
| Business & Financial | 0 (0.0%) | 0 (0.0%) |
| Computers, Engineering & Science | 13 (100.0%) | 0 (0.0%) |
| Computers & Mathematics | 13 (100.0%) | 0 (0.0%) |
| Architecture & Engineering | 0 (0.0%) | 0 (0.0%) |
| Life, Physical & Social Science | 0 (0.0%) | 0 (0.0%) |
| Community & Social Service | 0 (0.0%) | 2 (100.0%) |
| Education, Arts & Media | 0 (0.0%) | 2 (100.0%) |
| Legal Services & Support | 0 (0.0%) | 0 (0.0%) |
| Education Instruction & Library | 0 (0.0%) | 0 (0.0%) |
| Arts, Media & Entertainment | 0 (0.0%) | 0 (0.0%) |
| Health Diagnosing & Treating | 0 (0.0%) | 16 (100.0%) |
| Health Technologists | 0 (0.0%) | 5 (100.0%) |
| Total (Category) | 28 (46.7%) | 32 (53.3%) |
| Total (Overall) | 139 (45.7%) | 165 (54.3%) |
Services Occupations
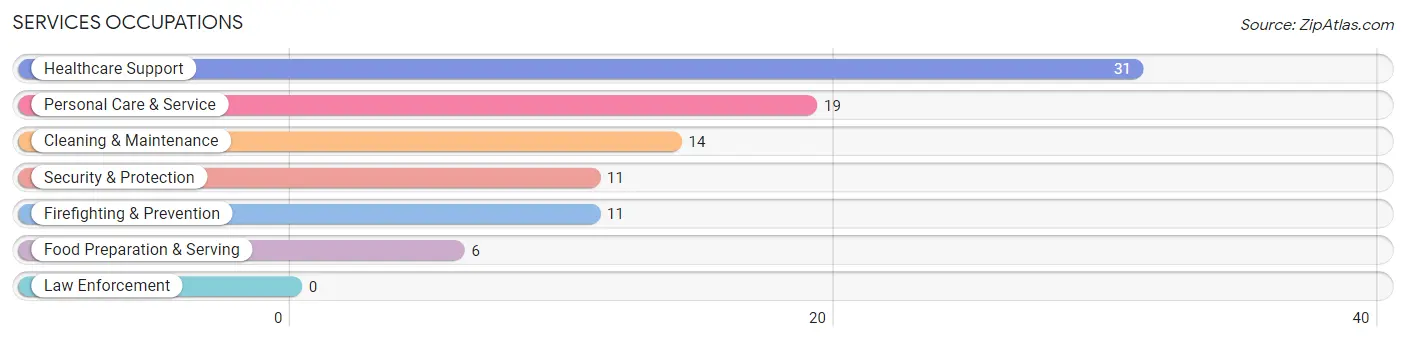
The most common Services occupations in Marble are Healthcare Support (31 | 10.2%), Personal Care & Service (19 | 6.2%), Cleaning & Maintenance (14 | 4.6%), Security & Protection (11 | 3.6%), and Firefighting & Prevention (11 | 3.6%).
Services Occupations by Sex
Within the Services occupations in Marble, the most male-oriented occupations are Security & Protection (100.0%), Firefighting & Prevention (100.0%), and Personal Care & Service (89.5%), while the most female-oriented occupations are Healthcare Support (100.0%), Food Preparation & Serving (100.0%), and Cleaning & Maintenance (42.9%).
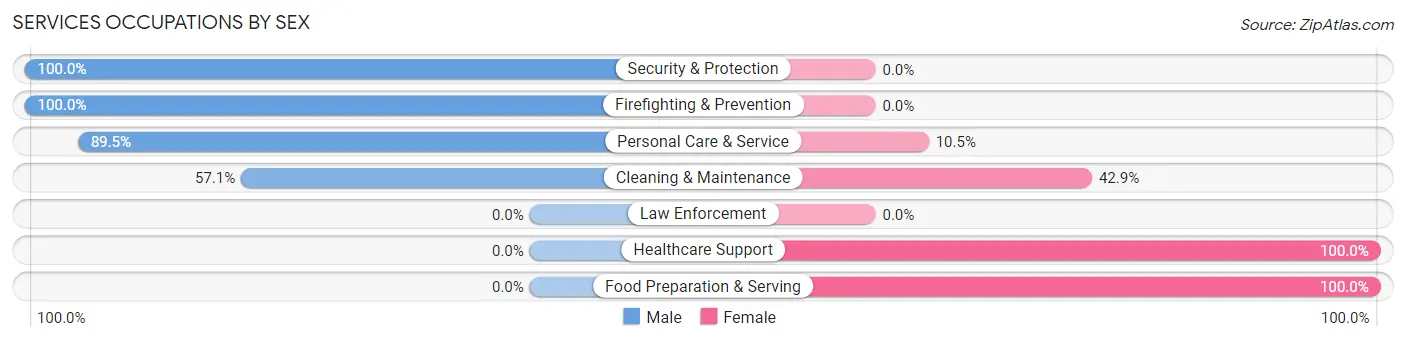
| Occupation | Male | Female |
| Healthcare Support | 0 (0.0%) | 31 (100.0%) |
| Security & Protection | 11 (100.0%) | 0 (0.0%) |
| Firefighting & Prevention | 11 (100.0%) | 0 (0.0%) |
| Law Enforcement | 0 (0.0%) | 0 (0.0%) |
| Food Preparation & Serving | 0 (0.0%) | 6 (100.0%) |
| Cleaning & Maintenance | 8 (57.1%) | 6 (42.9%) |
| Personal Care & Service | 17 (89.5%) | 2 (10.5%) |
| Total (Category) | 36 (44.4%) | 45 (55.6%) |
| Total (Overall) | 139 (45.7%) | 165 (54.3%) |
Sales and Office Occupations
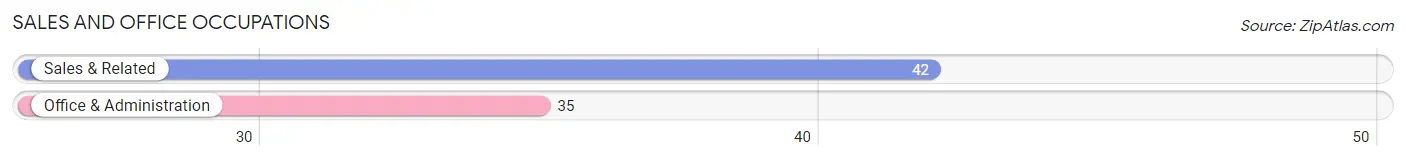
The most common Sales and Office occupations in Marble are Sales & Related (42 | 13.8%), and Office & Administration (35 | 11.5%).
Sales and Office Occupations by Sex
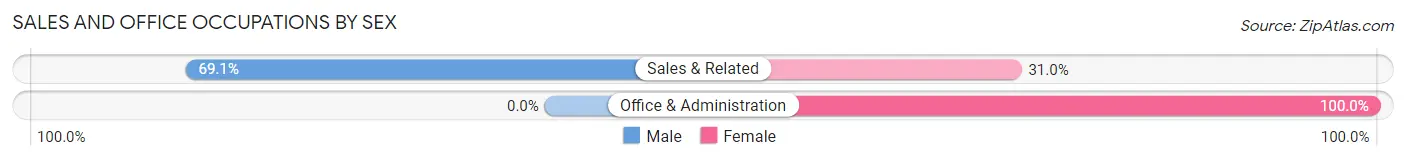
| Occupation | Male | Female |
| Sales & Related | 29 (69.1%) | 13 (30.9%) |
| Office & Administration | 0 (0.0%) | 35 (100.0%) |
| Total (Category) | 29 (37.7%) | 48 (62.3%) |
| Total (Overall) | 139 (45.7%) | 165 (54.3%) |
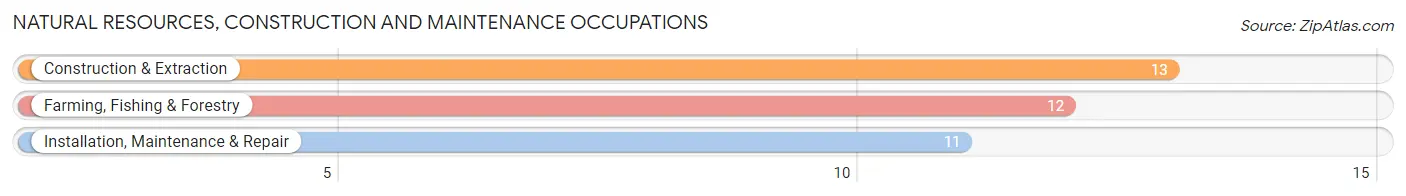
Natural Resources, Construction and Maintenance Occupations
The most common Natural Resources, Construction and Maintenance occupations in Marble are Construction & Extraction (13 | 4.3%), Farming, Fishing & Forestry (12 | 4.0%), and Installation, Maintenance & Repair (11 | 3.6%).
Natural Resources, Construction and Maintenance Occupations by Sex
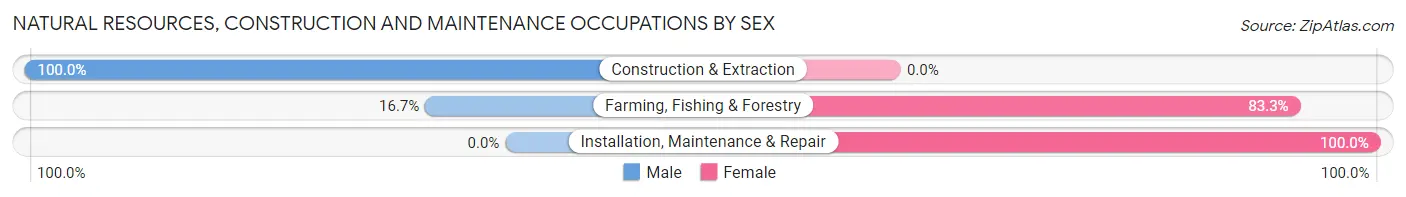
| Occupation | Male | Female |
| Farming, Fishing & Forestry | 2 (16.7%) | 10 (83.3%) |
| Construction & Extraction | 13 (100.0%) | 0 (0.0%) |
| Installation, Maintenance & Repair | 0 (0.0%) | 11 (100.0%) |
| Total (Category) | 15 (41.7%) | 21 (58.3%) |
| Total (Overall) | 139 (45.7%) | 165 (54.3%) |
Production, Transportation and Moving Occupations
The most common Production, Transportation and Moving occupations in Marble are Production (28 | 9.2%), Material Moving (15 | 4.9%), and Transportation (7 | 2.3%).
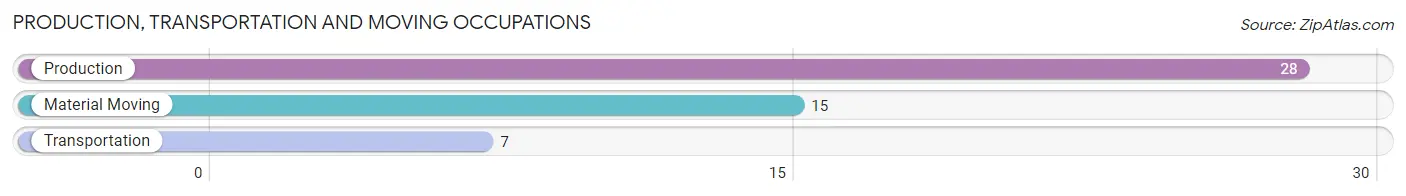
Production, Transportation and Moving Occupations by Sex
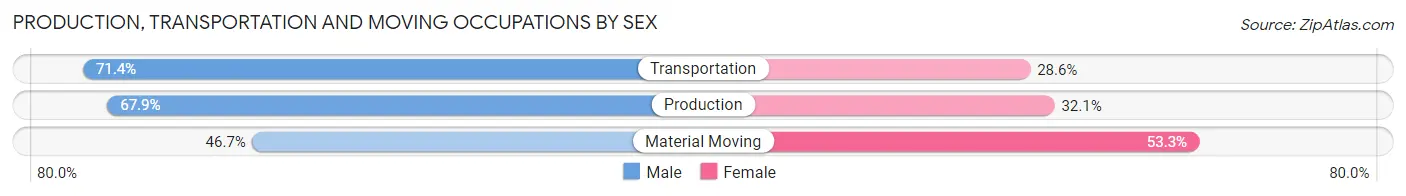
| Occupation | Male | Female |
| Production | 19 (67.9%) | 9 (32.1%) |
| Transportation | 5 (71.4%) | 2 (28.6%) |
| Material Moving | 7 (46.7%) | 8 (53.3%) |
| Total (Category) | 31 (62.0%) | 19 (38.0%) |
| Total (Overall) | 139 (45.7%) | 165 (54.3%) |
Employment Industries by Sex in Marble
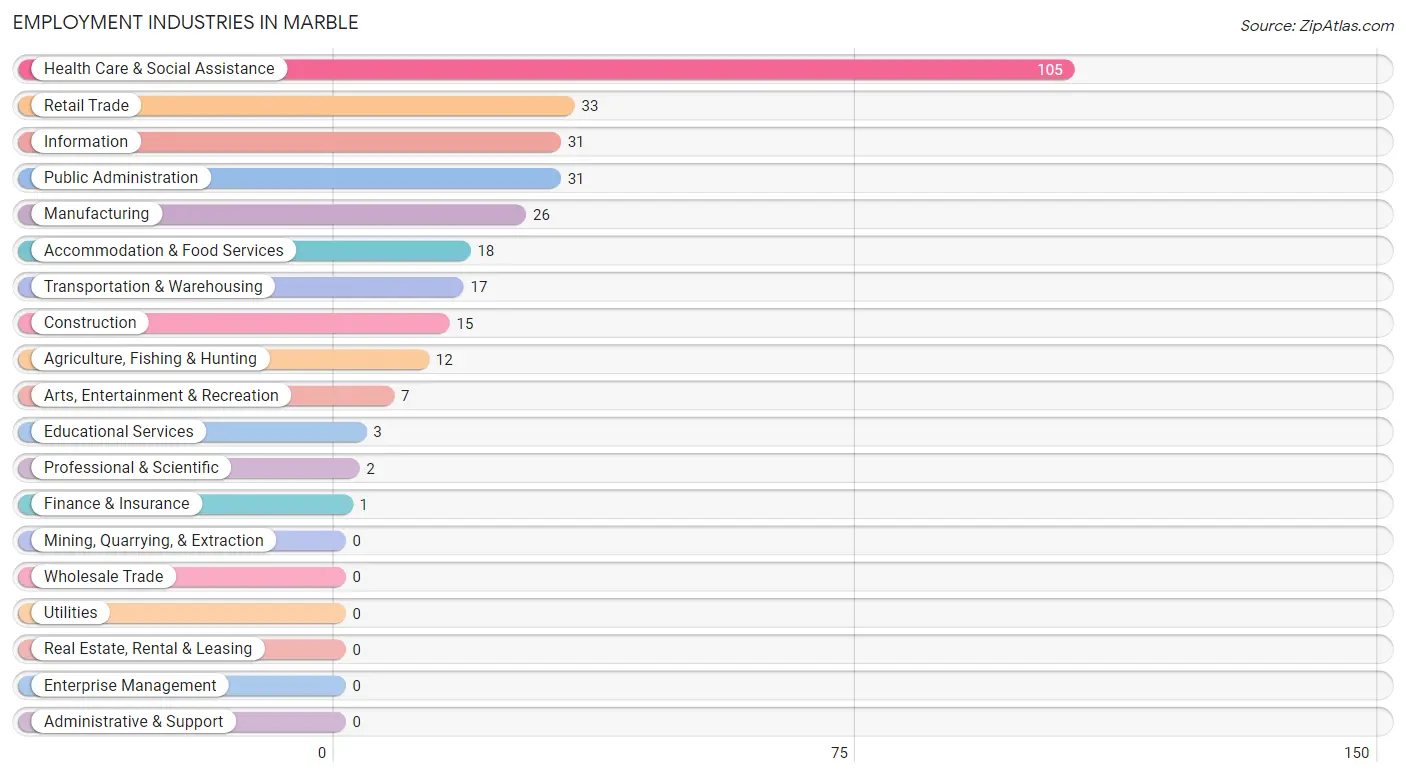
Employment Industries in Marble
The major employment industries in Marble include Health Care & Social Assistance (105 | 34.5%), Retail Trade (33 | 10.9%), Information (31 | 10.2%), Public Administration (31 | 10.2%), and Manufacturing (26 | 8.6%).
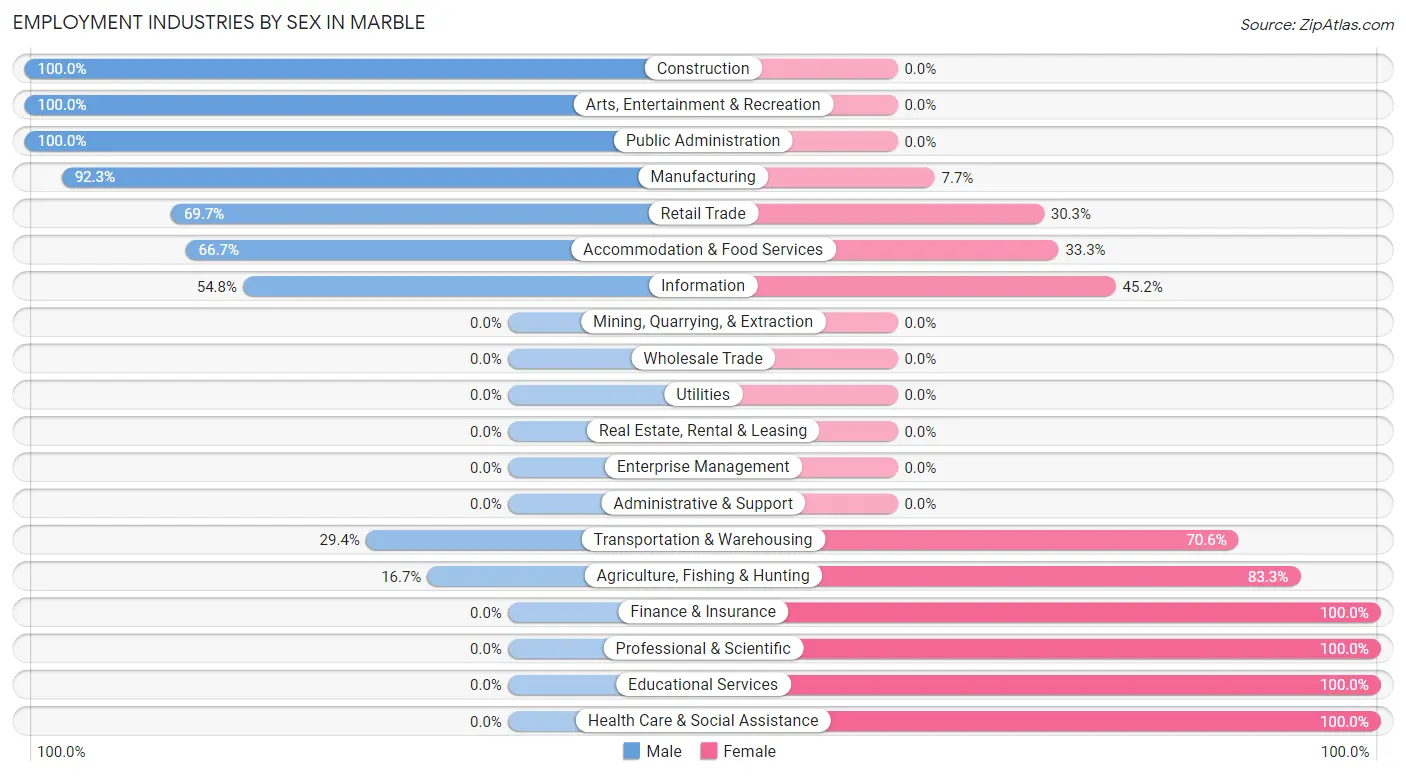
Employment Industries by Sex in Marble
The Marble industries that see more men than women are Construction (100.0%), Arts, Entertainment & Recreation (100.0%), and Public Administration (100.0%), whereas the industries that tend to have a higher number of women are Finance & Insurance (100.0%), Professional & Scientific (100.0%), and Educational Services (100.0%).
| Industry | Male | Female |
| Agriculture, Fishing & Hunting | 2 (16.7%) | 10 (83.3%) |
| Mining, Quarrying, & Extraction | 0 (0.0%) | 0 (0.0%) |
| Construction | 15 (100.0%) | 0 (0.0%) |
| Manufacturing | 24 (92.3%) | 2 (7.7%) |
| Wholesale Trade | 0 (0.0%) | 0 (0.0%) |
| Retail Trade | 23 (69.7%) | 10 (30.3%) |
| Transportation & Warehousing | 5 (29.4%) | 12 (70.6%) |
| Utilities | 0 (0.0%) | 0 (0.0%) |
| Information | 17 (54.8%) | 14 (45.2%) |
| Finance & Insurance | 0 (0.0%) | 1 (100.0%) |
| Real Estate, Rental & Leasing | 0 (0.0%) | 0 (0.0%) |
| Professional & Scientific | 0 (0.0%) | 2 (100.0%) |
| Enterprise Management | 0 (0.0%) | 0 (0.0%) |
| Administrative & Support | 0 (0.0%) | 0 (0.0%) |
| Educational Services | 0 (0.0%) | 3 (100.0%) |
| Health Care & Social Assistance | 0 (0.0%) | 105 (100.0%) |
| Arts, Entertainment & Recreation | 7 (100.0%) | 0 (0.0%) |
| Accommodation & Food Services | 12 (66.7%) | 6 (33.3%) |
| Public Administration | 31 (100.0%) | 0 (0.0%) |
| Total | 139 (45.7%) | 165 (54.3%) |
Education in Marble
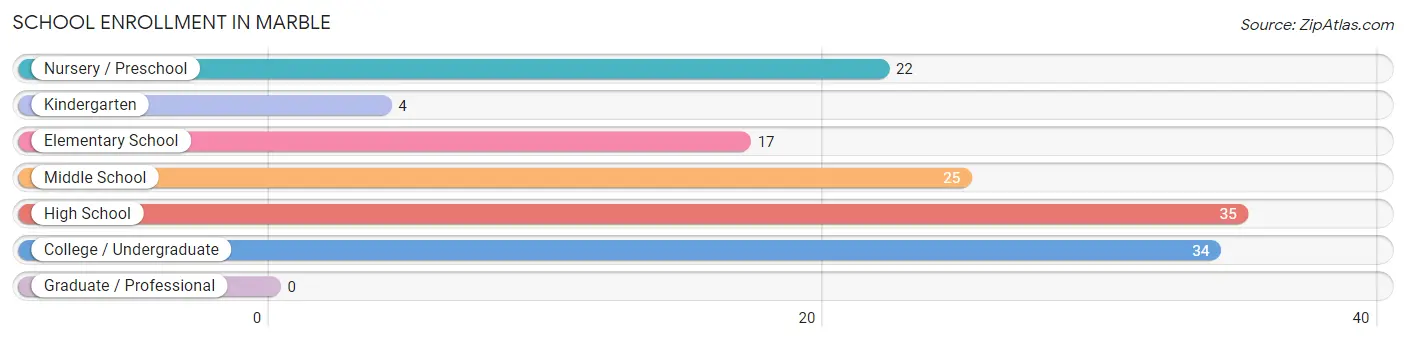
School Enrollment in Marble
The most common levels of schooling among the 137 students in Marble are high school (35 | 25.6%), college / undergraduate (34 | 24.8%), and middle school (25 | 18.2%).
| School Level | # Students | % Students |
| Nursery / Preschool | 22 | 16.1% |
| Kindergarten | 4 | 2.9% |
| Elementary School | 17 | 12.4% |
| Middle School | 25 | 18.2% |
| High School | 35 | 25.6% |
| College / Undergraduate | 34 | 24.8% |
| Graduate / Professional | 0 | 0.0% |
| Total | 137 | 100.0% |
School Enrollment by Age by Funding Source in Marble
Out of a total of 137 students who are enrolled in schools in Marble, 17 (12.4%) attend a private institution, while the remaining 120 (87.6%) are enrolled in public schools. The age group of 5 to 9 year old has the highest likelihood of being enrolled in private schools, with 7 (33.3% in the age bracket) enrolled. Conversely, the age group of 3 to 4 year olds has the lowest likelihood of being enrolled in a private school, with 20 (100.0% in the age bracket) attending a public institution.
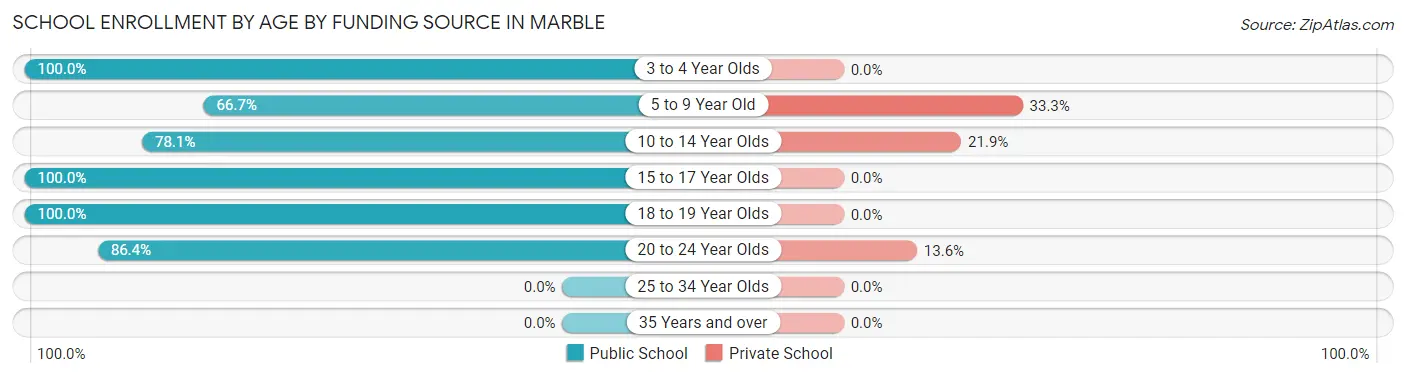
| Age Bracket | Public School | Private School |
| 3 to 4 Year Olds | 20 (100.0%) | 0 (0.0%) |
| 5 to 9 Year Old | 14 (66.7%) | 7 (33.3%) |
| 10 to 14 Year Olds | 25 (78.1%) | 7 (21.9%) |
| 15 to 17 Year Olds | 8 (100.0%) | 0 (0.0%) |
| 18 to 19 Year Olds | 34 (100.0%) | 0 (0.0%) |
| 20 to 24 Year Olds | 19 (86.4%) | 3 (13.6%) |
| 25 to 34 Year Olds | 0 (0.0%) | 0 (0.0%) |
| 35 Years and over | 0 (0.0%) | 0 (0.0%) |
| Total | 120 (87.6%) | 17 (12.4%) |
Educational Attainment by Field of Study in Marble
Psychology (12 | 41.4%), social sciences (8 | 27.6%), physical & health sciences (3 | 10.3%), computers & mathematics (2 | 6.9%), and science & technology (2 | 6.9%) are the most common fields of study among 29 individuals in Marble who have obtained a bachelor's degree or higher.
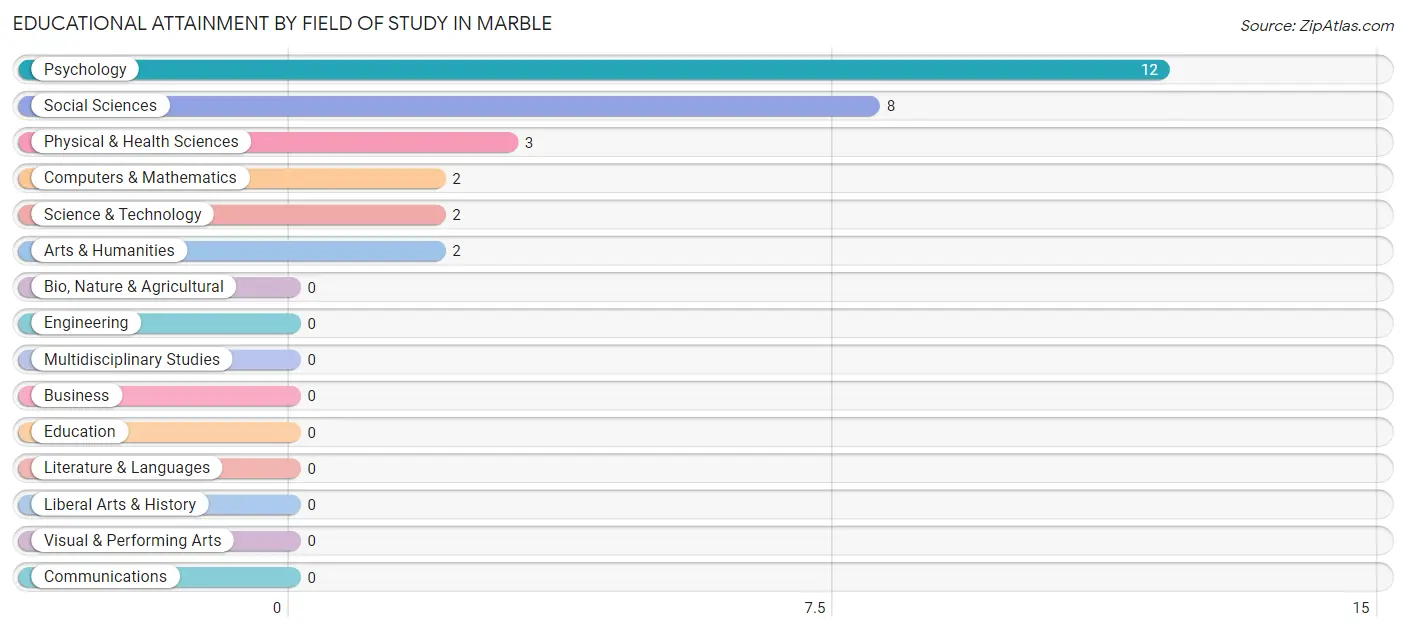
| Field of Study | # Graduates | % Graduates |
| Computers & Mathematics | 2 | 6.9% |
| Bio, Nature & Agricultural | 0 | 0.0% |
| Physical & Health Sciences | 3 | 10.3% |
| Psychology | 12 | 41.4% |
| Social Sciences | 8 | 27.6% |
| Engineering | 0 | 0.0% |
| Multidisciplinary Studies | 0 | 0.0% |
| Science & Technology | 2 | 6.9% |
| Business | 0 | 0.0% |
| Education | 0 | 0.0% |
| Literature & Languages | 0 | 0.0% |
| Liberal Arts & History | 0 | 0.0% |
| Visual & Performing Arts | 0 | 0.0% |
| Communications | 0 | 0.0% |
| Arts & Humanities | 2 | 6.9% |
| Total | 29 | 100.0% |
Transportation & Commute in Marble
Vehicle Availability by Sex in Marble
The most prevalent vehicle ownership categories in Marble are males with 2 vehicles (55, accounting for 43.0%) and females with 2 vehicles (71, making up 34.0%).
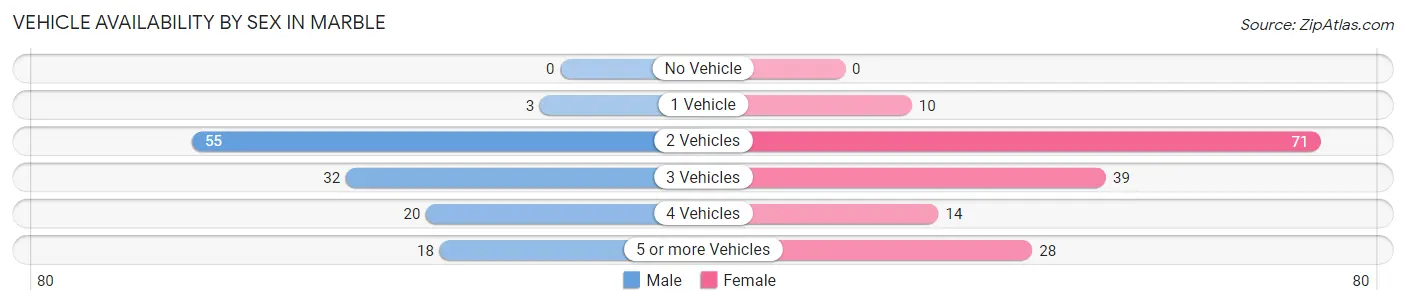
| Vehicles Available | Male | Female |
| No Vehicle | 0 (0.0%) | 0 (0.0%) |
| 1 Vehicle | 3 (2.3%) | 10 (6.2%) |
| 2 Vehicles | 55 (43.0%) | 71 (43.8%) |
| 3 Vehicles | 32 (25.0%) | 39 (24.1%) |
| 4 Vehicles | 20 (15.6%) | 14 (8.6%) |
| 5 or more Vehicles | 18 (14.1%) | 28 (17.3%) |
| Total | 128 (100.0%) | 162 (100.0%) |
Commute Time in Marble
The most frequently occuring commute durations in Marble are 20 to 24 minutes (150 commuters, 54.0%), 30 to 34 minutes (41 commuters, 14.7%), and 15 to 19 minutes (40 commuters, 14.4%).
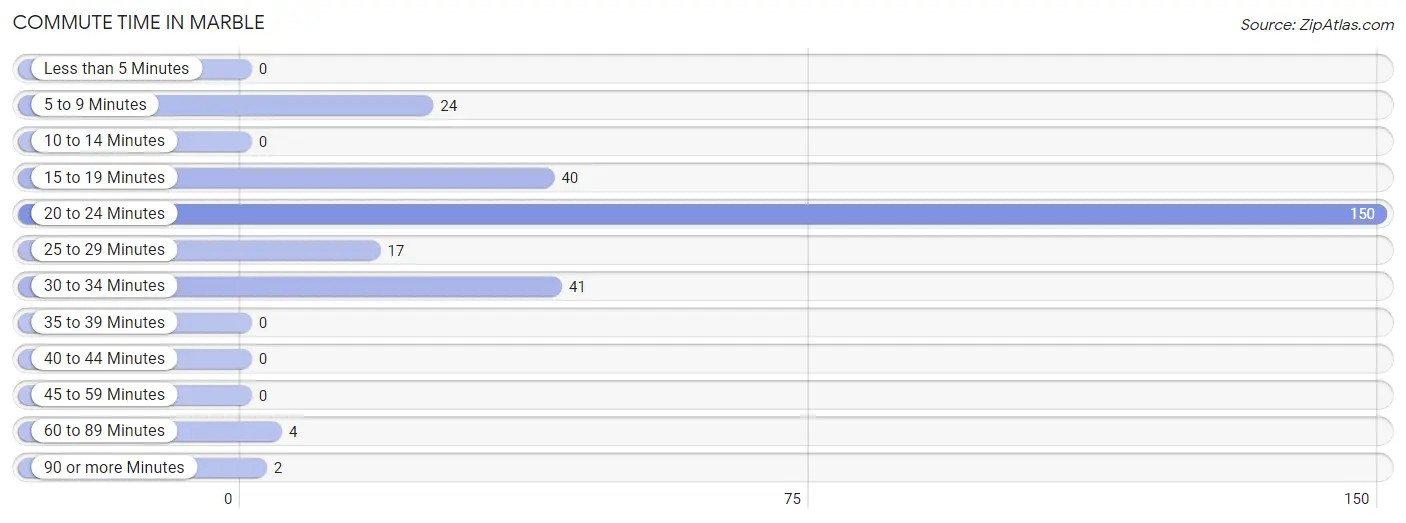
| Commute Time | # Commuters | % Commuters |
| Less than 5 Minutes | 0 | 0.0% |
| 5 to 9 Minutes | 24 | 8.6% |
| 10 to 14 Minutes | 0 | 0.0% |
| 15 to 19 Minutes | 40 | 14.4% |
| 20 to 24 Minutes | 150 | 54.0% |
| 25 to 29 Minutes | 17 | 6.1% |
| 30 to 34 Minutes | 41 | 14.7% |
| 35 to 39 Minutes | 0 | 0.0% |
| 40 to 44 Minutes | 0 | 0.0% |
| 45 to 59 Minutes | 0 | 0.0% |
| 60 to 89 Minutes | 4 | 1.4% |
| 90 or more Minutes | 2 | 0.7% |
Commute Time by Sex in Marble
The most common commute times in Marble are 20 to 24 minutes (67 commuters, 56.8%) for males and 20 to 24 minutes (83 commuters, 51.9%) for females.
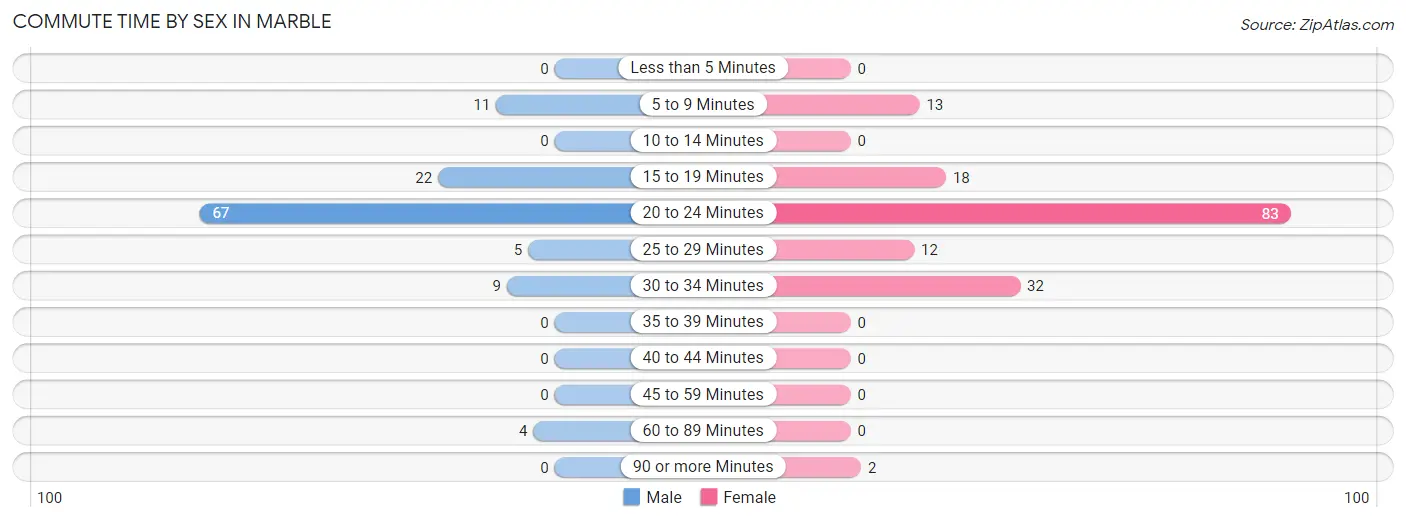
| Commute Time | Male | Female |
| Less than 5 Minutes | 0 (0.0%) | 0 (0.0%) |
| 5 to 9 Minutes | 11 (9.3%) | 13 (8.1%) |
| 10 to 14 Minutes | 0 (0.0%) | 0 (0.0%) |
| 15 to 19 Minutes | 22 (18.6%) | 18 (11.3%) |
| 20 to 24 Minutes | 67 (56.8%) | 83 (51.9%) |
| 25 to 29 Minutes | 5 (4.2%) | 12 (7.5%) |
| 30 to 34 Minutes | 9 (7.6%) | 32 (20.0%) |
| 35 to 39 Minutes | 0 (0.0%) | 0 (0.0%) |
| 40 to 44 Minutes | 0 (0.0%) | 0 (0.0%) |
| 45 to 59 Minutes | 0 (0.0%) | 0 (0.0%) |
| 60 to 89 Minutes | 4 (3.4%) | 0 (0.0%) |
| 90 or more Minutes | 0 (0.0%) | 2 (1.3%) |
Time of Departure to Work by Sex in Marble
The most frequent times of departure to work in Marble are 12:00 AM to 4:59 AM (41, 34.7%) for males and 7:00 AM to 7:29 AM (25, 15.6%) for females.
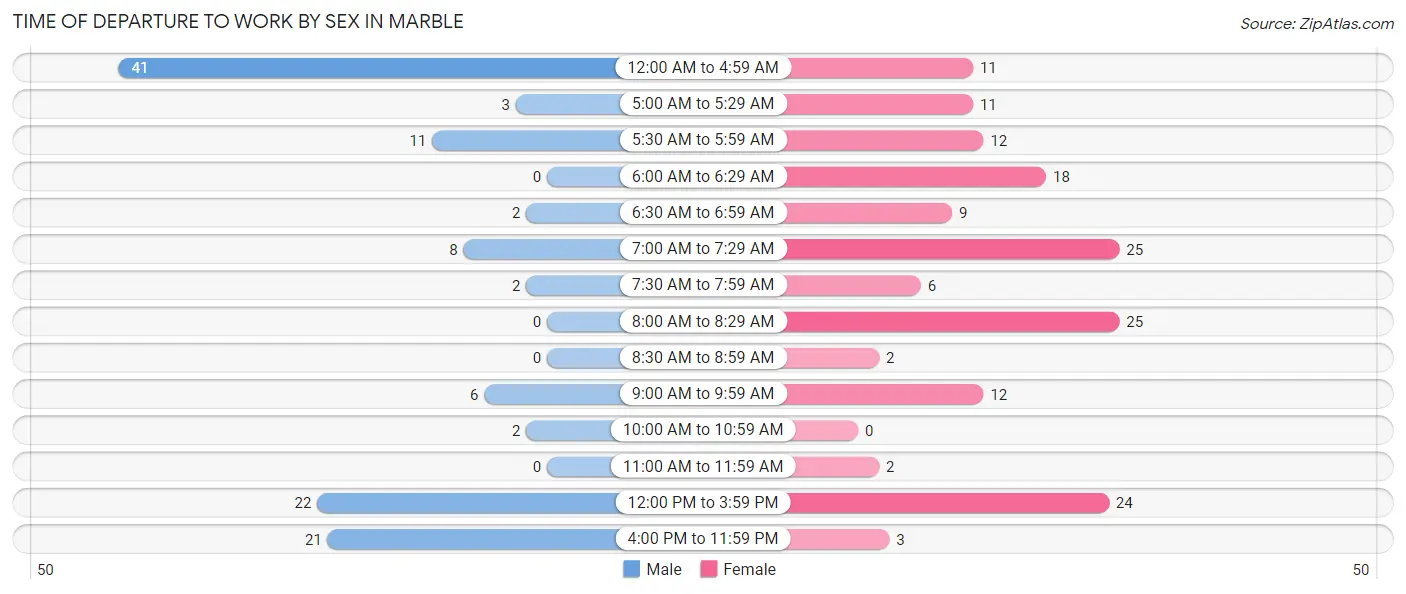
| Time of Departure | Male | Female |
| 12:00 AM to 4:59 AM | 41 (34.7%) | 11 (6.9%) |
| 5:00 AM to 5:29 AM | 3 (2.5%) | 11 (6.9%) |
| 5:30 AM to 5:59 AM | 11 (9.3%) | 12 (7.5%) |
| 6:00 AM to 6:29 AM | 0 (0.0%) | 18 (11.3%) |
| 6:30 AM to 6:59 AM | 2 (1.7%) | 9 (5.6%) |
| 7:00 AM to 7:29 AM | 8 (6.8%) | 25 (15.6%) |
| 7:30 AM to 7:59 AM | 2 (1.7%) | 6 (3.7%) |
| 8:00 AM to 8:29 AM | 0 (0.0%) | 25 (15.6%) |
| 8:30 AM to 8:59 AM | 0 (0.0%) | 2 (1.3%) |
| 9:00 AM to 9:59 AM | 6 (5.1%) | 12 (7.5%) |
| 10:00 AM to 10:59 AM | 2 (1.7%) | 0 (0.0%) |
| 11:00 AM to 11:59 AM | 0 (0.0%) | 2 (1.3%) |
| 12:00 PM to 3:59 PM | 22 (18.6%) | 24 (15.0%) |
| 4:00 PM to 11:59 PM | 21 (17.8%) | 3 (1.9%) |
| Total | 118 (100.0%) | 160 (100.0%) |
Housing Occupancy in Marble
Occupancy by Ownership in Marble
Of the total 251 dwellings in Marble, owner-occupied units account for 207 (82.5%), while renter-occupied units make up 44 (17.5%).
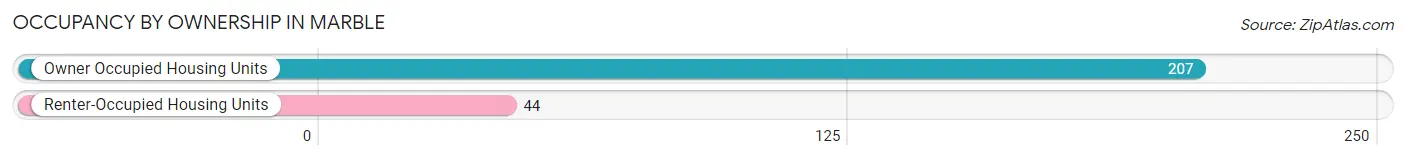
| Occupancy | # Housing Units | % Housing Units |
| Owner Occupied Housing Units | 207 | 82.5% |
| Renter-Occupied Housing Units | 44 | 17.5% |
| Total Occupied Housing Units | 251 | 100.0% |
Occupancy by Household Size in Marble
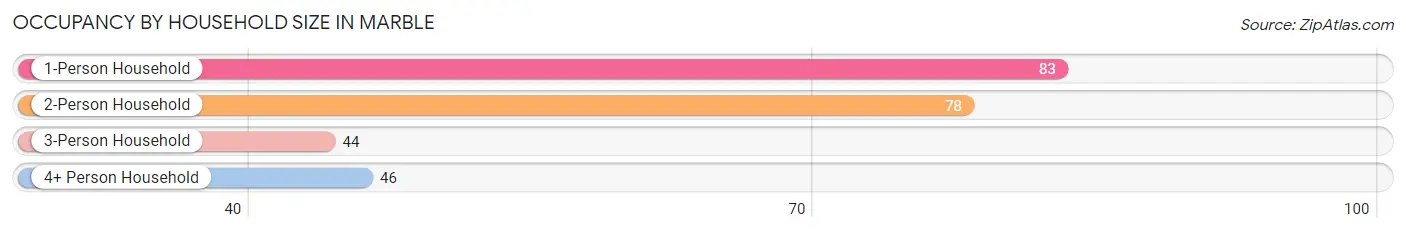
| Household Size | # Housing Units | % Housing Units |
| 1-Person Household | 83 | 33.1% |
| 2-Person Household | 78 | 31.1% |
| 3-Person Household | 44 | 17.5% |
| 4+ Person Household | 46 | 18.3% |
| Total Housing Units | 251 | 100.0% |
Occupancy by Ownership by Household Size in Marble
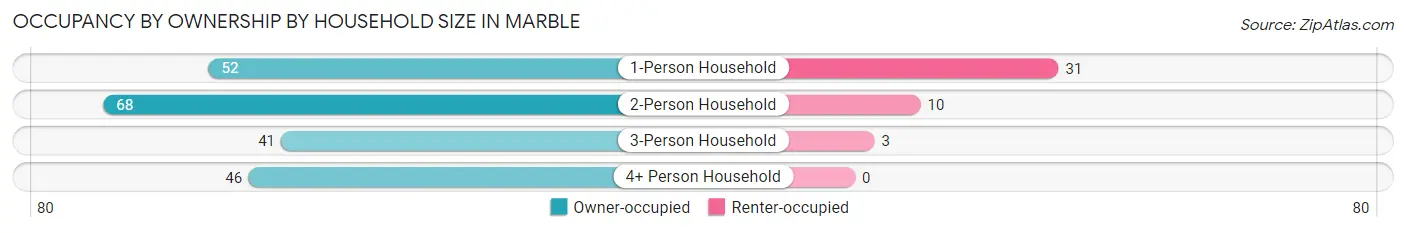
| Household Size | Owner-occupied | Renter-occupied |
| 1-Person Household | 52 (62.6%) | 31 (37.3%) |
| 2-Person Household | 68 (87.2%) | 10 (12.8%) |
| 3-Person Household | 41 (93.2%) | 3 (6.8%) |
| 4+ Person Household | 46 (100.0%) | 0 (0.0%) |
| Total Housing Units | 207 (82.5%) | 44 (17.5%) |
Occupancy by Educational Attainment in Marble
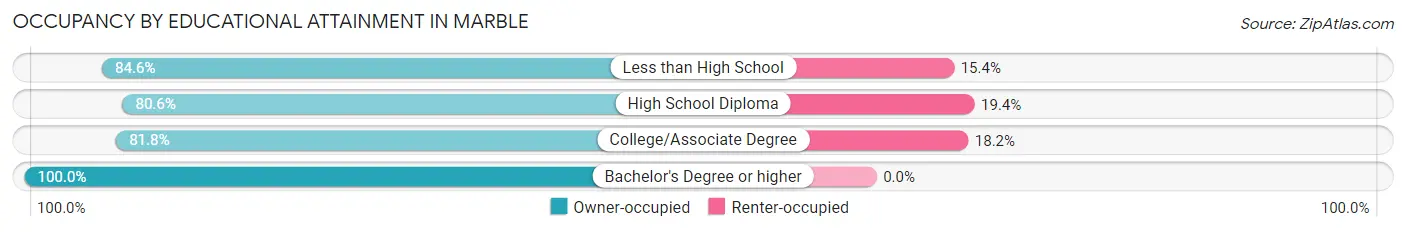
| Household Size | Owner-occupied | Renter-occupied |
| Less than High School | 11 (84.6%) | 2 (15.4%) |
| High School Diploma | 83 (80.6%) | 20 (19.4%) |
| College/Associate Degree | 99 (81.8%) | 22 (18.2%) |
| Bachelor's Degree or higher | 14 (100.0%) | 0 (0.0%) |
Occupancy by Age of Householder in Marble
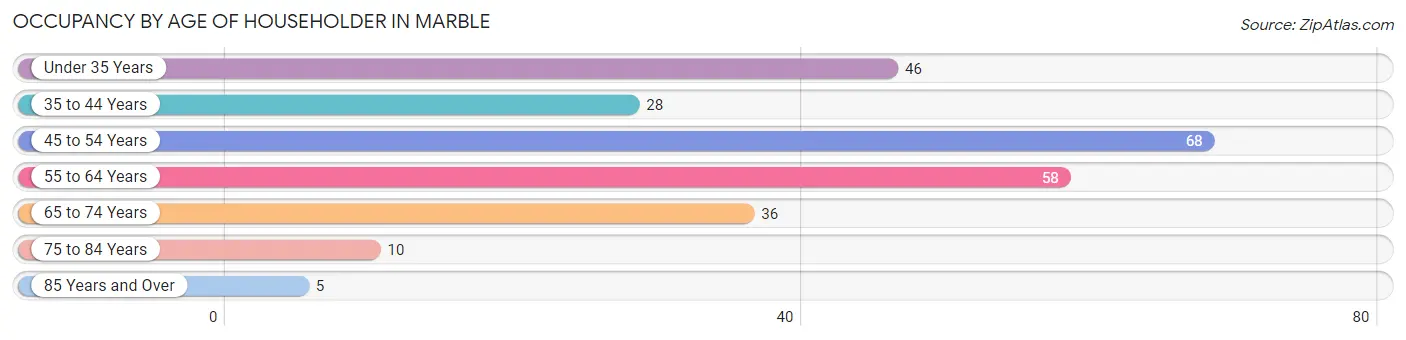
| Age Bracket | # Households | % Households |
| Under 35 Years | 46 | 18.3% |
| 35 to 44 Years | 28 | 11.2% |
| 45 to 54 Years | 68 | 27.1% |
| 55 to 64 Years | 58 | 23.1% |
| 65 to 74 Years | 36 | 14.3% |
| 75 to 84 Years | 10 | 4.0% |
| 85 Years and Over | 5 | 2.0% |
| Total | 251 | 100.0% |
Housing Finances in Marble
Median Income by Occupancy in Marble
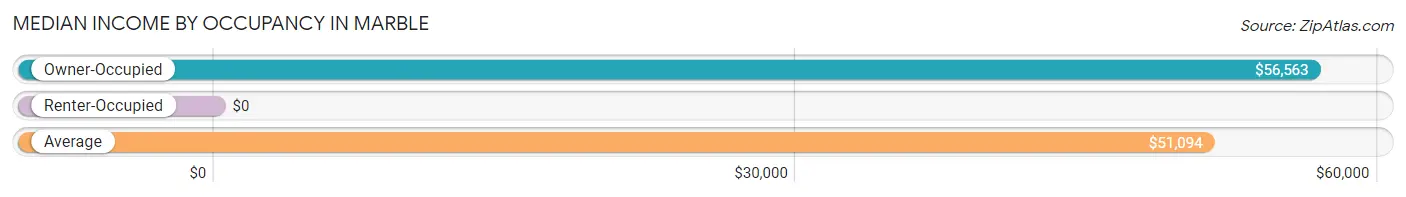
| Occupancy Type | # Households | Median Income |
| Owner-Occupied | 207 (82.5%) | $56,563 |
| Renter-Occupied | 44 (17.5%) | $0 |
| Average | 251 (100.0%) | $51,094 |
Occupancy by Householder Income Bracket in Marble
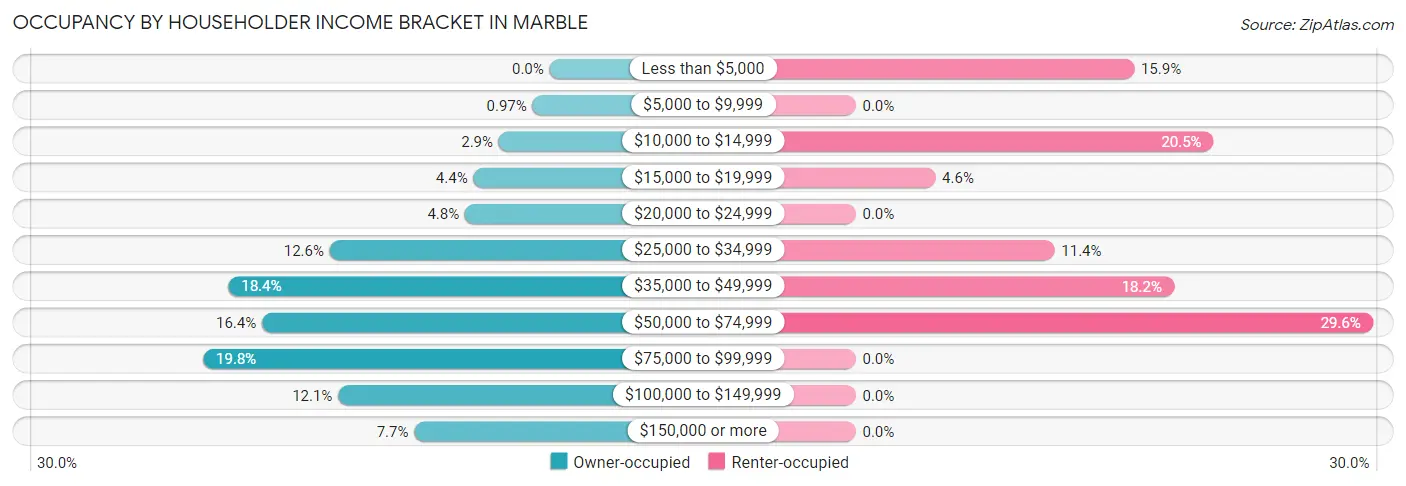
| Income Bracket | Owner-occupied | Renter-occupied |
| Less than $5,000 | 0 (0.0%) | 7 (15.9%) |
| $5,000 to $9,999 | 2 (1.0%) | 0 (0.0%) |
| $10,000 to $14,999 | 6 (2.9%) | 9 (20.4%) |
| $15,000 to $19,999 | 9 (4.3%) | 2 (4.5%) |
| $20,000 to $24,999 | 10 (4.8%) | 0 (0.0%) |
| $25,000 to $34,999 | 26 (12.6%) | 5 (11.4%) |
| $35,000 to $49,999 | 38 (18.4%) | 8 (18.2%) |
| $50,000 to $74,999 | 34 (16.4%) | 13 (29.5%) |
| $75,000 to $99,999 | 41 (19.8%) | 0 (0.0%) |
| $100,000 to $149,999 | 25 (12.1%) | 0 (0.0%) |
| $150,000 or more | 16 (7.7%) | 0 (0.0%) |
| Total | 207 (100.0%) | 44 (100.0%) |
Monthly Housing Cost Tiers in Marble
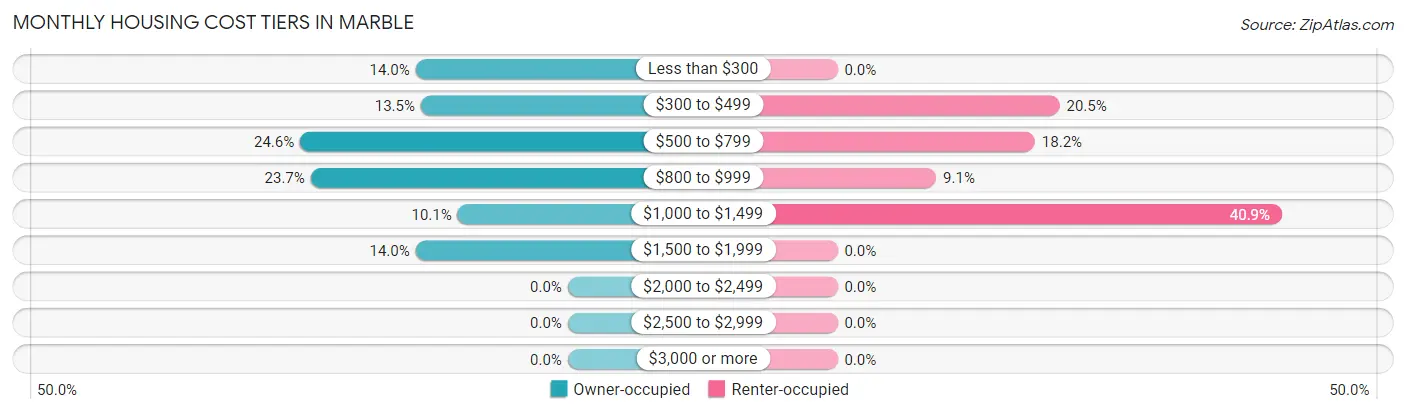
| Monthly Cost | Owner-occupied | Renter-occupied |
| Less than $300 | 29 (14.0%) | 0 (0.0%) |
| $300 to $499 | 28 (13.5%) | 9 (20.4%) |
| $500 to $799 | 51 (24.6%) | 8 (18.2%) |
| $800 to $999 | 49 (23.7%) | 4 (9.1%) |
| $1,000 to $1,499 | 21 (10.1%) | 18 (40.9%) |
| $1,500 to $1,999 | 29 (14.0%) | 0 (0.0%) |
| $2,000 to $2,499 | 0 (0.0%) | 0 (0.0%) |
| $2,500 to $2,999 | 0 (0.0%) | 0 (0.0%) |
| $3,000 or more | 0 (0.0%) | 0 (0.0%) |
| Total | 207 (100.0%) | 44 (100.0%) |
Physical Housing Characteristics in Marble
Housing Structures in Marble
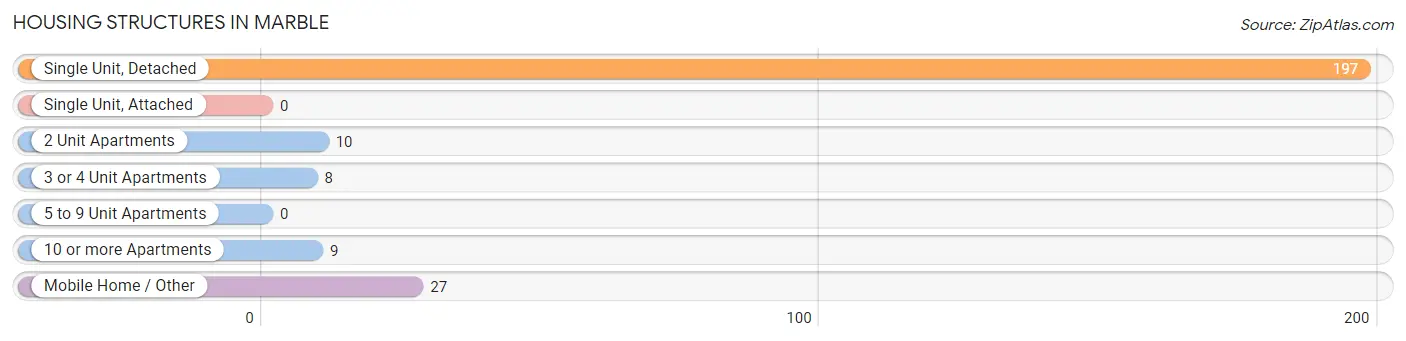
| Structure Type | # Housing Units | % Housing Units |
| Single Unit, Detached | 197 | 78.5% |
| Single Unit, Attached | 0 | 0.0% |
| 2 Unit Apartments | 10 | 4.0% |
| 3 or 4 Unit Apartments | 8 | 3.2% |
| 5 to 9 Unit Apartments | 0 | 0.0% |
| 10 or more Apartments | 9 | 3.6% |
| Mobile Home / Other | 27 | 10.8% |
| Total | 251 | 100.0% |
Housing Structures by Occupancy in Marble
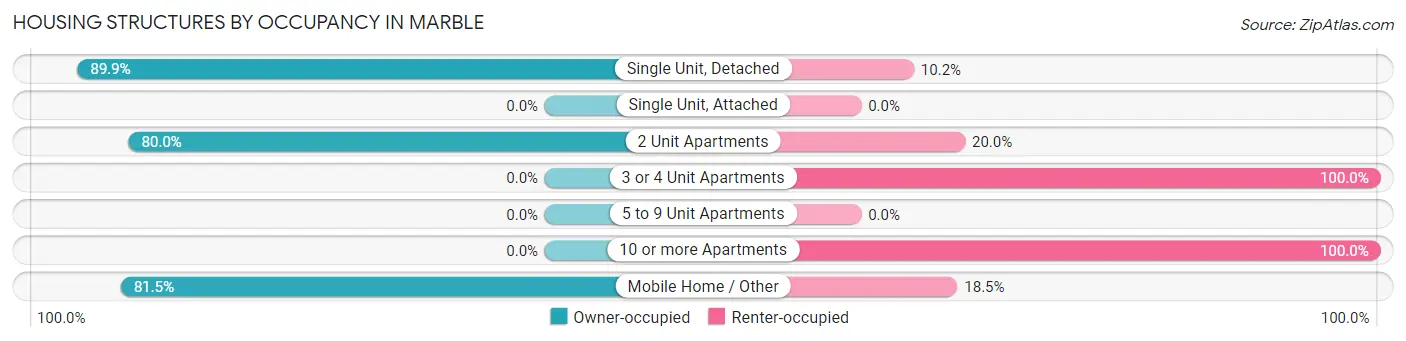
| Structure Type | Owner-occupied | Renter-occupied |
| Single Unit, Detached | 177 (89.8%) | 20 (10.2%) |
| Single Unit, Attached | 0 (0.0%) | 0 (0.0%) |
| 2 Unit Apartments | 8 (80.0%) | 2 (20.0%) |
| 3 or 4 Unit Apartments | 0 (0.0%) | 8 (100.0%) |
| 5 to 9 Unit Apartments | 0 (0.0%) | 0 (0.0%) |
| 10 or more Apartments | 0 (0.0%) | 9 (100.0%) |
| Mobile Home / Other | 22 (81.5%) | 5 (18.5%) |
| Total | 207 (82.5%) | 44 (17.5%) |
Housing Structures by Number of Rooms in Marble
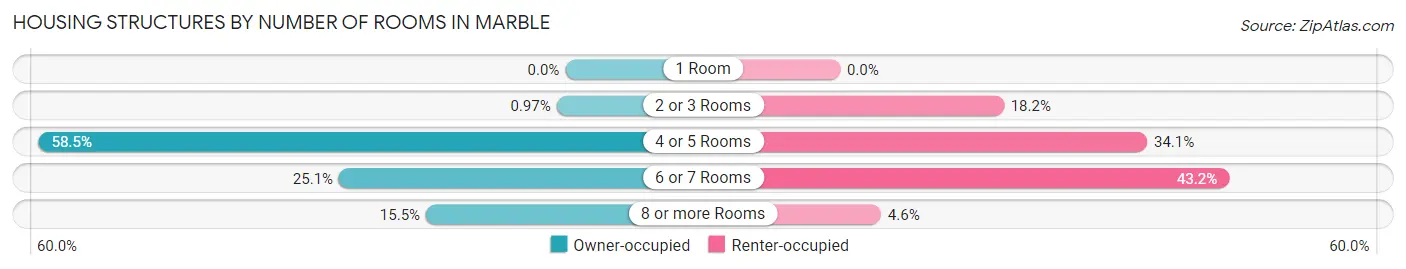
| Number of Rooms | Owner-occupied | Renter-occupied |
| 1 Room | 0 (0.0%) | 0 (0.0%) |
| 2 or 3 Rooms | 2 (1.0%) | 8 (18.2%) |
| 4 or 5 Rooms | 121 (58.5%) | 15 (34.1%) |
| 6 or 7 Rooms | 52 (25.1%) | 19 (43.2%) |
| 8 or more Rooms | 32 (15.5%) | 2 (4.5%) |
| Total | 207 (100.0%) | 44 (100.0%) |
Housing Structure by Heating Type in Marble
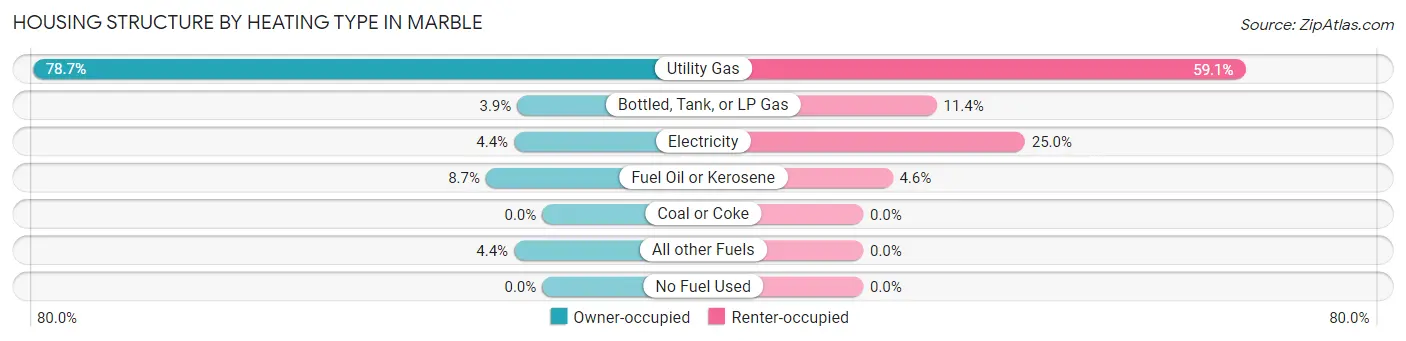
| Heating Type | Owner-occupied | Renter-occupied |
| Utility Gas | 163 (78.7%) | 26 (59.1%) |
| Bottled, Tank, or LP Gas | 8 (3.9%) | 5 (11.4%) |
| Electricity | 9 (4.3%) | 11 (25.0%) |
| Fuel Oil or Kerosene | 18 (8.7%) | 2 (4.5%) |
| Coal or Coke | 0 (0.0%) | 0 (0.0%) |
| All other Fuels | 9 (4.3%) | 0 (0.0%) |
| No Fuel Used | 0 (0.0%) | 0 (0.0%) |
| Total | 207 (100.0%) | 44 (100.0%) |
Household Vehicle Usage in Marble
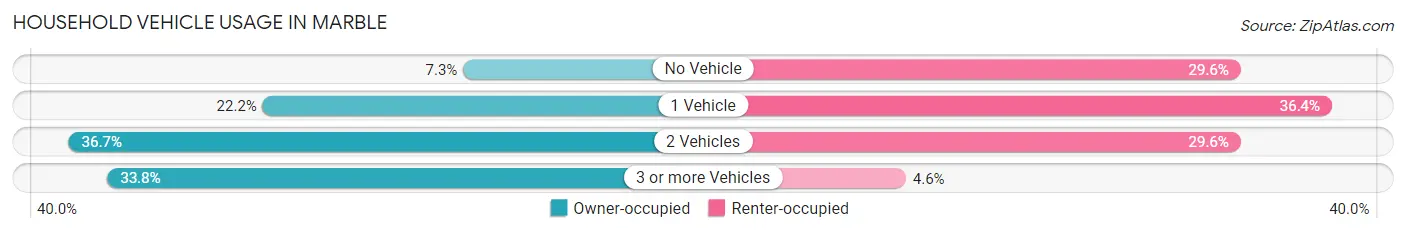
| Vehicles per Household | Owner-occupied | Renter-occupied |
| No Vehicle | 15 (7.2%) | 13 (29.5%) |
| 1 Vehicle | 46 (22.2%) | 16 (36.4%) |
| 2 Vehicles | 76 (36.7%) | 13 (29.5%) |
| 3 or more Vehicles | 70 (33.8%) | 2 (4.5%) |
| Total | 207 (100.0%) | 44 (100.0%) |
Real Estate & Mortgages in Marble
Real Estate and Mortgage Overview in Marble
| Characteristic | Without Mortgage | With Mortgage |
| Housing Units | 79 | 128 |
| Median Property Value | $55,800 | $98,700 |
| Median Household Income | $26,953 | $16 |
| Monthly Housing Costs | $408 | $0 |
| Real Estate Taxes | $199 | $11 |
Property Value by Mortgage Status in Marble
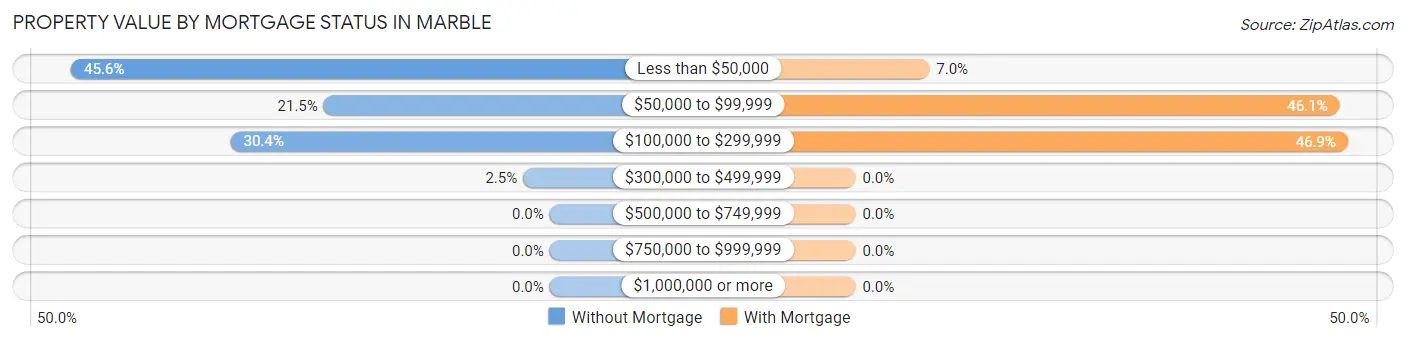
| Property Value | Without Mortgage | With Mortgage |
| Less than $50,000 | 36 (45.6%) | 9 (7.0%) |
| $50,000 to $99,999 | 17 (21.5%) | 59 (46.1%) |
| $100,000 to $299,999 | 24 (30.4%) | 60 (46.9%) |
| $300,000 to $499,999 | 2 (2.5%) | 0 (0.0%) |
| $500,000 to $749,999 | 0 (0.0%) | 0 (0.0%) |
| $750,000 to $999,999 | 0 (0.0%) | 0 (0.0%) |
| $1,000,000 or more | 0 (0.0%) | 0 (0.0%) |
| Total | 79 (100.0%) | 128 (100.0%) |
Household Income by Mortgage Status in Marble
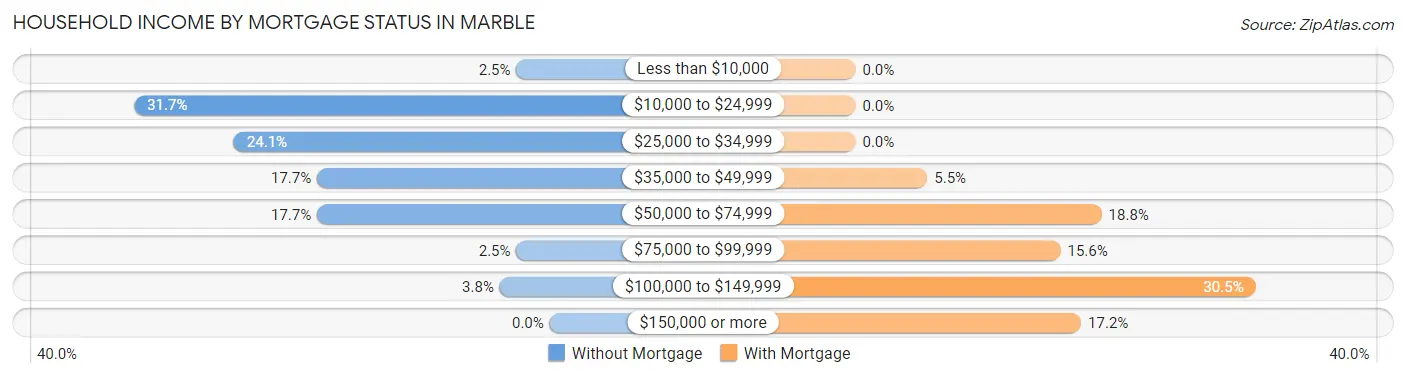
| Household Income | Without Mortgage | With Mortgage |
| Less than $10,000 | 2 (2.5%) | 0 (0.0%) |
| $10,000 to $24,999 | 25 (31.7%) | 0 (0.0%) |
| $25,000 to $34,999 | 19 (24.0%) | 0 (0.0%) |
| $35,000 to $49,999 | 14 (17.7%) | 7 (5.5%) |
| $50,000 to $74,999 | 14 (17.7%) | 24 (18.8%) |
| $75,000 to $99,999 | 2 (2.5%) | 20 (15.6%) |
| $100,000 to $149,999 | 3 (3.8%) | 39 (30.5%) |
| $150,000 or more | 0 (0.0%) | 22 (17.2%) |
| Total | 79 (100.0%) | 128 (100.0%) |
Property Value to Household Income Ratio in Marble
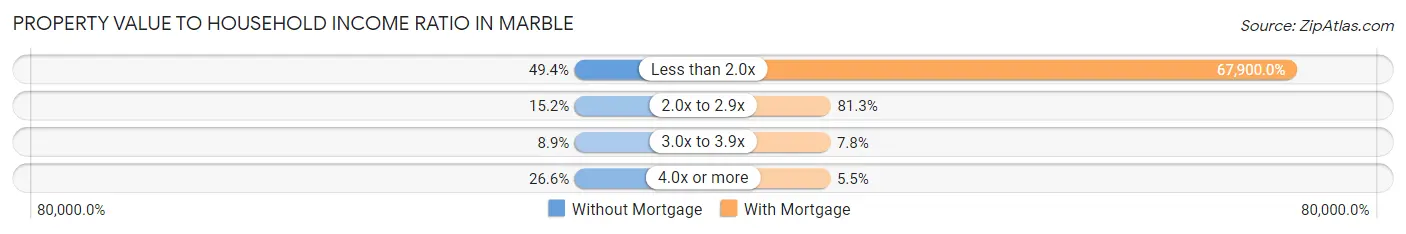
| Value-to-Income Ratio | Without Mortgage | With Mortgage |
| Less than 2.0x | 39 (49.4%) | 86,912 (67,900.0%) |
| 2.0x to 2.9x | 12 (15.2%) | 104 (81.2%) |
| 3.0x to 3.9x | 7 (8.9%) | 10 (7.8%) |
| 4.0x or more | 21 (26.6%) | 7 (5.5%) |
| Total | 79 (100.0%) | 128 (100.0%) |
Real Estate Taxes by Mortgage Status in Marble
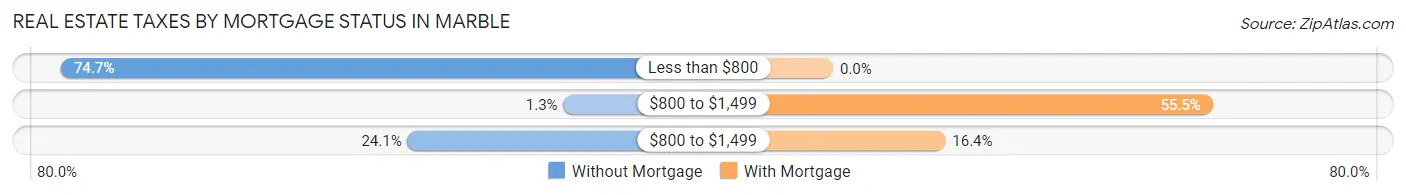
| Property Taxes | Without Mortgage | With Mortgage |
| Less than $800 | 59 (74.7%) | 0 (0.0%) |
| $800 to $1,499 | 1 (1.3%) | 71 (55.5%) |
| $800 to $1,499 | 19 (24.0%) | 21 (16.4%) |
| Total | 79 (100.0%) | 128 (100.0%) |
Health & Disability in Marble
Health Insurance Coverage by Age in Marble
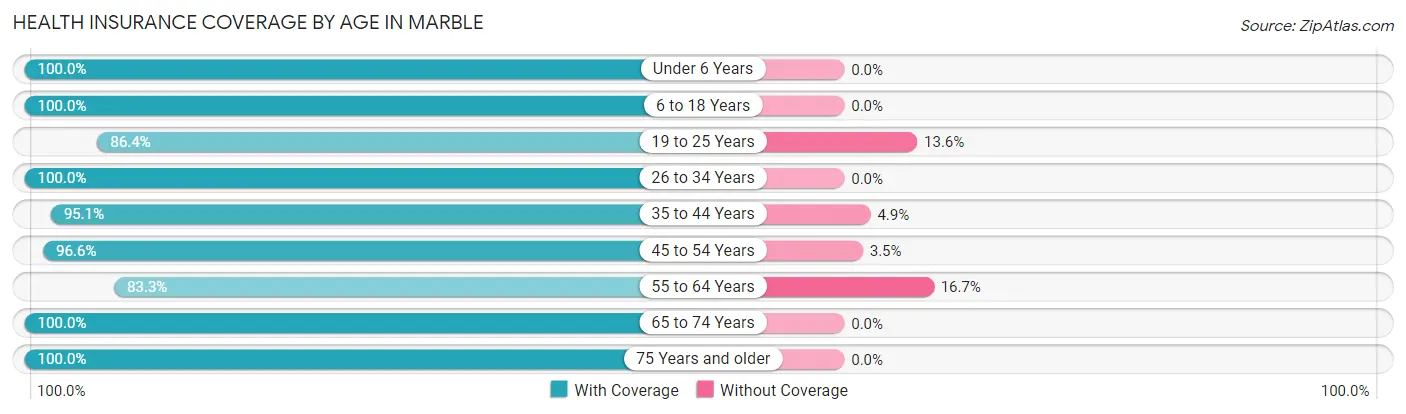
| Age Bracket | With Coverage | Without Coverage |
| Under 6 Years | 32 (100.0%) | 0 (0.0%) |
| 6 to 18 Years | 93 (100.0%) | 0 (0.0%) |
| 19 to 25 Years | 70 (86.4%) | 11 (13.6%) |
| 26 to 34 Years | 107 (100.0%) | 0 (0.0%) |
| 35 to 44 Years | 39 (95.1%) | 2 (4.9%) |
| 45 to 54 Years | 112 (96.6%) | 4 (3.5%) |
| 55 to 64 Years | 60 (83.3%) | 12 (16.7%) |
| 65 to 74 Years | 53 (100.0%) | 0 (0.0%) |
| 75 Years and older | 19 (100.0%) | 0 (0.0%) |
| Total | 585 (95.3%) | 29 (4.7%) |
Health Insurance Coverage by Citizenship Status in Marble
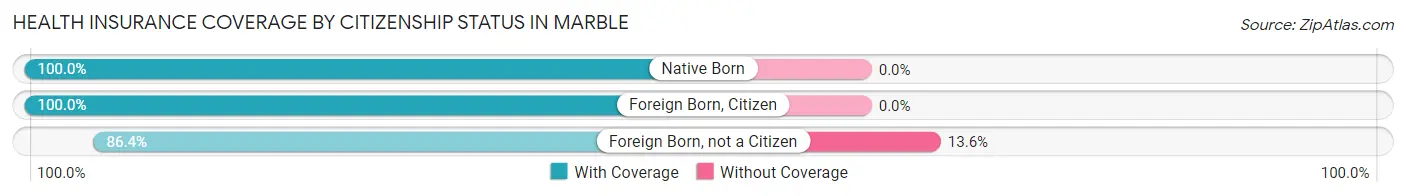
| Citizenship Status | With Coverage | Without Coverage |
| Native Born | 32 (100.0%) | 0 (0.0%) |
| Foreign Born, Citizen | 93 (100.0%) | 0 (0.0%) |
| Foreign Born, not a Citizen | 70 (86.4%) | 11 (13.6%) |
Health Insurance Coverage by Household Income in Marble
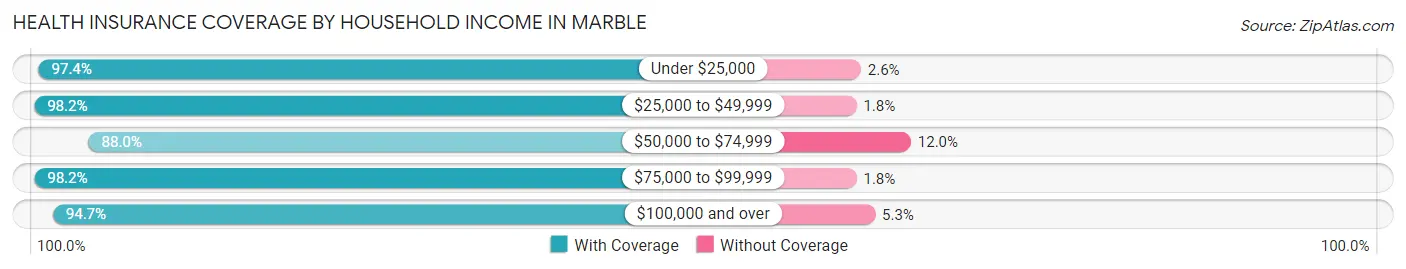
| Household Income | With Coverage | Without Coverage |
| Under $25,000 | 74 (97.4%) | 2 (2.6%) |
| $25,000 to $49,999 | 163 (98.2%) | 3 (1.8%) |
| $50,000 to $74,999 | 110 (88.0%) | 15 (12.0%) |
| $75,000 to $99,999 | 108 (98.2%) | 2 (1.8%) |
| $100,000 and over | 125 (94.7%) | 7 (5.3%) |
Public vs Private Health Insurance Coverage by Age in Marble
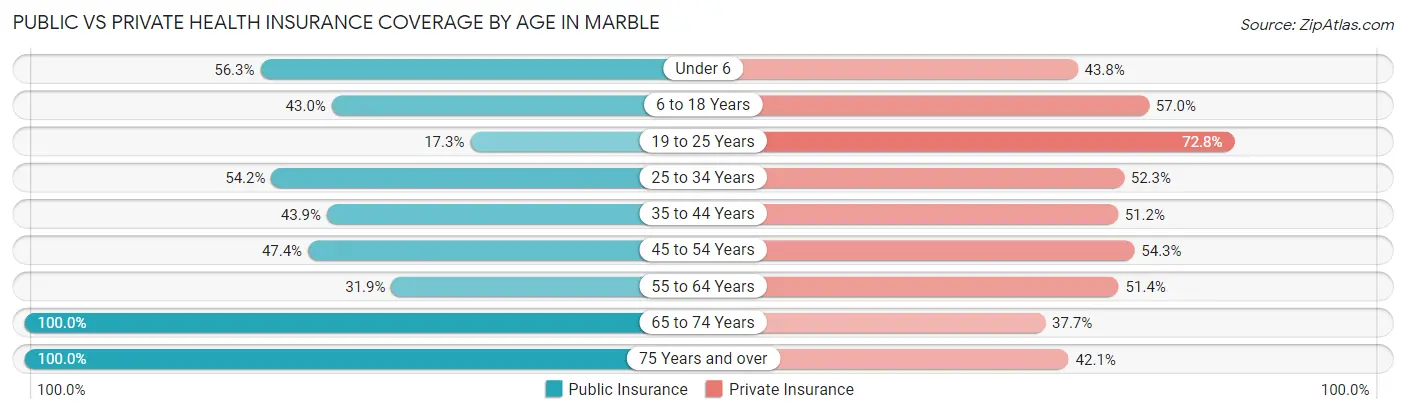
| Age Bracket | Public Insurance | Private Insurance |
| Under 6 | 18 (56.2%) | 14 (43.8%) |
| 6 to 18 Years | 40 (43.0%) | 53 (57.0%) |
| 19 to 25 Years | 14 (17.3%) | 59 (72.8%) |
| 25 to 34 Years | 58 (54.2%) | 56 (52.3%) |
| 35 to 44 Years | 18 (43.9%) | 21 (51.2%) |
| 45 to 54 Years | 55 (47.4%) | 63 (54.3%) |
| 55 to 64 Years | 23 (31.9%) | 37 (51.4%) |
| 65 to 74 Years | 53 (100.0%) | 20 (37.7%) |
| 75 Years and over | 19 (100.0%) | 8 (42.1%) |
| Total | 298 (48.5%) | 331 (53.9%) |
Disability Status by Sex by Age in Marble
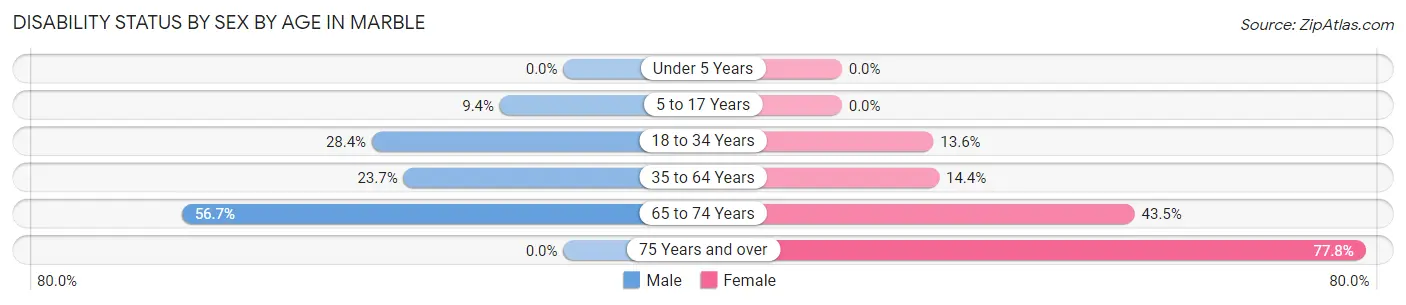
| Age Bracket | Male | Female |
| Under 5 Years | 0 (0.0%) | 0 (0.0%) |
| 5 to 17 Years | 5 (9.4%) | 0 (0.0%) |
| 18 to 34 Years | 27 (28.4%) | 17 (13.6%) |
| 35 to 64 Years | 33 (23.7%) | 13 (14.4%) |
| 65 to 74 Years | 17 (56.7%) | 10 (43.5%) |
| 75 Years and over | 0 (0.0%) | 7 (77.8%) |
Disability Class by Sex by Age in Marble
Disability Class: Hearing Difficulty
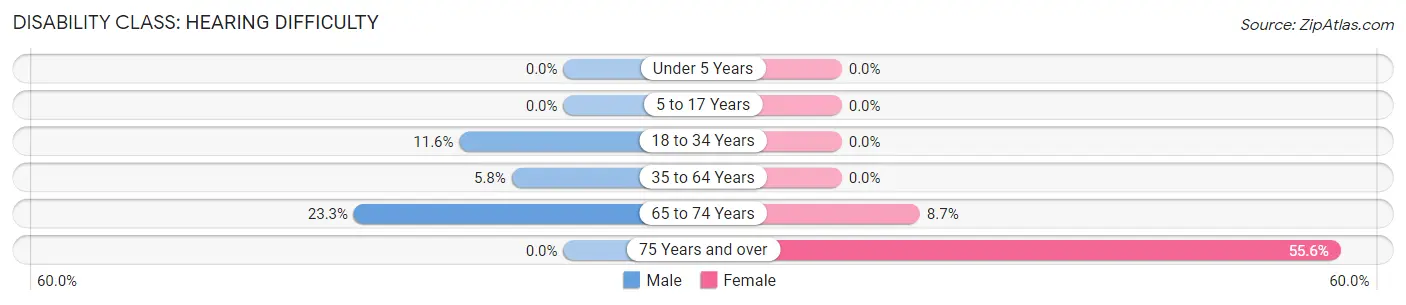
| Age Bracket | Male | Female |
| Under 5 Years | 0 (0.0%) | 0 (0.0%) |
| 5 to 17 Years | 0 (0.0%) | 0 (0.0%) |
| 18 to 34 Years | 11 (11.6%) | 0 (0.0%) |
| 35 to 64 Years | 8 (5.8%) | 0 (0.0%) |
| 65 to 74 Years | 7 (23.3%) | 2 (8.7%) |
| 75 Years and over | 0 (0.0%) | 5 (55.6%) |
Disability Class: Vision Difficulty
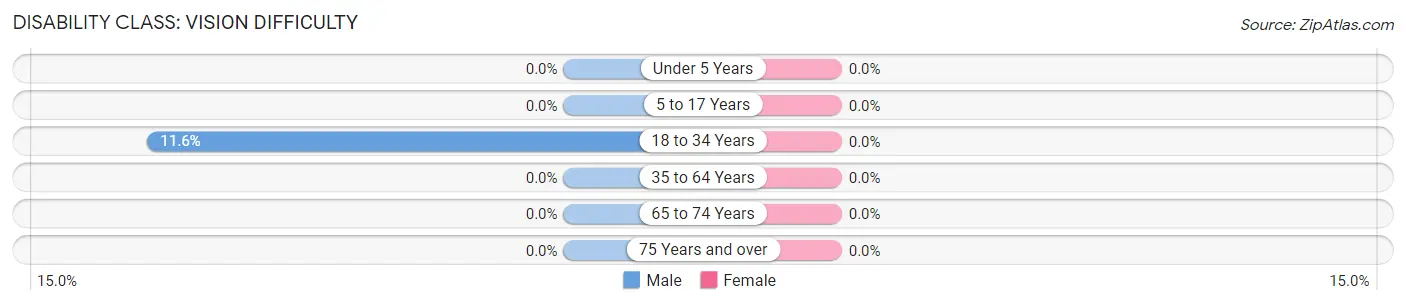
| Age Bracket | Male | Female |
| Under 5 Years | 0 (0.0%) | 0 (0.0%) |
| 5 to 17 Years | 0 (0.0%) | 0 (0.0%) |
| 18 to 34 Years | 11 (11.6%) | 0 (0.0%) |
| 35 to 64 Years | 0 (0.0%) | 0 (0.0%) |
| 65 to 74 Years | 0 (0.0%) | 0 (0.0%) |
| 75 Years and over | 0 (0.0%) | 0 (0.0%) |
Disability Class: Cognitive Difficulty
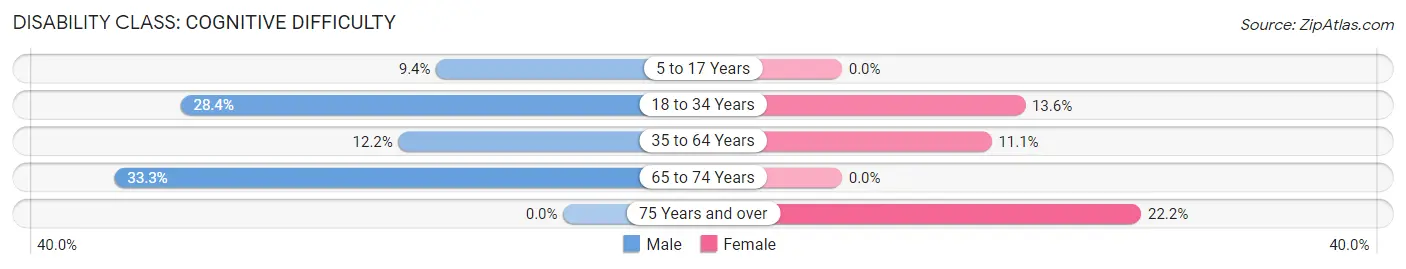
| Age Bracket | Male | Female |
| 5 to 17 Years | 5 (9.4%) | 0 (0.0%) |
| 18 to 34 Years | 27 (28.4%) | 17 (13.6%) |
| 35 to 64 Years | 17 (12.2%) | 10 (11.1%) |
| 65 to 74 Years | 10 (33.3%) | 0 (0.0%) |
| 75 Years and over | 0 (0.0%) | 2 (22.2%) |
Disability Class: Ambulatory Difficulty
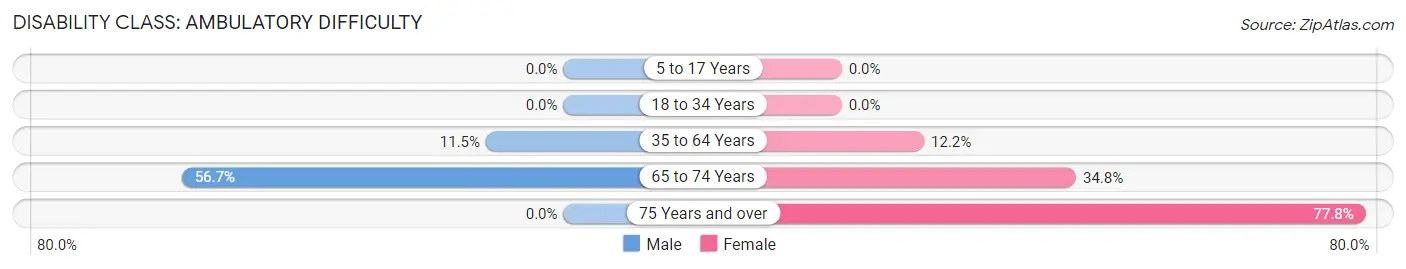
| Age Bracket | Male | Female |
| 5 to 17 Years | 0 (0.0%) | 0 (0.0%) |
| 18 to 34 Years | 0 (0.0%) | 0 (0.0%) |
| 35 to 64 Years | 16 (11.5%) | 11 (12.2%) |
| 65 to 74 Years | 17 (56.7%) | 8 (34.8%) |
| 75 Years and over | 0 (0.0%) | 7 (77.8%) |
Disability Class: Self-Care Difficulty
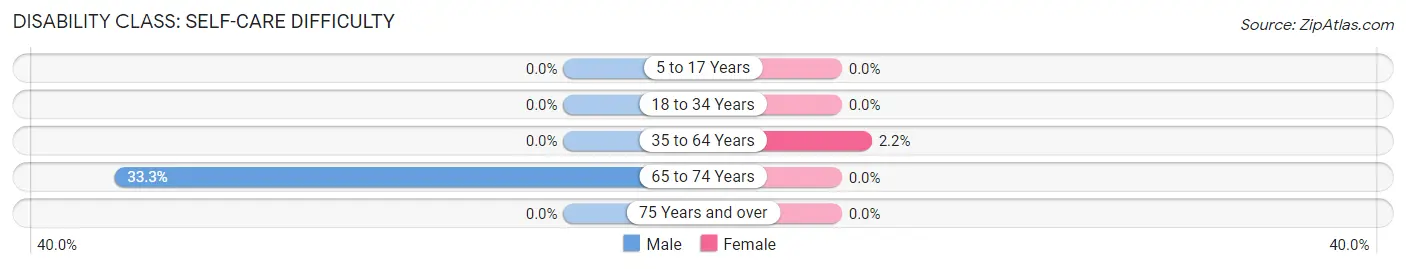
| Age Bracket | Male | Female |
| 5 to 17 Years | 0 (0.0%) | 0 (0.0%) |
| 18 to 34 Years | 0 (0.0%) | 0 (0.0%) |
| 35 to 64 Years | 0 (0.0%) | 2 (2.2%) |
| 65 to 74 Years | 10 (33.3%) | 0 (0.0%) |
| 75 Years and over | 0 (0.0%) | 0 (0.0%) |
Technology Access in Marble
Computing Device Access in Marble
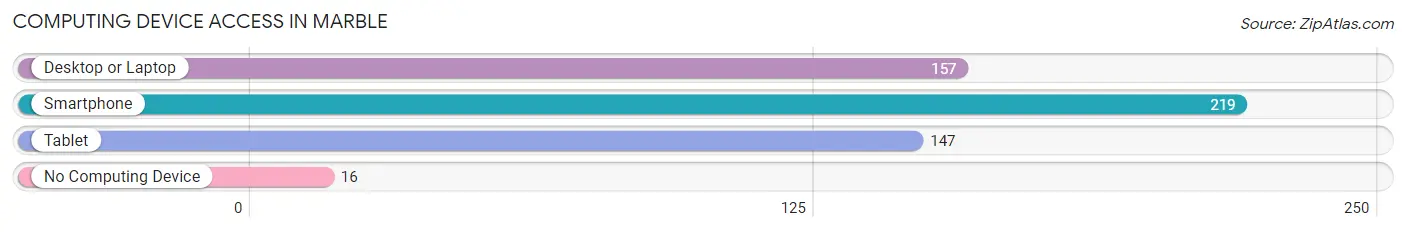
| Device Type | # Households | % Households |
| Desktop or Laptop | 157 | 62.5% |
| Smartphone | 219 | 87.3% |
| Tablet | 147 | 58.6% |
| No Computing Device | 16 | 6.4% |
| Total | 251 | 100.0% |
Internet Access in Marble
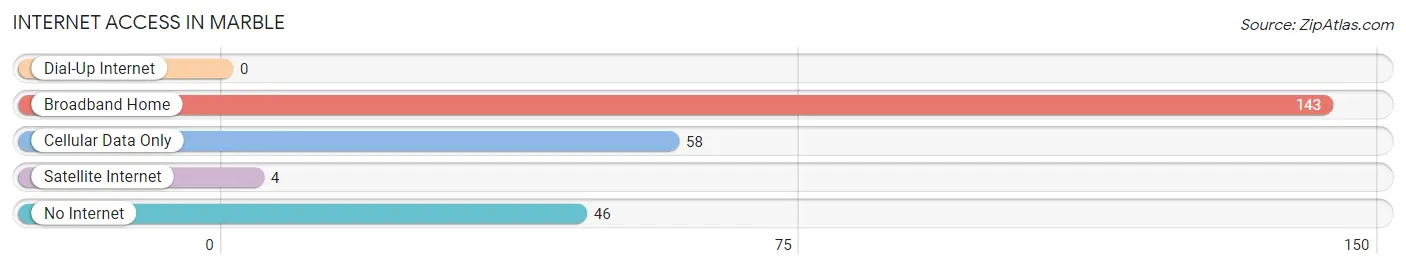
| Internet Type | # Households | % Households |
| Dial-Up Internet | 0 | 0.0% |
| Broadband Home | 143 | 57.0% |
| Cellular Data Only | 58 | 23.1% |
| Satellite Internet | 4 | 1.6% |
| No Internet | 46 | 18.3% |
| Total | 251 | 100.0% |
Marble Summary
Marble, Minnesota is a small town located in Itasca County, in the northern part of the state. It is situated on the banks of the Mississippi River, and is surrounded by the Chippewa National Forest. The town has a population of just over 500 people, and is known for its natural beauty and outdoor recreation opportunities.
History
Marble was first settled in the late 1800s by a group of Finnish immigrants. The town was originally called “Kivi”, which means “stone” in Finnish, and was later changed to Marble. The town was officially incorporated in 1906.
In the early 1900s, Marble was a thriving logging and mining town. The town was home to several sawmills, and the surrounding area was heavily logged. The town also had several marble quarries, which supplied marble for buildings and monuments throughout the state.
In the 1950s, the logging and mining industries began to decline, and the town’s economy shifted to tourism. The town is now known for its outdoor recreation opportunities, including fishing, hunting, camping, and hiking.
Geography
Marble is located in the northern part of Minnesota, in Itasca County. The town is situated on the banks of the Mississippi River, and is surrounded by the Chippewa National Forest. The town is located about 30 miles north of Grand Rapids, and about 90 miles north of Minneapolis.
The town has a total area of 0.6 square miles, all of which is land. The town is located at an elevation of 1,072 feet above sea level.
Economy
Marble’s economy is largely based on tourism. The town is known for its outdoor recreation opportunities, and attracts visitors from all over the state. The town also has several small businesses, including restaurants, shops, and lodging.
The town is also home to several logging and mining companies, which provide jobs for the local residents.
Demographics
As of the 2010 census, Marble had a population of 517 people. The racial makeup of the town was 97.3% White, 0.6% Native American, 0.2% Asian, 0.2% from other races, and 1.7% from two or more races.
The median household income in Marble was $37,500, and the median family income was $41,250. The per capita income for the town was $17,845. About 11.2% of the population was below the poverty line.
Marble is a small town with a rich history and a strong sense of community. The town is known for its outdoor recreation opportunities, and attracts visitors from all over the state. The town’s economy is largely based on tourism, and the town also has several small businesses. The town has a population of just over 500 people, and is a great place to live and visit.
Common Questions
What is Per Capita Income in Marble?
Per Capita income in Marble is $26,326.
What is the Median Family Income in Marble?
Median Family Income in Marble is $74,583.
What is the Median Household income in Marble?
Median Household Income in Marble is $51,094.
What is Income or Wage Gap in Marble?
Income or Wage Gap in Marble is 21.8%.
Women in Marble earn 78.2 cents for every dollar earned by a man.
What is Inequality or Gini Index in Marble?
Inequality or Gini Index in Marble is 0.40.
What is the Total Population of Marble?
Total Population of Marble is 614.
What is the Total Male Population of Marble?
Total Male Population of Marble is 344.
What is the Total Female Population of Marble?
Total Female Population of Marble is 270.
What is the Ratio of Males per 100 Females in Marble?
There are 127.41 Males per 100 Females in Marble.
What is the Ratio of Females per 100 Males in Marble?
There are 78.49 Females per 100 Males in Marble.
What is the Median Population Age in Marble?
Median Population Age in Marble is 33.6 Years.
What is the Average Family Size in Marble
Average Family Size in Marble is 3.0 People.
What is the Average Household Size in Marble
Average Household Size in Marble is 2.4 People.
How Large is the Labor Force in Marble?
There are 328 People in the Labor Forcein in Marble.
What is the Percentage of People in the Labor Force in Marble?
62.6% of People are in the Labor Force in Marble.
What is the Unemployment Rate in Marble?
Unemployment Rate in Marble is 7.3%.