Madison Lake, MN Map & Demographics
Madison Lake Map
Madison Lake Overview
$50,176
PER CAPITA INCOME
$109,477
AVG FAMILY INCOME
$104,583
AVG HOUSEHOLD INCOME
2.0%
WAGE / INCOME GAP [ % ]
98.0¢/ $1
WAGE / INCOME GAP [ $ ]
0.41
INEQUALITY / GINI INDEX
1,190
TOTAL POPULATION
554
MALE POPULATION
636
FEMALE POPULATION
87.11
MALES / 100 FEMALES
114.80
FEMALES / 100 MALES
40.2
MEDIAN AGE
3.0
AVG FAMILY SIZE
2.4
AVG HOUSEHOLD SIZE
695
LABOR FORCE [ PEOPLE ]
78.5%
PERCENT IN LABOR FORCE
2.4%
UNEMPLOYMENT RATE
Madison Lake Zip Codes
Madison Lake Area Codes
Income in Madison Lake
Income Overview in Madison Lake
Per Capita Income in Madison Lake is $50,176, while median incomes of families and households are $109,477 and $104,583 respectively.
| Characteristic | Number | Measure |
| Per Capita Income | 1,190 | $50,176 |
| Median Family Income | 324 | $109,477 |
| Mean Family Income | 324 | $137,944 |
| Median Household Income | 487 | $104,583 |
| Mean Household Income | 487 | $123,015 |
| Income Deficit | 324 | $0 |
| Wage / Income Gap (%) | 1,190 | 2.03% |
| Wage / Income Gap ($) | 1,190 | 97.97¢ per $1 |
| Gini / Inequality Index | 1,190 | 0.41 |
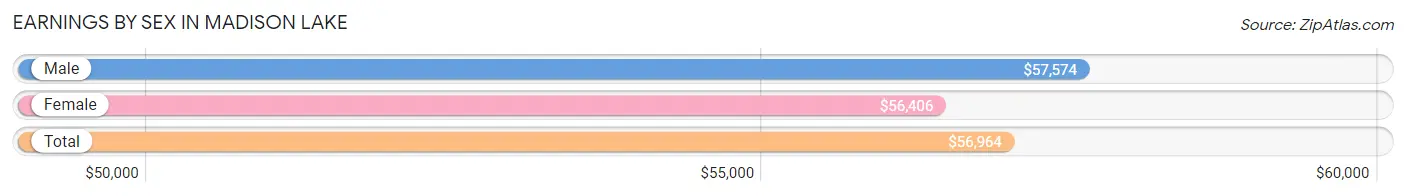
Earnings by Sex in Madison Lake
Average Earnings in Madison Lake are $56,964, $57,574 for men and $56,406 for women, a difference of 2.0%.
| Sex | Number | Average Earnings |
| Male | 395 (54.3%) | $57,574 |
| Female | 333 (45.7%) | $56,406 |
| Total | 728 (100.0%) | $56,964 |
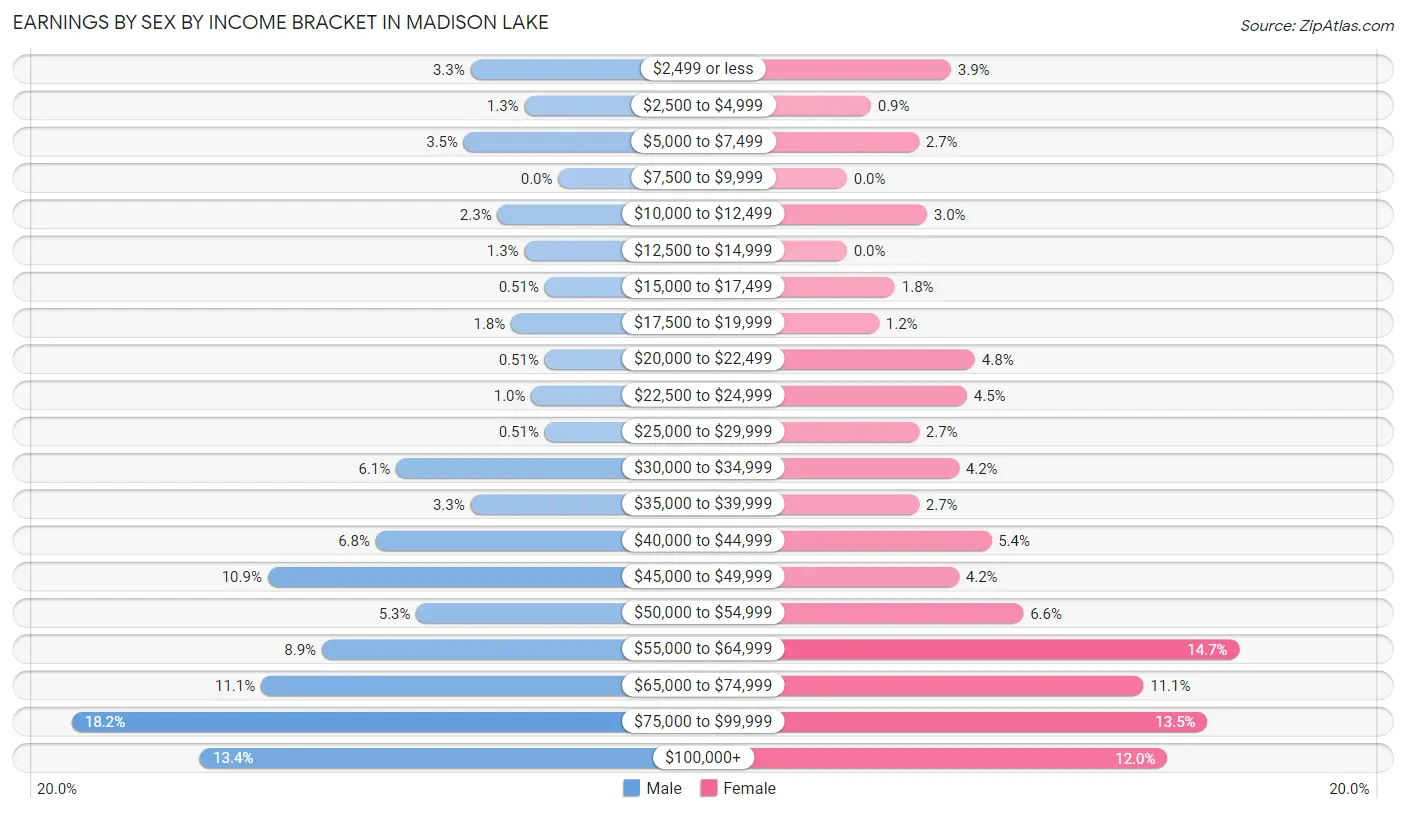
Earnings by Sex by Income Bracket in Madison Lake
The most common earnings brackets in Madison Lake are $75,000 to $99,999 for men (72 | 18.2%) and $55,000 to $64,999 for women (49 | 14.7%).
| Income | Male | Female |
| $2,499 or less | 13 (3.3%) | 13 (3.9%) |
| $2,500 to $4,999 | 5 (1.3%) | 3 (0.9%) |
| $5,000 to $7,499 | 14 (3.5%) | 9 (2.7%) |
| $7,500 to $9,999 | 0 (0.0%) | 0 (0.0%) |
| $10,000 to $12,499 | 9 (2.3%) | 10 (3.0%) |
| $12,500 to $14,999 | 5 (1.3%) | 0 (0.0%) |
| $15,000 to $17,499 | 2 (0.5%) | 6 (1.8%) |
| $17,500 to $19,999 | 7 (1.8%) | 4 (1.2%) |
| $20,000 to $22,499 | 2 (0.5%) | 16 (4.8%) |
| $22,500 to $24,999 | 4 (1.0%) | 15 (4.5%) |
| $25,000 to $29,999 | 2 (0.5%) | 9 (2.7%) |
| $30,000 to $34,999 | 24 (6.1%) | 14 (4.2%) |
| $35,000 to $39,999 | 13 (3.3%) | 9 (2.7%) |
| $40,000 to $44,999 | 27 (6.8%) | 18 (5.4%) |
| $45,000 to $49,999 | 43 (10.9%) | 14 (4.2%) |
| $50,000 to $54,999 | 21 (5.3%) | 22 (6.6%) |
| $55,000 to $64,999 | 35 (8.9%) | 49 (14.7%) |
| $65,000 to $74,999 | 44 (11.1%) | 37 (11.1%) |
| $75,000 to $99,999 | 72 (18.2%) | 45 (13.5%) |
| $100,000+ | 53 (13.4%) | 40 (12.0%) |
| Total | 395 (100.0%) | 333 (100.0%) |
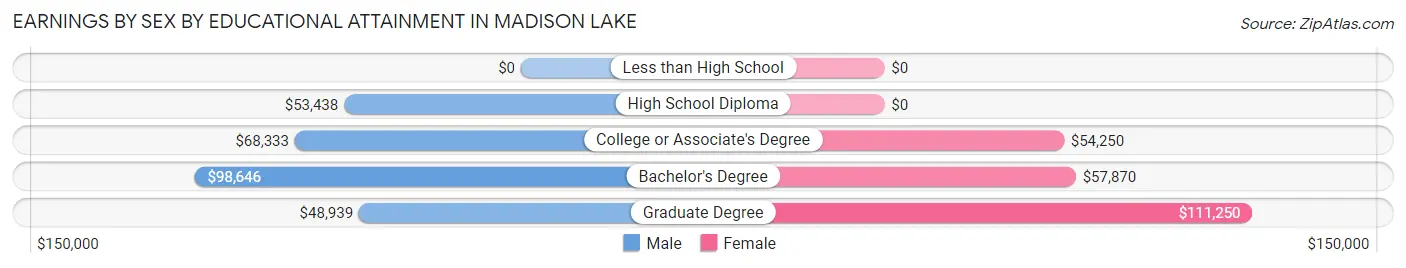
Earnings by Sex by Educational Attainment in Madison Lake
Average earnings in Madison Lake are $59,000 for men and $57,852 for women, a difference of 1.9%. Men with an educational attainment of bachelor's degree enjoy the highest average annual earnings of $98,646, while those with graduate degree education earn the least with $48,939. Women with an educational attainment of graduate degree earn the most with the average annual earnings of $111,250, while those with college or associate's degree education have the smallest earnings of $54,250.
| Educational Attainment | Male Income | Female Income |
| Less than High School | - | - |
| High School Diploma | $53,438 | $0 |
| College or Associate's Degree | $68,333 | $54,250 |
| Bachelor's Degree | $98,646 | $57,870 |
| Graduate Degree | $48,939 | $111,250 |
| Total | $59,000 | $57,852 |
Family Income in Madison Lake
Family Income Brackets in Madison Lake
According to the Madison Lake family income data, there are 105 families falling into the $100,000 to $149,999 income range, which is the most common income bracket and makes up 32.4% of all families.
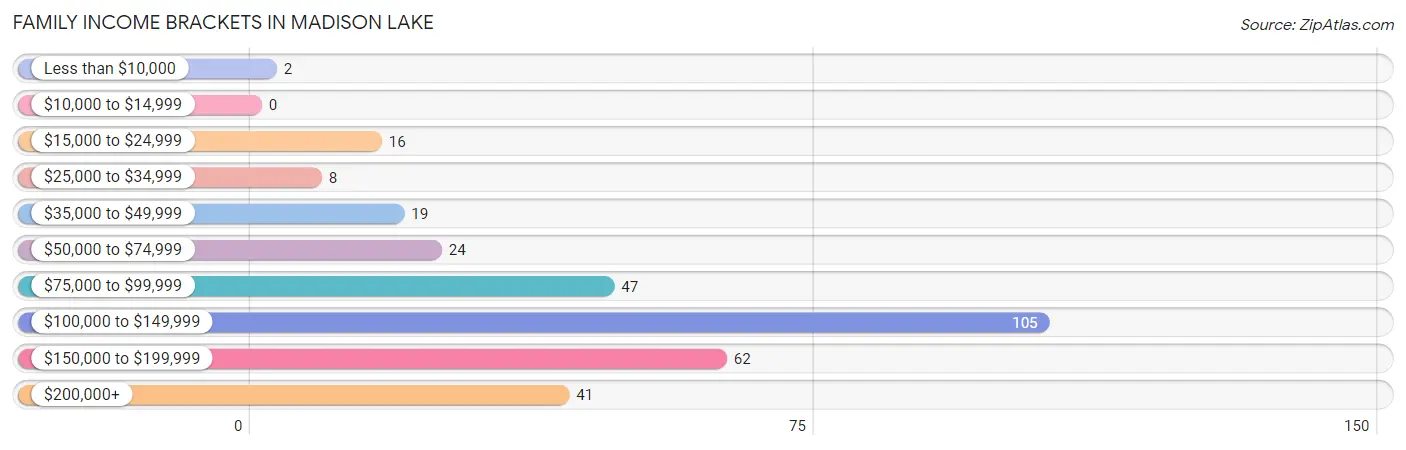
| Income Bracket | # Families | % Families |
| Less than $10,000 | 2 | 0.6% |
| $10,000 to $14,999 | 0 | 0.0% |
| $15,000 to $24,999 | 16 | 4.9% |
| $25,000 to $34,999 | 8 | 2.5% |
| $35,000 to $49,999 | 19 | 5.9% |
| $50,000 to $74,999 | 24 | 7.4% |
| $75,000 to $99,999 | 47 | 14.5% |
| $100,000 to $149,999 | 105 | 32.4% |
| $150,000 to $199,999 | 62 | 19.1% |
| $200,000+ | 41 | 12.7% |
Family Income by Famaliy Size in Madison Lake
5-person families (34 | 10.5%) account for the highest median family income in Madison Lake with $190,000 per family, while 2-person families (172 | 53.1%) have the highest median income of $50,834 per family member.
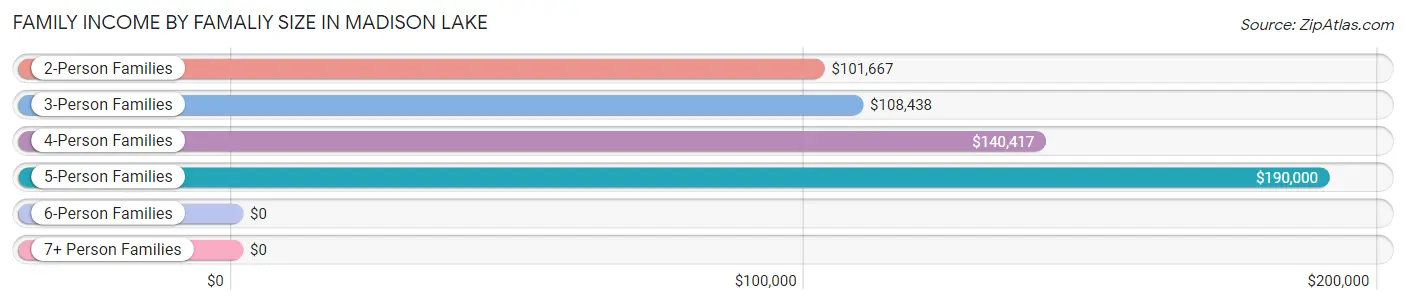
| Income Bracket | # Families | Median Income |
| 2-Person Families | 172 (53.1%) | $101,667 |
| 3-Person Families | 53 (16.4%) | $108,438 |
| 4-Person Families | 61 (18.8%) | $140,417 |
| 5-Person Families | 34 (10.5%) | $190,000 |
| 6-Person Families | 4 (1.2%) | $0 |
| 7+ Person Families | 0 (0.0%) | $0 |
| Total | 324 (100.0%) | $109,477 |
Family Income by Number of Earners in Madison Lake
The median family income in Madison Lake is $109,477, with families comprising 2 earners (191) having the highest median family income of $140,795, while families with 1 earner (83) have the lowest median family income of $57,083, accounting for 59.0% and 25.6% of families, respectively.
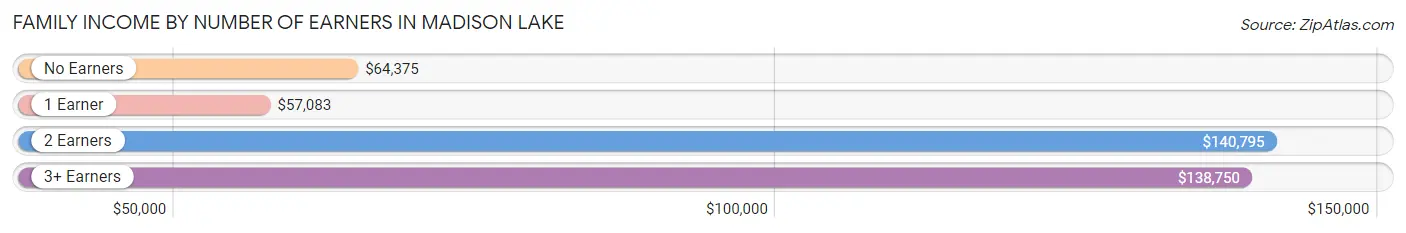
| Number of Earners | # Families | Median Income |
| No Earners | 17 (5.2%) | $64,375 |
| 1 Earner | 83 (25.6%) | $57,083 |
| 2 Earners | 191 (59.0%) | $140,795 |
| 3+ Earners | 33 (10.2%) | $138,750 |
| Total | 324 (100.0%) | $109,477 |
Household Income in Madison Lake
Household Income Brackets in Madison Lake
With 133 households falling in the category, the $100,000 to $149,999 income range is the most frequent in Madison Lake, accounting for 27.3% of all households. In contrast, only 2 households (0.4%) fall into the less than $10,000 income bracket, making it the least populous group.
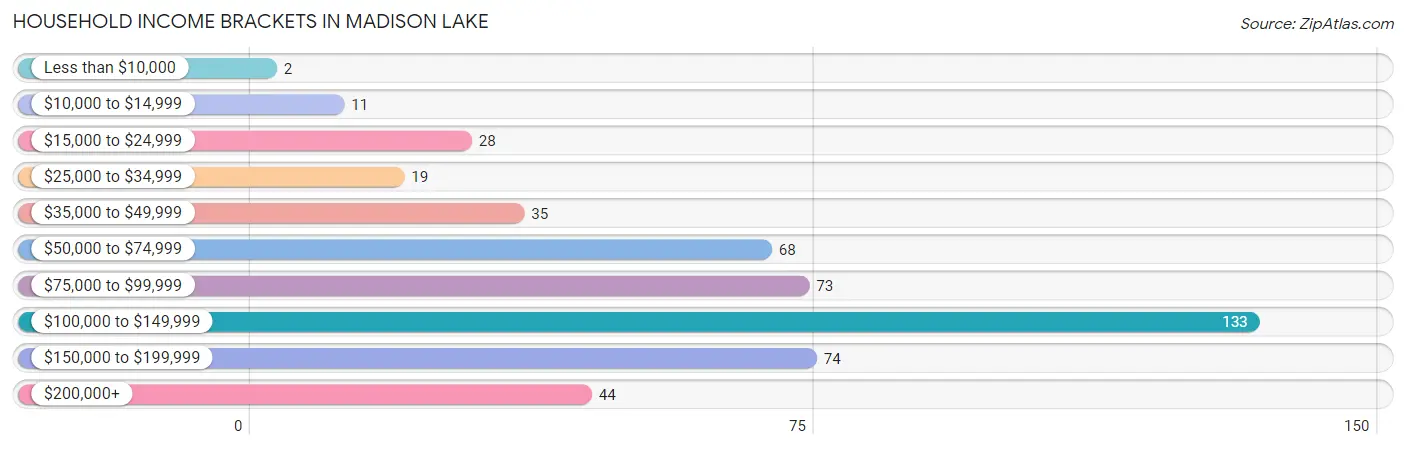
| Income Bracket | # Households | % Households |
| Less than $10,000 | 2 | 0.4% |
| $10,000 to $14,999 | 11 | 2.3% |
| $15,000 to $24,999 | 28 | 5.7% |
| $25,000 to $34,999 | 19 | 3.9% |
| $35,000 to $49,999 | 35 | 7.2% |
| $50,000 to $74,999 | 68 | 14.0% |
| $75,000 to $99,999 | 73 | 15.0% |
| $100,000 to $149,999 | 133 | 27.3% |
| $150,000 to $199,999 | 74 | 15.2% |
| $200,000+ | 44 | 9.0% |
Household Income by Householder Age in Madison Lake
The median household income in Madison Lake is $104,583, with the highest median household income of $135,673 found in the 25 to 44 years age bracket for the primary householder. A total of 169 households (34.7%) fall into this category. Meanwhile, the 15 to 24 years age bracket for the primary householder has the lowest median household income of $0, with 5 households (1.0%) in this group.
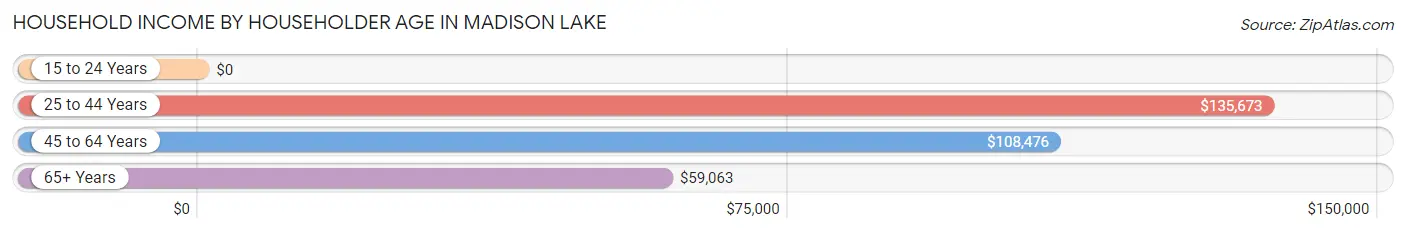
| Income Bracket | # Households | Median Income |
| 15 to 24 Years | 5 (1.0%) | $0 |
| 25 to 44 Years | 169 (34.7%) | $135,673 |
| 45 to 64 Years | 186 (38.2%) | $108,476 |
| 65+ Years | 127 (26.1%) | $59,063 |
| Total | 487 (100.0%) | $104,583 |
Poverty in Madison Lake
Income Below Poverty by Sex and Age in Madison Lake
With 0.4% poverty level for males and 3.6% for females among the residents of Madison Lake, 65 to 74 year old males and 55 to 64 year old females are the most vulnerable to poverty, with 2 males (3.2%) and 11 females (15.5%) in their respective age groups living below the poverty level.
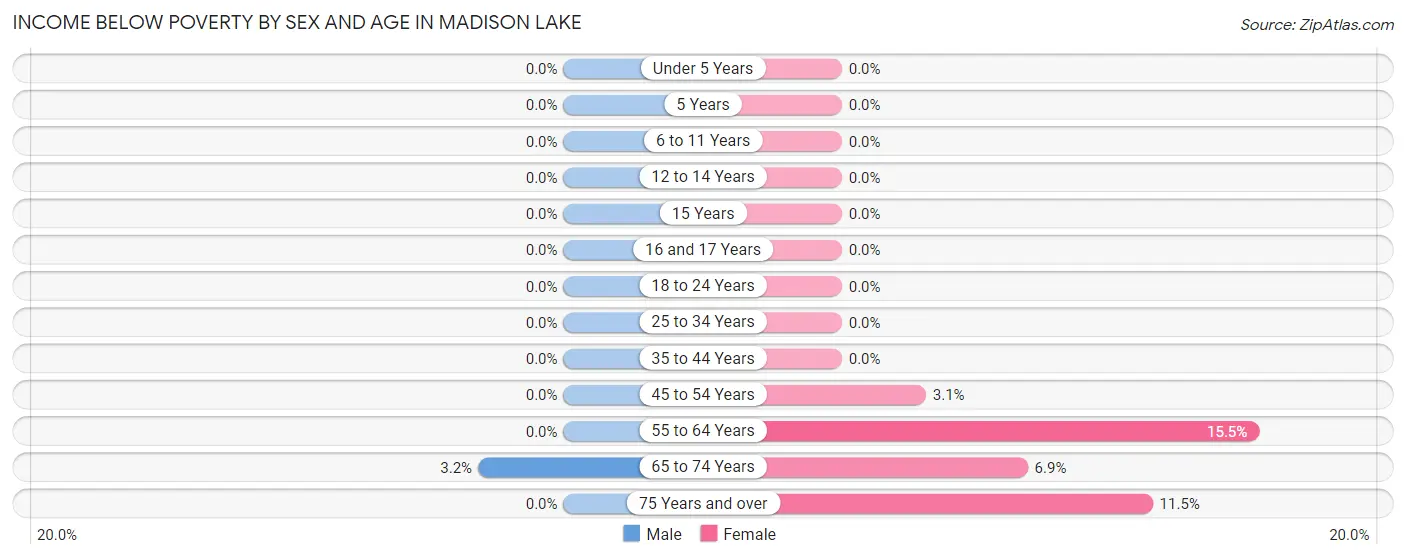
| Age Bracket | Male | Female |
| Under 5 Years | 0 (0.0%) | 0 (0.0%) |
| 5 Years | 0 (0.0%) | 0 (0.0%) |
| 6 to 11 Years | 0 (0.0%) | 0 (0.0%) |
| 12 to 14 Years | 0 (0.0%) | 0 (0.0%) |
| 15 Years | 0 (0.0%) | 0 (0.0%) |
| 16 and 17 Years | 0 (0.0%) | 0 (0.0%) |
| 18 to 24 Years | 0 (0.0%) | 0 (0.0%) |
| 25 to 34 Years | 0 (0.0%) | 0 (0.0%) |
| 35 to 44 Years | 0 (0.0%) | 0 (0.0%) |
| 45 to 54 Years | 0 (0.0%) | 3 (3.1%) |
| 55 to 64 Years | 0 (0.0%) | 11 (15.5%) |
| 65 to 74 Years | 2 (3.2%) | 6 (6.9%) |
| 75 Years and over | 0 (0.0%) | 3 (11.5%) |
| Total | 2 (0.4%) | 23 (3.6%) |
Income Above Poverty by Sex and Age in Madison Lake
According to the poverty statistics in Madison Lake, males aged under 5 years and females aged under 5 years are the age groups that are most secure financially, with 100.0% of males and 100.0% of females in these age groups living above the poverty line.
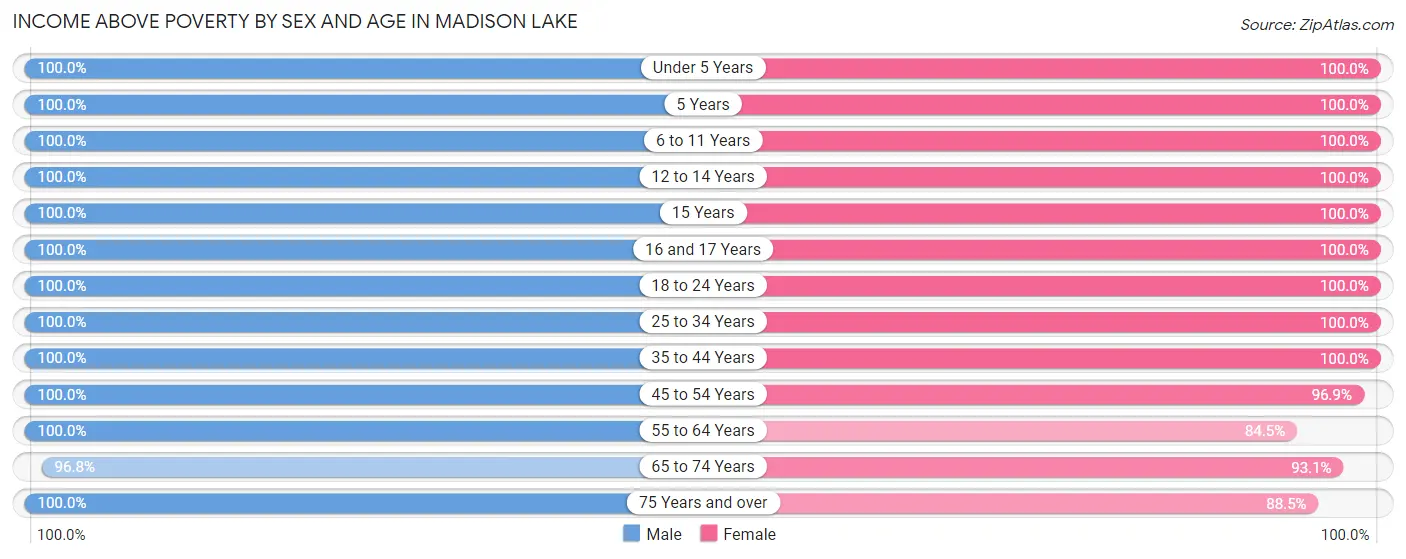
| Age Bracket | Male | Female |
| Under 5 Years | 23 (100.0%) | 39 (100.0%) |
| 5 Years | 12 (100.0%) | 42 (100.0%) |
| 6 to 11 Years | 56 (100.0%) | 42 (100.0%) |
| 12 to 14 Years | 23 (100.0%) | 48 (100.0%) |
| 15 Years | 3 (100.0%) | 17 (100.0%) |
| 16 and 17 Years | 11 (100.0%) | 13 (100.0%) |
| 18 to 24 Years | 25 (100.0%) | 13 (100.0%) |
| 25 to 34 Years | 54 (100.0%) | 62 (100.0%) |
| 35 to 44 Years | 101 (100.0%) | 80 (100.0%) |
| 45 to 54 Years | 107 (100.0%) | 93 (96.9%) |
| 55 to 64 Years | 61 (100.0%) | 60 (84.5%) |
| 65 to 74 Years | 61 (96.8%) | 81 (93.1%) |
| 75 Years and over | 15 (100.0%) | 23 (88.5%) |
| Total | 552 (99.6%) | 613 (96.4%) |
Income Below Poverty Among Married-Couple Families in Madison Lake
The poverty statistics for married-couple families in Madison Lake show that 0.7% or 2 of the total 273 families live below the poverty line. Families with no children have the highest poverty rate of 1.2%, comprising of 2 families. On the other hand, families with 1 or 2 children have the lowest poverty rate of 0.0%, which includes 0 families.
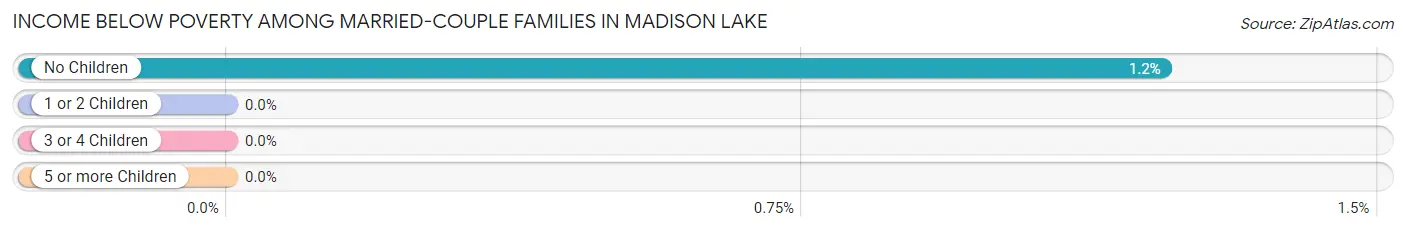
| Children | Above Poverty | Below Poverty |
| No Children | 162 (98.8%) | 2 (1.2%) |
| 1 or 2 Children | 71 (100.0%) | 0 (0.0%) |
| 3 or 4 Children | 38 (100.0%) | 0 (0.0%) |
| 5 or more Children | 0 (0.0%) | 0 (0.0%) |
| Total | 271 (99.3%) | 2 (0.7%) |
Income Below Poverty Among Single-Parent Households in Madison Lake
| Children | Single Father | Single Mother |
| No Children | 0 (0.0%) | 0 (0.0%) |
| 1 or 2 Children | 0 (0.0%) | 0 (0.0%) |
| 3 or 4 Children | 0 (0.0%) | 0 (0.0%) |
| 5 or more Children | 0 (0.0%) | 0 (0.0%) |
| Total | 0 (0.0%) | 0 (0.0%) |
Income Below Poverty Among Married-Couple vs Single-Parent Households in Madison Lake
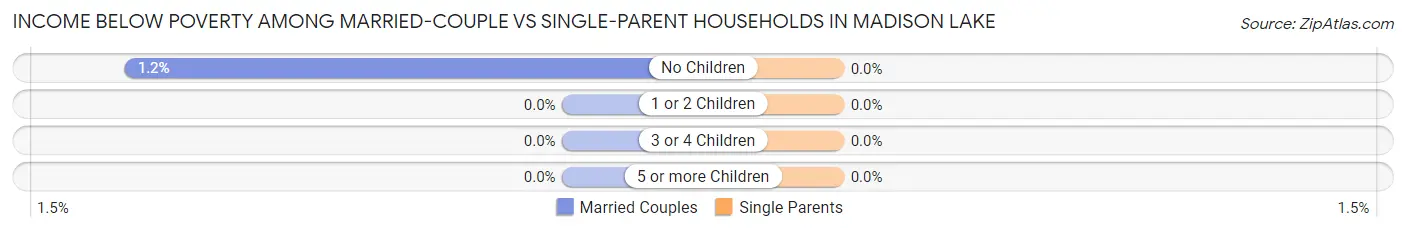
| Children | Married-Couple Families | Single-Parent Households |
| No Children | 2 (1.2%) | 0 (0.0%) |
| 1 or 2 Children | 0 (0.0%) | 0 (0.0%) |
| 3 or 4 Children | 0 (0.0%) | 0 (0.0%) |
| 5 or more Children | 0 (0.0%) | 0 (0.0%) |
| Total | 2 (0.7%) | 0 (0.0%) |
Race in Madison Lake
The most populous races in Madison Lake are White / Caucasian (1,101 | 92.5%), Two or more Races (87 | 7.3%), and Hispanic or Latino (6 | 0.5%).
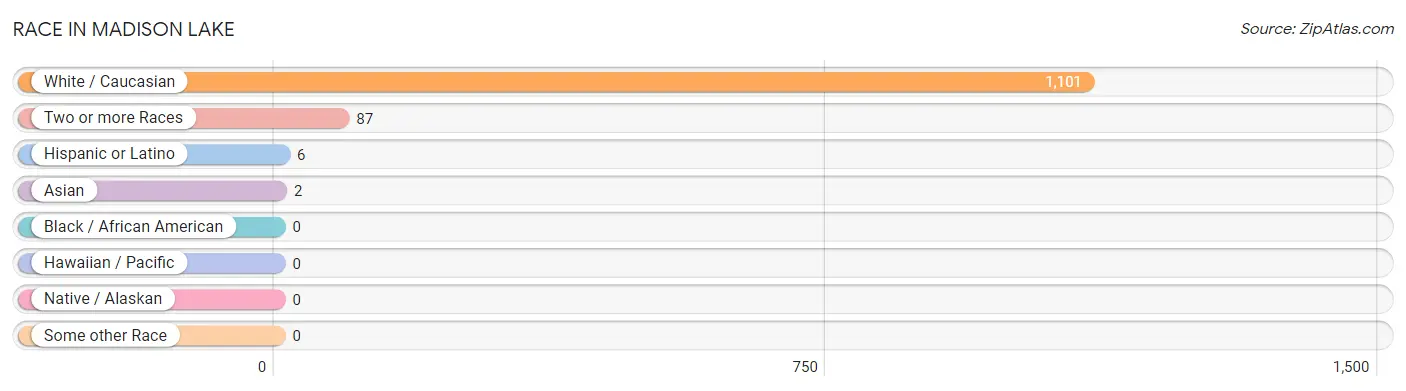
| Race | # Population | % Population |
| Asian | 2 | 0.2% |
| Black / African American | 0 | 0.0% |
| Hawaiian / Pacific | 0 | 0.0% |
| Hispanic or Latino | 6 | 0.5% |
| Native / Alaskan | 0 | 0.0% |
| White / Caucasian | 1,101 | 92.5% |
| Two or more Races | 87 | 7.3% |
| Some other Race | 0 | 0.0% |
| Total | 1,190 | 100.0% |
Ancestry in Madison Lake
The most populous ancestries reported in Madison Lake are German (696 | 58.5%), Irish (178 | 15.0%), Norwegian (106 | 8.9%), English (94 | 7.9%), and Swedish (89 | 7.5%), together accounting for 97.7% of all Madison Lake residents.
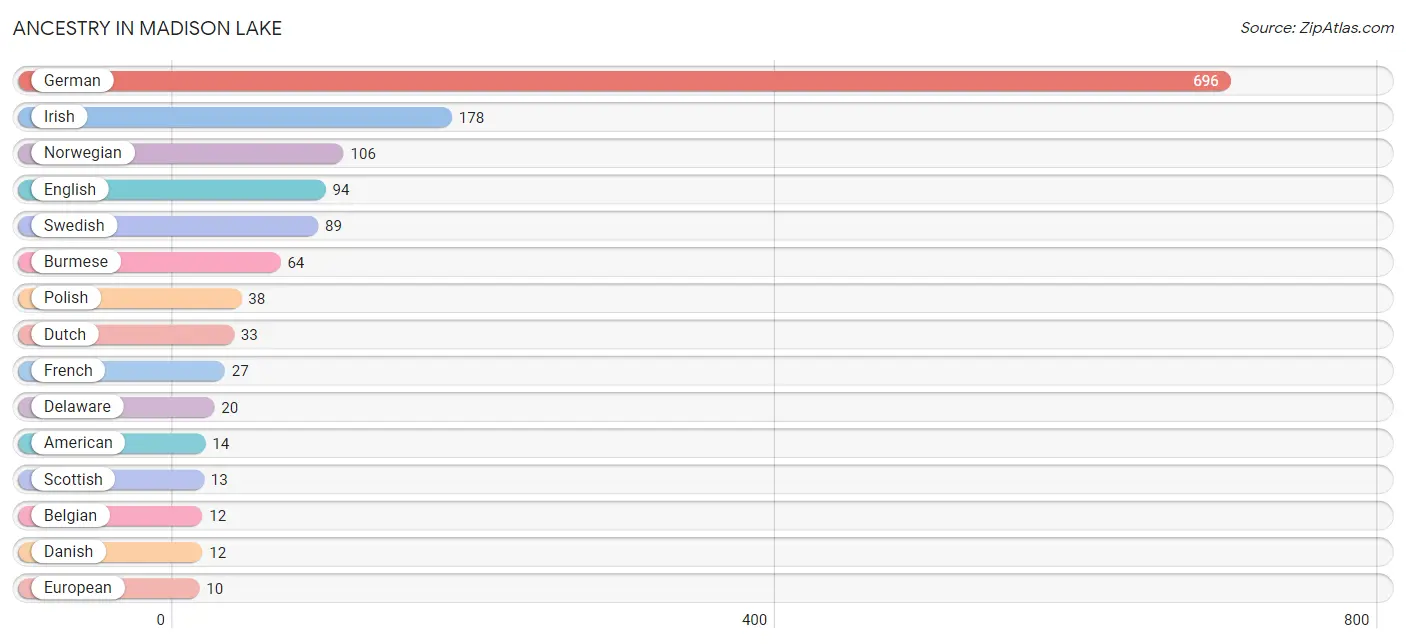
| Ancestry | # Population | % Population |
| American | 14 | 1.2% |
| Belgian | 12 | 1.0% |
| Burmese | 64 | 5.4% |
| Czech | 3 | 0.3% |
| Danish | 12 | 1.0% |
| Delaware | 20 | 1.7% |
| Dutch | 33 | 2.8% |
| Eastern European | 1 | 0.1% |
| English | 94 | 7.9% |
| European | 10 | 0.8% |
| French | 27 | 2.3% |
| French Canadian | 4 | 0.3% |
| German | 696 | 58.5% |
| Greek | 3 | 0.3% |
| Irish | 178 | 15.0% |
| Italian | 9 | 0.8% |
| Latvian | 3 | 0.3% |
| Northern European | 3 | 0.3% |
| Norwegian | 106 | 8.9% |
| Polish | 38 | 3.2% |
| Russian | 3 | 0.3% |
| Scandinavian | 5 | 0.4% |
| Scotch-Irish | 2 | 0.2% |
| Scottish | 13 | 1.1% |
| Swedish | 89 | 7.5% |
| Swiss | 2 | 0.2% |
| Welsh | 7 | 0.6% | View All 27 Rows |
Immigrants in Madison Lake
The most numerous immigrant groups reported in Madison Lake came from Europe (3 | 0.3%), Greece (3 | 0.3%), Southern Europe (3 | 0.3%), Asia (2 | 0.2%), and Eastern Asia (2 | 0.2%), together accounting for 1.1% of all Madison Lake residents.
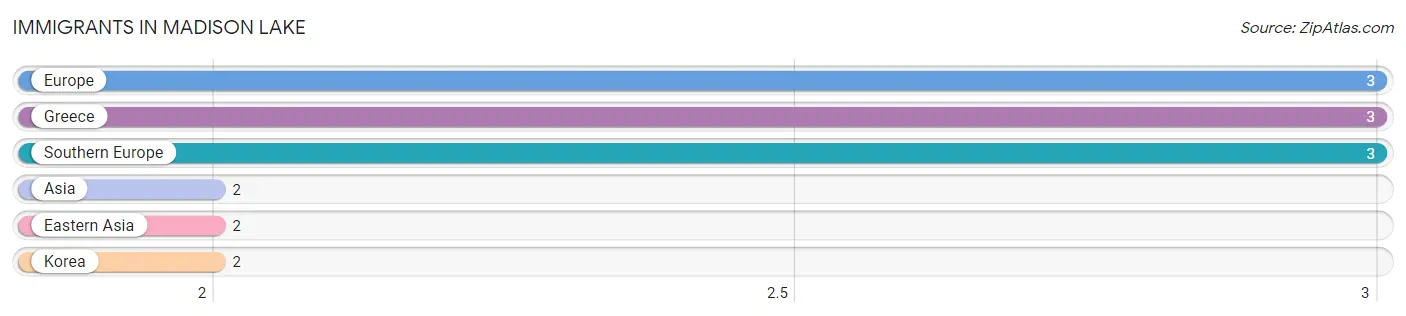
| Immigration Origin | # Population | % Population |
| Asia | 2 | 0.2% |
| Eastern Asia | 2 | 0.2% |
| Europe | 3 | 0.3% |
| Greece | 3 | 0.3% |
| Korea | 2 | 0.2% |
| Southern Europe | 3 | 0.3% | View All 6 Rows |
Sex and Age in Madison Lake
Sex and Age in Madison Lake
The most populous age groups in Madison Lake are 50 to 54 Years (71 | 12.8%) for men and 5 to 9 Years (76 | 11.9%) for women.
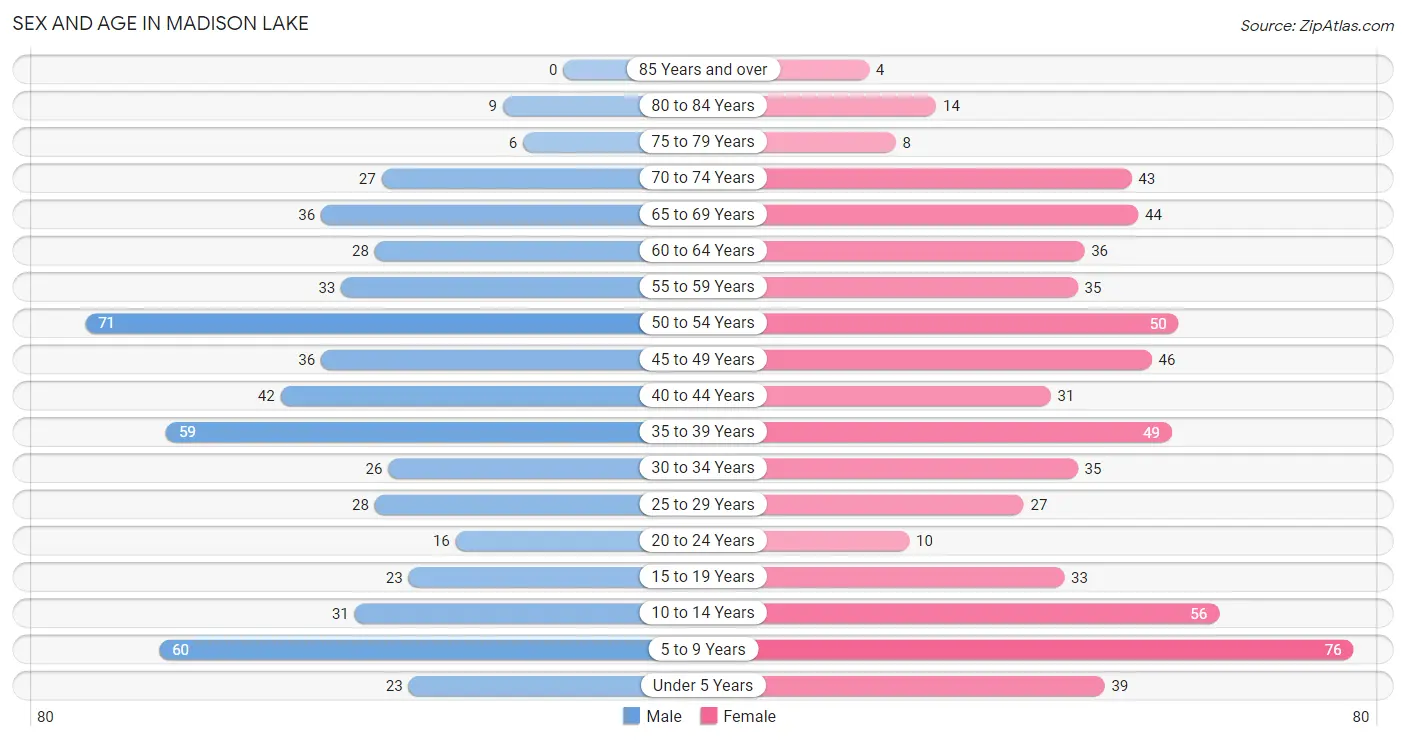
| Age Bracket | Male | Female |
| Under 5 Years | 23 (4.2%) | 39 (6.1%) |
| 5 to 9 Years | 60 (10.8%) | 76 (11.9%) |
| 10 to 14 Years | 31 (5.6%) | 56 (8.8%) |
| 15 to 19 Years | 23 (4.2%) | 33 (5.2%) |
| 20 to 24 Years | 16 (2.9%) | 10 (1.6%) |
| 25 to 29 Years | 28 (5.1%) | 27 (4.3%) |
| 30 to 34 Years | 26 (4.7%) | 35 (5.5%) |
| 35 to 39 Years | 59 (10.6%) | 49 (7.7%) |
| 40 to 44 Years | 42 (7.6%) | 31 (4.9%) |
| 45 to 49 Years | 36 (6.5%) | 46 (7.2%) |
| 50 to 54 Years | 71 (12.8%) | 50 (7.9%) |
| 55 to 59 Years | 33 (6.0%) | 35 (5.5%) |
| 60 to 64 Years | 28 (5.1%) | 36 (5.7%) |
| 65 to 69 Years | 36 (6.5%) | 44 (6.9%) |
| 70 to 74 Years | 27 (4.9%) | 43 (6.8%) |
| 75 to 79 Years | 6 (1.1%) | 8 (1.3%) |
| 80 to 84 Years | 9 (1.6%) | 14 (2.2%) |
| 85 Years and over | 0 (0.0%) | 4 (0.6%) |
| Total | 554 (100.0%) | 636 (100.0%) |
Families and Households in Madison Lake
Median Family Size in Madison Lake
The median family size in Madison Lake is 3.02 persons per family, with married-couple families (273 | 84.3%) accounting for the largest median family size of 3.13 persons per family. On the other hand, single female/mother families (26 | 8.0%) represent the smallest median family size with 2.23 persons per family.
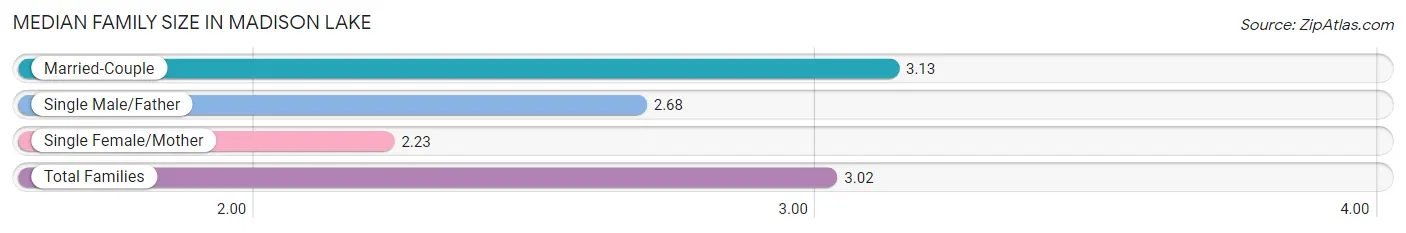
| Family Type | # Families | Family Size |
| Married-Couple | 273 (84.3%) | 3.13 |
| Single Male/Father | 25 (7.7%) | 2.68 |
| Single Female/Mother | 26 (8.0%) | 2.23 |
| Total Families | 324 (100.0%) | 3.02 |
Median Household Size in Madison Lake
The median household size in Madison Lake is 2.44 persons per household, with married-couple households (273 | 56.1%) accounting for the largest median household size of 3.13 persons per household. non-family households (163 | 33.5%) represent the smallest median household size with 1.17 persons per household.
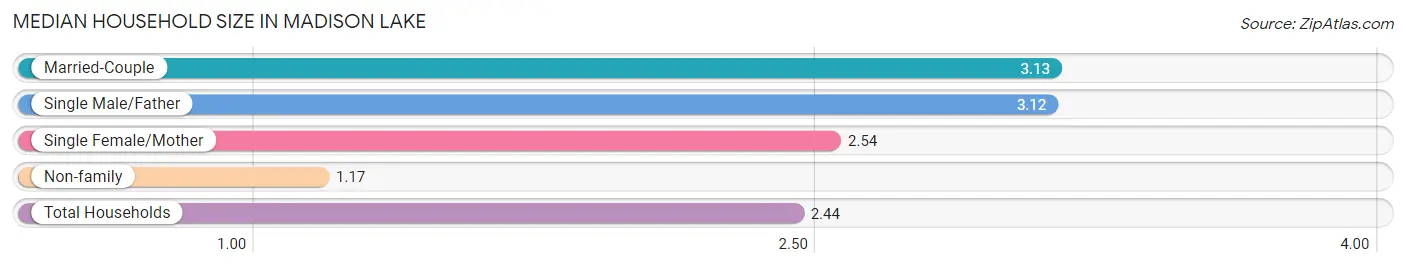
| Household Type | # Households | Household Size |
| Married-Couple | 273 (56.1%) | 3.13 |
| Single Male/Father | 25 (5.1%) | 3.12 |
| Single Female/Mother | 26 (5.3%) | 2.54 |
| Non-family | 163 (33.5%) | 1.17 |
| Total Households | 487 (100.0%) | 2.44 |
Household Size by Marriage Status in Madison Lake
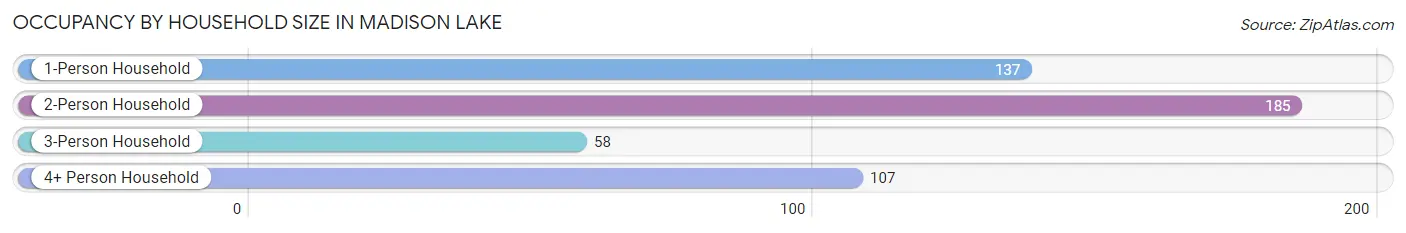
Out of a total of 487 households in Madison Lake, 324 (66.5%) are family households, while 163 (33.5%) are nonfamily households. The most numerous type of family households are 2-person households, comprising 161, and the most common type of nonfamily households are 1-person households, comprising 137.
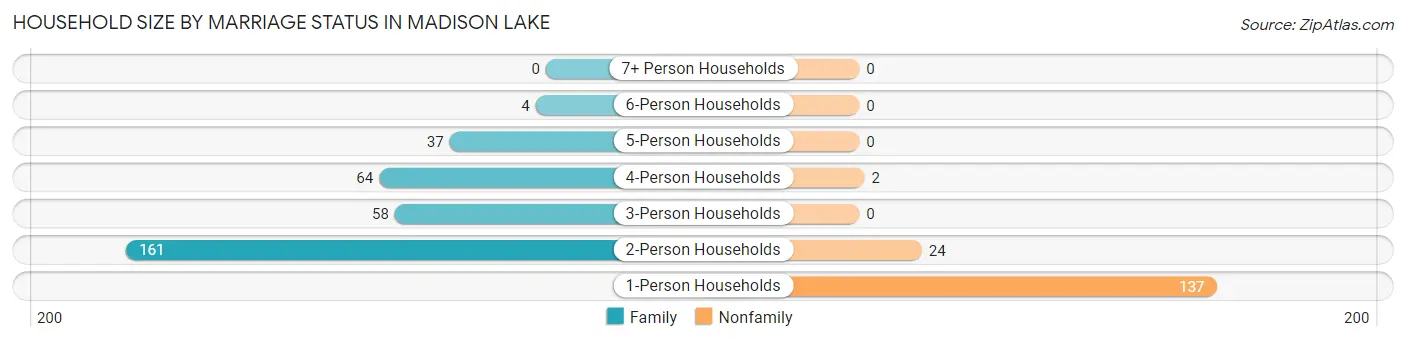
| Household Size | Family Households | Nonfamily Households |
| 1-Person Households | - | 137 (28.1%) |
| 2-Person Households | 161 (33.1%) | 24 (4.9%) |
| 3-Person Households | 58 (11.9%) | 0 (0.0%) |
| 4-Person Households | 64 (13.1%) | 2 (0.4%) |
| 5-Person Households | 37 (7.6%) | 0 (0.0%) |
| 6-Person Households | 4 (0.8%) | 0 (0.0%) |
| 7+ Person Households | 0 (0.0%) | 0 (0.0%) |
| Total | 324 (66.5%) | 163 (33.5%) |
Female Fertility in Madison Lake
Fertility by Age in Madison Lake
Average fertility rate in Madison Lake is 124.0 births per 1,000 women. Women in the age bracket of 35 to 50 years have the highest fertility rate with 156.0 births per 1,000 women. Women in the age bracket of 35 to 50 years acount for 69.0% of all women with births.
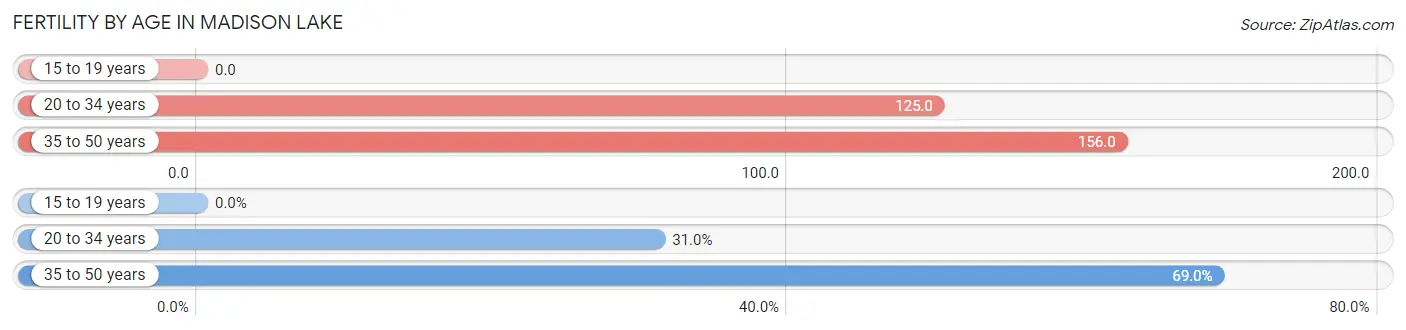
| Age Bracket | Women with Births | Births / 1,000 Women |
| 15 to 19 years | 0 (0.0%) | 0.0 |
| 20 to 34 years | 9 (31.0%) | 125.0 |
| 35 to 50 years | 20 (69.0%) | 156.0 |
| Total | 29 (100.0%) | 124.0 |
Fertility by Age by Marriage Status in Madison Lake
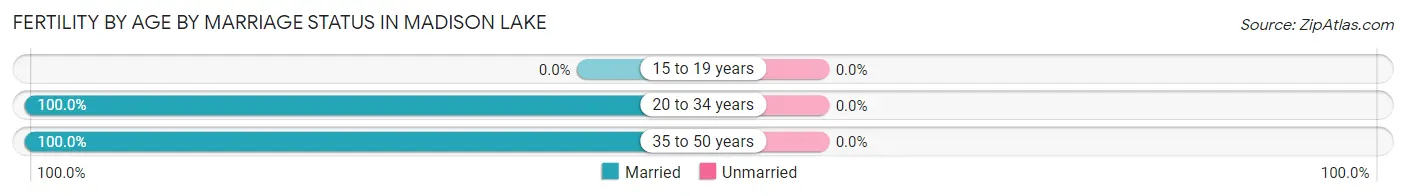
| Age Bracket | Married | Unmarried |
| 15 to 19 years | 0 (0.0%) | 0 (0.0%) |
| 20 to 34 years | 9 (100.0%) | 0 (0.0%) |
| 35 to 50 years | 20 (100.0%) | 0 (0.0%) |
| Total | 29 (100.0%) | 0 (0.0%) |
Fertility by Education in Madison Lake
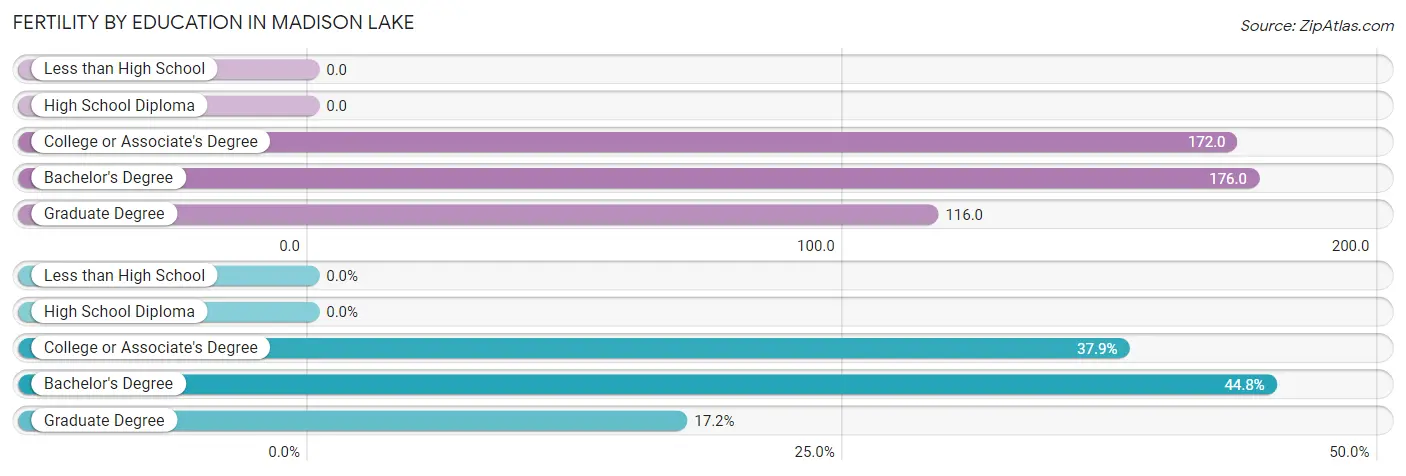
| Educational Attainment | Women with Births | Births / 1,000 Women |
| Less than High School | 0 (0.0%) | 0.0 |
| High School Diploma | 0 (0.0%) | 0.0 |
| College or Associate's Degree | 11 (37.9%) | 172.0 |
| Bachelor's Degree | 13 (44.8%) | 176.0 |
| Graduate Degree | 5 (17.2%) | 116.0 |
| Total | 29 (100.0%) | 124.0 |
Fertility by Education by Marriage Status in Madison Lake
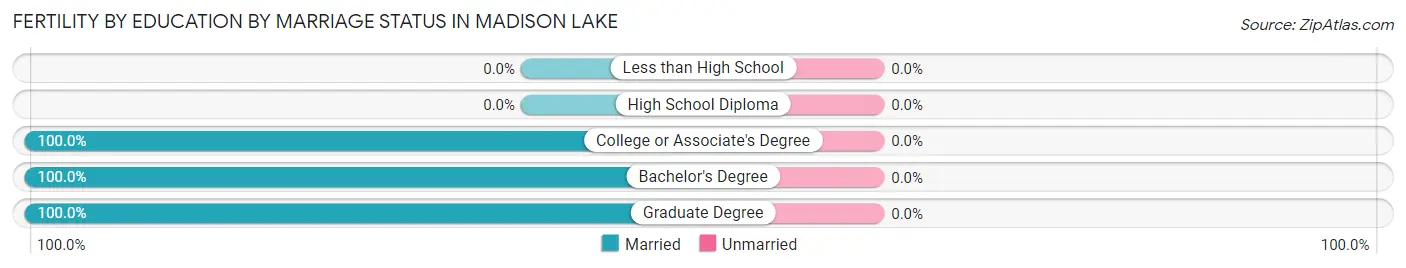
| Educational Attainment | Married | Unmarried |
| Less than High School | 0 (0.0%) | 0 (0.0%) |
| High School Diploma | 0 (0.0%) | 0 (0.0%) |
| College or Associate's Degree | 11 (100.0%) | 0 (0.0%) |
| Bachelor's Degree | 13 (100.0%) | 0 (0.0%) |
| Graduate Degree | 5 (100.0%) | 0 (0.0%) |
| Total | 29 (100.0%) | 0 (0.0%) |
Employment Characteristics in Madison Lake
Employment by Class of Employer in Madison Lake
Among the 668 employed individuals in Madison Lake, private company employees (407 | 60.9%), not-for-profit organizations (106 | 15.9%), and self-employed (incorporated) (56 | 8.4%) make up the most common classes of employment.
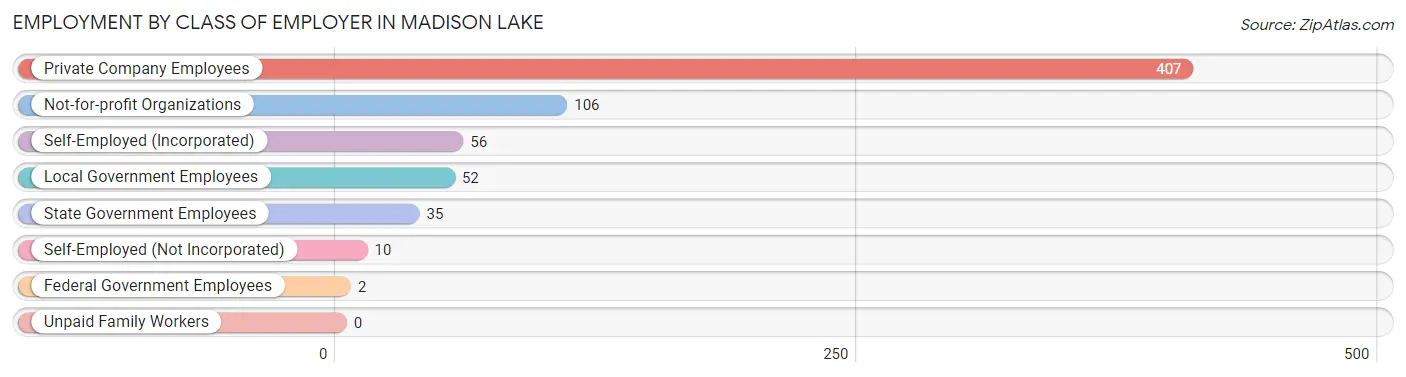
| Employer Class | # Employees | % Employees |
| Private Company Employees | 407 | 60.9% |
| Self-Employed (Incorporated) | 56 | 8.4% |
| Self-Employed (Not Incorporated) | 10 | 1.5% |
| Not-for-profit Organizations | 106 | 15.9% |
| Local Government Employees | 52 | 7.8% |
| State Government Employees | 35 | 5.2% |
| Federal Government Employees | 2 | 0.3% |
| Unpaid Family Workers | 0 | 0.0% |
| Total | 668 | 100.0% |
Employment Status by Age in Madison Lake
According to the labor force statistics for Madison Lake, out of the total population over 16 years of age (885), 78.5% or 695 individuals are in the labor force, with 2.4% or 17 of them unemployed. The age group with the highest labor force participation rate is 20 to 24 years, with 100.0% or 26 individuals in the labor force. Within the labor force, the 16 to 19 years age range has the highest percentage of unemployed individuals, with 21.7% or 5 of them being unemployed.
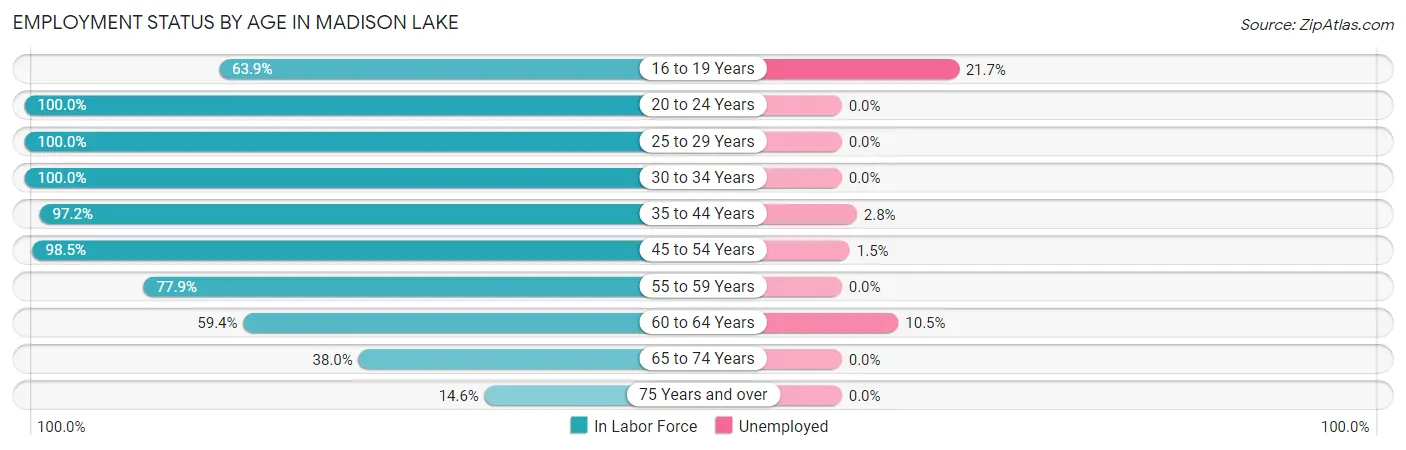
| Age Bracket | In Labor Force | Unemployed |
| 16 to 19 Years | 23 (63.9%) | 5 (21.7%) |
| 20 to 24 Years | 26 (100.0%) | 0 (0.0%) |
| 25 to 29 Years | 55 (100.0%) | 0 (0.0%) |
| 30 to 34 Years | 61 (100.0%) | 0 (0.0%) |
| 35 to 44 Years | 176 (97.2%) | 5 (2.8%) |
| 45 to 54 Years | 200 (98.5%) | 3 (1.5%) |
| 55 to 59 Years | 53 (77.9%) | 0 (0.0%) |
| 60 to 64 Years | 38 (59.4%) | 4 (10.5%) |
| 65 to 74 Years | 57 (38.0%) | 0 (0.0%) |
| 75 Years and over | 6 (14.6%) | 0 (0.0%) |
| Total | 695 (78.5%) | 17 (2.4%) |
Employment Status by Educational Attainment in Madison Lake
According to labor force statistics for Madison Lake, 92.2% of individuals (583) out of the total population between 25 and 64 years of age (632) are in the labor force, with 2.1% or 12 of them being unemployed. The group with the highest labor force participation rate are those with the educational attainment of bachelor's degree or higher, with 95.6% or 284 individuals in the labor force. Within the labor force, individuals with bachelor's degree or higher education have the highest percentage of unemployment, with 3.2% or 9 of them being unemployed.
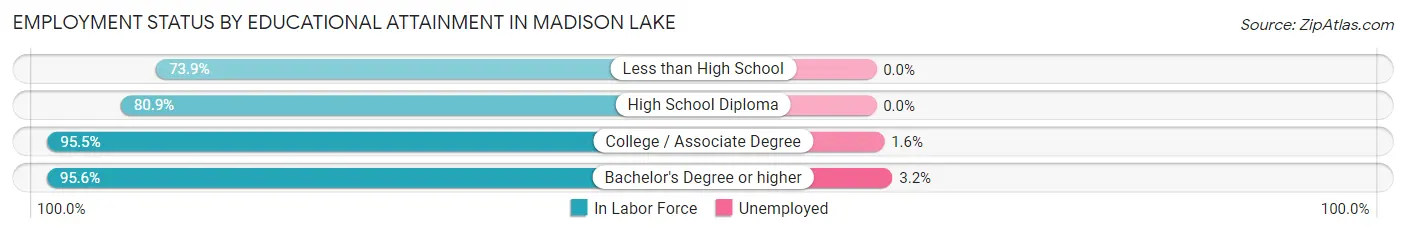
| Educational Attainment | In Labor Force | Unemployed |
| Less than High School | 17 (73.9%) | 0 (0.0%) |
| High School Diploma | 89 (80.9%) | 0 (0.0%) |
| College / Associate Degree | 193 (95.5%) | 3 (1.6%) |
| Bachelor's Degree or higher | 284 (95.6%) | 10 (3.2%) |
| Total | 583 (92.2%) | 13 (2.1%) |
Employment Occupations by Sex in Madison Lake
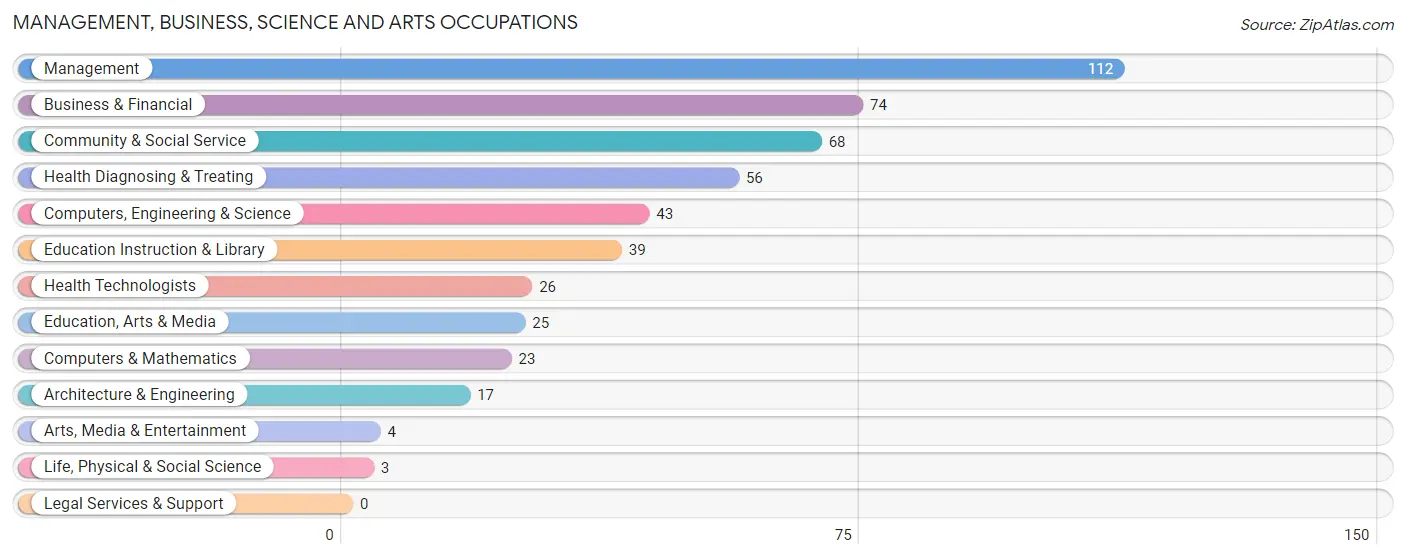
Management, Business, Science and Arts Occupations
The most common Management, Business, Science and Arts occupations in Madison Lake are Management (112 | 16.5%), Business & Financial (74 | 10.9%), Community & Social Service (68 | 10.0%), Health Diagnosing & Treating (56 | 8.3%), and Computers, Engineering & Science (43 | 6.3%).
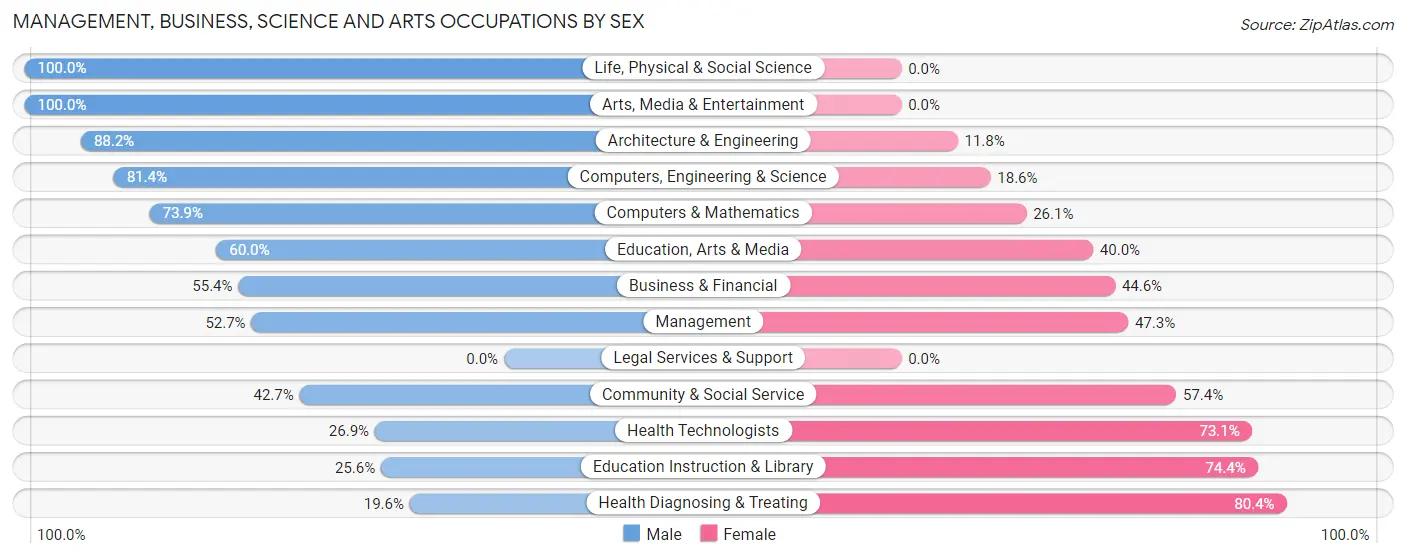
Management, Business, Science and Arts Occupations by Sex
Within the Management, Business, Science and Arts occupations in Madison Lake, the most male-oriented occupations are Life, Physical & Social Science (100.0%), Arts, Media & Entertainment (100.0%), and Architecture & Engineering (88.2%), while the most female-oriented occupations are Health Diagnosing & Treating (80.4%), Education Instruction & Library (74.4%), and Health Technologists (73.1%).
| Occupation | Male | Female |
| Management | 59 (52.7%) | 53 (47.3%) |
| Business & Financial | 41 (55.4%) | 33 (44.6%) |
| Computers, Engineering & Science | 35 (81.4%) | 8 (18.6%) |
| Computers & Mathematics | 17 (73.9%) | 6 (26.1%) |
| Architecture & Engineering | 15 (88.2%) | 2 (11.8%) |
| Life, Physical & Social Science | 3 (100.0%) | 0 (0.0%) |
| Community & Social Service | 29 (42.6%) | 39 (57.4%) |
| Education, Arts & Media | 15 (60.0%) | 10 (40.0%) |
| Legal Services & Support | 0 (0.0%) | 0 (0.0%) |
| Education Instruction & Library | 10 (25.6%) | 29 (74.4%) |
| Arts, Media & Entertainment | 4 (100.0%) | 0 (0.0%) |
| Health Diagnosing & Treating | 11 (19.6%) | 45 (80.4%) |
| Health Technologists | 7 (26.9%) | 19 (73.1%) |
| Total (Category) | 175 (49.6%) | 178 (50.4%) |
| Total (Overall) | 374 (55.2%) | 304 (44.8%) |
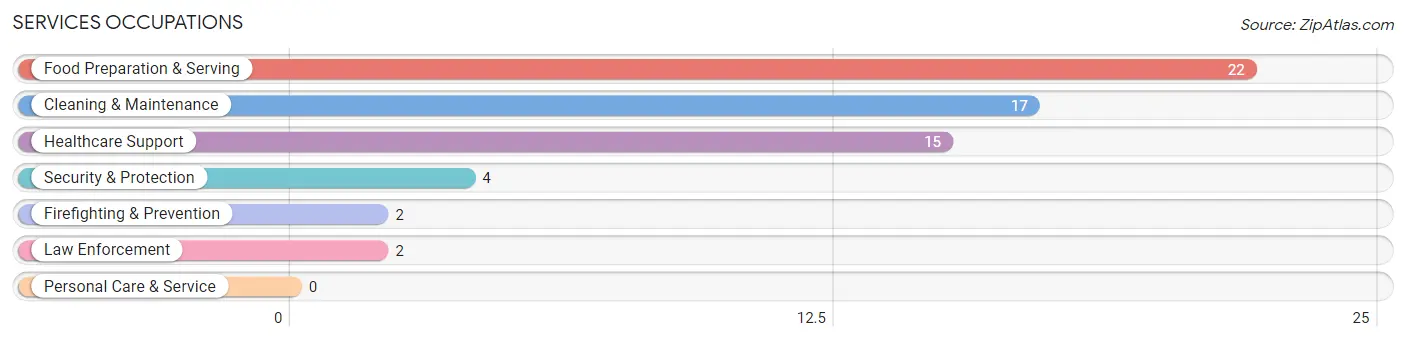
Services Occupations
The most common Services occupations in Madison Lake are Food Preparation & Serving (22 | 3.2%), Cleaning & Maintenance (17 | 2.5%), Healthcare Support (15 | 2.2%), Security & Protection (4 | 0.6%), and Firefighting & Prevention (2 | 0.3%).
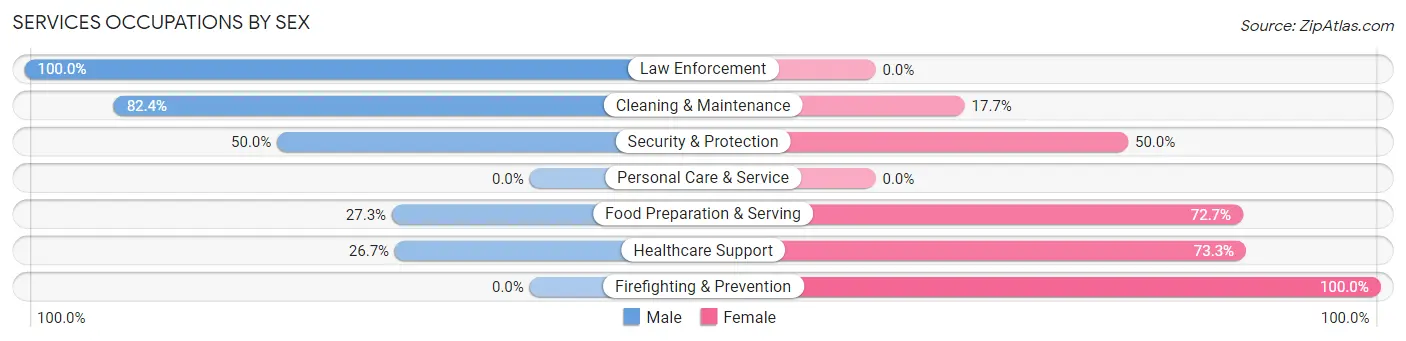
Services Occupations by Sex
Within the Services occupations in Madison Lake, the most male-oriented occupations are Law Enforcement (100.0%), Cleaning & Maintenance (82.4%), and Security & Protection (50.0%), while the most female-oriented occupations are Firefighting & Prevention (100.0%), Healthcare Support (73.3%), and Food Preparation & Serving (72.7%).
| Occupation | Male | Female |
| Healthcare Support | 4 (26.7%) | 11 (73.3%) |
| Security & Protection | 2 (50.0%) | 2 (50.0%) |
| Firefighting & Prevention | 0 (0.0%) | 2 (100.0%) |
| Law Enforcement | 2 (100.0%) | 0 (0.0%) |
| Food Preparation & Serving | 6 (27.3%) | 16 (72.7%) |
| Cleaning & Maintenance | 14 (82.4%) | 3 (17.6%) |
| Personal Care & Service | 0 (0.0%) | 0 (0.0%) |
| Total (Category) | 26 (44.8%) | 32 (55.2%) |
| Total (Overall) | 374 (55.2%) | 304 (44.8%) |
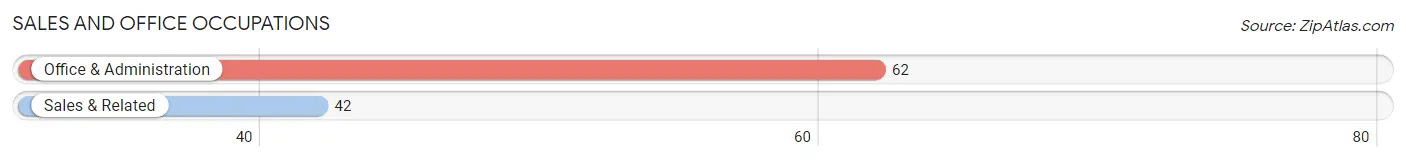
Sales and Office Occupations
The most common Sales and Office occupations in Madison Lake are Office & Administration (62 | 9.1%), and Sales & Related (42 | 6.2%).
Sales and Office Occupations by Sex
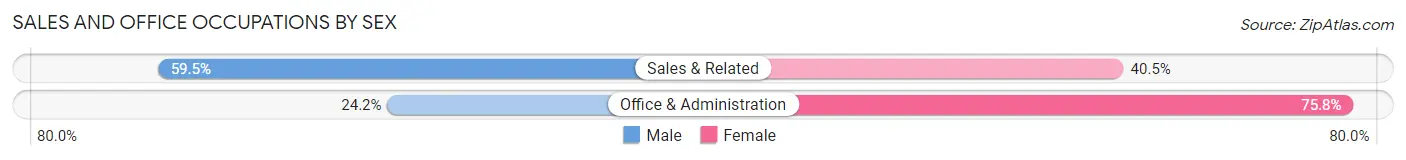
| Occupation | Male | Female |
| Sales & Related | 25 (59.5%) | 17 (40.5%) |
| Office & Administration | 15 (24.2%) | 47 (75.8%) |
| Total (Category) | 40 (38.5%) | 64 (61.5%) |
| Total (Overall) | 374 (55.2%) | 304 (44.8%) |
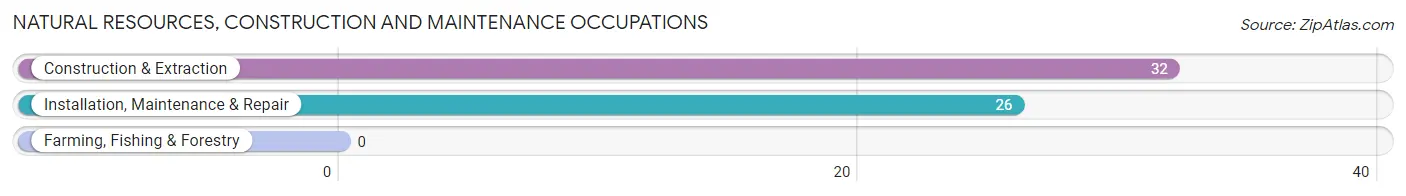
Natural Resources, Construction and Maintenance Occupations
The most common Natural Resources, Construction and Maintenance occupations in Madison Lake are Construction & Extraction (32 | 4.7%), and Installation, Maintenance & Repair (26 | 3.8%).
Natural Resources, Construction and Maintenance Occupations by Sex
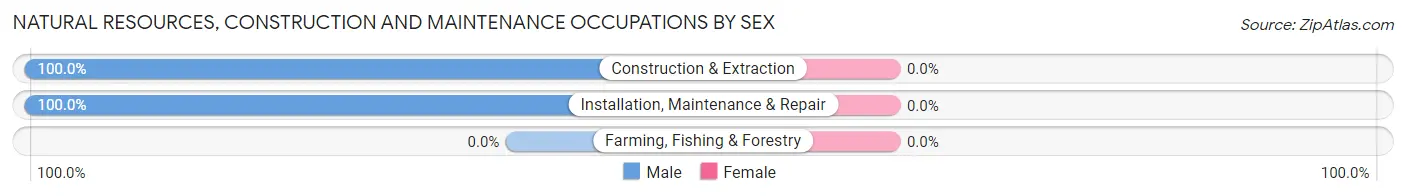
| Occupation | Male | Female |
| Farming, Fishing & Forestry | 0 (0.0%) | 0 (0.0%) |
| Construction & Extraction | 32 (100.0%) | 0 (0.0%) |
| Installation, Maintenance & Repair | 26 (100.0%) | 0 (0.0%) |
| Total (Category) | 58 (100.0%) | 0 (0.0%) |
| Total (Overall) | 374 (55.2%) | 304 (44.8%) |
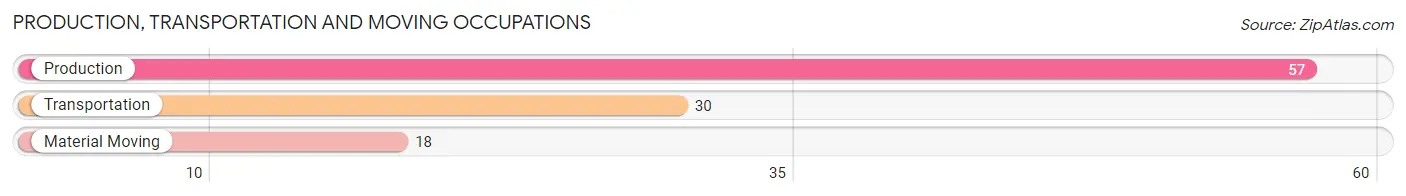
Production, Transportation and Moving Occupations
The most common Production, Transportation and Moving occupations in Madison Lake are Production (57 | 8.4%), Transportation (30 | 4.4%), and Material Moving (18 | 2.6%).
Production, Transportation and Moving Occupations by Sex
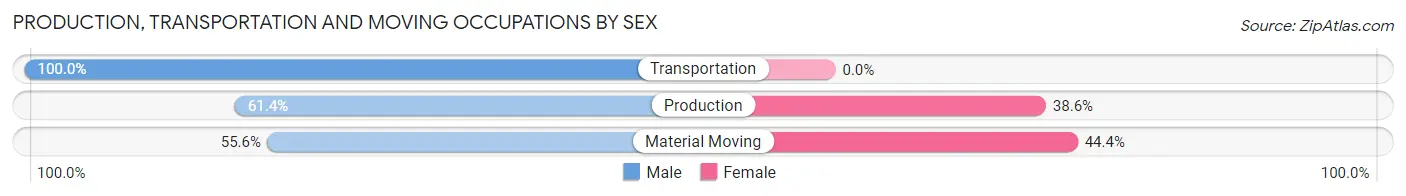
| Occupation | Male | Female |
| Production | 35 (61.4%) | 22 (38.6%) |
| Transportation | 30 (100.0%) | 0 (0.0%) |
| Material Moving | 10 (55.6%) | 8 (44.4%) |
| Total (Category) | 75 (71.4%) | 30 (28.6%) |
| Total (Overall) | 374 (55.2%) | 304 (44.8%) |
Employment Industries by Sex in Madison Lake
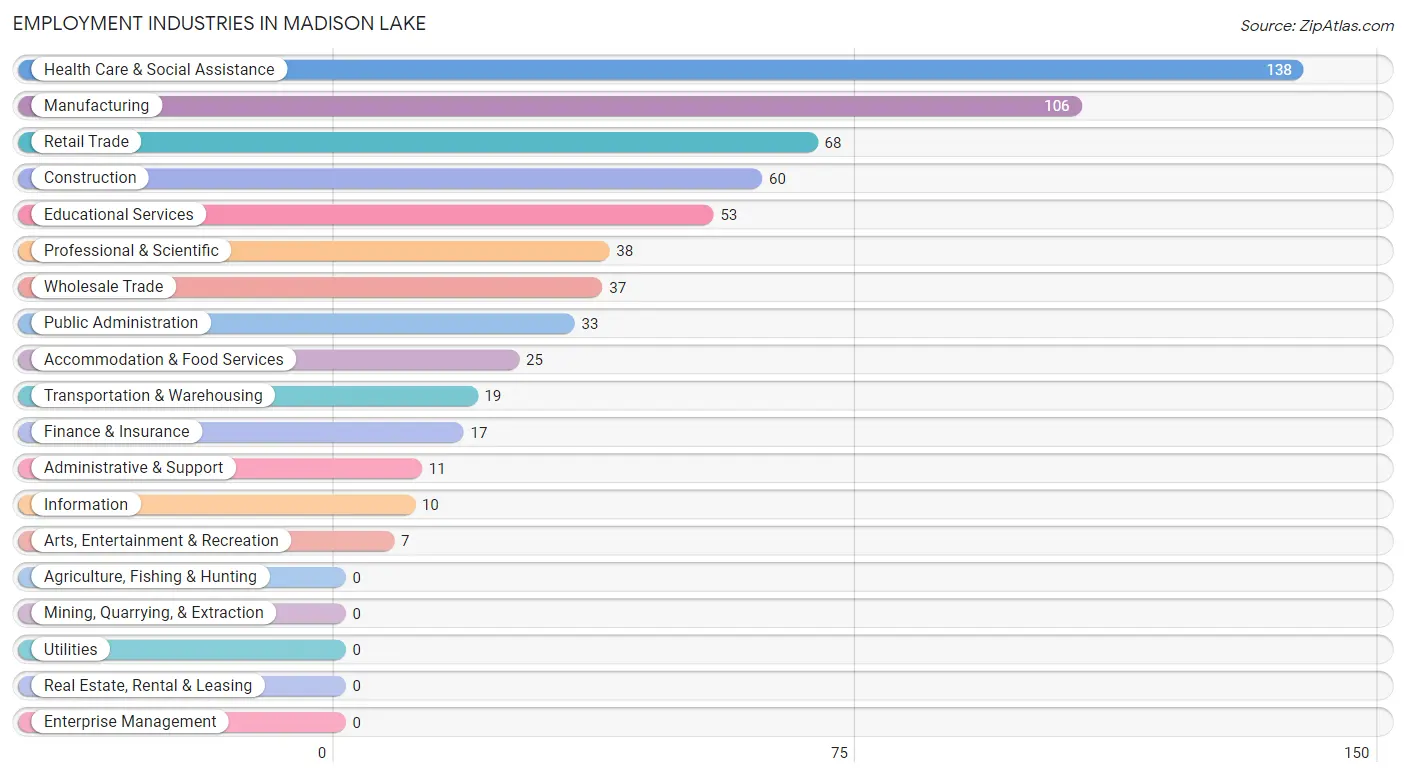
Employment Industries in Madison Lake
The major employment industries in Madison Lake include Health Care & Social Assistance (138 | 20.3%), Manufacturing (106 | 15.6%), Retail Trade (68 | 10.0%), Construction (60 | 8.8%), and Educational Services (53 | 7.8%).
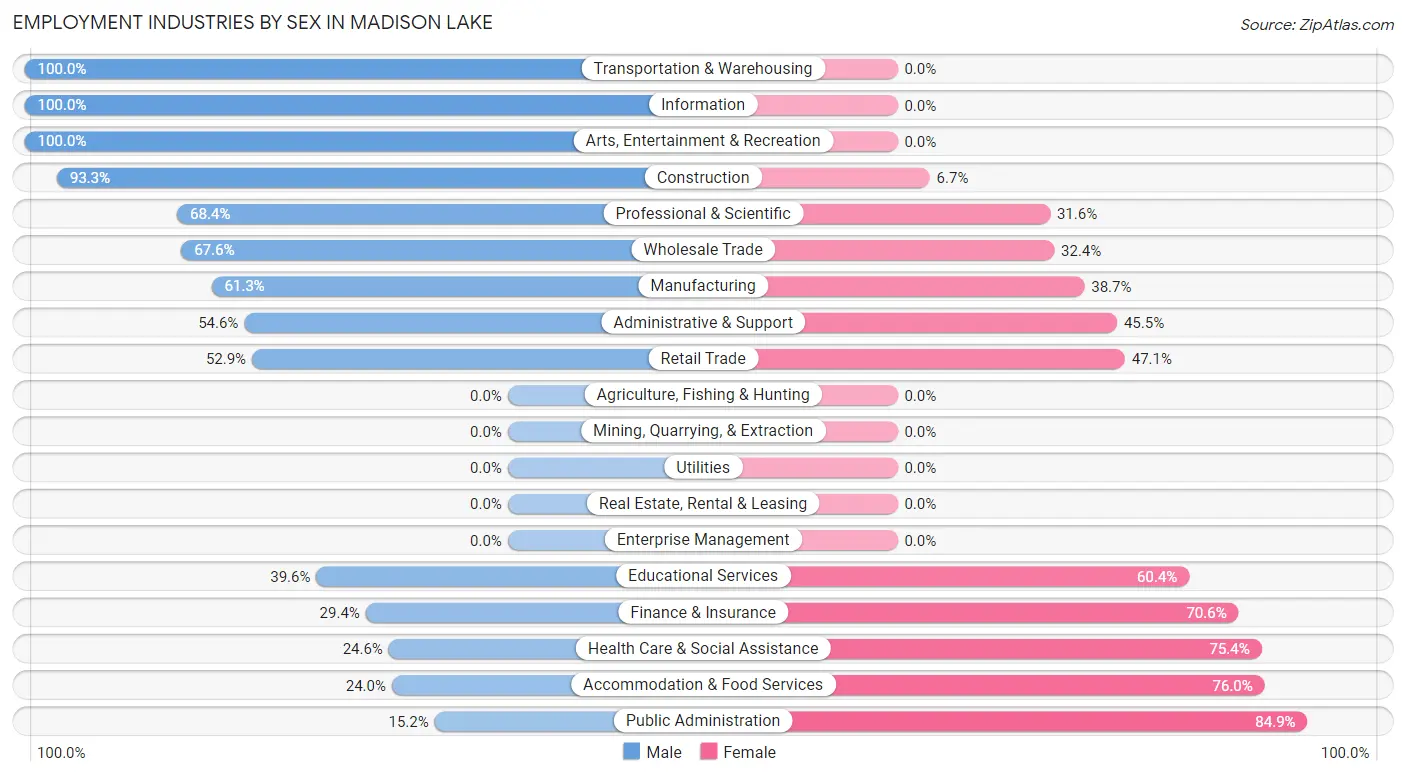
Employment Industries by Sex in Madison Lake
The Madison Lake industries that see more men than women are Transportation & Warehousing (100.0%), Information (100.0%), and Arts, Entertainment & Recreation (100.0%), whereas the industries that tend to have a higher number of women are Public Administration (84.9%), Accommodation & Food Services (76.0%), and Health Care & Social Assistance (75.4%).
| Industry | Male | Female |
| Agriculture, Fishing & Hunting | 0 (0.0%) | 0 (0.0%) |
| Mining, Quarrying, & Extraction | 0 (0.0%) | 0 (0.0%) |
| Construction | 56 (93.3%) | 4 (6.7%) |
| Manufacturing | 65 (61.3%) | 41 (38.7%) |
| Wholesale Trade | 25 (67.6%) | 12 (32.4%) |
| Retail Trade | 36 (52.9%) | 32 (47.1%) |
| Transportation & Warehousing | 19 (100.0%) | 0 (0.0%) |
| Utilities | 0 (0.0%) | 0 (0.0%) |
| Information | 10 (100.0%) | 0 (0.0%) |
| Finance & Insurance | 5 (29.4%) | 12 (70.6%) |
| Real Estate, Rental & Leasing | 0 (0.0%) | 0 (0.0%) |
| Professional & Scientific | 26 (68.4%) | 12 (31.6%) |
| Enterprise Management | 0 (0.0%) | 0 (0.0%) |
| Administrative & Support | 6 (54.5%) | 5 (45.5%) |
| Educational Services | 21 (39.6%) | 32 (60.4%) |
| Health Care & Social Assistance | 34 (24.6%) | 104 (75.4%) |
| Arts, Entertainment & Recreation | 7 (100.0%) | 0 (0.0%) |
| Accommodation & Food Services | 6 (24.0%) | 19 (76.0%) |
| Public Administration | 5 (15.1%) | 28 (84.9%) |
| Total | 374 (55.2%) | 304 (44.8%) |
Education in Madison Lake
School Enrollment in Madison Lake
The most common levels of schooling among the 312 students in Madison Lake are kindergarten (73 | 23.4%), middle school (68 | 21.8%), and elementary school (63 | 20.2%).
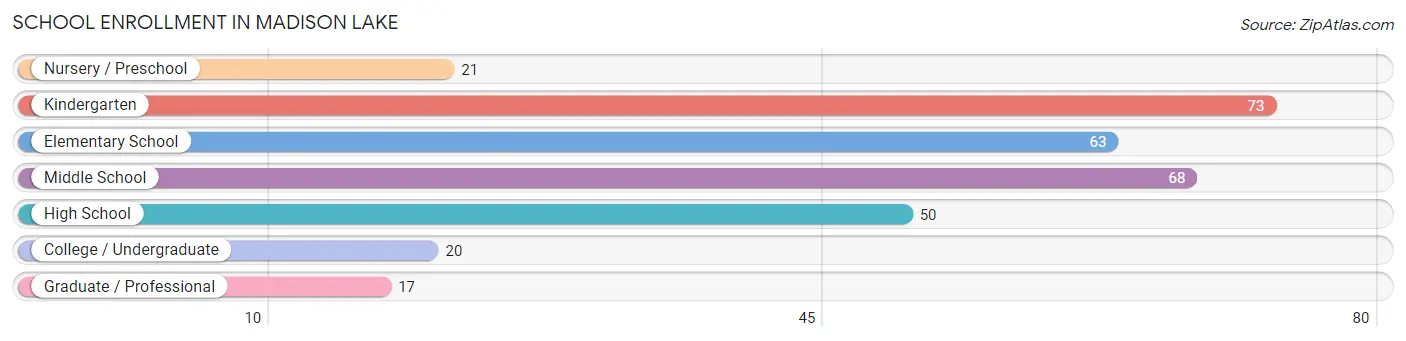
| School Level | # Students | % Students |
| Nursery / Preschool | 21 | 6.7% |
| Kindergarten | 73 | 23.4% |
| Elementary School | 63 | 20.2% |
| Middle School | 68 | 21.8% |
| High School | 50 | 16.0% |
| College / Undergraduate | 20 | 6.4% |
| Graduate / Professional | 17 | 5.4% |
| Total | 312 | 100.0% |
School Enrollment by Age by Funding Source in Madison Lake
Out of a total of 312 students who are enrolled in schools in Madison Lake, 41 (13.1%) attend a private institution, while the remaining 271 (86.9%) are enrolled in public schools. The age group of 20 to 24 year olds has the highest likelihood of being enrolled in private schools, with 7 (100.0% in the age bracket) enrolled. Conversely, the age group of 18 to 19 year olds has the lowest likelihood of being enrolled in a private school, with 2 (100.0% in the age bracket) attending a public institution.
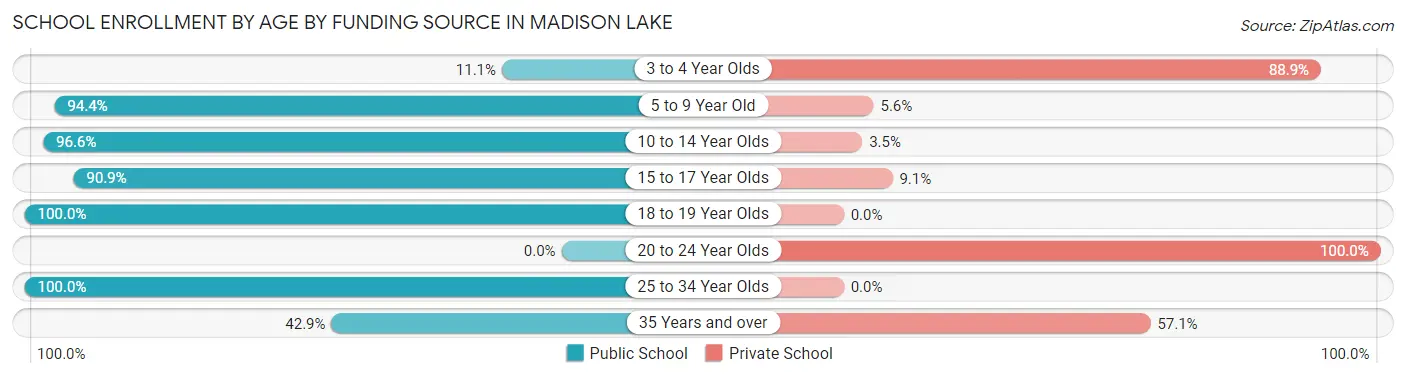
| Age Bracket | Public School | Private School |
| 3 to 4 Year Olds | 2 (11.1%) | 16 (88.9%) |
| 5 to 9 Year Old | 119 (94.4%) | 7 (5.6%) |
| 10 to 14 Year Olds | 84 (96.6%) | 3 (3.5%) |
| 15 to 17 Year Olds | 40 (90.9%) | 4 (9.1%) |
| 18 to 19 Year Olds | 2 (100.0%) | 0 (0.0%) |
| 20 to 24 Year Olds | 0 (0.0%) | 7 (100.0%) |
| 25 to 34 Year Olds | 21 (100.0%) | 0 (0.0%) |
| 35 Years and over | 3 (42.9%) | 4 (57.1%) |
| Total | 271 (86.9%) | 41 (13.1%) |
Educational Attainment by Field of Study in Madison Lake
Education (102 | 26.4%), business (91 | 23.6%), science & technology (42 | 10.9%), arts & humanities (32 | 8.3%), and liberal arts & history (21 | 5.4%) are the most common fields of study among 386 individuals in Madison Lake who have obtained a bachelor's degree or higher.
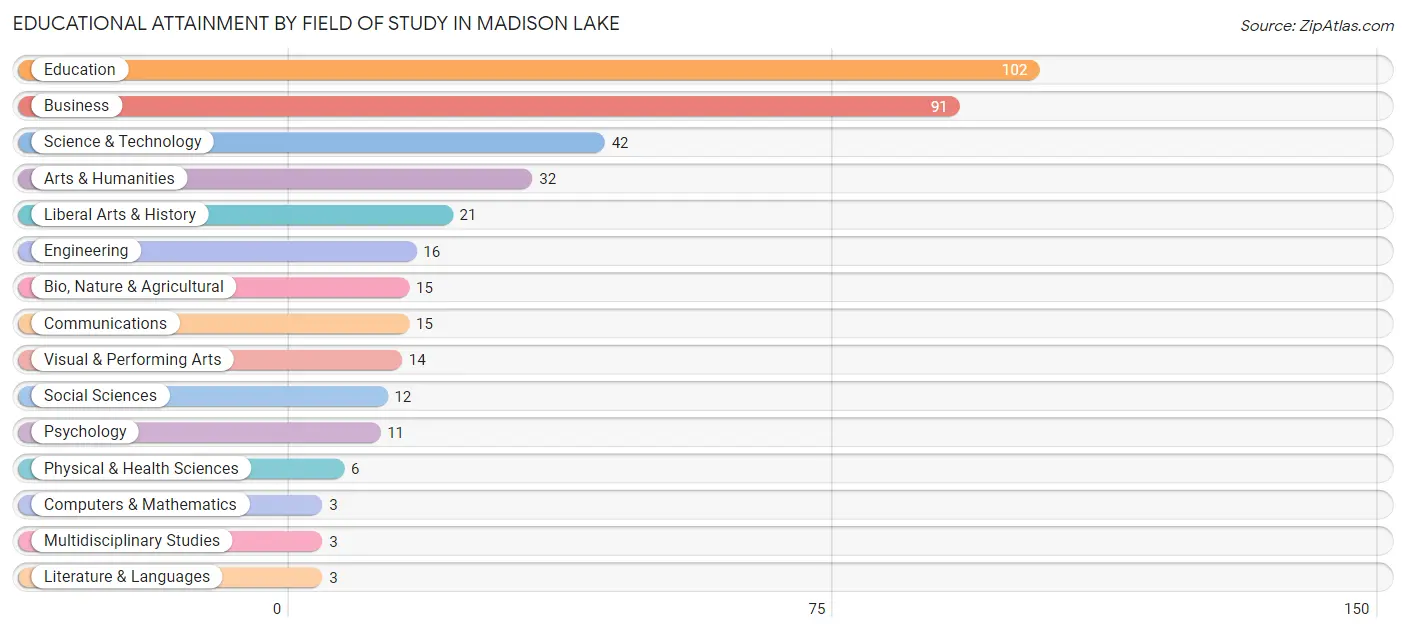
| Field of Study | # Graduates | % Graduates |
| Computers & Mathematics | 3 | 0.8% |
| Bio, Nature & Agricultural | 15 | 3.9% |
| Physical & Health Sciences | 6 | 1.5% |
| Psychology | 11 | 2.9% |
| Social Sciences | 12 | 3.1% |
| Engineering | 16 | 4.2% |
| Multidisciplinary Studies | 3 | 0.8% |
| Science & Technology | 42 | 10.9% |
| Business | 91 | 23.6% |
| Education | 102 | 26.4% |
| Literature & Languages | 3 | 0.8% |
| Liberal Arts & History | 21 | 5.4% |
| Visual & Performing Arts | 14 | 3.6% |
| Communications | 15 | 3.9% |
| Arts & Humanities | 32 | 8.3% |
| Total | 386 | 100.0% |
Transportation & Commute in Madison Lake
Vehicle Availability by Sex in Madison Lake
The most prevalent vehicle ownership categories in Madison Lake are males with 2 vehicles (202, accounting for 54.9%) and females with 2 vehicles (152, making up 67.3%).
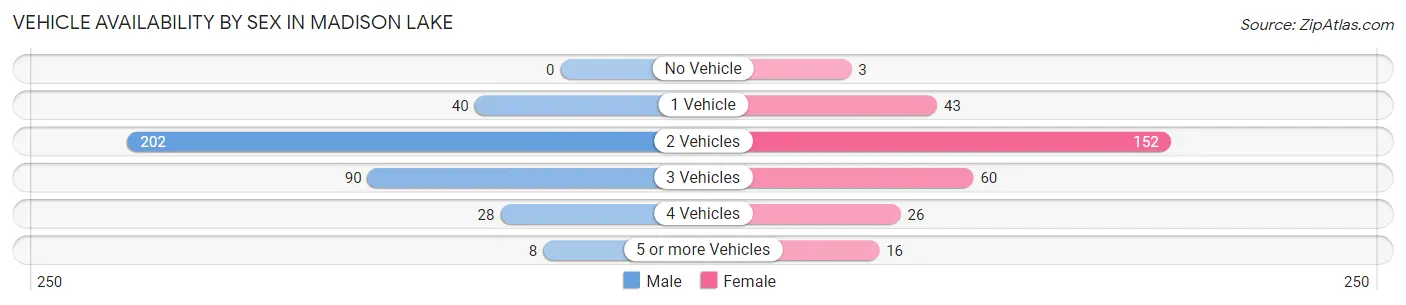
| Vehicles Available | Male | Female |
| No Vehicle | 0 (0.0%) | 3 (1.0%) |
| 1 Vehicle | 40 (10.9%) | 43 (14.3%) |
| 2 Vehicles | 202 (54.9%) | 152 (50.7%) |
| 3 Vehicles | 90 (24.5%) | 60 (20.0%) |
| 4 Vehicles | 28 (7.6%) | 26 (8.7%) |
| 5 or more Vehicles | 8 (2.2%) | 16 (5.3%) |
| Total | 368 (100.0%) | 300 (100.0%) |
Commute Time in Madison Lake
The most frequently occuring commute durations in Madison Lake are 20 to 24 minutes (163 commuters, 27.9%), 15 to 19 minutes (159 commuters, 27.2%), and 25 to 29 minutes (55 commuters, 9.4%).
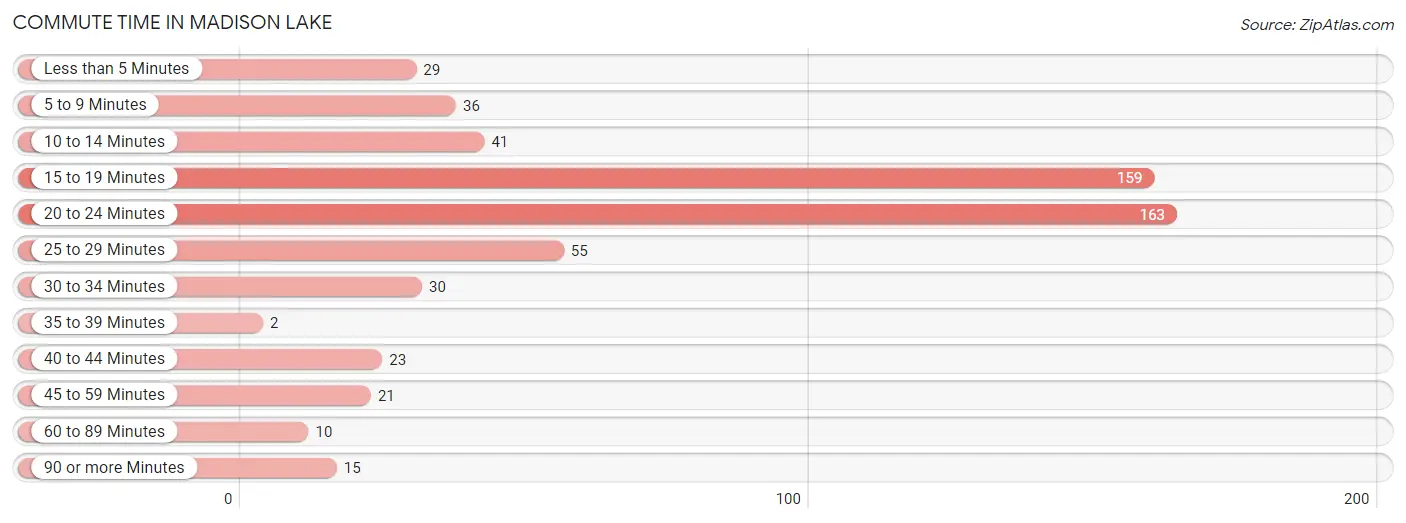
| Commute Time | # Commuters | % Commuters |
| Less than 5 Minutes | 29 | 5.0% |
| 5 to 9 Minutes | 36 | 6.2% |
| 10 to 14 Minutes | 41 | 7.0% |
| 15 to 19 Minutes | 159 | 27.2% |
| 20 to 24 Minutes | 163 | 27.9% |
| 25 to 29 Minutes | 55 | 9.4% |
| 30 to 34 Minutes | 30 | 5.1% |
| 35 to 39 Minutes | 2 | 0.3% |
| 40 to 44 Minutes | 23 | 3.9% |
| 45 to 59 Minutes | 21 | 3.6% |
| 60 to 89 Minutes | 10 | 1.7% |
| 90 or more Minutes | 15 | 2.6% |
Commute Time by Sex in Madison Lake
The most common commute times in Madison Lake are 15 to 19 minutes (99 commuters, 29.8%) for males and 20 to 24 minutes (76 commuters, 30.2%) for females.
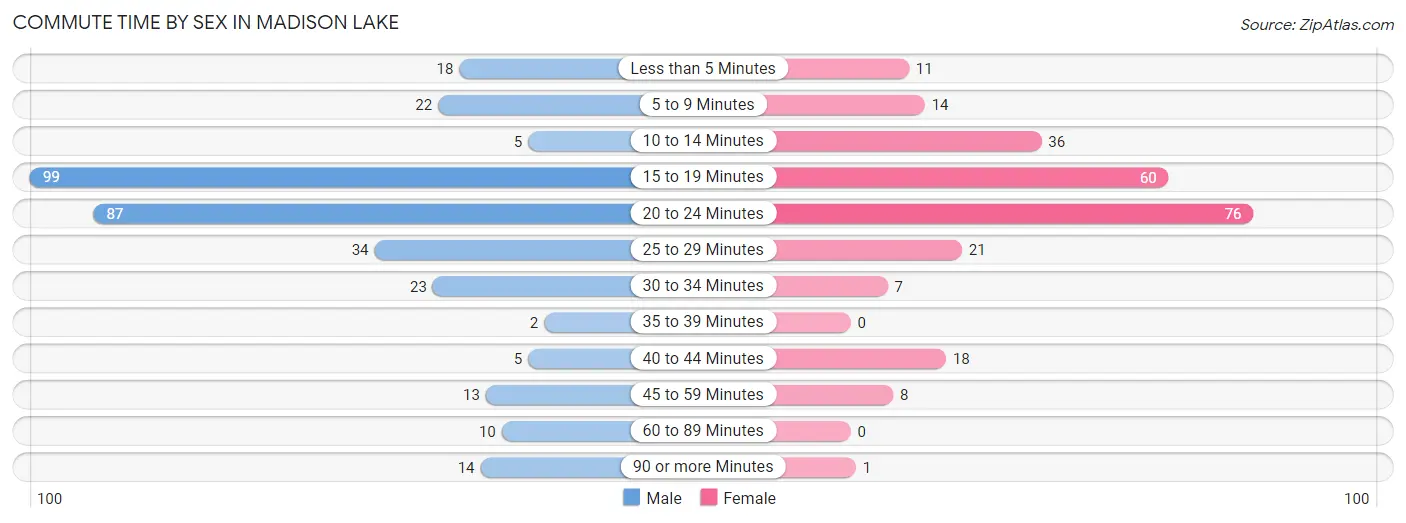
| Commute Time | Male | Female |
| Less than 5 Minutes | 18 (5.4%) | 11 (4.4%) |
| 5 to 9 Minutes | 22 (6.6%) | 14 (5.6%) |
| 10 to 14 Minutes | 5 (1.5%) | 36 (14.3%) |
| 15 to 19 Minutes | 99 (29.8%) | 60 (23.8%) |
| 20 to 24 Minutes | 87 (26.2%) | 76 (30.2%) |
| 25 to 29 Minutes | 34 (10.2%) | 21 (8.3%) |
| 30 to 34 Minutes | 23 (6.9%) | 7 (2.8%) |
| 35 to 39 Minutes | 2 (0.6%) | 0 (0.0%) |
| 40 to 44 Minutes | 5 (1.5%) | 18 (7.1%) |
| 45 to 59 Minutes | 13 (3.9%) | 8 (3.2%) |
| 60 to 89 Minutes | 10 (3.0%) | 0 (0.0%) |
| 90 or more Minutes | 14 (4.2%) | 1 (0.4%) |
Time of Departure to Work by Sex in Madison Lake
The most frequent times of departure to work in Madison Lake are 7:00 AM to 7:29 AM (78, 23.5%) for males and 7:30 AM to 7:59 AM (59, 23.4%) for females.
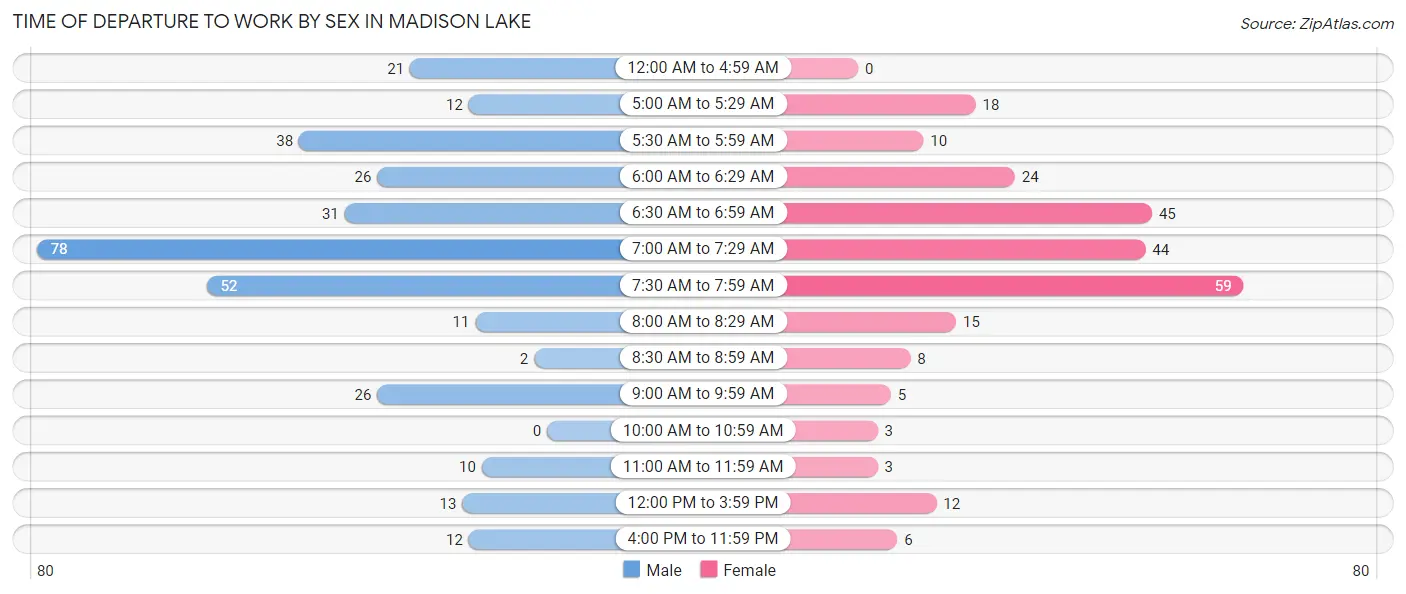
| Time of Departure | Male | Female |
| 12:00 AM to 4:59 AM | 21 (6.3%) | 0 (0.0%) |
| 5:00 AM to 5:29 AM | 12 (3.6%) | 18 (7.1%) |
| 5:30 AM to 5:59 AM | 38 (11.5%) | 10 (4.0%) |
| 6:00 AM to 6:29 AM | 26 (7.8%) | 24 (9.5%) |
| 6:30 AM to 6:59 AM | 31 (9.3%) | 45 (17.9%) |
| 7:00 AM to 7:29 AM | 78 (23.5%) | 44 (17.5%) |
| 7:30 AM to 7:59 AM | 52 (15.7%) | 59 (23.4%) |
| 8:00 AM to 8:29 AM | 11 (3.3%) | 15 (5.9%) |
| 8:30 AM to 8:59 AM | 2 (0.6%) | 8 (3.2%) |
| 9:00 AM to 9:59 AM | 26 (7.8%) | 5 (2.0%) |
| 10:00 AM to 10:59 AM | 0 (0.0%) | 3 (1.2%) |
| 11:00 AM to 11:59 AM | 10 (3.0%) | 3 (1.2%) |
| 12:00 PM to 3:59 PM | 13 (3.9%) | 12 (4.8%) |
| 4:00 PM to 11:59 PM | 12 (3.6%) | 6 (2.4%) |
| Total | 332 (100.0%) | 252 (100.0%) |
Housing Occupancy in Madison Lake
Occupancy by Ownership in Madison Lake
Of the total 487 dwellings in Madison Lake, owner-occupied units account for 351 (72.1%), while renter-occupied units make up 136 (27.9%).
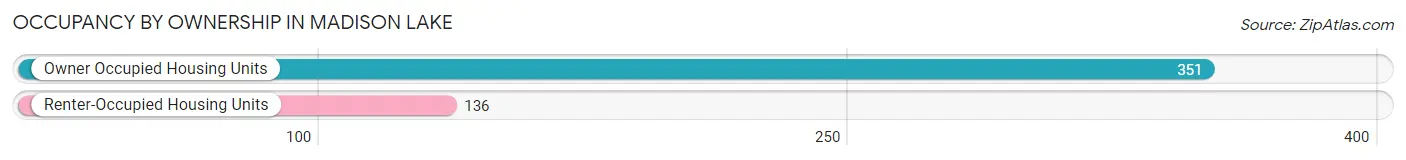
| Occupancy | # Housing Units | % Housing Units |
| Owner Occupied Housing Units | 351 | 72.1% |
| Renter-Occupied Housing Units | 136 | 27.9% |
| Total Occupied Housing Units | 487 | 100.0% |
Occupancy by Household Size in Madison Lake
| Household Size | # Housing Units | % Housing Units |
| 1-Person Household | 137 | 28.1% |
| 2-Person Household | 185 | 38.0% |
| 3-Person Household | 58 | 11.9% |
| 4+ Person Household | 107 | 22.0% |
| Total Housing Units | 487 | 100.0% |
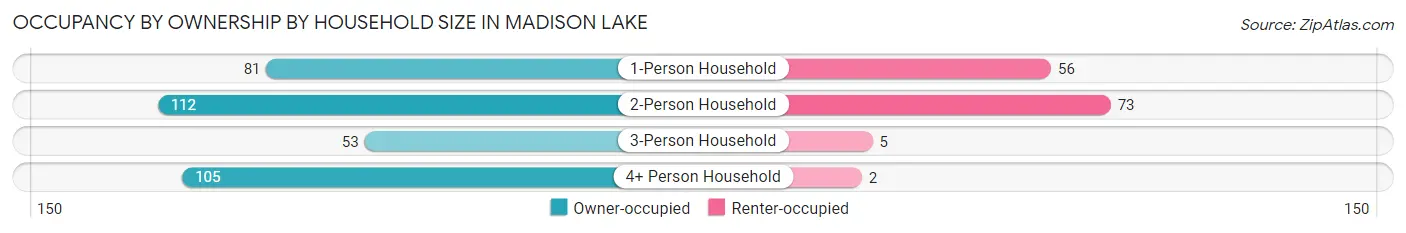
Occupancy by Ownership by Household Size in Madison Lake
| Household Size | Owner-occupied | Renter-occupied |
| 1-Person Household | 81 (59.1%) | 56 (40.9%) |
| 2-Person Household | 112 (60.5%) | 73 (39.5%) |
| 3-Person Household | 53 (91.4%) | 5 (8.6%) |
| 4+ Person Household | 105 (98.1%) | 2 (1.9%) |
| Total Housing Units | 351 (72.1%) | 136 (27.9%) |
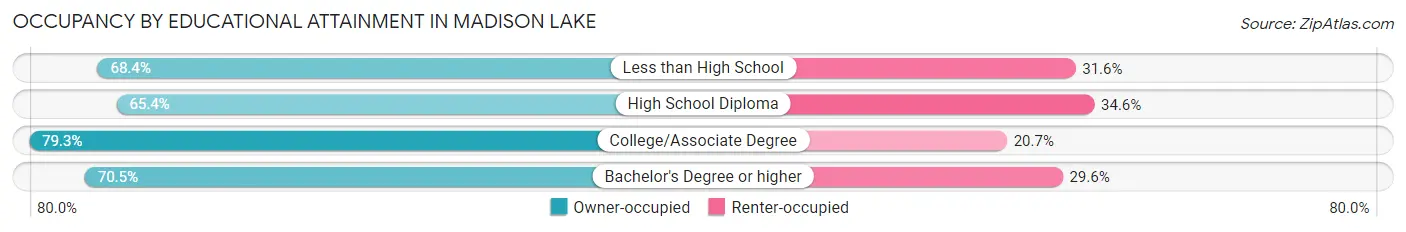
Occupancy by Educational Attainment in Madison Lake
| Household Size | Owner-occupied | Renter-occupied |
| Less than High School | 13 (68.4%) | 6 (31.6%) |
| High School Diploma | 53 (65.4%) | 28 (34.6%) |
| College/Associate Degree | 111 (79.3%) | 29 (20.7%) |
| Bachelor's Degree or higher | 174 (70.5%) | 73 (29.5%) |
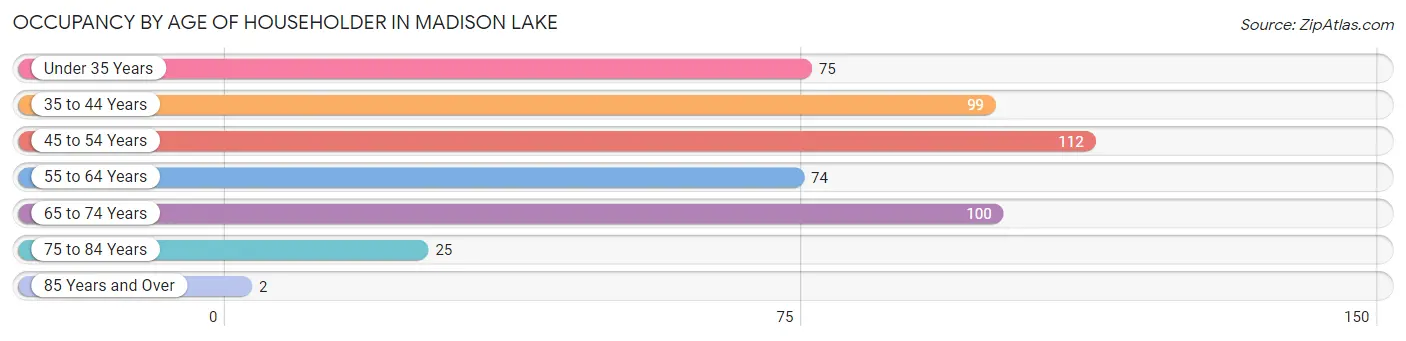
Occupancy by Age of Householder in Madison Lake
| Age Bracket | # Households | % Households |
| Under 35 Years | 75 | 15.4% |
| 35 to 44 Years | 99 | 20.3% |
| 45 to 54 Years | 112 | 23.0% |
| 55 to 64 Years | 74 | 15.2% |
| 65 to 74 Years | 100 | 20.5% |
| 75 to 84 Years | 25 | 5.1% |
| 85 Years and Over | 2 | 0.4% |
| Total | 487 | 100.0% |
Housing Finances in Madison Lake
Median Income by Occupancy in Madison Lake
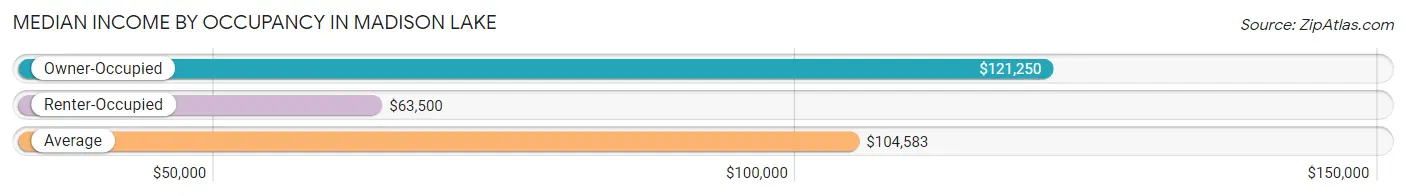
| Occupancy Type | # Households | Median Income |
| Owner-Occupied | 351 (72.1%) | $121,250 |
| Renter-Occupied | 136 (27.9%) | $63,500 |
| Average | 487 (100.0%) | $104,583 |
Occupancy by Householder Income Bracket in Madison Lake
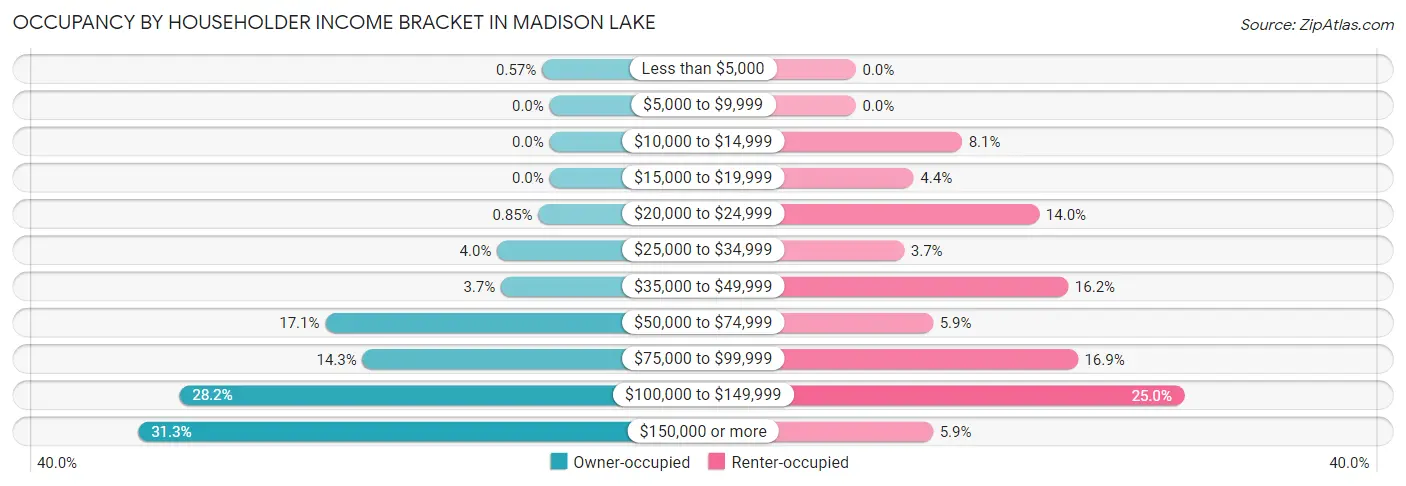
| Income Bracket | Owner-occupied | Renter-occupied |
| Less than $5,000 | 2 (0.6%) | 0 (0.0%) |
| $5,000 to $9,999 | 0 (0.0%) | 0 (0.0%) |
| $10,000 to $14,999 | 0 (0.0%) | 11 (8.1%) |
| $15,000 to $19,999 | 0 (0.0%) | 6 (4.4%) |
| $20,000 to $24,999 | 3 (0.9%) | 19 (14.0%) |
| $25,000 to $34,999 | 14 (4.0%) | 5 (3.7%) |
| $35,000 to $49,999 | 13 (3.7%) | 22 (16.2%) |
| $50,000 to $74,999 | 60 (17.1%) | 8 (5.9%) |
| $75,000 to $99,999 | 50 (14.2%) | 23 (16.9%) |
| $100,000 to $149,999 | 99 (28.2%) | 34 (25.0%) |
| $150,000 or more | 110 (31.3%) | 8 (5.9%) |
| Total | 351 (100.0%) | 136 (100.0%) |
Monthly Housing Cost Tiers in Madison Lake
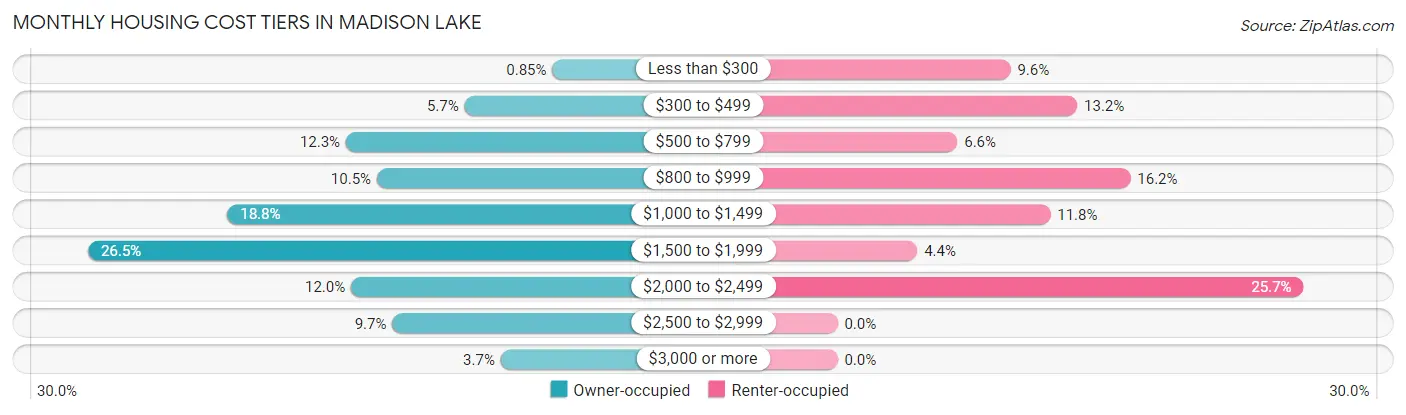
| Monthly Cost | Owner-occupied | Renter-occupied |
| Less than $300 | 3 (0.9%) | 13 (9.6%) |
| $300 to $499 | 20 (5.7%) | 18 (13.2%) |
| $500 to $799 | 43 (12.2%) | 9 (6.6%) |
| $800 to $999 | 37 (10.5%) | 22 (16.2%) |
| $1,000 to $1,499 | 66 (18.8%) | 16 (11.8%) |
| $1,500 to $1,999 | 93 (26.5%) | 6 (4.4%) |
| $2,000 to $2,499 | 42 (12.0%) | 35 (25.7%) |
| $2,500 to $2,999 | 34 (9.7%) | 0 (0.0%) |
| $3,000 or more | 13 (3.7%) | 0 (0.0%) |
| Total | 351 (100.0%) | 136 (100.0%) |
Physical Housing Characteristics in Madison Lake
Housing Structures in Madison Lake
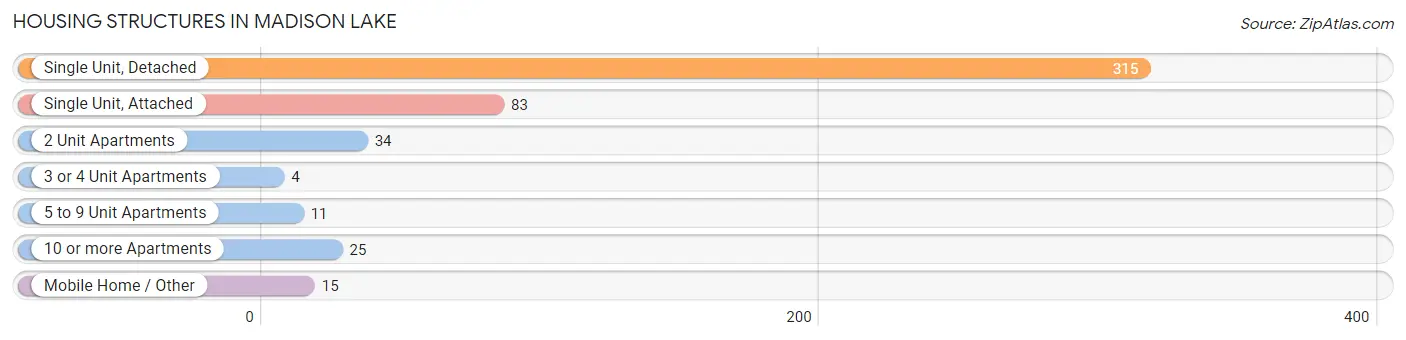
| Structure Type | # Housing Units | % Housing Units |
| Single Unit, Detached | 315 | 64.7% |
| Single Unit, Attached | 83 | 17.0% |
| 2 Unit Apartments | 34 | 7.0% |
| 3 or 4 Unit Apartments | 4 | 0.8% |
| 5 to 9 Unit Apartments | 11 | 2.3% |
| 10 or more Apartments | 25 | 5.1% |
| Mobile Home / Other | 15 | 3.1% |
| Total | 487 | 100.0% |
Housing Structures by Occupancy in Madison Lake
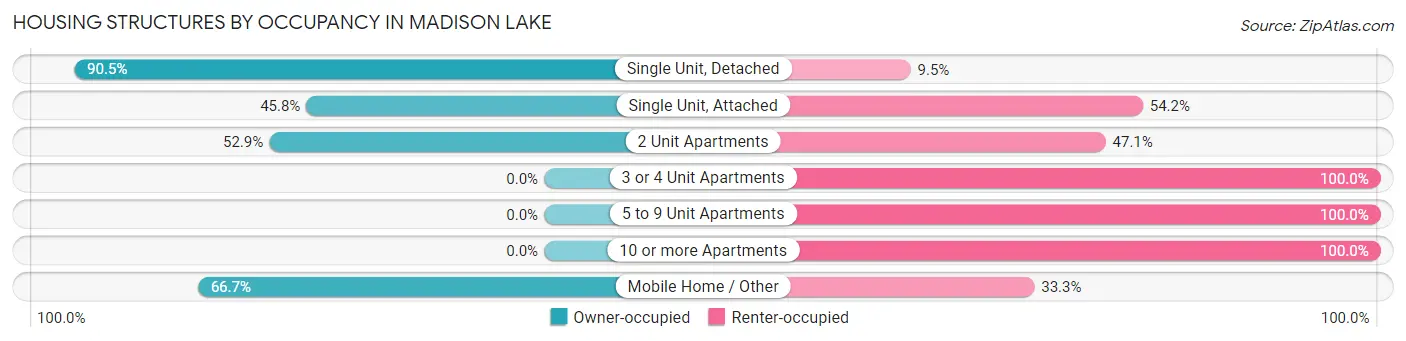
| Structure Type | Owner-occupied | Renter-occupied |
| Single Unit, Detached | 285 (90.5%) | 30 (9.5%) |
| Single Unit, Attached | 38 (45.8%) | 45 (54.2%) |
| 2 Unit Apartments | 18 (52.9%) | 16 (47.1%) |
| 3 or 4 Unit Apartments | 0 (0.0%) | 4 (100.0%) |
| 5 to 9 Unit Apartments | 0 (0.0%) | 11 (100.0%) |
| 10 or more Apartments | 0 (0.0%) | 25 (100.0%) |
| Mobile Home / Other | 10 (66.7%) | 5 (33.3%) |
| Total | 351 (72.1%) | 136 (27.9%) |
Housing Structures by Number of Rooms in Madison Lake
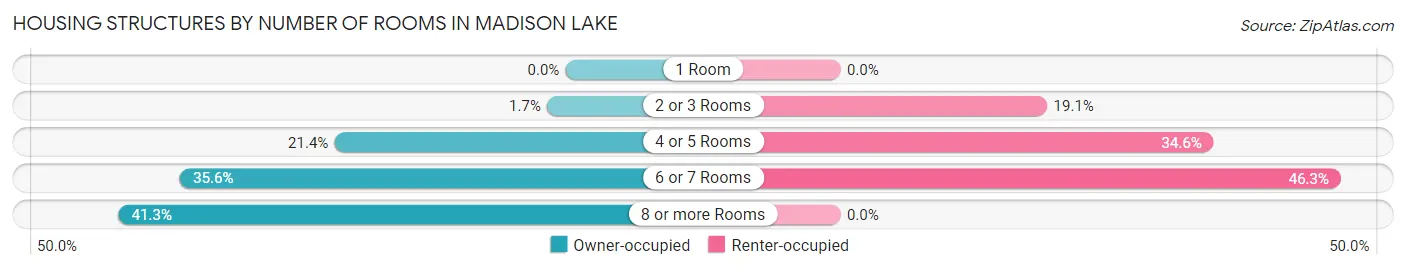
| Number of Rooms | Owner-occupied | Renter-occupied |
| 1 Room | 0 (0.0%) | 0 (0.0%) |
| 2 or 3 Rooms | 6 (1.7%) | 26 (19.1%) |
| 4 or 5 Rooms | 75 (21.4%) | 47 (34.6%) |
| 6 or 7 Rooms | 125 (35.6%) | 63 (46.3%) |
| 8 or more Rooms | 145 (41.3%) | 0 (0.0%) |
| Total | 351 (100.0%) | 136 (100.0%) |
Housing Structure by Heating Type in Madison Lake
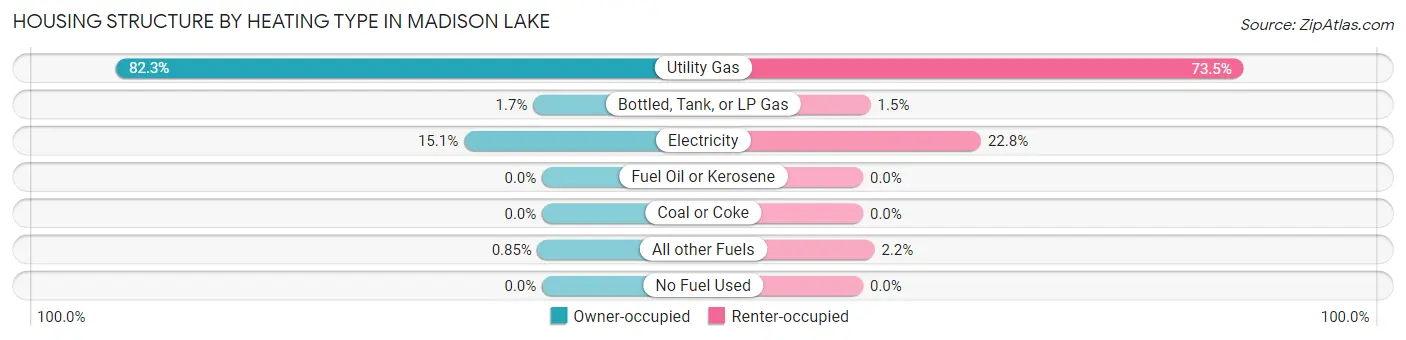
| Heating Type | Owner-occupied | Renter-occupied |
| Utility Gas | 289 (82.3%) | 100 (73.5%) |
| Bottled, Tank, or LP Gas | 6 (1.7%) | 2 (1.5%) |
| Electricity | 53 (15.1%) | 31 (22.8%) |
| Fuel Oil or Kerosene | 0 (0.0%) | 0 (0.0%) |
| Coal or Coke | 0 (0.0%) | 0 (0.0%) |
| All other Fuels | 3 (0.9%) | 3 (2.2%) |
| No Fuel Used | 0 (0.0%) | 0 (0.0%) |
| Total | 351 (100.0%) | 136 (100.0%) |
Household Vehicle Usage in Madison Lake
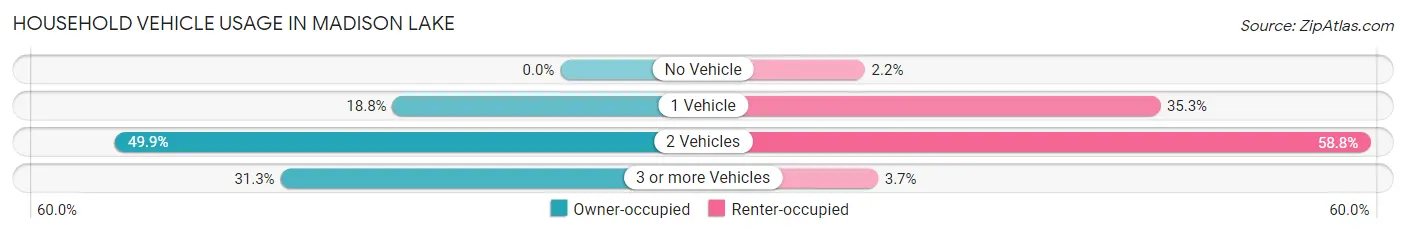
| Vehicles per Household | Owner-occupied | Renter-occupied |
| No Vehicle | 0 (0.0%) | 3 (2.2%) |
| 1 Vehicle | 66 (18.8%) | 48 (35.3%) |
| 2 Vehicles | 175 (49.9%) | 80 (58.8%) |
| 3 or more Vehicles | 110 (31.3%) | 5 (3.7%) |
| Total | 351 (100.0%) | 136 (100.0%) |
Real Estate & Mortgages in Madison Lake
Real Estate and Mortgage Overview in Madison Lake
| Characteristic | Without Mortgage | With Mortgage |
| Housing Units | 94 | 257 |
| Median Property Value | $247,600 | $275,400 |
| Median Household Income | $78,750 | $84 |
| Monthly Housing Costs | $663 | $10 |
| Real Estate Taxes | $2,800 | $4 |
Property Value by Mortgage Status in Madison Lake

| Property Value | Without Mortgage | With Mortgage |
| Less than $50,000 | 2 (2.1%) | 2 (0.8%) |
| $50,000 to $99,999 | 5 (5.3%) | 10 (3.9%) |
| $100,000 to $299,999 | 52 (55.3%) | 146 (56.8%) |
| $300,000 to $499,999 | 26 (27.7%) | 83 (32.3%) |
| $500,000 to $749,999 | 6 (6.4%) | 10 (3.9%) |
| $750,000 to $999,999 | 0 (0.0%) | 6 (2.3%) |
| $1,000,000 or more | 3 (3.2%) | 0 (0.0%) |
| Total | 94 (100.0%) | 257 (100.0%) |
Household Income by Mortgage Status in Madison Lake
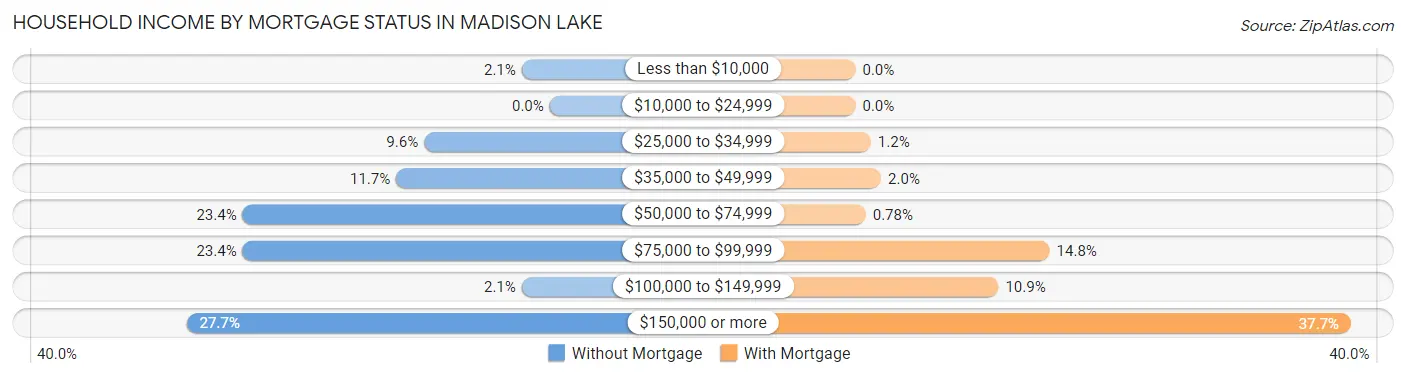
| Household Income | Without Mortgage | With Mortgage |
| Less than $10,000 | 2 (2.1%) | 0 (0.0%) |
| $10,000 to $24,999 | 0 (0.0%) | 0 (0.0%) |
| $25,000 to $34,999 | 9 (9.6%) | 3 (1.2%) |
| $35,000 to $49,999 | 11 (11.7%) | 5 (1.9%) |
| $50,000 to $74,999 | 22 (23.4%) | 2 (0.8%) |
| $75,000 to $99,999 | 22 (23.4%) | 38 (14.8%) |
| $100,000 to $149,999 | 2 (2.1%) | 28 (10.9%) |
| $150,000 or more | 26 (27.7%) | 97 (37.7%) |
| Total | 94 (100.0%) | 257 (100.0%) |
Property Value to Household Income Ratio in Madison Lake
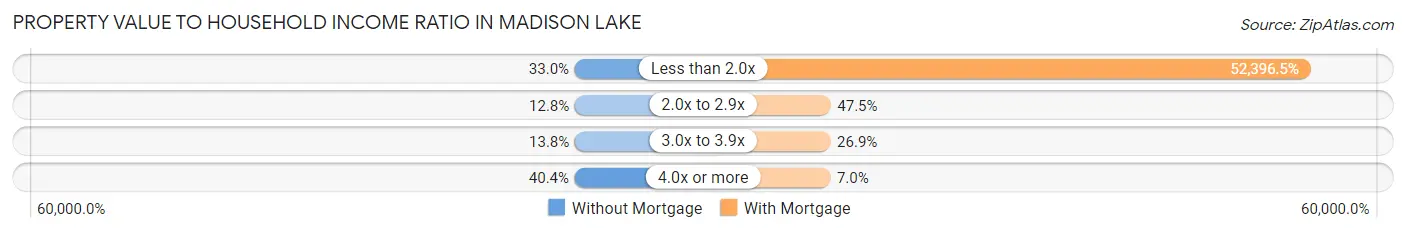
| Value-to-Income Ratio | Without Mortgage | With Mortgage |
| Less than 2.0x | 31 (33.0%) | 134,659 (52,396.5%) |
| 2.0x to 2.9x | 12 (12.8%) | 122 (47.5%) |
| 3.0x to 3.9x | 13 (13.8%) | 69 (26.9%) |
| 4.0x or more | 38 (40.4%) | 18 (7.0%) |
| Total | 94 (100.0%) | 257 (100.0%) |
Real Estate Taxes by Mortgage Status in Madison Lake
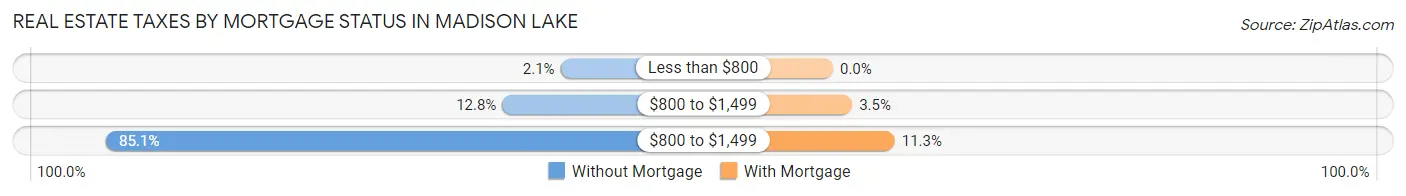
| Property Taxes | Without Mortgage | With Mortgage |
| Less than $800 | 2 (2.1%) | 0 (0.0%) |
| $800 to $1,499 | 12 (12.8%) | 9 (3.5%) |
| $800 to $1,499 | 80 (85.1%) | 29 (11.3%) |
| Total | 94 (100.0%) | 257 (100.0%) |
Health & Disability in Madison Lake
Health Insurance Coverage by Age in Madison Lake
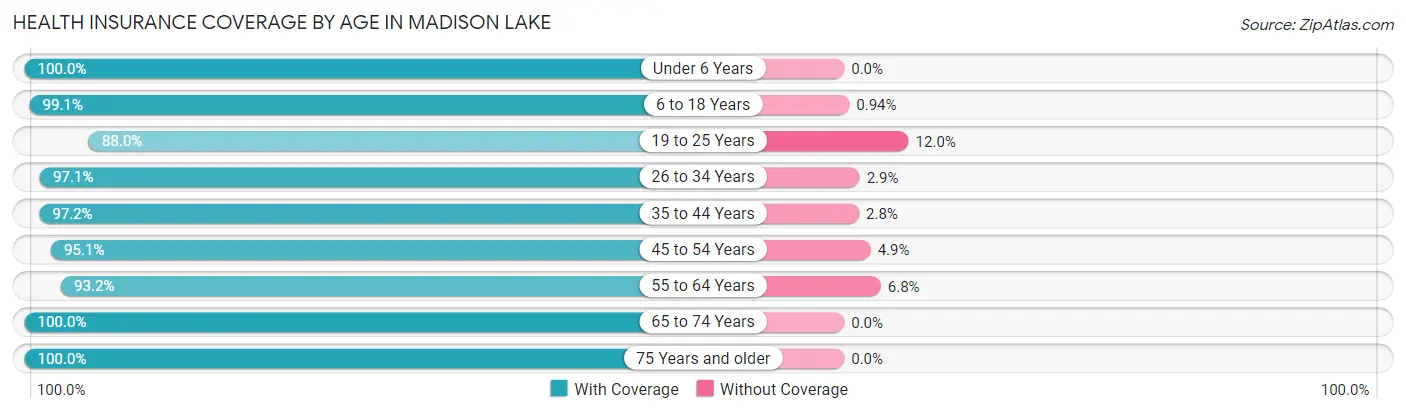
| Age Bracket | With Coverage | Without Coverage |
| Under 6 Years | 116 (100.0%) | 0 (0.0%) |
| 6 to 18 Years | 211 (99.1%) | 2 (0.9%) |
| 19 to 25 Years | 44 (88.0%) | 6 (12.0%) |
| 26 to 34 Years | 101 (97.1%) | 3 (2.9%) |
| 35 to 44 Years | 176 (97.2%) | 5 (2.8%) |
| 45 to 54 Years | 193 (95.1%) | 10 (4.9%) |
| 55 to 64 Years | 123 (93.2%) | 9 (6.8%) |
| 65 to 74 Years | 150 (100.0%) | 0 (0.0%) |
| 75 Years and older | 41 (100.0%) | 0 (0.0%) |
| Total | 1,155 (97.1%) | 35 (2.9%) |
Health Insurance Coverage by Citizenship Status in Madison Lake
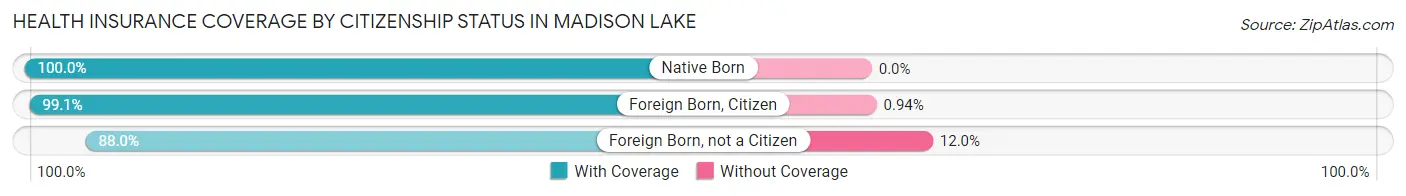
| Citizenship Status | With Coverage | Without Coverage |
| Native Born | 116 (100.0%) | 0 (0.0%) |
| Foreign Born, Citizen | 211 (99.1%) | 2 (0.9%) |
| Foreign Born, not a Citizen | 44 (88.0%) | 6 (12.0%) |
Health Insurance Coverage by Household Income in Madison Lake
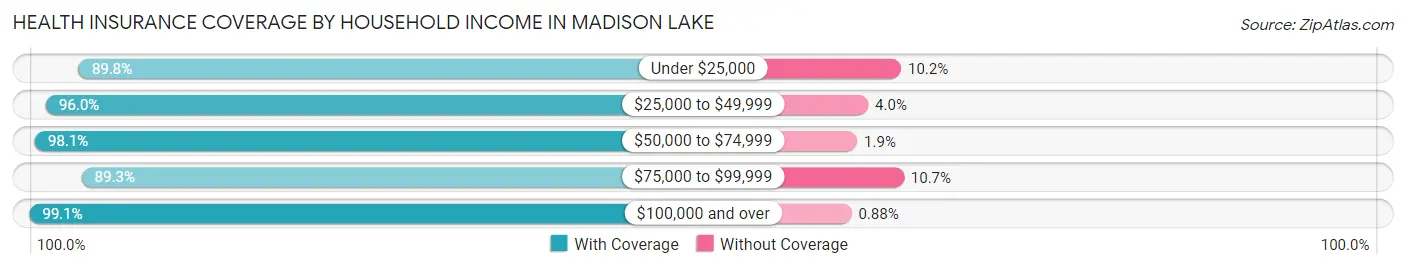
| Household Income | With Coverage | Without Coverage |
| Under $25,000 | 53 (89.8%) | 6 (10.2%) |
| $25,000 to $49,999 | 72 (96.0%) | 3 (4.0%) |
| $50,000 to $74,999 | 101 (98.1%) | 2 (1.9%) |
| $75,000 to $99,999 | 142 (89.3%) | 17 (10.7%) |
| $100,000 and over | 787 (99.1%) | 7 (0.9%) |
Public vs Private Health Insurance Coverage by Age in Madison Lake
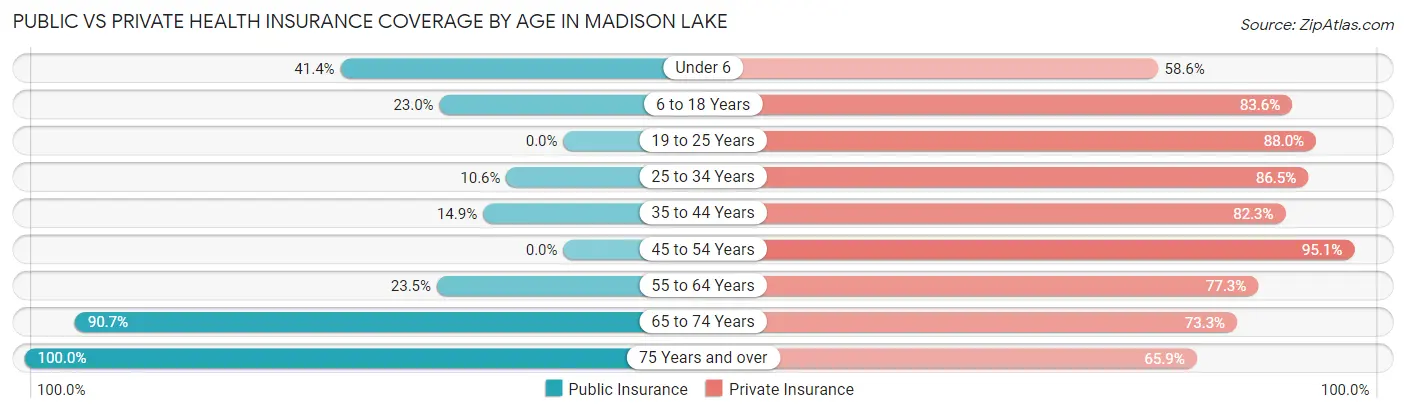
| Age Bracket | Public Insurance | Private Insurance |
| Under 6 | 48 (41.4%) | 68 (58.6%) |
| 6 to 18 Years | 49 (23.0%) | 178 (83.6%) |
| 19 to 25 Years | 0 (0.0%) | 44 (88.0%) |
| 25 to 34 Years | 11 (10.6%) | 90 (86.5%) |
| 35 to 44 Years | 27 (14.9%) | 149 (82.3%) |
| 45 to 54 Years | 0 (0.0%) | 193 (95.1%) |
| 55 to 64 Years | 31 (23.5%) | 102 (77.3%) |
| 65 to 74 Years | 136 (90.7%) | 110 (73.3%) |
| 75 Years and over | 41 (100.0%) | 27 (65.8%) |
| Total | 343 (28.8%) | 961 (80.8%) |
Disability Status by Sex by Age in Madison Lake
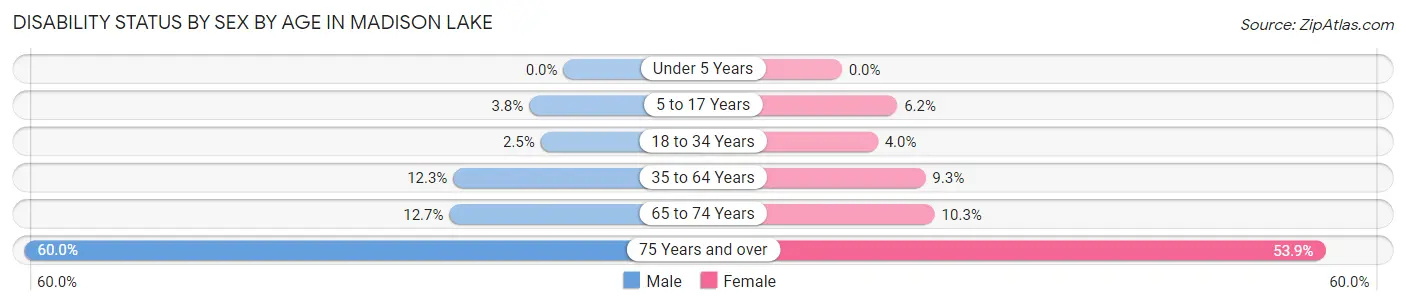
| Age Bracket | Male | Female |
| Under 5 Years | 0 (0.0%) | 0 (0.0%) |
| 5 to 17 Years | 4 (3.8%) | 10 (6.2%) |
| 18 to 34 Years | 2 (2.5%) | 3 (4.0%) |
| 35 to 64 Years | 33 (12.3%) | 23 (9.3%) |
| 65 to 74 Years | 8 (12.7%) | 9 (10.3%) |
| 75 Years and over | 9 (60.0%) | 14 (53.8%) |
Disability Class by Sex by Age in Madison Lake
Disability Class: Hearing Difficulty
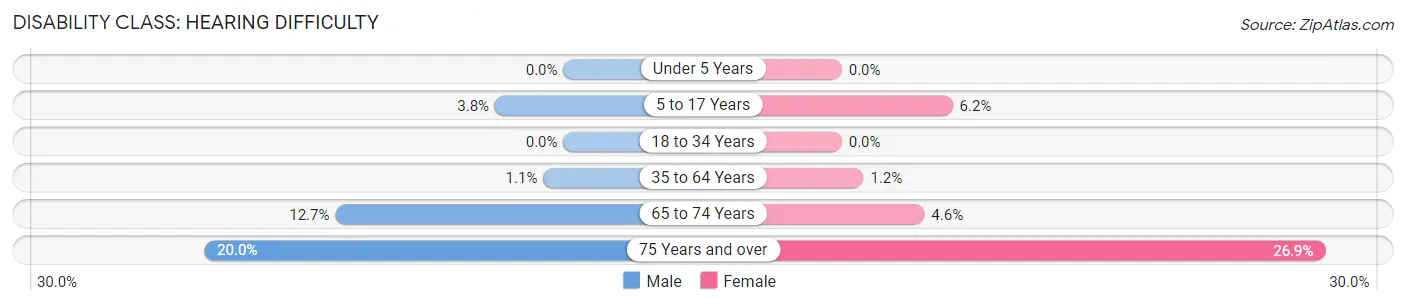
| Age Bracket | Male | Female |
| Under 5 Years | 0 (0.0%) | 0 (0.0%) |
| 5 to 17 Years | 4 (3.8%) | 10 (6.2%) |
| 18 to 34 Years | 0 (0.0%) | 0 (0.0%) |
| 35 to 64 Years | 3 (1.1%) | 3 (1.2%) |
| 65 to 74 Years | 8 (12.7%) | 4 (4.6%) |
| 75 Years and over | 3 (20.0%) | 7 (26.9%) |
Disability Class: Vision Difficulty
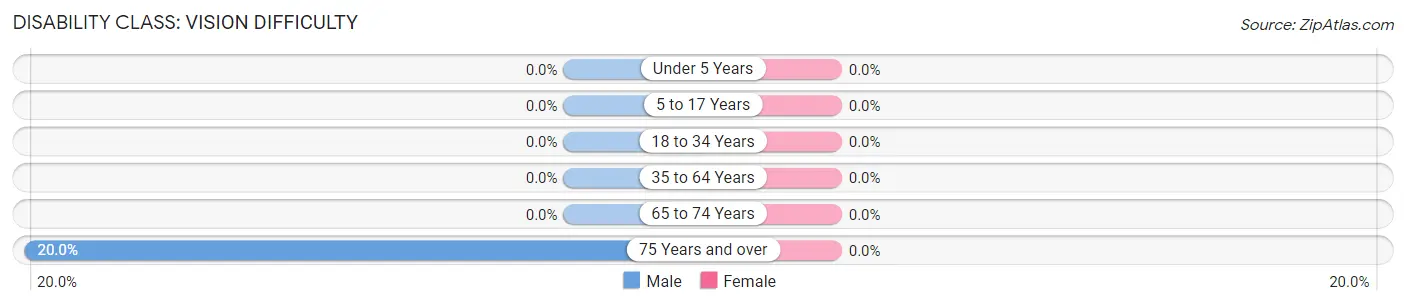
| Age Bracket | Male | Female |
| Under 5 Years | 0 (0.0%) | 0 (0.0%) |
| 5 to 17 Years | 0 (0.0%) | 0 (0.0%) |
| 18 to 34 Years | 0 (0.0%) | 0 (0.0%) |
| 35 to 64 Years | 0 (0.0%) | 0 (0.0%) |
| 65 to 74 Years | 0 (0.0%) | 0 (0.0%) |
| 75 Years and over | 3 (20.0%) | 0 (0.0%) |
Disability Class: Cognitive Difficulty
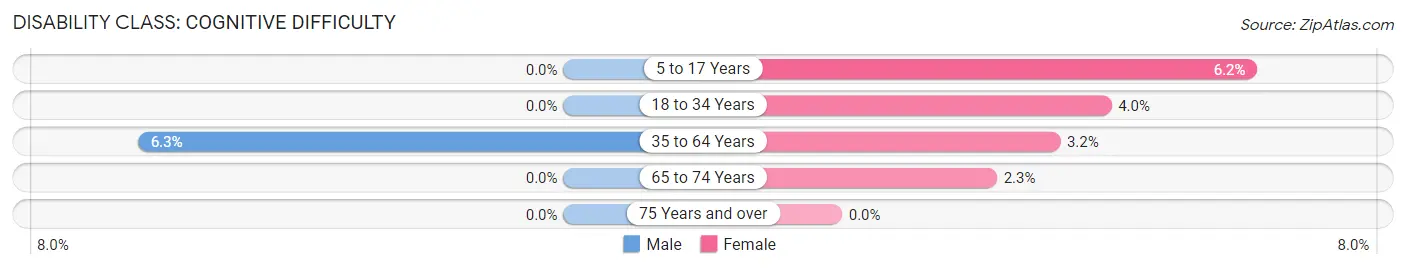
| Age Bracket | Male | Female |
| 5 to 17 Years | 0 (0.0%) | 10 (6.2%) |
| 18 to 34 Years | 0 (0.0%) | 3 (4.0%) |
| 35 to 64 Years | 17 (6.3%) | 8 (3.2%) |
| 65 to 74 Years | 0 (0.0%) | 2 (2.3%) |
| 75 Years and over | 0 (0.0%) | 0 (0.0%) |
Disability Class: Ambulatory Difficulty
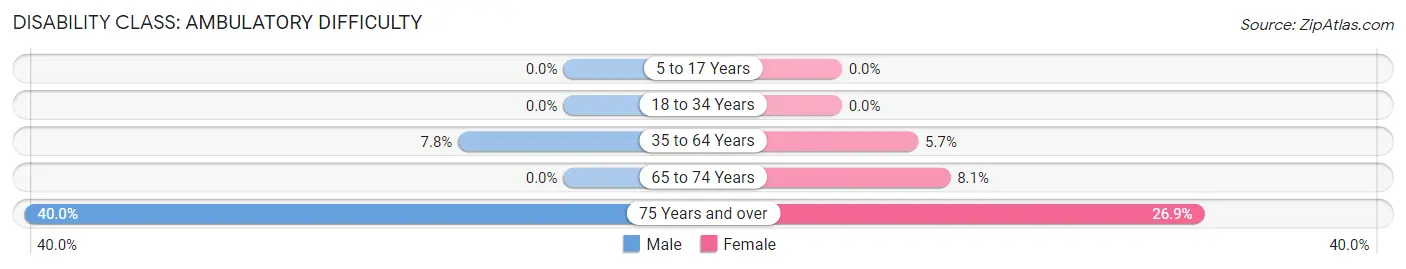
| Age Bracket | Male | Female |
| 5 to 17 Years | 0 (0.0%) | 0 (0.0%) |
| 18 to 34 Years | 0 (0.0%) | 0 (0.0%) |
| 35 to 64 Years | 21 (7.8%) | 14 (5.7%) |
| 65 to 74 Years | 0 (0.0%) | 7 (8.1%) |
| 75 Years and over | 6 (40.0%) | 7 (26.9%) |
Disability Class: Self-Care Difficulty
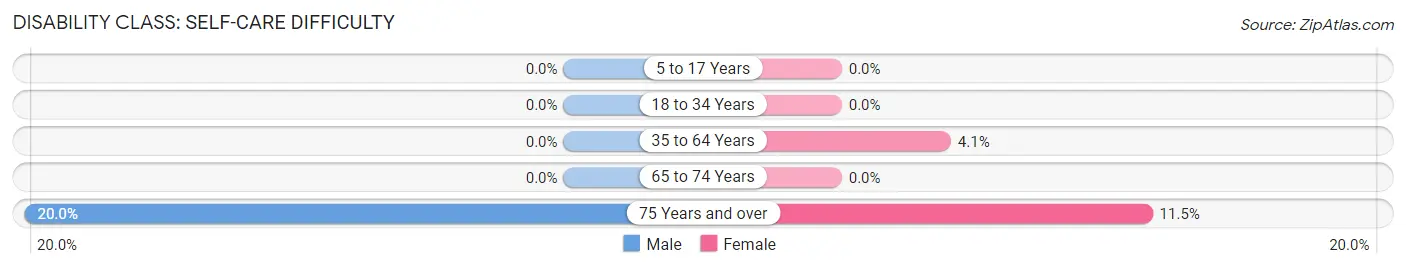
| Age Bracket | Male | Female |
| 5 to 17 Years | 0 (0.0%) | 0 (0.0%) |
| 18 to 34 Years | 0 (0.0%) | 0 (0.0%) |
| 35 to 64 Years | 0 (0.0%) | 10 (4.1%) |
| 65 to 74 Years | 0 (0.0%) | 0 (0.0%) |
| 75 Years and over | 3 (20.0%) | 3 (11.5%) |
Technology Access in Madison Lake
Computing Device Access in Madison Lake
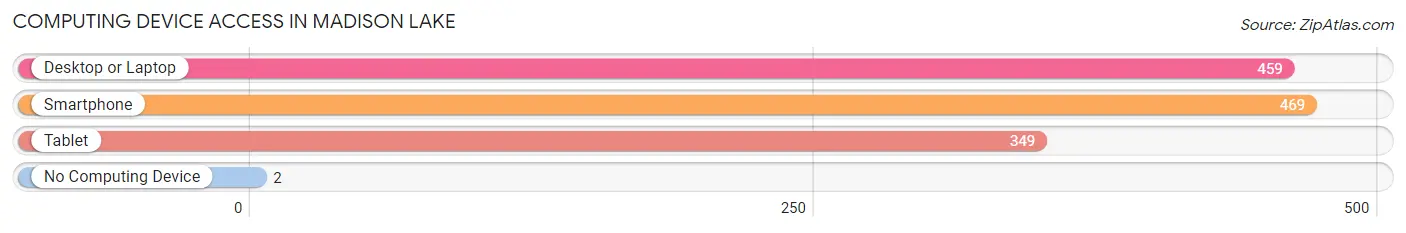
| Device Type | # Households | % Households |
| Desktop or Laptop | 459 | 94.3% |
| Smartphone | 469 | 96.3% |
| Tablet | 349 | 71.7% |
| No Computing Device | 2 | 0.4% |
| Total | 487 | 100.0% |
Internet Access in Madison Lake
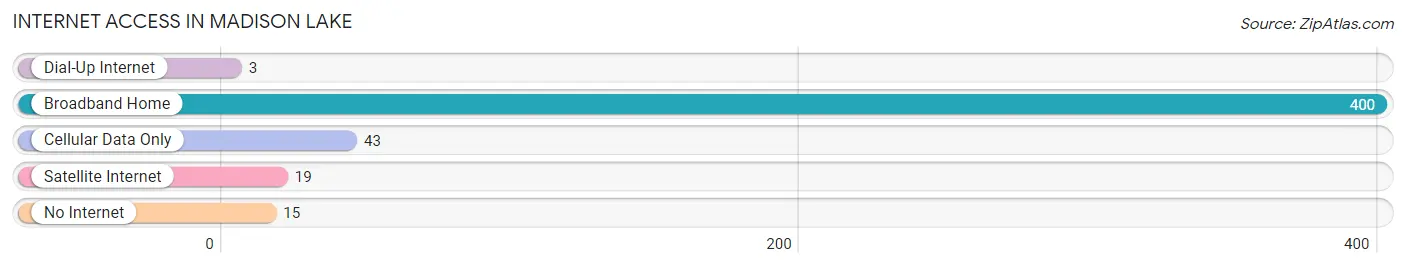
| Internet Type | # Households | % Households |
| Dial-Up Internet | 3 | 0.6% |
| Broadband Home | 400 | 82.1% |
| Cellular Data Only | 43 | 8.8% |
| Satellite Internet | 19 | 3.9% |
| No Internet | 15 | 3.1% |
| Total | 487 | 100.0% |
Madison Lake Summary
History
The small town of Madison Lake, Minnesota is located in the south-central part of the state, about an hour south of the Twin Cities. It is situated on the shores of Madison Lake, a large lake that is part of the Minnesota River system. The town was founded in 1856 by a group of settlers from Wisconsin who were looking for a place to settle and farm. The town was named after the lake, which was named after James Madison, the fourth President of the United States.
The town grew slowly over the years, but it was not until the late 19th century that it began to experience significant growth. In 1887, the railroad arrived in Madison Lake, connecting it to the rest of the state and the country. This allowed for the development of the town’s economy, which was largely based on agriculture and timber.
In the early 20th century, Madison Lake began to experience a period of rapid growth. This was due in part to the development of the nearby town of Mankato, which was growing rapidly due to its location on the Minnesota River. As Mankato grew, so did Madison Lake, and by the mid-20th century, the town had become a popular summer destination for tourists.
Geography
Madison Lake is located in the south-central part of Minnesota, about an hour south of the Twin Cities. It is situated on the shores of Madison Lake, a large lake that is part of the Minnesota River system. The town is surrounded by rolling hills and farmland, and is located in the heart of the Minnesota River Valley.
The town is located in Blue Earth County, and is part of the Mankato-North Mankato Metropolitan Statistical Area. The town is located at an elevation of 945 feet above sea level, and has a total area of 2.2 square miles.
Economy
The economy of Madison Lake is largely based on agriculture and tourism. The town is home to several farms, which produce a variety of crops, including corn, soybeans, and wheat. The town is also home to several small businesses, including restaurants, retail stores, and a few small manufacturing companies.
Tourism is also an important part of the local economy. Madison Lake is a popular destination for tourists, who come to enjoy the lake, the nearby parks, and the small-town atmosphere. The town is also home to several resorts, which offer a variety of recreational activities, such as fishing, boating, and swimming.
Demographics
As of the 2010 census, the population of Madison Lake was 1,845. The population is largely white (96.2%), with a small percentage of African Americans (1.2%) and Native Americans (0.7%). The median household income is $50,972, and the median age is 43.
The town is served by the Mankato-North Mankato School District, which includes two elementary schools, one middle school, and one high school. The town is also home to a branch of the Minnesota State University system, which offers a variety of degree programs.
Conclusion
Madison Lake, Minnesota is a small town located in the south-central part of the state. It is situated on the shores of Madison Lake, and is surrounded by rolling hills and farmland. The town’s economy is largely based on agriculture and tourism, and it is home to several small businesses and resorts. The population of Madison Lake is largely white, and the median household income is $50,972. The town is served by the Mankato-North Mankato School District, and is home to a branch of the Minnesota State University system.
Common Questions
What is Per Capita Income in Madison Lake?
Per Capita income in Madison Lake is $50,176.
What is the Median Family Income in Madison Lake?
Median Family Income in Madison Lake is $109,477.
What is the Median Household income in Madison Lake?
Median Household Income in Madison Lake is $104,583.
What is Income or Wage Gap in Madison Lake?
Income or Wage Gap in Madison Lake is 2.0%.
Women in Madison Lake earn 98.0 cents for every dollar earned by a man.
What is Inequality or Gini Index in Madison Lake?
Inequality or Gini Index in Madison Lake is 0.41.
What is the Total Population of Madison Lake?
Total Population of Madison Lake is 1,190.
What is the Total Male Population of Madison Lake?
Total Male Population of Madison Lake is 554.
What is the Total Female Population of Madison Lake?
Total Female Population of Madison Lake is 636.
What is the Ratio of Males per 100 Females in Madison Lake?
There are 87.11 Males per 100 Females in Madison Lake.
What is the Ratio of Females per 100 Males in Madison Lake?
There are 114.80 Females per 100 Males in Madison Lake.
What is the Median Population Age in Madison Lake?
Median Population Age in Madison Lake is 40.2 Years.
What is the Average Family Size in Madison Lake
Average Family Size in Madison Lake is 3.0 People.
What is the Average Household Size in Madison Lake
Average Household Size in Madison Lake is 2.4 People.
How Large is the Labor Force in Madison Lake?
There are 695 People in the Labor Forcein in Madison Lake.
What is the Percentage of People in the Labor Force in Madison Lake?
78.5% of People are in the Labor Force in Madison Lake.
What is the Unemployment Rate in Madison Lake?
Unemployment Rate in Madison Lake is 2.4%.