Lynd, MN Map & Demographics
Lynd Map
Lynd Overview
$29,533
PER CAPITA INCOME
$73,750
AVG FAMILY INCOME
$70,417
AVG HOUSEHOLD INCOME
38.6%
WAGE / INCOME GAP [ % ]
61.4¢/ $1
WAGE / INCOME GAP [ $ ]
0.34
INEQUALITY / GINI INDEX
527
TOTAL POPULATION
267
MALE POPULATION
260
FEMALE POPULATION
102.69
MALES / 100 FEMALES
97.38
FEMALES / 100 MALES
28.2
MEDIAN AGE
3.6
AVG FAMILY SIZE
2.8
AVG HOUSEHOLD SIZE
253
LABOR FORCE [ PEOPLE ]
72.7%
PERCENT IN LABOR FORCE
2.0%
UNEMPLOYMENT RATE
Lynd Zip Codes
Lynd Area Codes
Income in Lynd
Income Overview in Lynd
Per Capita Income in Lynd is $29,533, while median incomes of families and households are $73,750 and $70,417 respectively.
| Characteristic | Number | Measure |
| Per Capita Income | 527 | $29,533 |
| Median Family Income | 111 | $73,750 |
| Mean Family Income | 111 | $99,024 |
| Median Household Income | 190 | $70,417 |
| Mean Household Income | 190 | $85,488 |
| Income Deficit | 111 | $0 |
| Wage / Income Gap (%) | 527 | 38.64% |
| Wage / Income Gap ($) | 527 | 61.36¢ per $1 |
| Gini / Inequality Index | 527 | 0.34 |
Earnings by Sex in Lynd
Average Earnings in Lynd are $40,208, $45,833 for men and $28,125 for women, a difference of 38.6%.
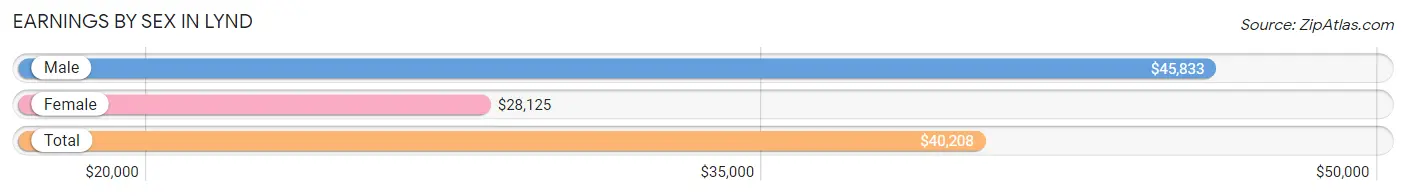
| Sex | Number | Average Earnings |
| Male | 138 (50.0%) | $45,833 |
| Female | 138 (50.0%) | $28,125 |
| Total | 276 (100.0%) | $40,208 |
Earnings by Sex by Income Bracket in Lynd
The most common earnings brackets in Lynd are $40,000 to $44,999 for men (27 | 19.6%) and $10,000 to $12,499 for women (18 | 13.0%).
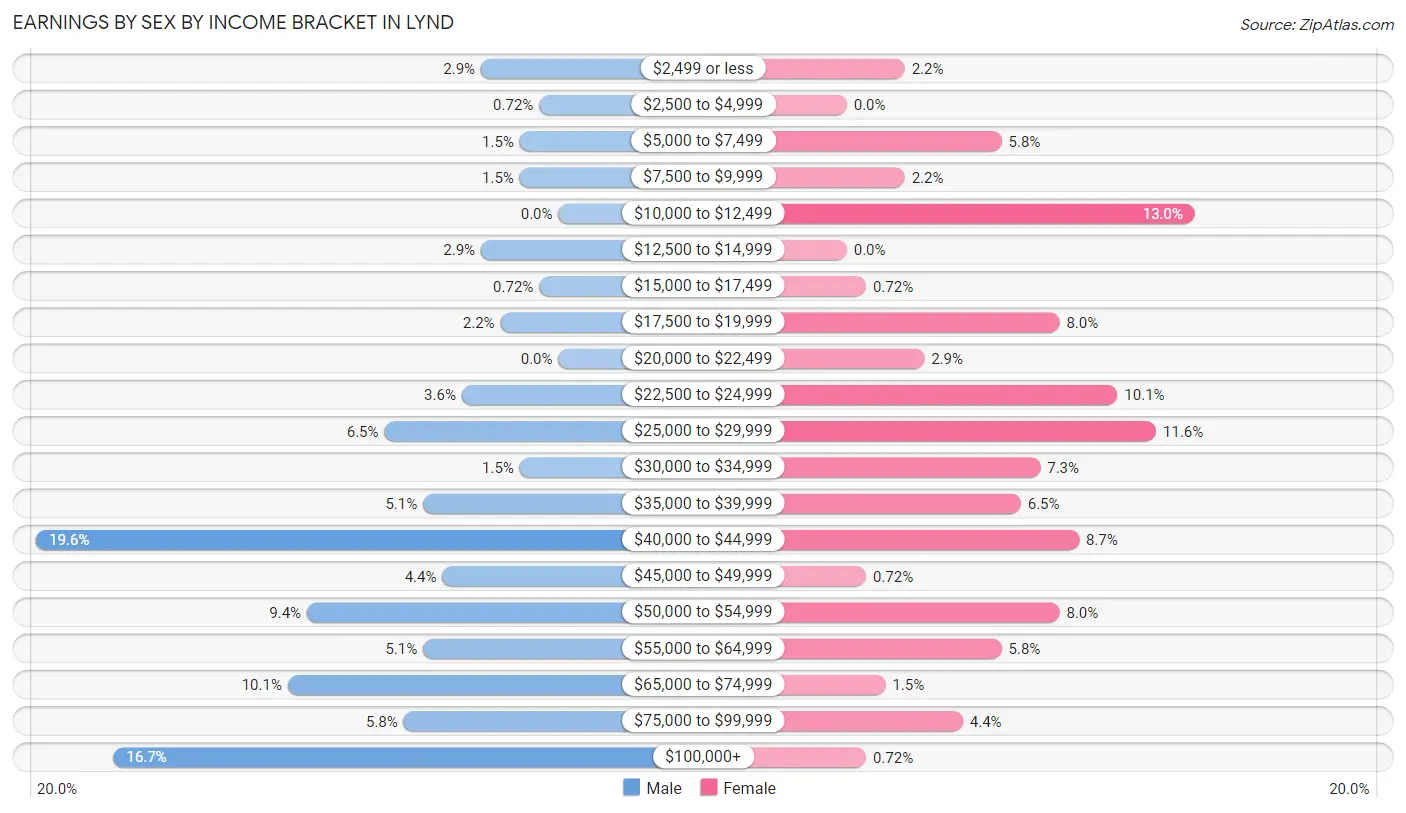
| Income | Male | Female |
| $2,499 or less | 4 (2.9%) | 3 (2.2%) |
| $2,500 to $4,999 | 1 (0.7%) | 0 (0.0%) |
| $5,000 to $7,499 | 2 (1.5%) | 8 (5.8%) |
| $7,500 to $9,999 | 2 (1.5%) | 3 (2.2%) |
| $10,000 to $12,499 | 0 (0.0%) | 18 (13.0%) |
| $12,500 to $14,999 | 4 (2.9%) | 0 (0.0%) |
| $15,000 to $17,499 | 1 (0.7%) | 1 (0.7%) |
| $17,500 to $19,999 | 3 (2.2%) | 11 (8.0%) |
| $20,000 to $22,499 | 0 (0.0%) | 4 (2.9%) |
| $22,500 to $24,999 | 5 (3.6%) | 14 (10.1%) |
| $25,000 to $29,999 | 9 (6.5%) | 16 (11.6%) |
| $30,000 to $34,999 | 2 (1.5%) | 10 (7.2%) |
| $35,000 to $39,999 | 7 (5.1%) | 9 (6.5%) |
| $40,000 to $44,999 | 27 (19.6%) | 12 (8.7%) |
| $45,000 to $49,999 | 6 (4.3%) | 1 (0.7%) |
| $50,000 to $54,999 | 13 (9.4%) | 11 (8.0%) |
| $55,000 to $64,999 | 7 (5.1%) | 8 (5.8%) |
| $65,000 to $74,999 | 14 (10.1%) | 2 (1.5%) |
| $75,000 to $99,999 | 8 (5.8%) | 6 (4.3%) |
| $100,000+ | 23 (16.7%) | 1 (0.7%) |
| Total | 138 (100.0%) | 138 (100.0%) |
Earnings by Sex by Educational Attainment in Lynd
Average earnings in Lynd are $47,083 for men and $30,125 for women, a difference of 36.0%. Men with an educational attainment of graduate degree enjoy the highest average annual earnings of $125,000, while those with college or associate's degree education earn the least with $44,100. Women with an educational attainment of graduate degree earn the most with the average annual earnings of $83,750, while those with college or associate's degree education have the smallest earnings of $19,861.
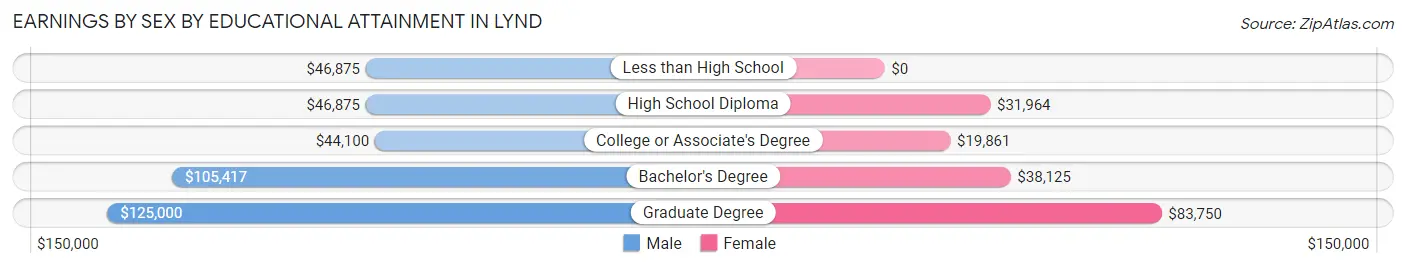
| Educational Attainment | Male Income | Female Income |
| Less than High School | $46,875 | $0 |
| High School Diploma | $46,875 | $31,964 |
| College or Associate's Degree | $44,100 | $19,861 |
| Bachelor's Degree | $105,417 | $38,125 |
| Graduate Degree | $125,000 | $83,750 |
| Total | $47,083 | $30,125 |
Family Income in Lynd
Family Income Brackets in Lynd
According to the Lynd family income data, there are 30 families falling into the $50,000 to $74,999 income range, which is the most common income bracket and makes up 27.0% of all families.
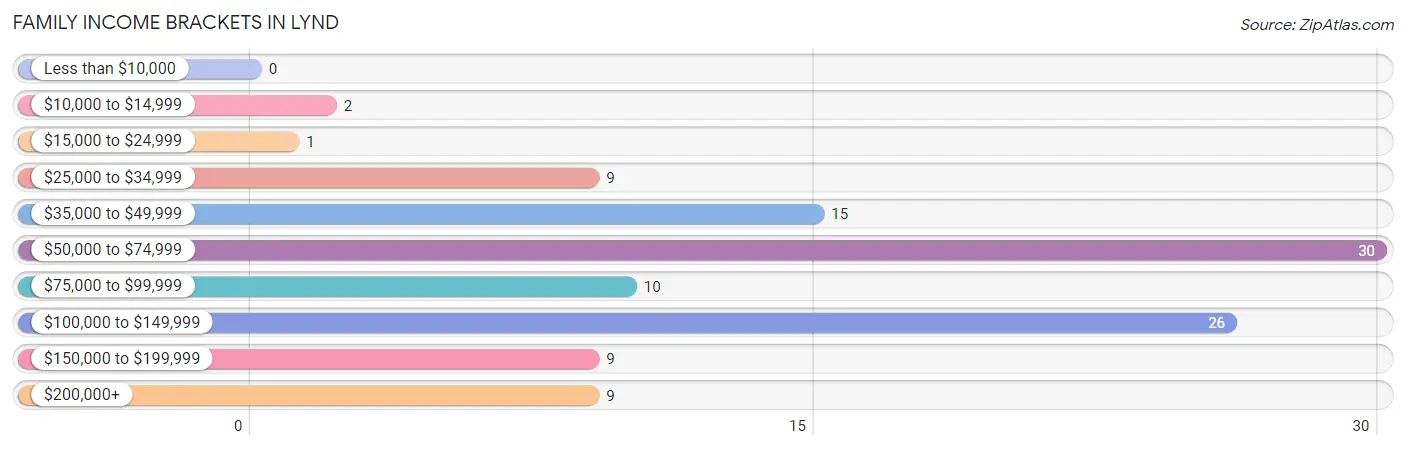
| Income Bracket | # Families | % Families |
| Less than $10,000 | 0 | 0.0% |
| $10,000 to $14,999 | 2 | 1.8% |
| $15,000 to $24,999 | 1 | 0.9% |
| $25,000 to $34,999 | 9 | 8.1% |
| $35,000 to $49,999 | 15 | 13.5% |
| $50,000 to $74,999 | 30 | 27.0% |
| $75,000 to $99,999 | 10 | 9.0% |
| $100,000 to $149,999 | 26 | 23.4% |
| $150,000 to $199,999 | 9 | 8.1% |
| $200,000+ | 9 | 8.1% |
Family Income by Famaliy Size in Lynd
3-person families (18 | 16.2%) account for the highest median family income in Lynd with $74,167 per family, while 2-person families (48 | 43.2%) have the highest median income of $35,625 per family member.
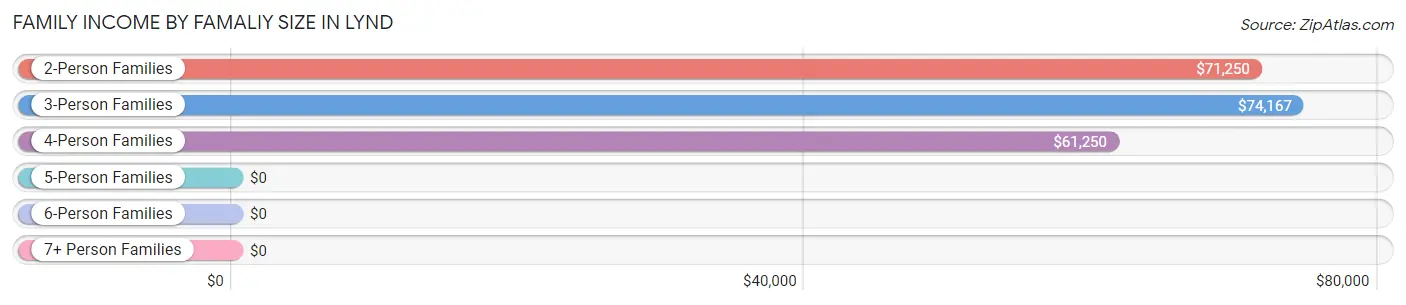
| Income Bracket | # Families | Median Income |
| 2-Person Families | 48 (43.2%) | $71,250 |
| 3-Person Families | 18 (16.2%) | $74,167 |
| 4-Person Families | 22 (19.8%) | $61,250 |
| 5-Person Families | 17 (15.3%) | $0 |
| 6-Person Families | 5 (4.5%) | $0 |
| 7+ Person Families | 1 (0.9%) | $0 |
| Total | 111 (100.0%) | $73,750 |
Family Income by Number of Earners in Lynd
The median family income in Lynd is $73,750, with families comprising 3+ earners (6) having the highest median family income of $115,000, while families with 1 earner (45) have the lowest median family income of $51,875, accounting for 5.4% and 40.5% of families, respectively.
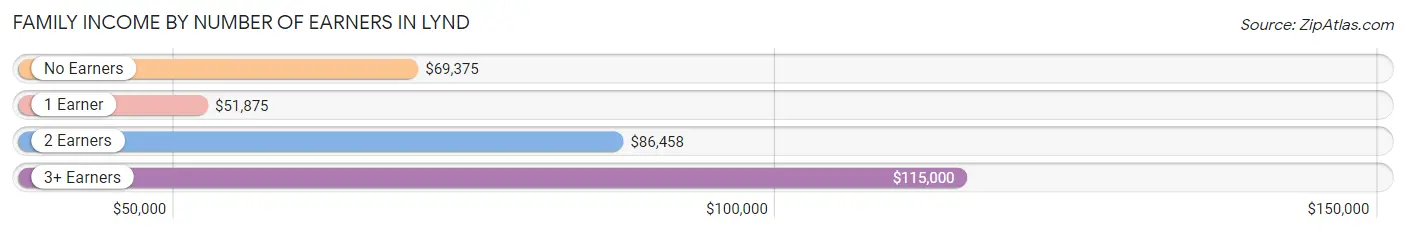
| Number of Earners | # Families | Median Income |
| No Earners | 7 (6.3%) | $69,375 |
| 1 Earner | 45 (40.5%) | $51,875 |
| 2 Earners | 53 (47.7%) | $86,458 |
| 3+ Earners | 6 (5.4%) | $115,000 |
| Total | 111 (100.0%) | $73,750 |
Household Income in Lynd
Household Income Brackets in Lynd
With 59 households falling in the category, the $50,000 to $74,999 income range is the most frequent in Lynd, accounting for 31.0% of all households. In contrast, only 1 households (0.5%) fall into the less than $10,000 income bracket, making it the least populous group.
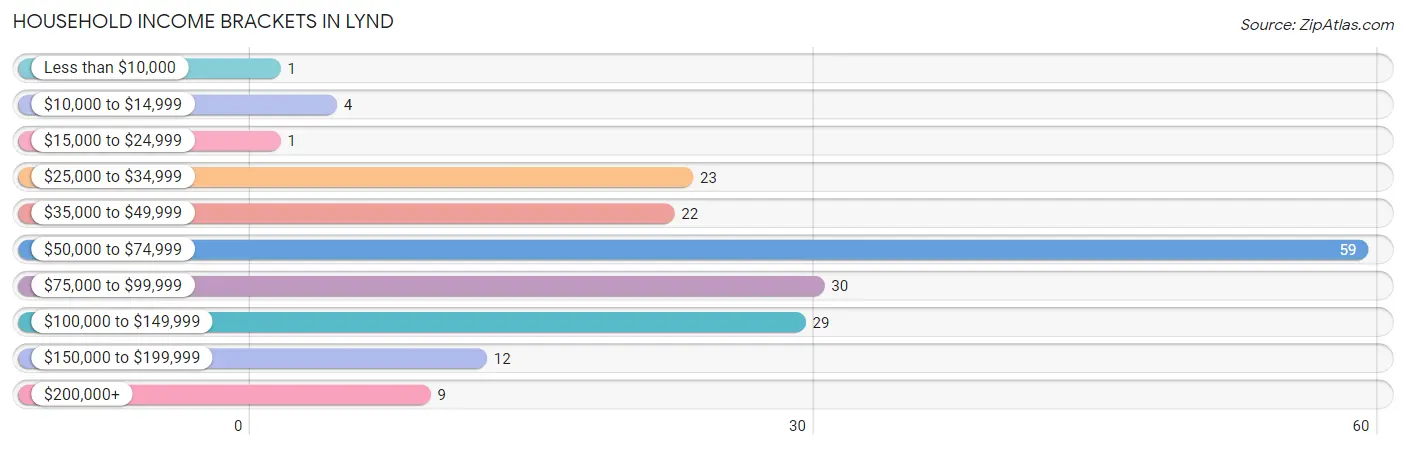
| Income Bracket | # Households | % Households |
| Less than $10,000 | 1 | 0.5% |
| $10,000 to $14,999 | 4 | 2.1% |
| $15,000 to $24,999 | 1 | 0.5% |
| $25,000 to $34,999 | 23 | 12.1% |
| $35,000 to $49,999 | 22 | 11.6% |
| $50,000 to $74,999 | 59 | 31.1% |
| $75,000 to $99,999 | 30 | 15.8% |
| $100,000 to $149,999 | 29 | 15.3% |
| $150,000 to $199,999 | 12 | 6.3% |
| $200,000+ | 9 | 4.7% |
Household Income by Householder Age in Lynd
The median household income in Lynd is $70,417, with the highest median household income of $89,167 found in the 45 to 64 years age bracket for the primary householder. A total of 56 households (29.5%) fall into this category. Meanwhile, the 65+ years age bracket for the primary householder has the lowest median household income of $0, with 25 households (13.2%) in this group.
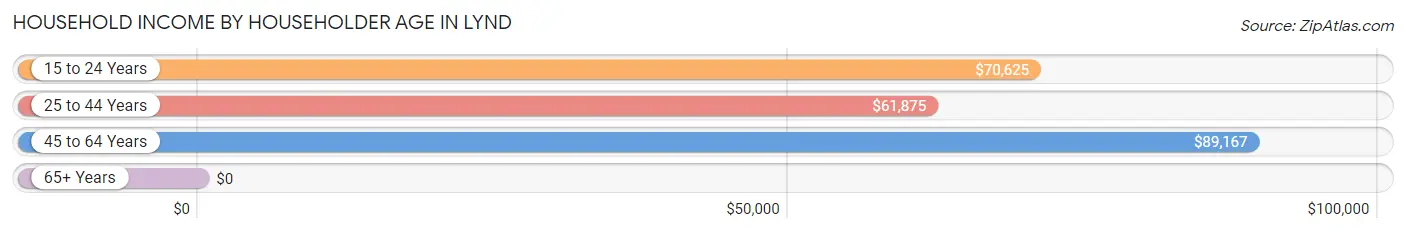
| Income Bracket | # Households | Median Income |
| 15 to 24 Years | 9 (4.7%) | $70,625 |
| 25 to 44 Years | 100 (52.6%) | $61,875 |
| 45 to 64 Years | 56 (29.5%) | $89,167 |
| 65+ Years | 25 (13.2%) | $0 |
| Total | 190 (100.0%) | $70,417 |
Poverty in Lynd
Income Below Poverty by Sex and Age in Lynd
With 12.1% poverty level for males and 23.1% for females among the residents of Lynd, 6 to 11 year old males and under 5 year old females are the most vulnerable to poverty, with 28 males (40.0%) and 13 females (68.4%) in their respective age groups living below the poverty level.
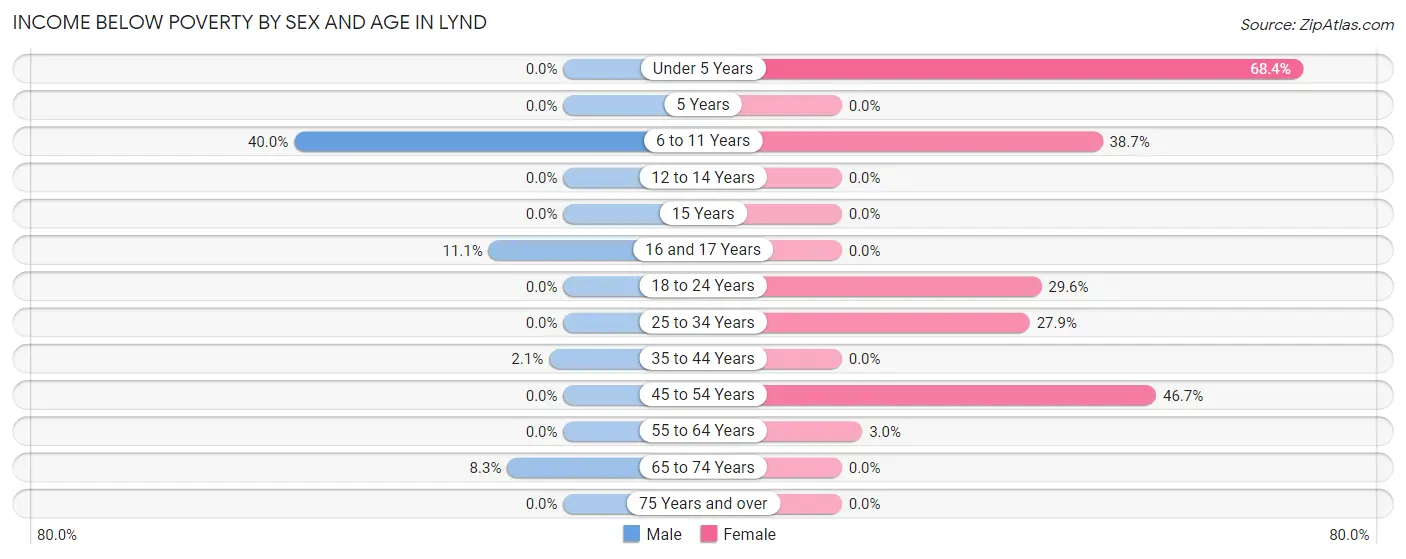
| Age Bracket | Male | Female |
| Under 5 Years | 0 (0.0%) | 13 (68.4%) |
| 5 Years | 0 (0.0%) | 0 (0.0%) |
| 6 to 11 Years | 28 (40.0%) | 12 (38.7%) |
| 12 to 14 Years | 0 (0.0%) | 0 (0.0%) |
| 15 Years | 0 (0.0%) | 0 (0.0%) |
| 16 and 17 Years | 1 (11.1%) | 0 (0.0%) |
| 18 to 24 Years | 0 (0.0%) | 8 (29.6%) |
| 25 to 34 Years | 0 (0.0%) | 12 (27.9%) |
| 35 to 44 Years | 1 (2.1%) | 0 (0.0%) |
| 45 to 54 Years | 0 (0.0%) | 14 (46.7%) |
| 55 to 64 Years | 0 (0.0%) | 1 (3.0%) |
| 65 to 74 Years | 1 (8.3%) | 0 (0.0%) |
| 75 Years and over | 0 (0.0%) | 0 (0.0%) |
| Total | 31 (12.1%) | 60 (23.1%) |
Income Above Poverty by Sex and Age in Lynd
According to the poverty statistics in Lynd, males aged under 5 years and females aged 12 to 14 years are the age groups that are most secure financially, with 100.0% of males and 100.0% of females in these age groups living above the poverty line.
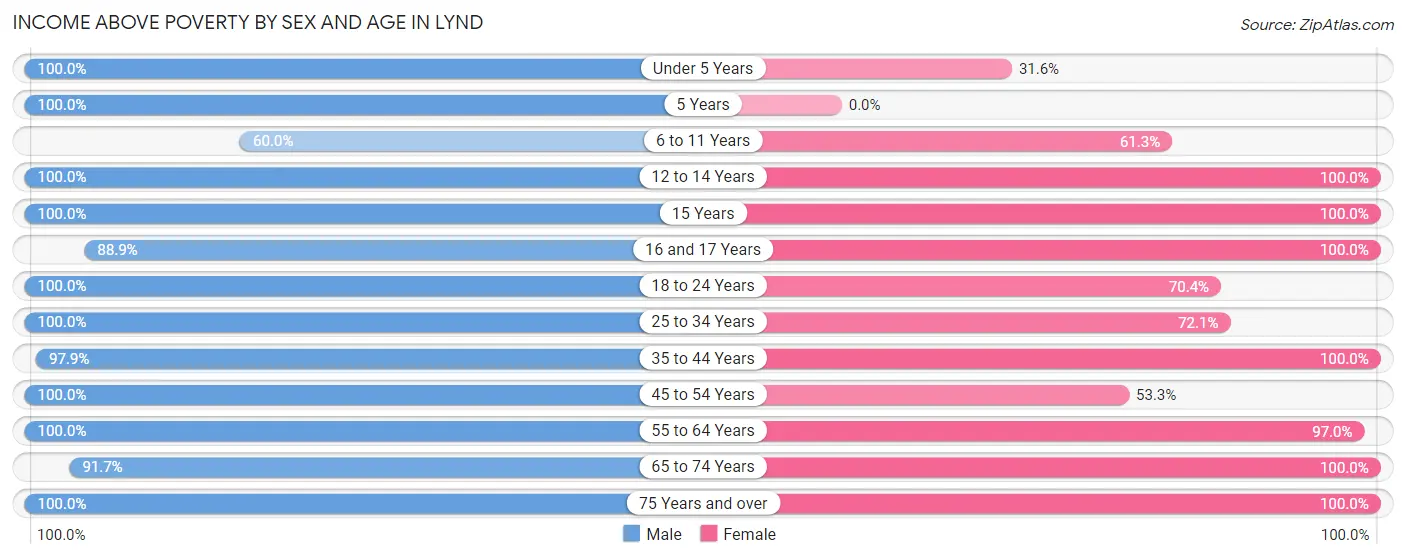
| Age Bracket | Male | Female |
| Under 5 Years | 7 (100.0%) | 6 (31.6%) |
| 5 Years | 3 (100.0%) | 0 (0.0%) |
| 6 to 11 Years | 42 (60.0%) | 19 (61.3%) |
| 12 to 14 Years | 11 (100.0%) | 20 (100.0%) |
| 15 Years | 4 (100.0%) | 3 (100.0%) |
| 16 and 17 Years | 8 (88.9%) | 1 (100.0%) |
| 18 to 24 Years | 3 (100.0%) | 19 (70.4%) |
| 25 to 34 Years | 43 (100.0%) | 31 (72.1%) |
| 35 to 44 Years | 46 (97.9%) | 38 (100.0%) |
| 45 to 54 Years | 19 (100.0%) | 16 (53.3%) |
| 55 to 64 Years | 25 (100.0%) | 32 (97.0%) |
| 65 to 74 Years | 11 (91.7%) | 13 (100.0%) |
| 75 Years and over | 3 (100.0%) | 2 (100.0%) |
| Total | 225 (87.9%) | 200 (76.9%) |
Income Below Poverty Among Married-Couple Families in Lynd
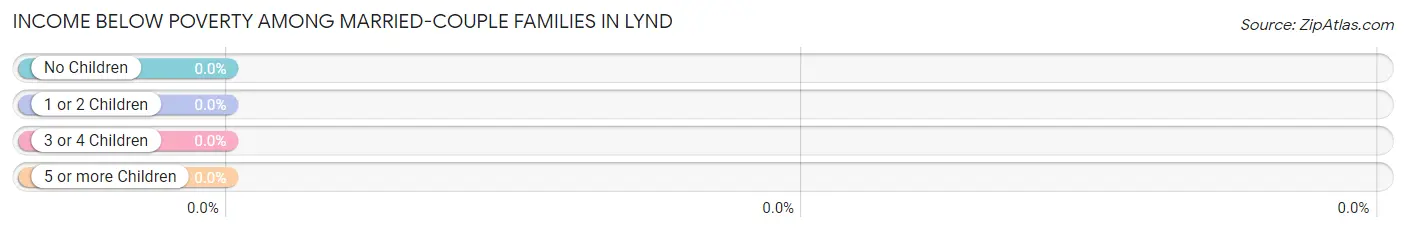
| Children | Above Poverty | Below Poverty |
| No Children | 35 (100.0%) | 0 (0.0%) |
| 1 or 2 Children | 35 (100.0%) | 0 (0.0%) |
| 3 or 4 Children | 10 (100.0%) | 0 (0.0%) |
| 5 or more Children | 0 (0.0%) | 0 (0.0%) |
| Total | 80 (100.0%) | 0 (0.0%) |
Income Below Poverty Among Single-Parent Households in Lynd
According to the poverty data in Lynd, 5.0% or 1 single-father households and 72.7% or 8 single-mother households are living below the poverty line. Among single-father households, those with 1 or 2 children have the highest poverty rate, with 1 households (6.2%) experiencing poverty. Likewise, among single-mother households, those with 3 or 4 children have the highest poverty rate, with 7 households (100.0%) falling below the poverty line.
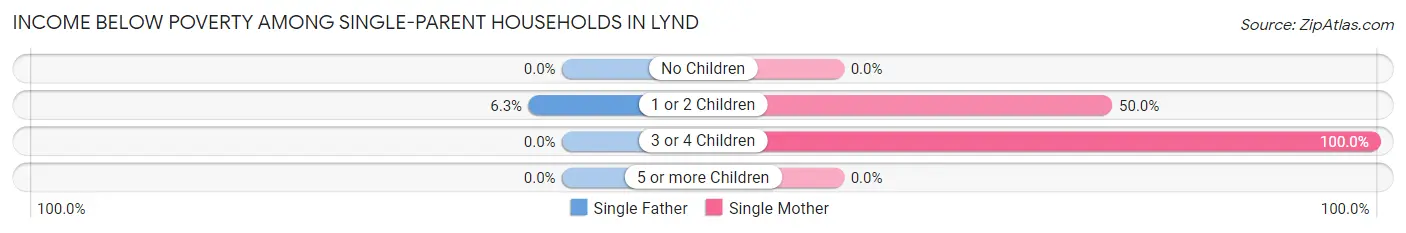
| Children | Single Father | Single Mother |
| No Children | 0 (0.0%) | 0 (0.0%) |
| 1 or 2 Children | 1 (6.2%) | 1 (50.0%) |
| 3 or 4 Children | 0 (0.0%) | 7 (100.0%) |
| 5 or more Children | 0 (0.0%) | 0 (0.0%) |
| Total | 1 (5.0%) | 8 (72.7%) |
Income Below Poverty Among Married-Couple vs Single-Parent Households in Lynd
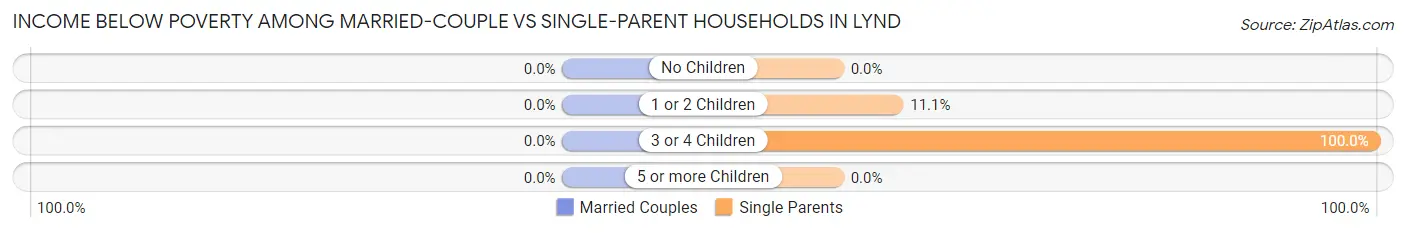
| Children | Married-Couple Families | Single-Parent Households |
| No Children | 0 (0.0%) | 0 (0.0%) |
| 1 or 2 Children | 0 (0.0%) | 2 (11.1%) |
| 3 or 4 Children | 0 (0.0%) | 7 (100.0%) |
| 5 or more Children | 0 (0.0%) | 0 (0.0%) |
| Total | 0 (0.0%) | 9 (29.0%) |
Race in Lynd
The most populous races in Lynd are White / Caucasian (396 | 75.1%), Hispanic or Latino (156 | 29.6%), and Some other Race (106 | 20.1%).
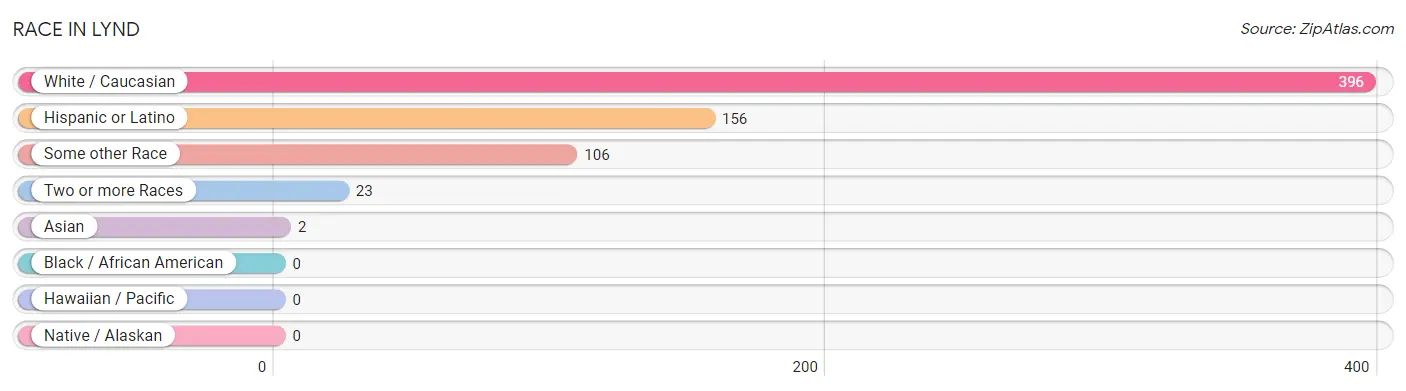
| Race | # Population | % Population |
| Asian | 2 | 0.4% |
| Black / African American | 0 | 0.0% |
| Hawaiian / Pacific | 0 | 0.0% |
| Hispanic or Latino | 156 | 29.6% |
| Native / Alaskan | 0 | 0.0% |
| White / Caucasian | 396 | 75.1% |
| Two or more Races | 23 | 4.4% |
| Some other Race | 106 | 20.1% |
| Total | 527 | 100.0% |
Ancestry in Lynd
The most populous ancestries reported in Lynd are Mexican (156 | 29.6%), German (151 | 28.6%), Norwegian (59 | 11.2%), Irish (36 | 6.8%), and American (34 | 6.5%), together accounting for 82.7% of all Lynd residents.
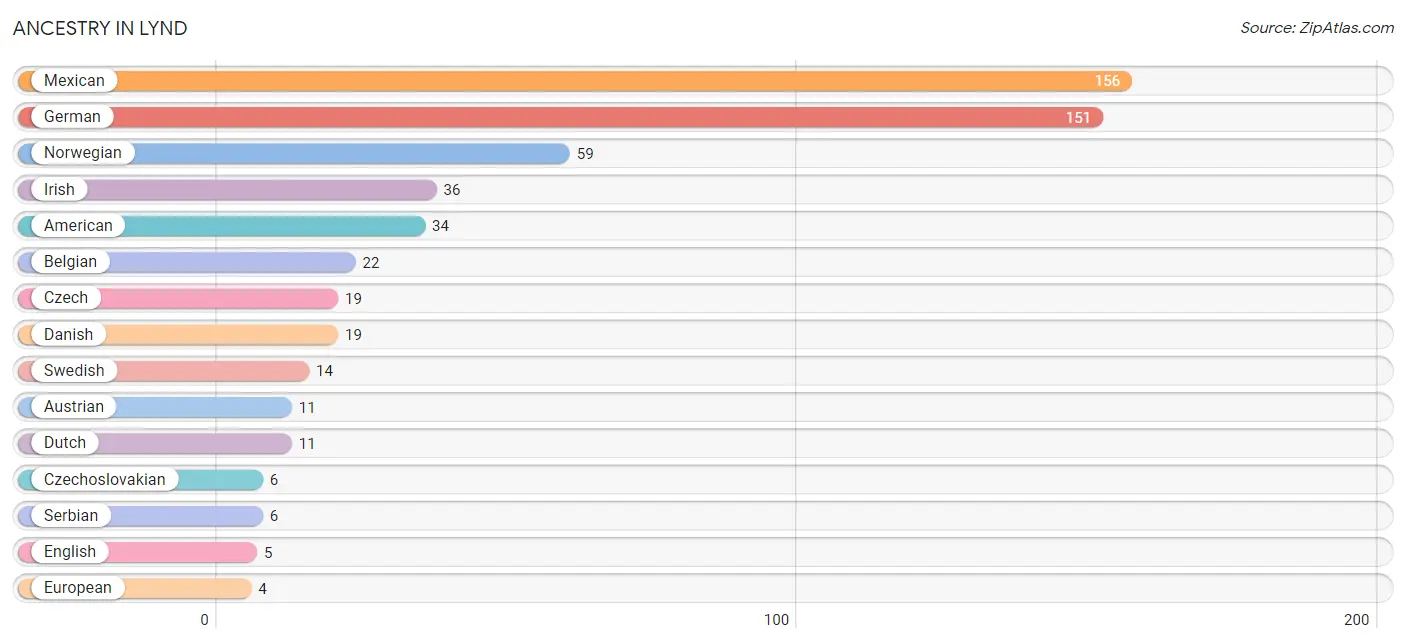
| Ancestry | # Population | % Population |
| American | 34 | 6.5% |
| Austrian | 11 | 2.1% |
| Belgian | 22 | 4.2% |
| Bhutanese | 1 | 0.2% |
| British | 1 | 0.2% |
| Chippewa | 2 | 0.4% |
| Czech | 19 | 3.6% |
| Czechoslovakian | 6 | 1.1% |
| Danish | 19 | 3.6% |
| Dutch | 11 | 2.1% |
| English | 5 | 0.9% |
| European | 4 | 0.8% |
| French | 4 | 0.8% |
| French American Indian | 1 | 0.2% |
| French Canadian | 1 | 0.2% |
| German | 151 | 28.6% |
| Icelander | 4 | 0.8% |
| Irish | 36 | 6.8% |
| Korean | 4 | 0.8% |
| Mexican | 156 | 29.6% |
| Norwegian | 59 | 11.2% |
| Polish | 4 | 0.8% |
| Scotch-Irish | 2 | 0.4% |
| Scottish | 1 | 0.2% |
| Serbian | 6 | 1.1% |
| Slovak | 2 | 0.4% |
| Swedish | 14 | 2.7% |
| Welsh | 3 | 0.6% | View All 28 Rows |
Immigrants in Lynd
The most numerous immigrant groups reported in Lynd came from Central America (41 | 7.8%), Latin America (41 | 7.8%), Mexico (41 | 7.8%), Oceania (3 | 0.6%), and Asia (1 | 0.2%), together accounting for 24.1% of all Lynd residents.
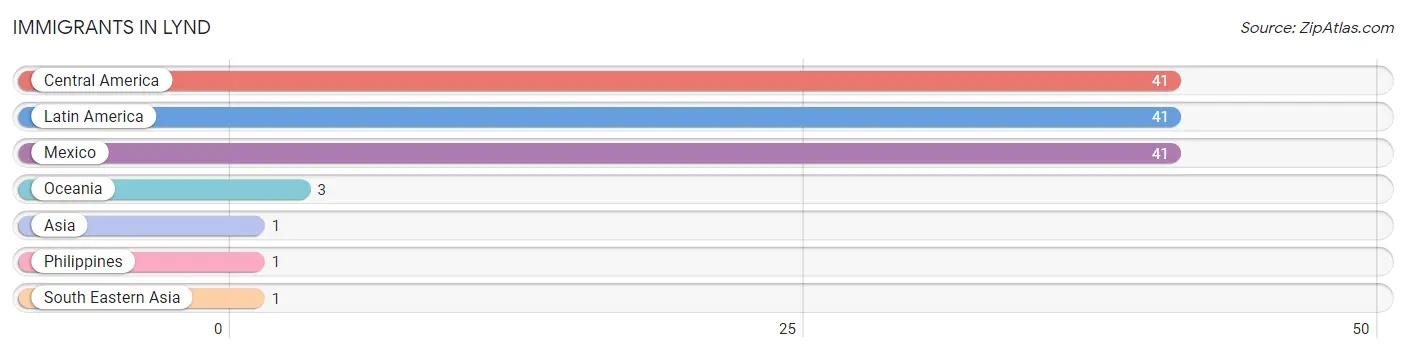
| Immigration Origin | # Population | % Population |
| Asia | 1 | 0.2% |
| Central America | 41 | 7.8% |
| Latin America | 41 | 7.8% |
| Mexico | 41 | 7.8% |
| Oceania | 3 | 0.6% |
| Philippines | 1 | 0.2% |
| South Eastern Asia | 1 | 0.2% | View All 7 Rows |
Sex and Age in Lynd
Sex and Age in Lynd
The most populous age groups in Lynd are 5 to 9 Years (59 | 22.1%) for men and 25 to 29 Years (37 | 14.2%) for women.
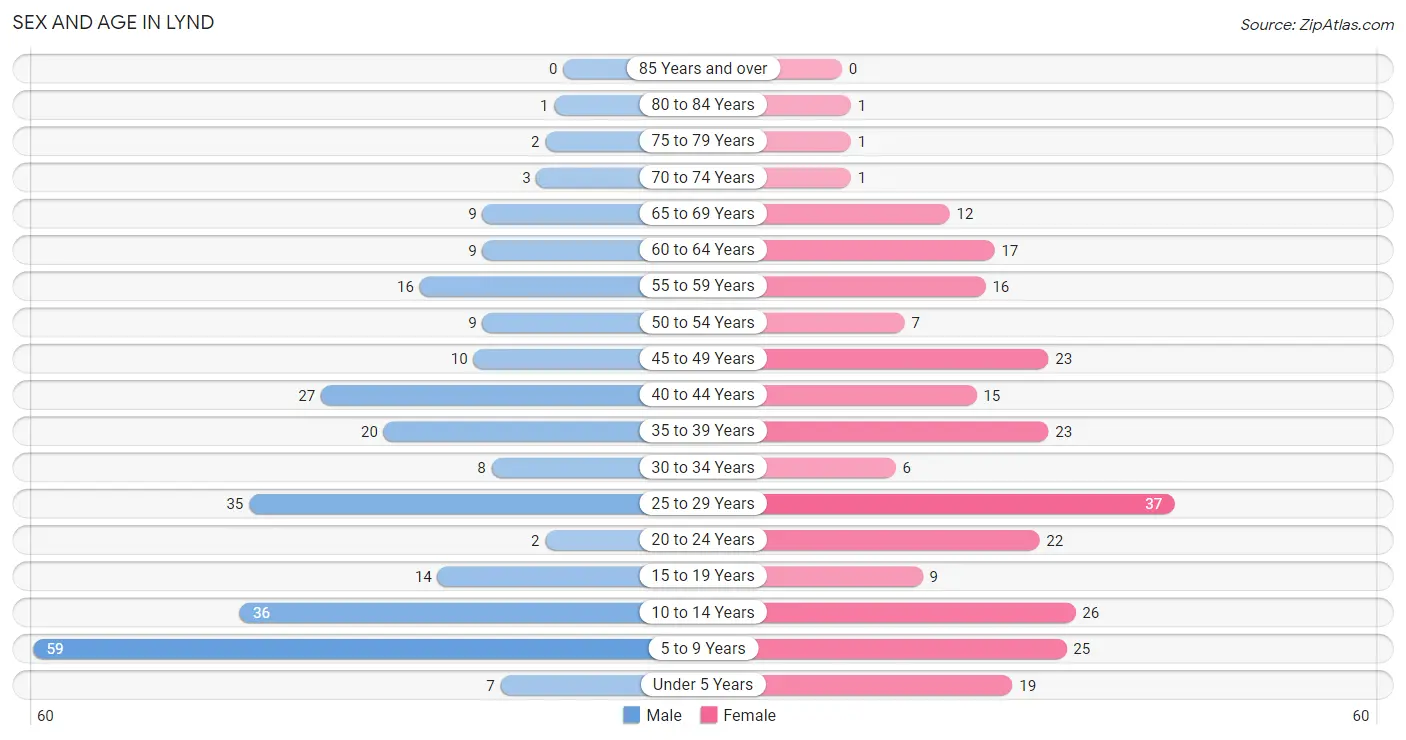
| Age Bracket | Male | Female |
| Under 5 Years | 7 (2.6%) | 19 (7.3%) |
| 5 to 9 Years | 59 (22.1%) | 25 (9.6%) |
| 10 to 14 Years | 36 (13.5%) | 26 (10.0%) |
| 15 to 19 Years | 14 (5.2%) | 9 (3.5%) |
| 20 to 24 Years | 2 (0.7%) | 22 (8.5%) |
| 25 to 29 Years | 35 (13.1%) | 37 (14.2%) |
| 30 to 34 Years | 8 (3.0%) | 6 (2.3%) |
| 35 to 39 Years | 20 (7.5%) | 23 (8.8%) |
| 40 to 44 Years | 27 (10.1%) | 15 (5.8%) |
| 45 to 49 Years | 10 (3.7%) | 23 (8.8%) |
| 50 to 54 Years | 9 (3.4%) | 7 (2.7%) |
| 55 to 59 Years | 16 (6.0%) | 16 (6.1%) |
| 60 to 64 Years | 9 (3.4%) | 17 (6.5%) |
| 65 to 69 Years | 9 (3.4%) | 12 (4.6%) |
| 70 to 74 Years | 3 (1.1%) | 1 (0.4%) |
| 75 to 79 Years | 2 (0.7%) | 1 (0.4%) |
| 80 to 84 Years | 1 (0.4%) | 1 (0.4%) |
| 85 Years and over | 0 (0.0%) | 0 (0.0%) |
| Total | 267 (100.0%) | 260 (100.0%) |
Families and Households in Lynd
Median Family Size in Lynd
The median family size in Lynd is 3.61 persons per family, with single female/mother families (11 | 9.9%) accounting for the largest median family size of 7.18 persons per family. On the other hand, single male/father families (20 | 18.0%) represent the smallest median family size with 2.60 persons per family.
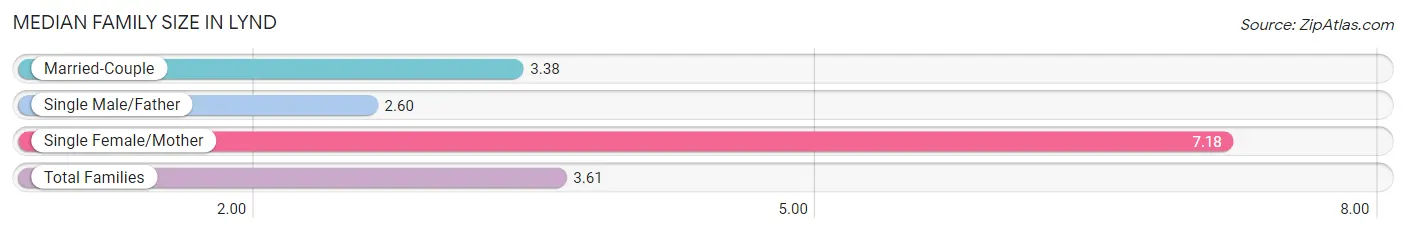
| Family Type | # Families | Family Size |
| Married-Couple | 80 (72.1%) | 3.38 |
| Single Male/Father | 20 (18.0%) | 2.60 |
| Single Female/Mother | 11 (9.9%) | 7.18 |
| Total Families | 111 (100.0%) | 3.61 |
Median Household Size in Lynd
The median household size in Lynd is 2.77 persons per household, with single female/mother households (11 | 5.8%) accounting for the largest median household size of 7.18 persons per household. non-family households (79 | 41.6%) represent the smallest median household size with 1.49 persons per household.
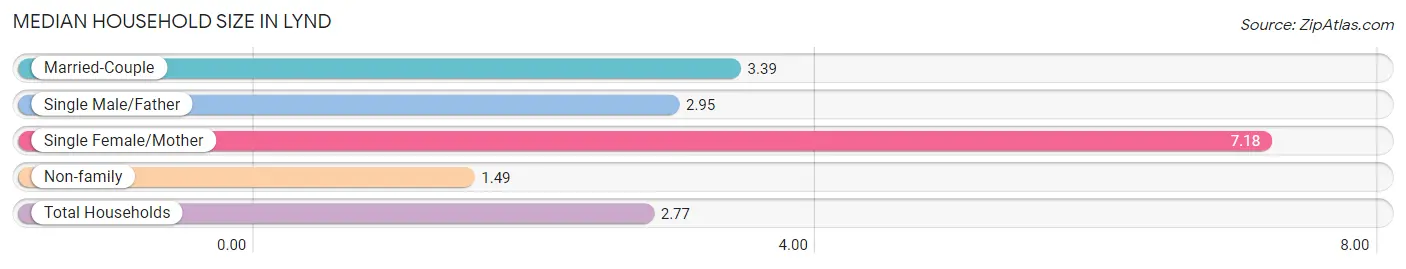
| Household Type | # Households | Household Size |
| Married-Couple | 80 (42.1%) | 3.39 |
| Single Male/Father | 20 (10.5%) | 2.95 |
| Single Female/Mother | 11 (5.8%) | 7.18 |
| Non-family | 79 (41.6%) | 1.49 |
| Total Households | 190 (100.0%) | 2.77 |
Household Size by Marriage Status in Lynd
Out of a total of 190 households in Lynd, 111 (58.4%) are family households, while 79 (41.6%) are nonfamily households. The most numerous type of family households are 2-person households, comprising 40, and the most common type of nonfamily households are 1-person households, comprising 44.
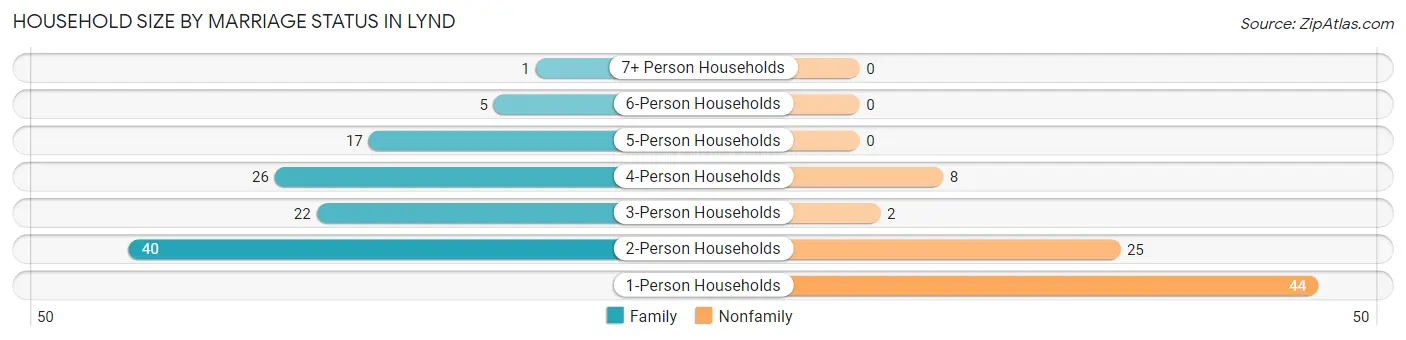
| Household Size | Family Households | Nonfamily Households |
| 1-Person Households | - | 44 (23.2%) |
| 2-Person Households | 40 (21.0%) | 25 (13.2%) |
| 3-Person Households | 22 (11.6%) | 2 (1.1%) |
| 4-Person Households | 26 (13.7%) | 8 (4.2%) |
| 5-Person Households | 17 (8.9%) | 0 (0.0%) |
| 6-Person Households | 5 (2.6%) | 0 (0.0%) |
| 7+ Person Households | 1 (0.5%) | 0 (0.0%) |
| Total | 111 (58.4%) | 79 (41.6%) |
Female Fertility in Lynd
Fertility by Age in Lynd
Average fertility rate in Lynd is 7.0 births per 1,000 women. Women in the age bracket of 35 to 50 years have the highest fertility rate with 16.0 births per 1,000 women. Women in the age bracket of 35 to 50 years acount for 100.0% of all women with births.
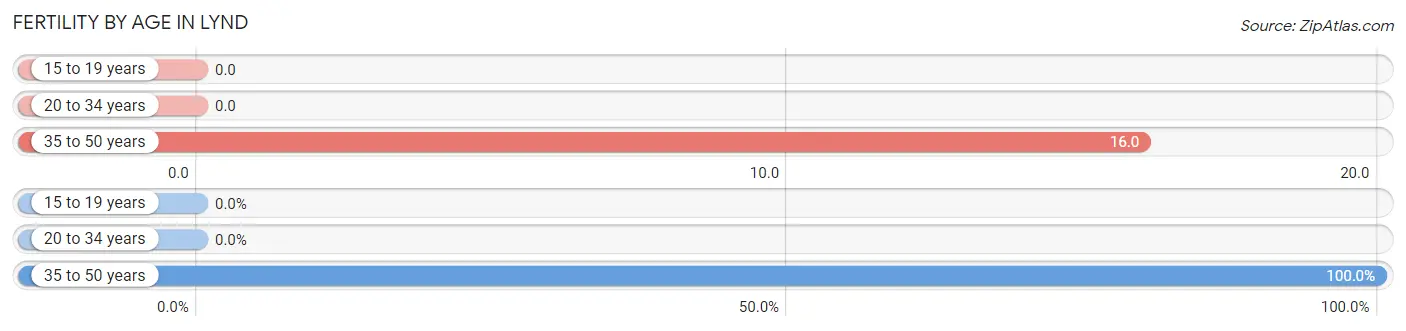
| Age Bracket | Women with Births | Births / 1,000 Women |
| 15 to 19 years | 0 (0.0%) | 0.0 |
| 20 to 34 years | 0 (0.0%) | 0.0 |
| 35 to 50 years | 1 (100.0%) | 16.0 |
| Total | 1 (100.0%) | 7.0 |
Fertility by Age by Marriage Status in Lynd
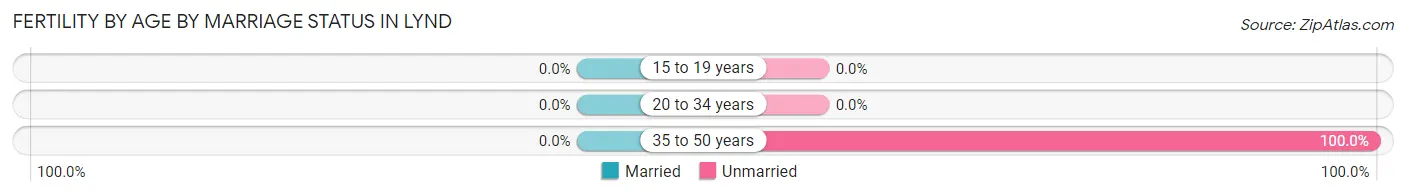
| Age Bracket | Married | Unmarried |
| 15 to 19 years | 0 (0.0%) | 0 (0.0%) |
| 20 to 34 years | 0 (0.0%) | 0 (0.0%) |
| 35 to 50 years | 0 (0.0%) | 1 (100.0%) |
| Total | 0 (0.0%) | 1 (100.0%) |
Fertility by Education in Lynd
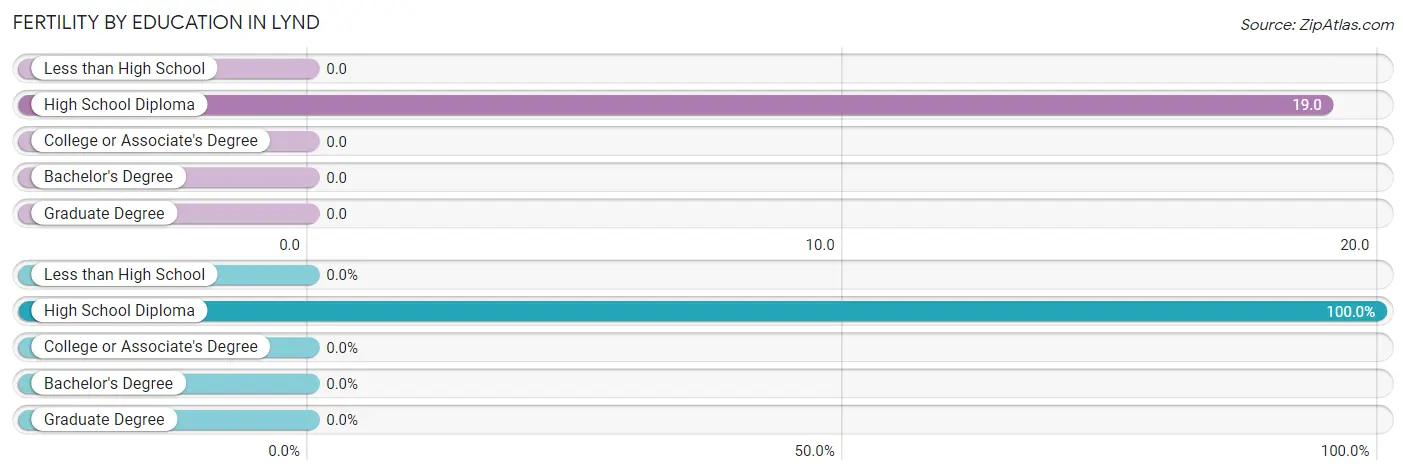
| Educational Attainment | Women with Births | Births / 1,000 Women |
| Less than High School | 0 (0.0%) | 0.0 |
| High School Diploma | 1 (100.0%) | 19.0 |
| College or Associate's Degree | 0 (0.0%) | 0.0 |
| Bachelor's Degree | 0 (0.0%) | 0.0 |
| Graduate Degree | 0 (0.0%) | 0.0 |
| Total | 1 (100.0%) | 7.0 |
Fertility by Education by Marriage Status in Lynd
| Educational Attainment | Married | Unmarried |
| Less than High School | 0 (0.0%) | 0 (0.0%) |
| High School Diploma | 0 (0.0%) | 1 (100.0%) |
| College or Associate's Degree | 0 (0.0%) | 0 (0.0%) |
| Bachelor's Degree | 0 (0.0%) | 0 (0.0%) |
| Graduate Degree | 0 (0.0%) | 0 (0.0%) |
| Total | 0 (0.0%) | 1 (100.0%) |
Employment Characteristics in Lynd
Employment by Class of Employer in Lynd
Among the 245 employed individuals in Lynd, private company employees (190 | 77.5%), not-for-profit organizations (14 | 5.7%), and self-employed (incorporated) (11 | 4.5%) make up the most common classes of employment.
| Employer Class | # Employees | % Employees |
| Private Company Employees | 190 | 77.5% |
| Self-Employed (Incorporated) | 11 | 4.5% |
| Self-Employed (Not Incorporated) | 10 | 4.1% |
| Not-for-profit Organizations | 14 | 5.7% |
| Local Government Employees | 9 | 3.7% |
| State Government Employees | 10 | 4.1% |
| Federal Government Employees | 1 | 0.4% |
| Unpaid Family Workers | 0 | 0.0% |
| Total | 245 | 100.0% |
Employment Status by Age in Lynd
According to the labor force statistics for Lynd, out of the total population over 16 years of age (348), 72.7% or 253 individuals are in the labor force, with 2.0% or 5 of them unemployed. The age group with the highest labor force participation rate is 30 to 34 years, with 100.0% or 14 individuals in the labor force. Within the labor force, the 65 to 74 years age range has the highest percentage of unemployed individuals, with 25.0% or 1 of them being unemployed.
| Age Bracket | In Labor Force | Unemployed |
| 16 to 19 Years | 4 (25.0%) | 0 (0.0%) |
| 20 to 24 Years | 22 (91.7%) | 2 (9.1%) |
| 25 to 29 Years | 69 (95.8%) | 1 (1.4%) |
| 30 to 34 Years | 14 (100.0%) | 0 (0.0%) |
| 35 to 44 Years | 75 (88.2%) | 0 (0.0%) |
| 45 to 54 Years | 28 (57.1%) | 0 (0.0%) |
| 55 to 59 Years | 23 (71.9%) | 1 (4.3%) |
| 60 to 64 Years | 13 (50.0%) | 0 (0.0%) |
| 65 to 74 Years | 4 (16.0%) | 1 (25.0%) |
| 75 Years and over | 1 (20.0%) | 0 (0.0%) |
| Total | 253 (72.7%) | 5 (2.0%) |
Employment Status by Educational Attainment in Lynd
According to labor force statistics for Lynd, 79.9% of individuals (222) out of the total population between 25 and 64 years of age (278) are in the labor force, with 0.9% or 2 of them being unemployed. The group with the highest labor force participation rate are those with the educational attainment of less than high school, with 95.8% or 23 individuals in the labor force. Within the labor force, individuals with less than high school education have the highest percentage of unemployment, with 4.3% or 1 of them being unemployed.
| Educational Attainment | In Labor Force | Unemployed |
| Less than High School | 23 (95.8%) | 1 (4.3%) |
| High School Diploma | 69 (76.7%) | 0 (0.0%) |
| College / Associate Degree | 86 (82.7%) | 1 (1.2%) |
| Bachelor's Degree or higher | 44 (73.3%) | 0 (0.0%) |
| Total | 222 (79.9%) | 3 (0.9%) |
Employment Occupations by Sex in Lynd
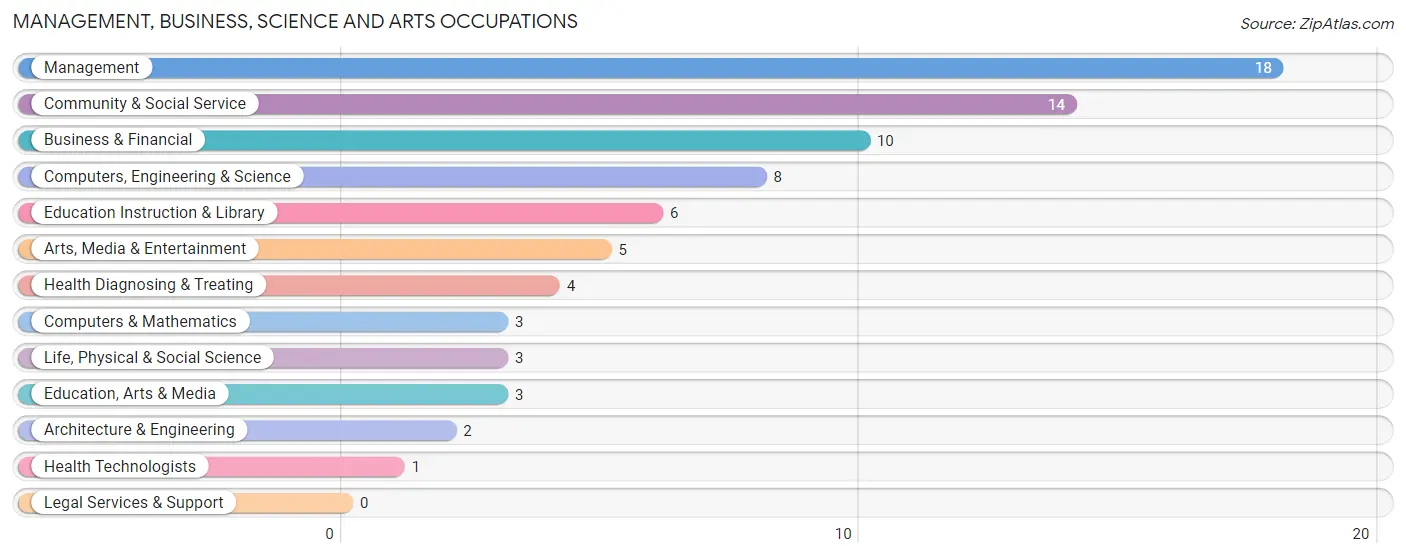
Management, Business, Science and Arts Occupations
The most common Management, Business, Science and Arts occupations in Lynd are Management (18 | 7.3%), Community & Social Service (14 | 5.7%), Business & Financial (10 | 4.0%), Computers, Engineering & Science (8 | 3.2%), and Education Instruction & Library (6 | 2.4%).
Management, Business, Science and Arts Occupations by Sex
Within the Management, Business, Science and Arts occupations in Lynd, the most male-oriented occupations are Computers, Engineering & Science (100.0%), Computers & Mathematics (100.0%), and Architecture & Engineering (100.0%), while the most female-oriented occupations are Education, Arts & Media (100.0%), Education Instruction & Library (100.0%), and Health Diagnosing & Treating (100.0%).
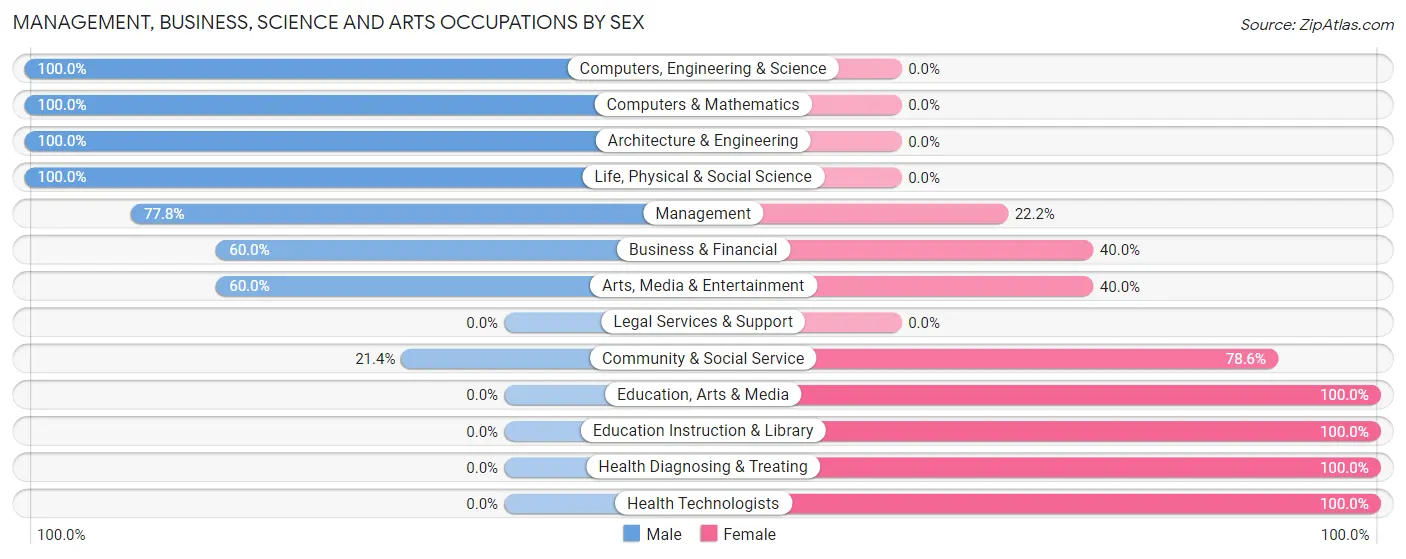
| Occupation | Male | Female |
| Management | 14 (77.8%) | 4 (22.2%) |
| Business & Financial | 6 (60.0%) | 4 (40.0%) |
| Computers, Engineering & Science | 8 (100.0%) | 0 (0.0%) |
| Computers & Mathematics | 3 (100.0%) | 0 (0.0%) |
| Architecture & Engineering | 2 (100.0%) | 0 (0.0%) |
| Life, Physical & Social Science | 3 (100.0%) | 0 (0.0%) |
| Community & Social Service | 3 (21.4%) | 11 (78.6%) |
| Education, Arts & Media | 0 (0.0%) | 3 (100.0%) |
| Legal Services & Support | 0 (0.0%) | 0 (0.0%) |
| Education Instruction & Library | 0 (0.0%) | 6 (100.0%) |
| Arts, Media & Entertainment | 3 (60.0%) | 2 (40.0%) |
| Health Diagnosing & Treating | 0 (0.0%) | 4 (100.0%) |
| Health Technologists | 0 (0.0%) | 1 (100.0%) |
| Total (Category) | 31 (57.4%) | 23 (42.6%) |
| Total (Overall) | 127 (51.2%) | 121 (48.8%) |
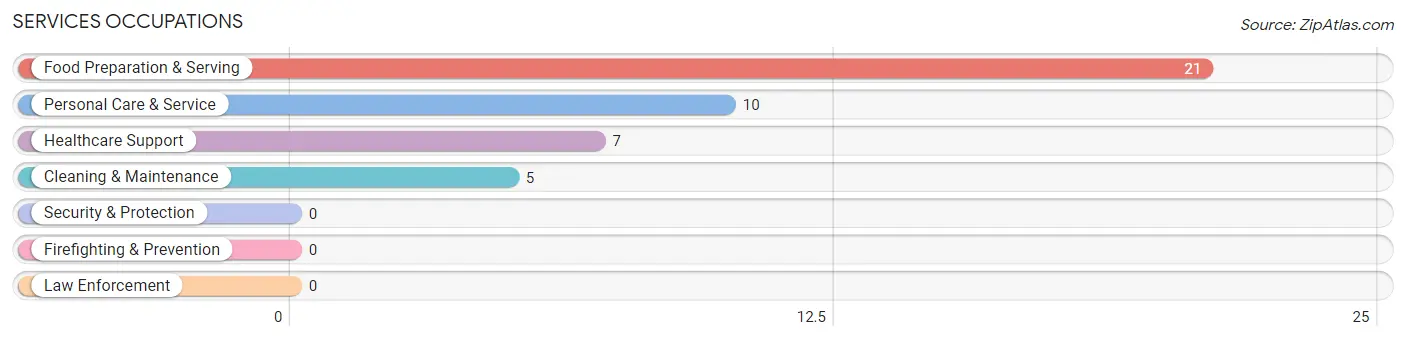
Services Occupations
The most common Services occupations in Lynd are Food Preparation & Serving (21 | 8.5%), Personal Care & Service (10 | 4.0%), Healthcare Support (7 | 2.8%), and Cleaning & Maintenance (5 | 2.0%).
Services Occupations by Sex
Within the Services occupations in Lynd, the most male-oriented occupations are Cleaning & Maintenance (60.0%), and Food Preparation & Serving (9.5%), while the most female-oriented occupations are Healthcare Support (100.0%), Personal Care & Service (100.0%), and Food Preparation & Serving (90.5%).
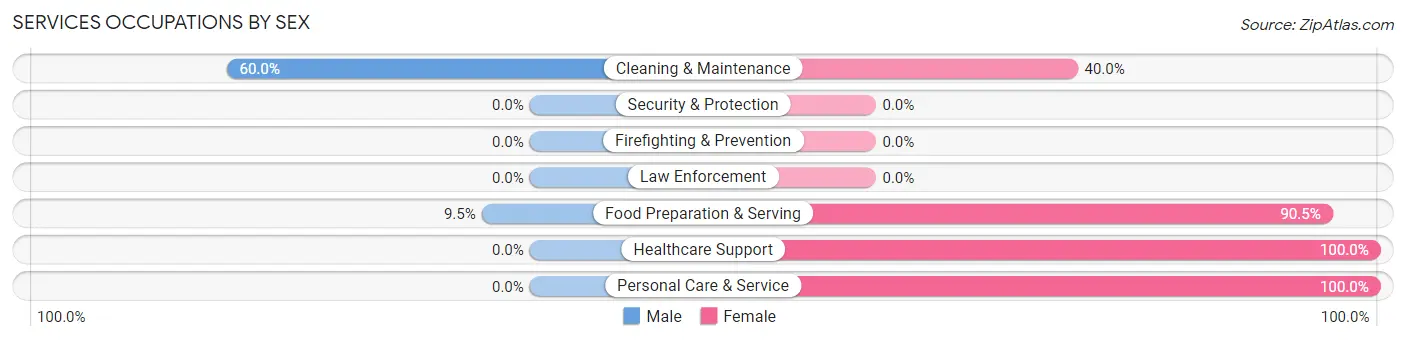
| Occupation | Male | Female |
| Healthcare Support | 0 (0.0%) | 7 (100.0%) |
| Security & Protection | 0 (0.0%) | 0 (0.0%) |
| Firefighting & Prevention | 0 (0.0%) | 0 (0.0%) |
| Law Enforcement | 0 (0.0%) | 0 (0.0%) |
| Food Preparation & Serving | 2 (9.5%) | 19 (90.5%) |
| Cleaning & Maintenance | 3 (60.0%) | 2 (40.0%) |
| Personal Care & Service | 0 (0.0%) | 10 (100.0%) |
| Total (Category) | 5 (11.6%) | 38 (88.4%) |
| Total (Overall) | 127 (51.2%) | 121 (48.8%) |
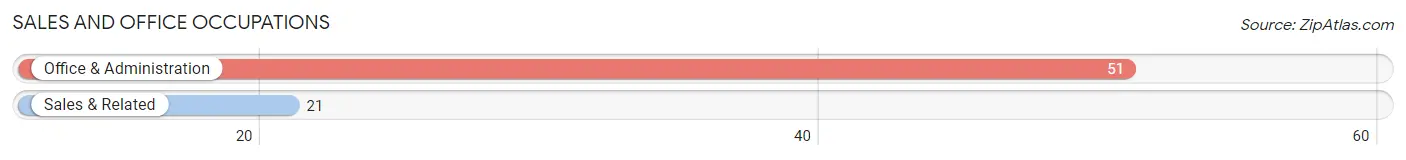
Sales and Office Occupations
The most common Sales and Office occupations in Lynd are Office & Administration (51 | 20.6%), and Sales & Related (21 | 8.5%).
Sales and Office Occupations by Sex
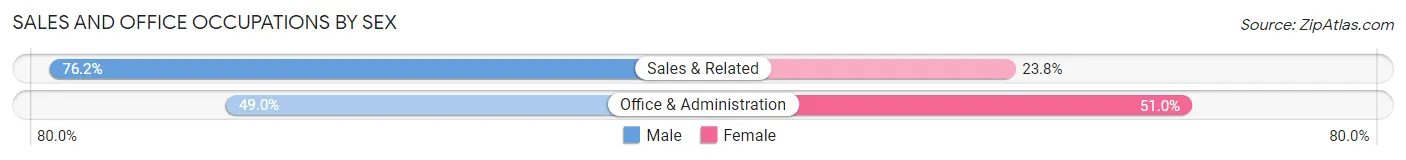
| Occupation | Male | Female |
| Sales & Related | 16 (76.2%) | 5 (23.8%) |
| Office & Administration | 25 (49.0%) | 26 (51.0%) |
| Total (Category) | 41 (56.9%) | 31 (43.1%) |
| Total (Overall) | 127 (51.2%) | 121 (48.8%) |
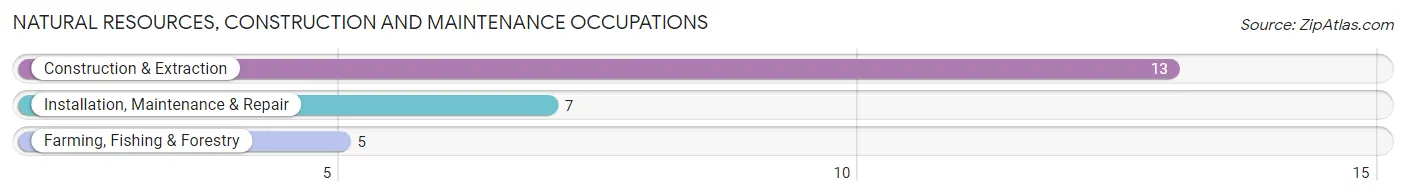
Natural Resources, Construction and Maintenance Occupations
The most common Natural Resources, Construction and Maintenance occupations in Lynd are Construction & Extraction (13 | 5.2%), Installation, Maintenance & Repair (7 | 2.8%), and Farming, Fishing & Forestry (5 | 2.0%).
Natural Resources, Construction and Maintenance Occupations by Sex
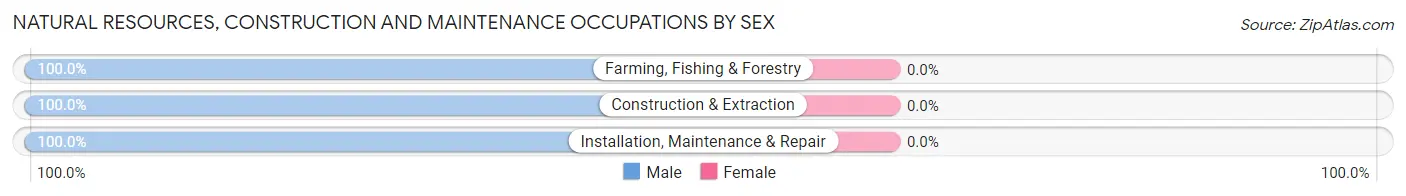
| Occupation | Male | Female |
| Farming, Fishing & Forestry | 5 (100.0%) | 0 (0.0%) |
| Construction & Extraction | 13 (100.0%) | 0 (0.0%) |
| Installation, Maintenance & Repair | 7 (100.0%) | 0 (0.0%) |
| Total (Category) | 25 (100.0%) | 0 (0.0%) |
| Total (Overall) | 127 (51.2%) | 121 (48.8%) |
Production, Transportation and Moving Occupations
The most common Production, Transportation and Moving occupations in Lynd are Production (40 | 16.1%), Material Moving (10 | 4.0%), and Transportation (4 | 1.6%).
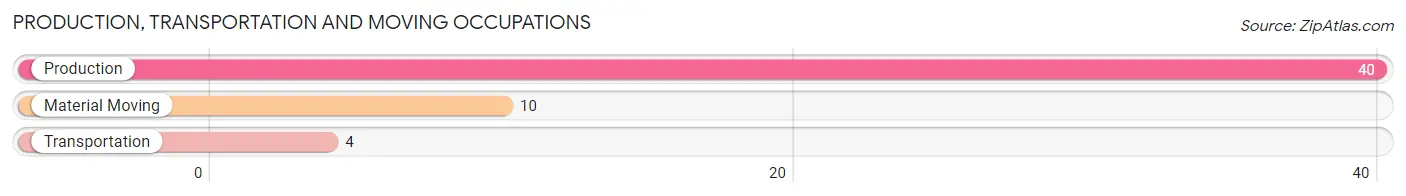
Production, Transportation and Moving Occupations by Sex
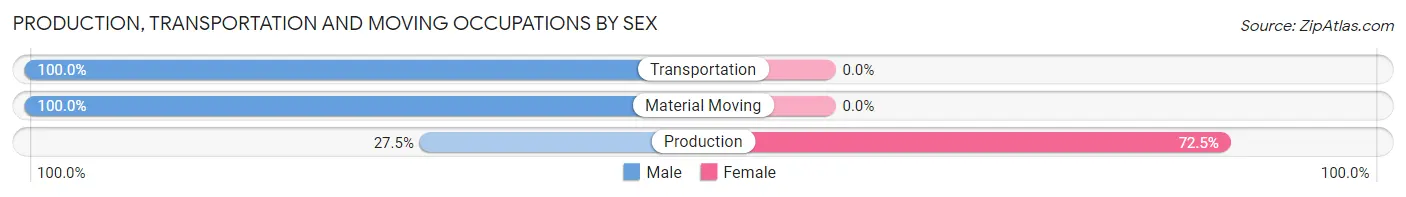
| Occupation | Male | Female |
| Production | 11 (27.5%) | 29 (72.5%) |
| Transportation | 4 (100.0%) | 0 (0.0%) |
| Material Moving | 10 (100.0%) | 0 (0.0%) |
| Total (Category) | 25 (46.3%) | 29 (53.7%) |
| Total (Overall) | 127 (51.2%) | 121 (48.8%) |
Employment Industries by Sex in Lynd
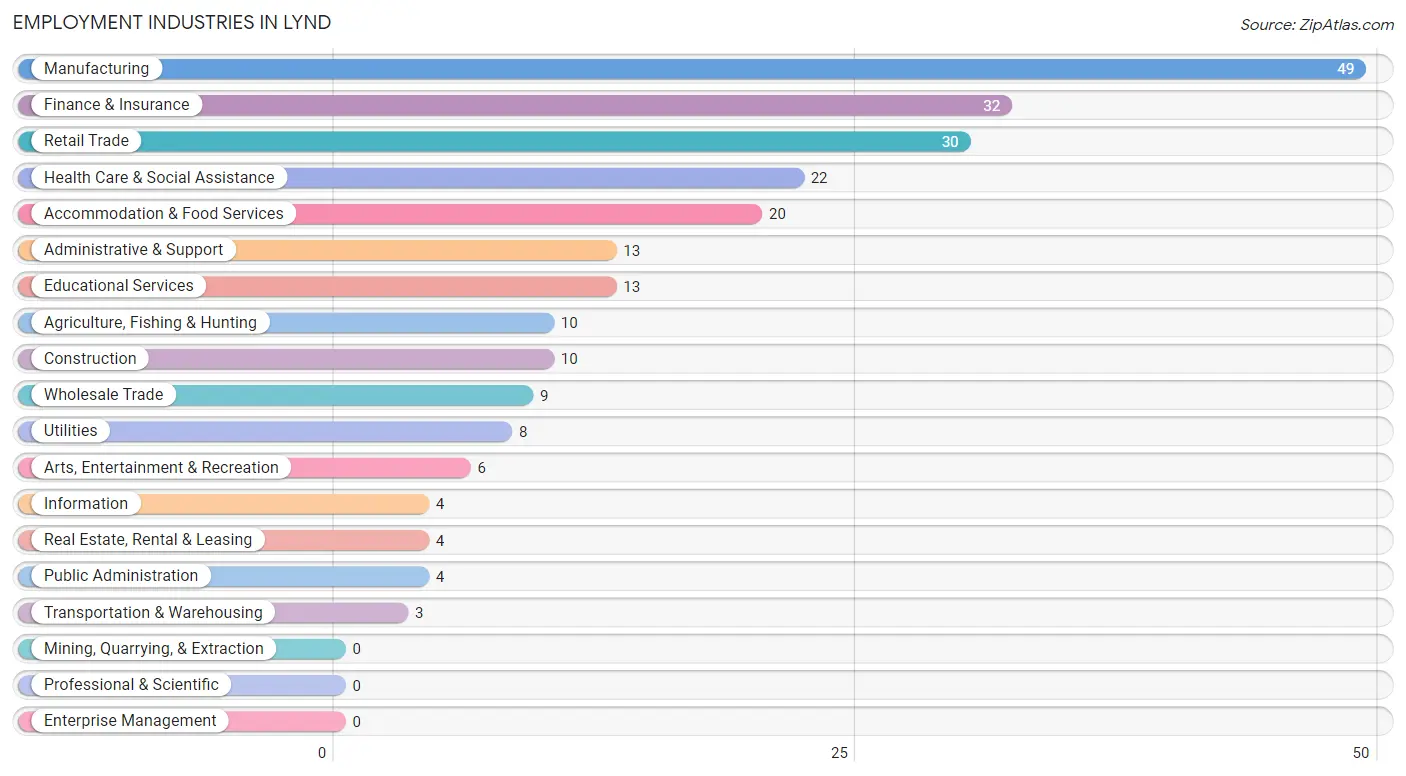
Employment Industries in Lynd
The major employment industries in Lynd include Manufacturing (49 | 19.8%), Finance & Insurance (32 | 12.9%), Retail Trade (30 | 12.1%), Health Care & Social Assistance (22 | 8.9%), and Accommodation & Food Services (20 | 8.1%).
Employment Industries by Sex in Lynd
The Lynd industries that see more men than women are Construction (100.0%), Utilities (100.0%), and Real Estate, Rental & Leasing (100.0%), whereas the industries that tend to have a higher number of women are Health Care & Social Assistance (100.0%), Arts, Entertainment & Recreation (100.0%), and Public Administration (75.0%).
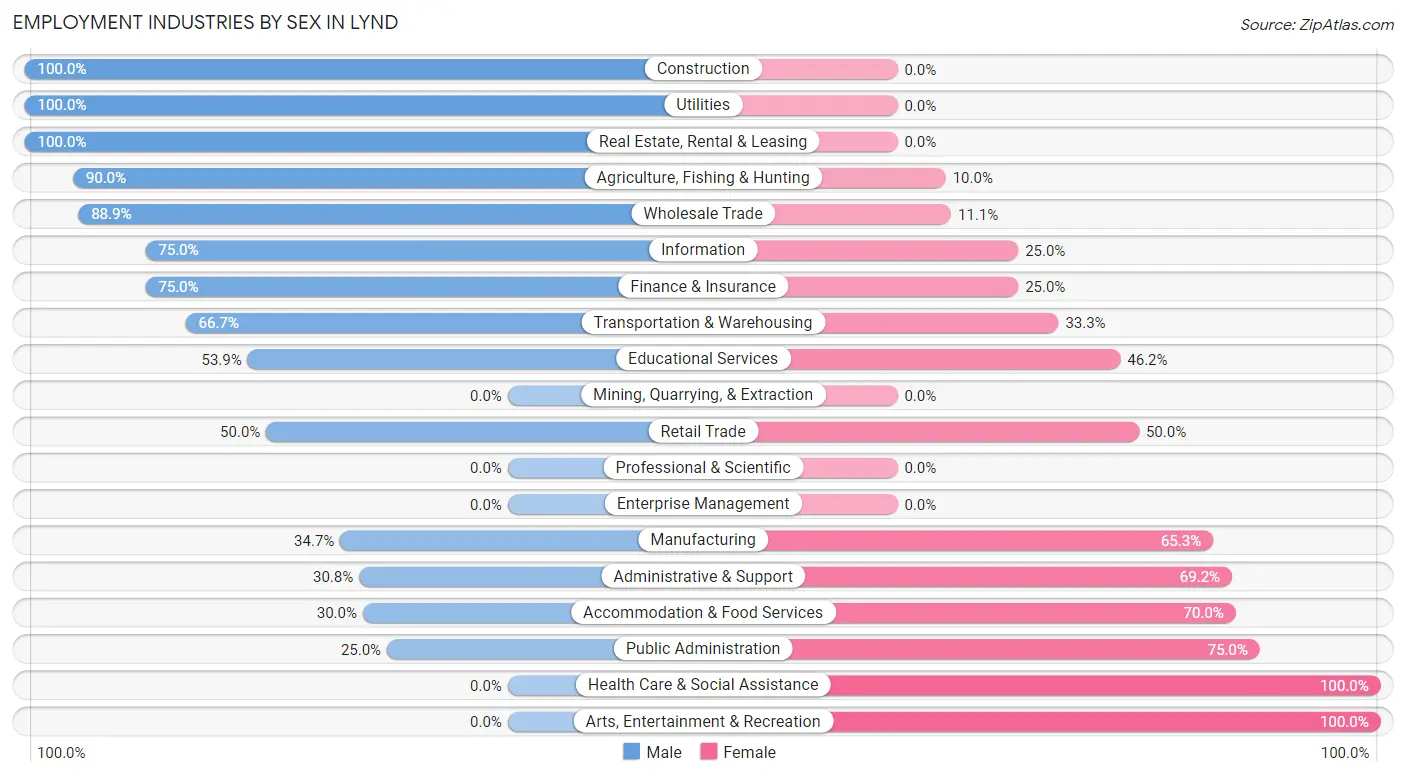
| Industry | Male | Female |
| Agriculture, Fishing & Hunting | 9 (90.0%) | 1 (10.0%) |
| Mining, Quarrying, & Extraction | 0 (0.0%) | 0 (0.0%) |
| Construction | 10 (100.0%) | 0 (0.0%) |
| Manufacturing | 17 (34.7%) | 32 (65.3%) |
| Wholesale Trade | 8 (88.9%) | 1 (11.1%) |
| Retail Trade | 15 (50.0%) | 15 (50.0%) |
| Transportation & Warehousing | 2 (66.7%) | 1 (33.3%) |
| Utilities | 8 (100.0%) | 0 (0.0%) |
| Information | 3 (75.0%) | 1 (25.0%) |
| Finance & Insurance | 24 (75.0%) | 8 (25.0%) |
| Real Estate, Rental & Leasing | 4 (100.0%) | 0 (0.0%) |
| Professional & Scientific | 0 (0.0%) | 0 (0.0%) |
| Enterprise Management | 0 (0.0%) | 0 (0.0%) |
| Administrative & Support | 4 (30.8%) | 9 (69.2%) |
| Educational Services | 7 (53.8%) | 6 (46.2%) |
| Health Care & Social Assistance | 0 (0.0%) | 22 (100.0%) |
| Arts, Entertainment & Recreation | 0 (0.0%) | 6 (100.0%) |
| Accommodation & Food Services | 6 (30.0%) | 14 (70.0%) |
| Public Administration | 1 (25.0%) | 3 (75.0%) |
| Total | 127 (51.2%) | 121 (48.8%) |
Education in Lynd
School Enrollment in Lynd
The most common levels of schooling among the 187 students in Lynd are middle school (56 | 29.9%), elementary school (55 | 29.4%), and kindergarten (29 | 15.5%).
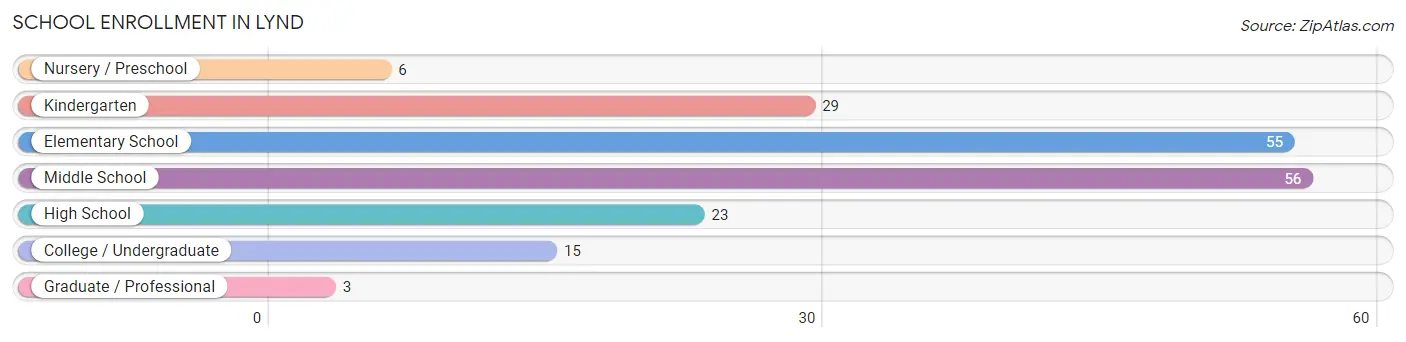
| School Level | # Students | % Students |
| Nursery / Preschool | 6 | 3.2% |
| Kindergarten | 29 | 15.5% |
| Elementary School | 55 | 29.4% |
| Middle School | 56 | 29.9% |
| High School | 23 | 12.3% |
| College / Undergraduate | 15 | 8.0% |
| Graduate / Professional | 3 | 1.6% |
| Total | 187 | 100.0% |
School Enrollment by Age by Funding Source in Lynd
Out of a total of 187 students who are enrolled in schools in Lynd, 22 (11.8%) attend a private institution, while the remaining 165 (88.2%) are enrolled in public schools. The age group of 3 to 4 year olds has the highest likelihood of being enrolled in private schools, with 3 (60.0% in the age bracket) enrolled. Conversely, the age group of 18 to 19 year olds has the lowest likelihood of being enrolled in a private school, with 6 (100.0% in the age bracket) attending a public institution.
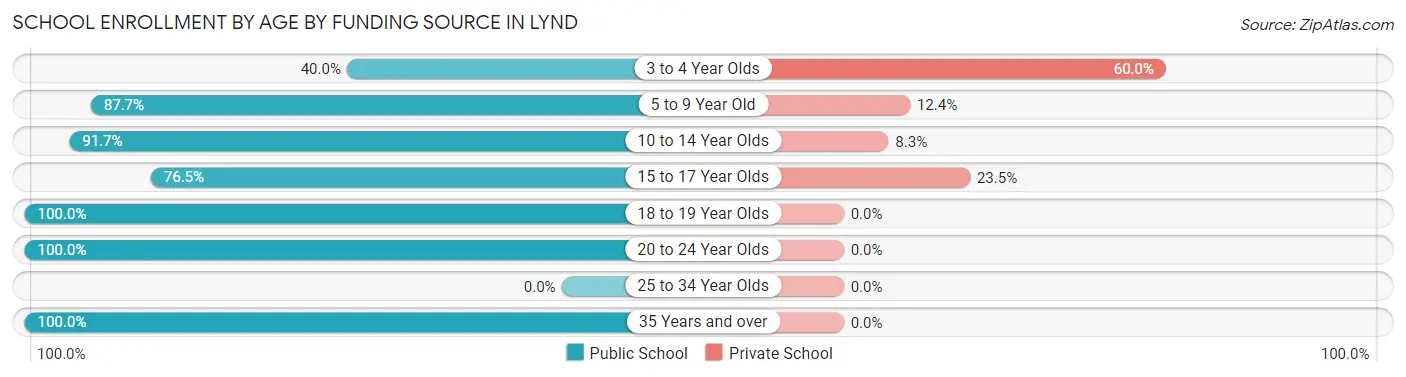
| Age Bracket | Public School | Private School |
| 3 to 4 Year Olds | 2 (40.0%) | 3 (60.0%) |
| 5 to 9 Year Old | 71 (87.6%) | 10 (12.3%) |
| 10 to 14 Year Olds | 55 (91.7%) | 5 (8.3%) |
| 15 to 17 Year Olds | 13 (76.5%) | 4 (23.5%) |
| 18 to 19 Year Olds | 6 (100.0%) | 0 (0.0%) |
| 20 to 24 Year Olds | 13 (100.0%) | 0 (0.0%) |
| 25 to 34 Year Olds | 0 (0.0%) | 0 (0.0%) |
| 35 Years and over | 5 (100.0%) | 0 (0.0%) |
| Total | 165 (88.2%) | 22 (11.8%) |
Educational Attainment by Field of Study in Lynd
Business (22 | 32.4%), bio, nature & agricultural (12 | 17.6%), education (10 | 14.7%), communications (5 | 7.3%), and science & technology (4 | 5.9%) are the most common fields of study among 68 individuals in Lynd who have obtained a bachelor's degree or higher.
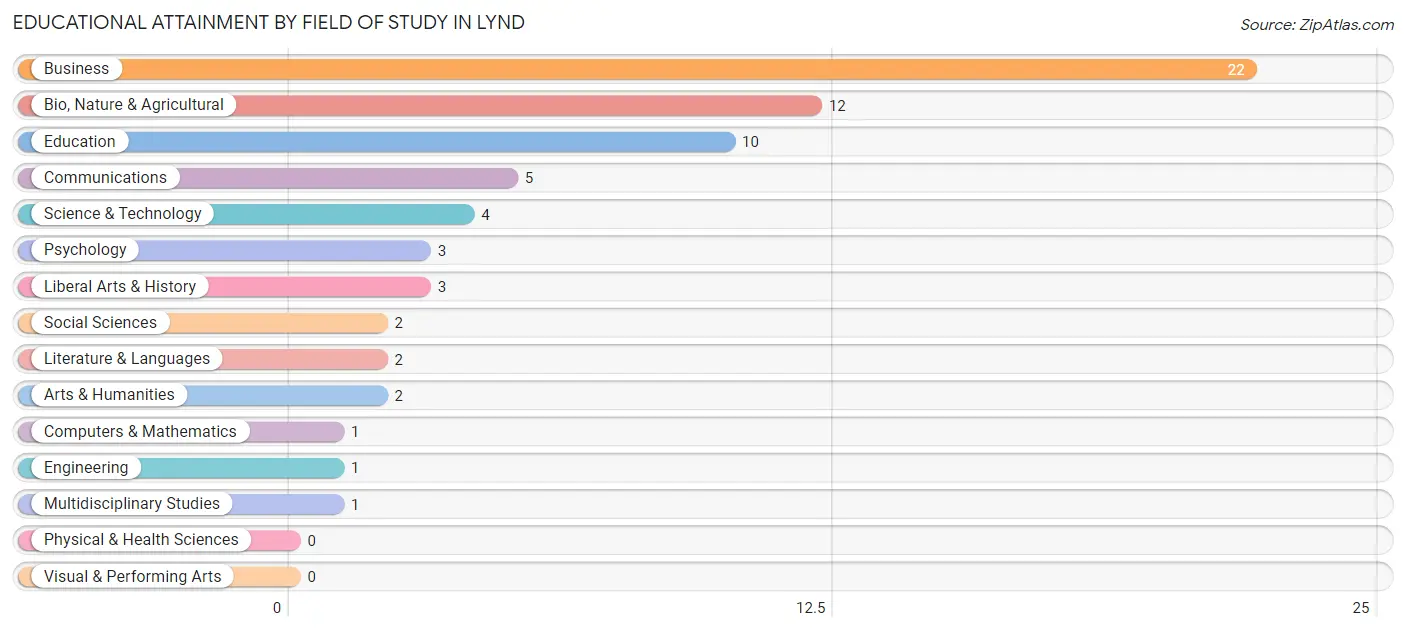
| Field of Study | # Graduates | % Graduates |
| Computers & Mathematics | 1 | 1.5% |
| Bio, Nature & Agricultural | 12 | 17.6% |
| Physical & Health Sciences | 0 | 0.0% |
| Psychology | 3 | 4.4% |
| Social Sciences | 2 | 2.9% |
| Engineering | 1 | 1.5% |
| Multidisciplinary Studies | 1 | 1.5% |
| Science & Technology | 4 | 5.9% |
| Business | 22 | 32.4% |
| Education | 10 | 14.7% |
| Literature & Languages | 2 | 2.9% |
| Liberal Arts & History | 3 | 4.4% |
| Visual & Performing Arts | 0 | 0.0% |
| Communications | 5 | 7.3% |
| Arts & Humanities | 2 | 2.9% |
| Total | 68 | 100.0% |
Transportation & Commute in Lynd
Vehicle Availability by Sex in Lynd
The most prevalent vehicle ownership categories in Lynd are males with 2 vehicles (43, accounting for 34.7%) and females with 2 vehicles (47, making up 35.5%).
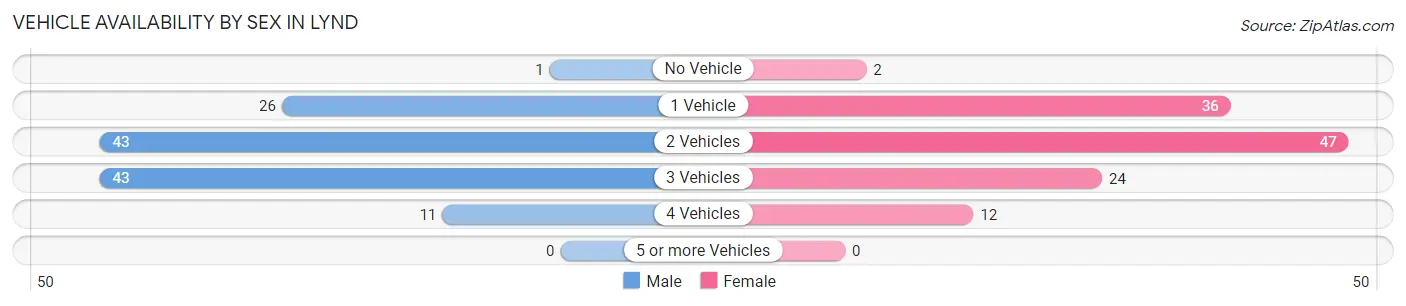
| Vehicles Available | Male | Female |
| No Vehicle | 1 (0.8%) | 2 (1.7%) |
| 1 Vehicle | 26 (21.0%) | 36 (29.7%) |
| 2 Vehicles | 43 (34.7%) | 47 (38.8%) |
| 3 Vehicles | 43 (34.7%) | 24 (19.8%) |
| 4 Vehicles | 11 (8.9%) | 12 (9.9%) |
| 5 or more Vehicles | 0 (0.0%) | 0 (0.0%) |
| Total | 124 (100.0%) | 121 (100.0%) |
Commute Time in Lynd
The most frequently occuring commute durations in Lynd are 10 to 14 minutes (75 commuters, 34.9%), 15 to 19 minutes (67 commuters, 31.2%), and 20 to 24 minutes (27 commuters, 12.6%).
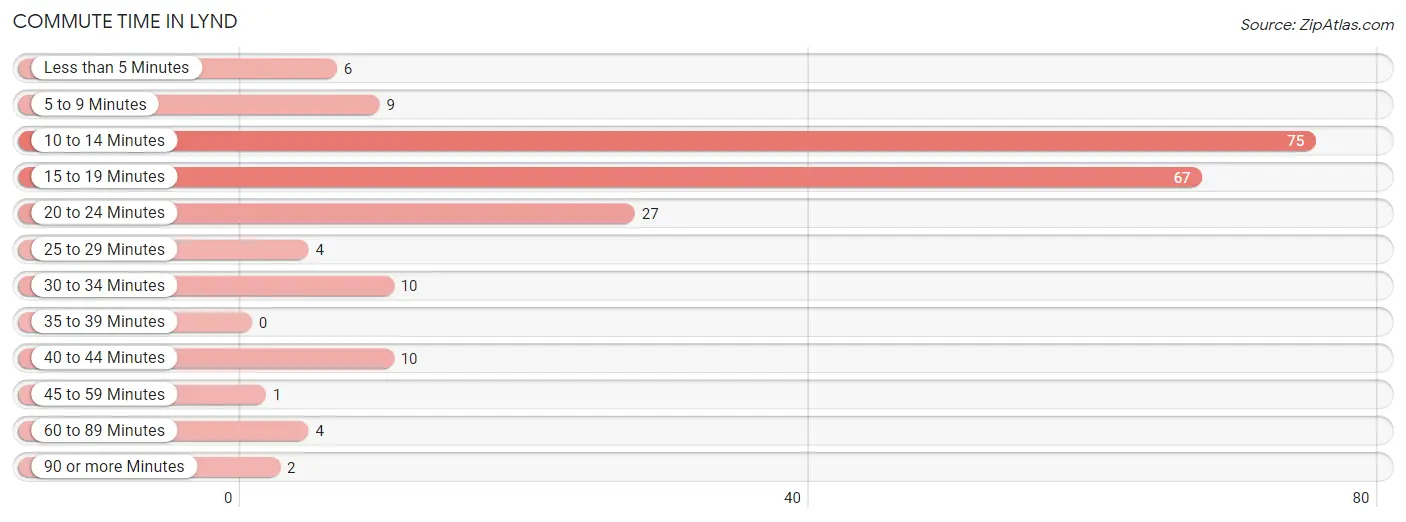
| Commute Time | # Commuters | % Commuters |
| Less than 5 Minutes | 6 | 2.8% |
| 5 to 9 Minutes | 9 | 4.2% |
| 10 to 14 Minutes | 75 | 34.9% |
| 15 to 19 Minutes | 67 | 31.2% |
| 20 to 24 Minutes | 27 | 12.6% |
| 25 to 29 Minutes | 4 | 1.9% |
| 30 to 34 Minutes | 10 | 4.6% |
| 35 to 39 Minutes | 0 | 0.0% |
| 40 to 44 Minutes | 10 | 4.6% |
| 45 to 59 Minutes | 1 | 0.5% |
| 60 to 89 Minutes | 4 | 1.9% |
| 90 or more Minutes | 2 | 0.9% |
Commute Time by Sex in Lynd
The most common commute times in Lynd are 10 to 14 minutes (32 commuters, 29.1%) for males and 10 to 14 minutes (43 commuters, 40.9%) for females.
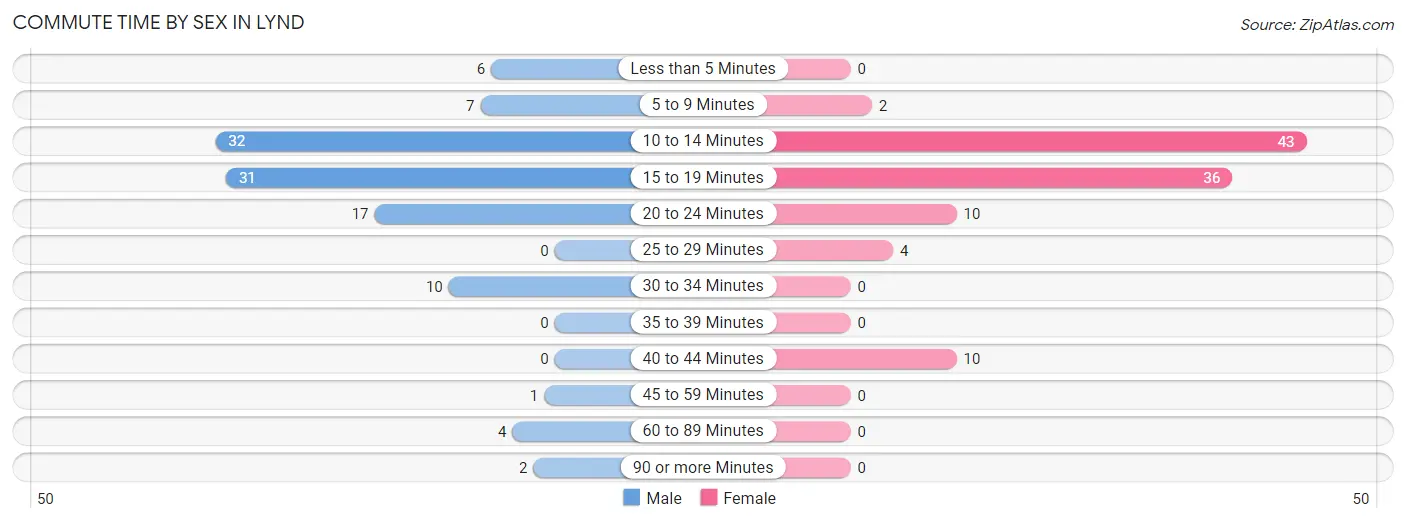
| Commute Time | Male | Female |
| Less than 5 Minutes | 6 (5.4%) | 0 (0.0%) |
| 5 to 9 Minutes | 7 (6.4%) | 2 (1.9%) |
| 10 to 14 Minutes | 32 (29.1%) | 43 (40.9%) |
| 15 to 19 Minutes | 31 (28.2%) | 36 (34.3%) |
| 20 to 24 Minutes | 17 (15.4%) | 10 (9.5%) |
| 25 to 29 Minutes | 0 (0.0%) | 4 (3.8%) |
| 30 to 34 Minutes | 10 (9.1%) | 0 (0.0%) |
| 35 to 39 Minutes | 0 (0.0%) | 0 (0.0%) |
| 40 to 44 Minutes | 0 (0.0%) | 10 (9.5%) |
| 45 to 59 Minutes | 1 (0.9%) | 0 (0.0%) |
| 60 to 89 Minutes | 4 (3.6%) | 0 (0.0%) |
| 90 or more Minutes | 2 (1.8%) | 0 (0.0%) |
Time of Departure to Work by Sex in Lynd
The most frequent times of departure to work in Lynd are 6:30 AM to 6:59 AM (35, 31.8%) for males and 12:00 AM to 4:59 AM (17, 16.2%) for females.
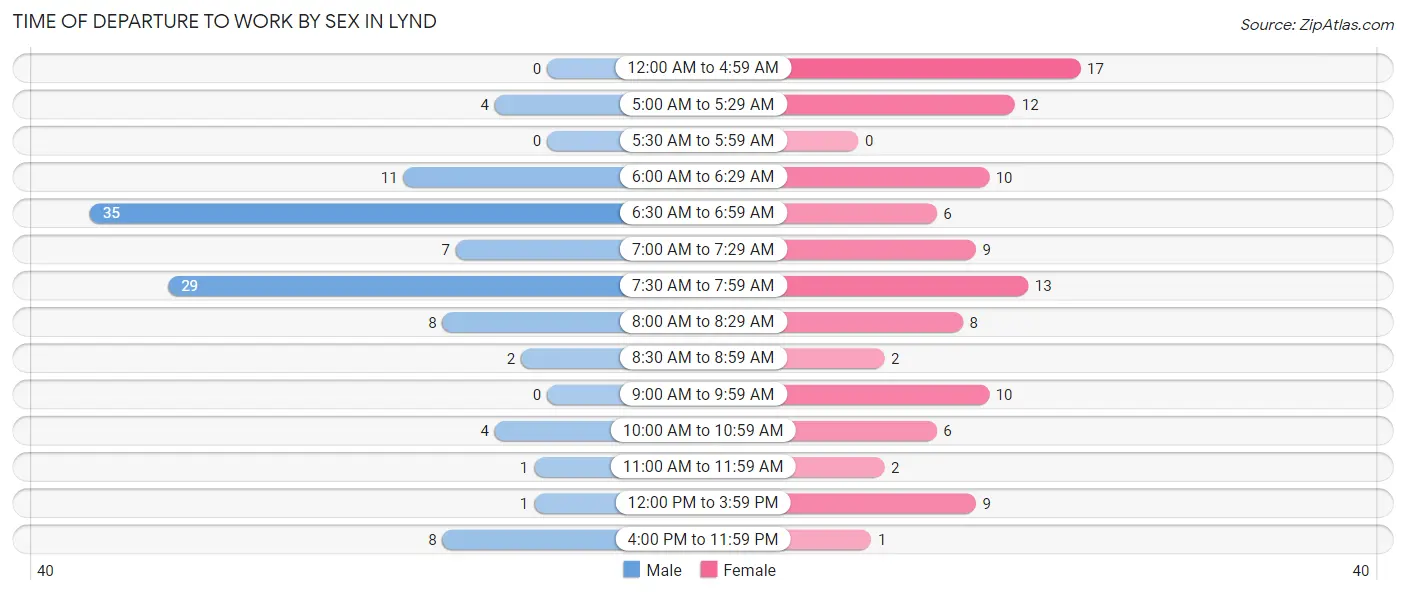
| Time of Departure | Male | Female |
| 12:00 AM to 4:59 AM | 0 (0.0%) | 17 (16.2%) |
| 5:00 AM to 5:29 AM | 4 (3.6%) | 12 (11.4%) |
| 5:30 AM to 5:59 AM | 0 (0.0%) | 0 (0.0%) |
| 6:00 AM to 6:29 AM | 11 (10.0%) | 10 (9.5%) |
| 6:30 AM to 6:59 AM | 35 (31.8%) | 6 (5.7%) |
| 7:00 AM to 7:29 AM | 7 (6.4%) | 9 (8.6%) |
| 7:30 AM to 7:59 AM | 29 (26.4%) | 13 (12.4%) |
| 8:00 AM to 8:29 AM | 8 (7.3%) | 8 (7.6%) |
| 8:30 AM to 8:59 AM | 2 (1.8%) | 2 (1.9%) |
| 9:00 AM to 9:59 AM | 0 (0.0%) | 10 (9.5%) |
| 10:00 AM to 10:59 AM | 4 (3.6%) | 6 (5.7%) |
| 11:00 AM to 11:59 AM | 1 (0.9%) | 2 (1.9%) |
| 12:00 PM to 3:59 PM | 1 (0.9%) | 9 (8.6%) |
| 4:00 PM to 11:59 PM | 8 (7.3%) | 1 (0.9%) |
| Total | 110 (100.0%) | 105 (100.0%) |
Housing Occupancy in Lynd
Occupancy by Ownership in Lynd
Of the total 190 dwellings in Lynd, owner-occupied units account for 153 (80.5%), while renter-occupied units make up 37 (19.5%).
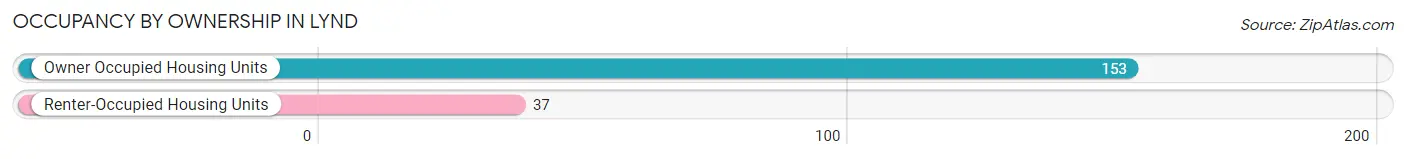
| Occupancy | # Housing Units | % Housing Units |
| Owner Occupied Housing Units | 153 | 80.5% |
| Renter-Occupied Housing Units | 37 | 19.5% |
| Total Occupied Housing Units | 190 | 100.0% |
Occupancy by Household Size in Lynd
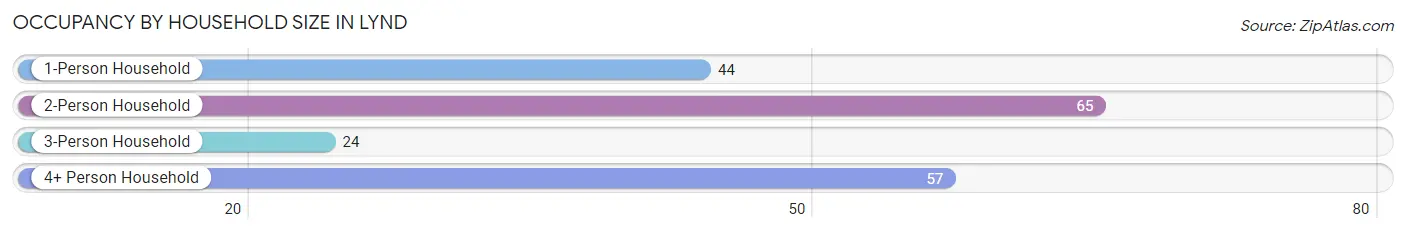
| Household Size | # Housing Units | % Housing Units |
| 1-Person Household | 44 | 23.2% |
| 2-Person Household | 65 | 34.2% |
| 3-Person Household | 24 | 12.6% |
| 4+ Person Household | 57 | 30.0% |
| Total Housing Units | 190 | 100.0% |
Occupancy by Ownership by Household Size in Lynd
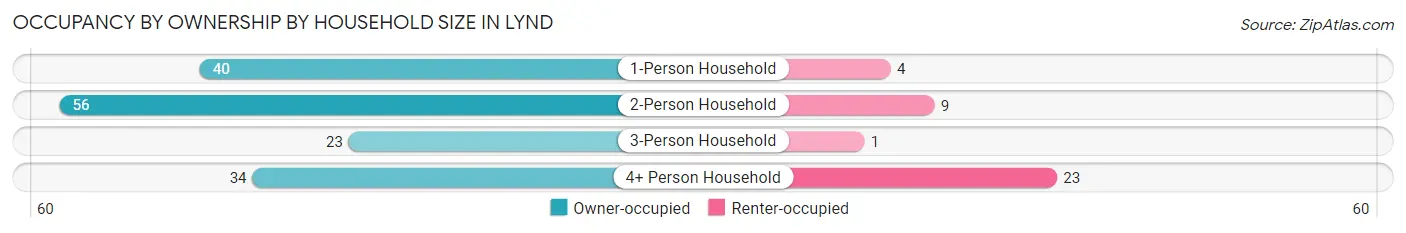
| Household Size | Owner-occupied | Renter-occupied |
| 1-Person Household | 40 (90.9%) | 4 (9.1%) |
| 2-Person Household | 56 (86.2%) | 9 (13.9%) |
| 3-Person Household | 23 (95.8%) | 1 (4.2%) |
| 4+ Person Household | 34 (59.7%) | 23 (40.4%) |
| Total Housing Units | 153 (80.5%) | 37 (19.5%) |
Occupancy by Educational Attainment in Lynd
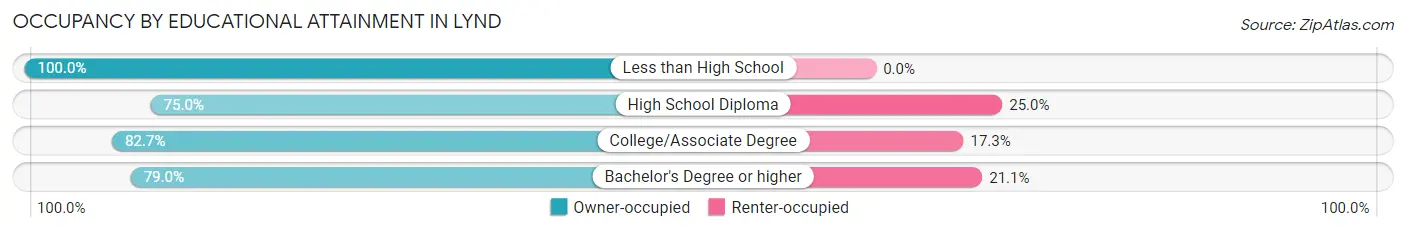
| Household Size | Owner-occupied | Renter-occupied |
| Less than High School | 13 (100.0%) | 0 (0.0%) |
| High School Diploma | 48 (75.0%) | 16 (25.0%) |
| College/Associate Degree | 62 (82.7%) | 13 (17.3%) |
| Bachelor's Degree or higher | 30 (78.9%) | 8 (21.0%) |
Occupancy by Age of Householder in Lynd
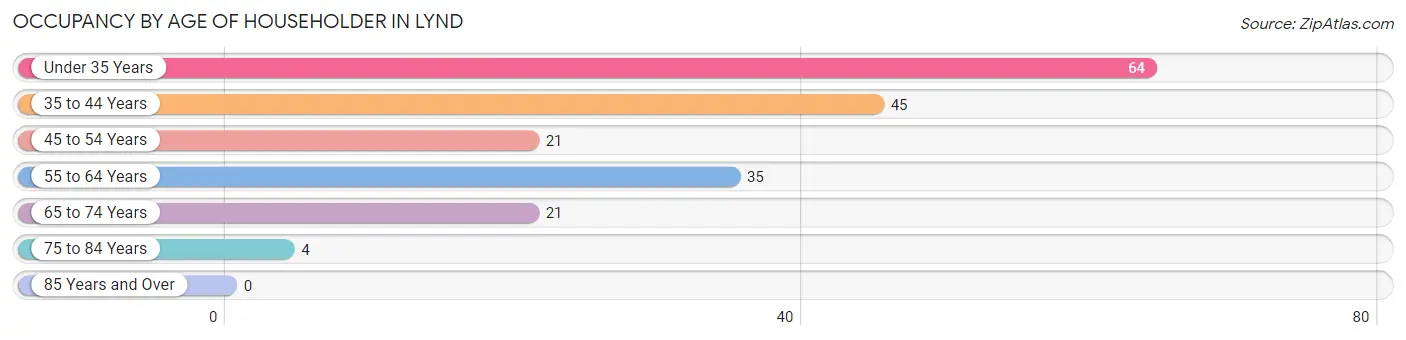
| Age Bracket | # Households | % Households |
| Under 35 Years | 64 | 33.7% |
| 35 to 44 Years | 45 | 23.7% |
| 45 to 54 Years | 21 | 11.1% |
| 55 to 64 Years | 35 | 18.4% |
| 65 to 74 Years | 21 | 11.1% |
| 75 to 84 Years | 4 | 2.1% |
| 85 Years and Over | 0 | 0.0% |
| Total | 190 | 100.0% |
Housing Finances in Lynd
Median Income by Occupancy in Lynd
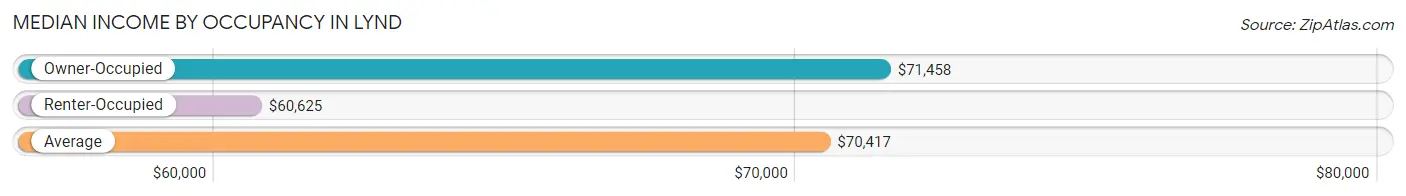
| Occupancy Type | # Households | Median Income |
| Owner-Occupied | 153 (80.5%) | $71,458 |
| Renter-Occupied | 37 (19.5%) | $60,625 |
| Average | 190 (100.0%) | $70,417 |
Occupancy by Householder Income Bracket in Lynd
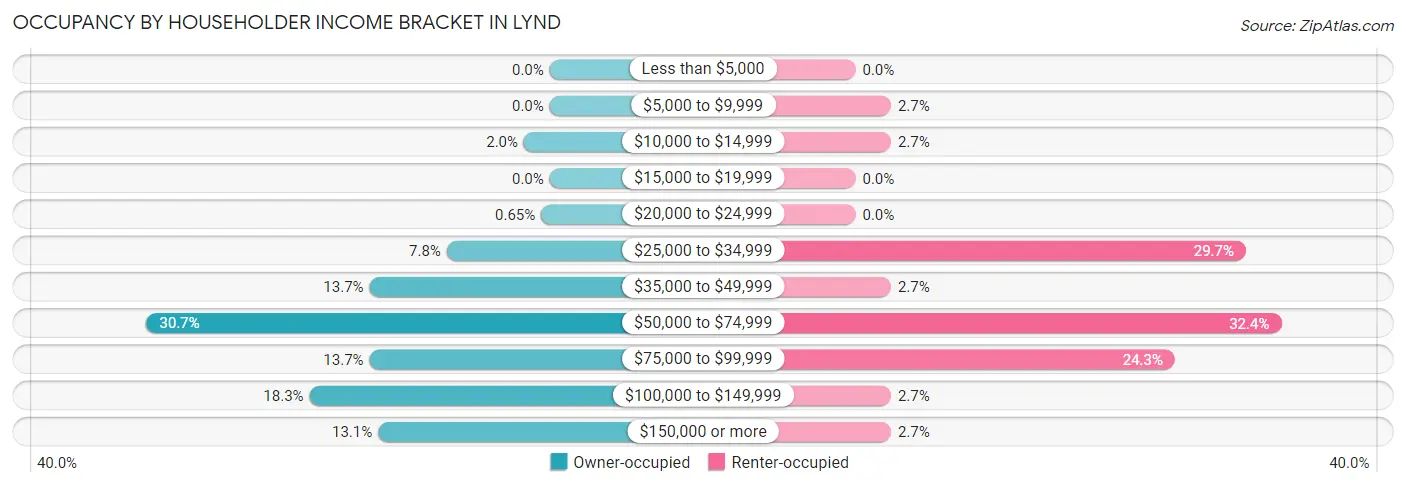
| Income Bracket | Owner-occupied | Renter-occupied |
| Less than $5,000 | 0 (0.0%) | 0 (0.0%) |
| $5,000 to $9,999 | 0 (0.0%) | 1 (2.7%) |
| $10,000 to $14,999 | 3 (2.0%) | 1 (2.7%) |
| $15,000 to $19,999 | 0 (0.0%) | 0 (0.0%) |
| $20,000 to $24,999 | 1 (0.6%) | 0 (0.0%) |
| $25,000 to $34,999 | 12 (7.8%) | 11 (29.7%) |
| $35,000 to $49,999 | 21 (13.7%) | 1 (2.7%) |
| $50,000 to $74,999 | 47 (30.7%) | 12 (32.4%) |
| $75,000 to $99,999 | 21 (13.7%) | 9 (24.3%) |
| $100,000 to $149,999 | 28 (18.3%) | 1 (2.7%) |
| $150,000 or more | 20 (13.1%) | 1 (2.7%) |
| Total | 153 (100.0%) | 37 (100.0%) |
Monthly Housing Cost Tiers in Lynd
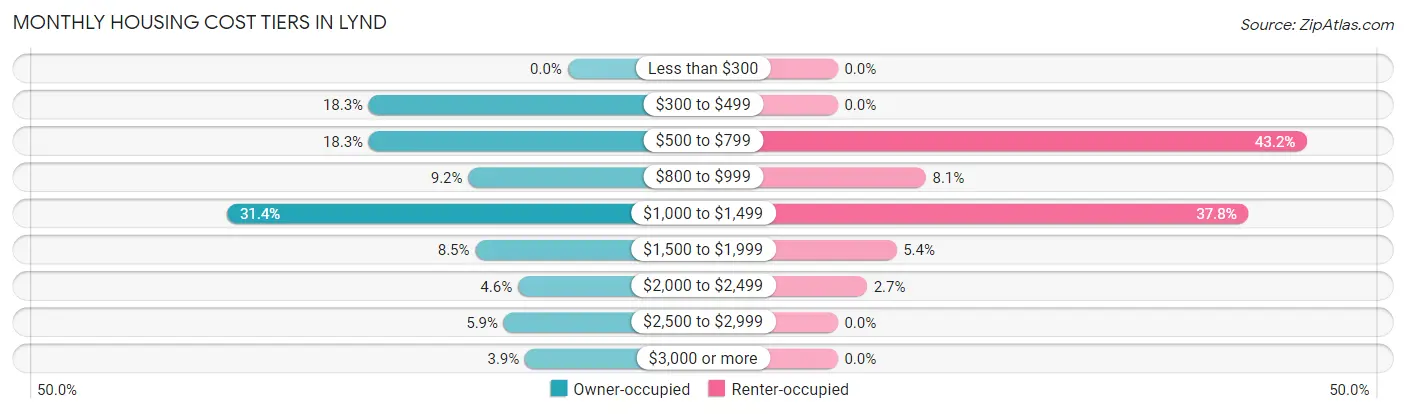
| Monthly Cost | Owner-occupied | Renter-occupied |
| Less than $300 | 0 (0.0%) | 0 (0.0%) |
| $300 to $499 | 28 (18.3%) | 0 (0.0%) |
| $500 to $799 | 28 (18.3%) | 16 (43.2%) |
| $800 to $999 | 14 (9.1%) | 3 (8.1%) |
| $1,000 to $1,499 | 48 (31.4%) | 14 (37.8%) |
| $1,500 to $1,999 | 13 (8.5%) | 2 (5.4%) |
| $2,000 to $2,499 | 7 (4.6%) | 1 (2.7%) |
| $2,500 to $2,999 | 9 (5.9%) | 0 (0.0%) |
| $3,000 or more | 6 (3.9%) | 0 (0.0%) |
| Total | 153 (100.0%) | 37 (100.0%) |
Physical Housing Characteristics in Lynd
Housing Structures in Lynd
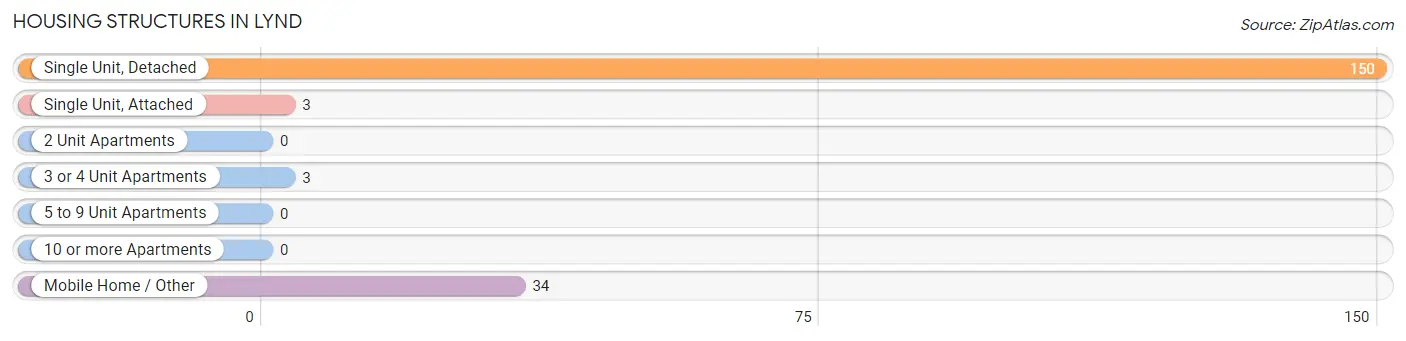
| Structure Type | # Housing Units | % Housing Units |
| Single Unit, Detached | 150 | 78.9% |
| Single Unit, Attached | 3 | 1.6% |
| 2 Unit Apartments | 0 | 0.0% |
| 3 or 4 Unit Apartments | 3 | 1.6% |
| 5 to 9 Unit Apartments | 0 | 0.0% |
| 10 or more Apartments | 0 | 0.0% |
| Mobile Home / Other | 34 | 17.9% |
| Total | 190 | 100.0% |
Housing Structures by Occupancy in Lynd
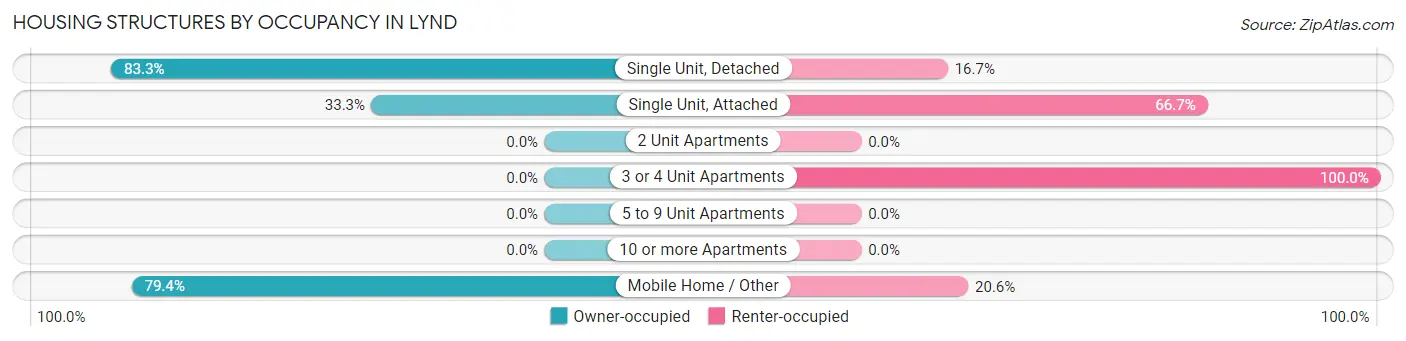
| Structure Type | Owner-occupied | Renter-occupied |
| Single Unit, Detached | 125 (83.3%) | 25 (16.7%) |
| Single Unit, Attached | 1 (33.3%) | 2 (66.7%) |
| 2 Unit Apartments | 0 (0.0%) | 0 (0.0%) |
| 3 or 4 Unit Apartments | 0 (0.0%) | 3 (100.0%) |
| 5 to 9 Unit Apartments | 0 (0.0%) | 0 (0.0%) |
| 10 or more Apartments | 0 (0.0%) | 0 (0.0%) |
| Mobile Home / Other | 27 (79.4%) | 7 (20.6%) |
| Total | 153 (80.5%) | 37 (19.5%) |
Housing Structures by Number of Rooms in Lynd
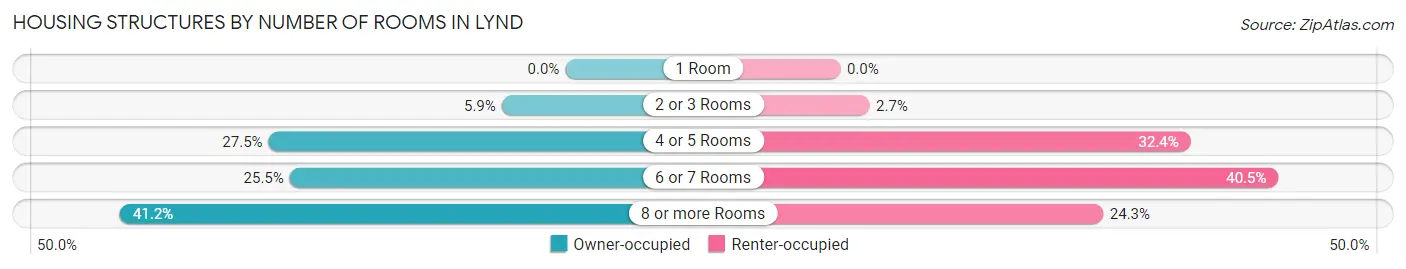
| Number of Rooms | Owner-occupied | Renter-occupied |
| 1 Room | 0 (0.0%) | 0 (0.0%) |
| 2 or 3 Rooms | 9 (5.9%) | 1 (2.7%) |
| 4 or 5 Rooms | 42 (27.5%) | 12 (32.4%) |
| 6 or 7 Rooms | 39 (25.5%) | 15 (40.5%) |
| 8 or more Rooms | 63 (41.2%) | 9 (24.3%) |
| Total | 153 (100.0%) | 37 (100.0%) |
Housing Structure by Heating Type in Lynd
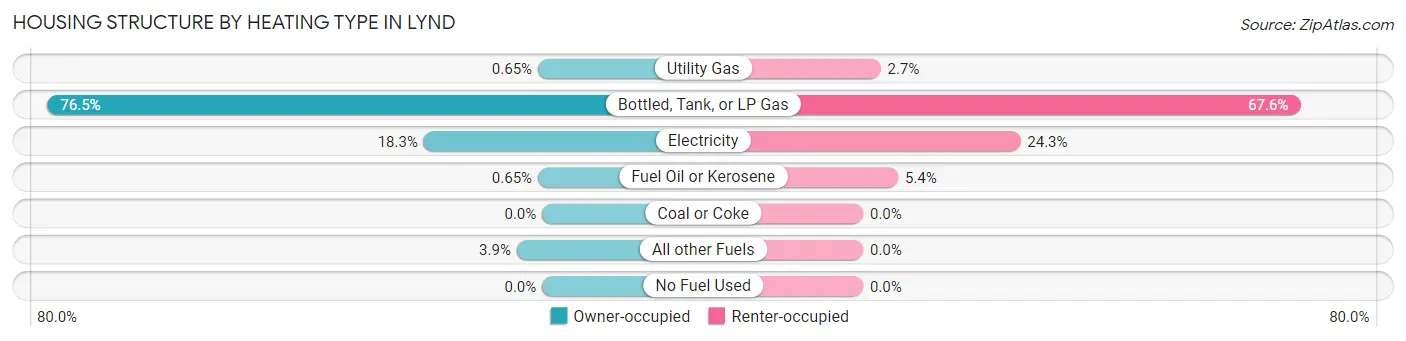
| Heating Type | Owner-occupied | Renter-occupied |
| Utility Gas | 1 (0.6%) | 1 (2.7%) |
| Bottled, Tank, or LP Gas | 117 (76.5%) | 25 (67.6%) |
| Electricity | 28 (18.3%) | 9 (24.3%) |
| Fuel Oil or Kerosene | 1 (0.6%) | 2 (5.4%) |
| Coal or Coke | 0 (0.0%) | 0 (0.0%) |
| All other Fuels | 6 (3.9%) | 0 (0.0%) |
| No Fuel Used | 0 (0.0%) | 0 (0.0%) |
| Total | 153 (100.0%) | 37 (100.0%) |
Household Vehicle Usage in Lynd
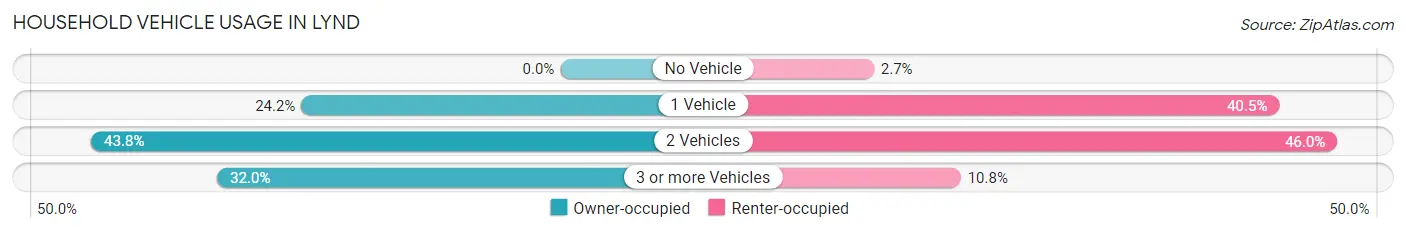
| Vehicles per Household | Owner-occupied | Renter-occupied |
| No Vehicle | 0 (0.0%) | 1 (2.7%) |
| 1 Vehicle | 37 (24.2%) | 15 (40.5%) |
| 2 Vehicles | 67 (43.8%) | 17 (46.0%) |
| 3 or more Vehicles | 49 (32.0%) | 4 (10.8%) |
| Total | 153 (100.0%) | 37 (100.0%) |
Real Estate & Mortgages in Lynd
Real Estate and Mortgage Overview in Lynd
| Characteristic | Without Mortgage | With Mortgage |
| Housing Units | 66 | 87 |
| Median Property Value | $90,000 | $159,000 |
| Median Household Income | $56,786 | $17 |
| Monthly Housing Costs | $600 | $4 |
| Real Estate Taxes | $818 | $18 |
Property Value by Mortgage Status in Lynd
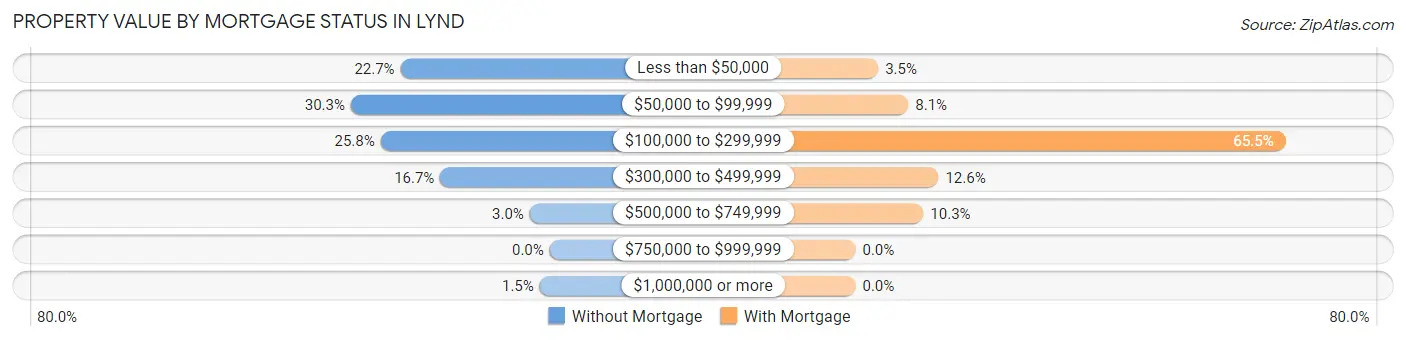
| Property Value | Without Mortgage | With Mortgage |
| Less than $50,000 | 15 (22.7%) | 3 (3.5%) |
| $50,000 to $99,999 | 20 (30.3%) | 7 (8.1%) |
| $100,000 to $299,999 | 17 (25.8%) | 57 (65.5%) |
| $300,000 to $499,999 | 11 (16.7%) | 11 (12.6%) |
| $500,000 to $749,999 | 2 (3.0%) | 9 (10.3%) |
| $750,000 to $999,999 | 0 (0.0%) | 0 (0.0%) |
| $1,000,000 or more | 1 (1.5%) | 0 (0.0%) |
| Total | 66 (100.0%) | 87 (100.0%) |
Household Income by Mortgage Status in Lynd
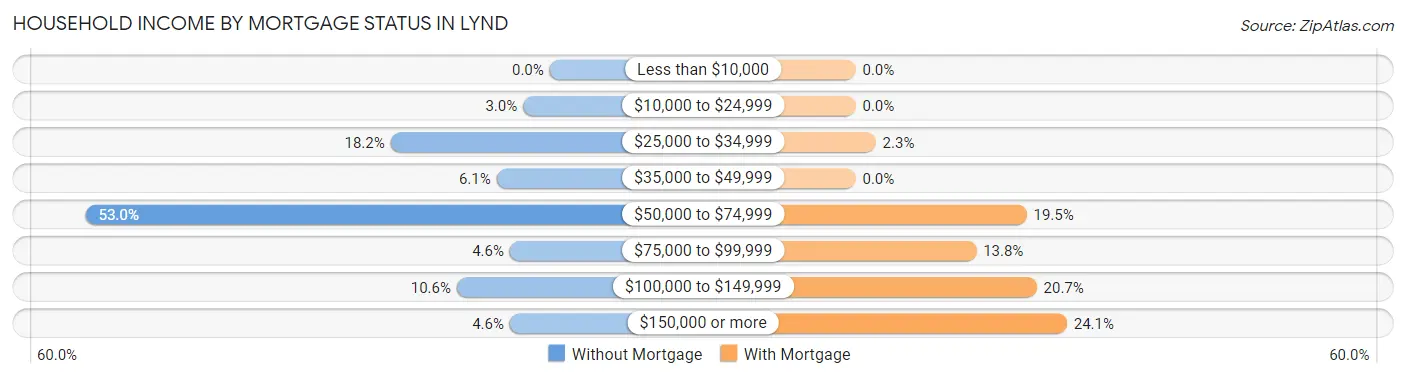
| Household Income | Without Mortgage | With Mortgage |
| Less than $10,000 | 0 (0.0%) | 0 (0.0%) |
| $10,000 to $24,999 | 2 (3.0%) | 0 (0.0%) |
| $25,000 to $34,999 | 12 (18.2%) | 2 (2.3%) |
| $35,000 to $49,999 | 4 (6.1%) | 0 (0.0%) |
| $50,000 to $74,999 | 35 (53.0%) | 17 (19.5%) |
| $75,000 to $99,999 | 3 (4.5%) | 12 (13.8%) |
| $100,000 to $149,999 | 7 (10.6%) | 18 (20.7%) |
| $150,000 or more | 3 (4.5%) | 21 (24.1%) |
| Total | 66 (100.0%) | 87 (100.0%) |
Property Value to Household Income Ratio in Lynd
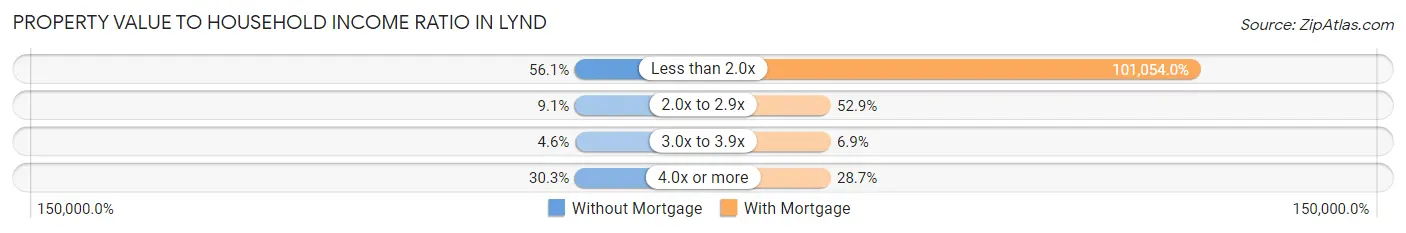
| Value-to-Income Ratio | Without Mortgage | With Mortgage |
| Less than 2.0x | 37 (56.1%) | 87,917 (101,054.0%) |
| 2.0x to 2.9x | 6 (9.1%) | 46 (52.9%) |
| 3.0x to 3.9x | 3 (4.5%) | 6 (6.9%) |
| 4.0x or more | 20 (30.3%) | 25 (28.7%) |
| Total | 66 (100.0%) | 87 (100.0%) |
Real Estate Taxes by Mortgage Status in Lynd
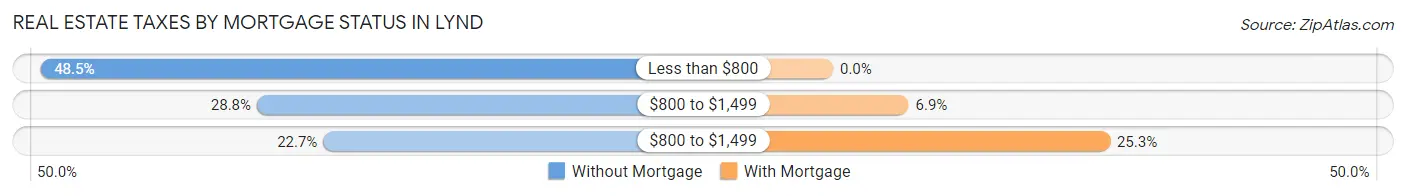
| Property Taxes | Without Mortgage | With Mortgage |
| Less than $800 | 32 (48.5%) | 0 (0.0%) |
| $800 to $1,499 | 19 (28.8%) | 6 (6.9%) |
| $800 to $1,499 | 15 (22.7%) | 22 (25.3%) |
| Total | 66 (100.0%) | 87 (100.0%) |
Health & Disability in Lynd
Health Insurance Coverage by Age in Lynd
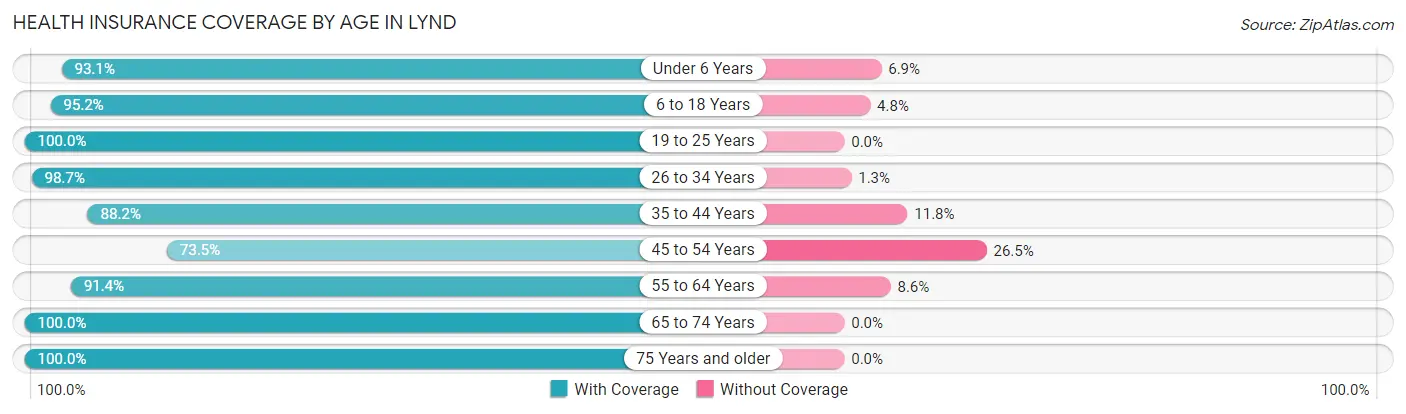
| Age Bracket | With Coverage | Without Coverage |
| Under 6 Years | 27 (93.1%) | 2 (6.9%) |
| 6 to 18 Years | 158 (95.2%) | 8 (4.8%) |
| 19 to 25 Years | 33 (100.0%) | 0 (0.0%) |
| 26 to 34 Years | 76 (98.7%) | 1 (1.3%) |
| 35 to 44 Years | 75 (88.2%) | 10 (11.8%) |
| 45 to 54 Years | 36 (73.5%) | 13 (26.5%) |
| 55 to 64 Years | 53 (91.4%) | 5 (8.6%) |
| 65 to 74 Years | 25 (100.0%) | 0 (0.0%) |
| 75 Years and older | 5 (100.0%) | 0 (0.0%) |
| Total | 488 (92.6%) | 39 (7.4%) |
Health Insurance Coverage by Citizenship Status in Lynd
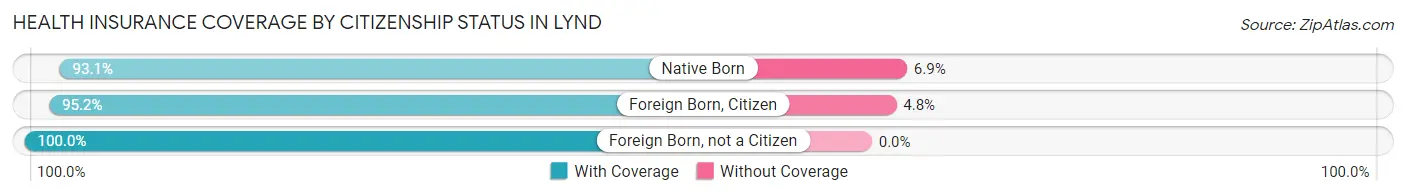
| Citizenship Status | With Coverage | Without Coverage |
| Native Born | 27 (93.1%) | 2 (6.9%) |
| Foreign Born, Citizen | 158 (95.2%) | 8 (4.8%) |
| Foreign Born, not a Citizen | 33 (100.0%) | 0 (0.0%) |
Health Insurance Coverage by Household Income in Lynd
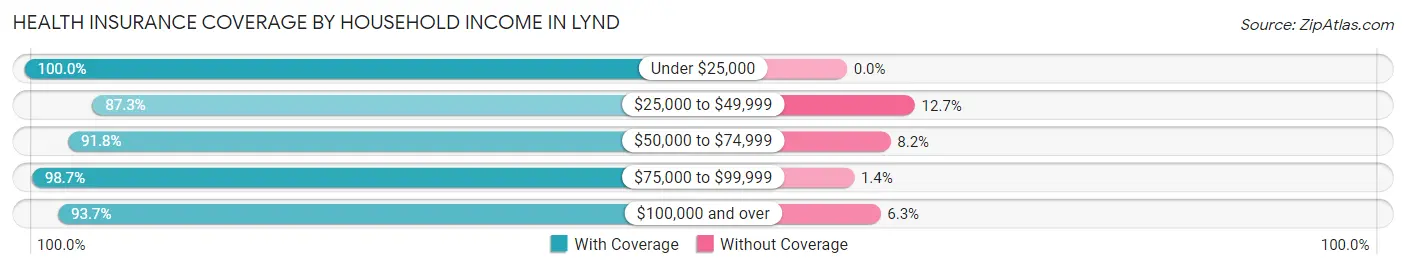
| Household Income | With Coverage | Without Coverage |
| Under $25,000 | 13 (100.0%) | 0 (0.0%) |
| $25,000 to $49,999 | 103 (87.3%) | 15 (12.7%) |
| $50,000 to $74,999 | 135 (91.8%) | 12 (8.2%) |
| $75,000 to $99,999 | 73 (98.7%) | 1 (1.3%) |
| $100,000 and over | 164 (93.7%) | 11 (6.3%) |
Public vs Private Health Insurance Coverage by Age in Lynd
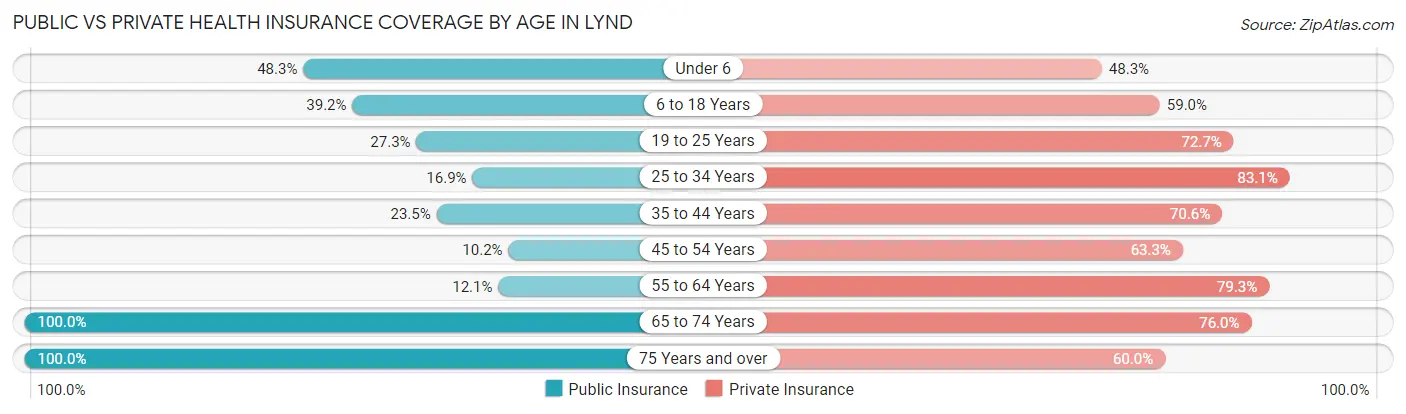
| Age Bracket | Public Insurance | Private Insurance |
| Under 6 | 14 (48.3%) | 14 (48.3%) |
| 6 to 18 Years | 65 (39.2%) | 98 (59.0%) |
| 19 to 25 Years | 9 (27.3%) | 24 (72.7%) |
| 25 to 34 Years | 13 (16.9%) | 64 (83.1%) |
| 35 to 44 Years | 20 (23.5%) | 60 (70.6%) |
| 45 to 54 Years | 5 (10.2%) | 31 (63.3%) |
| 55 to 64 Years | 7 (12.1%) | 46 (79.3%) |
| 65 to 74 Years | 25 (100.0%) | 19 (76.0%) |
| 75 Years and over | 5 (100.0%) | 3 (60.0%) |
| Total | 163 (30.9%) | 359 (68.1%) |
Disability Status by Sex by Age in Lynd
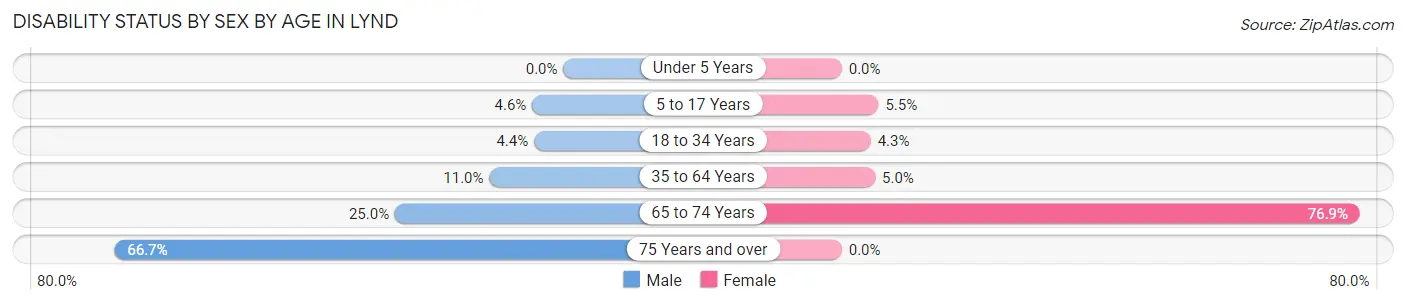
| Age Bracket | Male | Female |
| Under 5 Years | 0 (0.0%) | 0 (0.0%) |
| 5 to 17 Years | 5 (4.6%) | 3 (5.4%) |
| 18 to 34 Years | 2 (4.3%) | 3 (4.3%) |
| 35 to 64 Years | 10 (11.0%) | 5 (5.0%) |
| 65 to 74 Years | 3 (25.0%) | 10 (76.9%) |
| 75 Years and over | 2 (66.7%) | 0 (0.0%) |
Disability Class by Sex by Age in Lynd
Disability Class: Hearing Difficulty
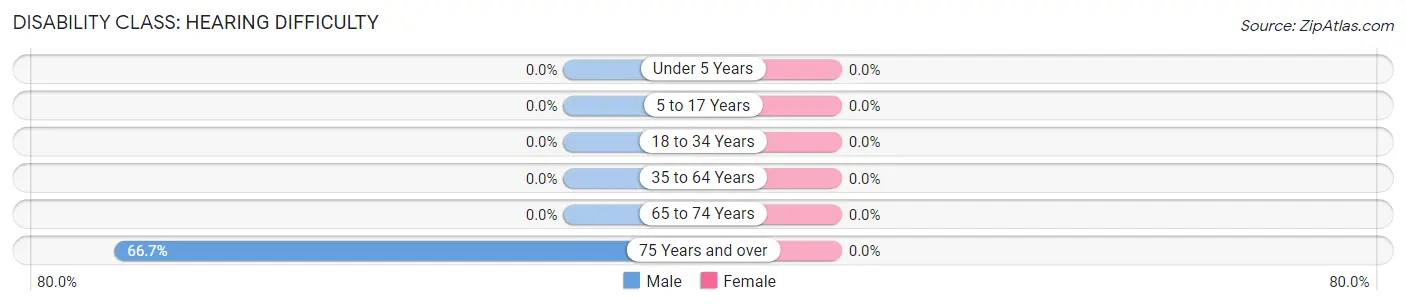
| Age Bracket | Male | Female |
| Under 5 Years | 0 (0.0%) | 0 (0.0%) |
| 5 to 17 Years | 0 (0.0%) | 0 (0.0%) |
| 18 to 34 Years | 0 (0.0%) | 0 (0.0%) |
| 35 to 64 Years | 0 (0.0%) | 0 (0.0%) |
| 65 to 74 Years | 0 (0.0%) | 0 (0.0%) |
| 75 Years and over | 2 (66.7%) | 0 (0.0%) |
Disability Class: Vision Difficulty
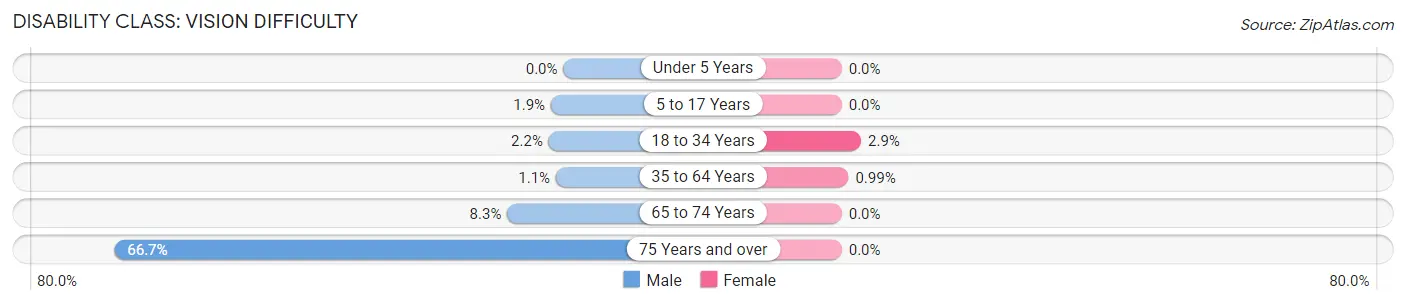
| Age Bracket | Male | Female |
| Under 5 Years | 0 (0.0%) | 0 (0.0%) |
| 5 to 17 Years | 2 (1.8%) | 0 (0.0%) |
| 18 to 34 Years | 1 (2.2%) | 2 (2.9%) |
| 35 to 64 Years | 1 (1.1%) | 1 (1.0%) |
| 65 to 74 Years | 1 (8.3%) | 0 (0.0%) |
| 75 Years and over | 2 (66.7%) | 0 (0.0%) |
Disability Class: Cognitive Difficulty
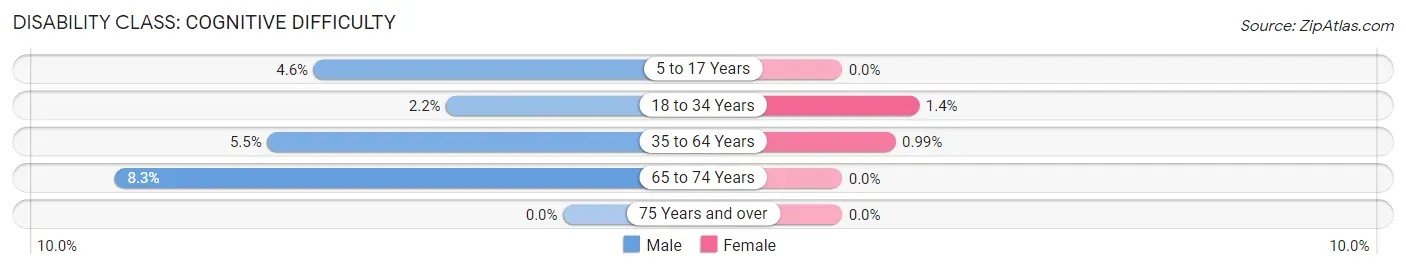
| Age Bracket | Male | Female |
| 5 to 17 Years | 5 (4.6%) | 0 (0.0%) |
| 18 to 34 Years | 1 (2.2%) | 1 (1.4%) |
| 35 to 64 Years | 5 (5.5%) | 1 (1.0%) |
| 65 to 74 Years | 1 (8.3%) | 0 (0.0%) |
| 75 Years and over | 0 (0.0%) | 0 (0.0%) |
Disability Class: Ambulatory Difficulty
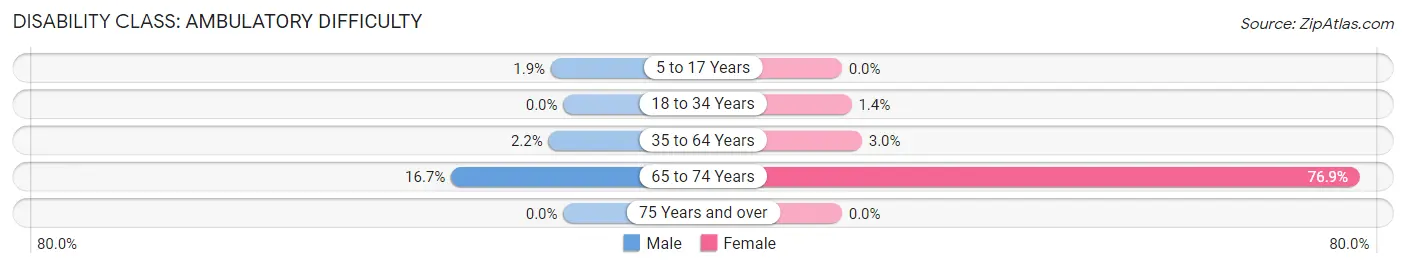
| Age Bracket | Male | Female |
| 5 to 17 Years | 2 (1.8%) | 0 (0.0%) |
| 18 to 34 Years | 0 (0.0%) | 1 (1.4%) |
| 35 to 64 Years | 2 (2.2%) | 3 (3.0%) |
| 65 to 74 Years | 2 (16.7%) | 10 (76.9%) |
| 75 Years and over | 0 (0.0%) | 0 (0.0%) |
Disability Class: Self-Care Difficulty
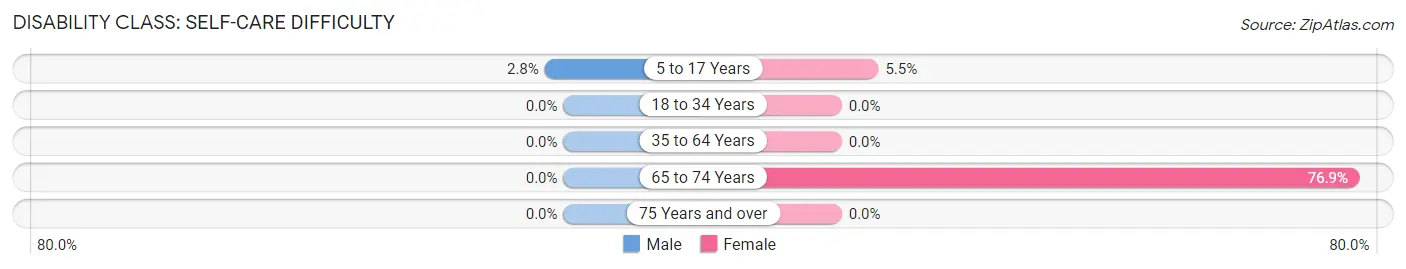
| Age Bracket | Male | Female |
| 5 to 17 Years | 3 (2.8%) | 3 (5.4%) |
| 18 to 34 Years | 0 (0.0%) | 0 (0.0%) |
| 35 to 64 Years | 0 (0.0%) | 0 (0.0%) |
| 65 to 74 Years | 0 (0.0%) | 10 (76.9%) |
| 75 Years and over | 0 (0.0%) | 0 (0.0%) |
Technology Access in Lynd
Computing Device Access in Lynd
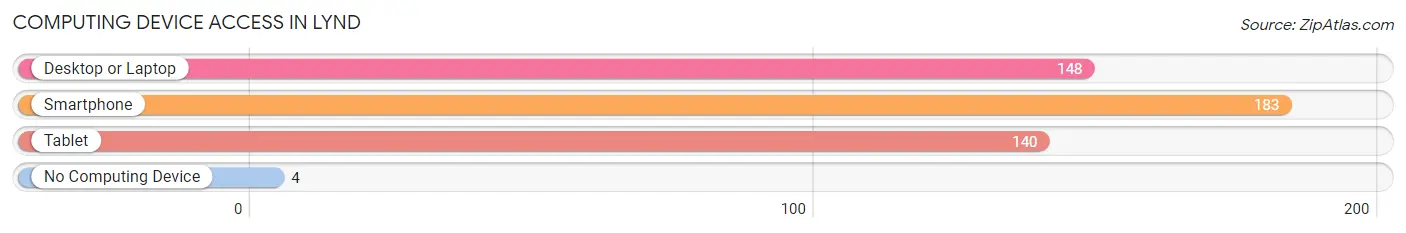
| Device Type | # Households | % Households |
| Desktop or Laptop | 148 | 77.9% |
| Smartphone | 183 | 96.3% |
| Tablet | 140 | 73.7% |
| No Computing Device | 4 | 2.1% |
| Total | 190 | 100.0% |
Internet Access in Lynd
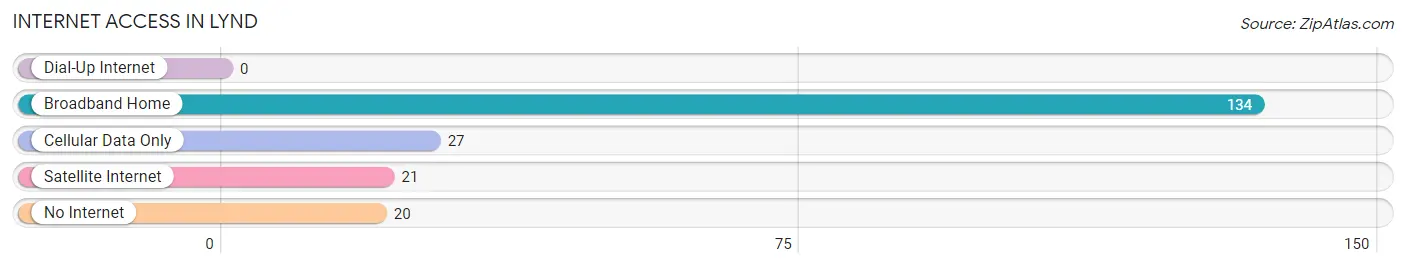
| Internet Type | # Households | % Households |
| Dial-Up Internet | 0 | 0.0% |
| Broadband Home | 134 | 70.5% |
| Cellular Data Only | 27 | 14.2% |
| Satellite Internet | 21 | 11.1% |
| No Internet | 20 | 10.5% |
| Total | 190 | 100.0% |
Lynd Summary
Lynd is a small city located in Lincoln County, Minnesota, United States. The city is situated on the banks of the Cottonwood River, approximately 20 miles east of Marshall. As of the 2010 census, the population of Lynd was 545.
History
The area that is now Lynd was first settled in the late 1800s by a group of Norwegian immigrants. The city was originally known as “Lynden”, after the Norwegian city of the same name. The name was later shortened to “Lynd”. The city was officially incorporated in 1902.
In the early 1900s, Lynd was a thriving agricultural community. The city was home to several grain elevators, a creamery, a flour mill, and a lumber mill. The city also had a hotel, a bank, and several stores.
In the 1950s, the city began to decline as many of its residents moved away in search of better economic opportunities. The city’s population dropped from a peak of 845 in 1950 to 545 in 2010.
Geography
Lynd is located at the intersection of Minnesota State Highways 19 and 23. The city is situated on the banks of the Cottonwood River, approximately 20 miles east of Marshall. The city has a total area of 0.6 square miles, all of which is land.
Economy
The economy of Lynd is largely based on agriculture. The city is home to several grain elevators, a creamery, and a flour mill. The city also has a few small businesses, including a grocery store, a hardware store, and a restaurant.
Demographics
As of the 2010 census, the population of Lynd was 545. The racial makeup of the city was 97.3% White, 0.2% African American, 0.2% Native American, 0.2% Asian, 0.4% from other races, and 1.7% from two or more races. Hispanic or Latino of any race were 1.3% of the population.
The median income for a household in the city was $41,250, and the median income for a family was $45,000. The per capita income for the city was $17,845. About 10.2% of families and 11.7% of the population were below the poverty line, including 16.7% of those under age 18 and 8.3% of those age 65 or over.
Common Questions
What is Per Capita Income in Lynd?
Per Capita income in Lynd is $29,533.
What is the Median Family Income in Lynd?
Median Family Income in Lynd is $73,750.
What is the Median Household income in Lynd?
Median Household Income in Lynd is $70,417.
What is Income or Wage Gap in Lynd?
Income or Wage Gap in Lynd is 38.6%.
Women in Lynd earn 61.4 cents for every dollar earned by a man.
What is Inequality or Gini Index in Lynd?
Inequality or Gini Index in Lynd is 0.34.
What is the Total Population of Lynd?
Total Population of Lynd is 527.
What is the Total Male Population of Lynd?
Total Male Population of Lynd is 267.
What is the Total Female Population of Lynd?
Total Female Population of Lynd is 260.
What is the Ratio of Males per 100 Females in Lynd?
There are 102.69 Males per 100 Females in Lynd.
What is the Ratio of Females per 100 Males in Lynd?
There are 97.38 Females per 100 Males in Lynd.
What is the Median Population Age in Lynd?
Median Population Age in Lynd is 28.2 Years.
What is the Average Family Size in Lynd
Average Family Size in Lynd is 3.6 People.
What is the Average Household Size in Lynd
Average Household Size in Lynd is 2.8 People.
How Large is the Labor Force in Lynd?
There are 253 People in the Labor Forcein in Lynd.
What is the Percentage of People in the Labor Force in Lynd?
72.7% of People are in the Labor Force in Lynd.
What is the Unemployment Rate in Lynd?
Unemployment Rate in Lynd is 2.0%.