Lutsen, MN Map & Demographics
Lutsen Map
Lutsen Overview
$44,030
PER CAPITA INCOME
$80,278
AVG FAMILY INCOME
$52,031
AVG HOUSEHOLD INCOME
62.3%
WAGE / INCOME GAP [ % ]
37.7¢/ $1
WAGE / INCOME GAP [ $ ]
0.38
INEQUALITY / GINI INDEX
225
TOTAL POPULATION
118
MALE POPULATION
107
FEMALE POPULATION
110.28
MALES / 100 FEMALES
90.68
FEMALES / 100 MALES
58.1
MEDIAN AGE
2.0
AVG FAMILY SIZE
1.5
AVG HOUSEHOLD SIZE
139
LABOR FORCE [ PEOPLE ]
61.8%
PERCENT IN LABOR FORCE
5.8%
UNEMPLOYMENT RATE
Lutsen Zip Codes
Lutsen Area Codes
Income in Lutsen
Income Overview in Lutsen
Per Capita Income in Lutsen is $44,030, while median incomes of families and households are $80,278 and $52,031 respectively.
| Characteristic | Number | Measure |
| Per Capita Income | 225 | $44,030 |
| Median Family Income | 42 | $80,278 |
| Mean Family Income | 42 | $92,236 |
| Median Household Income | 150 | $52,031 |
| Mean Household Income | 150 | $68,328 |
| Income Deficit | 42 | $0 |
| Wage / Income Gap (%) | 225 | 62.26% |
| Wage / Income Gap ($) | 225 | 37.74¢ per $1 |
| Gini / Inequality Index | 225 | 0.38 |
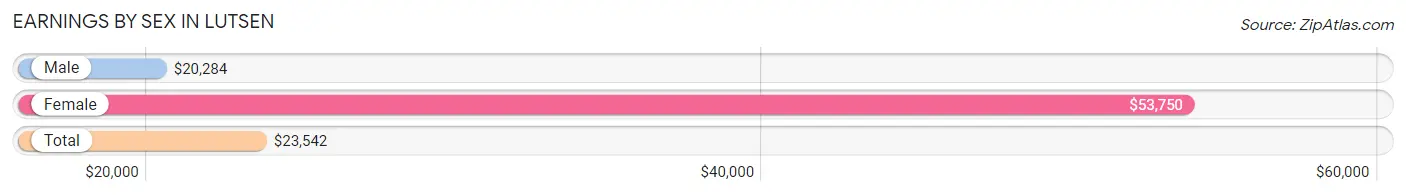
Earnings by Sex in Lutsen
Average Earnings in Lutsen are $23,542, $20,284 for men and $53,750 for women, a difference of 62.3%.
| Sex | Number | Average Earnings |
| Male | 101 (67.8%) | $20,284 |
| Female | 48 (32.2%) | $53,750 |
| Total | 149 (100.0%) | $23,542 |
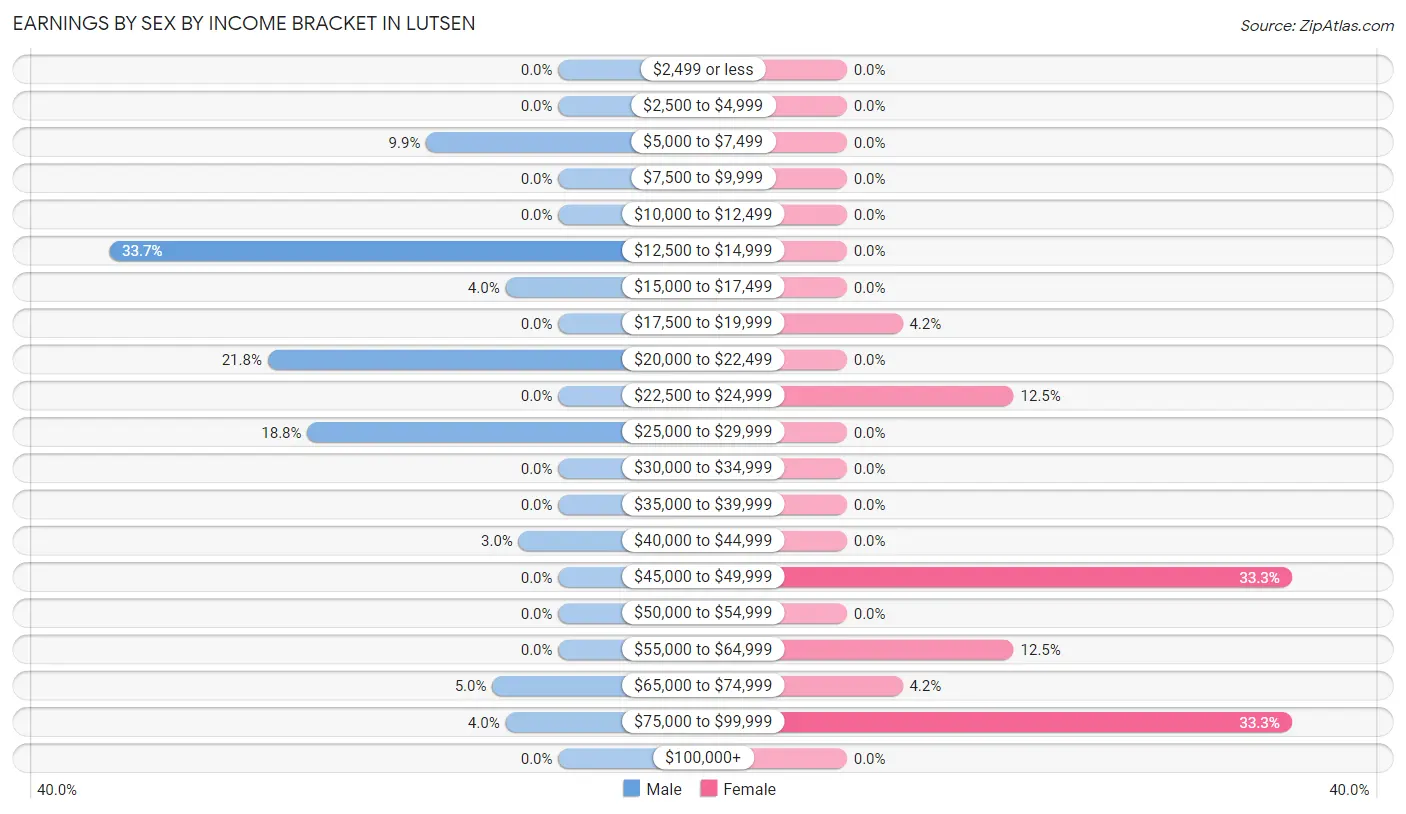
Earnings by Sex by Income Bracket in Lutsen
The most common earnings brackets in Lutsen are $12,500 to $14,999 for men (34 | 33.7%) and $45,000 to $49,999 for women (16 | 33.3%).
| Income | Male | Female |
| $2,499 or less | 0 (0.0%) | 0 (0.0%) |
| $2,500 to $4,999 | 0 (0.0%) | 0 (0.0%) |
| $5,000 to $7,499 | 10 (9.9%) | 0 (0.0%) |
| $7,500 to $9,999 | 0 (0.0%) | 0 (0.0%) |
| $10,000 to $12,499 | 0 (0.0%) | 0 (0.0%) |
| $12,500 to $14,999 | 34 (33.7%) | 0 (0.0%) |
| $15,000 to $17,499 | 4 (4.0%) | 0 (0.0%) |
| $17,500 to $19,999 | 0 (0.0%) | 2 (4.2%) |
| $20,000 to $22,499 | 22 (21.8%) | 0 (0.0%) |
| $22,500 to $24,999 | 0 (0.0%) | 6 (12.5%) |
| $25,000 to $29,999 | 19 (18.8%) | 0 (0.0%) |
| $30,000 to $34,999 | 0 (0.0%) | 0 (0.0%) |
| $35,000 to $39,999 | 0 (0.0%) | 0 (0.0%) |
| $40,000 to $44,999 | 3 (3.0%) | 0 (0.0%) |
| $45,000 to $49,999 | 0 (0.0%) | 16 (33.3%) |
| $50,000 to $54,999 | 0 (0.0%) | 0 (0.0%) |
| $55,000 to $64,999 | 0 (0.0%) | 6 (12.5%) |
| $65,000 to $74,999 | 5 (5.0%) | 2 (4.2%) |
| $75,000 to $99,999 | 4 (4.0%) | 16 (33.3%) |
| $100,000+ | 0 (0.0%) | 0 (0.0%) |
| Total | 101 (100.0%) | 48 (100.0%) |
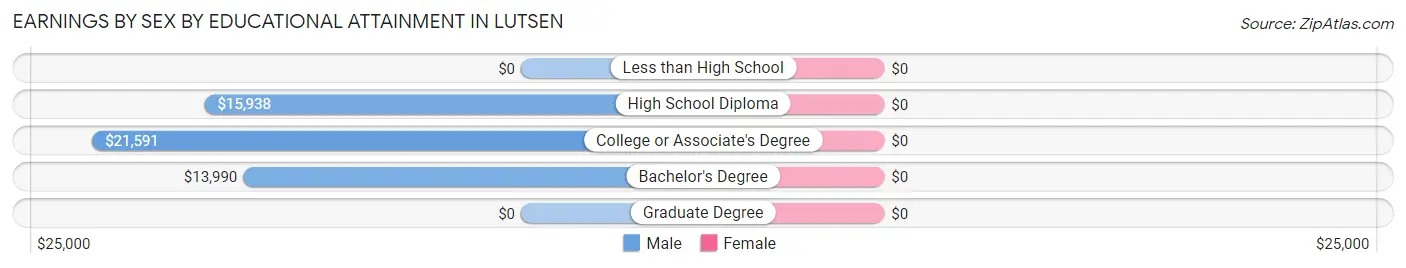
Earnings by Sex by Educational Attainment in Lutsen
| Educational Attainment | Male Income | Female Income |
| Less than High School | - | - |
| High School Diploma | $15,938 | $0 |
| College or Associate's Degree | $21,591 | $0 |
| Bachelor's Degree | $13,990 | $0 |
| Graduate Degree | - | - |
| Total | $14,853 | $53,750 |
Family Income in Lutsen
Family Income Brackets in Lutsen
According to the Lutsen family income data, there are 18 families falling into the $50,000 to $74,999 income range, which is the most common income bracket and makes up 42.9% of all families.
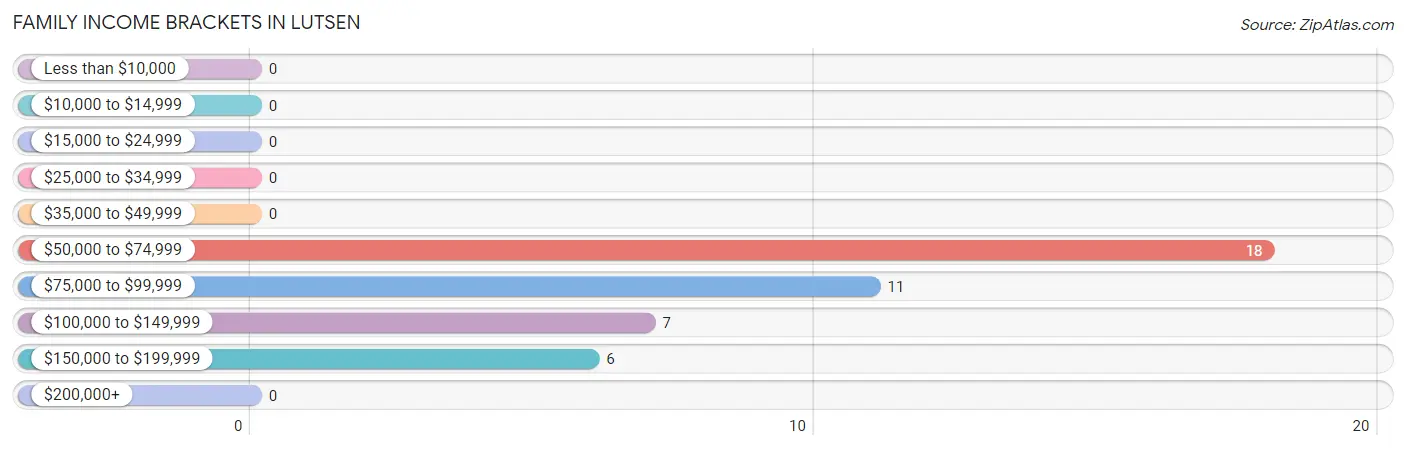
| Income Bracket | # Families | % Families |
| Less than $10,000 | 0 | 0.0% |
| $10,000 to $14,999 | 0 | 0.0% |
| $15,000 to $24,999 | 0 | 0.0% |
| $25,000 to $34,999 | 0 | 0.0% |
| $35,000 to $49,999 | 0 | 0.0% |
| $50,000 to $74,999 | 18 | 42.9% |
| $75,000 to $99,999 | 11 | 26.2% |
| $100,000 to $149,999 | 7 | 16.7% |
| $150,000 to $199,999 | 6 | 14.3% |
| $200,000+ | 0 | 0.0% |
Family Income by Famaliy Size in Lutsen
2-person families (42 | 100.0%) account for the highest median family income in Lutsen with $80,278 per family, while 2-person families (42 | 100.0%) have the highest median income of $40,139 per family member.
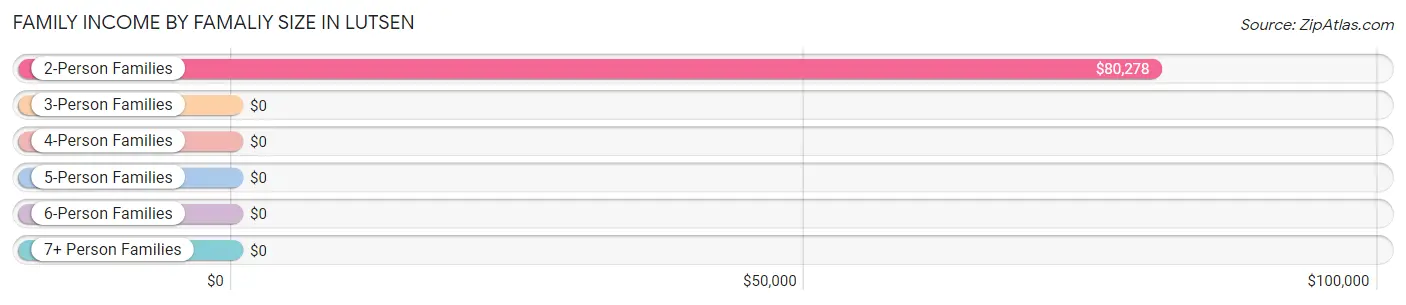
| Income Bracket | # Families | Median Income |
| 2-Person Families | 42 (100.0%) | $80,278 |
| 3-Person Families | 0 (0.0%) | $0 |
| 4-Person Families | 0 (0.0%) | $0 |
| 5-Person Families | 0 (0.0%) | $0 |
| 6-Person Families | 0 (0.0%) | $0 |
| 7+ Person Families | 0 (0.0%) | $0 |
| Total | 42 (100.0%) | $80,278 |
Family Income by Number of Earners in Lutsen
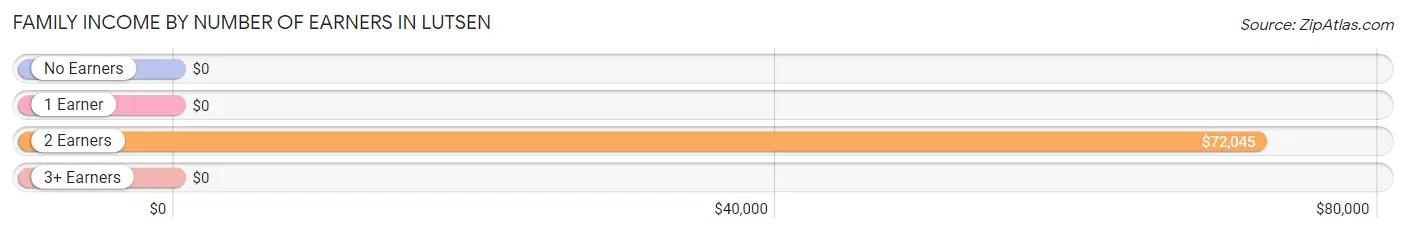
| Number of Earners | # Families | Median Income |
| No Earners | 7 (16.7%) | $0 |
| 1 Earner | 17 (40.5%) | $0 |
| 2 Earners | 18 (42.9%) | $72,045 |
| 3+ Earners | 0 (0.0%) | $0 |
| Total | 42 (100.0%) | $80,278 |
Household Income in Lutsen
Household Income Brackets in Lutsen
With 40 households falling in the category, the $50,000 to $74,999 income range is the most frequent in Lutsen, accounting for 26.7% of all households.
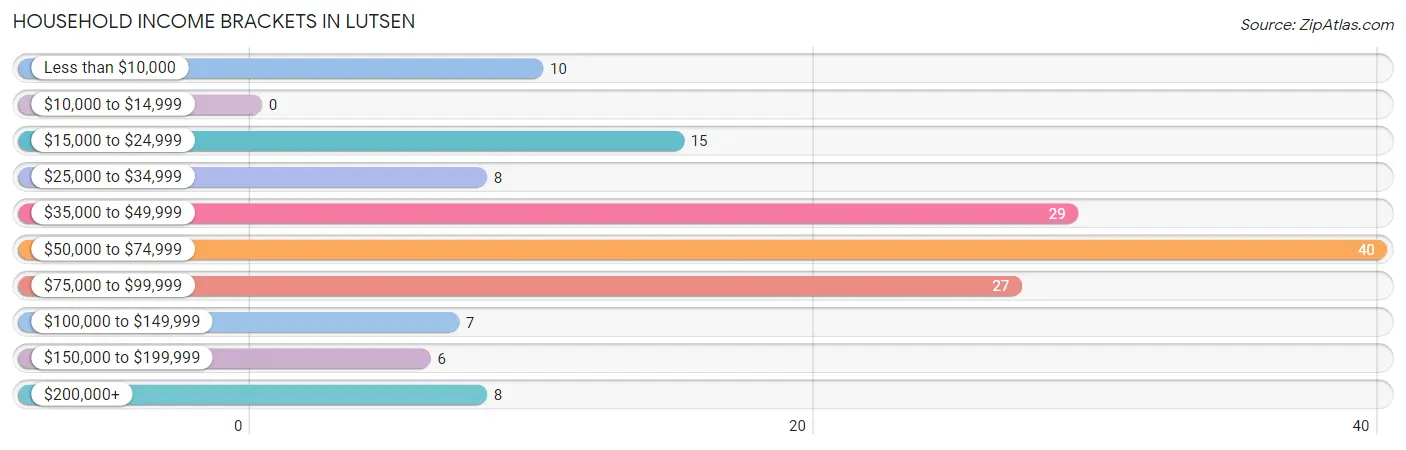
| Income Bracket | # Households | % Households |
| Less than $10,000 | 10 | 6.7% |
| $10,000 to $14,999 | 0 | 0.0% |
| $15,000 to $24,999 | 15 | 10.0% |
| $25,000 to $34,999 | 8 | 5.3% |
| $35,000 to $49,999 | 29 | 19.3% |
| $50,000 to $74,999 | 40 | 26.7% |
| $75,000 to $99,999 | 27 | 18.0% |
| $100,000 to $149,999 | 7 | 4.7% |
| $150,000 to $199,999 | 6 | 4.0% |
| $200,000+ | 8 | 5.3% |
Household Income by Householder Age in Lutsen
The median household income in Lutsen is $52,031, with the highest median household income of $72,273 found in the 45 to 64 years age bracket for the primary householder. A total of 48 households (32.0%) fall into this category. Meanwhile, the 15 to 24 years age bracket for the primary householder has the lowest median household income of $0, with 17 households (11.3%) in this group.
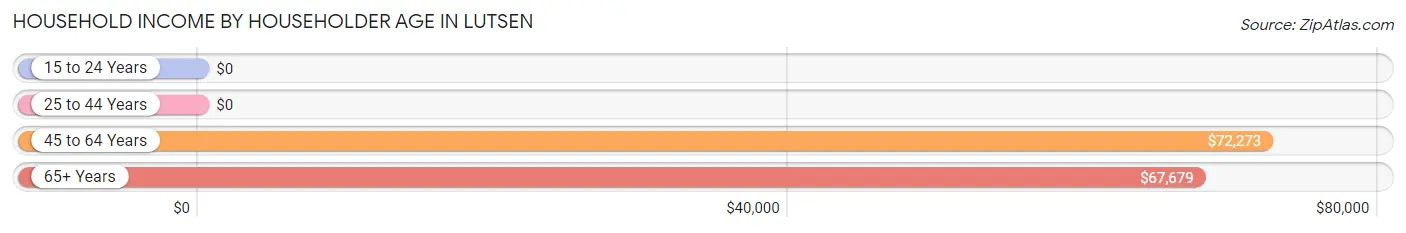
| Income Bracket | # Households | Median Income |
| 15 to 24 Years | 17 (11.3%) | $0 |
| 25 to 44 Years | 22 (14.7%) | $0 |
| 45 to 64 Years | 48 (32.0%) | $72,273 |
| 65+ Years | 63 (42.0%) | $67,679 |
| Total | 150 (100.0%) | $52,031 |
Poverty in Lutsen
Income Below Poverty by Sex and Age in Lutsen
With 35.6% poverty level for males and 6.5% for females among the residents of Lutsen, 35 to 44 year old males and 55 to 64 year old females are the most vulnerable to poverty, with 8 males (100.0%) and 7 females (36.8%) in their respective age groups living below the poverty level.
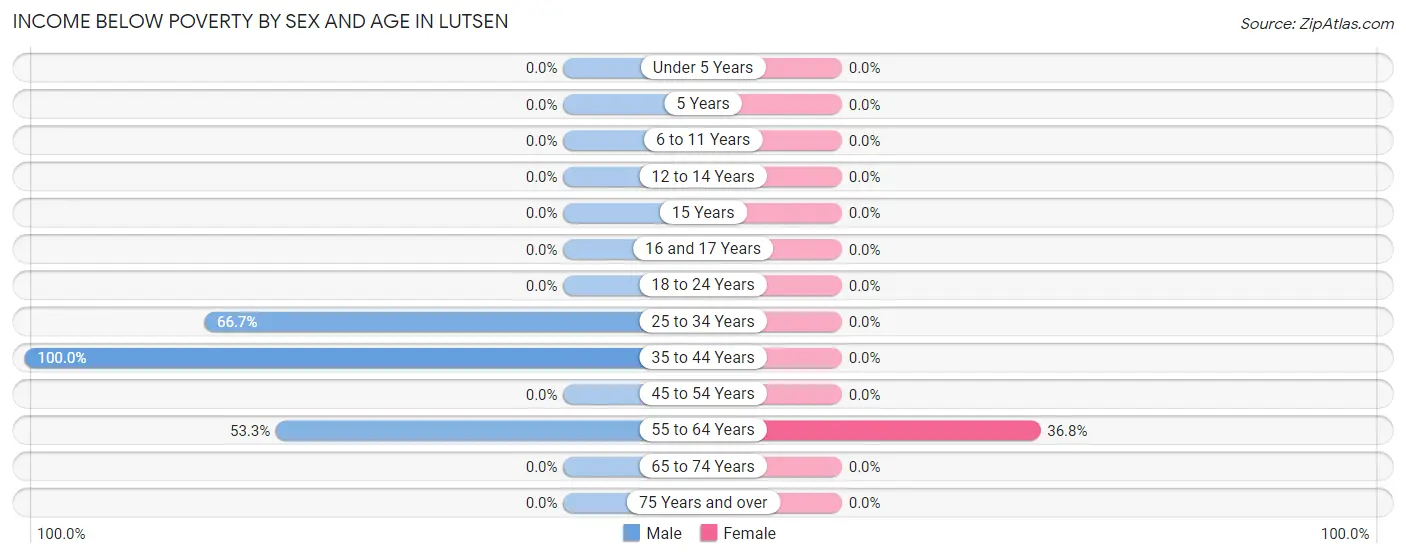
| Age Bracket | Male | Female |
| Under 5 Years | 0 (0.0%) | 0 (0.0%) |
| 5 Years | 0 (0.0%) | 0 (0.0%) |
| 6 to 11 Years | 0 (0.0%) | 0 (0.0%) |
| 12 to 14 Years | 0 (0.0%) | 0 (0.0%) |
| 15 Years | 0 (0.0%) | 0 (0.0%) |
| 16 and 17 Years | 0 (0.0%) | 0 (0.0%) |
| 18 to 24 Years | 0 (0.0%) | 0 (0.0%) |
| 25 to 34 Years | 26 (66.7%) | 0 (0.0%) |
| 35 to 44 Years | 8 (100.0%) | 0 (0.0%) |
| 45 to 54 Years | 0 (0.0%) | 0 (0.0%) |
| 55 to 64 Years | 8 (53.3%) | 7 (36.8%) |
| 65 to 74 Years | 0 (0.0%) | 0 (0.0%) |
| 75 Years and over | 0 (0.0%) | 0 (0.0%) |
| Total | 42 (35.6%) | 7 (6.5%) |
Income Above Poverty by Sex and Age in Lutsen
According to the poverty statistics in Lutsen, males aged 18 to 24 years and females aged 45 to 54 years are the age groups that are most secure financially, with 100.0% of males and 100.0% of females in these age groups living above the poverty line.
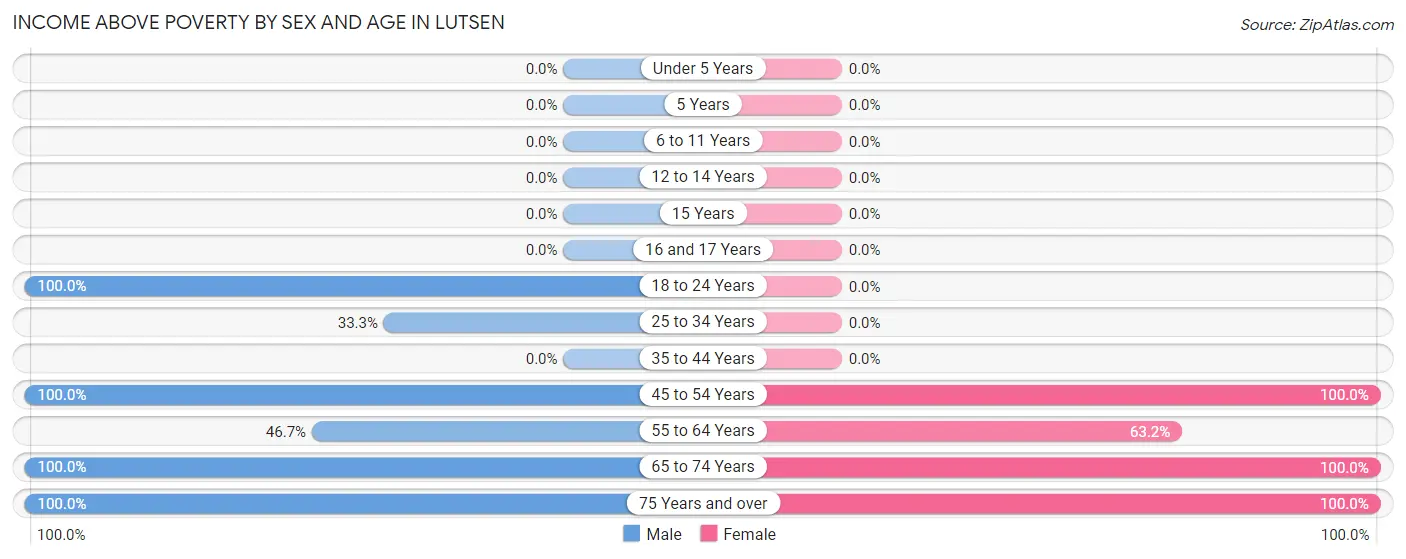
| Age Bracket | Male | Female |
| Under 5 Years | 0 (0.0%) | 0 (0.0%) |
| 5 Years | 0 (0.0%) | 0 (0.0%) |
| 6 to 11 Years | 0 (0.0%) | 0 (0.0%) |
| 12 to 14 Years | 0 (0.0%) | 0 (0.0%) |
| 15 Years | 0 (0.0%) | 0 (0.0%) |
| 16 and 17 Years | 0 (0.0%) | 0 (0.0%) |
| 18 to 24 Years | 17 (100.0%) | 0 (0.0%) |
| 25 to 34 Years | 13 (33.3%) | 0 (0.0%) |
| 35 to 44 Years | 0 (0.0%) | 0 (0.0%) |
| 45 to 54 Years | 11 (100.0%) | 32 (100.0%) |
| 55 to 64 Years | 7 (46.7%) | 12 (63.2%) |
| 65 to 74 Years | 20 (100.0%) | 43 (100.0%) |
| 75 Years and over | 8 (100.0%) | 13 (100.0%) |
| Total | 76 (64.4%) | 100 (93.5%) |
Income Below Poverty Among Married-Couple Families in Lutsen
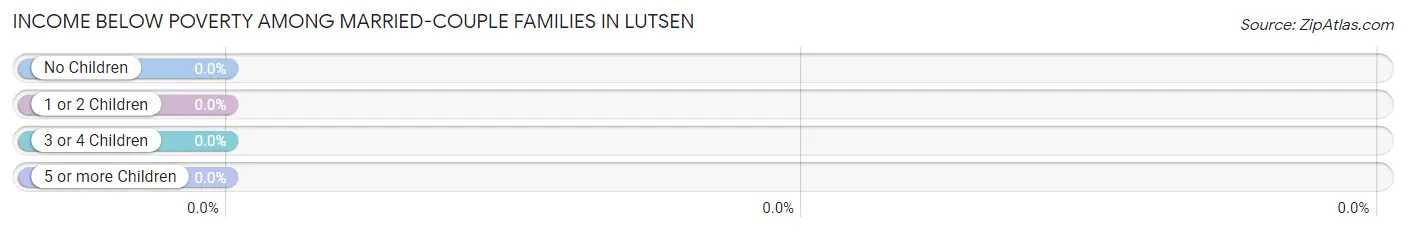
| Children | Above Poverty | Below Poverty |
| No Children | 42 (100.0%) | 0 (0.0%) |
| 1 or 2 Children | 0 (0.0%) | 0 (0.0%) |
| 3 or 4 Children | 0 (0.0%) | 0 (0.0%) |
| 5 or more Children | 0 (0.0%) | 0 (0.0%) |
| Total | 42 (100.0%) | 0 (0.0%) |
Income Below Poverty Among Single-Parent Households in Lutsen
| Children | Single Father | Single Mother |
| No Children | 0 (0.0%) | 0 (0.0%) |
| 1 or 2 Children | 0 (0.0%) | 0 (0.0%) |
| 3 or 4 Children | 0 (0.0%) | 0 (0.0%) |
| 5 or more Children | 0 (0.0%) | 0 (0.0%) |
| Total | 0 (0.0%) | 0 (0.0%) |
Income Below Poverty Among Married-Couple vs Single-Parent Households in Lutsen
| Children | Married-Couple Families | Single-Parent Households |
| No Children | 0 (0.0%) | 0 (0.0%) |
| 1 or 2 Children | 0 (0.0%) | 0 (0.0%) |
| 3 or 4 Children | 0 (0.0%) | 0 (0.0%) |
| 5 or more Children | 0 (0.0%) | 0 (0.0%) |
| Total | 0 (0.0%) | 0 (0.0%) |
Race in Lutsen
The most populous races in Lutsen are White / Caucasian (189 | 84.0%), Some other Race (30 | 13.3%), and Hispanic or Latino (26 | 11.6%).
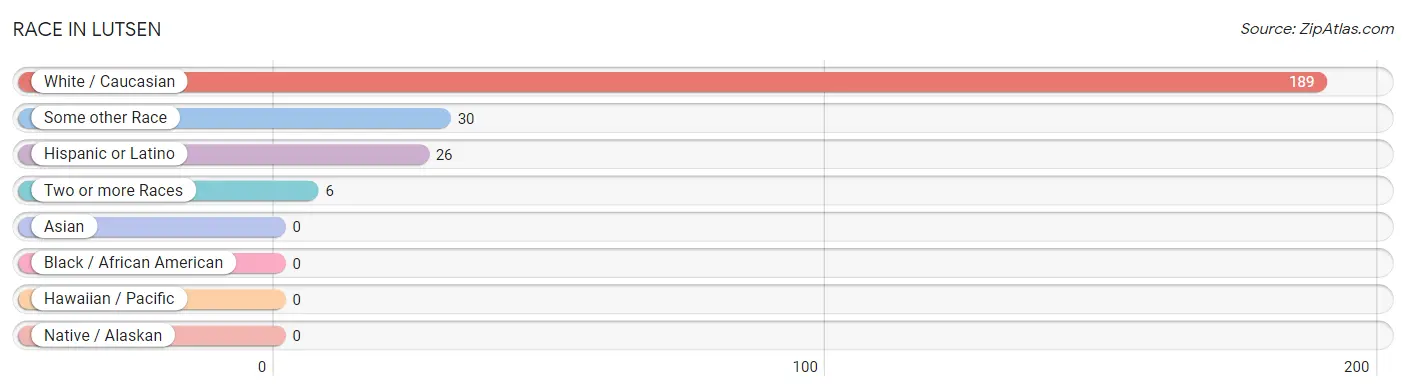
| Race | # Population | % Population |
| Asian | 0 | 0.0% |
| Black / African American | 0 | 0.0% |
| Hawaiian / Pacific | 0 | 0.0% |
| Hispanic or Latino | 26 | 11.6% |
| Native / Alaskan | 0 | 0.0% |
| White / Caucasian | 189 | 84.0% |
| Two or more Races | 6 | 2.7% |
| Some other Race | 30 | 13.3% |
| Total | 225 | 100.0% |
Ancestry in Lutsen
The most populous ancestries reported in Lutsen are German (74 | 32.9%), Norwegian (45 | 20.0%), Irish (40 | 17.8%), Mexican (26 | 11.6%), and Swedish (25 | 11.1%), together accounting for 93.3% of all Lutsen residents.
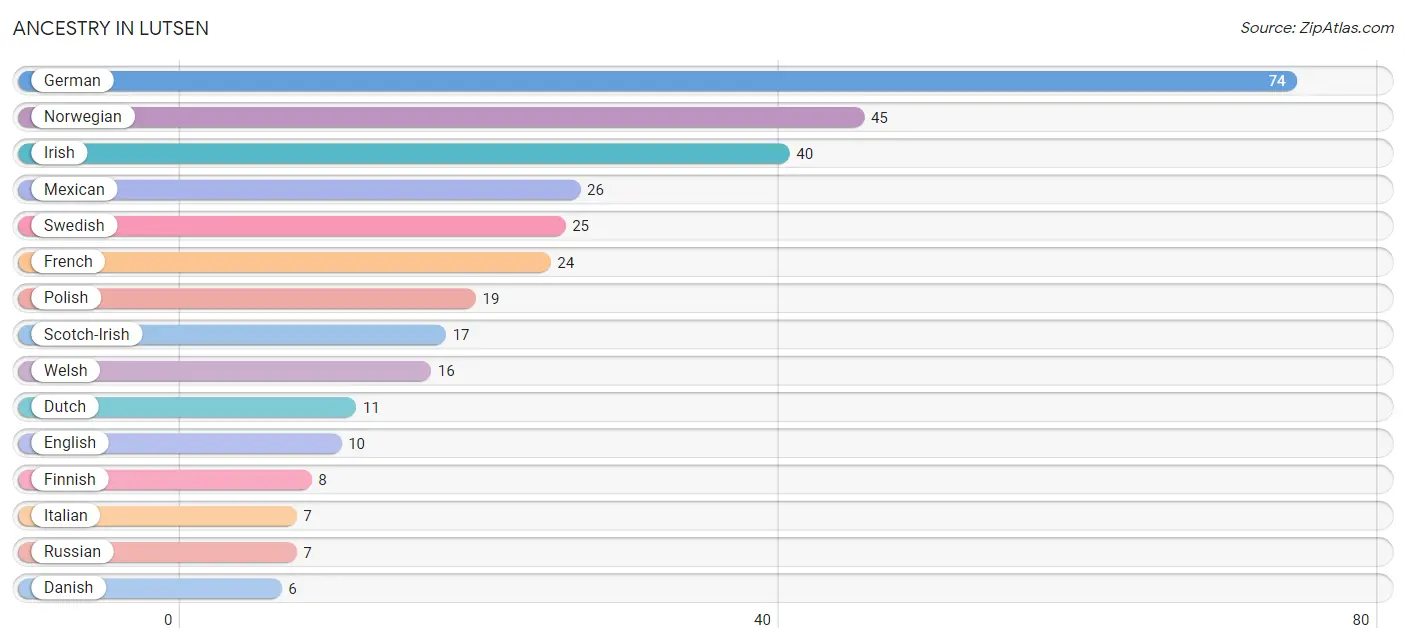
| Ancestry | # Population | % Population |
| American | 4 | 1.8% |
| Danish | 6 | 2.7% |
| Dutch | 11 | 4.9% |
| English | 10 | 4.4% |
| Finnish | 8 | 3.6% |
| French | 24 | 10.7% |
| French Canadian | 6 | 2.7% |
| German | 74 | 32.9% |
| Irish | 40 | 17.8% |
| Italian | 7 | 3.1% |
| Mexican | 26 | 11.6% |
| Norwegian | 45 | 20.0% |
| Polish | 19 | 8.4% |
| Russian | 7 | 3.1% |
| Scandinavian | 4 | 1.8% |
| Scotch-Irish | 17 | 7.6% |
| Swedish | 25 | 11.1% |
| Welsh | 16 | 7.1% | View All 18 Rows |
Immigrants in Lutsen
The most numerous immigrant groups reported in Lutsen came from Central America (26 | 11.6%), Latin America (26 | 11.6%), and Mexico (26 | 11.6%), together accounting for 34.7% of all Lutsen residents.
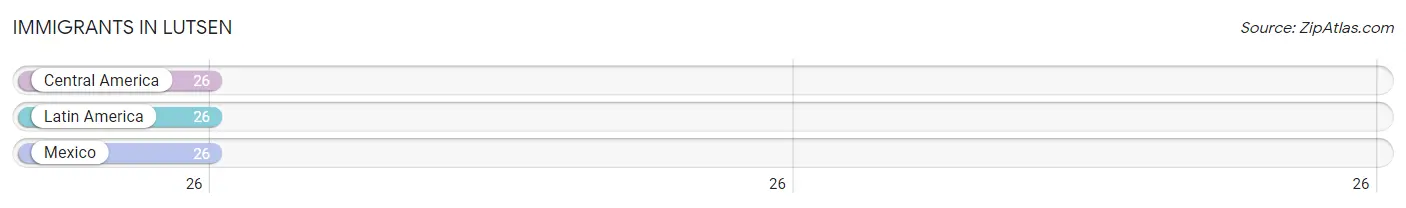
| Immigration Origin | # Population | % Population |
| Central America | 26 | 11.6% |
| Latin America | 26 | 11.6% |
| Mexico | 26 | 11.6% | View All 3 Rows |
Sex and Age in Lutsen
Sex and Age in Lutsen
The most populous age groups in Lutsen are 30 to 34 Years (28 | 23.7%) for men and 50 to 54 Years (32 | 29.9%) for women.
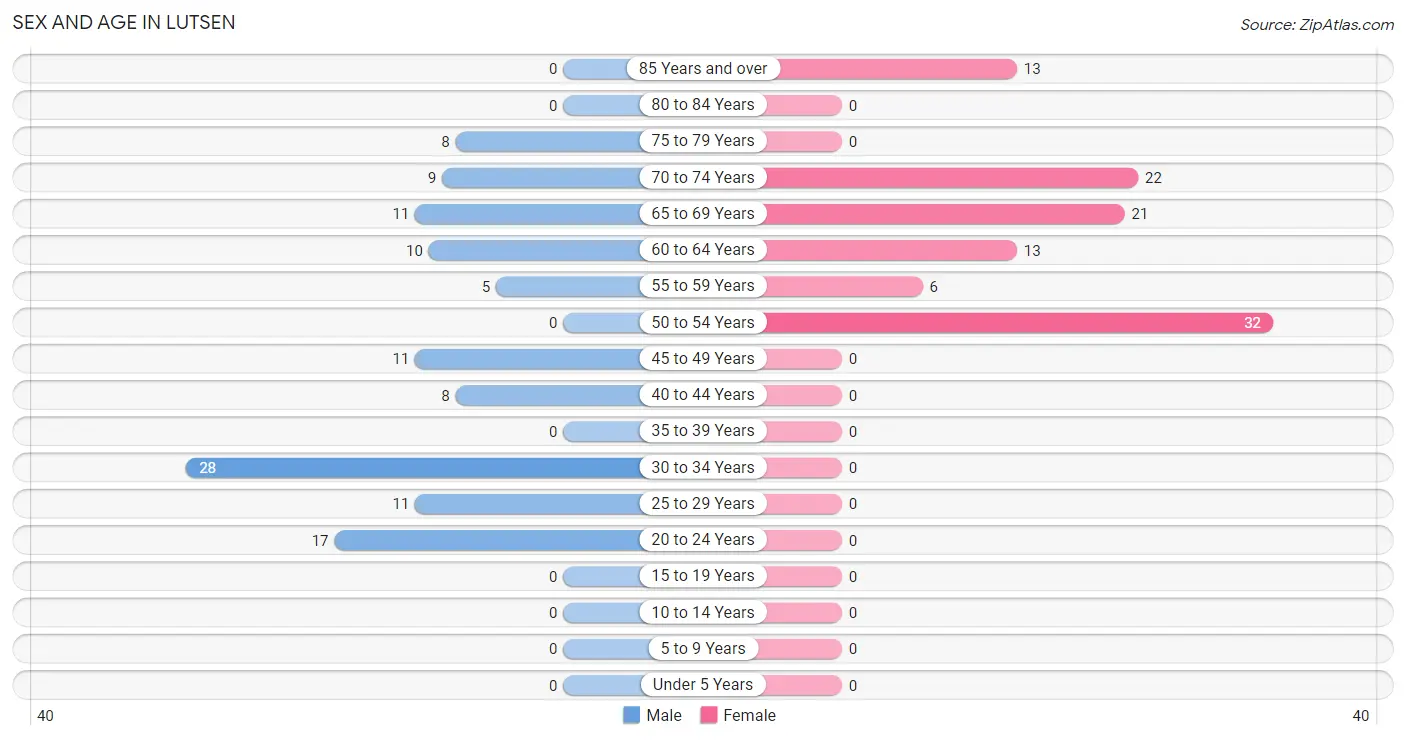
| Age Bracket | Male | Female |
| Under 5 Years | 0 (0.0%) | 0 (0.0%) |
| 5 to 9 Years | 0 (0.0%) | 0 (0.0%) |
| 10 to 14 Years | 0 (0.0%) | 0 (0.0%) |
| 15 to 19 Years | 0 (0.0%) | 0 (0.0%) |
| 20 to 24 Years | 17 (14.4%) | 0 (0.0%) |
| 25 to 29 Years | 11 (9.3%) | 0 (0.0%) |
| 30 to 34 Years | 28 (23.7%) | 0 (0.0%) |
| 35 to 39 Years | 0 (0.0%) | 0 (0.0%) |
| 40 to 44 Years | 8 (6.8%) | 0 (0.0%) |
| 45 to 49 Years | 11 (9.3%) | 0 (0.0%) |
| 50 to 54 Years | 0 (0.0%) | 32 (29.9%) |
| 55 to 59 Years | 5 (4.2%) | 6 (5.6%) |
| 60 to 64 Years | 10 (8.5%) | 13 (12.1%) |
| 65 to 69 Years | 11 (9.3%) | 21 (19.6%) |
| 70 to 74 Years | 9 (7.6%) | 22 (20.6%) |
| 75 to 79 Years | 8 (6.8%) | 0 (0.0%) |
| 80 to 84 Years | 0 (0.0%) | 0 (0.0%) |
| 85 Years and over | 0 (0.0%) | 13 (12.1%) |
| Total | 118 (100.0%) | 107 (100.0%) |
Families and Households in Lutsen
Median Family Size in Lutsen
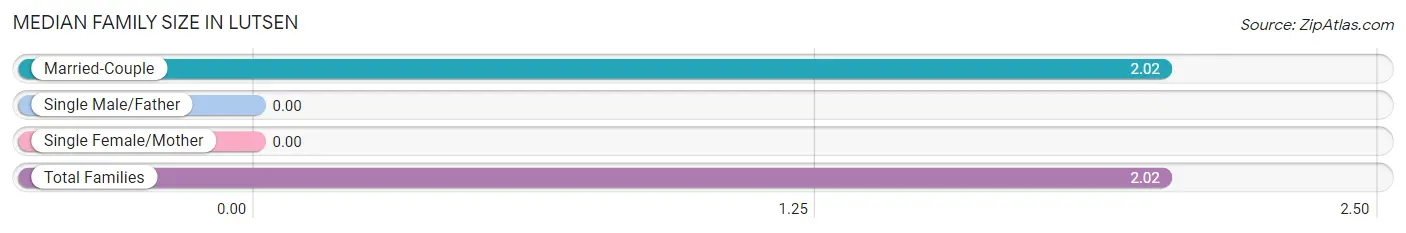
| Family Type | # Families | Family Size |
| Married-Couple | 42 (100.0%) | 2.02 |
| Single Male/Father | 0 (0.0%) | - |
| Single Female/Mother | 0 (0.0%) | - |
| Total Families | 42 (100.0%) | 2.02 |
Median Household Size in Lutsen
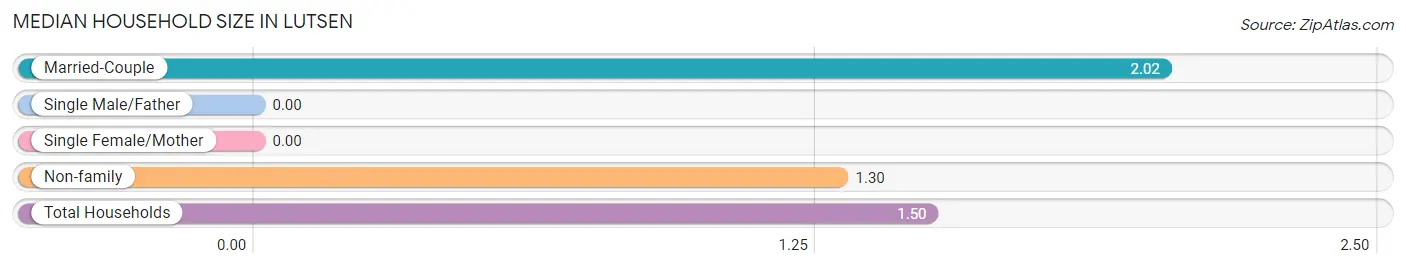
| Household Type | # Households | Household Size |
| Married-Couple | 42 (28.0%) | 2.02 |
| Single Male/Father | 0 (0.0%) | - |
| Single Female/Mother | 0 (0.0%) | - |
| Non-family | 108 (72.0%) | 1.30 |
| Total Households | 150 (100.0%) | 1.50 |
Household Size by Marriage Status in Lutsen
Out of a total of 150 households in Lutsen, 42 (28.0%) are family households, while 108 (72.0%) are nonfamily households. The most numerous type of family households are 2-person households, comprising 42, and the most common type of nonfamily households are 1-person households, comprising 73.
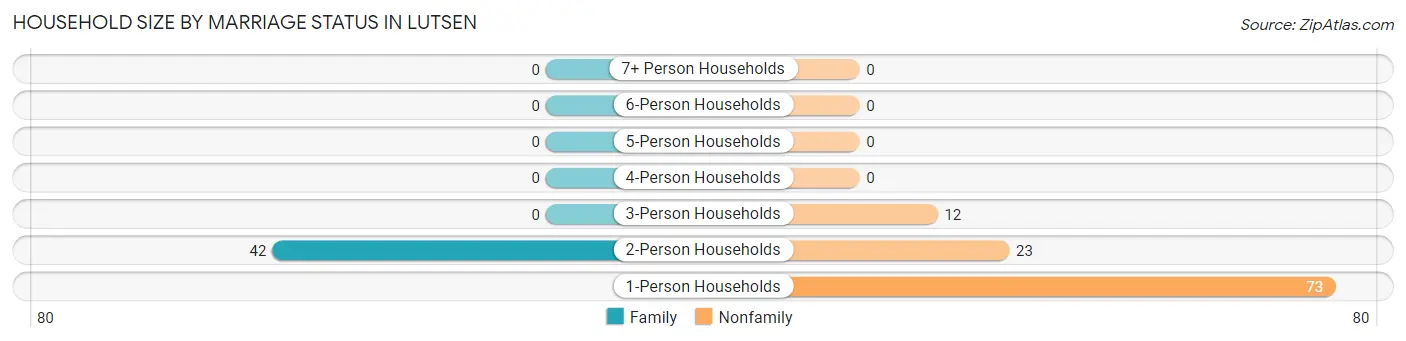
| Household Size | Family Households | Nonfamily Households |
| 1-Person Households | - | 73 (48.7%) |
| 2-Person Households | 42 (28.0%) | 23 (15.3%) |
| 3-Person Households | 0 (0.0%) | 12 (8.0%) |
| 4-Person Households | 0 (0.0%) | 0 (0.0%) |
| 5-Person Households | 0 (0.0%) | 0 (0.0%) |
| 6-Person Households | 0 (0.0%) | 0 (0.0%) |
| 7+ Person Households | 0 (0.0%) | 0 (0.0%) |
| Total | 42 (28.0%) | 108 (72.0%) |
Female Fertility in Lutsen
Fertility by Age in Lutsen
| Age Bracket | Women with Births | Births / 1,000 Women |
| 15 to 19 years | 0 (0.0%) | 0.0 |
| 20 to 34 years | 0 (0.0%) | 0.0 |
| 35 to 50 years | 0 (0.0%) | 0.0 |
| Total | 0 (0.0%) | 0.0 |
Fertility by Age by Marriage Status in Lutsen
| Age Bracket | Married | Unmarried |
| 15 to 19 years | 0 (0.0%) | 0 (0.0%) |
| 20 to 34 years | 0 (0.0%) | 0 (0.0%) |
| 35 to 50 years | 0 (0.0%) | 0 (0.0%) |
| Total | 0 (0.0%) | 0 (0.0%) |
Fertility by Education in Lutsen
| Educational Attainment | Women with Births | Births / 1,000 Women |
| Less than High School | 0 (0.0%) | 0.0 |
| High School Diploma | 0 (0.0%) | 0.0 |
| College or Associate's Degree | 0 (0.0%) | 0.0 |
| Bachelor's Degree | 0 (0.0%) | 0.0 |
| Graduate Degree | 0 (0.0%) | 0.0 |
| Total | 0 (0.0%) | 0.0 |
Fertility by Education by Marriage Status in Lutsen
| Educational Attainment | Married | Unmarried |
| Less than High School | 0 (0.0%) | 0 (0.0%) |
| High School Diploma | 0 (0.0%) | 0 (0.0%) |
| College or Associate's Degree | 0 (0.0%) | 0 (0.0%) |
| Bachelor's Degree | 0 (0.0%) | 0 (0.0%) |
| Graduate Degree | 0 (0.0%) | 0 (0.0%) |
| Total | 0 (0.0%) | 0 (0.0%) |
Employment Characteristics in Lutsen
Employment by Class of Employer in Lutsen
Among the 131 employed individuals in Lutsen, private company employees (78 | 59.5%), local government employees (18 | 13.7%), and self-employed (not incorporated) (15 | 11.5%) make up the most common classes of employment.
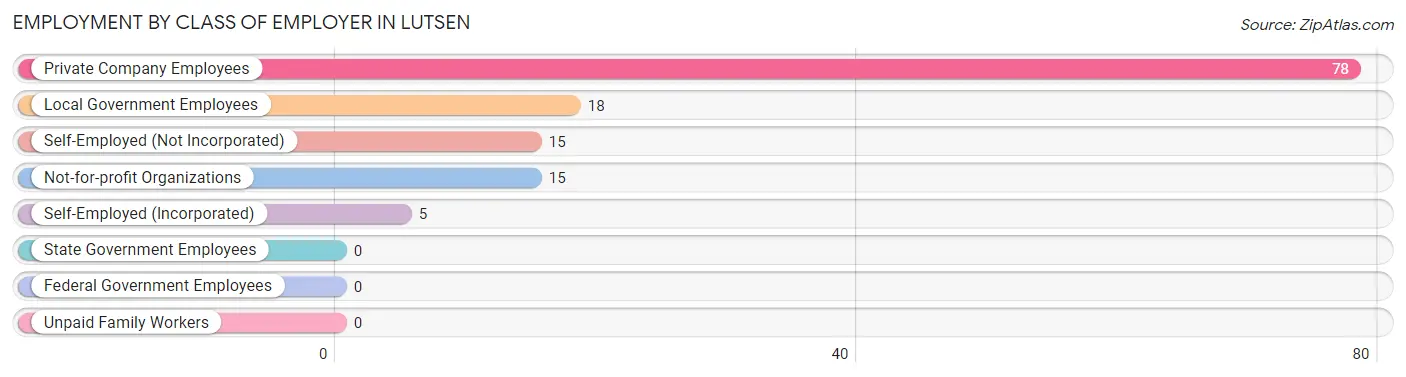
| Employer Class | # Employees | % Employees |
| Private Company Employees | 78 | 59.5% |
| Self-Employed (Incorporated) | 5 | 3.8% |
| Self-Employed (Not Incorporated) | 15 | 11.5% |
| Not-for-profit Organizations | 15 | 11.5% |
| Local Government Employees | 18 | 13.7% |
| State Government Employees | 0 | 0.0% |
| Federal Government Employees | 0 | 0.0% |
| Unpaid Family Workers | 0 | 0.0% |
| Total | 131 | 100.0% |
Employment Status by Age in Lutsen
According to the labor force statistics for Lutsen, out of the total population over 16 years of age (225), 61.8% or 139 individuals are in the labor force, with 5.8% or 8 of them unemployed. The age group with the highest labor force participation rate is 20 to 24 years, with 100.0% or 17 individuals in the labor force. Within the labor force, the 35 to 44 years age range has the highest percentage of unemployed individuals, with 100.0% or 8 of them being unemployed.
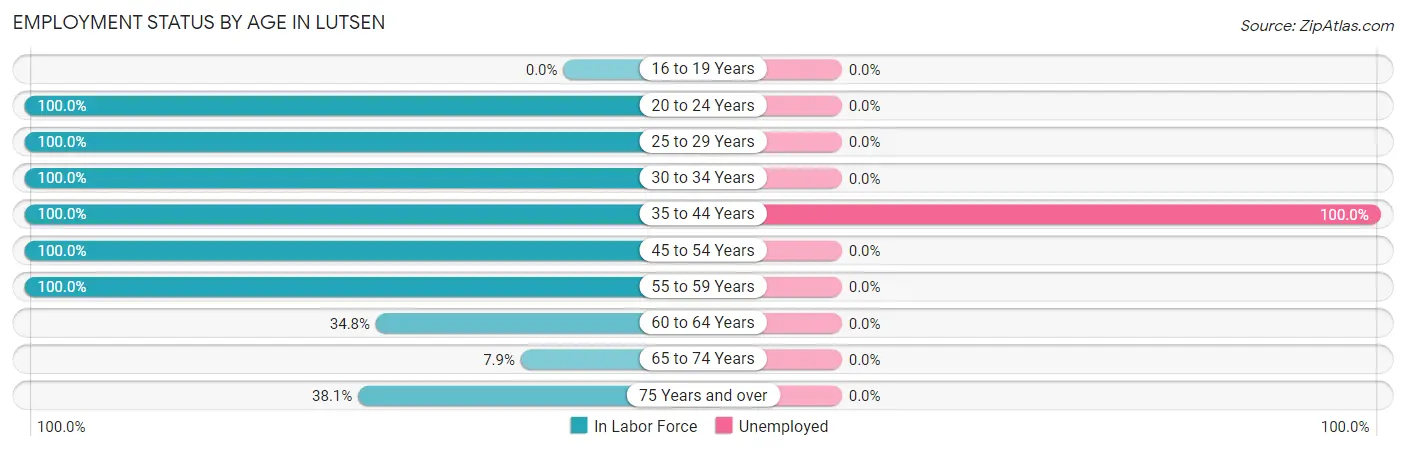
| Age Bracket | In Labor Force | Unemployed |
| 16 to 19 Years | 0 (0.0%) | 0 (0.0%) |
| 20 to 24 Years | 17 (100.0%) | 0 (0.0%) |
| 25 to 29 Years | 11 (100.0%) | 0 (0.0%) |
| 30 to 34 Years | 28 (100.0%) | 0 (0.0%) |
| 35 to 44 Years | 8 (100.0%) | 8 (100.0%) |
| 45 to 54 Years | 43 (100.0%) | 0 (0.0%) |
| 55 to 59 Years | 11 (100.0%) | 0 (0.0%) |
| 60 to 64 Years | 8 (34.8%) | 0 (0.0%) |
| 65 to 74 Years | 5 (7.9%) | 0 (0.0%) |
| 75 Years and over | 8 (38.1%) | 0 (0.0%) |
| Total | 139 (61.8%) | 8 (5.8%) |
Employment Status by Educational Attainment in Lutsen
According to labor force statistics for Lutsen, 87.9% of individuals (109) out of the total population between 25 and 64 years of age (124) are in the labor force, with 7.3% or 8 of them being unemployed. The group with the highest labor force participation rate are those with the educational attainment of college / associate degree, with 100.0% or 21 individuals in the labor force. Within the labor force, individuals with high school diploma education have the highest percentage of unemployment, with 32.0% or 8 of them being unemployed.
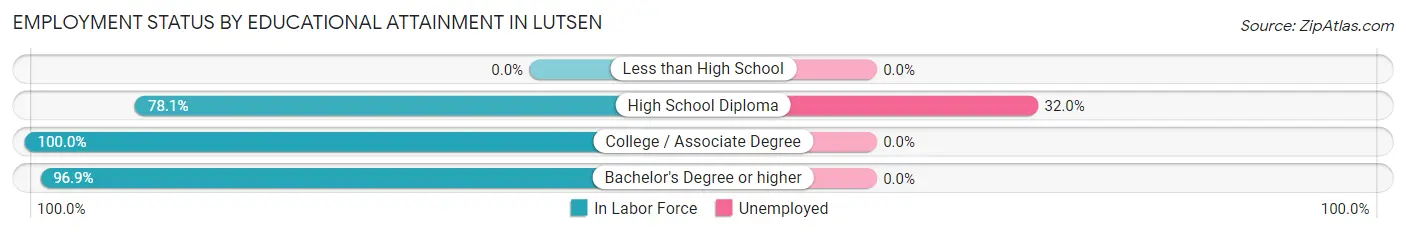
| Educational Attainment | In Labor Force | Unemployed |
| Less than High School | 0 (0.0%) | 0 (0.0%) |
| High School Diploma | 25 (78.1%) | 10 (32.0%) |
| College / Associate Degree | 21 (100.0%) | 0 (0.0%) |
| Bachelor's Degree or higher | 63 (96.9%) | 0 (0.0%) |
| Total | 109 (87.9%) | 9 (7.3%) |
Employment Occupations by Sex in Lutsen
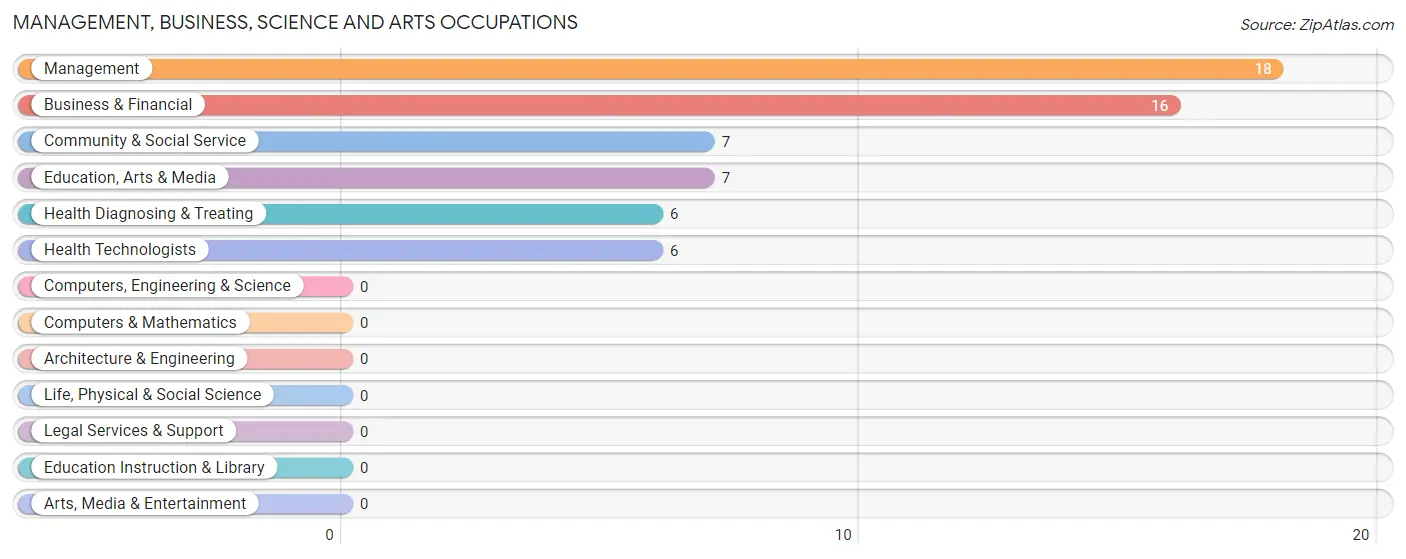
Management, Business, Science and Arts Occupations
The most common Management, Business, Science and Arts occupations in Lutsen are Management (18 | 13.7%), Business & Financial (16 | 12.2%), Community & Social Service (7 | 5.3%), Education, Arts & Media (7 | 5.3%), and Health Diagnosing & Treating (6 | 4.6%).
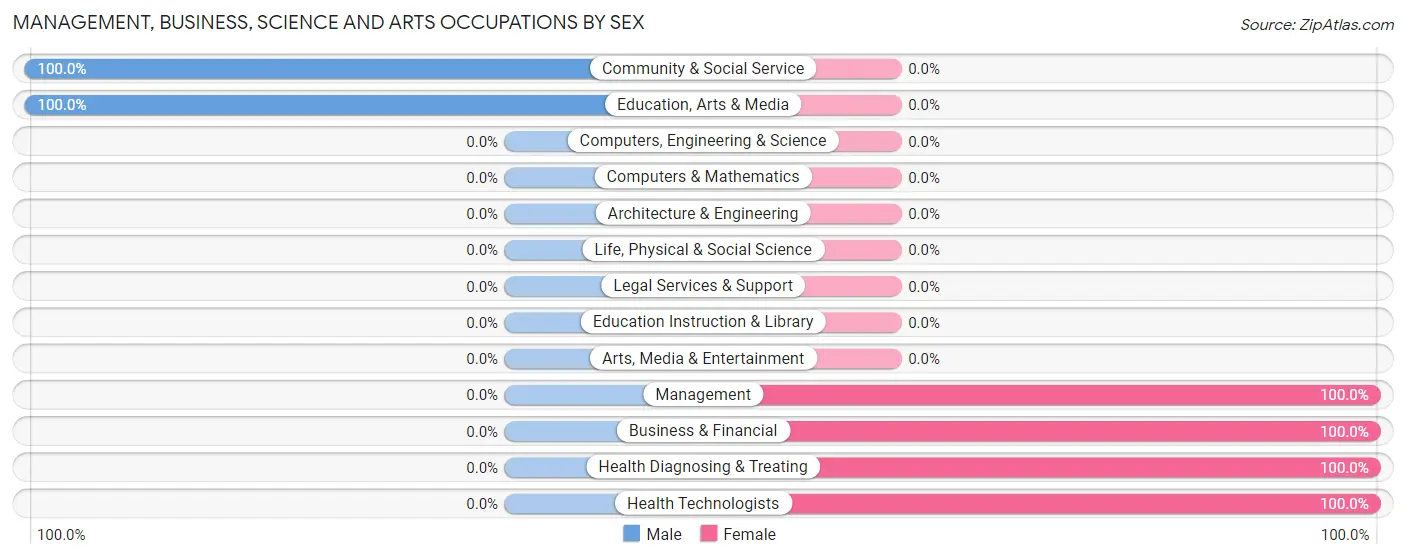
Management, Business, Science and Arts Occupations by Sex
Within the Management, Business, Science and Arts occupations in Lutsen, the most male-oriented occupations are Community & Social Service (100.0%), and Education, Arts & Media (100.0%), while the most female-oriented occupations are Management (100.0%), Business & Financial (100.0%), and Health Diagnosing & Treating (100.0%).
| Occupation | Male | Female |
| Management | 0 (0.0%) | 18 (100.0%) |
| Business & Financial | 0 (0.0%) | 16 (100.0%) |
| Computers, Engineering & Science | 0 (0.0%) | 0 (0.0%) |
| Computers & Mathematics | 0 (0.0%) | 0 (0.0%) |
| Architecture & Engineering | 0 (0.0%) | 0 (0.0%) |
| Life, Physical & Social Science | 0 (0.0%) | 0 (0.0%) |
| Community & Social Service | 7 (100.0%) | 0 (0.0%) |
| Education, Arts & Media | 7 (100.0%) | 0 (0.0%) |
| Legal Services & Support | 0 (0.0%) | 0 (0.0%) |
| Education Instruction & Library | 0 (0.0%) | 0 (0.0%) |
| Arts, Media & Entertainment | 0 (0.0%) | 0 (0.0%) |
| Health Diagnosing & Treating | 0 (0.0%) | 6 (100.0%) |
| Health Technologists | 0 (0.0%) | 6 (100.0%) |
| Total (Category) | 7 (14.9%) | 40 (85.1%) |
| Total (Overall) | 85 (64.9%) | 46 (35.1%) |
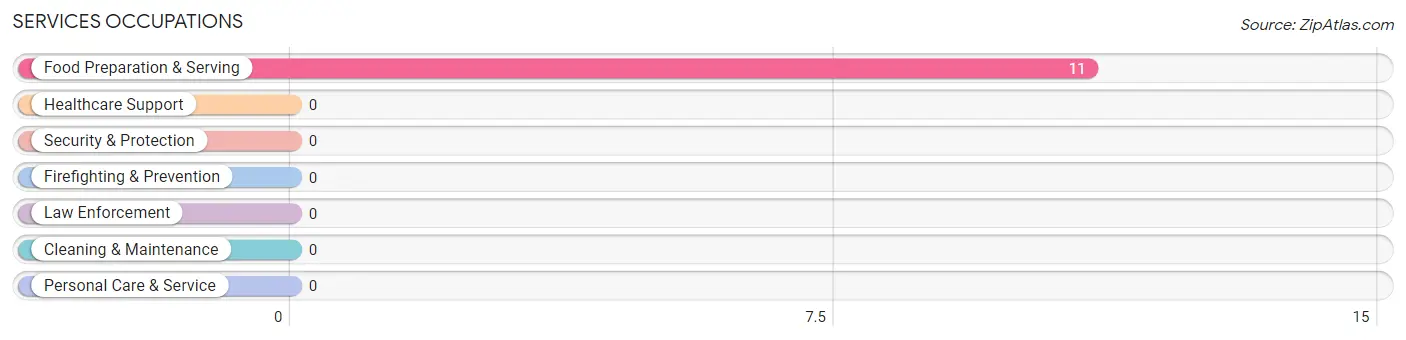
Services Occupations
The most common Services occupations in Lutsen are , and Food Preparation & Serving (11 | 8.4%).
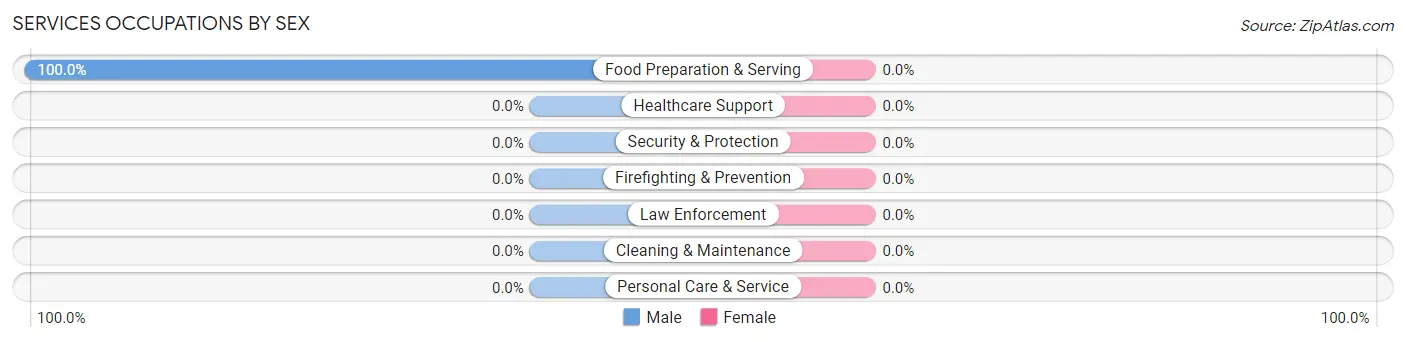
Services Occupations by Sex
| Occupation | Male | Female |
| Healthcare Support | 0 (0.0%) | 0 (0.0%) |
| Security & Protection | 0 (0.0%) | 0 (0.0%) |
| Firefighting & Prevention | 0 (0.0%) | 0 (0.0%) |
| Law Enforcement | 0 (0.0%) | 0 (0.0%) |
| Food Preparation & Serving | 11 (100.0%) | 0 (0.0%) |
| Cleaning & Maintenance | 0 (0.0%) | 0 (0.0%) |
| Personal Care & Service | 0 (0.0%) | 0 (0.0%) |
| Total (Category) | 11 (100.0%) | 0 (0.0%) |
| Total (Overall) | 85 (64.9%) | 46 (35.1%) |
Sales and Office Occupations
The most common Sales and Office occupations in Lutsen are Sales & Related (28 | 21.4%), and Office & Administration (17 | 13.0%).
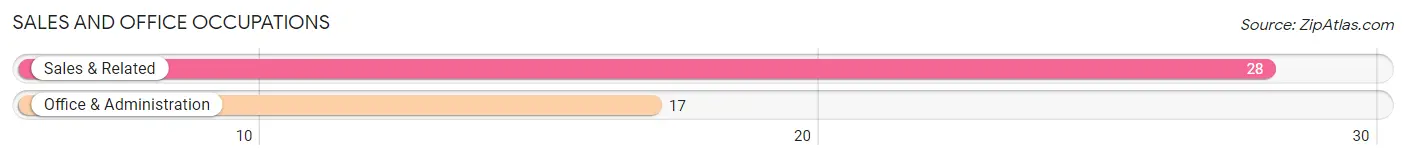
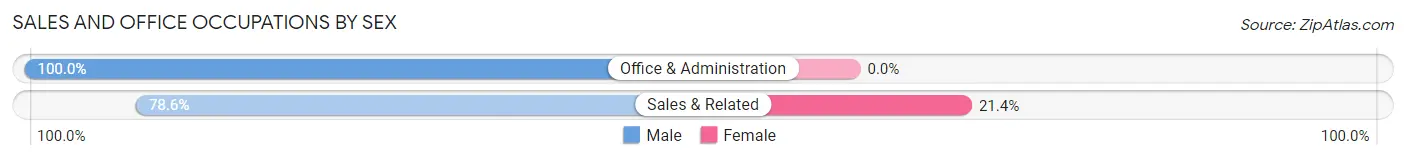
Sales and Office Occupations by Sex
| Occupation | Male | Female |
| Sales & Related | 22 (78.6%) | 6 (21.4%) |
| Office & Administration | 17 (100.0%) | 0 (0.0%) |
| Total (Category) | 39 (86.7%) | 6 (13.3%) |
| Total (Overall) | 85 (64.9%) | 46 (35.1%) |
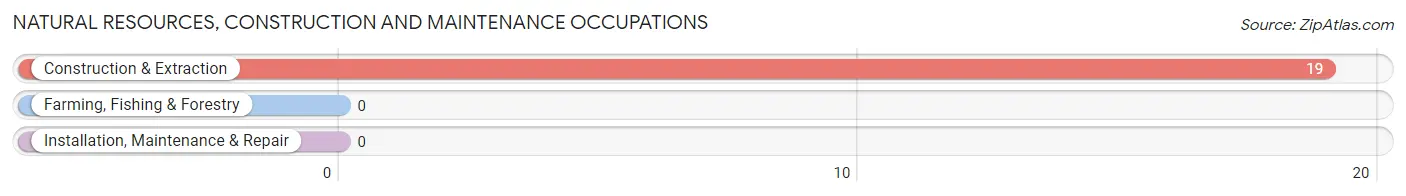
Natural Resources, Construction and Maintenance Occupations
The most common Natural Resources, Construction and Maintenance occupations in Lutsen are , and Construction & Extraction (19 | 14.5%).
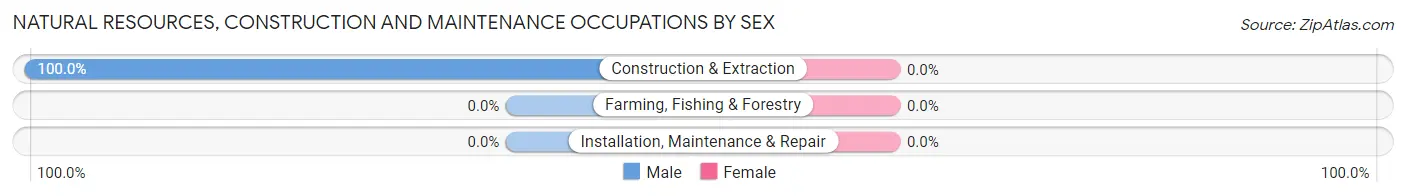
Natural Resources, Construction and Maintenance Occupations by Sex
| Occupation | Male | Female |
| Farming, Fishing & Forestry | 0 (0.0%) | 0 (0.0%) |
| Construction & Extraction | 19 (100.0%) | 0 (0.0%) |
| Installation, Maintenance & Repair | 0 (0.0%) | 0 (0.0%) |
| Total (Category) | 19 (100.0%) | 0 (0.0%) |
| Total (Overall) | 85 (64.9%) | 46 (35.1%) |
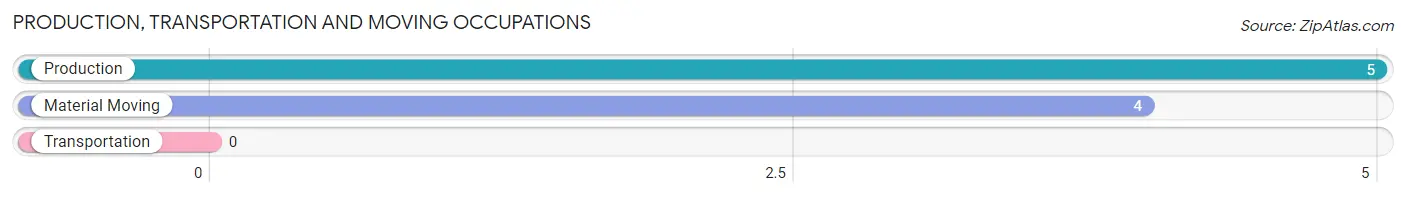
Production, Transportation and Moving Occupations
The most common Production, Transportation and Moving occupations in Lutsen are Production (5 | 3.8%), and Material Moving (4 | 3.0%).
Production, Transportation and Moving Occupations by Sex
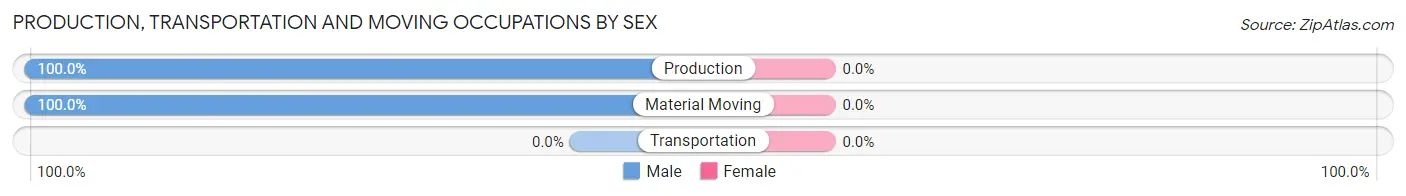
| Occupation | Male | Female |
| Production | 5 (100.0%) | 0 (0.0%) |
| Transportation | 0 (0.0%) | 0 (0.0%) |
| Material Moving | 4 (100.0%) | 0 (0.0%) |
| Total (Category) | 9 (100.0%) | 0 (0.0%) |
| Total (Overall) | 85 (64.9%) | 46 (35.1%) |
Employment Industries by Sex in Lutsen
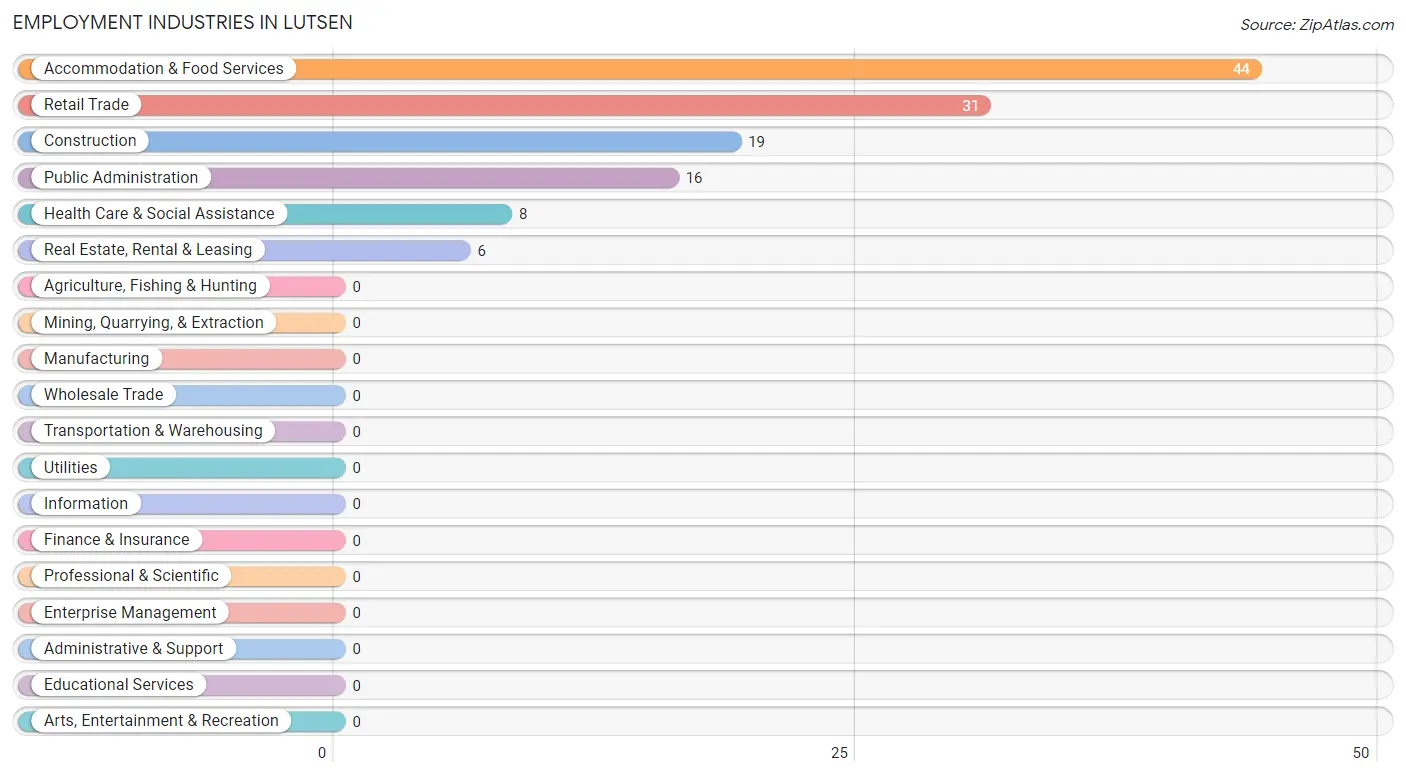
Employment Industries in Lutsen
The major employment industries in Lutsen include Accommodation & Food Services (44 | 33.6%), Retail Trade (31 | 23.7%), Construction (19 | 14.5%), Public Administration (16 | 12.2%), and Health Care & Social Assistance (8 | 6.1%).
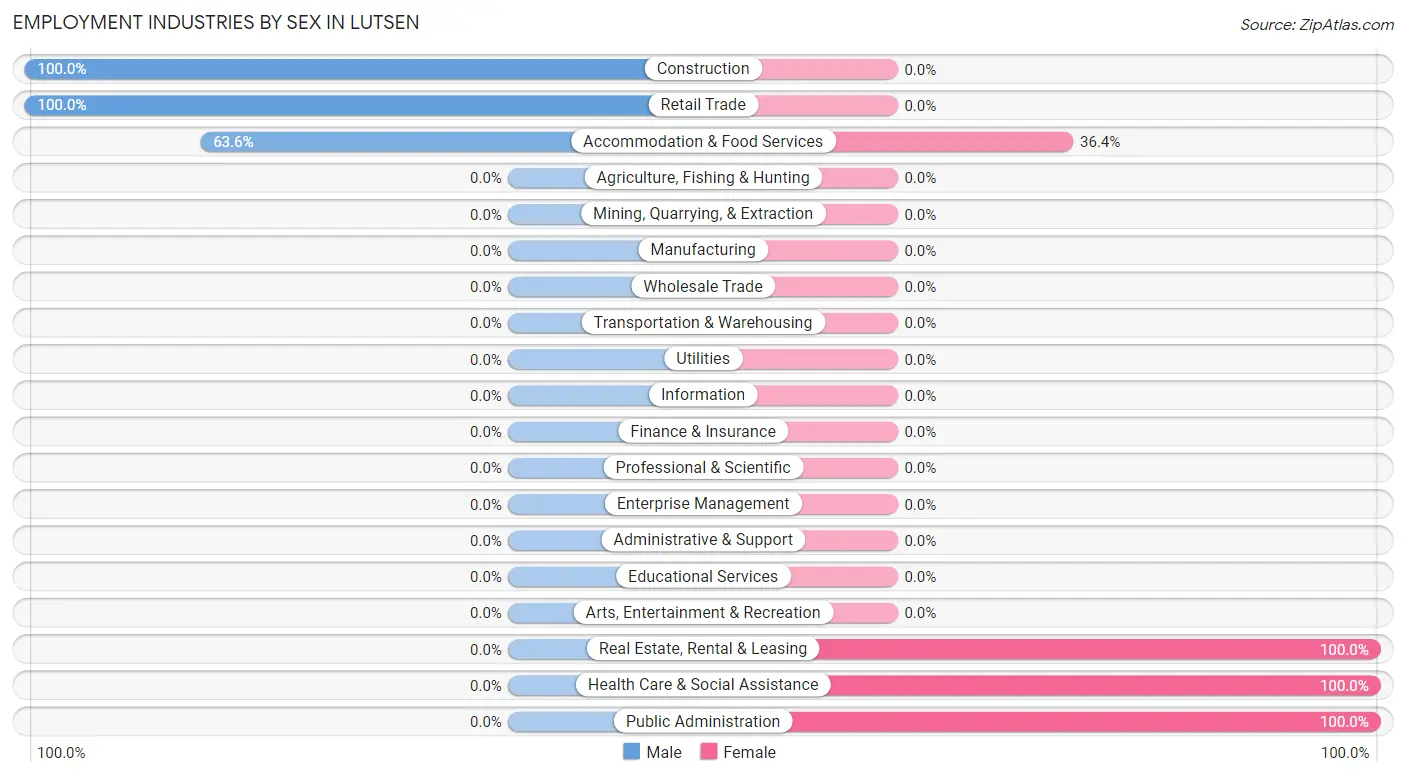
Employment Industries by Sex in Lutsen
The Lutsen industries that see more men than women are Construction (100.0%), Retail Trade (100.0%), and Accommodation & Food Services (63.6%), whereas the industries that tend to have a higher number of women are Real Estate, Rental & Leasing (100.0%), Health Care & Social Assistance (100.0%), and Public Administration (100.0%).
| Industry | Male | Female |
| Agriculture, Fishing & Hunting | 0 (0.0%) | 0 (0.0%) |
| Mining, Quarrying, & Extraction | 0 (0.0%) | 0 (0.0%) |
| Construction | 19 (100.0%) | 0 (0.0%) |
| Manufacturing | 0 (0.0%) | 0 (0.0%) |
| Wholesale Trade | 0 (0.0%) | 0 (0.0%) |
| Retail Trade | 31 (100.0%) | 0 (0.0%) |
| Transportation & Warehousing | 0 (0.0%) | 0 (0.0%) |
| Utilities | 0 (0.0%) | 0 (0.0%) |
| Information | 0 (0.0%) | 0 (0.0%) |
| Finance & Insurance | 0 (0.0%) | 0 (0.0%) |
| Real Estate, Rental & Leasing | 0 (0.0%) | 6 (100.0%) |
| Professional & Scientific | 0 (0.0%) | 0 (0.0%) |
| Enterprise Management | 0 (0.0%) | 0 (0.0%) |
| Administrative & Support | 0 (0.0%) | 0 (0.0%) |
| Educational Services | 0 (0.0%) | 0 (0.0%) |
| Health Care & Social Assistance | 0 (0.0%) | 8 (100.0%) |
| Arts, Entertainment & Recreation | 0 (0.0%) | 0 (0.0%) |
| Accommodation & Food Services | 28 (63.6%) | 16 (36.4%) |
| Public Administration | 0 (0.0%) | 16 (100.0%) |
| Total | 85 (64.9%) | 46 (35.1%) |
Education in Lutsen
School Enrollment in Lutsen
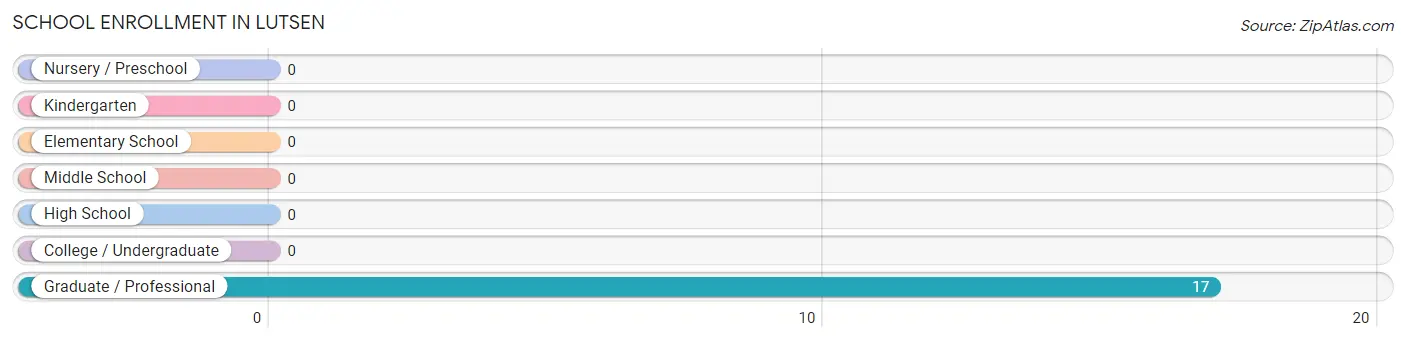
| School Level | # Students | % Students |
| Nursery / Preschool | 0 | 0.0% |
| Kindergarten | 0 | 0.0% |
| Elementary School | 0 | 0.0% |
| Middle School | 0 | 0.0% |
| High School | 0 | 0.0% |
| College / Undergraduate | 0 | 0.0% |
| Graduate / Professional | 17 | 100.0% |
| Total | 17 | 100.0% |
School Enrollment by Age by Funding Source in Lutsen
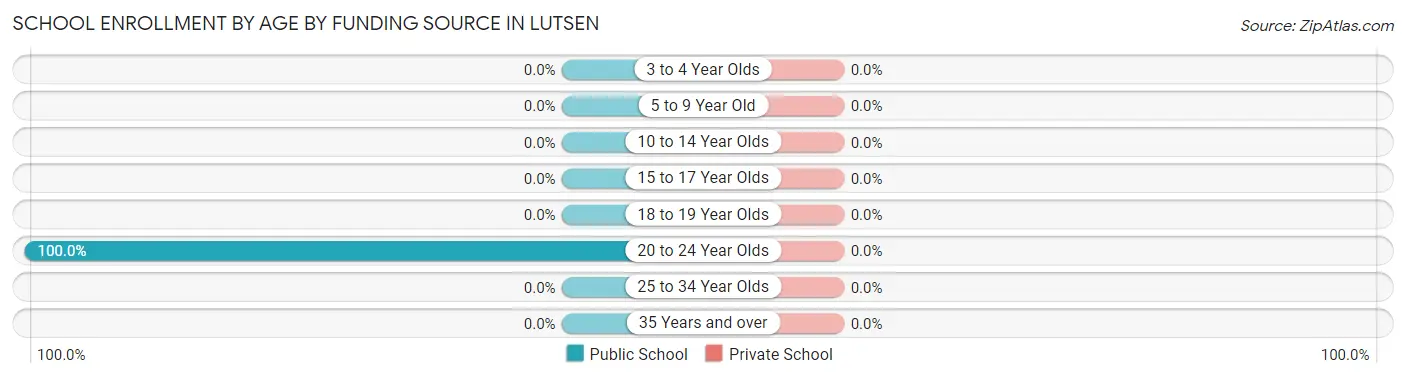
| Age Bracket | Public School | Private School |
| 3 to 4 Year Olds | 0 (0.0%) | 0 (0.0%) |
| 5 to 9 Year Old | 0 (0.0%) | 0 (0.0%) |
| 10 to 14 Year Olds | 0 (0.0%) | 0 (0.0%) |
| 15 to 17 Year Olds | 0 (0.0%) | 0 (0.0%) |
| 18 to 19 Year Olds | 0 (0.0%) | 0 (0.0%) |
| 20 to 24 Year Olds | 17 (100.0%) | 0 (0.0%) |
| 25 to 34 Year Olds | 0 (0.0%) | 0 (0.0%) |
| 35 Years and over | 0 (0.0%) | 0 (0.0%) |
| Total | 17 (100.0%) | 0 (0.0%) |
Educational Attainment by Field of Study in Lutsen
Business (23 | 18.5%), computers & mathematics (21 | 16.9%), education (17 | 13.7%), literature & languages (16 | 12.9%), and bio, nature & agricultural (15 | 12.1%) are the most common fields of study among 124 individuals in Lutsen who have obtained a bachelor's degree or higher.
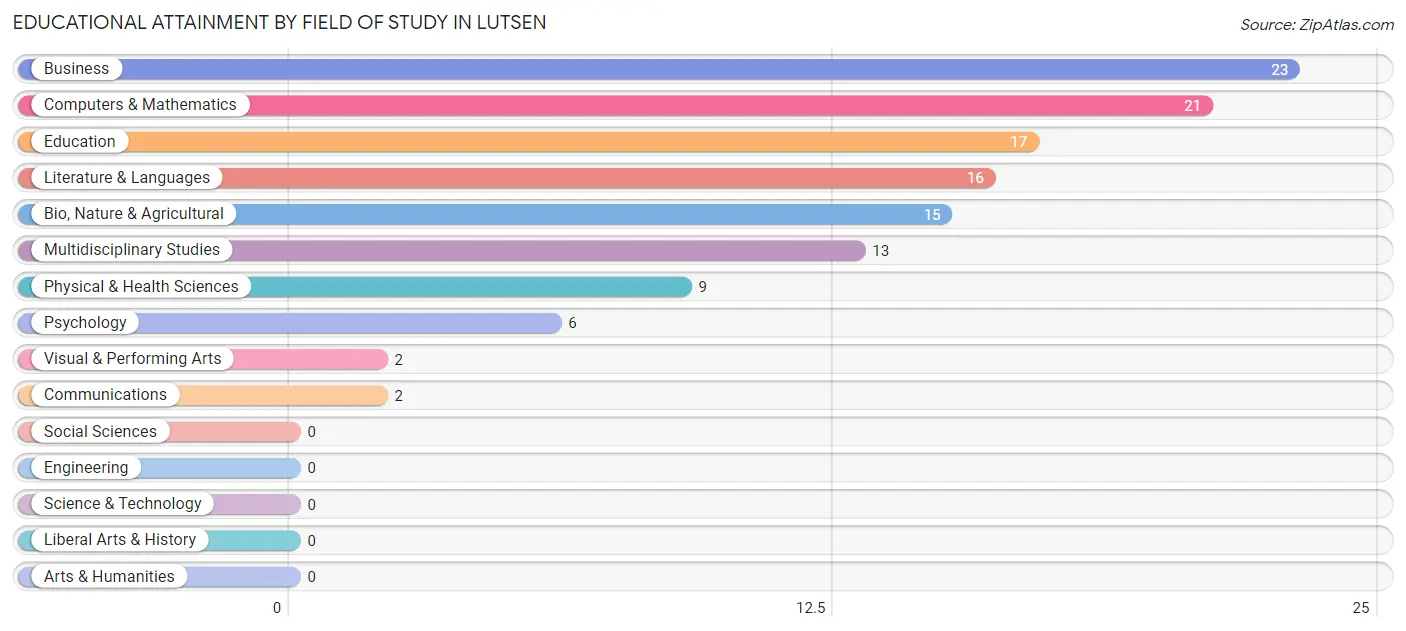
| Field of Study | # Graduates | % Graduates |
| Computers & Mathematics | 21 | 16.9% |
| Bio, Nature & Agricultural | 15 | 12.1% |
| Physical & Health Sciences | 9 | 7.3% |
| Psychology | 6 | 4.8% |
| Social Sciences | 0 | 0.0% |
| Engineering | 0 | 0.0% |
| Multidisciplinary Studies | 13 | 10.5% |
| Science & Technology | 0 | 0.0% |
| Business | 23 | 18.5% |
| Education | 17 | 13.7% |
| Literature & Languages | 16 | 12.9% |
| Liberal Arts & History | 0 | 0.0% |
| Visual & Performing Arts | 2 | 1.6% |
| Communications | 2 | 1.6% |
| Arts & Humanities | 0 | 0.0% |
| Total | 124 | 100.0% |
Transportation & Commute in Lutsen
Vehicle Availability by Sex in Lutsen
The most prevalent vehicle ownership categories in Lutsen are males with 1 vehicle (32, accounting for 37.7%) and females with 1 vehicle (22, making up 69.6%).
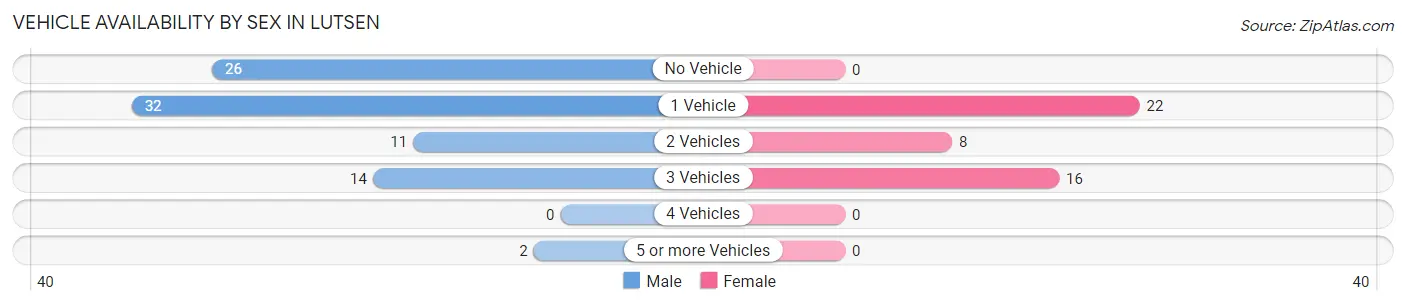
| Vehicles Available | Male | Female |
| No Vehicle | 26 (30.6%) | 0 (0.0%) |
| 1 Vehicle | 32 (37.7%) | 22 (47.8%) |
| 2 Vehicles | 11 (12.9%) | 8 (17.4%) |
| 3 Vehicles | 14 (16.5%) | 16 (34.8%) |
| 4 Vehicles | 0 (0.0%) | 0 (0.0%) |
| 5 or more Vehicles | 2 (2.4%) | 0 (0.0%) |
| Total | 85 (100.0%) | 46 (100.0%) |
Commute Time in Lutsen
The most frequently occuring commute durations in Lutsen are 5 to 9 minutes (90 commuters, 81.1%), 20 to 24 minutes (12 commuters, 10.8%), and less than 5 minutes (5 commuters, 4.5%).
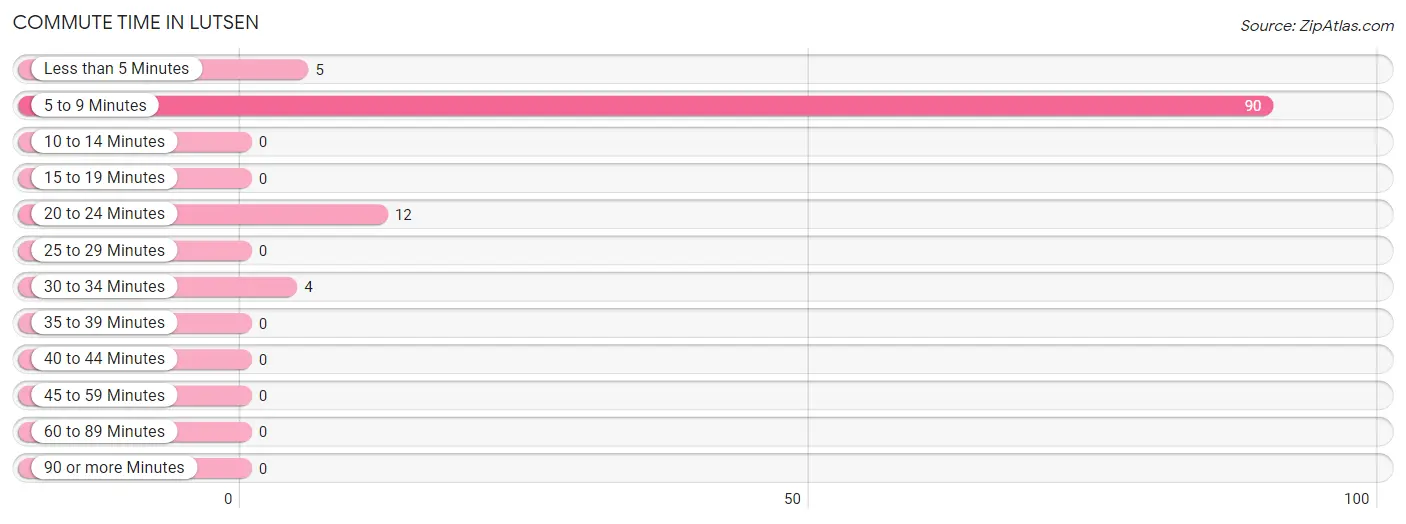
| Commute Time | # Commuters | % Commuters |
| Less than 5 Minutes | 5 | 4.5% |
| 5 to 9 Minutes | 90 | 81.1% |
| 10 to 14 Minutes | 0 | 0.0% |
| 15 to 19 Minutes | 0 | 0.0% |
| 20 to 24 Minutes | 12 | 10.8% |
| 25 to 29 Minutes | 0 | 0.0% |
| 30 to 34 Minutes | 4 | 3.6% |
| 35 to 39 Minutes | 0 | 0.0% |
| 40 to 44 Minutes | 0 | 0.0% |
| 45 to 59 Minutes | 0 | 0.0% |
| 60 to 89 Minutes | 0 | 0.0% |
| 90 or more Minutes | 0 | 0.0% |
Commute Time by Sex in Lutsen
The most common commute times in Lutsen are 5 to 9 minutes (72 commuters, 88.9%) for males and 5 to 9 minutes (18 commuters, 60.0%) for females.
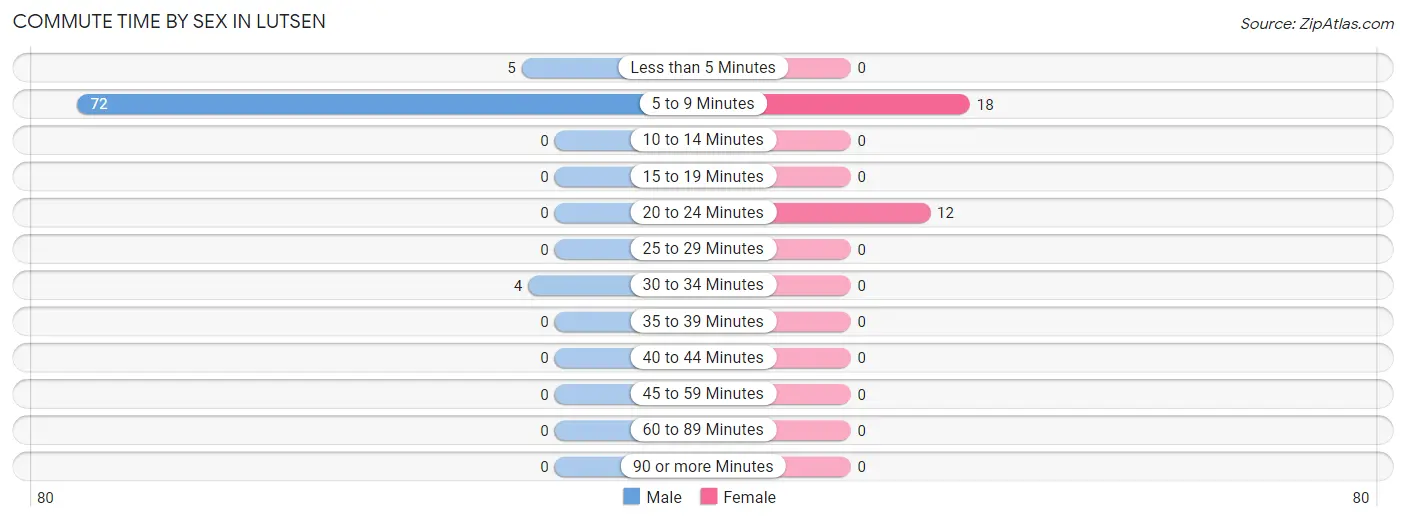
| Commute Time | Male | Female |
| Less than 5 Minutes | 5 (6.2%) | 0 (0.0%) |
| 5 to 9 Minutes | 72 (88.9%) | 18 (60.0%) |
| 10 to 14 Minutes | 0 (0.0%) | 0 (0.0%) |
| 15 to 19 Minutes | 0 (0.0%) | 0 (0.0%) |
| 20 to 24 Minutes | 0 (0.0%) | 12 (40.0%) |
| 25 to 29 Minutes | 0 (0.0%) | 0 (0.0%) |
| 30 to 34 Minutes | 4 (4.9%) | 0 (0.0%) |
| 35 to 39 Minutes | 0 (0.0%) | 0 (0.0%) |
| 40 to 44 Minutes | 0 (0.0%) | 0 (0.0%) |
| 45 to 59 Minutes | 0 (0.0%) | 0 (0.0%) |
| 60 to 89 Minutes | 0 (0.0%) | 0 (0.0%) |
| 90 or more Minutes | 0 (0.0%) | 0 (0.0%) |
Time of Departure to Work by Sex in Lutsen
The most frequent times of departure to work in Lutsen are 7:30 AM to 7:59 AM (32, 39.5%) for males and 8:00 AM to 8:29 AM (24, 80.0%) for females.
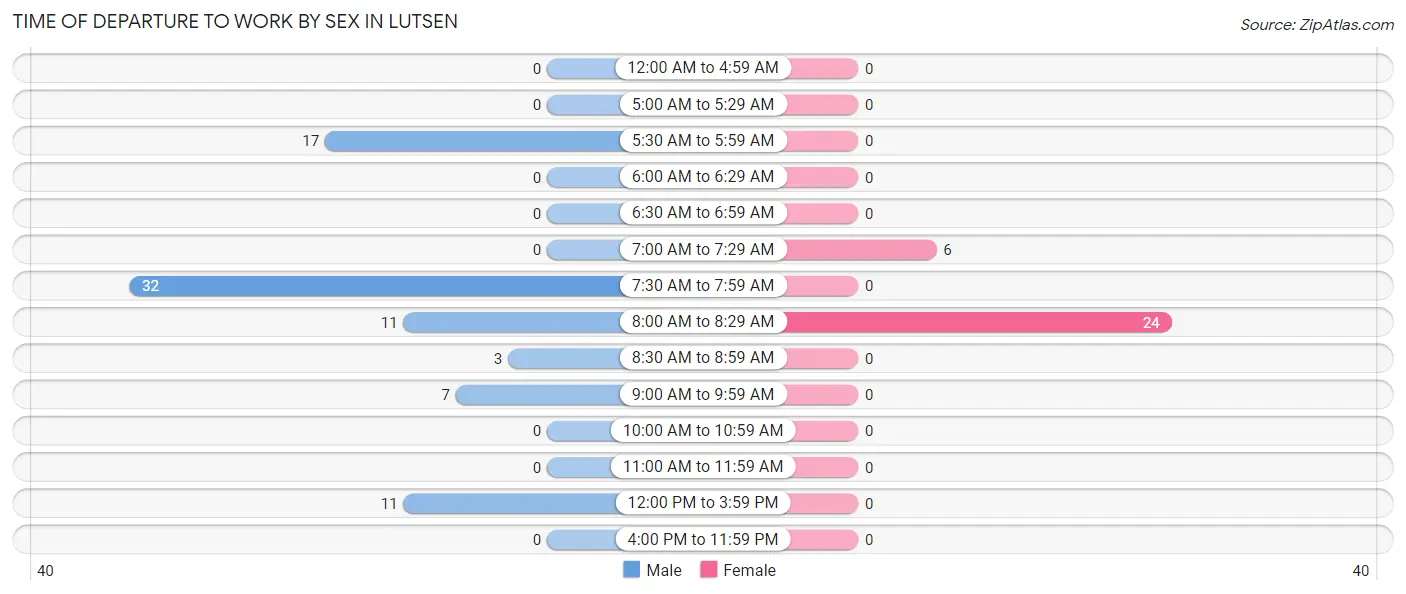
| Time of Departure | Male | Female |
| 12:00 AM to 4:59 AM | 0 (0.0%) | 0 (0.0%) |
| 5:00 AM to 5:29 AM | 0 (0.0%) | 0 (0.0%) |
| 5:30 AM to 5:59 AM | 17 (21.0%) | 0 (0.0%) |
| 6:00 AM to 6:29 AM | 0 (0.0%) | 0 (0.0%) |
| 6:30 AM to 6:59 AM | 0 (0.0%) | 0 (0.0%) |
| 7:00 AM to 7:29 AM | 0 (0.0%) | 6 (20.0%) |
| 7:30 AM to 7:59 AM | 32 (39.5%) | 0 (0.0%) |
| 8:00 AM to 8:29 AM | 11 (13.6%) | 24 (80.0%) |
| 8:30 AM to 8:59 AM | 3 (3.7%) | 0 (0.0%) |
| 9:00 AM to 9:59 AM | 7 (8.6%) | 0 (0.0%) |
| 10:00 AM to 10:59 AM | 0 (0.0%) | 0 (0.0%) |
| 11:00 AM to 11:59 AM | 0 (0.0%) | 0 (0.0%) |
| 12:00 PM to 3:59 PM | 11 (13.6%) | 0 (0.0%) |
| 4:00 PM to 11:59 PM | 0 (0.0%) | 0 (0.0%) |
| Total | 81 (100.0%) | 30 (100.0%) |
Housing Occupancy in Lutsen
Occupancy by Ownership in Lutsen
Of the total 150 dwellings in Lutsen, owner-occupied units account for 100 (66.7%), while renter-occupied units make up 50 (33.3%).
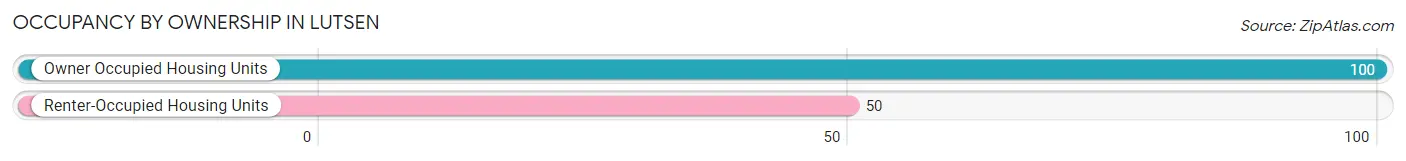
| Occupancy | # Housing Units | % Housing Units |
| Owner Occupied Housing Units | 100 | 66.7% |
| Renter-Occupied Housing Units | 50 | 33.3% |
| Total Occupied Housing Units | 150 | 100.0% |
Occupancy by Household Size in Lutsen
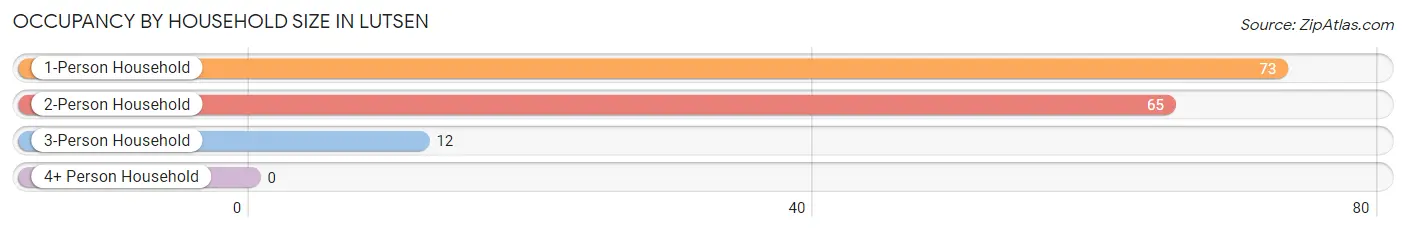
| Household Size | # Housing Units | % Housing Units |
| 1-Person Household | 73 | 48.7% |
| 2-Person Household | 65 | 43.3% |
| 3-Person Household | 12 | 8.0% |
| 4+ Person Household | 0 | 0.0% |
| Total Housing Units | 150 | 100.0% |
Occupancy by Ownership by Household Size in Lutsen
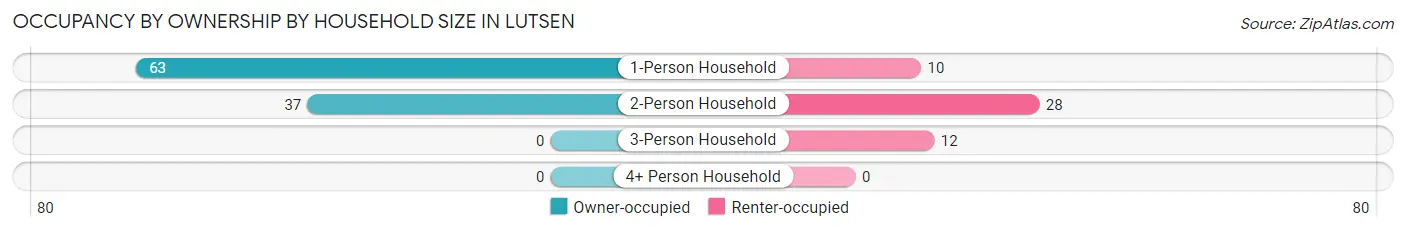
| Household Size | Owner-occupied | Renter-occupied |
| 1-Person Household | 63 (86.3%) | 10 (13.7%) |
| 2-Person Household | 37 (56.9%) | 28 (43.1%) |
| 3-Person Household | 0 (0.0%) | 12 (100.0%) |
| 4+ Person Household | 0 (0.0%) | 0 (0.0%) |
| Total Housing Units | 100 (66.7%) | 50 (33.3%) |
Occupancy by Educational Attainment in Lutsen
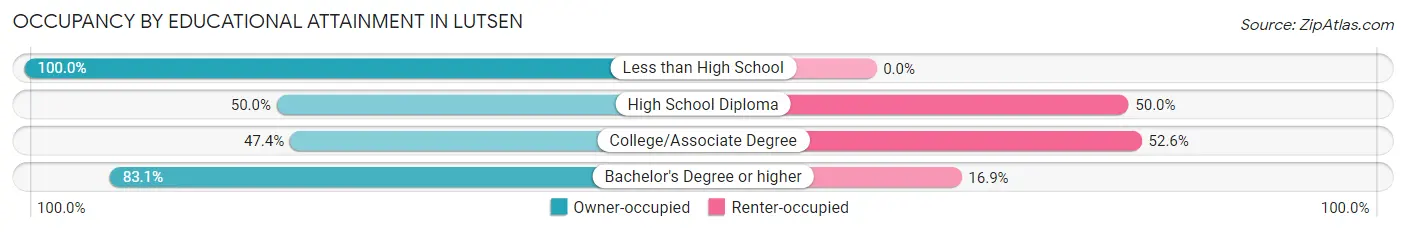
| Household Size | Owner-occupied | Renter-occupied |
| Less than High School | 6 (100.0%) | 0 (0.0%) |
| High School Diploma | 8 (50.0%) | 8 (50.0%) |
| College/Associate Degree | 27 (47.4%) | 30 (52.6%) |
| Bachelor's Degree or higher | 59 (83.1%) | 12 (16.9%) |
Occupancy by Age of Householder in Lutsen
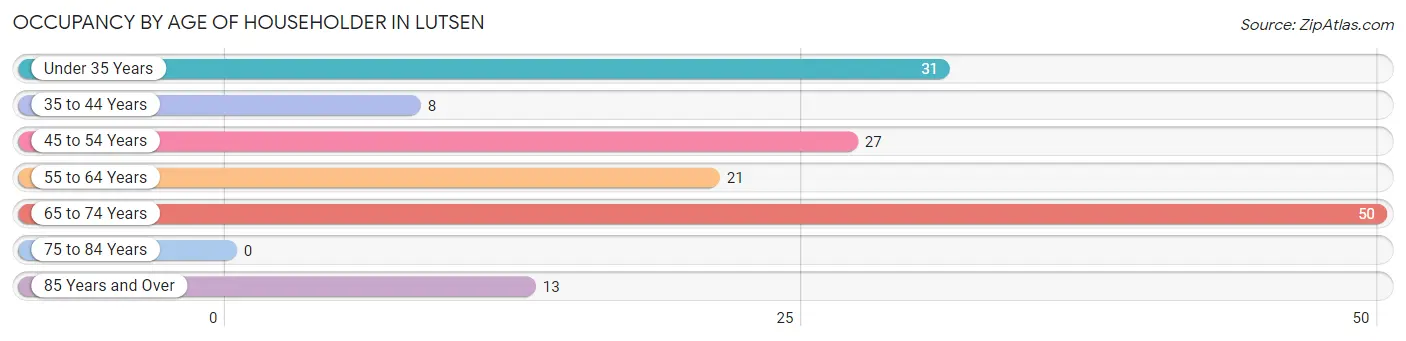
| Age Bracket | # Households | % Households |
| Under 35 Years | 31 | 20.7% |
| 35 to 44 Years | 8 | 5.3% |
| 45 to 54 Years | 27 | 18.0% |
| 55 to 64 Years | 21 | 14.0% |
| 65 to 74 Years | 50 | 33.3% |
| 75 to 84 Years | 0 | 0.0% |
| 85 Years and Over | 13 | 8.7% |
| Total | 150 | 100.0% |
Housing Finances in Lutsen
Median Income by Occupancy in Lutsen
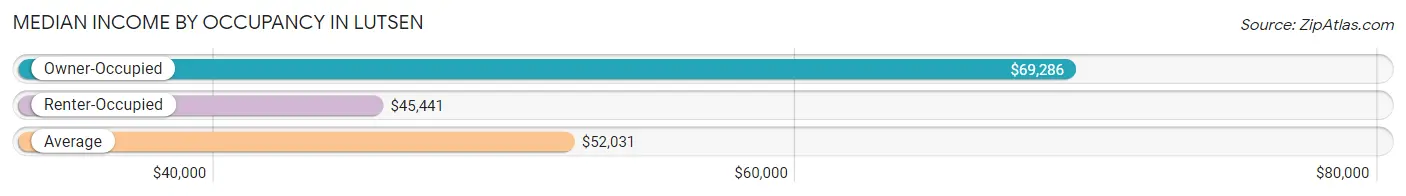
| Occupancy Type | # Households | Median Income |
| Owner-Occupied | 100 (66.7%) | $69,286 |
| Renter-Occupied | 50 (33.3%) | $45,441 |
| Average | 150 (100.0%) | $52,031 |
Occupancy by Householder Income Bracket in Lutsen
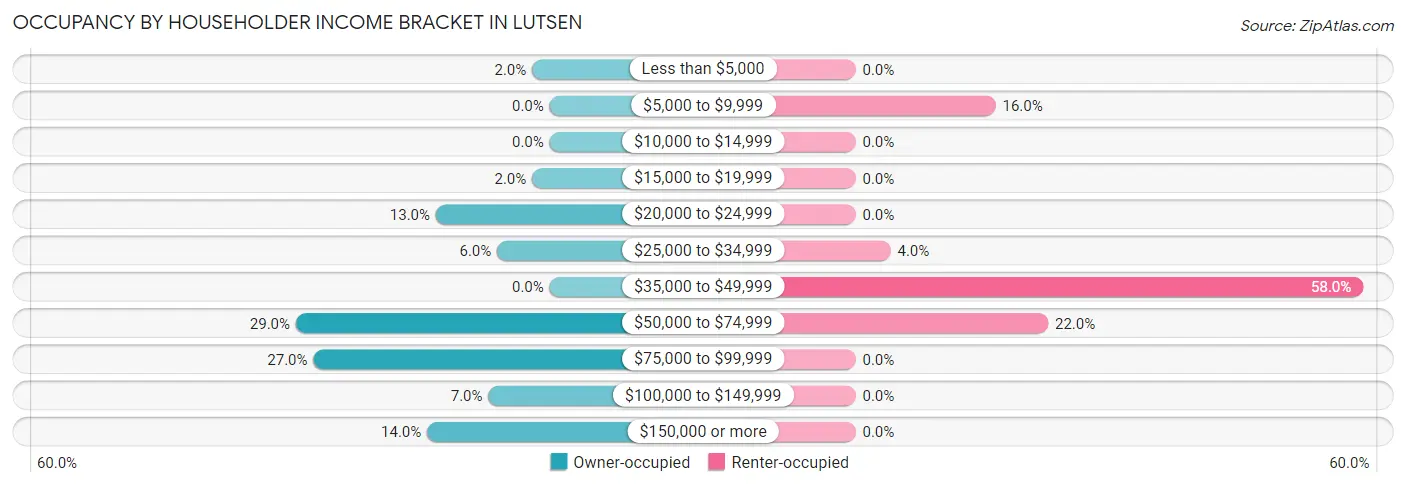
| Income Bracket | Owner-occupied | Renter-occupied |
| Less than $5,000 | 2 (2.0%) | 0 (0.0%) |
| $5,000 to $9,999 | 0 (0.0%) | 8 (16.0%) |
| $10,000 to $14,999 | 0 (0.0%) | 0 (0.0%) |
| $15,000 to $19,999 | 2 (2.0%) | 0 (0.0%) |
| $20,000 to $24,999 | 13 (13.0%) | 0 (0.0%) |
| $25,000 to $34,999 | 6 (6.0%) | 2 (4.0%) |
| $35,000 to $49,999 | 0 (0.0%) | 29 (58.0%) |
| $50,000 to $74,999 | 29 (29.0%) | 11 (22.0%) |
| $75,000 to $99,999 | 27 (27.0%) | 0 (0.0%) |
| $100,000 to $149,999 | 7 (7.0%) | 0 (0.0%) |
| $150,000 or more | 14 (14.0%) | 0 (0.0%) |
| Total | 100 (100.0%) | 50 (100.0%) |
Monthly Housing Cost Tiers in Lutsen
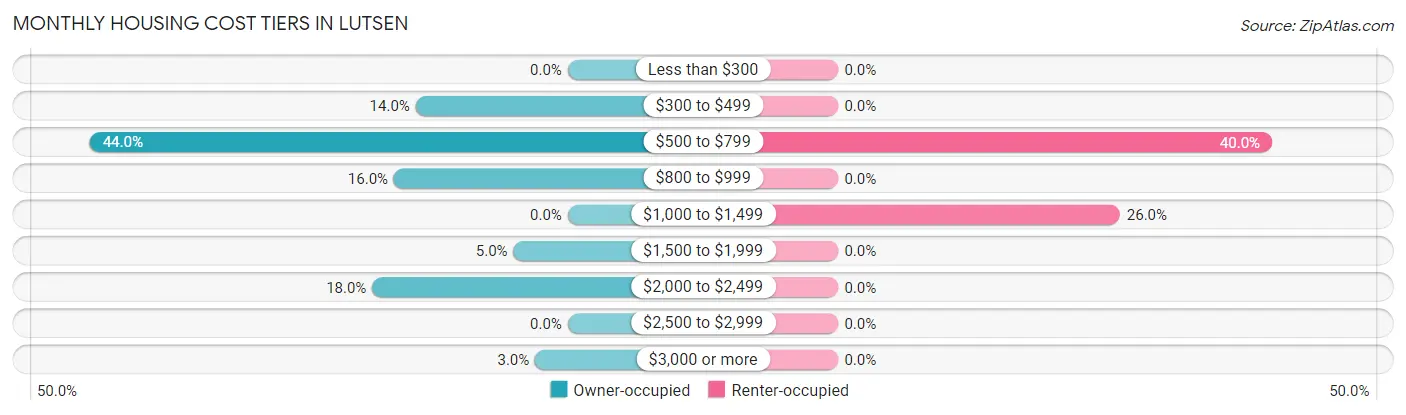
| Monthly Cost | Owner-occupied | Renter-occupied |
| Less than $300 | 0 (0.0%) | 0 (0.0%) |
| $300 to $499 | 14 (14.0%) | 0 (0.0%) |
| $500 to $799 | 44 (44.0%) | 20 (40.0%) |
| $800 to $999 | 16 (16.0%) | 0 (0.0%) |
| $1,000 to $1,499 | 0 (0.0%) | 13 (26.0%) |
| $1,500 to $1,999 | 5 (5.0%) | 0 (0.0%) |
| $2,000 to $2,499 | 18 (18.0%) | 0 (0.0%) |
| $2,500 to $2,999 | 0 (0.0%) | 0 (0.0%) |
| $3,000 or more | 3 (3.0%) | 0 (0.0%) |
| Total | 100 (100.0%) | 50 (100.0%) |
Physical Housing Characteristics in Lutsen
Housing Structures in Lutsen
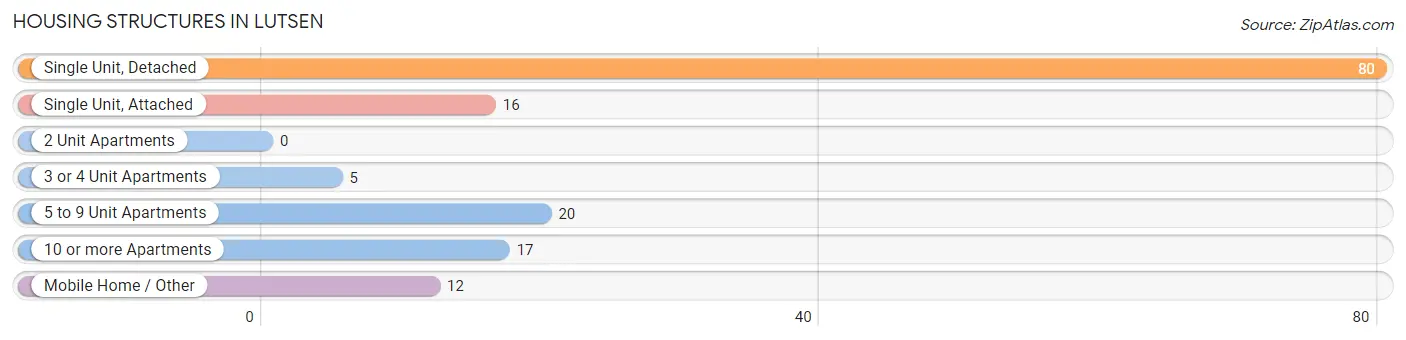
| Structure Type | # Housing Units | % Housing Units |
| Single Unit, Detached | 80 | 53.3% |
| Single Unit, Attached | 16 | 10.7% |
| 2 Unit Apartments | 0 | 0.0% |
| 3 or 4 Unit Apartments | 5 | 3.3% |
| 5 to 9 Unit Apartments | 20 | 13.3% |
| 10 or more Apartments | 17 | 11.3% |
| Mobile Home / Other | 12 | 8.0% |
| Total | 150 | 100.0% |
Housing Structures by Occupancy in Lutsen
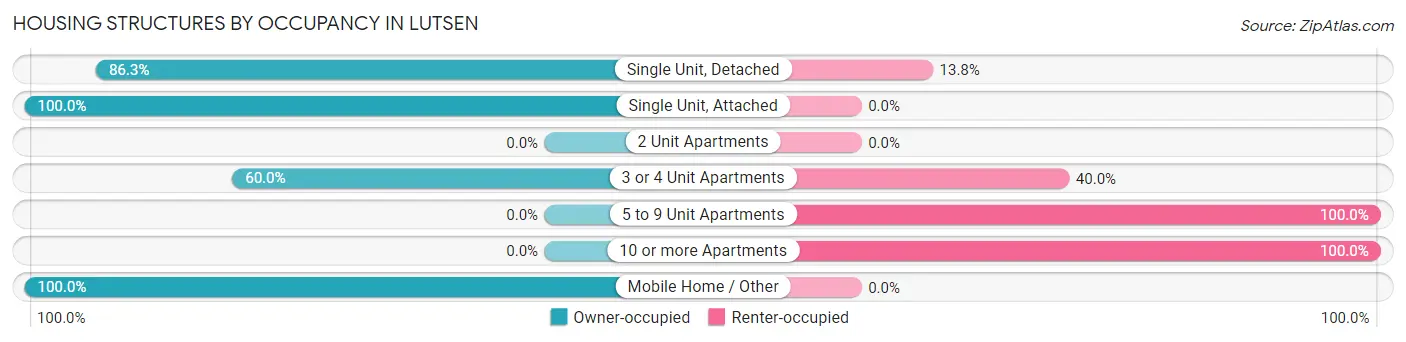
| Structure Type | Owner-occupied | Renter-occupied |
| Single Unit, Detached | 69 (86.3%) | 11 (13.8%) |
| Single Unit, Attached | 16 (100.0%) | 0 (0.0%) |
| 2 Unit Apartments | 0 (0.0%) | 0 (0.0%) |
| 3 or 4 Unit Apartments | 3 (60.0%) | 2 (40.0%) |
| 5 to 9 Unit Apartments | 0 (0.0%) | 20 (100.0%) |
| 10 or more Apartments | 0 (0.0%) | 17 (100.0%) |
| Mobile Home / Other | 12 (100.0%) | 0 (0.0%) |
| Total | 100 (66.7%) | 50 (33.3%) |
Housing Structures by Number of Rooms in Lutsen
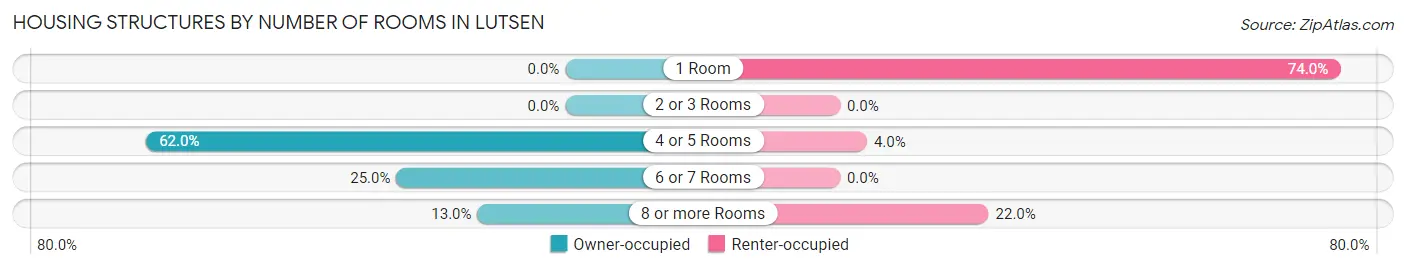
| Number of Rooms | Owner-occupied | Renter-occupied |
| 1 Room | 0 (0.0%) | 37 (74.0%) |
| 2 or 3 Rooms | 0 (0.0%) | 0 (0.0%) |
| 4 or 5 Rooms | 62 (62.0%) | 2 (4.0%) |
| 6 or 7 Rooms | 25 (25.0%) | 0 (0.0%) |
| 8 or more Rooms | 13 (13.0%) | 11 (22.0%) |
| Total | 100 (100.0%) | 50 (100.0%) |
Housing Structure by Heating Type in Lutsen
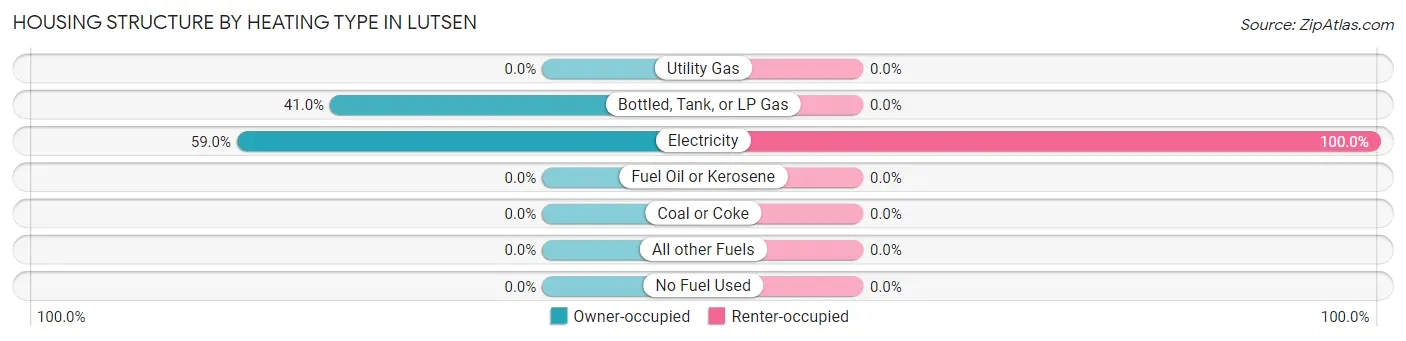
| Heating Type | Owner-occupied | Renter-occupied |
| Utility Gas | 0 (0.0%) | 0 (0.0%) |
| Bottled, Tank, or LP Gas | 41 (41.0%) | 0 (0.0%) |
| Electricity | 59 (59.0%) | 50 (100.0%) |
| Fuel Oil or Kerosene | 0 (0.0%) | 0 (0.0%) |
| Coal or Coke | 0 (0.0%) | 0 (0.0%) |
| All other Fuels | 0 (0.0%) | 0 (0.0%) |
| No Fuel Used | 0 (0.0%) | 0 (0.0%) |
| Total | 100 (100.0%) | 50 (100.0%) |
Household Vehicle Usage in Lutsen
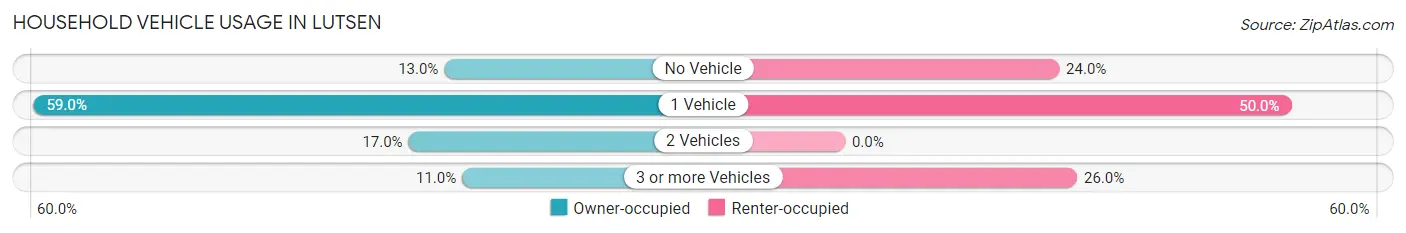
| Vehicles per Household | Owner-occupied | Renter-occupied |
| No Vehicle | 13 (13.0%) | 12 (24.0%) |
| 1 Vehicle | 59 (59.0%) | 25 (50.0%) |
| 2 Vehicles | 17 (17.0%) | 0 (0.0%) |
| 3 or more Vehicles | 11 (11.0%) | 13 (26.0%) |
| Total | 100 (100.0%) | 50 (100.0%) |
Real Estate & Mortgages in Lutsen
Real Estate and Mortgage Overview in Lutsen
| Characteristic | Without Mortgage | With Mortgage |
| Housing Units | 74 | 26 |
| Median Property Value | $230,000 | $361,900 |
| Median Household Income | $55,000 | $0 |
| Monthly Housing Costs | $600 | $3 |
| Real Estate Taxes | $1,431 | $0 |
Property Value by Mortgage Status in Lutsen
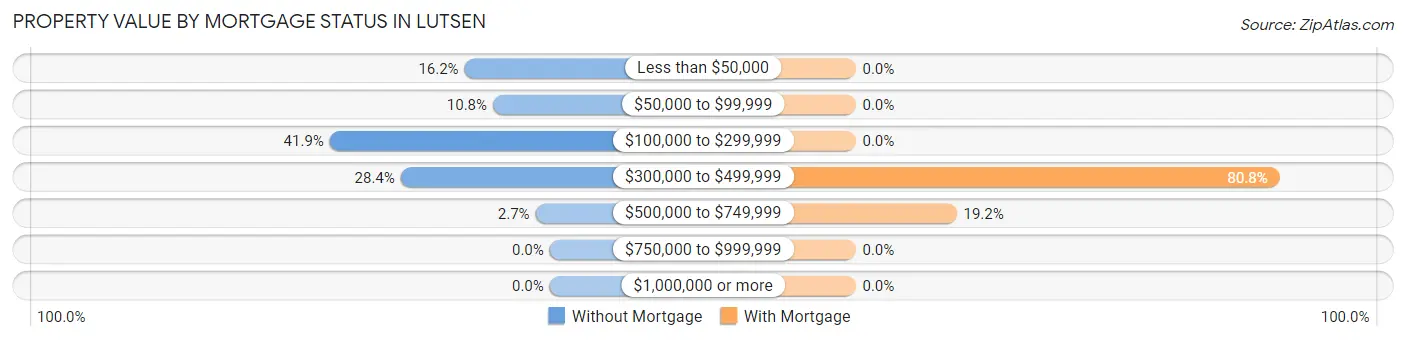
| Property Value | Without Mortgage | With Mortgage |
| Less than $50,000 | 12 (16.2%) | 0 (0.0%) |
| $50,000 to $99,999 | 8 (10.8%) | 0 (0.0%) |
| $100,000 to $299,999 | 31 (41.9%) | 0 (0.0%) |
| $300,000 to $499,999 | 21 (28.4%) | 21 (80.8%) |
| $500,000 to $749,999 | 2 (2.7%) | 5 (19.2%) |
| $750,000 to $999,999 | 0 (0.0%) | 0 (0.0%) |
| $1,000,000 or more | 0 (0.0%) | 0 (0.0%) |
| Total | 74 (100.0%) | 26 (100.0%) |
Household Income by Mortgage Status in Lutsen
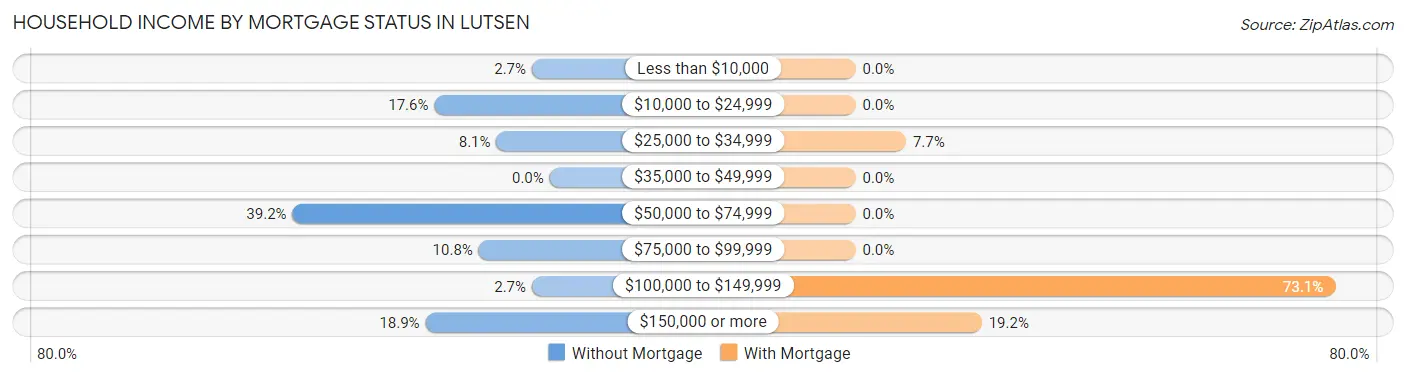
| Household Income | Without Mortgage | With Mortgage |
| Less than $10,000 | 2 (2.7%) | 0 (0.0%) |
| $10,000 to $24,999 | 13 (17.6%) | 0 (0.0%) |
| $25,000 to $34,999 | 6 (8.1%) | 2 (7.7%) |
| $35,000 to $49,999 | 0 (0.0%) | 0 (0.0%) |
| $50,000 to $74,999 | 29 (39.2%) | 0 (0.0%) |
| $75,000 to $99,999 | 8 (10.8%) | 0 (0.0%) |
| $100,000 to $149,999 | 2 (2.7%) | 19 (73.1%) |
| $150,000 or more | 14 (18.9%) | 5 (19.2%) |
| Total | 74 (100.0%) | 26 (100.0%) |
Property Value to Household Income Ratio in Lutsen
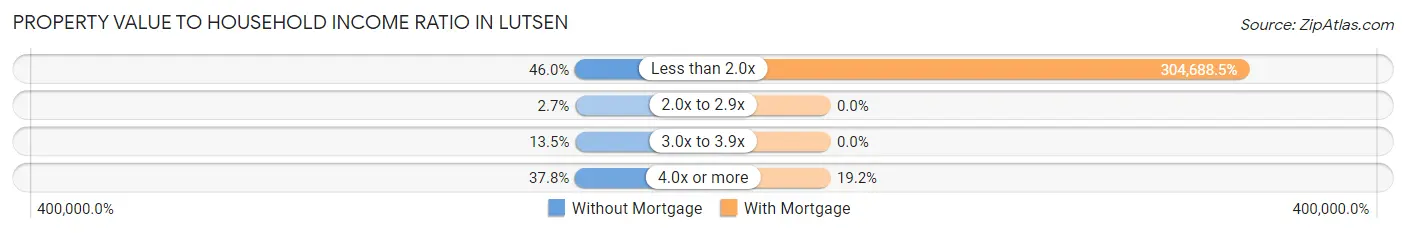
| Value-to-Income Ratio | Without Mortgage | With Mortgage |
| Less than 2.0x | 34 (46.0%) | 79,219 (304,688.5%) |
| 2.0x to 2.9x | 2 (2.7%) | 0 (0.0%) |
| 3.0x to 3.9x | 10 (13.5%) | 0 (0.0%) |
| 4.0x or more | 28 (37.8%) | 5 (19.2%) |
| Total | 74 (100.0%) | 26 (100.0%) |
Real Estate Taxes by Mortgage Status in Lutsen
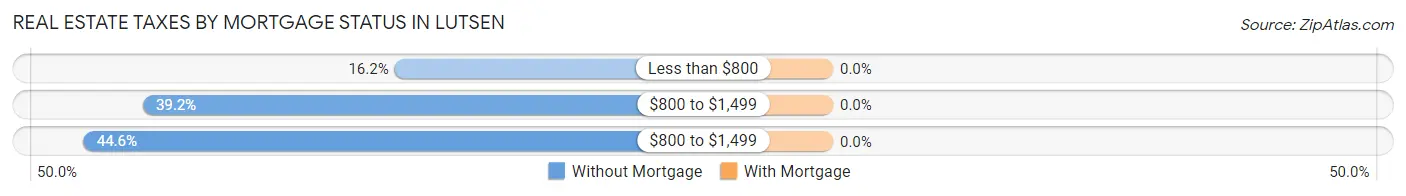
| Property Taxes | Without Mortgage | With Mortgage |
| Less than $800 | 12 (16.2%) | 0 (0.0%) |
| $800 to $1,499 | 29 (39.2%) | 0 (0.0%) |
| $800 to $1,499 | 33 (44.6%) | 0 (0.0%) |
| Total | 74 (100.0%) | 26 (100.0%) |
Health & Disability in Lutsen
Health Insurance Coverage by Age in Lutsen
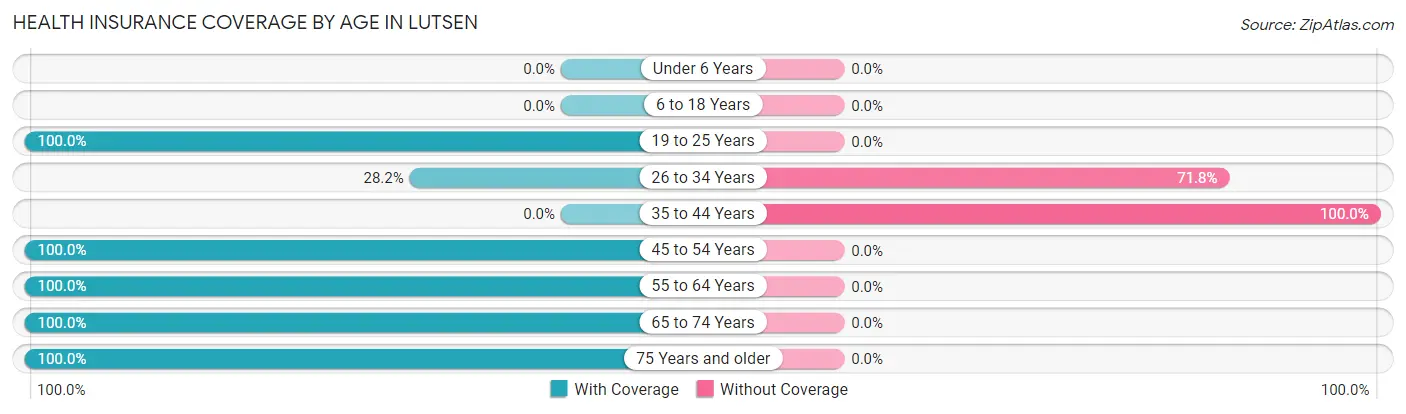
| Age Bracket | With Coverage | Without Coverage |
| Under 6 Years | 0 (0.0%) | 0 (0.0%) |
| 6 to 18 Years | 0 (0.0%) | 0 (0.0%) |
| 19 to 25 Years | 17 (100.0%) | 0 (0.0%) |
| 26 to 34 Years | 11 (28.2%) | 28 (71.8%) |
| 35 to 44 Years | 0 (0.0%) | 8 (100.0%) |
| 45 to 54 Years | 43 (100.0%) | 0 (0.0%) |
| 55 to 64 Years | 34 (100.0%) | 0 (0.0%) |
| 65 to 74 Years | 63 (100.0%) | 0 (0.0%) |
| 75 Years and older | 21 (100.0%) | 0 (0.0%) |
| Total | 189 (84.0%) | 36 (16.0%) |
Health Insurance Coverage by Citizenship Status in Lutsen
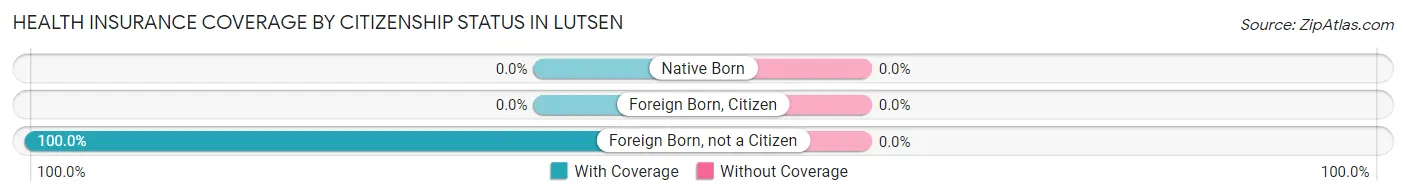
| Citizenship Status | With Coverage | Without Coverage |
| Native Born | 0 (0.0%) | 0 (0.0%) |
| Foreign Born, Citizen | 0 (0.0%) | 0 (0.0%) |
| Foreign Born, not a Citizen | 17 (100.0%) | 0 (0.0%) |
Health Insurance Coverage by Household Income in Lutsen
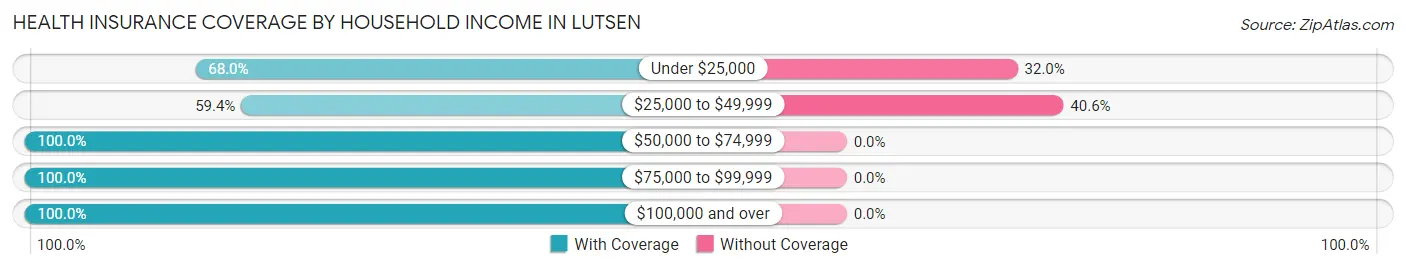
| Household Income | With Coverage | Without Coverage |
| Under $25,000 | 17 (68.0%) | 8 (32.0%) |
| $25,000 to $49,999 | 41 (59.4%) | 28 (40.6%) |
| $50,000 to $74,999 | 62 (100.0%) | 0 (0.0%) |
| $75,000 to $99,999 | 36 (100.0%) | 0 (0.0%) |
| $100,000 and over | 33 (100.0%) | 0 (0.0%) |
Public vs Private Health Insurance Coverage by Age in Lutsen
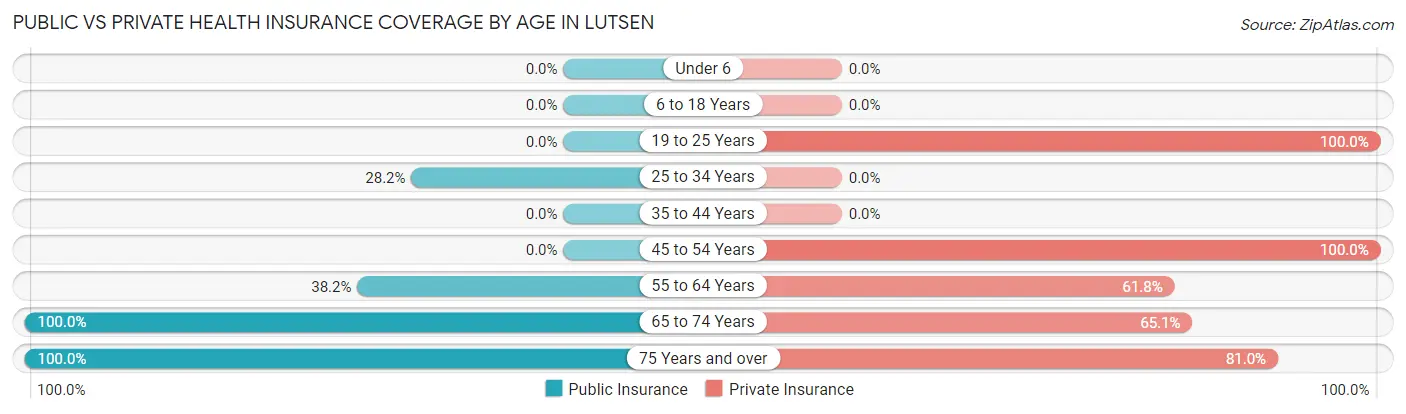
| Age Bracket | Public Insurance | Private Insurance |
| Under 6 | 0 (0.0%) | 0 (0.0%) |
| 6 to 18 Years | 0 (0.0%) | 0 (0.0%) |
| 19 to 25 Years | 0 (0.0%) | 17 (100.0%) |
| 25 to 34 Years | 11 (28.2%) | 0 (0.0%) |
| 35 to 44 Years | 0 (0.0%) | 0 (0.0%) |
| 45 to 54 Years | 0 (0.0%) | 43 (100.0%) |
| 55 to 64 Years | 13 (38.2%) | 21 (61.8%) |
| 65 to 74 Years | 63 (100.0%) | 41 (65.1%) |
| 75 Years and over | 21 (100.0%) | 17 (80.9%) |
| Total | 108 (48.0%) | 139 (61.8%) |
Disability Status by Sex by Age in Lutsen
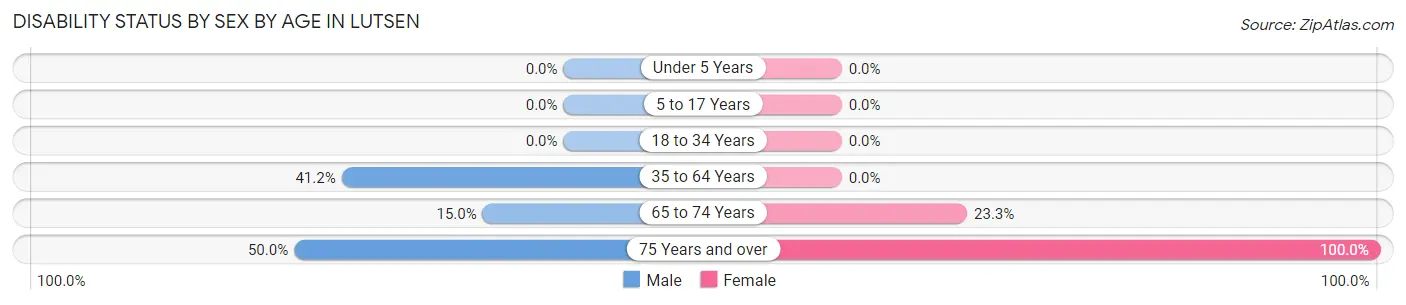
| Age Bracket | Male | Female |
| Under 5 Years | 0 (0.0%) | 0 (0.0%) |
| 5 to 17 Years | 0 (0.0%) | 0 (0.0%) |
| 18 to 34 Years | 0 (0.0%) | 0 (0.0%) |
| 35 to 64 Years | 14 (41.2%) | 0 (0.0%) |
| 65 to 74 Years | 3 (15.0%) | 10 (23.3%) |
| 75 Years and over | 4 (50.0%) | 13 (100.0%) |
Disability Class by Sex by Age in Lutsen
Disability Class: Hearing Difficulty
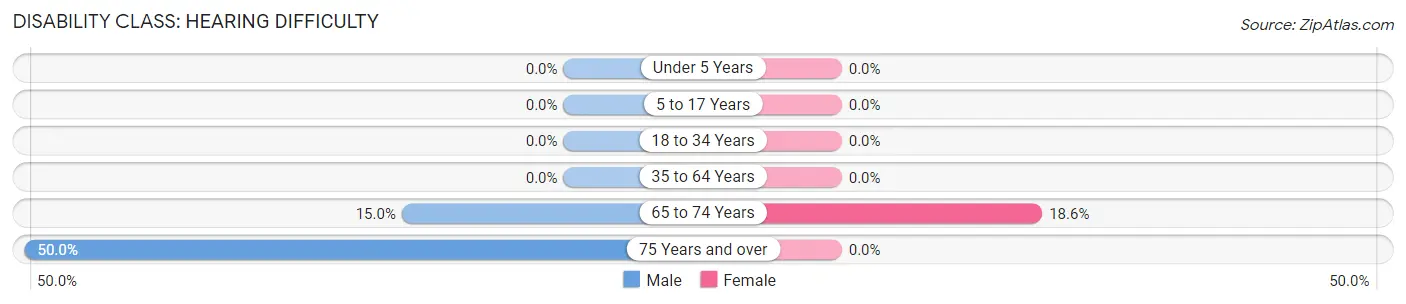
| Age Bracket | Male | Female |
| Under 5 Years | 0 (0.0%) | 0 (0.0%) |
| 5 to 17 Years | 0 (0.0%) | 0 (0.0%) |
| 18 to 34 Years | 0 (0.0%) | 0 (0.0%) |
| 35 to 64 Years | 0 (0.0%) | 0 (0.0%) |
| 65 to 74 Years | 3 (15.0%) | 8 (18.6%) |
| 75 Years and over | 4 (50.0%) | 0 (0.0%) |
Disability Class: Vision Difficulty
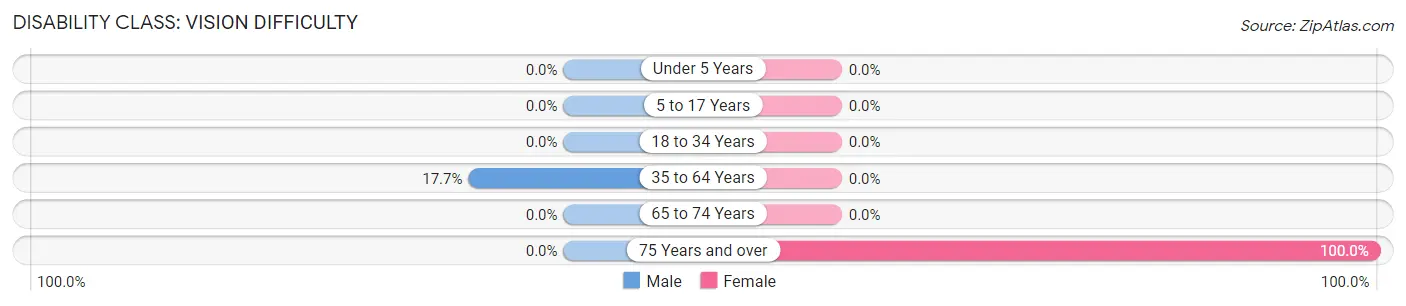
| Age Bracket | Male | Female |
| Under 5 Years | 0 (0.0%) | 0 (0.0%) |
| 5 to 17 Years | 0 (0.0%) | 0 (0.0%) |
| 18 to 34 Years | 0 (0.0%) | 0 (0.0%) |
| 35 to 64 Years | 6 (17.6%) | 0 (0.0%) |
| 65 to 74 Years | 0 (0.0%) | 0 (0.0%) |
| 75 Years and over | 0 (0.0%) | 13 (100.0%) |
Disability Class: Cognitive Difficulty

| Age Bracket | Male | Female |
| 5 to 17 Years | 0 (0.0%) | 0 (0.0%) |
| 18 to 34 Years | 0 (0.0%) | 0 (0.0%) |
| 35 to 64 Years | 8 (23.5%) | 0 (0.0%) |
| 65 to 74 Years | 0 (0.0%) | 0 (0.0%) |
| 75 Years and over | 0 (0.0%) | 0 (0.0%) |
Disability Class: Ambulatory Difficulty
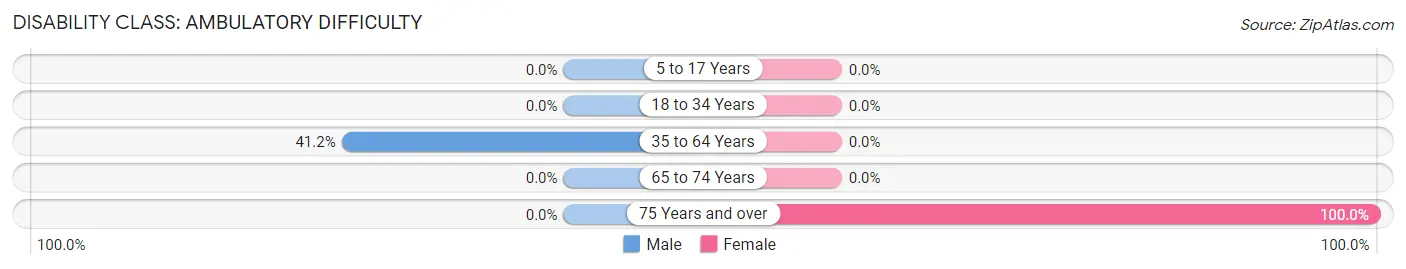
| Age Bracket | Male | Female |
| 5 to 17 Years | 0 (0.0%) | 0 (0.0%) |
| 18 to 34 Years | 0 (0.0%) | 0 (0.0%) |
| 35 to 64 Years | 14 (41.2%) | 0 (0.0%) |
| 65 to 74 Years | 0 (0.0%) | 0 (0.0%) |
| 75 Years and over | 0 (0.0%) | 13 (100.0%) |
Disability Class: Self-Care Difficulty
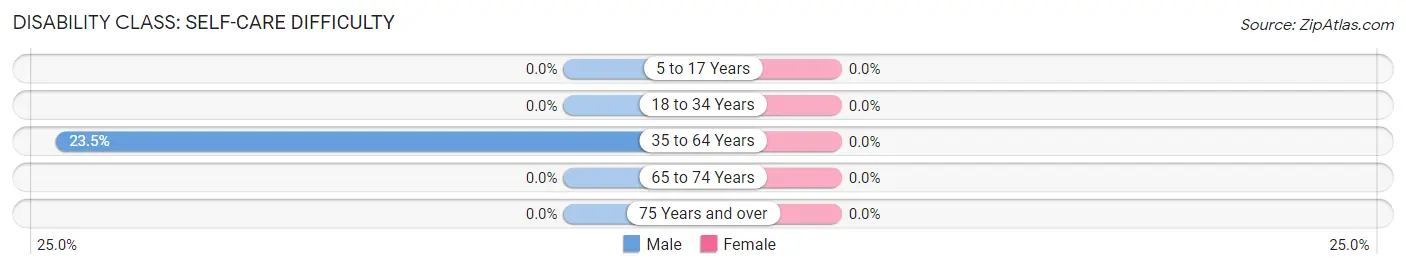
| Age Bracket | Male | Female |
| 5 to 17 Years | 0 (0.0%) | 0 (0.0%) |
| 18 to 34 Years | 0 (0.0%) | 0 (0.0%) |
| 35 to 64 Years | 8 (23.5%) | 0 (0.0%) |
| 65 to 74 Years | 0 (0.0%) | 0 (0.0%) |
| 75 Years and over | 0 (0.0%) | 0 (0.0%) |
Technology Access in Lutsen
Computing Device Access in Lutsen
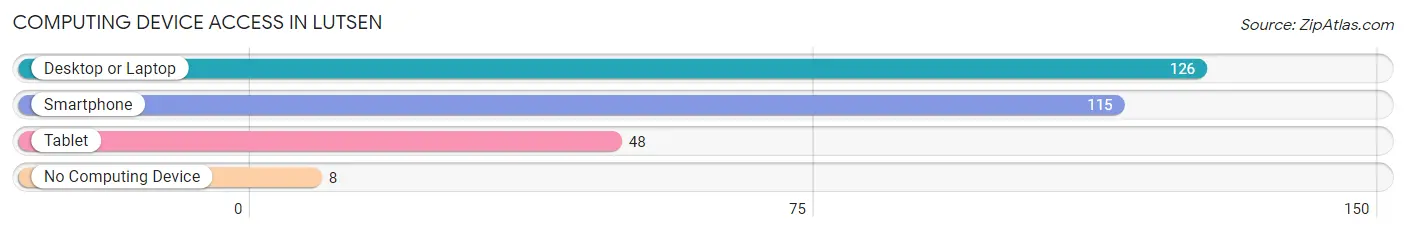
| Device Type | # Households | % Households |
| Desktop or Laptop | 126 | 84.0% |
| Smartphone | 115 | 76.7% |
| Tablet | 48 | 32.0% |
| No Computing Device | 8 | 5.3% |
| Total | 150 | 100.0% |
Internet Access in Lutsen
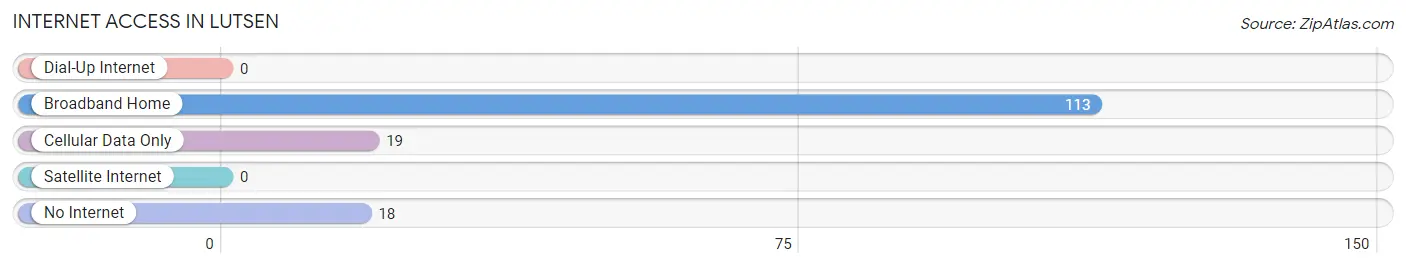
| Internet Type | # Households | % Households |
| Dial-Up Internet | 0 | 0.0% |
| Broadband Home | 113 | 75.3% |
| Cellular Data Only | 19 | 12.7% |
| Satellite Internet | 0 | 0.0% |
| No Internet | 18 | 12.0% |
| Total | 150 | 100.0% |
Lutsen Summary
Lutsen, Minnesota is a small unincorporated community located in Cook County, Minnesota, United States. It is situated on the North Shore of Lake Superior, approximately 25 miles northeast of Grand Marais. The population of Lutsen was estimated to be around 200 people in 2020.
History
Lutsen was first settled in the late 1800s by Scandinavian immigrants. The area was originally known as "Lutzen" and was named after a small town in Norway. The first settlers were mostly farmers and fishermen, and the area was known for its abundance of wild game and fish.
In the early 1900s, the area began to attract tourists, and the first resort was built in Lutsen in 1910. The resort was called the Lutsen Hotel and was owned by the Lutsen family. The hotel was a popular destination for tourists and was known for its beautiful views of Lake Superior.
In the 1920s, the area began to attract more tourists, and the Lutsen Hotel was expanded to accommodate the influx of visitors. The hotel was eventually sold to the Lutsen Resort Company in the 1940s, and the resort was renamed the Lutsen Resort and Spa.
The resort was a popular destination for tourists and was known for its beautiful views of Lake Superior. In the 1950s, the resort was expanded to include a golf course, ski area, and other recreational activities. The resort was eventually sold to the Lutsen Resort Company in the 1970s, and the resort was renamed the Lutsen Resort and Spa.
The resort is still a popular destination for tourists and is known for its beautiful views of Lake Superior.
Geography
Lutsen is located in Cook County, Minnesota, United States. It is situated on the North Shore of Lake Superior, approximately 25 miles northeast of Grand Marais. The area is known for its rugged terrain and beautiful views of Lake Superior. The area is also home to several state parks, including Temperance River State Park, Cascade River State Park, and Judge C.R. Magney State Park.
The area is also home to several ski resorts, including Lutsen Mountains, which is the largest ski resort in the Midwest. The area is also home to several hiking trails, including the Superior Hiking Trail, which runs along the North Shore of Lake Superior.
Economy
The economy of Lutsen is largely based on tourism. The area is home to several resorts, including the Lutsen Resort and Spa, which is a popular destination for tourists. The area is also home to several ski resorts, including Lutsen Mountains, which is the largest ski resort in the Midwest.
The area is also home to several hiking trails, including the Superior Hiking Trail, which runs along the North Shore of Lake Superior. The area is also home to several state parks, including Temperance River State Park, Cascade River State Park, and Judge C.R. Magney State Park.
The area is also home to several businesses, including restaurants, bars, and shops. The area is also home to several art galleries, including the Lutsen Art Gallery, which features works by local artists.
Demographics
The population of Lutsen was estimated to be around 200 people in 2020. The population is largely made up of Caucasian Americans, with a small percentage of Native Americans. The median age of the population is 44.7 years, and the median household income is $45,000. The area is also home to several ski resorts, including Lutsen Mountains, which is the largest ski resort in the Midwest.
Common Questions
What is Per Capita Income in Lutsen?
Per Capita income in Lutsen is $44,030.
What is the Median Family Income in Lutsen?
Median Family Income in Lutsen is $80,278.
What is the Median Household income in Lutsen?
Median Household Income in Lutsen is $52,031.
What is Income or Wage Gap in Lutsen?
Income or Wage Gap in Lutsen is 62.3%.
Women in Lutsen earn 37.7 cents for every dollar earned by a man.
What is Inequality or Gini Index in Lutsen?
Inequality or Gini Index in Lutsen is 0.38.
What is the Total Population of Lutsen?
Total Population of Lutsen is 225.
What is the Total Male Population of Lutsen?
Total Male Population of Lutsen is 118.
What is the Total Female Population of Lutsen?
Total Female Population of Lutsen is 107.
What is the Ratio of Males per 100 Females in Lutsen?
There are 110.28 Males per 100 Females in Lutsen.
What is the Ratio of Females per 100 Males in Lutsen?
There are 90.68 Females per 100 Males in Lutsen.
What is the Median Population Age in Lutsen?
Median Population Age in Lutsen is 58.1 Years.
What is the Average Family Size in Lutsen
Average Family Size in Lutsen is 2.0 People.
What is the Average Household Size in Lutsen
Average Household Size in Lutsen is 1.5 People.
How Large is the Labor Force in Lutsen?
There are 139 People in the Labor Forcein in Lutsen.
What is the Percentage of People in the Labor Force in Lutsen?
61.8% of People are in the Labor Force in Lutsen.
What is the Unemployment Rate in Lutsen?
Unemployment Rate in Lutsen is 5.8%.