Longville, MN Map & Demographics
Longville Map
Longville Overview
$32,529
PER CAPITA INCOME
$51,250
AVG FAMILY INCOME
$47,788
AVG HOUSEHOLD INCOME
51.2%
WAGE / INCOME GAP [ % ]
48.8¢/ $1
WAGE / INCOME GAP [ $ ]
$4,588
FAMILY INCOME DEFICIT
0.36
INEQUALITY / GINI INDEX
185
TOTAL POPULATION
72
MALE POPULATION
113
FEMALE POPULATION
63.72
MALES / 100 FEMALES
156.94
FEMALES / 100 MALES
67.3
MEDIAN AGE
2.1
AVG FAMILY SIZE
1.4
AVG HOUSEHOLD SIZE
58
LABOR FORCE [ PEOPLE ]
31.7%
PERCENT IN LABOR FORCE
12.1%
UNEMPLOYMENT RATE
Longville Zip Codes
Longville Area Codes
Income in Longville
Income Overview in Longville
Per Capita Income in Longville is $32,529, while median incomes of families and households are $51,250 and $47,788 respectively.
| Characteristic | Number | Measure |
| Per Capita Income | 185 | $32,529 |
| Median Family Income | 40 | $51,250 |
| Mean Family Income | 40 | $60,170 |
| Median Household Income | 129 | $47,788 |
| Mean Household Income | 129 | $47,176 |
| Income Deficit | 40 | $4,588 |
| Wage / Income Gap (%) | 185 | 51.25% |
| Wage / Income Gap ($) | 185 | 48.75¢ per $1 |
| Gini / Inequality Index | 185 | 0.36 |
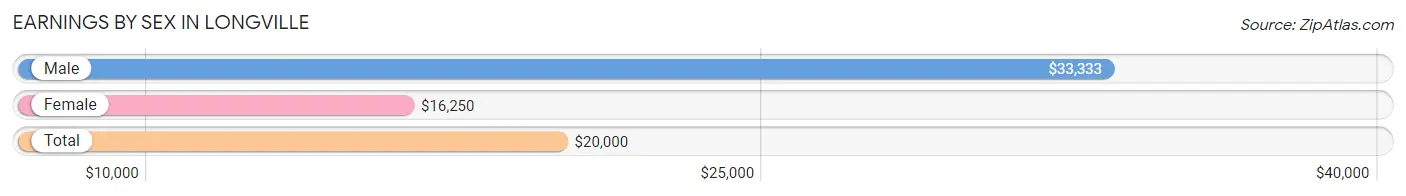
Earnings by Sex in Longville
Average Earnings in Longville are $20,000, $33,333 for men and $16,250 for women, a difference of 51.2%.
| Sex | Number | Average Earnings |
| Male | 36 (51.4%) | $33,333 |
| Female | 34 (48.6%) | $16,250 |
| Total | 70 (100.0%) | $20,000 |
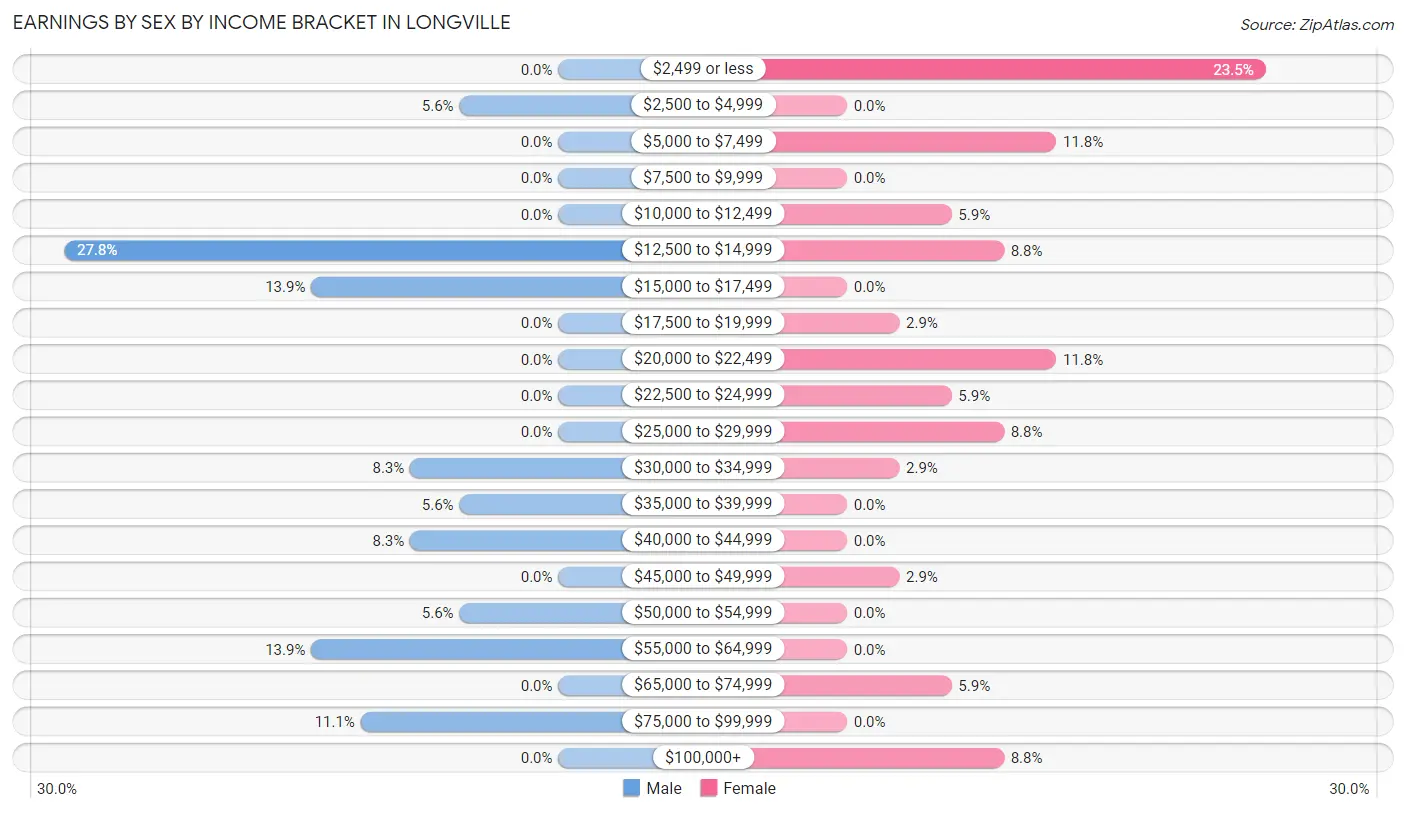
Earnings by Sex by Income Bracket in Longville
The most common earnings brackets in Longville are $12,500 to $14,999 for men (10 | 27.8%) and $2,499 or less for women (8 | 23.5%).
| Income | Male | Female |
| $2,499 or less | 0 (0.0%) | 8 (23.5%) |
| $2,500 to $4,999 | 2 (5.6%) | 0 (0.0%) |
| $5,000 to $7,499 | 0 (0.0%) | 4 (11.8%) |
| $7,500 to $9,999 | 0 (0.0%) | 0 (0.0%) |
| $10,000 to $12,499 | 0 (0.0%) | 2 (5.9%) |
| $12,500 to $14,999 | 10 (27.8%) | 3 (8.8%) |
| $15,000 to $17,499 | 5 (13.9%) | 0 (0.0%) |
| $17,500 to $19,999 | 0 (0.0%) | 1 (2.9%) |
| $20,000 to $22,499 | 0 (0.0%) | 4 (11.8%) |
| $22,500 to $24,999 | 0 (0.0%) | 2 (5.9%) |
| $25,000 to $29,999 | 0 (0.0%) | 3 (8.8%) |
| $30,000 to $34,999 | 3 (8.3%) | 1 (2.9%) |
| $35,000 to $39,999 | 2 (5.6%) | 0 (0.0%) |
| $40,000 to $44,999 | 3 (8.3%) | 0 (0.0%) |
| $45,000 to $49,999 | 0 (0.0%) | 1 (2.9%) |
| $50,000 to $54,999 | 2 (5.6%) | 0 (0.0%) |
| $55,000 to $64,999 | 5 (13.9%) | 0 (0.0%) |
| $65,000 to $74,999 | 0 (0.0%) | 2 (5.9%) |
| $75,000 to $99,999 | 4 (11.1%) | 0 (0.0%) |
| $100,000+ | 0 (0.0%) | 3 (8.8%) |
| Total | 36 (100.0%) | 34 (100.0%) |
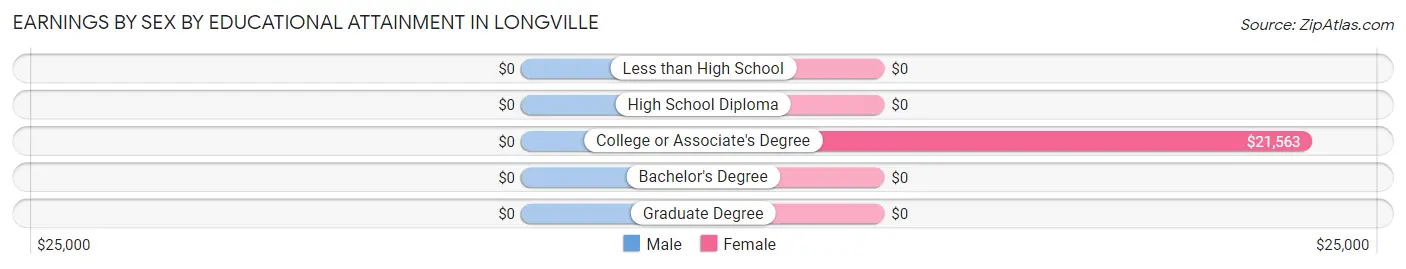
Earnings by Sex by Educational Attainment in Longville
| Educational Attainment | Male Income | Female Income |
| Less than High School | - | - |
| High School Diploma | - | - |
| College or Associate's Degree | - | - |
| Bachelor's Degree | - | - |
| Graduate Degree | - | - |
| Total | $41,250 | $16,250 |
Family Income in Longville
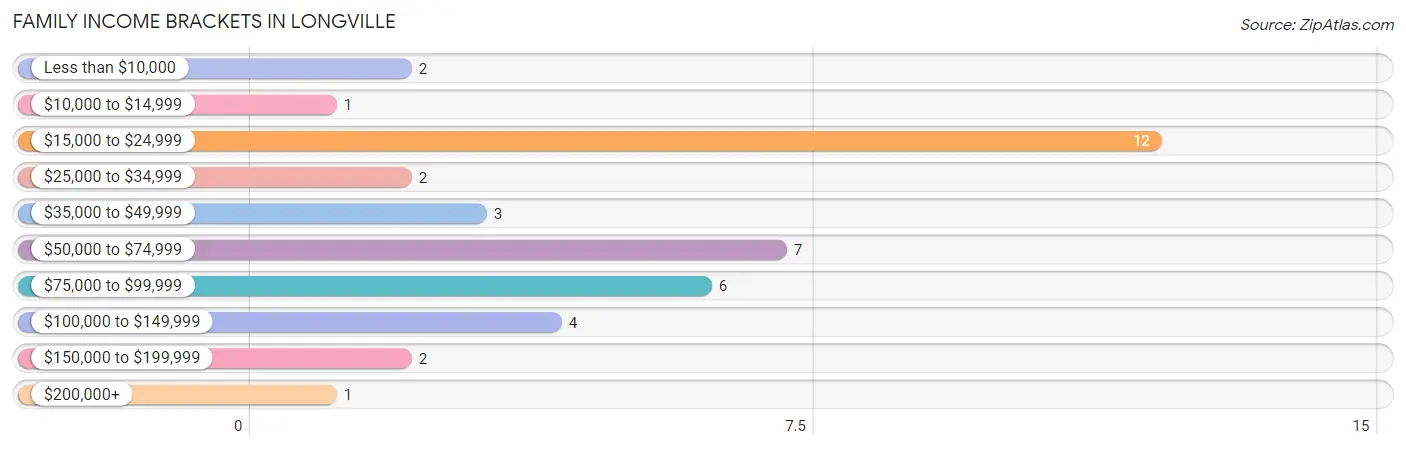
Family Income Brackets in Longville
According to the Longville family income data, there are 12 families falling into the $15,000 to $24,999 income range, which is the most common income bracket and makes up 30.0% of all families. Conversely, the $10,000 to $14,999 income bracket is the least frequent group with only 1 families (2.5%) belonging to this category.
| Income Bracket | # Families | % Families |
| Less than $10,000 | 2 | 5.0% |
| $10,000 to $14,999 | 1 | 2.5% |
| $15,000 to $24,999 | 12 | 30.0% |
| $25,000 to $34,999 | 2 | 5.0% |
| $35,000 to $49,999 | 3 | 7.5% |
| $50,000 to $74,999 | 7 | 17.5% |
| $75,000 to $99,999 | 6 | 15.0% |
| $100,000 to $149,999 | 4 | 10.0% |
| $150,000 to $199,999 | 2 | 5.0% |
| $200,000+ | 1 | 2.5% |
Family Income by Famaliy Size in Longville
| Income Bracket | # Families | Median Income |
| 2-Person Families | 36 (90.0%) | $0 |
| 3-Person Families | 3 (7.5%) | $0 |
| 4-Person Families | 1 (2.5%) | $0 |
| 5-Person Families | 0 (0.0%) | $0 |
| 6-Person Families | 0 (0.0%) | $0 |
| 7+ Person Families | 0 (0.0%) | $0 |
| Total | 40 (100.0%) | $51,250 |
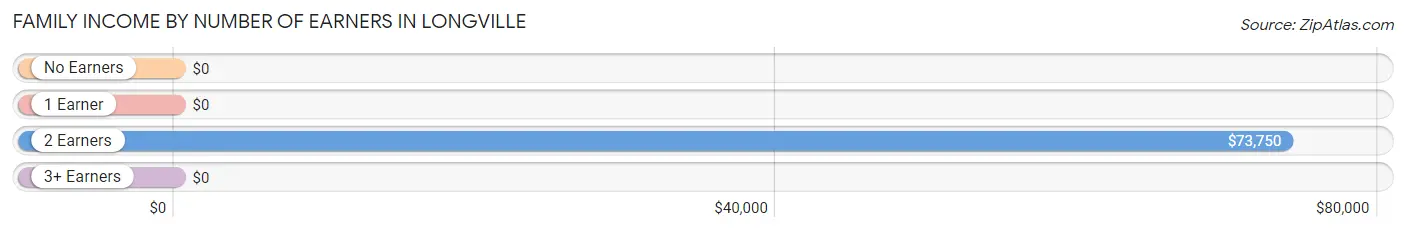
Family Income by Number of Earners in Longville
| Number of Earners | # Families | Median Income |
| No Earners | 18 (45.0%) | $0 |
| 1 Earner | 3 (7.5%) | $0 |
| 2 Earners | 16 (40.0%) | $73,750 |
| 3+ Earners | 3 (7.5%) | $0 |
| Total | 40 (100.0%) | $51,250 |
Household Income in Longville
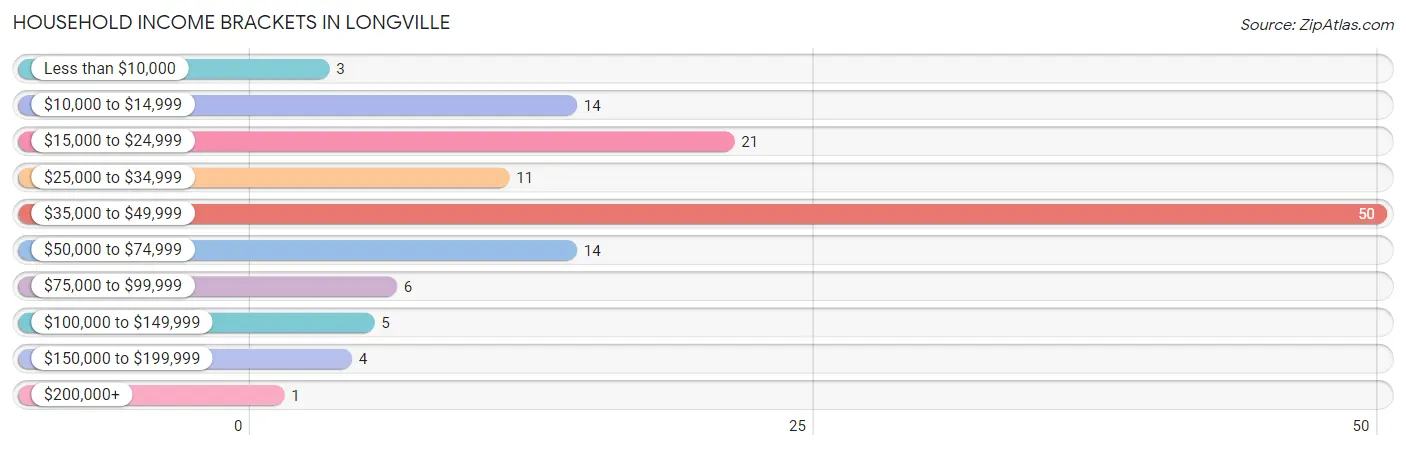
Household Income Brackets in Longville
With 50 households falling in the category, the $35,000 to $49,999 income range is the most frequent in Longville, accounting for 38.8% of all households. In contrast, only 1 households (0.8%) fall into the $200,000+ income bracket, making it the least populous group.
| Income Bracket | # Households | % Households |
| Less than $10,000 | 3 | 2.3% |
| $10,000 to $14,999 | 14 | 10.9% |
| $15,000 to $24,999 | 21 | 16.3% |
| $25,000 to $34,999 | 11 | 8.5% |
| $35,000 to $49,999 | 50 | 38.8% |
| $50,000 to $74,999 | 14 | 10.9% |
| $75,000 to $99,999 | 6 | 4.7% |
| $100,000 to $149,999 | 5 | 3.9% |
| $150,000 to $199,999 | 4 | 3.1% |
| $200,000+ | 1 | 0.8% |
Household Income by Householder Age in Longville
The median household income in Longville is $47,788, with the highest median household income of $83,750 found in the 25 to 44 years age bracket for the primary householder. A total of 5 households (3.9%) fall into this category. Meanwhile, the 15 to 24 years age bracket for the primary householder has the lowest median household income of $0, with 2 households (1.5%) in this group.
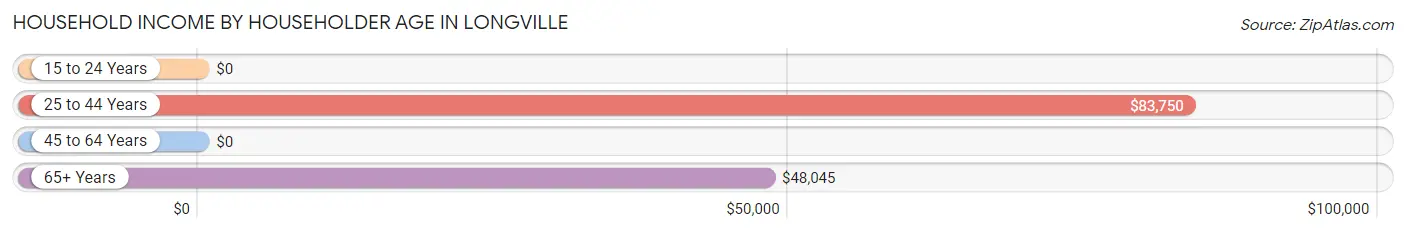
| Income Bracket | # Households | Median Income |
| 15 to 24 Years | 2 (1.5%) | $0 |
| 25 to 44 Years | 5 (3.9%) | $83,750 |
| 45 to 64 Years | 29 (22.5%) | $0 |
| 65+ Years | 93 (72.1%) | $48,045 |
| Total | 129 (100.0%) | $47,788 |
Poverty in Longville
Income Below Poverty by Sex and Age in Longville
With 15.3% poverty level for males and 20.3% for females among the residents of Longville, 45 to 54 year old males and 55 to 64 year old females are the most vulnerable to poverty, with 2 males (66.7%) and 20 females (62.5%) in their respective age groups living below the poverty level.
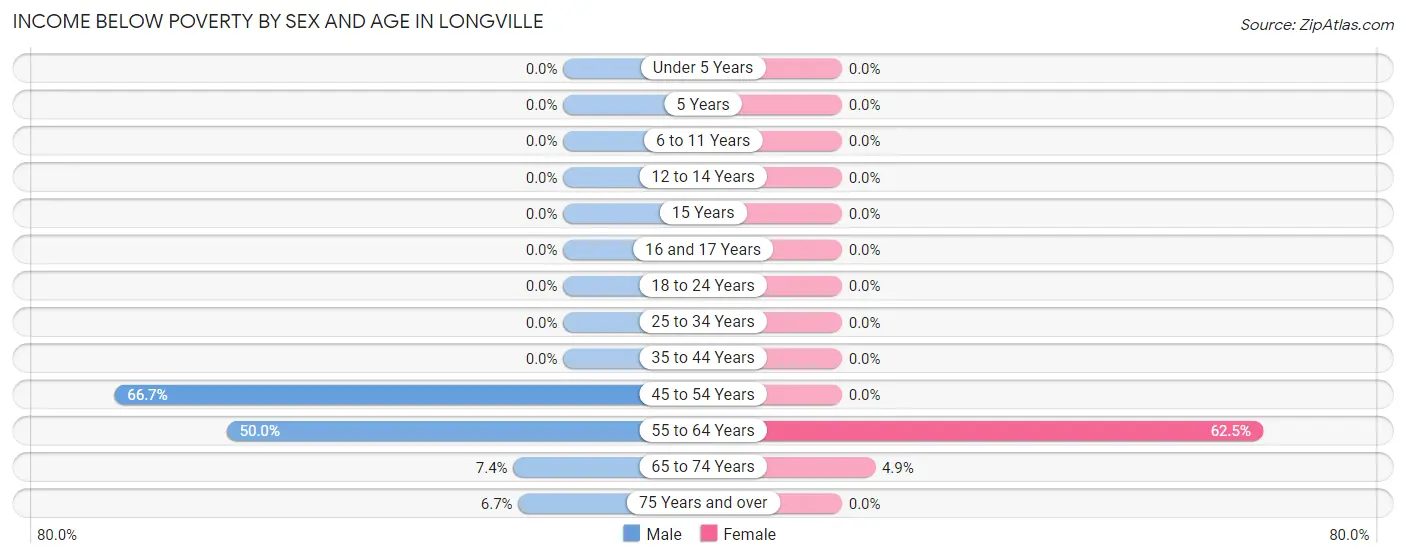
| Age Bracket | Male | Female |
| Under 5 Years | 0 (0.0%) | 0 (0.0%) |
| 5 Years | 0 (0.0%) | 0 (0.0%) |
| 6 to 11 Years | 0 (0.0%) | 0 (0.0%) |
| 12 to 14 Years | 0 (0.0%) | 0 (0.0%) |
| 15 Years | 0 (0.0%) | 0 (0.0%) |
| 16 and 17 Years | 0 (0.0%) | 0 (0.0%) |
| 18 to 24 Years | 0 (0.0%) | 0 (0.0%) |
| 25 to 34 Years | 0 (0.0%) | 0 (0.0%) |
| 35 to 44 Years | 0 (0.0%) | 0 (0.0%) |
| 45 to 54 Years | 2 (66.7%) | 0 (0.0%) |
| 55 to 64 Years | 6 (50.0%) | 20 (62.5%) |
| 65 to 74 Years | 2 (7.4%) | 3 (4.9%) |
| 75 Years and over | 1 (6.7%) | 0 (0.0%) |
| Total | 11 (15.3%) | 23 (20.3%) |
Income Above Poverty by Sex and Age in Longville
According to the poverty statistics in Longville, males aged 18 to 24 years and females aged under 5 years are the age groups that are most secure financially, with 100.0% of males and 100.0% of females in these age groups living above the poverty line.
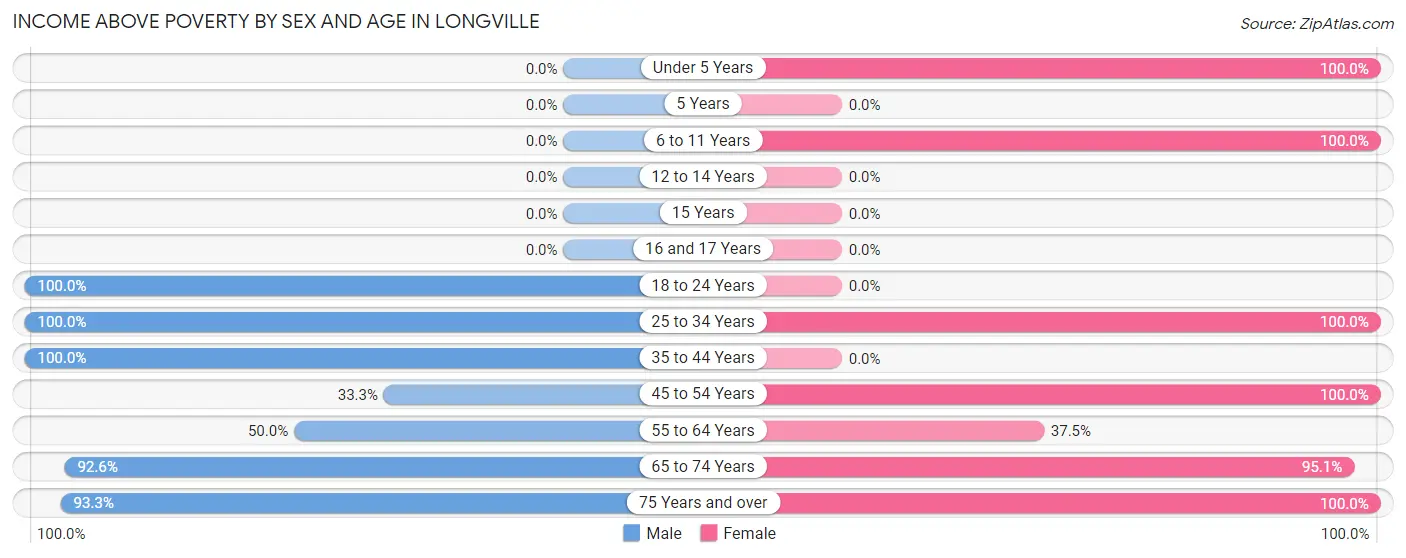
| Age Bracket | Male | Female |
| Under 5 Years | 0 (0.0%) | 1 (100.0%) |
| 5 Years | 0 (0.0%) | 0 (0.0%) |
| 6 to 11 Years | 0 (0.0%) | 1 (100.0%) |
| 12 to 14 Years | 0 (0.0%) | 0 (0.0%) |
| 15 Years | 0 (0.0%) | 0 (0.0%) |
| 16 and 17 Years | 0 (0.0%) | 0 (0.0%) |
| 18 to 24 Years | 11 (100.0%) | 0 (0.0%) |
| 25 to 34 Years | 1 (100.0%) | 2 (100.0%) |
| 35 to 44 Years | 3 (100.0%) | 0 (0.0%) |
| 45 to 54 Years | 1 (33.3%) | 4 (100.0%) |
| 55 to 64 Years | 6 (50.0%) | 12 (37.5%) |
| 65 to 74 Years | 25 (92.6%) | 58 (95.1%) |
| 75 Years and over | 14 (93.3%) | 12 (100.0%) |
| Total | 61 (84.7%) | 90 (79.6%) |
Income Below Poverty Among Married-Couple Families in Longville
The poverty statistics for married-couple families in Longville show that 20.5% or 8 of the total 39 families live below the poverty line. Families with no children have the highest poverty rate of 21.0%, comprising of 8 families. On the other hand, families with 1 or 2 children have the lowest poverty rate of 0.0%, which includes 0 families.
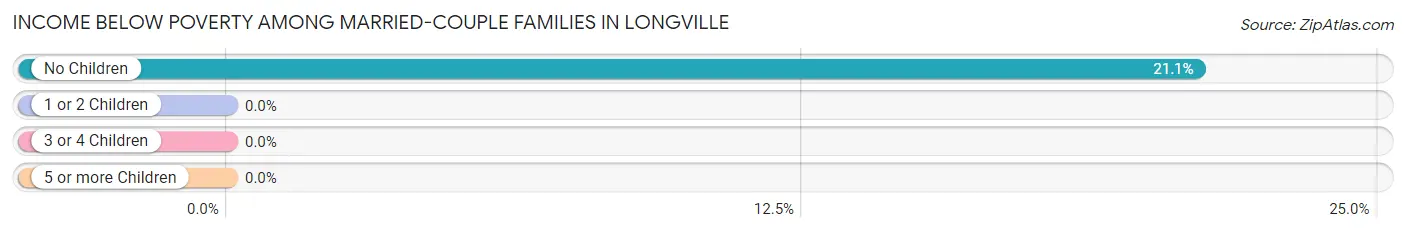
| Children | Above Poverty | Below Poverty |
| No Children | 30 (78.9%) | 8 (21.0%) |
| 1 or 2 Children | 1 (100.0%) | 0 (0.0%) |
| 3 or 4 Children | 0 (0.0%) | 0 (0.0%) |
| 5 or more Children | 0 (0.0%) | 0 (0.0%) |
| Total | 31 (79.5%) | 8 (20.5%) |
Income Below Poverty Among Single-Parent Households in Longville
| Children | Single Father | Single Mother |
| No Children | 0 (0.0%) | 0 (0.0%) |
| 1 or 2 Children | 0 (0.0%) | 0 (0.0%) |
| 3 or 4 Children | 0 (0.0%) | 0 (0.0%) |
| 5 or more Children | 0 (0.0%) | 0 (0.0%) |
| Total | 0 (0.0%) | 0 (0.0%) |
Income Below Poverty Among Married-Couple vs Single-Parent Households in Longville
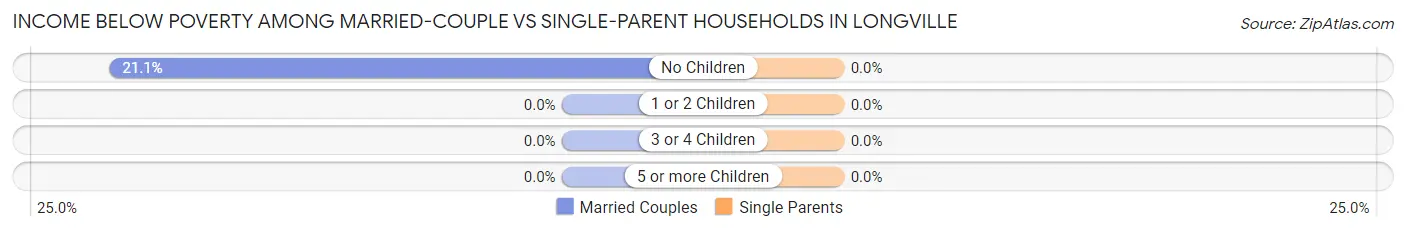
| Children | Married-Couple Families | Single-Parent Households |
| No Children | 8 (21.0%) | 0 (0.0%) |
| 1 or 2 Children | 0 (0.0%) | 0 (0.0%) |
| 3 or 4 Children | 0 (0.0%) | 0 (0.0%) |
| 5 or more Children | 0 (0.0%) | 0 (0.0%) |
| Total | 8 (20.5%) | 0 (0.0%) |
Race in Longville
The most populous races in Longville are White / Caucasian (182 | 98.4%), and Two or more Races (3 | 1.6%).
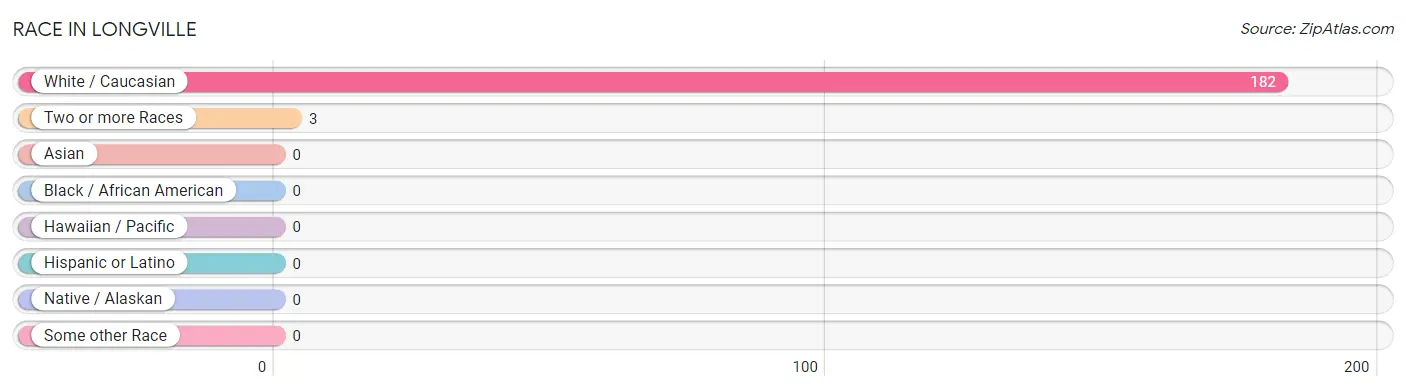
| Race | # Population | % Population |
| Asian | 0 | 0.0% |
| Black / African American | 0 | 0.0% |
| Hawaiian / Pacific | 0 | 0.0% |
| Hispanic or Latino | 0 | 0.0% |
| Native / Alaskan | 0 | 0.0% |
| White / Caucasian | 182 | 98.4% |
| Two or more Races | 3 | 1.6% |
| Some other Race | 0 | 0.0% |
| Total | 185 | 100.0% |
Ancestry in Longville
The most populous ancestries reported in Longville are German (90 | 48.6%), English (54 | 29.2%), Irish (19 | 10.3%), Scottish (15 | 8.1%), and Norwegian (11 | 5.9%), together accounting for 102.2% of all Longville residents.
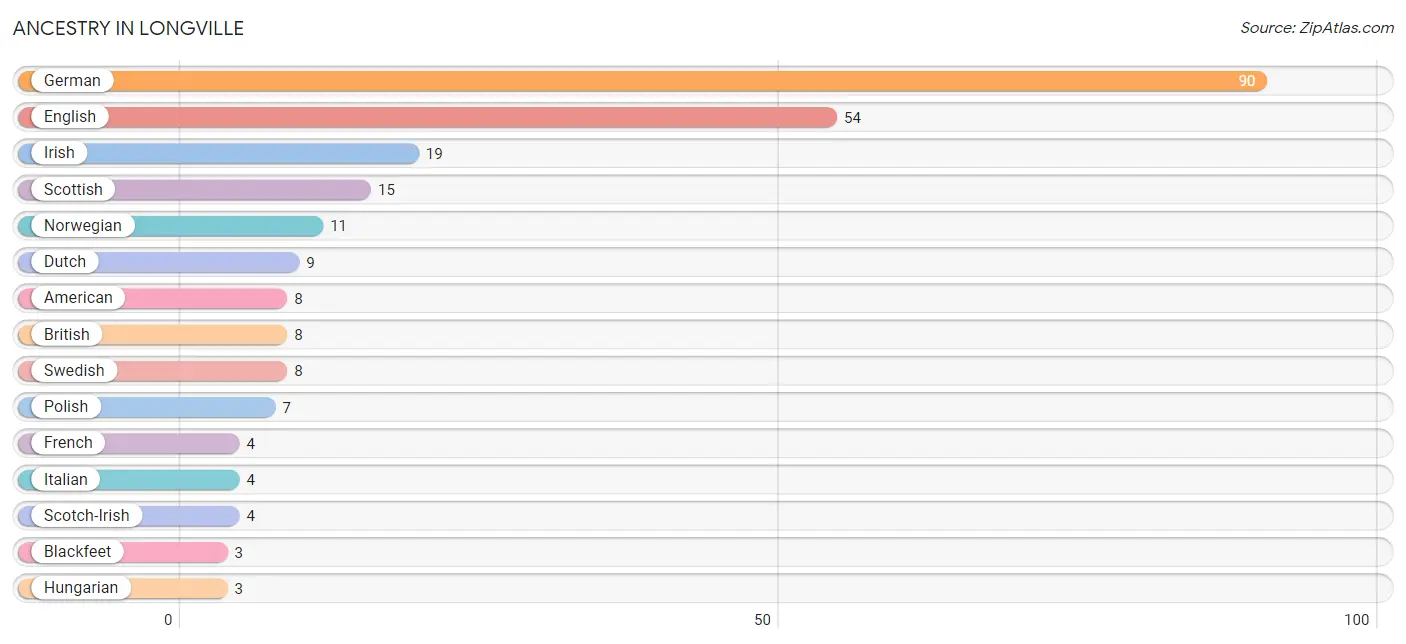
| Ancestry | # Population | % Population |
| American | 8 | 4.3% |
| Blackfeet | 3 | 1.6% |
| British | 8 | 4.3% |
| Croatian | 1 | 0.5% |
| Dutch | 9 | 4.9% |
| English | 54 | 29.2% |
| French | 4 | 2.2% |
| French Canadian | 2 | 1.1% |
| German | 90 | 48.6% |
| Hungarian | 3 | 1.6% |
| Irish | 19 | 10.3% |
| Italian | 4 | 2.2% |
| Norwegian | 11 | 5.9% |
| Polish | 7 | 3.8% |
| Scandinavian | 2 | 1.1% |
| Scotch-Irish | 4 | 2.2% |
| Scottish | 15 | 8.1% |
| Slovene | 1 | 0.5% |
| Swedish | 8 | 4.3% |
| Yugoslavian | 1 | 0.5% | View All 20 Rows |
Immigrants in Longville

| Immigration Origin | # Population | % Population | View All 0 Rows |
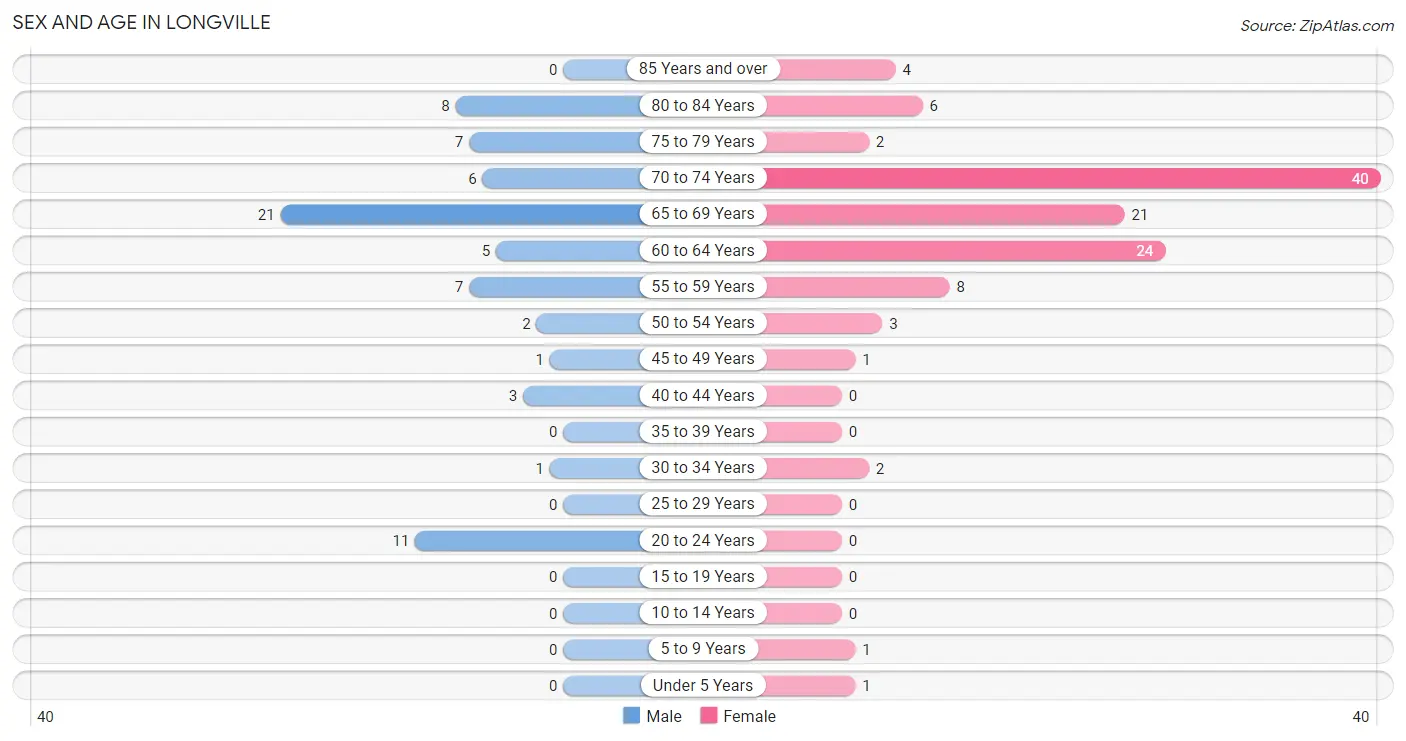
Sex and Age in Longville
Sex and Age in Longville
The most populous age groups in Longville are 65 to 69 Years (21 | 29.2%) for men and 70 to 74 Years (40 | 35.4%) for women.
| Age Bracket | Male | Female |
| Under 5 Years | 0 (0.0%) | 1 (0.9%) |
| 5 to 9 Years | 0 (0.0%) | 1 (0.9%) |
| 10 to 14 Years | 0 (0.0%) | 0 (0.0%) |
| 15 to 19 Years | 0 (0.0%) | 0 (0.0%) |
| 20 to 24 Years | 11 (15.3%) | 0 (0.0%) |
| 25 to 29 Years | 0 (0.0%) | 0 (0.0%) |
| 30 to 34 Years | 1 (1.4%) | 2 (1.8%) |
| 35 to 39 Years | 0 (0.0%) | 0 (0.0%) |
| 40 to 44 Years | 3 (4.2%) | 0 (0.0%) |
| 45 to 49 Years | 1 (1.4%) | 1 (0.9%) |
| 50 to 54 Years | 2 (2.8%) | 3 (2.6%) |
| 55 to 59 Years | 7 (9.7%) | 8 (7.1%) |
| 60 to 64 Years | 5 (6.9%) | 24 (21.2%) |
| 65 to 69 Years | 21 (29.2%) | 21 (18.6%) |
| 70 to 74 Years | 6 (8.3%) | 40 (35.4%) |
| 75 to 79 Years | 7 (9.7%) | 2 (1.8%) |
| 80 to 84 Years | 8 (11.1%) | 6 (5.3%) |
| 85 Years and over | 0 (0.0%) | 4 (3.5%) |
| Total | 72 (100.0%) | 113 (100.0%) |
Families and Households in Longville
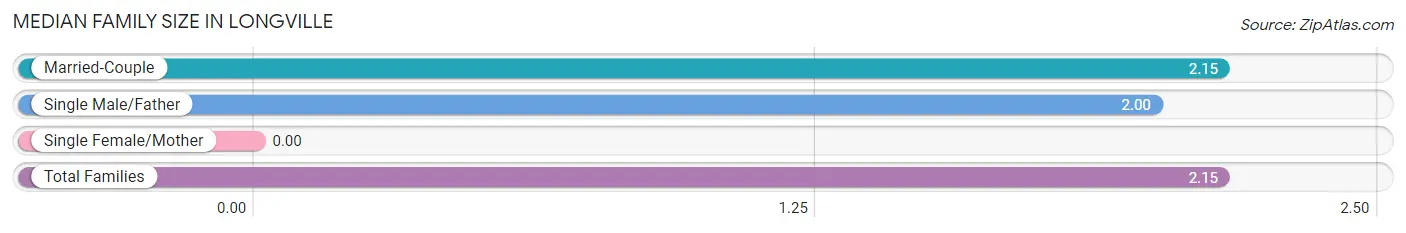
Median Family Size in Longville
| Family Type | # Families | Family Size |
| Married-Couple | 39 (97.5%) | 2.15 |
| Single Male/Father | 1 (2.5%) | 2.00 |
| Single Female/Mother | 0 (0.0%) | - |
| Total Families | 40 (100.0%) | 2.15 |
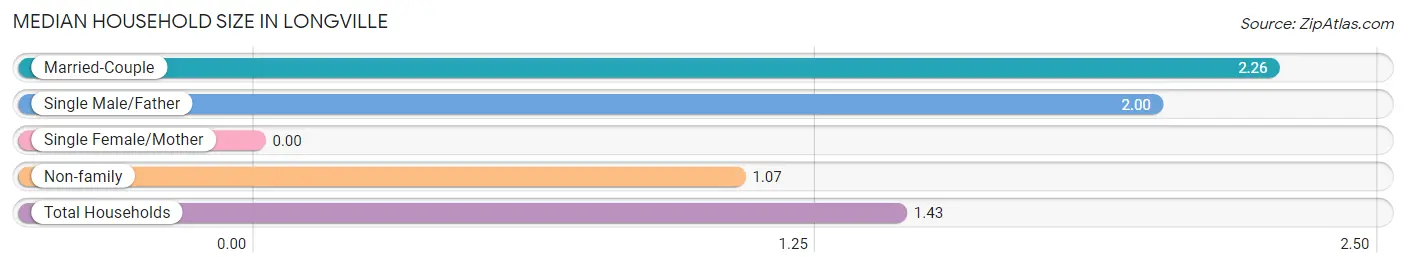
Median Household Size in Longville
| Household Type | # Households | Household Size |
| Married-Couple | 39 (30.2%) | 2.26 |
| Single Male/Father | 1 (0.8%) | 2.00 |
| Single Female/Mother | 0 (0.0%) | - |
| Non-family | 89 (69.0%) | 1.07 |
| Total Households | 129 (100.0%) | 1.43 |
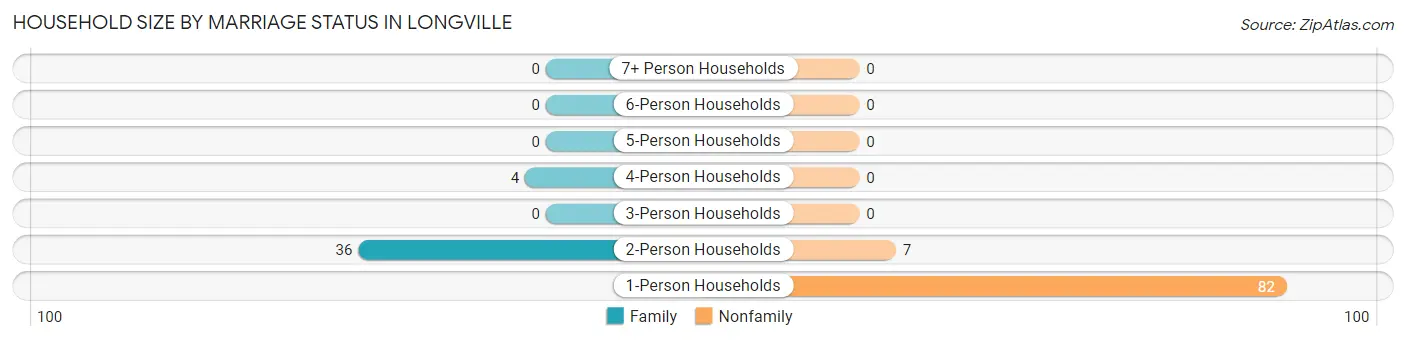
Household Size by Marriage Status in Longville
Out of a total of 129 households in Longville, 40 (31.0%) are family households, while 89 (69.0%) are nonfamily households. The most numerous type of family households are 2-person households, comprising 36, and the most common type of nonfamily households are 1-person households, comprising 82.
| Household Size | Family Households | Nonfamily Households |
| 1-Person Households | - | 82 (63.6%) |
| 2-Person Households | 36 (27.9%) | 7 (5.4%) |
| 3-Person Households | 0 (0.0%) | 0 (0.0%) |
| 4-Person Households | 4 (3.1%) | 0 (0.0%) |
| 5-Person Households | 0 (0.0%) | 0 (0.0%) |
| 6-Person Households | 0 (0.0%) | 0 (0.0%) |
| 7+ Person Households | 0 (0.0%) | 0 (0.0%) |
| Total | 40 (31.0%) | 89 (69.0%) |
Female Fertility in Longville
Fertility by Age in Longville
| Age Bracket | Women with Births | Births / 1,000 Women |
| 15 to 19 years | 0 (0.0%) | 0.0 |
| 20 to 34 years | 0 (0.0%) | 0.0 |
| 35 to 50 years | 0 (0.0%) | 0.0 |
| Total | 0 (0.0%) | 0.0 |
Fertility by Age by Marriage Status in Longville
| Age Bracket | Married | Unmarried |
| 15 to 19 years | 0 (0.0%) | 0 (0.0%) |
| 20 to 34 years | 0 (0.0%) | 0 (0.0%) |
| 35 to 50 years | 0 (0.0%) | 0 (0.0%) |
| Total | 0 (0.0%) | 0 (0.0%) |
Fertility by Education in Longville
| Educational Attainment | Women with Births | Births / 1,000 Women |
| Less than High School | 0 (0.0%) | 0.0 |
| High School Diploma | 0 (0.0%) | 0.0 |
| College or Associate's Degree | 0 (0.0%) | 0.0 |
| Bachelor's Degree | 0 (0.0%) | 0.0 |
| Graduate Degree | 0 (0.0%) | 0.0 |
| Total | 0 (0.0%) | 0.0 |
Fertility by Education by Marriage Status in Longville
| Educational Attainment | Married | Unmarried |
| Less than High School | 0 (0.0%) | 0 (0.0%) |
| High School Diploma | 0 (0.0%) | 0 (0.0%) |
| College or Associate's Degree | 0 (0.0%) | 0 (0.0%) |
| Bachelor's Degree | 0 (0.0%) | 0 (0.0%) |
| Graduate Degree | 0 (0.0%) | 0 (0.0%) |
| Total | 0 (0.0%) | 0 (0.0%) |
Employment Characteristics in Longville
Employment by Class of Employer in Longville
Among the 50 employed individuals in Longville, private company employees (33 | 66.0%), not-for-profit organizations (10 | 20.0%), and self-employed (not incorporated) (5 | 10.0%) make up the most common classes of employment.
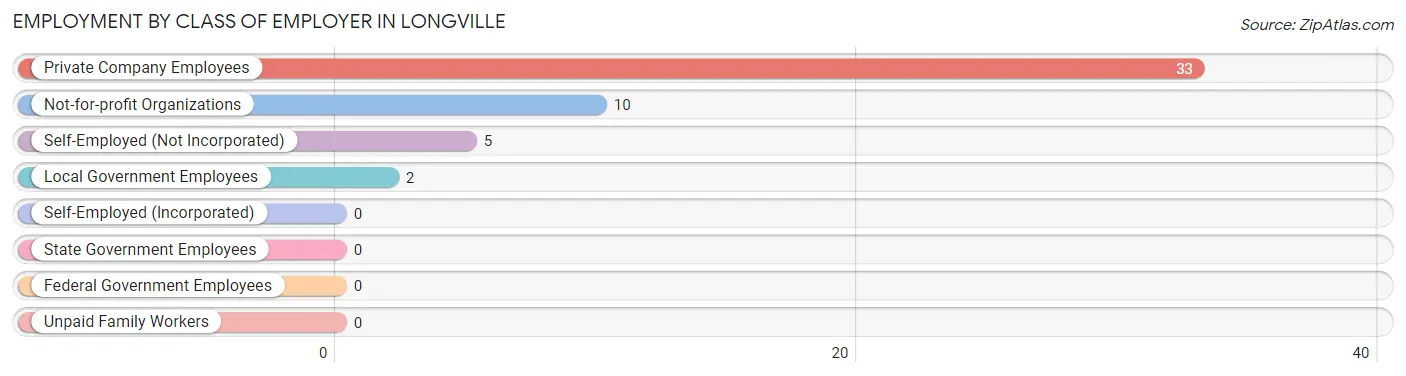
| Employer Class | # Employees | % Employees |
| Private Company Employees | 33 | 66.0% |
| Self-Employed (Incorporated) | 0 | 0.0% |
| Self-Employed (Not Incorporated) | 5 | 10.0% |
| Not-for-profit Organizations | 10 | 20.0% |
| Local Government Employees | 2 | 4.0% |
| State Government Employees | 0 | 0.0% |
| Federal Government Employees | 0 | 0.0% |
| Unpaid Family Workers | 0 | 0.0% |
| Total | 50 | 100.0% |
Employment Status by Age in Longville
According to the labor force statistics for Longville, out of the total population over 16 years of age (183), 31.7% or 58 individuals are in the labor force, with 12.1% or 7 of them unemployed. The age group with the highest labor force participation rate is 20 to 24 years, with 100.0% or 11 individuals in the labor force. Within the labor force, the 20 to 24 years age range has the highest percentage of unemployed individuals, with 63.6% or 7 of them being unemployed.
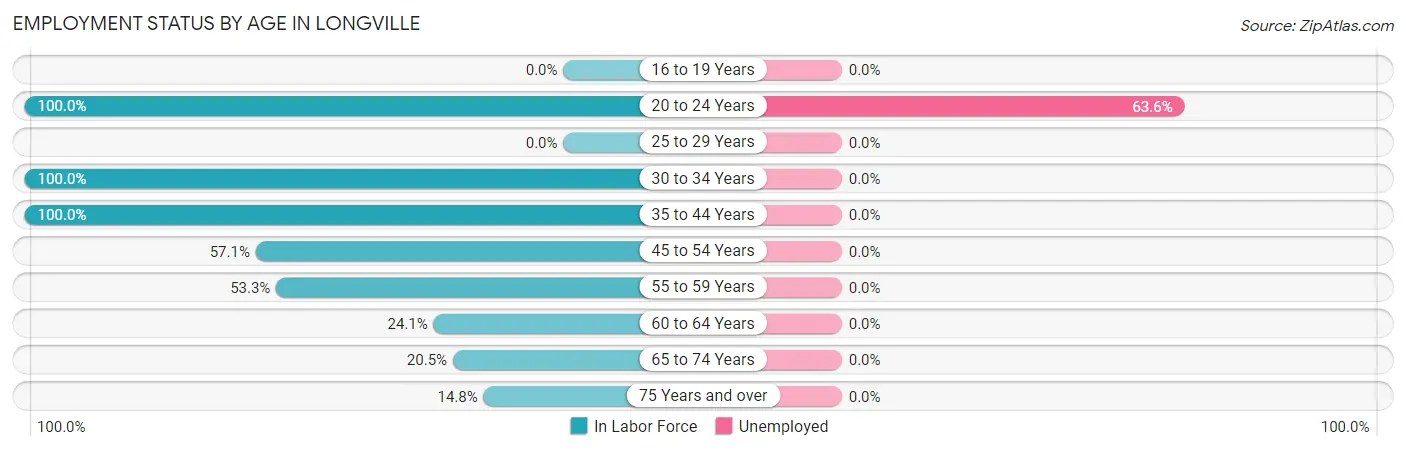
| Age Bracket | In Labor Force | Unemployed |
| 16 to 19 Years | 0 (0.0%) | 0 (0.0%) |
| 20 to 24 Years | 11 (100.0%) | 7 (63.6%) |
| 25 to 29 Years | 0 (0.0%) | 0 (0.0%) |
| 30 to 34 Years | 3 (100.0%) | 0 (0.0%) |
| 35 to 44 Years | 3 (100.0%) | 0 (0.0%) |
| 45 to 54 Years | 4 (57.1%) | 0 (0.0%) |
| 55 to 59 Years | 8 (53.3%) | 0 (0.0%) |
| 60 to 64 Years | 7 (24.1%) | 0 (0.0%) |
| 65 to 74 Years | 18 (20.5%) | 0 (0.0%) |
| 75 Years and over | 4 (14.8%) | 0 (0.0%) |
| Total | 58 (31.7%) | 7 (12.1%) |
Employment Status by Educational Attainment in Longville
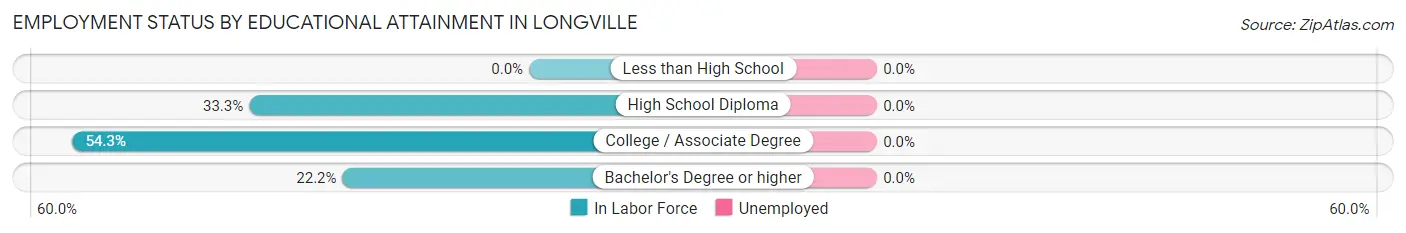
| Educational Attainment | In Labor Force | Unemployed |
| Less than High School | 0 (0.0%) | 0 (0.0%) |
| High School Diploma | 4 (33.3%) | 0 (0.0%) |
| College / Associate Degree | 19 (54.3%) | 0 (0.0%) |
| Bachelor's Degree or higher | 2 (22.2%) | 0 (0.0%) |
| Total | 25 (43.9%) | 0 (0.0%) |
Employment Occupations by Sex in Longville
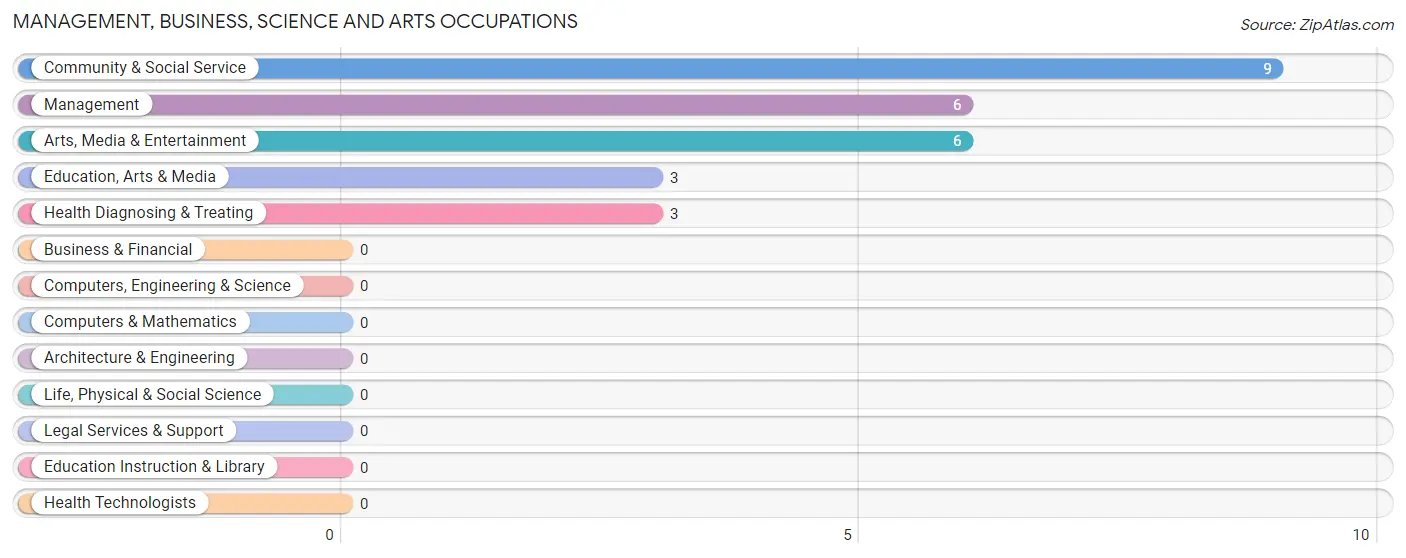
Management, Business, Science and Arts Occupations
The most common Management, Business, Science and Arts occupations in Longville are Community & Social Service (9 | 17.6%), Management (6 | 11.8%), Arts, Media & Entertainment (6 | 11.8%), Education, Arts & Media (3 | 5.9%), and Health Diagnosing & Treating (3 | 5.9%).
Management, Business, Science and Arts Occupations by Sex
Within the Management, Business, Science and Arts occupations in Longville, the most male-oriented occupations are Education, Arts & Media (100.0%), Community & Social Service (55.6%), and Management (50.0%), while the most female-oriented occupations are Health Diagnosing & Treating (100.0%), Arts, Media & Entertainment (66.7%), and Management (50.0%).
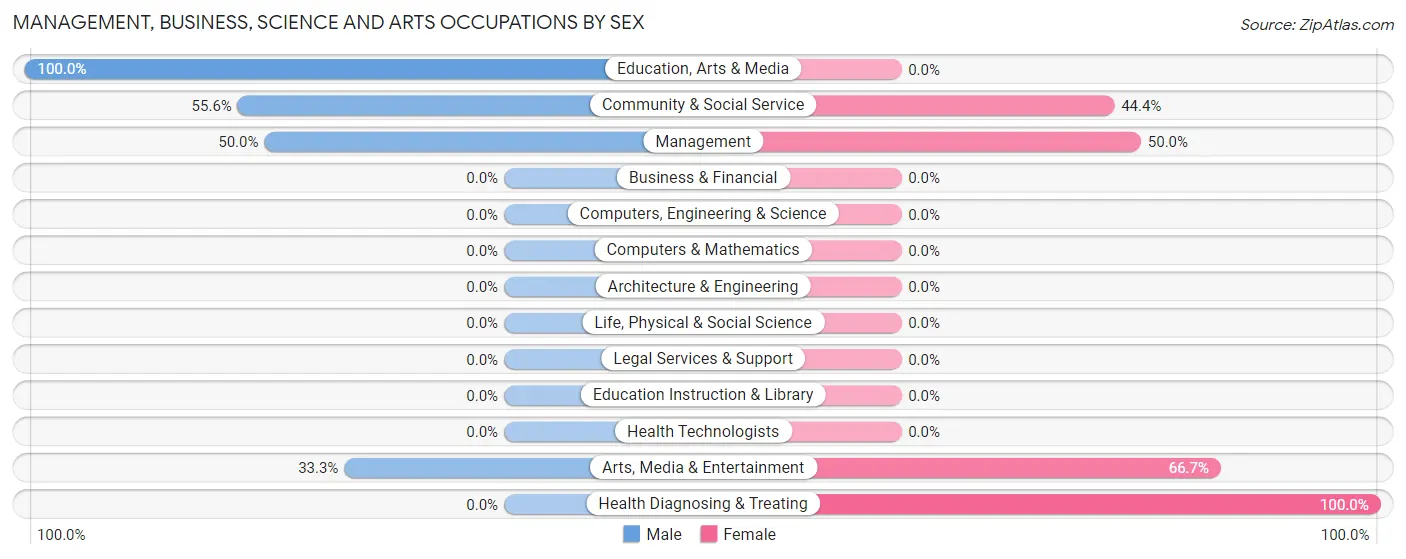
| Occupation | Male | Female |
| Management | 3 (50.0%) | 3 (50.0%) |
| Business & Financial | 0 (0.0%) | 0 (0.0%) |
| Computers, Engineering & Science | 0 (0.0%) | 0 (0.0%) |
| Computers & Mathematics | 0 (0.0%) | 0 (0.0%) |
| Architecture & Engineering | 0 (0.0%) | 0 (0.0%) |
| Life, Physical & Social Science | 0 (0.0%) | 0 (0.0%) |
| Community & Social Service | 5 (55.6%) | 4 (44.4%) |
| Education, Arts & Media | 3 (100.0%) | 0 (0.0%) |
| Legal Services & Support | 0 (0.0%) | 0 (0.0%) |
| Education Instruction & Library | 0 (0.0%) | 0 (0.0%) |
| Arts, Media & Entertainment | 2 (33.3%) | 4 (66.7%) |
| Health Diagnosing & Treating | 0 (0.0%) | 3 (100.0%) |
| Health Technologists | 0 (0.0%) | 0 (0.0%) |
| Total (Category) | 8 (44.4%) | 10 (55.6%) |
| Total (Overall) | 25 (49.0%) | 26 (51.0%) |
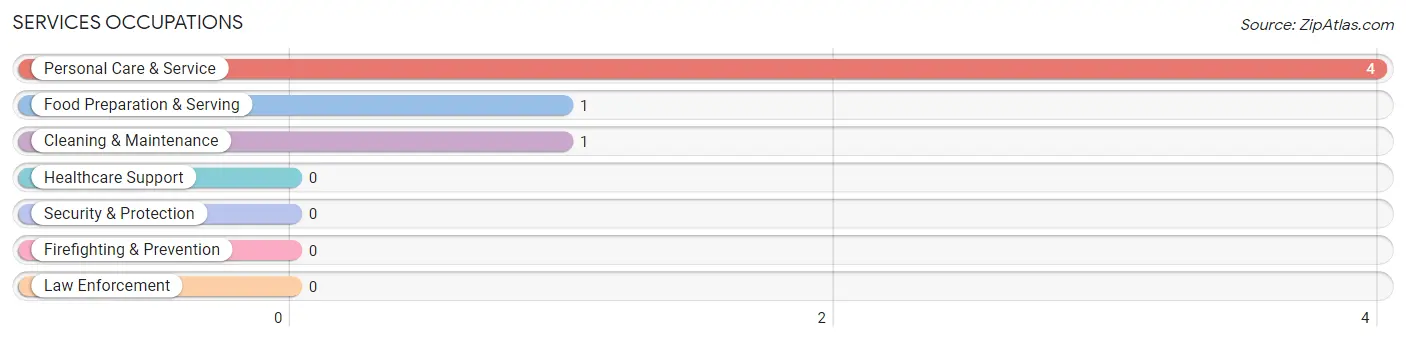
Services Occupations
The most common Services occupations in Longville are Personal Care & Service (4 | 7.8%), Food Preparation & Serving (1 | 2.0%), and Cleaning & Maintenance (1 | 2.0%).
Services Occupations by Sex
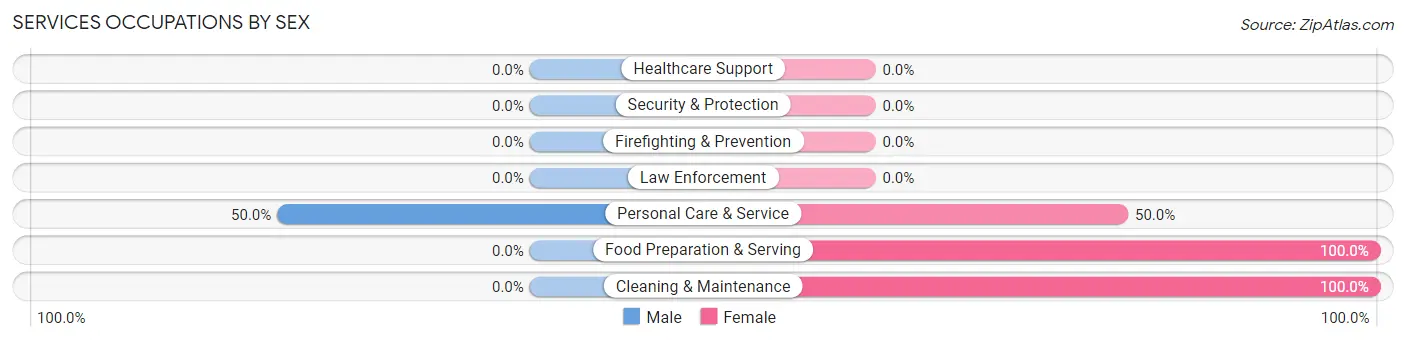
| Occupation | Male | Female |
| Healthcare Support | 0 (0.0%) | 0 (0.0%) |
| Security & Protection | 0 (0.0%) | 0 (0.0%) |
| Firefighting & Prevention | 0 (0.0%) | 0 (0.0%) |
| Law Enforcement | 0 (0.0%) | 0 (0.0%) |
| Food Preparation & Serving | 0 (0.0%) | 1 (100.0%) |
| Cleaning & Maintenance | 0 (0.0%) | 1 (100.0%) |
| Personal Care & Service | 2 (50.0%) | 2 (50.0%) |
| Total (Category) | 2 (33.3%) | 4 (66.7%) |
| Total (Overall) | 25 (49.0%) | 26 (51.0%) |
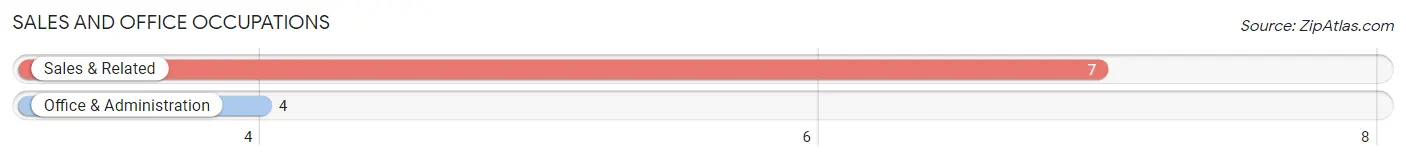
Sales and Office Occupations
The most common Sales and Office occupations in Longville are Sales & Related (7 | 13.7%), and Office & Administration (4 | 7.8%).
Sales and Office Occupations by Sex
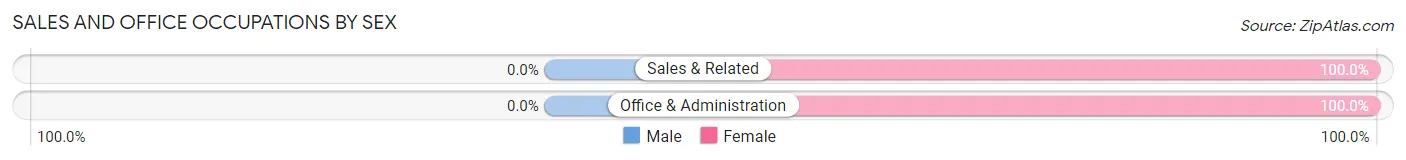
| Occupation | Male | Female |
| Sales & Related | 0 (0.0%) | 7 (100.0%) |
| Office & Administration | 0 (0.0%) | 4 (100.0%) |
| Total (Category) | 0 (0.0%) | 11 (100.0%) |
| Total (Overall) | 25 (49.0%) | 26 (51.0%) |
Natural Resources, Construction and Maintenance Occupations
The most common Natural Resources, Construction and Maintenance occupations in Longville are Construction & Extraction (4 | 7.8%), and Installation, Maintenance & Repair (3 | 5.9%).
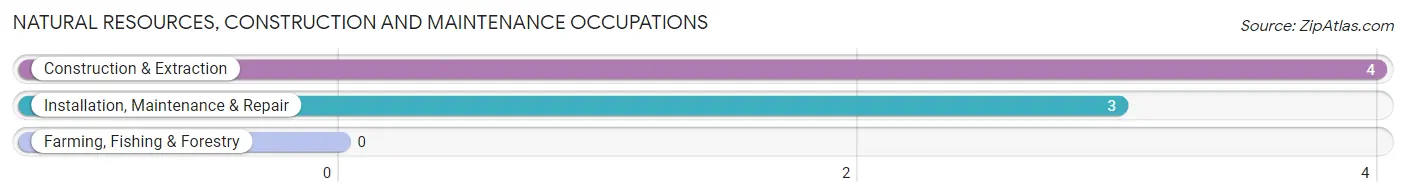
Natural Resources, Construction and Maintenance Occupations by Sex

| Occupation | Male | Female |
| Farming, Fishing & Forestry | 0 (0.0%) | 0 (0.0%) |
| Construction & Extraction | 4 (100.0%) | 0 (0.0%) |
| Installation, Maintenance & Repair | 3 (100.0%) | 0 (0.0%) |
| Total (Category) | 7 (100.0%) | 0 (0.0%) |
| Total (Overall) | 25 (49.0%) | 26 (51.0%) |
Production, Transportation and Moving Occupations
The most common Production, Transportation and Moving occupations in Longville are Production (4 | 7.8%), Transportation (3 | 5.9%), and Material Moving (2 | 3.9%).
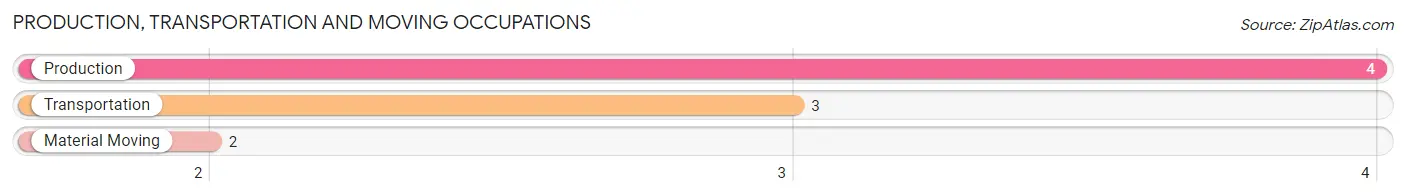
Production, Transportation and Moving Occupations by Sex
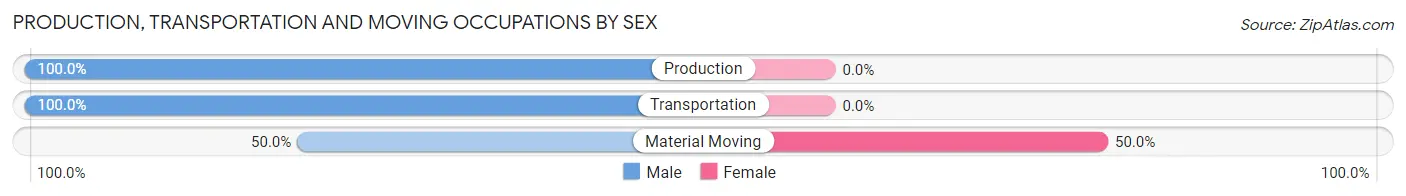
| Occupation | Male | Female |
| Production | 4 (100.0%) | 0 (0.0%) |
| Transportation | 3 (100.0%) | 0 (0.0%) |
| Material Moving | 1 (50.0%) | 1 (50.0%) |
| Total (Category) | 8 (88.9%) | 1 (11.1%) |
| Total (Overall) | 25 (49.0%) | 26 (51.0%) |
Employment Industries by Sex in Longville
Employment Industries in Longville
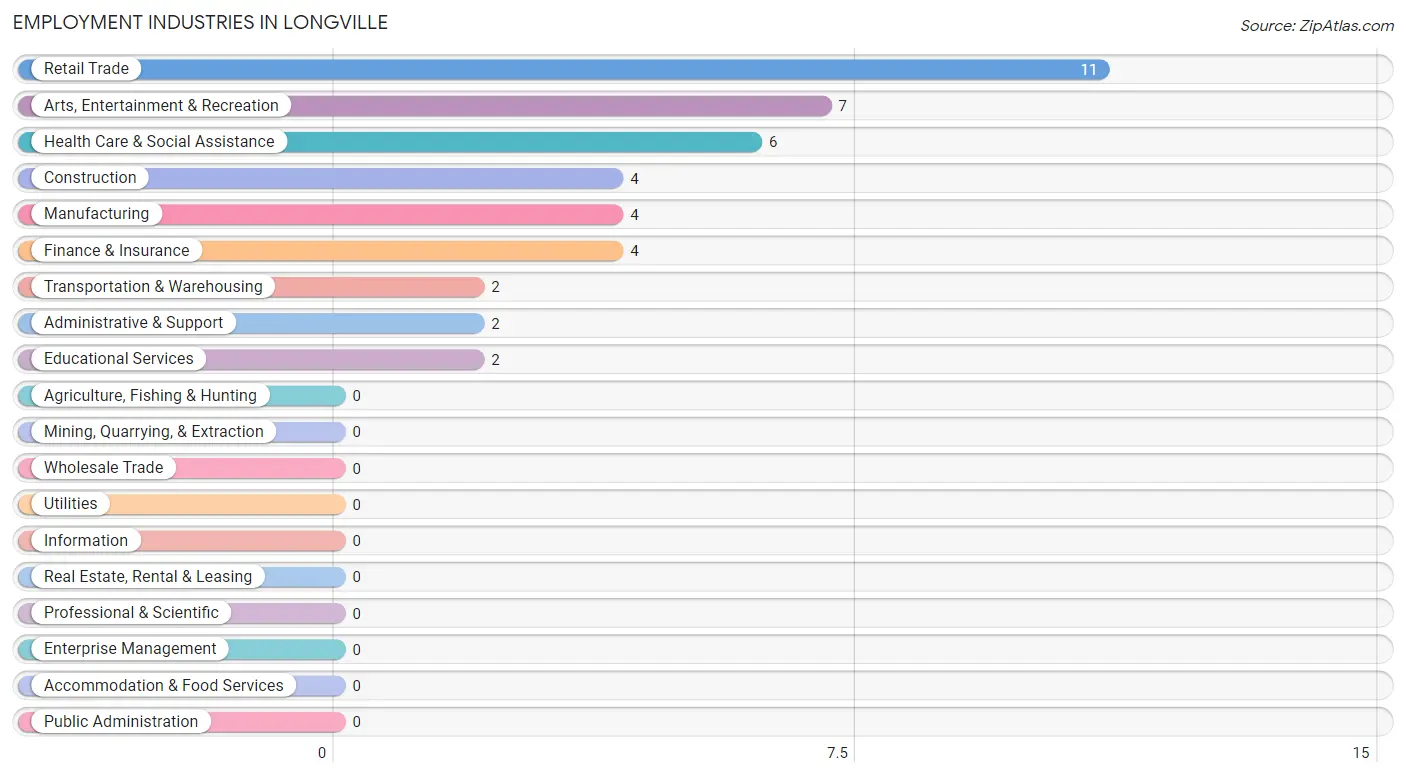
The major employment industries in Longville include Retail Trade (11 | 21.6%), Arts, Entertainment & Recreation (7 | 13.7%), Health Care & Social Assistance (6 | 11.8%), Construction (4 | 7.8%), and Manufacturing (4 | 7.8%).
Employment Industries by Sex in Longville
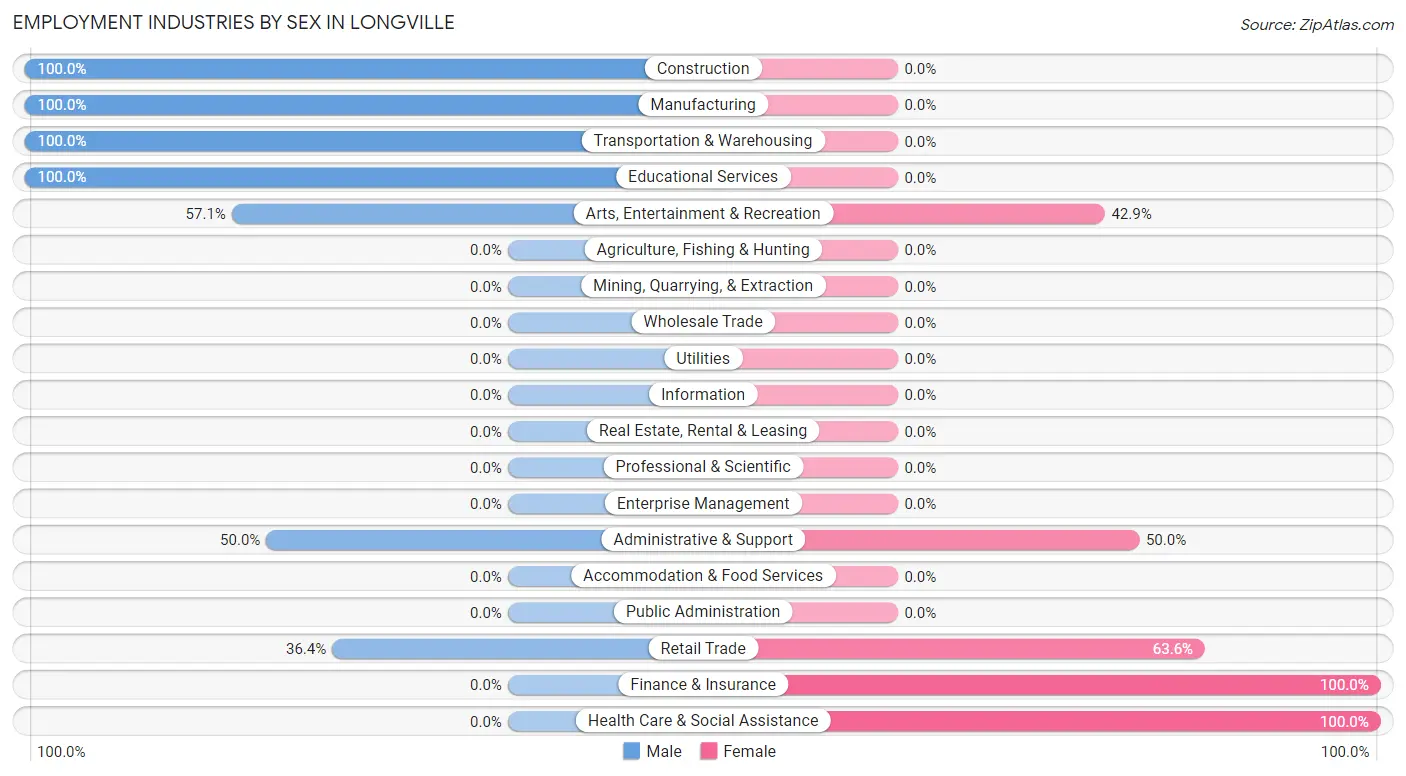
The Longville industries that see more men than women are Construction (100.0%), Manufacturing (100.0%), and Transportation & Warehousing (100.0%), whereas the industries that tend to have a higher number of women are Finance & Insurance (100.0%), Health Care & Social Assistance (100.0%), and Retail Trade (63.6%).
| Industry | Male | Female |
| Agriculture, Fishing & Hunting | 0 (0.0%) | 0 (0.0%) |
| Mining, Quarrying, & Extraction | 0 (0.0%) | 0 (0.0%) |
| Construction | 4 (100.0%) | 0 (0.0%) |
| Manufacturing | 4 (100.0%) | 0 (0.0%) |
| Wholesale Trade | 0 (0.0%) | 0 (0.0%) |
| Retail Trade | 4 (36.4%) | 7 (63.6%) |
| Transportation & Warehousing | 2 (100.0%) | 0 (0.0%) |
| Utilities | 0 (0.0%) | 0 (0.0%) |
| Information | 0 (0.0%) | 0 (0.0%) |
| Finance & Insurance | 0 (0.0%) | 4 (100.0%) |
| Real Estate, Rental & Leasing | 0 (0.0%) | 0 (0.0%) |
| Professional & Scientific | 0 (0.0%) | 0 (0.0%) |
| Enterprise Management | 0 (0.0%) | 0 (0.0%) |
| Administrative & Support | 1 (50.0%) | 1 (50.0%) |
| Educational Services | 2 (100.0%) | 0 (0.0%) |
| Health Care & Social Assistance | 0 (0.0%) | 6 (100.0%) |
| Arts, Entertainment & Recreation | 4 (57.1%) | 3 (42.9%) |
| Accommodation & Food Services | 0 (0.0%) | 0 (0.0%) |
| Public Administration | 0 (0.0%) | 0 (0.0%) |
| Total | 25 (49.0%) | 26 (51.0%) |
Education in Longville
School Enrollment in Longville
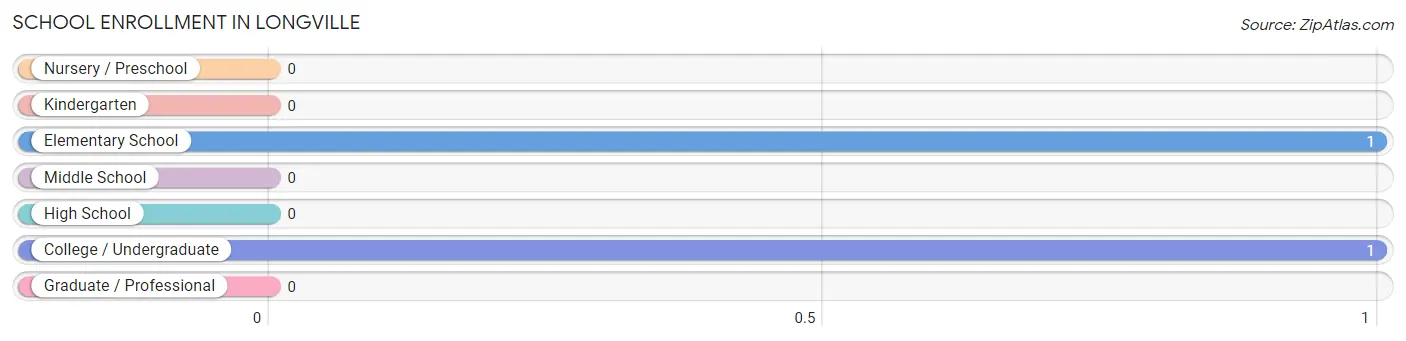
The most common levels of schooling among the 2 students in Longville are elementary school (1 | 50.0%), and college / undergraduate (1 | 50.0%).
| School Level | # Students | % Students |
| Nursery / Preschool | 0 | 0.0% |
| Kindergarten | 0 | 0.0% |
| Elementary School | 1 | 50.0% |
| Middle School | 0 | 0.0% |
| High School | 0 | 0.0% |
| College / Undergraduate | 1 | 50.0% |
| Graduate / Professional | 0 | 0.0% |
| Total | 2 | 100.0% |
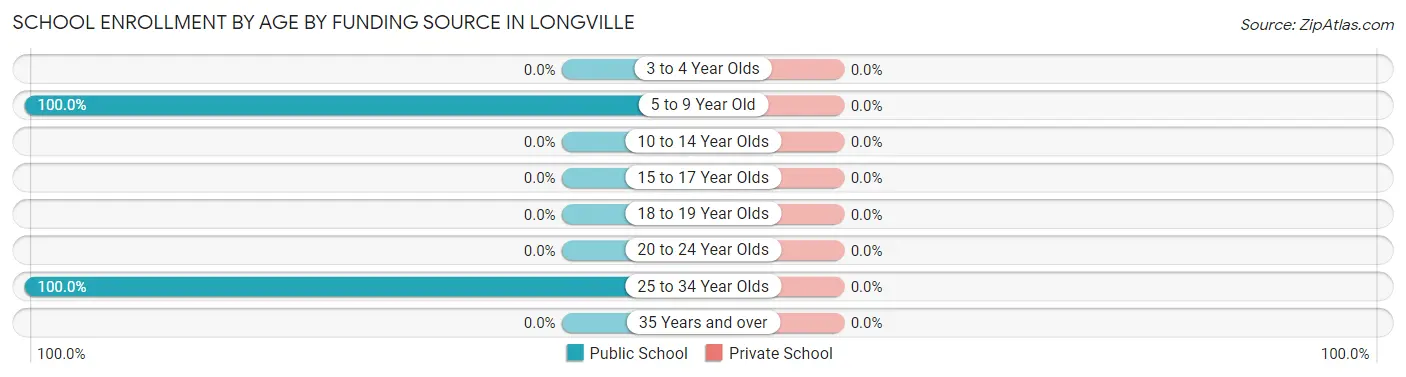
School Enrollment by Age by Funding Source in Longville
| Age Bracket | Public School | Private School |
| 3 to 4 Year Olds | 0 (0.0%) | 0 (0.0%) |
| 5 to 9 Year Old | 1 (100.0%) | 0 (0.0%) |
| 10 to 14 Year Olds | 0 (0.0%) | 0 (0.0%) |
| 15 to 17 Year Olds | 0 (0.0%) | 0 (0.0%) |
| 18 to 19 Year Olds | 0 (0.0%) | 0 (0.0%) |
| 20 to 24 Year Olds | 0 (0.0%) | 0 (0.0%) |
| 25 to 34 Year Olds | 1 (100.0%) | 0 (0.0%) |
| 35 Years and over | 0 (0.0%) | 0 (0.0%) |
| Total | 2 (100.0%) | 0 (0.0%) |
Educational Attainment by Field of Study in Longville
Education (43 | 66.1%), social sciences (6 | 9.2%), visual & performing arts (5 | 7.7%), communications (3 | 4.6%), and physical & health sciences (2 | 3.1%) are the most common fields of study among 65 individuals in Longville who have obtained a bachelor's degree or higher.
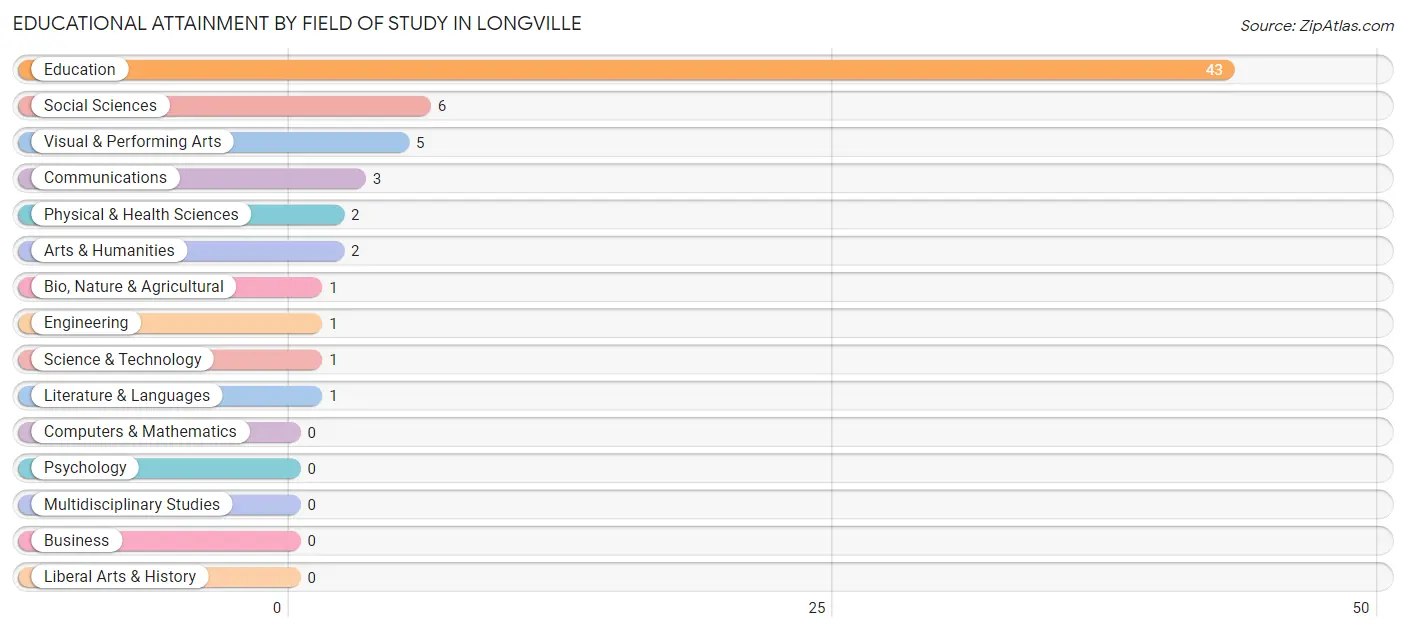
| Field of Study | # Graduates | % Graduates |
| Computers & Mathematics | 0 | 0.0% |
| Bio, Nature & Agricultural | 1 | 1.5% |
| Physical & Health Sciences | 2 | 3.1% |
| Psychology | 0 | 0.0% |
| Social Sciences | 6 | 9.2% |
| Engineering | 1 | 1.5% |
| Multidisciplinary Studies | 0 | 0.0% |
| Science & Technology | 1 | 1.5% |
| Business | 0 | 0.0% |
| Education | 43 | 66.1% |
| Literature & Languages | 1 | 1.5% |
| Liberal Arts & History | 0 | 0.0% |
| Visual & Performing Arts | 5 | 7.7% |
| Communications | 3 | 4.6% |
| Arts & Humanities | 2 | 3.1% |
| Total | 65 | 100.0% |
Transportation & Commute in Longville
Vehicle Availability by Sex in Longville
The most prevalent vehicle ownership categories in Longville are males with 2 vehicles (12, accounting for 50.0%) and females with 2 vehicles (8, making up 46.2%).
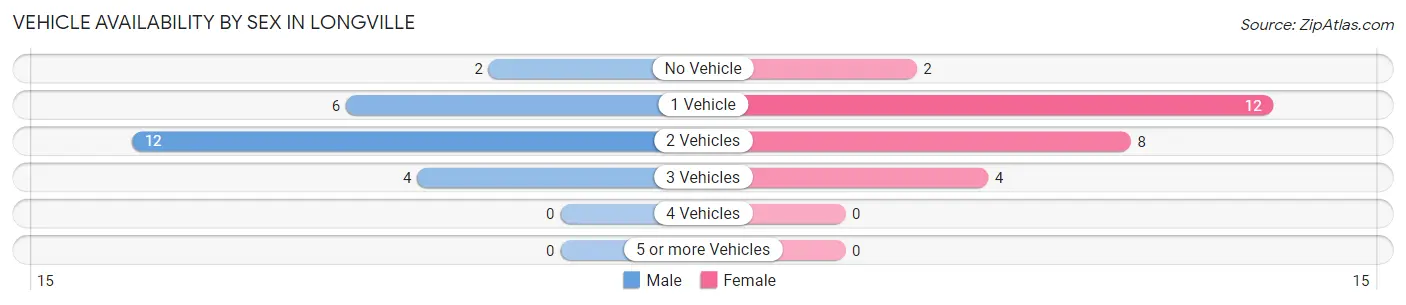
| Vehicles Available | Male | Female |
| No Vehicle | 2 (8.3%) | 2 (7.7%) |
| 1 Vehicle | 6 (25.0%) | 12 (46.2%) |
| 2 Vehicles | 12 (50.0%) | 8 (30.8%) |
| 3 Vehicles | 4 (16.7%) | 4 (15.4%) |
| 4 Vehicles | 0 (0.0%) | 0 (0.0%) |
| 5 or more Vehicles | 0 (0.0%) | 0 (0.0%) |
| Total | 24 (100.0%) | 26 (100.0%) |
Commute Time in Longville
The most frequently occuring commute durations in Longville are less than 5 minutes (15 commuters, 34.9%), 5 to 9 minutes (8 commuters, 18.6%), and 30 to 34 minutes (8 commuters, 18.6%).
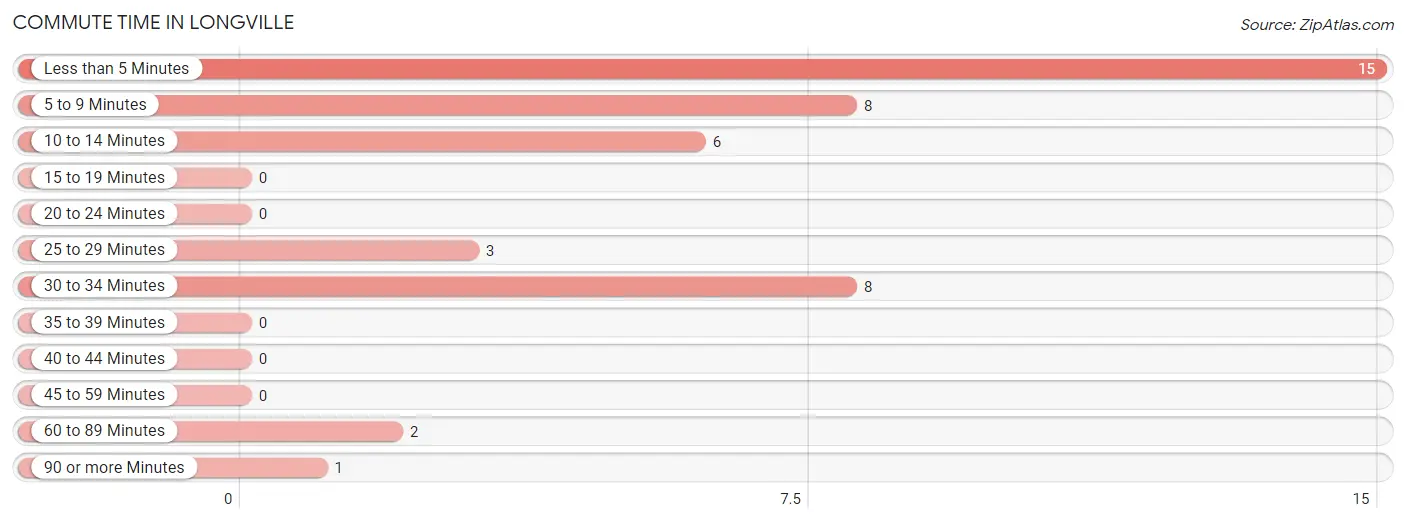
| Commute Time | # Commuters | % Commuters |
| Less than 5 Minutes | 15 | 34.9% |
| 5 to 9 Minutes | 8 | 18.6% |
| 10 to 14 Minutes | 6 | 14.0% |
| 15 to 19 Minutes | 0 | 0.0% |
| 20 to 24 Minutes | 0 | 0.0% |
| 25 to 29 Minutes | 3 | 7.0% |
| 30 to 34 Minutes | 8 | 18.6% |
| 35 to 39 Minutes | 0 | 0.0% |
| 40 to 44 Minutes | 0 | 0.0% |
| 45 to 59 Minutes | 0 | 0.0% |
| 60 to 89 Minutes | 2 | 4.6% |
| 90 or more Minutes | 1 | 2.3% |
Commute Time by Sex in Longville
The most common commute times in Longville are less than 5 minutes (7 commuters, 33.3%) for males and less than 5 minutes (8 commuters, 36.4%) for females.
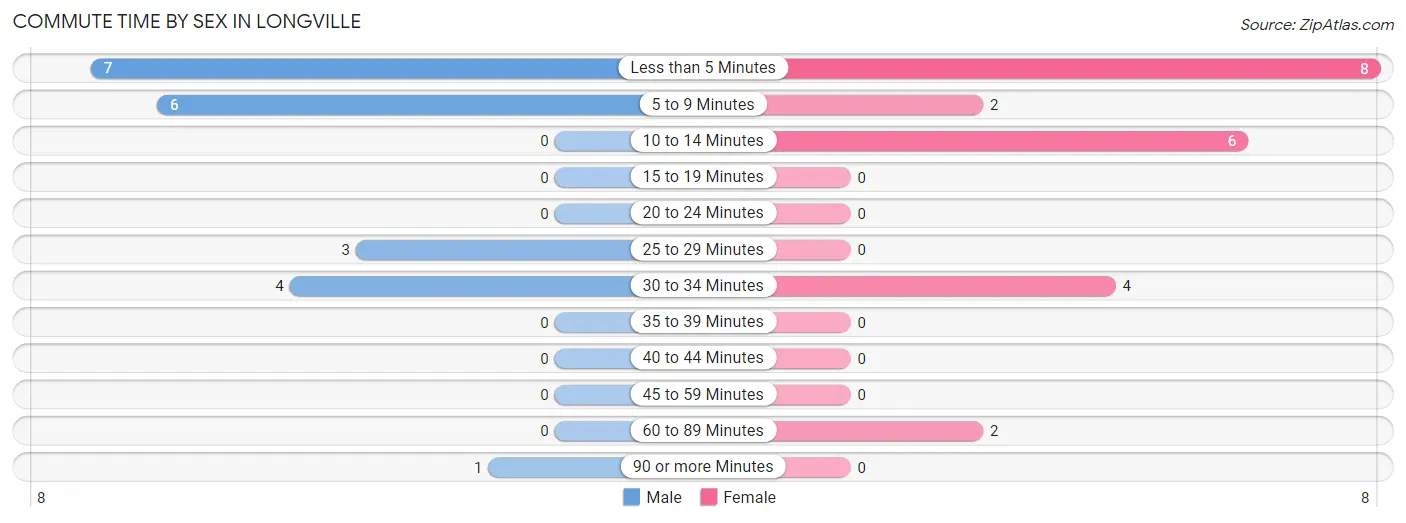
| Commute Time | Male | Female |
| Less than 5 Minutes | 7 (33.3%) | 8 (36.4%) |
| 5 to 9 Minutes | 6 (28.6%) | 2 (9.1%) |
| 10 to 14 Minutes | 0 (0.0%) | 6 (27.3%) |
| 15 to 19 Minutes | 0 (0.0%) | 0 (0.0%) |
| 20 to 24 Minutes | 0 (0.0%) | 0 (0.0%) |
| 25 to 29 Minutes | 3 (14.3%) | 0 (0.0%) |
| 30 to 34 Minutes | 4 (19.1%) | 4 (18.2%) |
| 35 to 39 Minutes | 0 (0.0%) | 0 (0.0%) |
| 40 to 44 Minutes | 0 (0.0%) | 0 (0.0%) |
| 45 to 59 Minutes | 0 (0.0%) | 0 (0.0%) |
| 60 to 89 Minutes | 0 (0.0%) | 2 (9.1%) |
| 90 or more Minutes | 1 (4.8%) | 0 (0.0%) |
Time of Departure to Work by Sex in Longville
The most frequent times of departure to work in Longville are 7:30 AM to 7:59 AM (8, 38.1%) for males and 7:00 AM to 7:29 AM (8, 36.4%) for females.
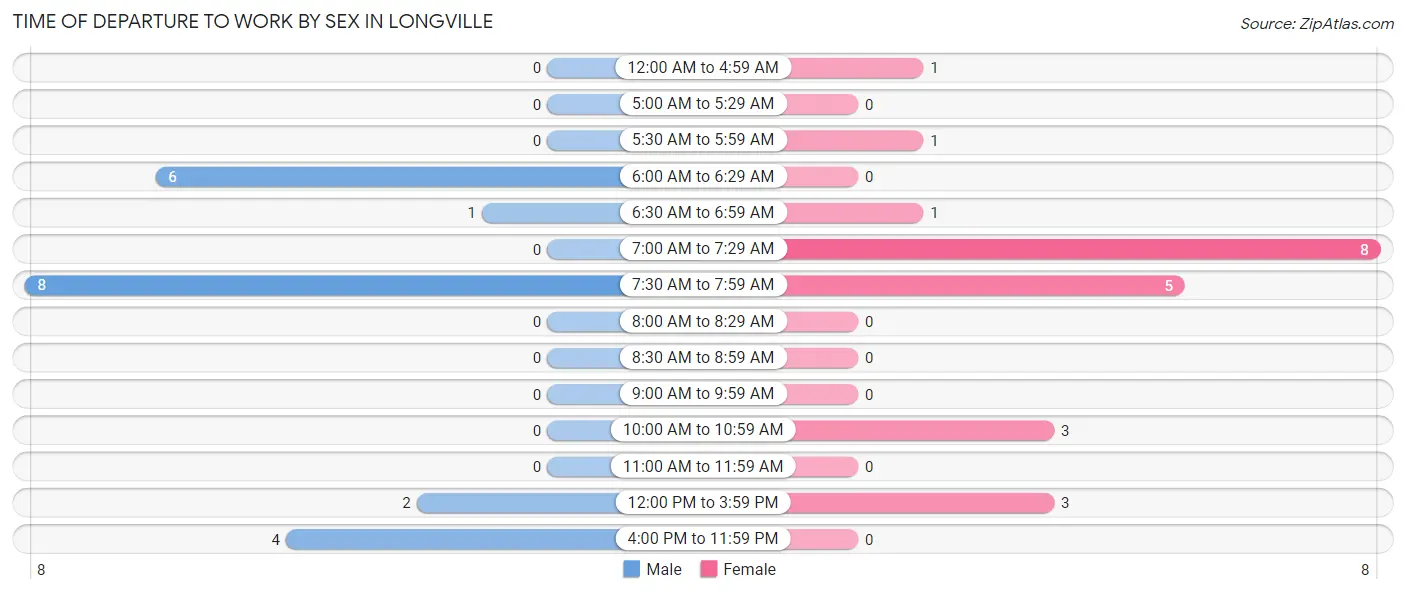
| Time of Departure | Male | Female |
| 12:00 AM to 4:59 AM | 0 (0.0%) | 1 (4.5%) |
| 5:00 AM to 5:29 AM | 0 (0.0%) | 0 (0.0%) |
| 5:30 AM to 5:59 AM | 0 (0.0%) | 1 (4.5%) |
| 6:00 AM to 6:29 AM | 6 (28.6%) | 0 (0.0%) |
| 6:30 AM to 6:59 AM | 1 (4.8%) | 1 (4.5%) |
| 7:00 AM to 7:29 AM | 0 (0.0%) | 8 (36.4%) |
| 7:30 AM to 7:59 AM | 8 (38.1%) | 5 (22.7%) |
| 8:00 AM to 8:29 AM | 0 (0.0%) | 0 (0.0%) |
| 8:30 AM to 8:59 AM | 0 (0.0%) | 0 (0.0%) |
| 9:00 AM to 9:59 AM | 0 (0.0%) | 0 (0.0%) |
| 10:00 AM to 10:59 AM | 0 (0.0%) | 3 (13.6%) |
| 11:00 AM to 11:59 AM | 0 (0.0%) | 0 (0.0%) |
| 12:00 PM to 3:59 PM | 2 (9.5%) | 3 (13.6%) |
| 4:00 PM to 11:59 PM | 4 (19.1%) | 0 (0.0%) |
| Total | 21 (100.0%) | 22 (100.0%) |
Housing Occupancy in Longville
Occupancy by Ownership in Longville
Of the total 129 dwellings in Longville, owner-occupied units account for 111 (86.1%), while renter-occupied units make up 18 (14.0%).
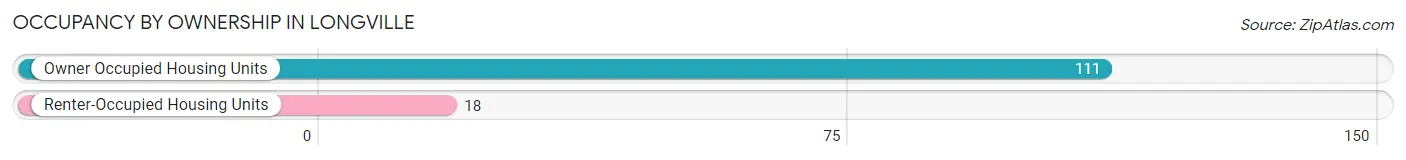
| Occupancy | # Housing Units | % Housing Units |
| Owner Occupied Housing Units | 111 | 86.1% |
| Renter-Occupied Housing Units | 18 | 14.0% |
| Total Occupied Housing Units | 129 | 100.0% |
Occupancy by Household Size in Longville
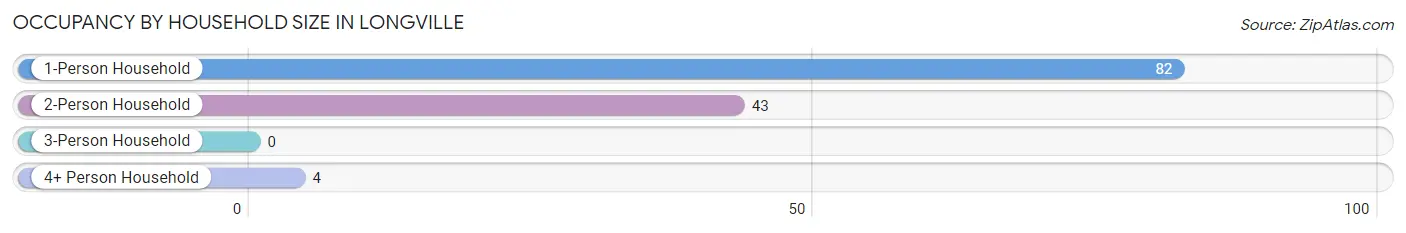
| Household Size | # Housing Units | % Housing Units |
| 1-Person Household | 82 | 63.6% |
| 2-Person Household | 43 | 33.3% |
| 3-Person Household | 0 | 0.0% |
| 4+ Person Household | 4 | 3.1% |
| Total Housing Units | 129 | 100.0% |
Occupancy by Ownership by Household Size in Longville
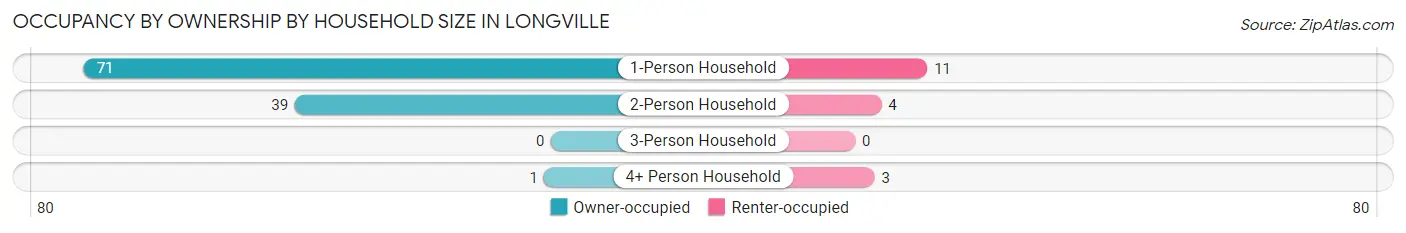
| Household Size | Owner-occupied | Renter-occupied |
| 1-Person Household | 71 (86.6%) | 11 (13.4%) |
| 2-Person Household | 39 (90.7%) | 4 (9.3%) |
| 3-Person Household | 0 (0.0%) | 0 (0.0%) |
| 4+ Person Household | 1 (25.0%) | 3 (75.0%) |
| Total Housing Units | 111 (86.1%) | 18 (14.0%) |
Occupancy by Educational Attainment in Longville
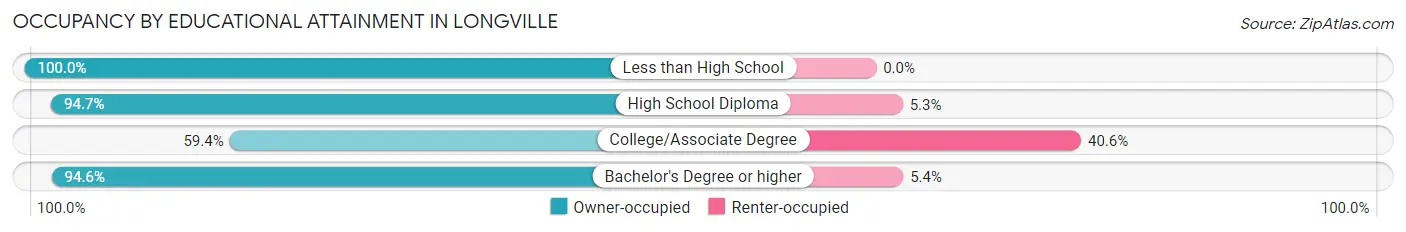
| Household Size | Owner-occupied | Renter-occupied |
| Less than High School | 3 (100.0%) | 0 (0.0%) |
| High School Diploma | 36 (94.7%) | 2 (5.3%) |
| College/Associate Degree | 19 (59.4%) | 13 (40.6%) |
| Bachelor's Degree or higher | 53 (94.6%) | 3 (5.4%) |
Occupancy by Age of Householder in Longville
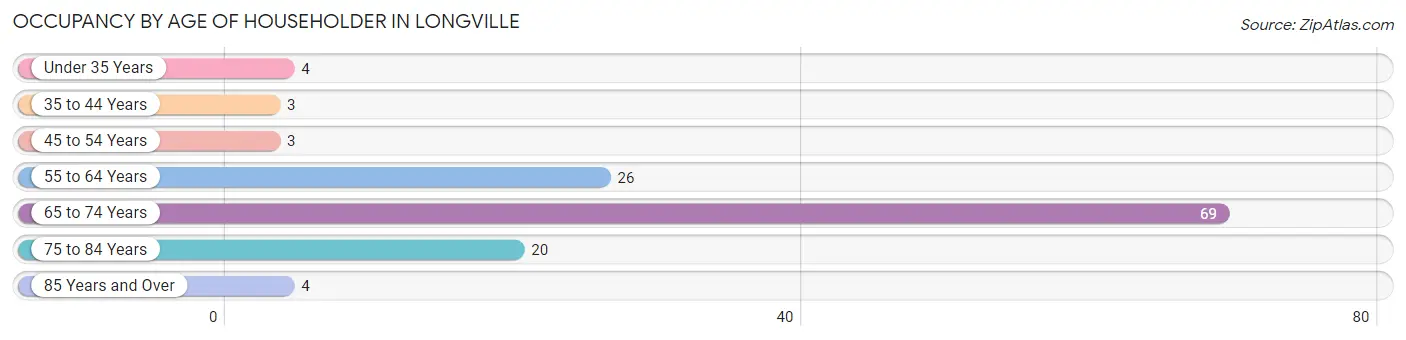
| Age Bracket | # Households | % Households |
| Under 35 Years | 4 | 3.1% |
| 35 to 44 Years | 3 | 2.3% |
| 45 to 54 Years | 3 | 2.3% |
| 55 to 64 Years | 26 | 20.2% |
| 65 to 74 Years | 69 | 53.5% |
| 75 to 84 Years | 20 | 15.5% |
| 85 Years and Over | 4 | 3.1% |
| Total | 129 | 100.0% |
Housing Finances in Longville
Median Income by Occupancy in Longville
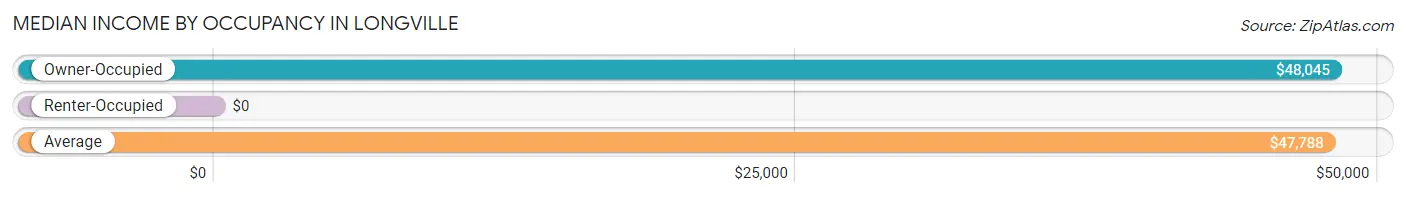
| Occupancy Type | # Households | Median Income |
| Owner-Occupied | 111 (86.1%) | $48,045 |
| Renter-Occupied | 18 (14.0%) | $0 |
| Average | 129 (100.0%) | $47,788 |
Occupancy by Householder Income Bracket in Longville
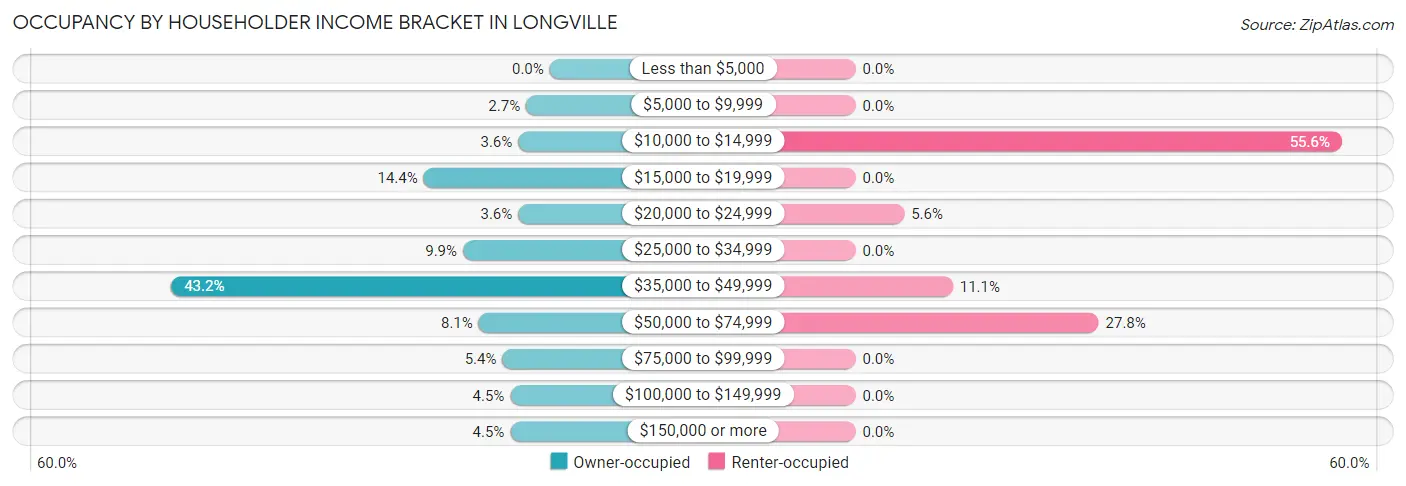
| Income Bracket | Owner-occupied | Renter-occupied |
| Less than $5,000 | 0 (0.0%) | 0 (0.0%) |
| $5,000 to $9,999 | 3 (2.7%) | 0 (0.0%) |
| $10,000 to $14,999 | 4 (3.6%) | 10 (55.6%) |
| $15,000 to $19,999 | 16 (14.4%) | 0 (0.0%) |
| $20,000 to $24,999 | 4 (3.6%) | 1 (5.6%) |
| $25,000 to $34,999 | 11 (9.9%) | 0 (0.0%) |
| $35,000 to $49,999 | 48 (43.2%) | 2 (11.1%) |
| $50,000 to $74,999 | 9 (8.1%) | 5 (27.8%) |
| $75,000 to $99,999 | 6 (5.4%) | 0 (0.0%) |
| $100,000 to $149,999 | 5 (4.5%) | 0 (0.0%) |
| $150,000 or more | 5 (4.5%) | 0 (0.0%) |
| Total | 111 (100.0%) | 18 (100.0%) |
Monthly Housing Cost Tiers in Longville
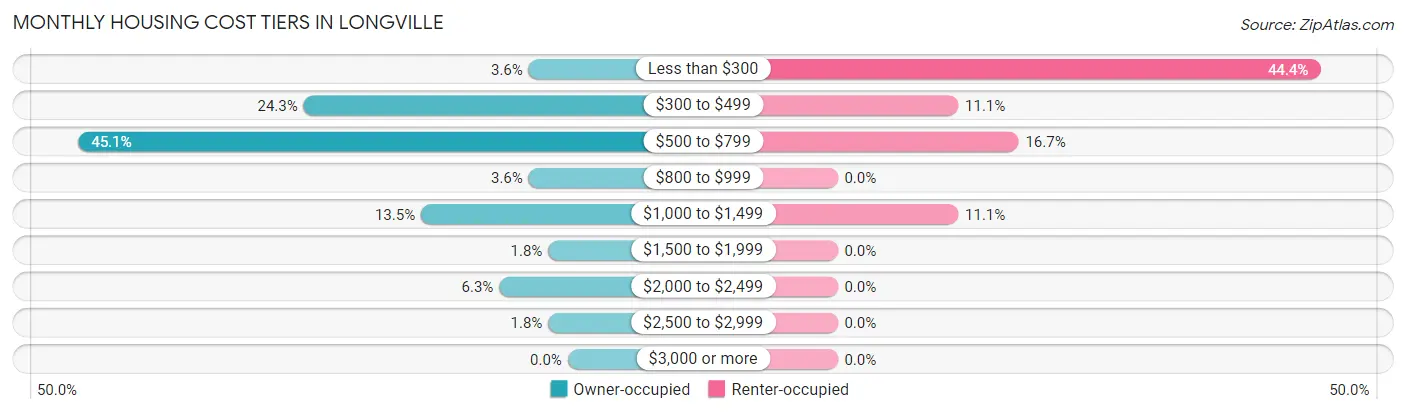
| Monthly Cost | Owner-occupied | Renter-occupied |
| Less than $300 | 4 (3.6%) | 8 (44.4%) |
| $300 to $499 | 27 (24.3%) | 2 (11.1%) |
| $500 to $799 | 50 (45.1%) | 3 (16.7%) |
| $800 to $999 | 4 (3.6%) | 0 (0.0%) |
| $1,000 to $1,499 | 15 (13.5%) | 2 (11.1%) |
| $1,500 to $1,999 | 2 (1.8%) | 0 (0.0%) |
| $2,000 to $2,499 | 7 (6.3%) | 0 (0.0%) |
| $2,500 to $2,999 | 2 (1.8%) | 0 (0.0%) |
| $3,000 or more | 0 (0.0%) | 0 (0.0%) |
| Total | 111 (100.0%) | 18 (100.0%) |
Physical Housing Characteristics in Longville
Housing Structures in Longville
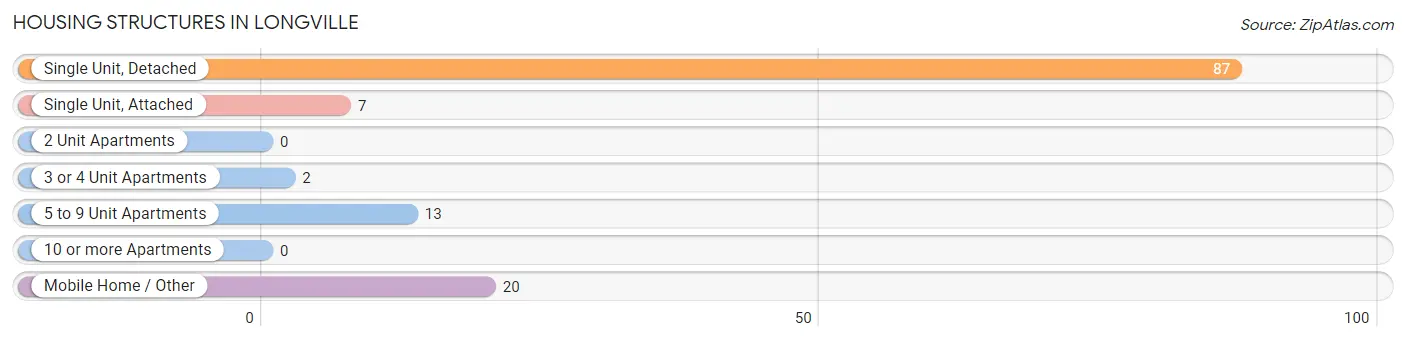
| Structure Type | # Housing Units | % Housing Units |
| Single Unit, Detached | 87 | 67.4% |
| Single Unit, Attached | 7 | 5.4% |
| 2 Unit Apartments | 0 | 0.0% |
| 3 or 4 Unit Apartments | 2 | 1.5% |
| 5 to 9 Unit Apartments | 13 | 10.1% |
| 10 or more Apartments | 0 | 0.0% |
| Mobile Home / Other | 20 | 15.5% |
| Total | 129 | 100.0% |
Housing Structures by Occupancy in Longville
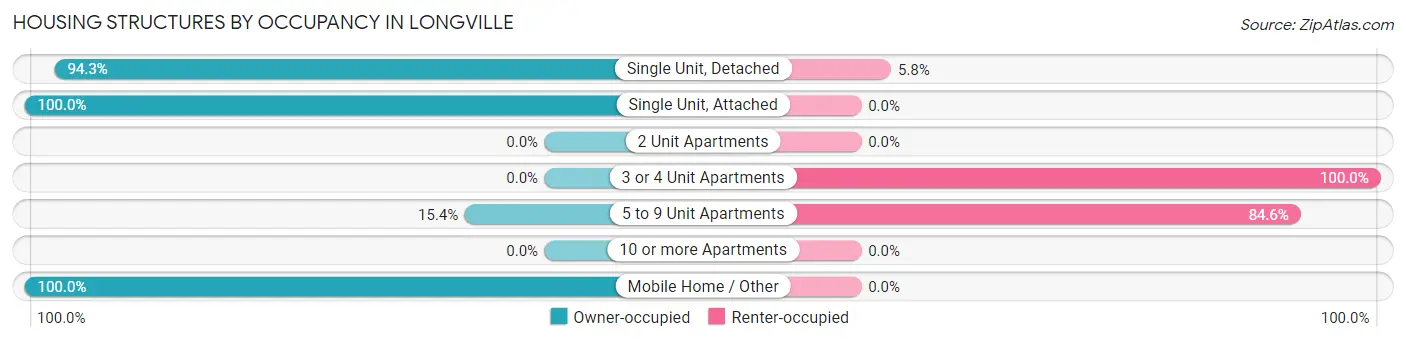
| Structure Type | Owner-occupied | Renter-occupied |
| Single Unit, Detached | 82 (94.3%) | 5 (5.8%) |
| Single Unit, Attached | 7 (100.0%) | 0 (0.0%) |
| 2 Unit Apartments | 0 (0.0%) | 0 (0.0%) |
| 3 or 4 Unit Apartments | 0 (0.0%) | 2 (100.0%) |
| 5 to 9 Unit Apartments | 2 (15.4%) | 11 (84.6%) |
| 10 or more Apartments | 0 (0.0%) | 0 (0.0%) |
| Mobile Home / Other | 20 (100.0%) | 0 (0.0%) |
| Total | 111 (86.1%) | 18 (14.0%) |
Housing Structures by Number of Rooms in Longville
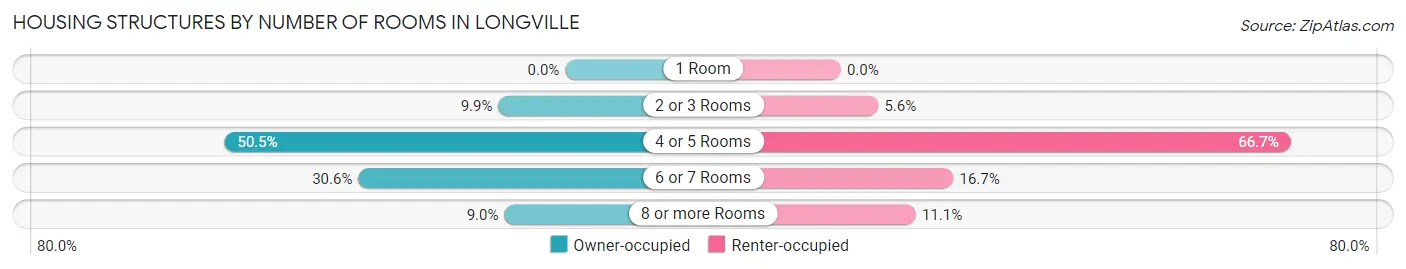
| Number of Rooms | Owner-occupied | Renter-occupied |
| 1 Room | 0 (0.0%) | 0 (0.0%) |
| 2 or 3 Rooms | 11 (9.9%) | 1 (5.6%) |
| 4 or 5 Rooms | 56 (50.4%) | 12 (66.7%) |
| 6 or 7 Rooms | 34 (30.6%) | 3 (16.7%) |
| 8 or more Rooms | 10 (9.0%) | 2 (11.1%) |
| Total | 111 (100.0%) | 18 (100.0%) |
Housing Structure by Heating Type in Longville
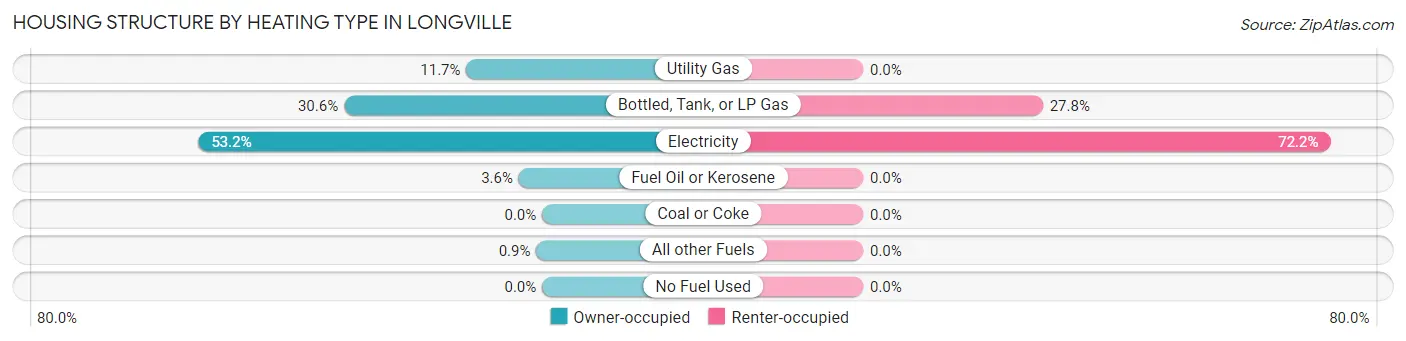
| Heating Type | Owner-occupied | Renter-occupied |
| Utility Gas | 13 (11.7%) | 0 (0.0%) |
| Bottled, Tank, or LP Gas | 34 (30.6%) | 5 (27.8%) |
| Electricity | 59 (53.1%) | 13 (72.2%) |
| Fuel Oil or Kerosene | 4 (3.6%) | 0 (0.0%) |
| Coal or Coke | 0 (0.0%) | 0 (0.0%) |
| All other Fuels | 1 (0.9%) | 0 (0.0%) |
| No Fuel Used | 0 (0.0%) | 0 (0.0%) |
| Total | 111 (100.0%) | 18 (100.0%) |
Household Vehicle Usage in Longville
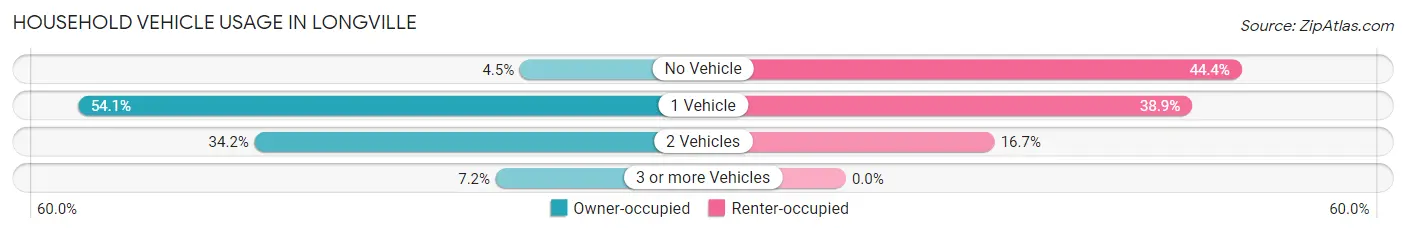
| Vehicles per Household | Owner-occupied | Renter-occupied |
| No Vehicle | 5 (4.5%) | 8 (44.4%) |
| 1 Vehicle | 60 (54.0%) | 7 (38.9%) |
| 2 Vehicles | 38 (34.2%) | 3 (16.7%) |
| 3 or more Vehicles | 8 (7.2%) | 0 (0.0%) |
| Total | 111 (100.0%) | 18 (100.0%) |
Real Estate & Mortgages in Longville
Real Estate and Mortgage Overview in Longville
| Characteristic | Without Mortgage | With Mortgage |
| Housing Units | 83 | 28 |
| Median Property Value | $266,900 | $200,000 |
| Median Household Income | $48,142 | $3 |
| Monthly Housing Costs | $609 | $0 |
| Real Estate Taxes | $1,296 | $3 |
Property Value by Mortgage Status in Longville
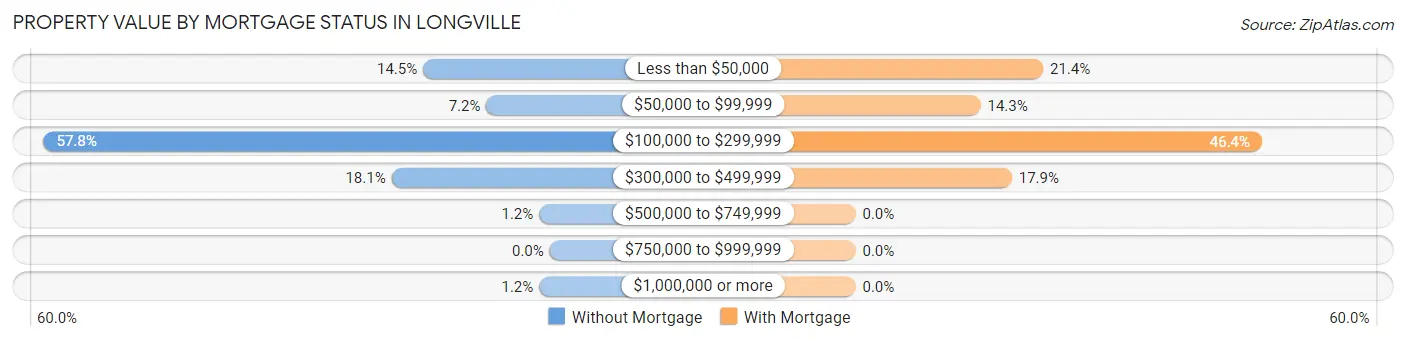
| Property Value | Without Mortgage | With Mortgage |
| Less than $50,000 | 12 (14.5%) | 6 (21.4%) |
| $50,000 to $99,999 | 6 (7.2%) | 4 (14.3%) |
| $100,000 to $299,999 | 48 (57.8%) | 13 (46.4%) |
| $300,000 to $499,999 | 15 (18.1%) | 5 (17.9%) |
| $500,000 to $749,999 | 1 (1.2%) | 0 (0.0%) |
| $750,000 to $999,999 | 0 (0.0%) | 0 (0.0%) |
| $1,000,000 or more | 1 (1.2%) | 0 (0.0%) |
| Total | 83 (100.0%) | 28 (100.0%) |
Household Income by Mortgage Status in Longville
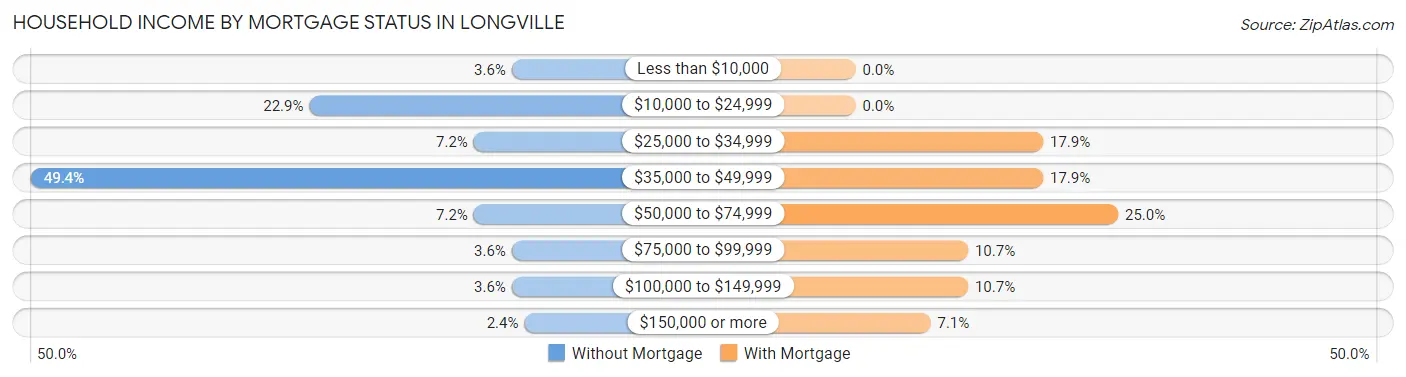
| Household Income | Without Mortgage | With Mortgage |
| Less than $10,000 | 3 (3.6%) | 0 (0.0%) |
| $10,000 to $24,999 | 19 (22.9%) | 0 (0.0%) |
| $25,000 to $34,999 | 6 (7.2%) | 5 (17.9%) |
| $35,000 to $49,999 | 41 (49.4%) | 5 (17.9%) |
| $50,000 to $74,999 | 6 (7.2%) | 7 (25.0%) |
| $75,000 to $99,999 | 3 (3.6%) | 3 (10.7%) |
| $100,000 to $149,999 | 3 (3.6%) | 3 (10.7%) |
| $150,000 or more | 2 (2.4%) | 2 (7.1%) |
| Total | 83 (100.0%) | 28 (100.0%) |
Property Value to Household Income Ratio in Longville
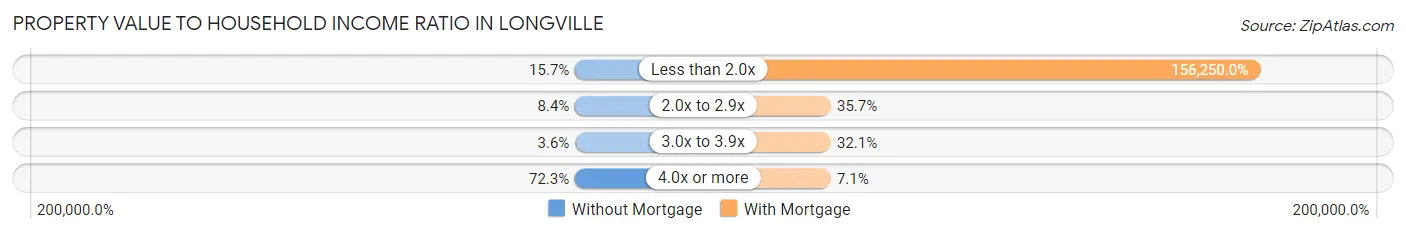
| Value-to-Income Ratio | Without Mortgage | With Mortgage |
| Less than 2.0x | 13 (15.7%) | 43,750 (156,250.0%) |
| 2.0x to 2.9x | 7 (8.4%) | 10 (35.7%) |
| 3.0x to 3.9x | 3 (3.6%) | 9 (32.1%) |
| 4.0x or more | 60 (72.3%) | 2 (7.1%) |
| Total | 83 (100.0%) | 28 (100.0%) |
Real Estate Taxes by Mortgage Status in Longville
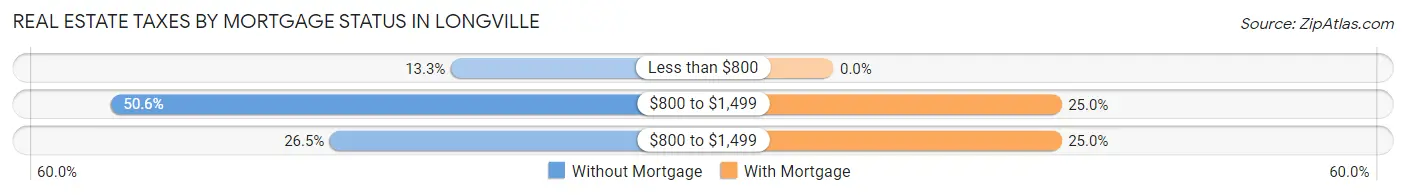
| Property Taxes | Without Mortgage | With Mortgage |
| Less than $800 | 11 (13.3%) | 0 (0.0%) |
| $800 to $1,499 | 42 (50.6%) | 7 (25.0%) |
| $800 to $1,499 | 22 (26.5%) | 7 (25.0%) |
| Total | 83 (100.0%) | 28 (100.0%) |
Health & Disability in Longville
Health Insurance Coverage by Age in Longville
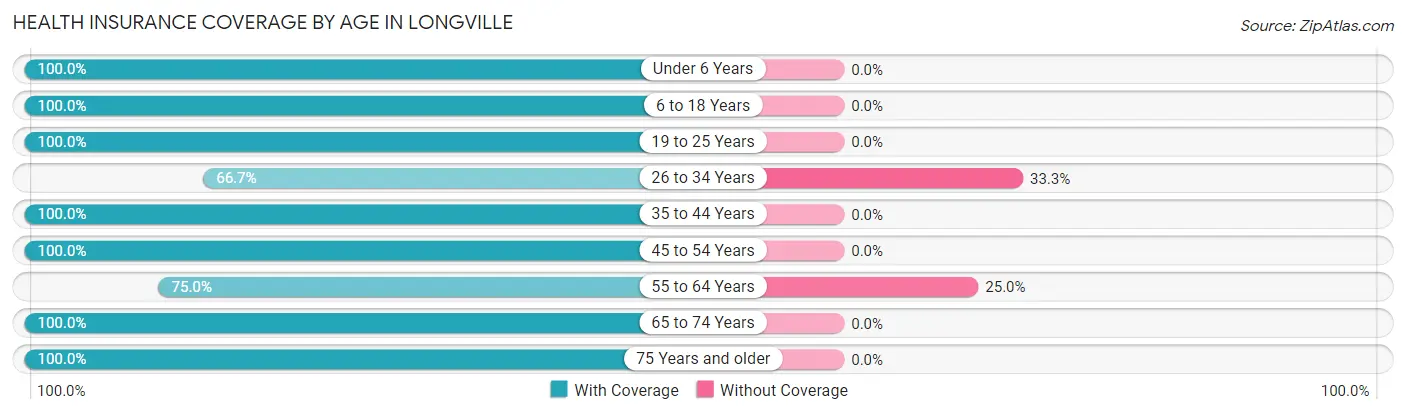
| Age Bracket | With Coverage | Without Coverage |
| Under 6 Years | 1 (100.0%) | 0 (0.0%) |
| 6 to 18 Years | 1 (100.0%) | 0 (0.0%) |
| 19 to 25 Years | 11 (100.0%) | 0 (0.0%) |
| 26 to 34 Years | 2 (66.7%) | 1 (33.3%) |
| 35 to 44 Years | 3 (100.0%) | 0 (0.0%) |
| 45 to 54 Years | 7 (100.0%) | 0 (0.0%) |
| 55 to 64 Years | 33 (75.0%) | 11 (25.0%) |
| 65 to 74 Years | 88 (100.0%) | 0 (0.0%) |
| 75 Years and older | 27 (100.0%) | 0 (0.0%) |
| Total | 173 (93.5%) | 12 (6.5%) |
Health Insurance Coverage by Citizenship Status in Longville
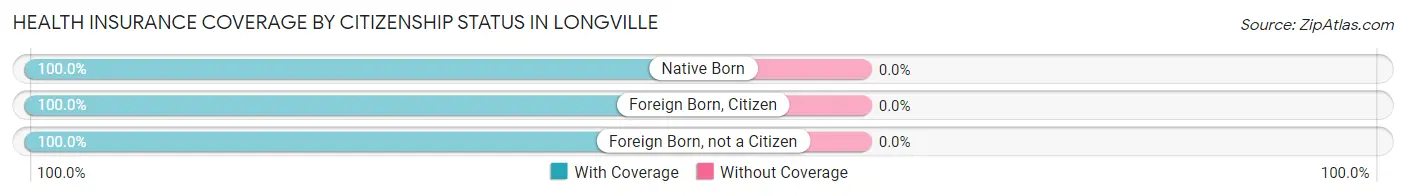
| Citizenship Status | With Coverage | Without Coverage |
| Native Born | 1 (100.0%) | 0 (0.0%) |
| Foreign Born, Citizen | 1 (100.0%) | 0 (0.0%) |
| Foreign Born, not a Citizen | 11 (100.0%) | 0 (0.0%) |
Health Insurance Coverage by Household Income in Longville
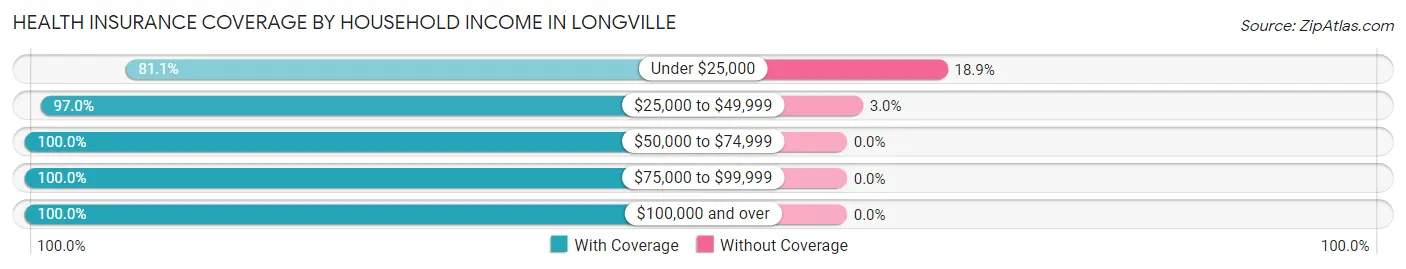
| Household Income | With Coverage | Without Coverage |
| Under $25,000 | 43 (81.1%) | 10 (18.9%) |
| $25,000 to $49,999 | 65 (97.0%) | 2 (3.0%) |
| $50,000 to $74,999 | 34 (100.0%) | 0 (0.0%) |
| $75,000 to $99,999 | 12 (100.0%) | 0 (0.0%) |
| $100,000 and over | 19 (100.0%) | 0 (0.0%) |
Public vs Private Health Insurance Coverage by Age in Longville
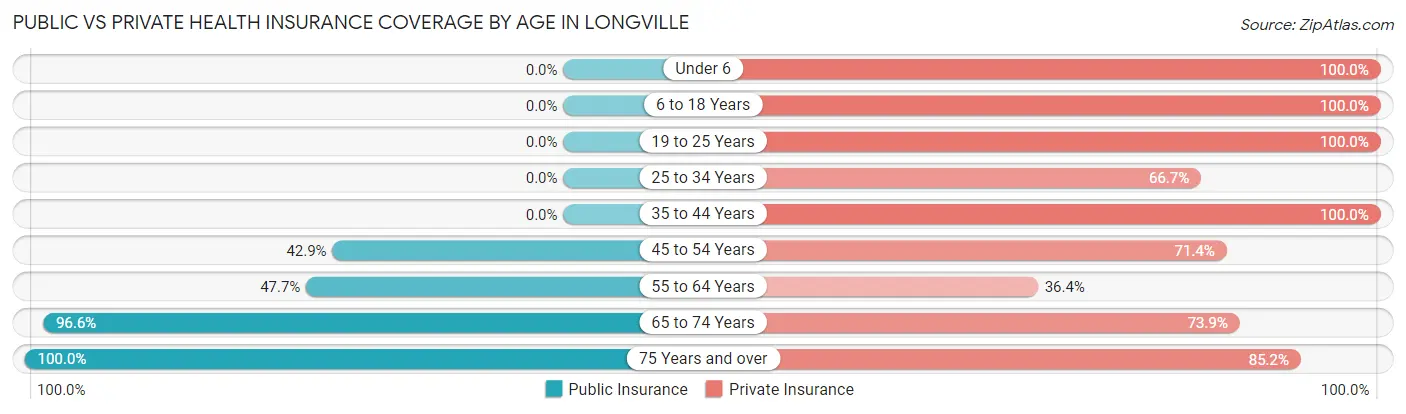
| Age Bracket | Public Insurance | Private Insurance |
| Under 6 | 0 (0.0%) | 1 (100.0%) |
| 6 to 18 Years | 0 (0.0%) | 1 (100.0%) |
| 19 to 25 Years | 0 (0.0%) | 11 (100.0%) |
| 25 to 34 Years | 0 (0.0%) | 2 (66.7%) |
| 35 to 44 Years | 0 (0.0%) | 3 (100.0%) |
| 45 to 54 Years | 3 (42.9%) | 5 (71.4%) |
| 55 to 64 Years | 21 (47.7%) | 16 (36.4%) |
| 65 to 74 Years | 85 (96.6%) | 65 (73.9%) |
| 75 Years and over | 27 (100.0%) | 23 (85.2%) |
| Total | 136 (73.5%) | 127 (68.6%) |
Disability Status by Sex by Age in Longville
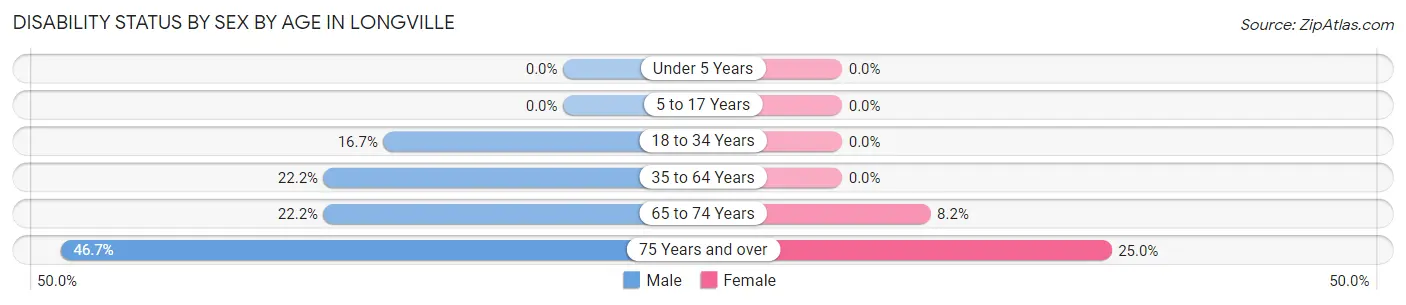
| Age Bracket | Male | Female |
| Under 5 Years | 0 (0.0%) | 0 (0.0%) |
| 5 to 17 Years | 0 (0.0%) | 0 (0.0%) |
| 18 to 34 Years | 2 (16.7%) | 0 (0.0%) |
| 35 to 64 Years | 4 (22.2%) | 0 (0.0%) |
| 65 to 74 Years | 6 (22.2%) | 5 (8.2%) |
| 75 Years and over | 7 (46.7%) | 3 (25.0%) |
Disability Class by Sex by Age in Longville
Disability Class: Hearing Difficulty
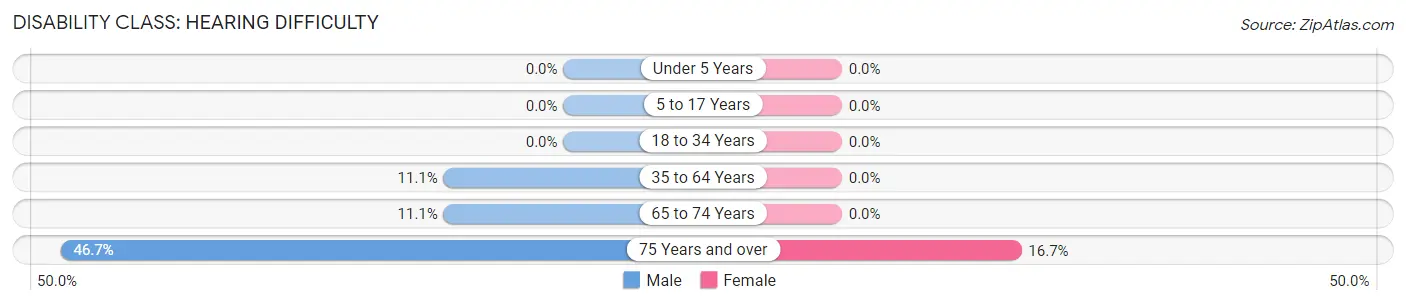
| Age Bracket | Male | Female |
| Under 5 Years | 0 (0.0%) | 0 (0.0%) |
| 5 to 17 Years | 0 (0.0%) | 0 (0.0%) |
| 18 to 34 Years | 0 (0.0%) | 0 (0.0%) |
| 35 to 64 Years | 2 (11.1%) | 0 (0.0%) |
| 65 to 74 Years | 3 (11.1%) | 0 (0.0%) |
| 75 Years and over | 7 (46.7%) | 2 (16.7%) |
Disability Class: Vision Difficulty
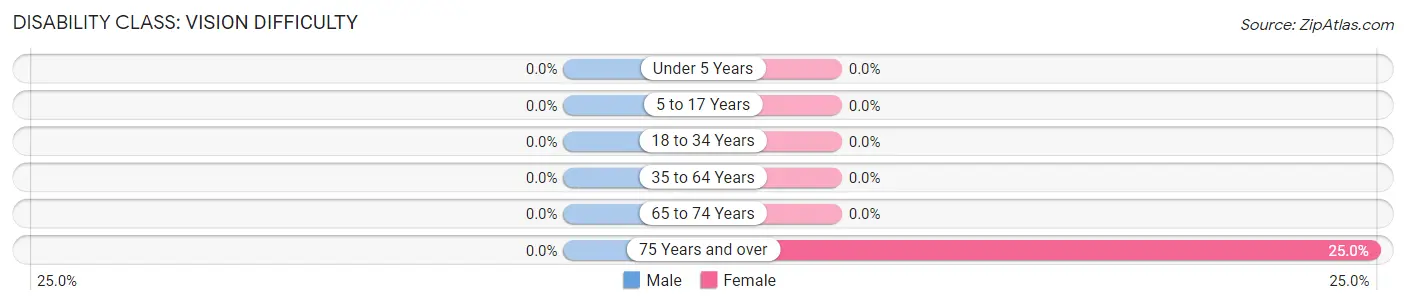
| Age Bracket | Male | Female |
| Under 5 Years | 0 (0.0%) | 0 (0.0%) |
| 5 to 17 Years | 0 (0.0%) | 0 (0.0%) |
| 18 to 34 Years | 0 (0.0%) | 0 (0.0%) |
| 35 to 64 Years | 0 (0.0%) | 0 (0.0%) |
| 65 to 74 Years | 0 (0.0%) | 0 (0.0%) |
| 75 Years and over | 0 (0.0%) | 3 (25.0%) |
Disability Class: Cognitive Difficulty
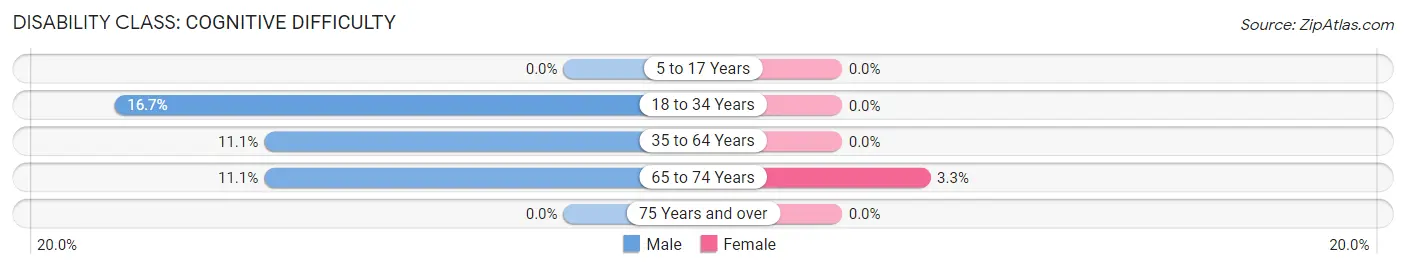
| Age Bracket | Male | Female |
| 5 to 17 Years | 0 (0.0%) | 0 (0.0%) |
| 18 to 34 Years | 2 (16.7%) | 0 (0.0%) |
| 35 to 64 Years | 2 (11.1%) | 0 (0.0%) |
| 65 to 74 Years | 3 (11.1%) | 2 (3.3%) |
| 75 Years and over | 0 (0.0%) | 0 (0.0%) |
Disability Class: Ambulatory Difficulty
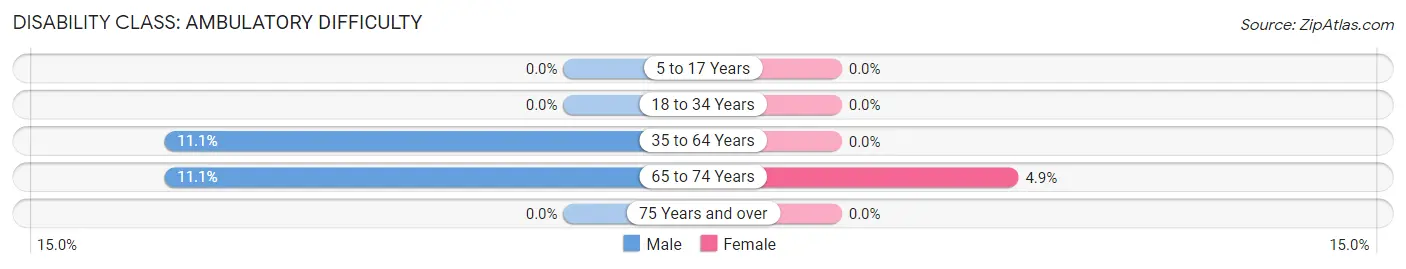
| Age Bracket | Male | Female |
| 5 to 17 Years | 0 (0.0%) | 0 (0.0%) |
| 18 to 34 Years | 0 (0.0%) | 0 (0.0%) |
| 35 to 64 Years | 2 (11.1%) | 0 (0.0%) |
| 65 to 74 Years | 3 (11.1%) | 3 (4.9%) |
| 75 Years and over | 0 (0.0%) | 0 (0.0%) |
Disability Class: Self-Care Difficulty
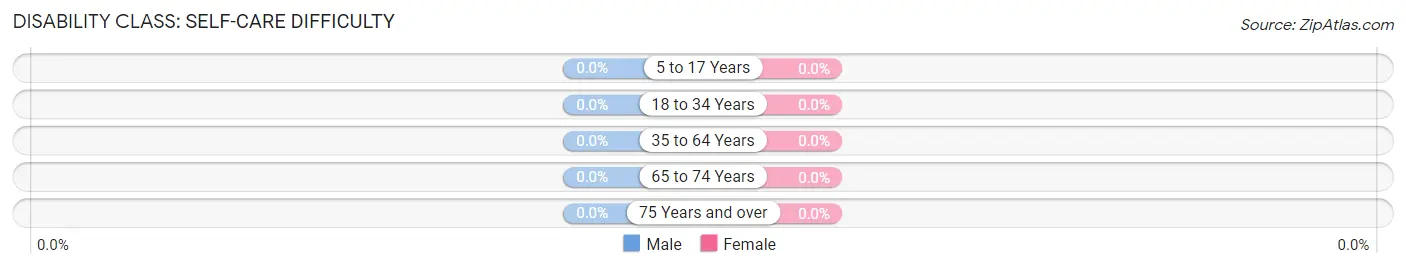
| Age Bracket | Male | Female |
| 5 to 17 Years | 0 (0.0%) | 0 (0.0%) |
| 18 to 34 Years | 0 (0.0%) | 0 (0.0%) |
| 35 to 64 Years | 0 (0.0%) | 0 (0.0%) |
| 65 to 74 Years | 0 (0.0%) | 0 (0.0%) |
| 75 Years and over | 0 (0.0%) | 0 (0.0%) |
Technology Access in Longville
Computing Device Access in Longville
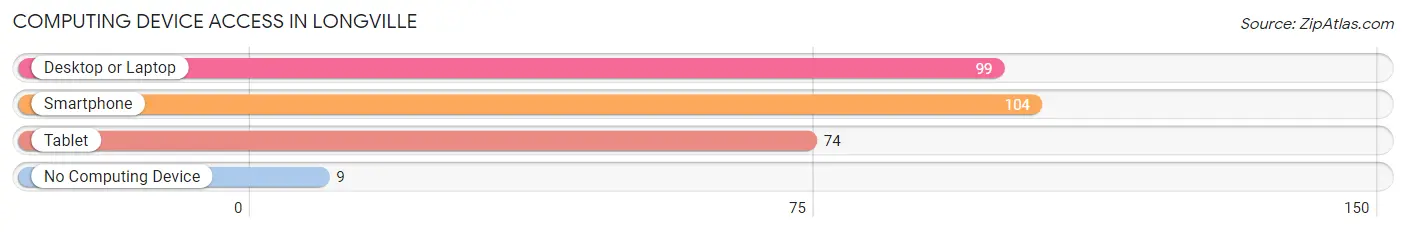
| Device Type | # Households | % Households |
| Desktop or Laptop | 99 | 76.7% |
| Smartphone | 104 | 80.6% |
| Tablet | 74 | 57.4% |
| No Computing Device | 9 | 7.0% |
| Total | 129 | 100.0% |
Internet Access in Longville
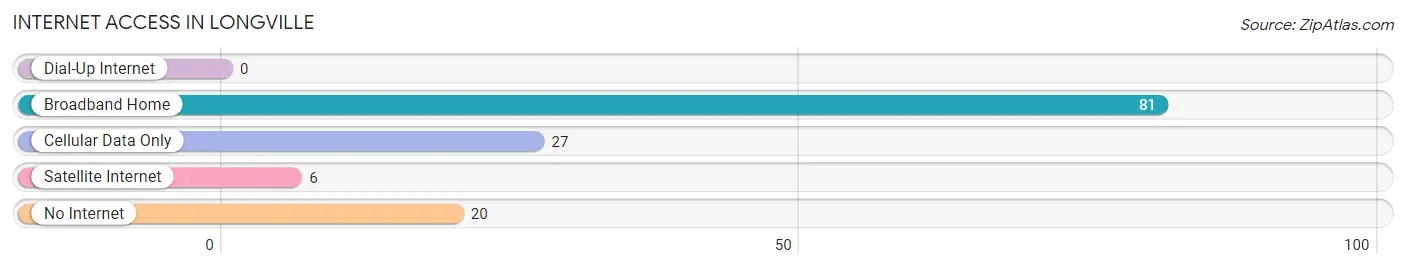
| Internet Type | # Households | % Households |
| Dial-Up Internet | 0 | 0.0% |
| Broadband Home | 81 | 62.8% |
| Cellular Data Only | 27 | 20.9% |
| Satellite Internet | 6 | 4.6% |
| No Internet | 20 | 15.5% |
| Total | 129 | 100.0% |
Longville Summary
Longville, Minnesota is a small town located in Cass County, in the north-central part of the state. It is situated on the south shore of Woman Lake, and is part of the Leech Lake Indian Reservation. The town was founded in 1887, and has a population of approximately 500 people.
History
Longville was founded in 1887 by a group of settlers from Wisconsin. The town was named after the Long family, who were among the first settlers. The town was originally a logging and farming community, and the first post office was established in 1891.
In the early 1900s, Longville began to grow as a resort town. The first resort was built in 1906, and by the 1920s, the town had become a popular destination for fishing and hunting. The town was also known for its logging industry, and the Longville Lumber Company was established in the 1920s.
In the 1950s, Longville began to experience a decline in population as people moved away to larger cities. However, the town has seen a resurgence in recent years, as people have moved back to the area to take advantage of the natural beauty and recreational opportunities.
Geography
Longville is located in Cass County, in the north-central part of Minnesota. It is situated on the south shore of Woman Lake, and is part of the Leech Lake Indian Reservation. The town is surrounded by forests and lakes, and is located near the Chippewa National Forest.
The town is located approximately 40 miles north of Brainerd, and is accessible by US Highway 371. The nearest major airport is Minneapolis-St. Paul International Airport, which is about two hours away.
Economy
Longville’s economy is largely based on tourism and recreation. The town is a popular destination for fishing, hunting, and other outdoor activities. There are several resorts and lodges in the area, as well as a number of restaurants and shops.
The town is also home to several small businesses, including a grocery store, a hardware store, and a gas station. The Longville Lumber Company is still in operation, and provides jobs for many of the town’s residents.
Demographics
As of the 2010 census, Longville had a population of 498 people. The racial makeup of the town was 97.2% White, 0.2% African American, 0.4% Native American, 0.2% Asian, 0.2% from other races, and 1.8% from two or more races.
The median household income in Longville was $37,500, and the median family income was $41,250. The per capita income was $19,845. About 11.2% of the population was below the poverty line.
Longville is a small town with a rich history and a vibrant economy. It is a popular destination for outdoor recreation, and is home to a number of small businesses. The town has a diverse population, and is a great place to live and work.
Common Questions
What is Per Capita Income in Longville?
Per Capita income in Longville is $32,529.
What is the Median Family Income in Longville?
Median Family Income in Longville is $51,250.
What is the Median Household income in Longville?
Median Household Income in Longville is $47,788.
What is Income or Wage Gap in Longville?
Income or Wage Gap in Longville is 51.2%.
Women in Longville earn 48.8 cents for every dollar earned by a man.
What is Family Income Deficit in Longville?
Family Income Deficit in Longville is $4,588.
Families that are below poverty line in Longville earn $4,588 less on average than the poverty threshold level.
What is Inequality or Gini Index in Longville?
Inequality or Gini Index in Longville is 0.36.
What is the Total Population of Longville?
Total Population of Longville is 185.
What is the Total Male Population of Longville?
Total Male Population of Longville is 72.
What is the Total Female Population of Longville?
Total Female Population of Longville is 113.
What is the Ratio of Males per 100 Females in Longville?
There are 63.72 Males per 100 Females in Longville.
What is the Ratio of Females per 100 Males in Longville?
There are 156.94 Females per 100 Males in Longville.
What is the Median Population Age in Longville?
Median Population Age in Longville is 67.3 Years.
What is the Average Family Size in Longville
Average Family Size in Longville is 2.1 People.
What is the Average Household Size in Longville
Average Household Size in Longville is 1.4 People.
How Large is the Labor Force in Longville?
There are 58 People in the Labor Forcein in Longville.
What is the Percentage of People in the Labor Force in Longville?
31.7% of People are in the Labor Force in Longville.
What is the Unemployment Rate in Longville?
Unemployment Rate in Longville is 12.1%.