Litchfield, MN Map & Demographics
Litchfield Map
Litchfield Overview
$39,099
PER CAPITA INCOME
$82,436
AVG FAMILY INCOME
$60,804
AVG HOUSEHOLD INCOME
32.9%
WAGE / INCOME GAP [ % ]
67.1¢/ $1
WAGE / INCOME GAP [ $ ]
0.48
INEQUALITY / GINI INDEX
6,598
TOTAL POPULATION
3,351
MALE POPULATION
3,247
FEMALE POPULATION
103.20
MALES / 100 FEMALES
96.90
FEMALES / 100 MALES
45.3
MEDIAN AGE
2.9
AVG FAMILY SIZE
2.3
AVG HOUSEHOLD SIZE
3,358
LABOR FORCE [ PEOPLE ]
61.9%
PERCENT IN LABOR FORCE
2.0%
UNEMPLOYMENT RATE
Litchfield Zip Codes
Litchfield Area Codes
Income in Litchfield
Income Overview in Litchfield
Per Capita Income in Litchfield is $39,099, while median incomes of families and households are $82,436 and $60,804 respectively.
| Characteristic | Number | Measure |
| Per Capita Income | 6,598 | $39,099 |
| Median Family Income | 1,641 | $82,436 |
| Mean Family Income | 1,641 | $105,357 |
| Median Household Income | 2,816 | $60,804 |
| Mean Household Income | 2,816 | $87,121 |
| Income Deficit | 1,641 | $0 |
| Wage / Income Gap (%) | 6,598 | 32.88% |
| Wage / Income Gap ($) | 6,598 | 67.12¢ per $1 |
| Gini / Inequality Index | 6,598 | 0.48 |
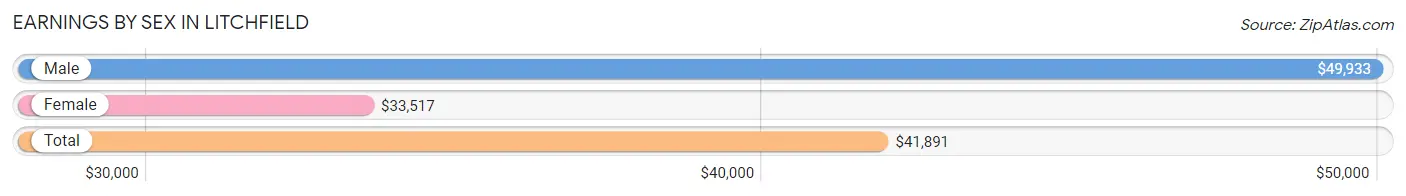
Earnings by Sex in Litchfield
Average Earnings in Litchfield are $41,891, $49,933 for men and $33,517 for women, a difference of 32.9%.
| Sex | Number | Average Earnings |
| Male | 1,916 (53.8%) | $49,933 |
| Female | 1,646 (46.2%) | $33,517 |
| Total | 3,562 (100.0%) | $41,891 |
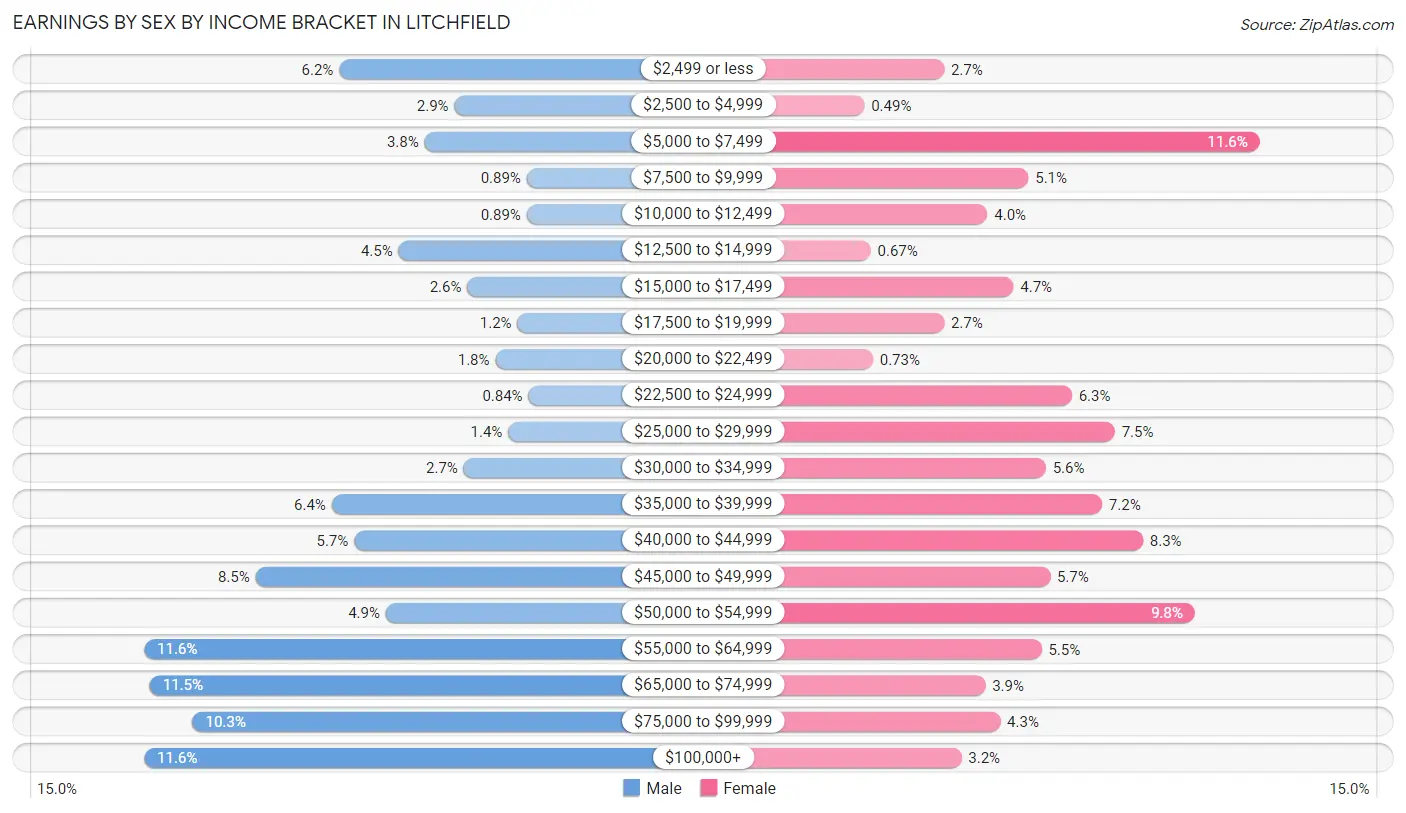
Earnings by Sex by Income Bracket in Litchfield
The most common earnings brackets in Litchfield are $55,000 to $64,999 for men (223 | 11.6%) and $5,000 to $7,499 for women (191 | 11.6%).
| Income | Male | Female |
| $2,499 or less | 118 (6.2%) | 45 (2.7%) |
| $2,500 to $4,999 | 56 (2.9%) | 8 (0.5%) |
| $5,000 to $7,499 | 72 (3.8%) | 191 (11.6%) |
| $7,500 to $9,999 | 17 (0.9%) | 84 (5.1%) |
| $10,000 to $12,499 | 17 (0.9%) | 65 (4.0%) |
| $12,500 to $14,999 | 86 (4.5%) | 11 (0.7%) |
| $15,000 to $17,499 | 49 (2.6%) | 77 (4.7%) |
| $17,500 to $19,999 | 22 (1.1%) | 45 (2.7%) |
| $20,000 to $22,499 | 34 (1.8%) | 12 (0.7%) |
| $22,500 to $24,999 | 16 (0.8%) | 104 (6.3%) |
| $25,000 to $29,999 | 27 (1.4%) | 124 (7.5%) |
| $30,000 to $34,999 | 51 (2.7%) | 92 (5.6%) |
| $35,000 to $39,999 | 122 (6.4%) | 118 (7.2%) |
| $40,000 to $44,999 | 110 (5.7%) | 137 (8.3%) |
| $45,000 to $49,999 | 163 (8.5%) | 94 (5.7%) |
| $50,000 to $54,999 | 93 (4.9%) | 161 (9.8%) |
| $55,000 to $64,999 | 223 (11.6%) | 90 (5.5%) |
| $65,000 to $74,999 | 220 (11.5%) | 64 (3.9%) |
| $75,000 to $99,999 | 197 (10.3%) | 71 (4.3%) |
| $100,000+ | 223 (11.6%) | 53 (3.2%) |
| Total | 1,916 (100.0%) | 1,646 (100.0%) |
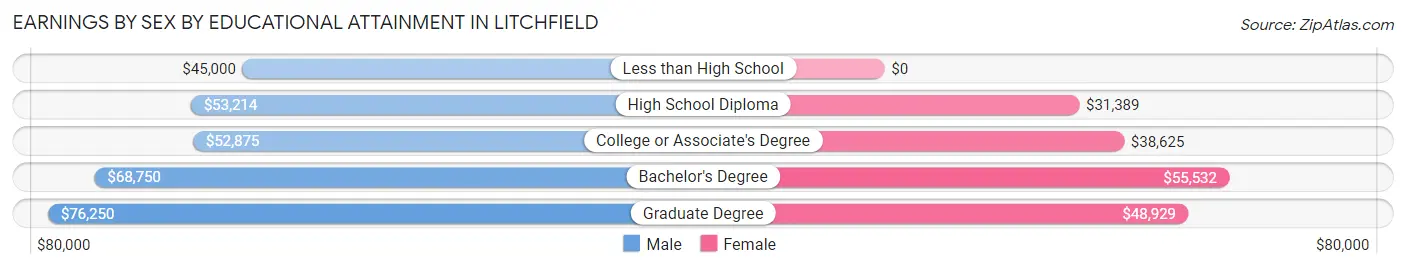
Earnings by Sex by Educational Attainment in Litchfield
Average earnings in Litchfield are $56,040 for men and $40,000 for women, a difference of 28.6%. Men with an educational attainment of graduate degree enjoy the highest average annual earnings of $76,250, while those with less than high school education earn the least with $45,000. Women with an educational attainment of bachelor's degree earn the most with the average annual earnings of $55,532, while those with high school diploma education have the smallest earnings of $31,389.
| Educational Attainment | Male Income | Female Income |
| Less than High School | $45,000 | $0 |
| High School Diploma | $53,214 | $31,389 |
| College or Associate's Degree | $52,875 | $38,625 |
| Bachelor's Degree | $68,750 | $55,532 |
| Graduate Degree | $76,250 | $48,929 |
| Total | $56,040 | $40,000 |
Family Income in Litchfield
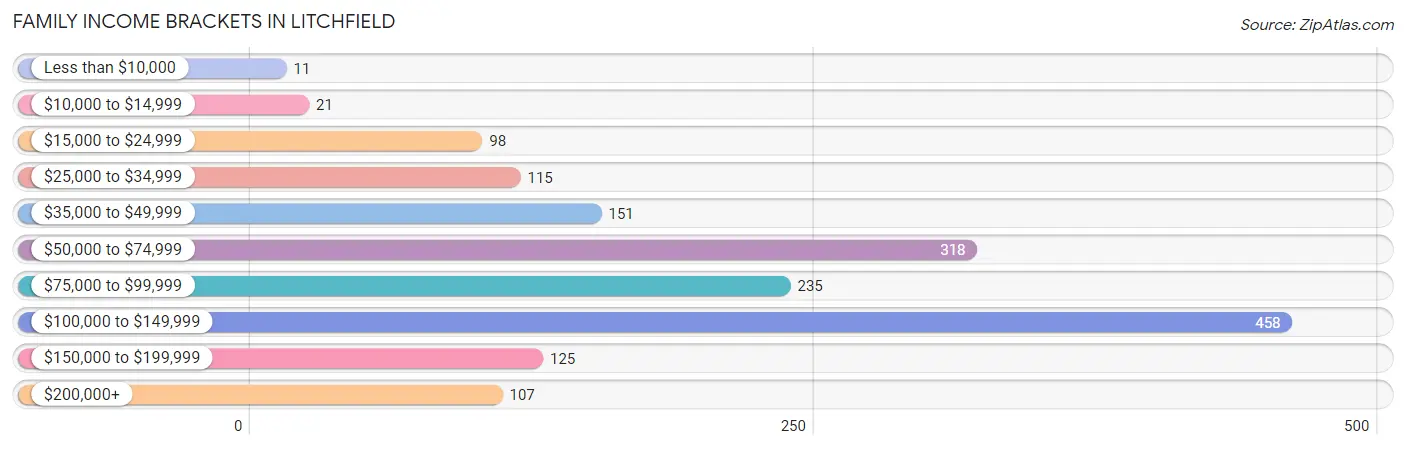
Family Income Brackets in Litchfield
According to the Litchfield family income data, there are 458 families falling into the $100,000 to $149,999 income range, which is the most common income bracket and makes up 27.9% of all families. Conversely, the less than $10,000 income bracket is the least frequent group with only 11 families (0.7%) belonging to this category.
| Income Bracket | # Families | % Families |
| Less than $10,000 | 11 | 0.7% |
| $10,000 to $14,999 | 21 | 1.3% |
| $15,000 to $24,999 | 98 | 6.0% |
| $25,000 to $34,999 | 115 | 7.0% |
| $35,000 to $49,999 | 151 | 9.2% |
| $50,000 to $74,999 | 318 | 19.4% |
| $75,000 to $99,999 | 235 | 14.3% |
| $100,000 to $149,999 | 458 | 27.9% |
| $150,000 to $199,999 | 125 | 7.6% |
| $200,000+ | 107 | 6.5% |
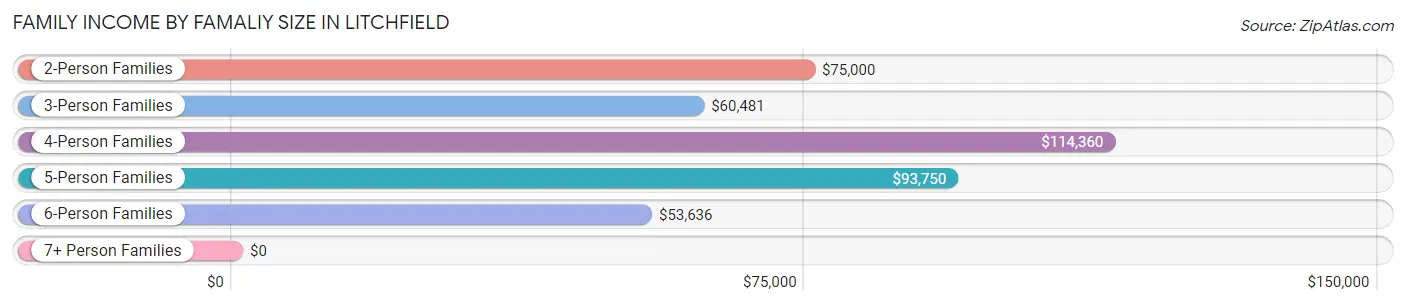
Family Income by Famaliy Size in Litchfield
4-person families (265 | 16.2%) account for the highest median family income in Litchfield with $114,360 per family, while 2-person families (988 | 60.2%) have the highest median income of $37,500 per family member.
| Income Bracket | # Families | Median Income |
| 2-Person Families | 988 (60.2%) | $75,000 |
| 3-Person Families | 235 (14.3%) | $60,481 |
| 4-Person Families | 265 (16.2%) | $114,360 |
| 5-Person Families | 104 (6.3%) | $93,750 |
| 6-Person Families | 36 (2.2%) | $53,636 |
| 7+ Person Families | 13 (0.8%) | $0 |
| Total | 1,641 (100.0%) | $82,436 |
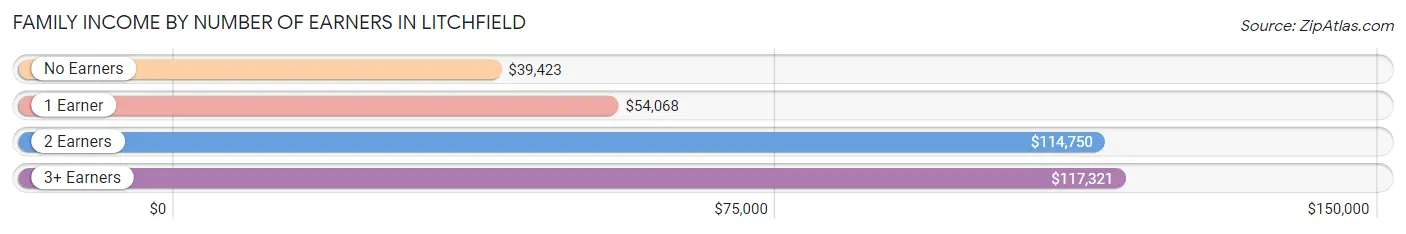
Family Income by Number of Earners in Litchfield
The median family income in Litchfield is $82,436, with families comprising 3+ earners (172) having the highest median family income of $117,321, while families with no earners (276) have the lowest median family income of $39,423, accounting for 10.5% and 16.8% of families, respectively.
| Number of Earners | # Families | Median Income |
| No Earners | 276 (16.8%) | $39,423 |
| 1 Earner | 513 (31.3%) | $54,068 |
| 2 Earners | 680 (41.4%) | $114,750 |
| 3+ Earners | 172 (10.5%) | $117,321 |
| Total | 1,641 (100.0%) | $82,436 |
Household Income in Litchfield
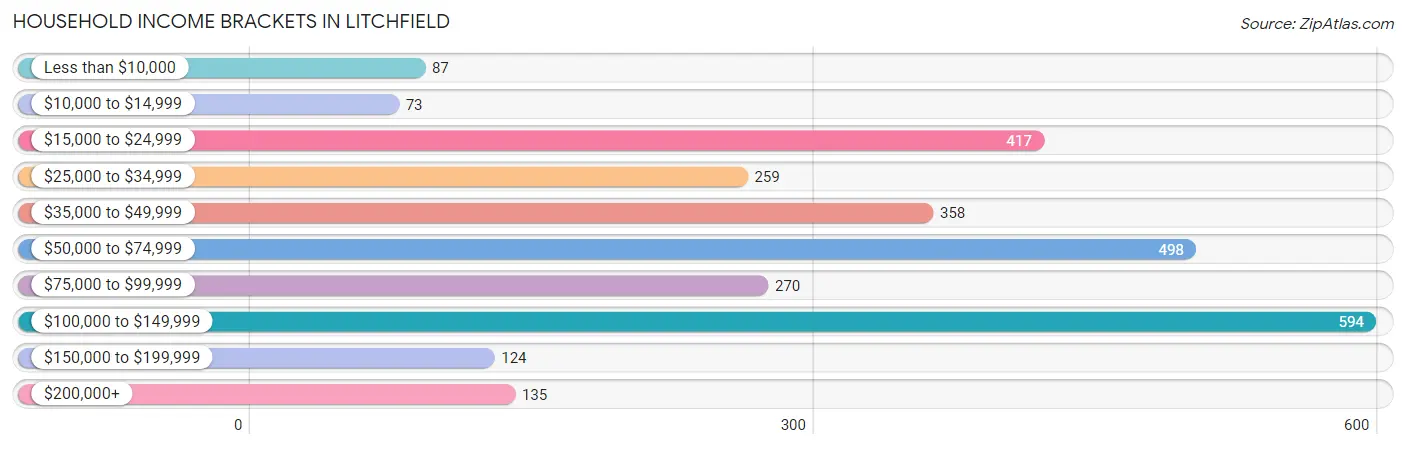
Household Income Brackets in Litchfield
With 594 households falling in the category, the $100,000 to $149,999 income range is the most frequent in Litchfield, accounting for 21.1% of all households. In contrast, only 73 households (2.6%) fall into the $10,000 to $14,999 income bracket, making it the least populous group.
| Income Bracket | # Households | % Households |
| Less than $10,000 | 87 | 3.1% |
| $10,000 to $14,999 | 73 | 2.6% |
| $15,000 to $24,999 | 417 | 14.8% |
| $25,000 to $34,999 | 259 | 9.2% |
| $35,000 to $49,999 | 358 | 12.7% |
| $50,000 to $74,999 | 498 | 17.7% |
| $75,000 to $99,999 | 270 | 9.6% |
| $100,000 to $149,999 | 594 | 21.1% |
| $150,000 to $199,999 | 124 | 4.4% |
| $200,000+ | 135 | 4.8% |
Household Income by Householder Age in Litchfield
The median household income in Litchfield is $60,804, with the highest median household income of $91,156 found in the 25 to 44 years age bracket for the primary householder. A total of 645 households (22.9%) fall into this category. Meanwhile, the 15 to 24 years age bracket for the primary householder has the lowest median household income of $24,736, with 139 households (4.9%) in this group.
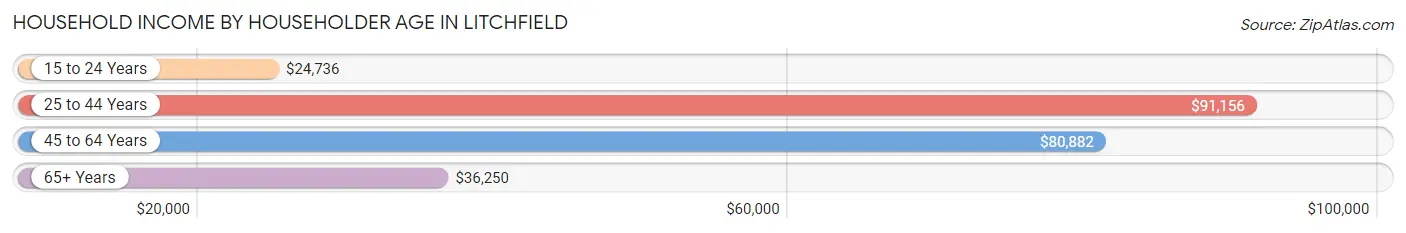
| Income Bracket | # Households | Median Income |
| 15 to 24 Years | 139 (4.9%) | $24,736 |
| 25 to 44 Years | 645 (22.9%) | $91,156 |
| 45 to 64 Years | 966 (34.3%) | $80,882 |
| 65+ Years | 1,066 (37.9%) | $36,250 |
| Total | 2,816 (100.0%) | $60,804 |
Poverty in Litchfield
Income Below Poverty by Sex and Age in Litchfield
With 6.8% poverty level for males and 9.0% for females among the residents of Litchfield, 16 and 17 year old males and 15 year old females are the most vulnerable to poverty, with 11 males (21.1%) and 12 females (35.3%) in their respective age groups living below the poverty level.
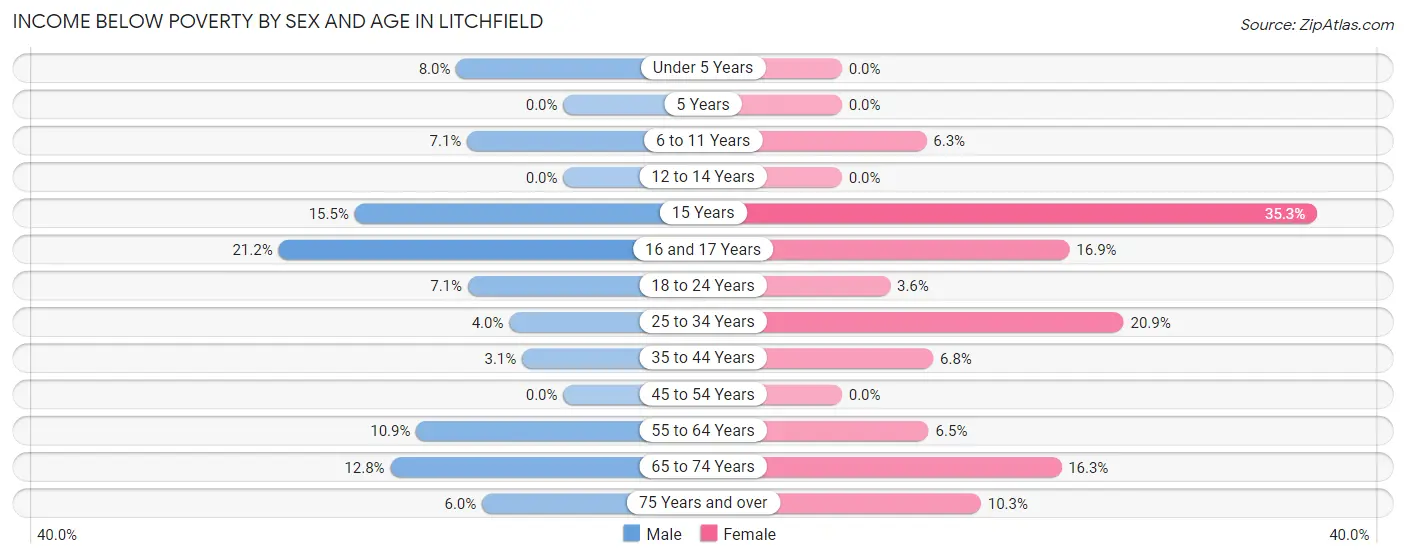
| Age Bracket | Male | Female |
| Under 5 Years | 24 (8.0%) | 0 (0.0%) |
| 5 Years | 0 (0.0%) | 0 (0.0%) |
| 6 to 11 Years | 14 (7.1%) | 14 (6.3%) |
| 12 to 14 Years | 0 (0.0%) | 0 (0.0%) |
| 15 Years | 11 (15.5%) | 12 (35.3%) |
| 16 and 17 Years | 11 (21.1%) | 12 (16.9%) |
| 18 to 24 Years | 19 (7.1%) | 11 (3.6%) |
| 25 to 34 Years | 15 (4.0%) | 64 (20.9%) |
| 35 to 44 Years | 10 (3.1%) | 24 (6.8%) |
| 45 to 54 Years | 0 (0.0%) | 0 (0.0%) |
| 55 to 64 Years | 63 (10.9%) | 32 (6.5%) |
| 65 to 74 Years | 33 (12.8%) | 65 (16.3%) |
| 75 Years and over | 21 (6.0%) | 51 (10.3%) |
| Total | 221 (6.8%) | 285 (9.0%) |
Income Above Poverty by Sex and Age in Litchfield
According to the poverty statistics in Litchfield, males aged 5 years and females aged under 5 years are the age groups that are most secure financially, with 100.0% of males and 100.0% of females in these age groups living above the poverty line.
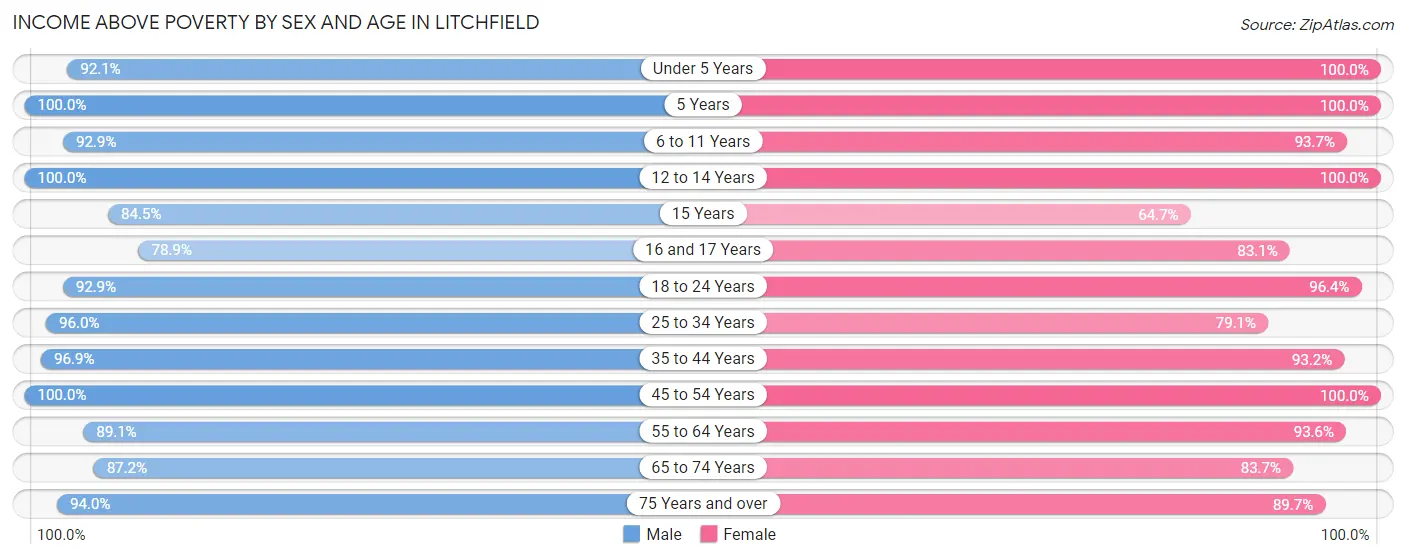
| Age Bracket | Male | Female |
| Under 5 Years | 278 (92.0%) | 71 (100.0%) |
| 5 Years | 26 (100.0%) | 16 (100.0%) |
| 6 to 11 Years | 182 (92.9%) | 209 (93.7%) |
| 12 to 14 Years | 105 (100.0%) | 93 (100.0%) |
| 15 Years | 60 (84.5%) | 22 (64.7%) |
| 16 and 17 Years | 41 (78.8%) | 59 (83.1%) |
| 18 to 24 Years | 249 (92.9%) | 296 (96.4%) |
| 25 to 34 Years | 359 (96.0%) | 242 (79.1%) |
| 35 to 44 Years | 317 (96.9%) | 330 (93.2%) |
| 45 to 54 Years | 362 (100.0%) | 296 (100.0%) |
| 55 to 64 Years | 514 (89.1%) | 464 (93.5%) |
| 65 to 74 Years | 224 (87.2%) | 334 (83.7%) |
| 75 Years and over | 327 (94.0%) | 443 (89.7%) |
| Total | 3,044 (93.2%) | 2,875 (91.0%) |
Income Below Poverty Among Married-Couple Families in Litchfield
The poverty statistics for married-couple families in Litchfield show that 4.7% or 58 of the total 1,228 families live below the poverty line. Families with 1 or 2 children have the highest poverty rate of 10.0%, comprising of 36 families. On the other hand, families with 3 or 4 children have the lowest poverty rate of 0.0%, which includes 0 families.
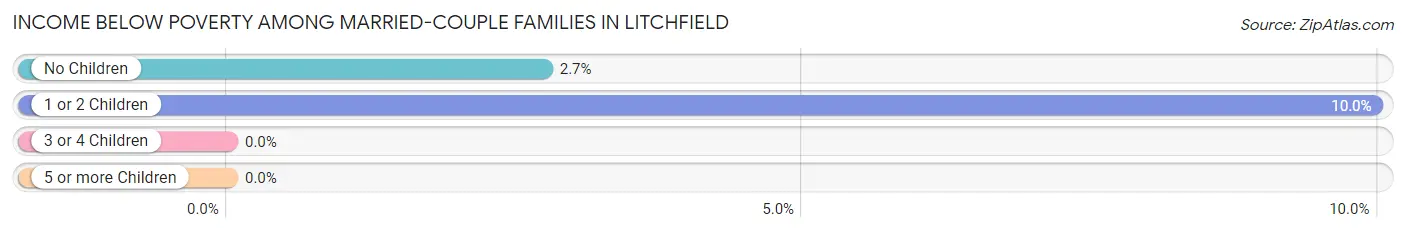
| Children | Above Poverty | Below Poverty |
| No Children | 780 (97.3%) | 22 (2.7%) |
| 1 or 2 Children | 325 (90.0%) | 36 (10.0%) |
| 3 or 4 Children | 65 (100.0%) | 0 (0.0%) |
| 5 or more Children | 0 (0.0%) | 0 (0.0%) |
| Total | 1,170 (95.3%) | 58 (4.7%) |
Income Below Poverty Among Single-Parent Households in Litchfield
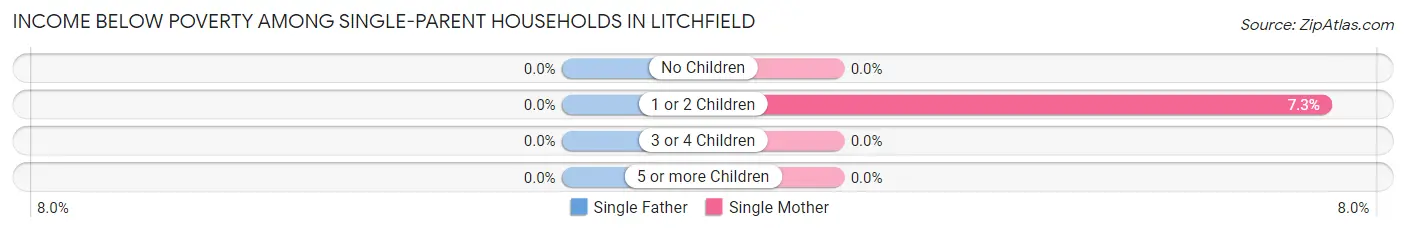
| Children | Single Father | Single Mother |
| No Children | 0 (0.0%) | 0 (0.0%) |
| 1 or 2 Children | 0 (0.0%) | 12 (7.3%) |
| 3 or 4 Children | 0 (0.0%) | 0 (0.0%) |
| 5 or more Children | 0 (0.0%) | 0 (0.0%) |
| Total | 0 (0.0%) | 12 (4.6%) |
Income Below Poverty Among Married-Couple vs Single-Parent Households in Litchfield
The poverty data for Litchfield shows that 58 of the married-couple family households (4.7%) and 12 of the single-parent households (2.9%) are living below the poverty level. Within the married-couple family households, those with 1 or 2 children have the highest poverty rate, with 36 households (10.0%) falling below the poverty line. Among the single-parent households, those with 1 or 2 children have the highest poverty rate, with 12 household (4.0%) living below poverty.
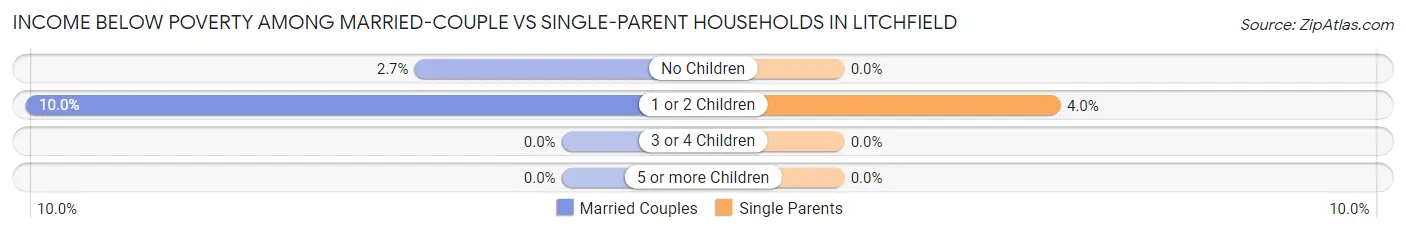
| Children | Married-Couple Families | Single-Parent Households |
| No Children | 22 (2.7%) | 0 (0.0%) |
| 1 or 2 Children | 36 (10.0%) | 12 (4.0%) |
| 3 or 4 Children | 0 (0.0%) | 0 (0.0%) |
| 5 or more Children | 0 (0.0%) | 0 (0.0%) |
| Total | 58 (4.7%) | 12 (2.9%) |
Race in Litchfield
The most populous races in Litchfield are White / Caucasian (6,212 | 94.2%), Hispanic or Latino (480 | 7.3%), and Some other Race (236 | 3.6%).
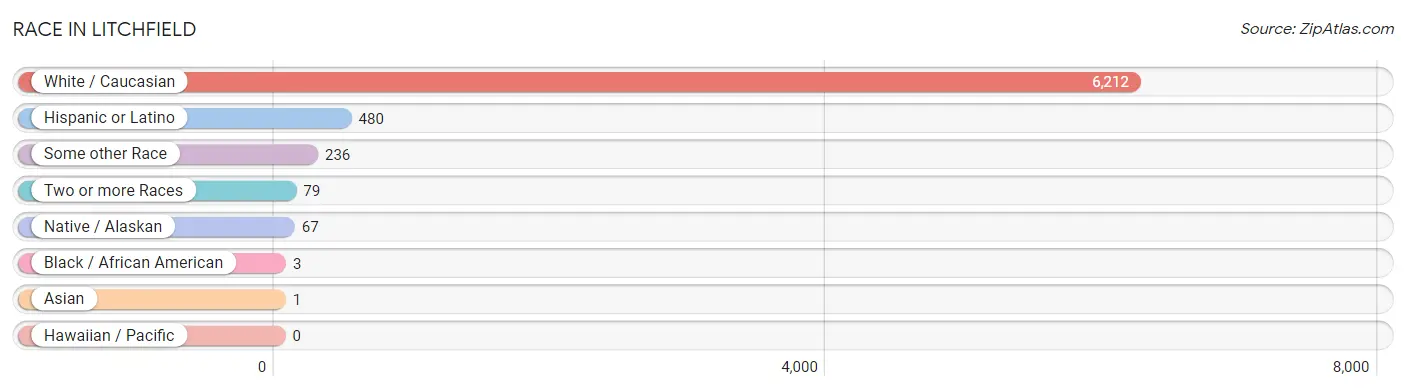
| Race | # Population | % Population |
| Asian | 1 | 0.0% |
| Black / African American | 3 | 0.1% |
| Hawaiian / Pacific | 0 | 0.0% |
| Hispanic or Latino | 480 | 7.3% |
| Native / Alaskan | 67 | 1.0% |
| White / Caucasian | 6,212 | 94.2% |
| Two or more Races | 79 | 1.2% |
| Some other Race | 236 | 3.6% |
| Total | 6,598 | 100.0% |
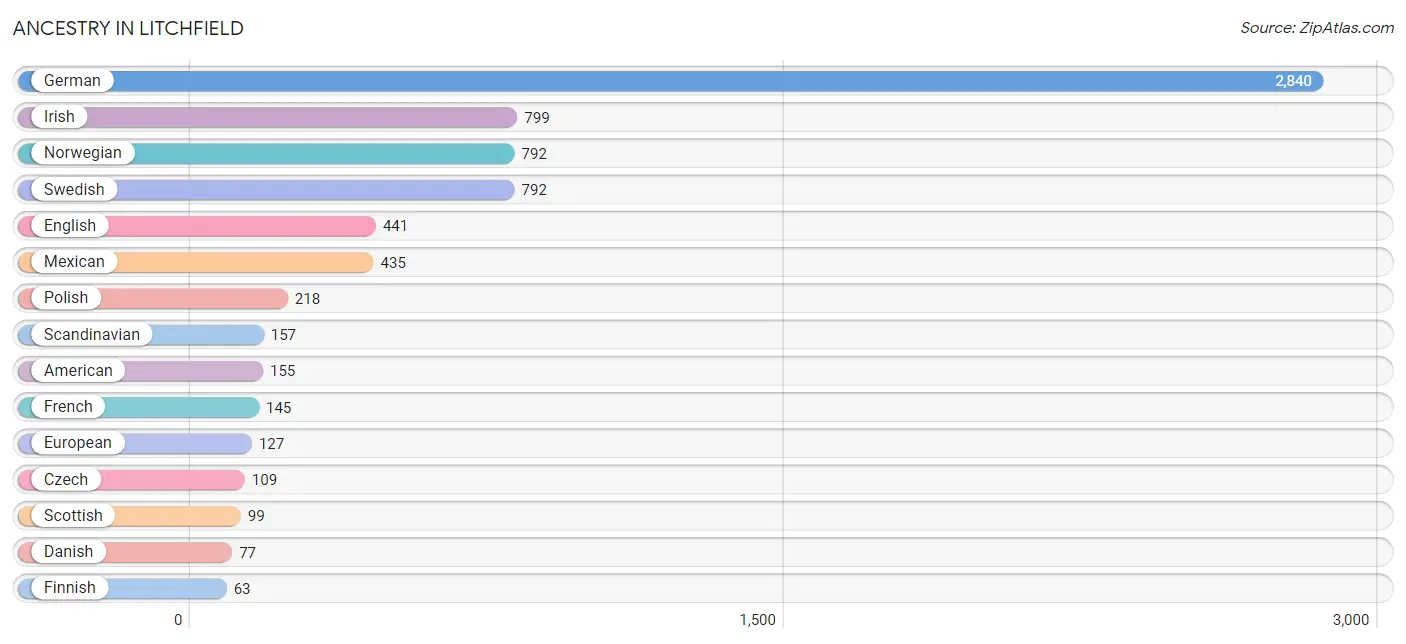
Ancestry in Litchfield
The most populous ancestries reported in Litchfield are German (2,840 | 43.0%), Irish (799 | 12.1%), Norwegian (792 | 12.0%), Swedish (792 | 12.0%), and English (441 | 6.7%), together accounting for 85.8% of all Litchfield residents.
| Ancestry | # Population | % Population |
| American | 155 | 2.4% |
| Apache | 3 | 0.1% |
| British | 10 | 0.2% |
| Canadian | 9 | 0.1% |
| Central American | 18 | 0.3% |
| Cherokee | 13 | 0.2% |
| Chippewa | 1 | 0.0% |
| Croatian | 14 | 0.2% |
| Czech | 109 | 1.7% |
| Danish | 77 | 1.2% |
| Dutch | 35 | 0.5% |
| English | 441 | 6.7% |
| European | 127 | 1.9% |
| Finnish | 63 | 0.9% |
| French | 145 | 2.2% |
| French American Indian | 4 | 0.1% |
| French Canadian | 10 | 0.2% |
| German | 2,840 | 43.0% |
| Guamanian / Chamorro | 40 | 0.6% |
| Guatemalan | 18 | 0.3% |
| Indonesian | 1 | 0.0% |
| Irish | 799 | 12.1% |
| Italian | 43 | 0.6% |
| Mexican | 435 | 6.6% |
| Navajo | 14 | 0.2% |
| Norwegian | 792 | 12.0% |
| Polish | 218 | 3.3% |
| Russian | 15 | 0.2% |
| Scandinavian | 157 | 2.4% |
| Scottish | 99 | 1.5% |
| Seminole | 2 | 0.0% |
| Sioux | 2 | 0.0% |
| Somali | 1 | 0.0% |
| Spaniard | 26 | 0.4% |
| Subsaharan African | 1 | 0.0% |
| Swedish | 792 | 12.0% |
| Swiss | 12 | 0.2% | View All 37 Rows |
Immigrants in Litchfield
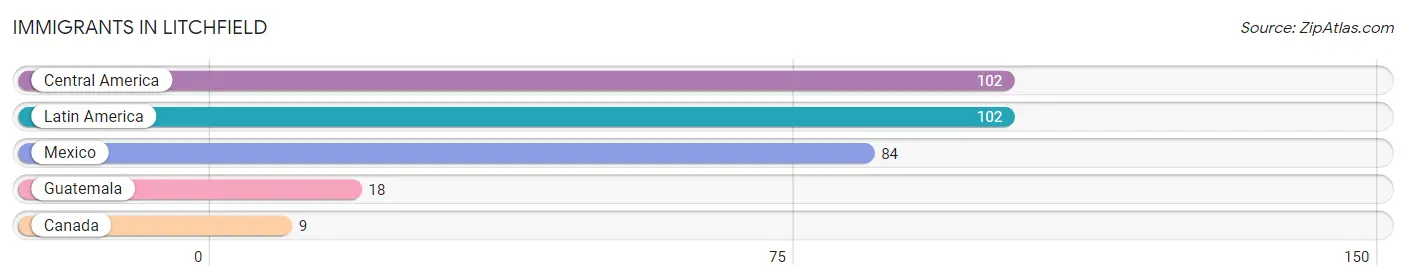
The most numerous immigrant groups reported in Litchfield came from Central America (102 | 1.5%), Latin America (102 | 1.5%), Mexico (84 | 1.3%), Guatemala (18 | 0.3%), and Canada (9 | 0.1%), together accounting for 4.8% of all Litchfield residents.
| Immigration Origin | # Population | % Population |
| Canada | 9 | 0.1% |
| Central America | 102 | 1.5% |
| Guatemala | 18 | 0.3% |
| Latin America | 102 | 1.5% |
| Mexico | 84 | 1.3% | View All 5 Rows |
Sex and Age in Litchfield
Sex and Age in Litchfield
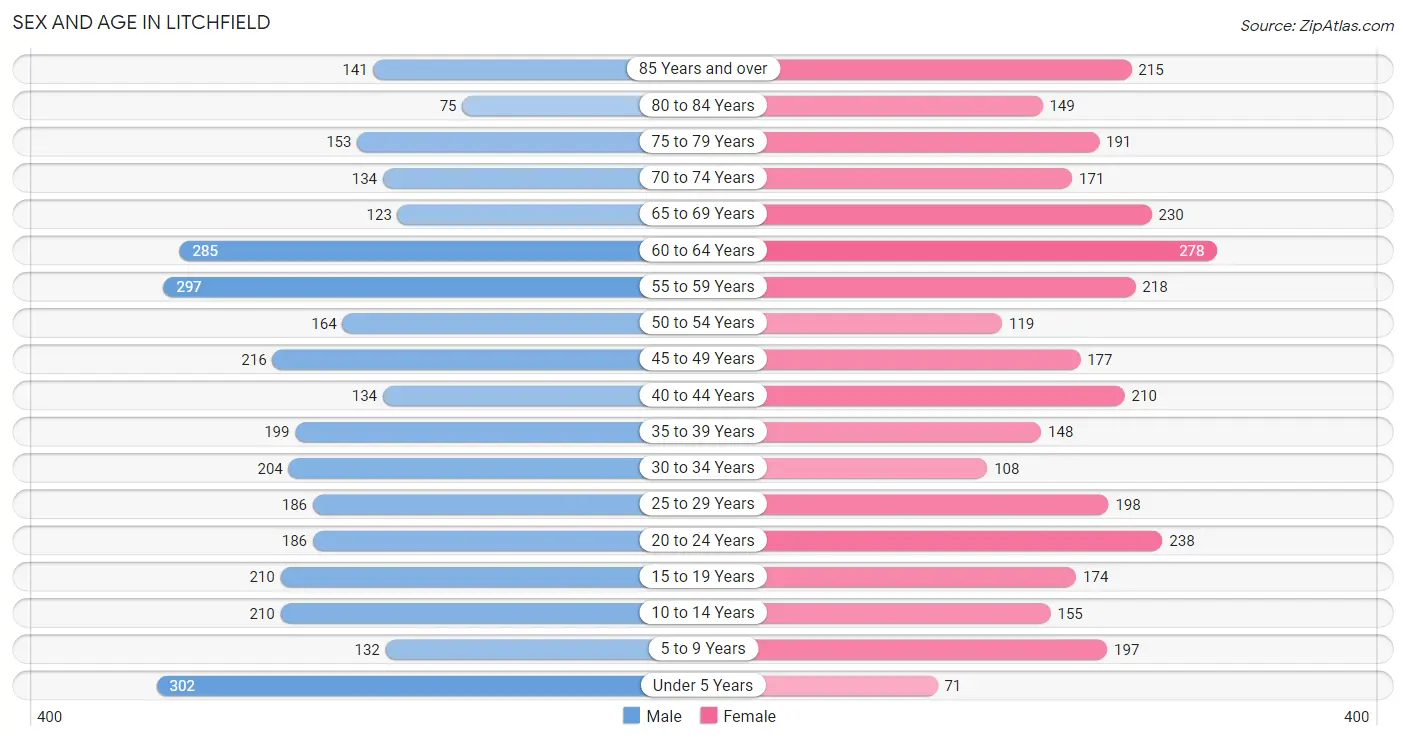
The most populous age groups in Litchfield are Under 5 Years (302 | 9.0%) for men and 60 to 64 Years (278 | 8.6%) for women.
| Age Bracket | Male | Female |
| Under 5 Years | 302 (9.0%) | 71 (2.2%) |
| 5 to 9 Years | 132 (3.9%) | 197 (6.1%) |
| 10 to 14 Years | 210 (6.3%) | 155 (4.8%) |
| 15 to 19 Years | 210 (6.3%) | 174 (5.4%) |
| 20 to 24 Years | 186 (5.6%) | 238 (7.3%) |
| 25 to 29 Years | 186 (5.6%) | 198 (6.1%) |
| 30 to 34 Years | 204 (6.1%) | 108 (3.3%) |
| 35 to 39 Years | 199 (5.9%) | 148 (4.6%) |
| 40 to 44 Years | 134 (4.0%) | 210 (6.5%) |
| 45 to 49 Years | 216 (6.5%) | 177 (5.4%) |
| 50 to 54 Years | 164 (4.9%) | 119 (3.7%) |
| 55 to 59 Years | 297 (8.9%) | 218 (6.7%) |
| 60 to 64 Years | 285 (8.5%) | 278 (8.6%) |
| 65 to 69 Years | 123 (3.7%) | 230 (7.1%) |
| 70 to 74 Years | 134 (4.0%) | 171 (5.3%) |
| 75 to 79 Years | 153 (4.6%) | 191 (5.9%) |
| 80 to 84 Years | 75 (2.2%) | 149 (4.6%) |
| 85 Years and over | 141 (4.2%) | 215 (6.6%) |
| Total | 3,351 (100.0%) | 3,247 (100.0%) |
Families and Households in Litchfield
Median Family Size in Litchfield
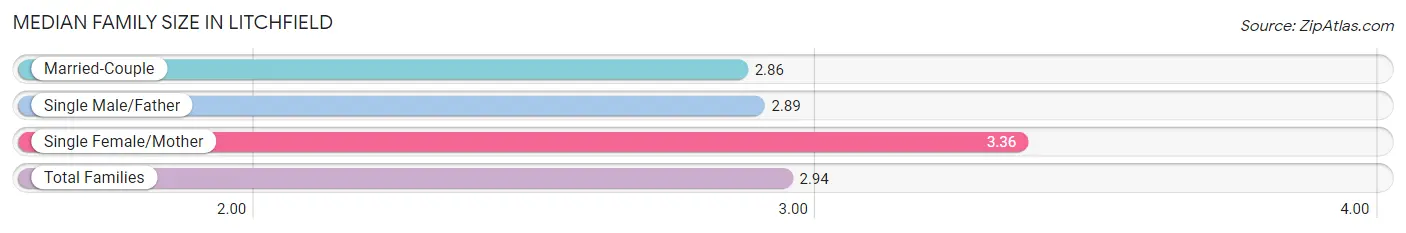
The median family size in Litchfield is 2.94 persons per family, with single female/mother families (261 | 15.9%) accounting for the largest median family size of 3.36 persons per family. On the other hand, married-couple families (1,228 | 74.8%) represent the smallest median family size with 2.86 persons per family.
| Family Type | # Families | Family Size |
| Married-Couple | 1,228 (74.8%) | 2.86 |
| Single Male/Father | 152 (9.3%) | 2.89 |
| Single Female/Mother | 261 (15.9%) | 3.36 |
| Total Families | 1,641 (100.0%) | 2.94 |
Median Household Size in Litchfield
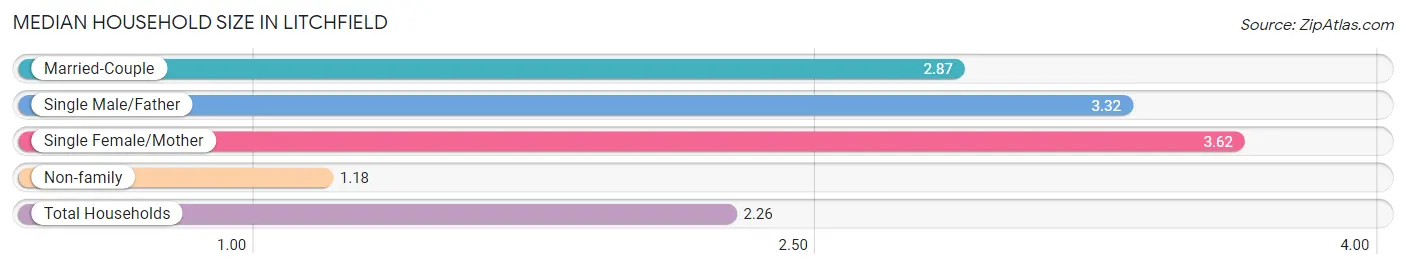
The median household size in Litchfield is 2.26 persons per household, with single female/mother households (261 | 9.3%) accounting for the largest median household size of 3.62 persons per household. non-family households (1,175 | 41.7%) represent the smallest median household size with 1.18 persons per household.
| Household Type | # Households | Household Size |
| Married-Couple | 1,228 (43.6%) | 2.87 |
| Single Male/Father | 152 (5.4%) | 3.32 |
| Single Female/Mother | 261 (9.3%) | 3.62 |
| Non-family | 1,175 (41.7%) | 1.18 |
| Total Households | 2,816 (100.0%) | 2.26 |
Household Size by Marriage Status in Litchfield
Out of a total of 2,816 households in Litchfield, 1,641 (58.3%) are family households, while 1,175 (41.7%) are nonfamily households. The most numerous type of family households are 2-person households, comprising 901, and the most common type of nonfamily households are 1-person households, comprising 1,045.
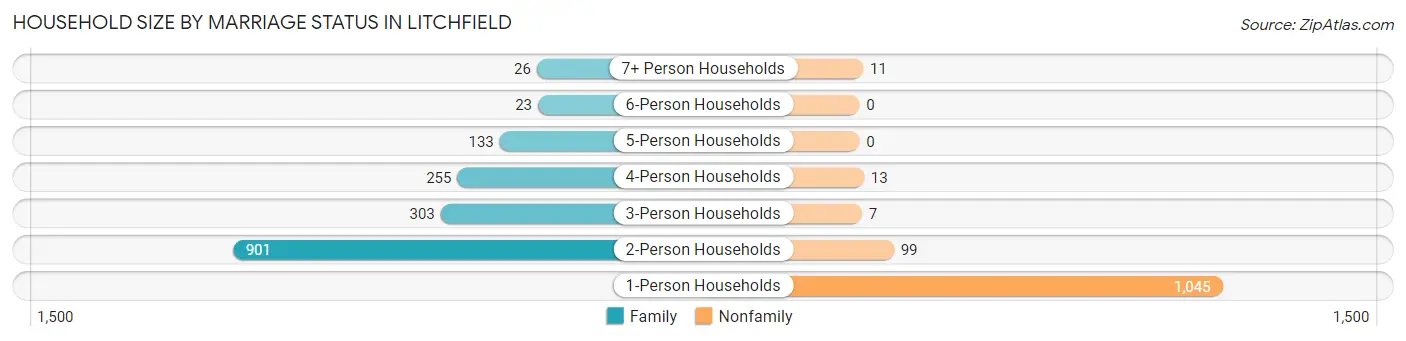
| Household Size | Family Households | Nonfamily Households |
| 1-Person Households | - | 1,045 (37.1%) |
| 2-Person Households | 901 (32.0%) | 99 (3.5%) |
| 3-Person Households | 303 (10.8%) | 7 (0.3%) |
| 4-Person Households | 255 (9.1%) | 13 (0.5%) |
| 5-Person Households | 133 (4.7%) | 0 (0.0%) |
| 6-Person Households | 23 (0.8%) | 0 (0.0%) |
| 7+ Person Households | 26 (0.9%) | 11 (0.4%) |
| Total | 1,641 (58.3%) | 1,175 (41.7%) |
Female Fertility in Litchfield
Fertility by Age in Litchfield
Average fertility rate in Litchfield is 93.0 births per 1,000 women. Women in the age bracket of 20 to 34 years have the highest fertility rate with 186.0 births per 1,000 women. Women in the age bracket of 20 to 34 years acount for 84.9% of all women with births.
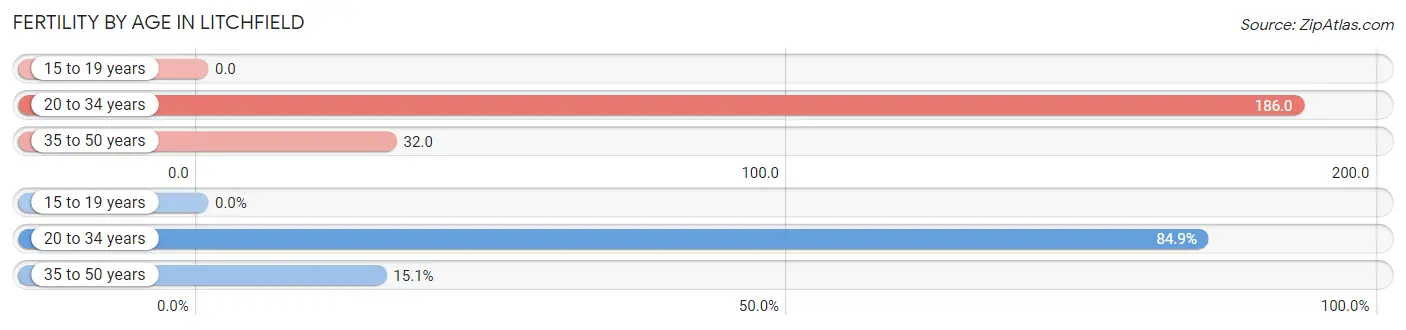
| Age Bracket | Women with Births | Births / 1,000 Women |
| 15 to 19 years | 0 (0.0%) | 0.0 |
| 20 to 34 years | 101 (84.9%) | 186.0 |
| 35 to 50 years | 18 (15.1%) | 32.0 |
| Total | 119 (100.0%) | 93.0 |
Fertility by Age by Marriage Status in Litchfield
44.5% of women with births (119) in Litchfield are married. The highest percentage of unmarried women with births falls into 20 to 34 years age bracket with 56.4% of them unmarried at the time of birth, while the lowest percentage of unmarried women with births belong to 35 to 50 years age bracket with 50.0% of them unmarried.
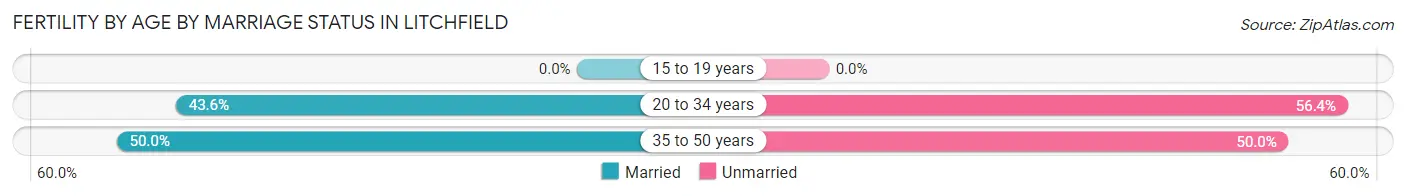
| Age Bracket | Married | Unmarried |
| 15 to 19 years | 0 (0.0%) | 0 (0.0%) |
| 20 to 34 years | 44 (43.6%) | 57 (56.4%) |
| 35 to 50 years | 9 (50.0%) | 9 (50.0%) |
| Total | 53 (44.5%) | 66 (55.5%) |
Fertility by Education in Litchfield
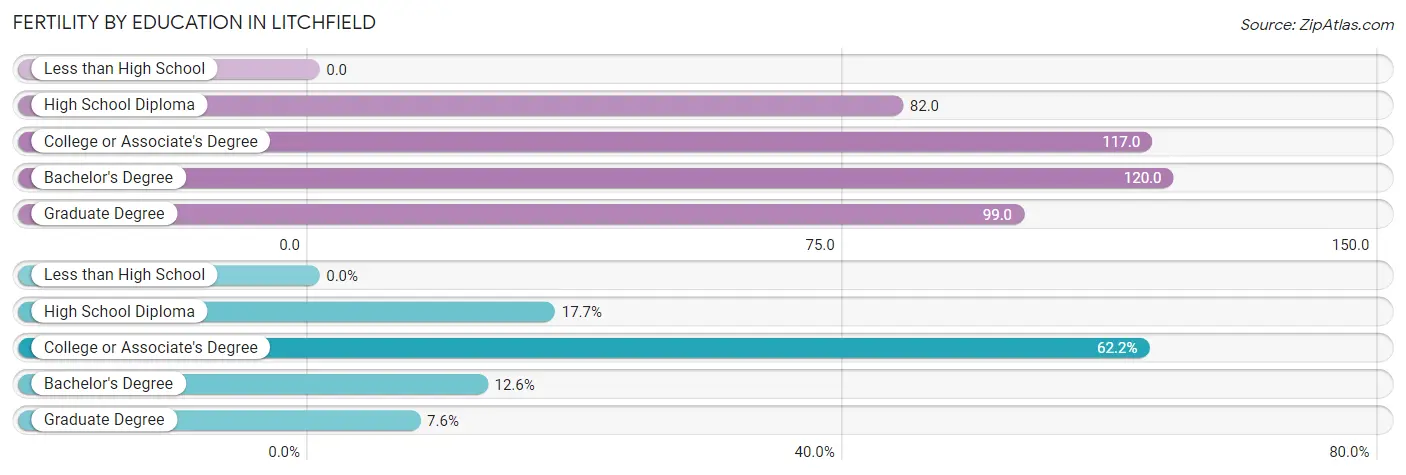
| Educational Attainment | Women with Births | Births / 1,000 Women |
| Less than High School | 0 (0.0%) | 0.0 |
| High School Diploma | 21 (17.6%) | 82.0 |
| College or Associate's Degree | 74 (62.2%) | 117.0 |
| Bachelor's Degree | 15 (12.6%) | 120.0 |
| Graduate Degree | 9 (7.6%) | 99.0 |
| Total | 119 (100.0%) | 93.0 |
Fertility by Education by Marriage Status in Litchfield
55.5% of women with births in Litchfield are unmarried. Women with the educational attainment of bachelor's degree are most likely to be married with 100.0% of them married at childbirth, while women with the educational attainment of college or associate's degree are least likely to be married with 77.0% of them unmarried at childbirth.
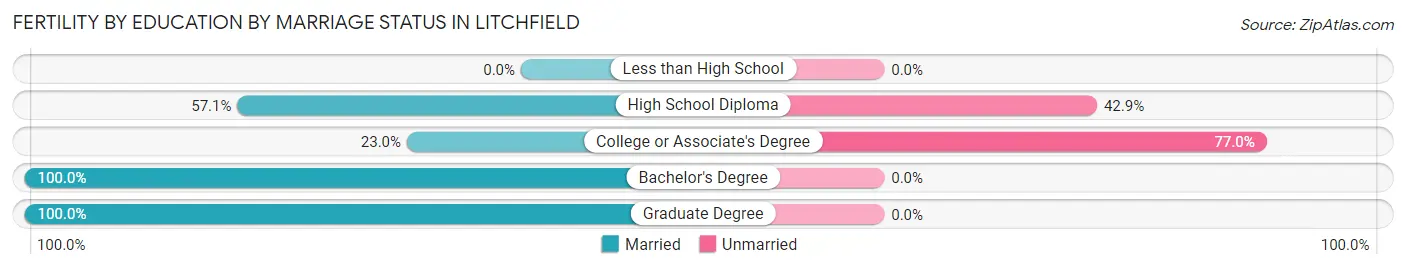
| Educational Attainment | Married | Unmarried |
| Less than High School | 0 (0.0%) | 0 (0.0%) |
| High School Diploma | 12 (57.1%) | 9 (42.9%) |
| College or Associate's Degree | 17 (23.0%) | 57 (77.0%) |
| Bachelor's Degree | 15 (100.0%) | 0 (0.0%) |
| Graduate Degree | 9 (100.0%) | 0 (0.0%) |
| Total | 53 (44.5%) | 66 (55.5%) |
Employment Characteristics in Litchfield
Employment by Class of Employer in Litchfield
Among the 3,227 employed individuals in Litchfield, private company employees (2,204 | 68.3%), not-for-profit organizations (359 | 11.1%), and local government employees (291 | 9.0%) make up the most common classes of employment.
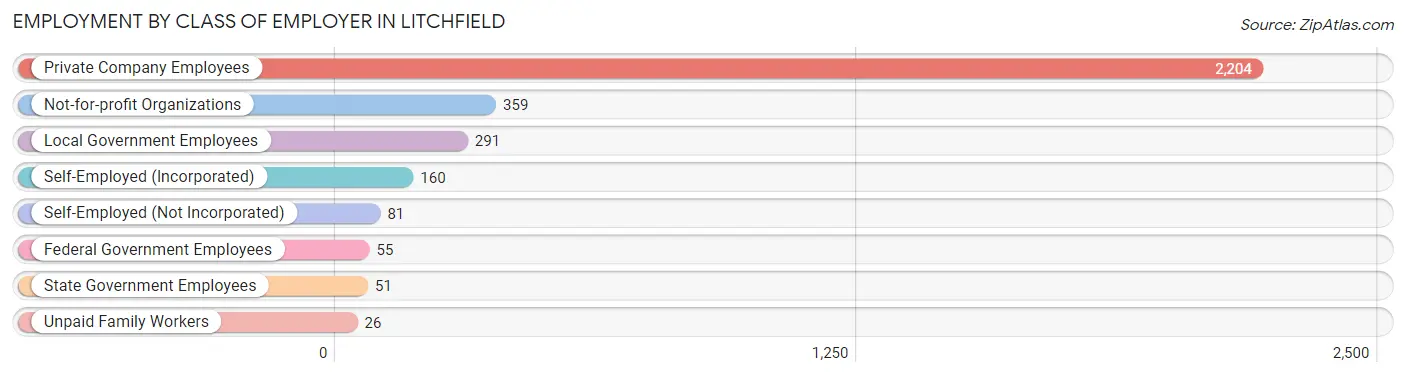
| Employer Class | # Employees | % Employees |
| Private Company Employees | 2,204 | 68.3% |
| Self-Employed (Incorporated) | 160 | 5.0% |
| Self-Employed (Not Incorporated) | 81 | 2.5% |
| Not-for-profit Organizations | 359 | 11.1% |
| Local Government Employees | 291 | 9.0% |
| State Government Employees | 51 | 1.6% |
| Federal Government Employees | 55 | 1.7% |
| Unpaid Family Workers | 26 | 0.8% |
| Total | 3,227 | 100.0% |
Employment Status by Age in Litchfield
According to the labor force statistics for Litchfield, out of the total population over 16 years of age (5,425), 61.9% or 3,358 individuals are in the labor force, with 2.0% or 67 of them unemployed. The age group with the highest labor force participation rate is 35 to 44 years, with 93.3% or 645 individuals in the labor force. Within the labor force, the 20 to 24 years age range has the highest percentage of unemployed individuals, with 7.9% or 29 of them being unemployed.
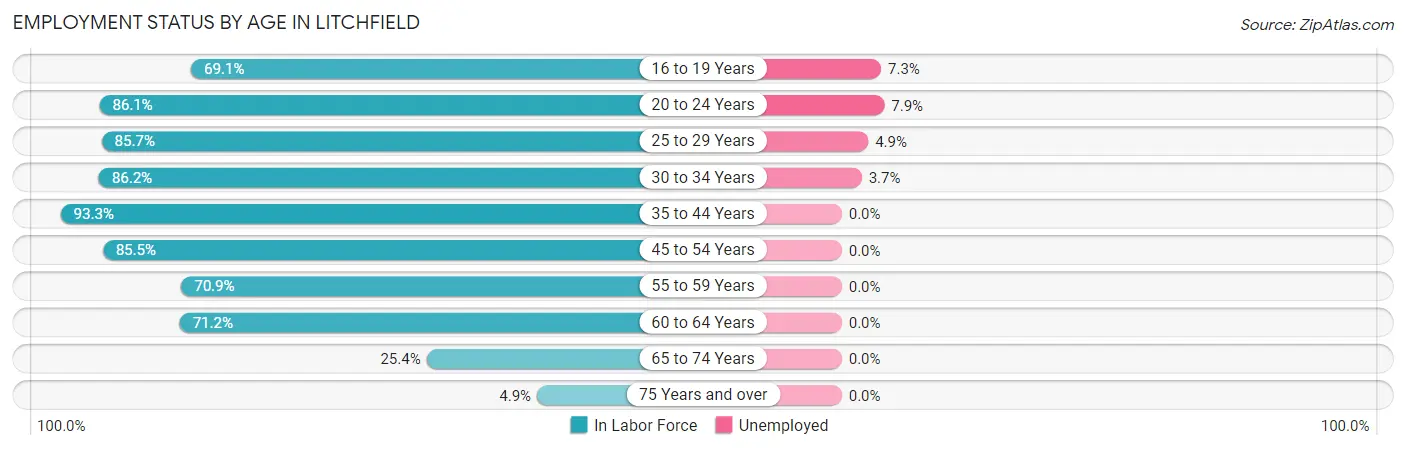
| Age Bracket | In Labor Force | Unemployed |
| 16 to 19 Years | 192 (69.1%) | 14 (7.3%) |
| 20 to 24 Years | 365 (86.1%) | 29 (7.9%) |
| 25 to 29 Years | 329 (85.7%) | 16 (4.9%) |
| 30 to 34 Years | 269 (86.2%) | 10 (3.7%) |
| 35 to 44 Years | 645 (93.3%) | 0 (0.0%) |
| 45 to 54 Years | 578 (85.5%) | 0 (0.0%) |
| 55 to 59 Years | 365 (70.9%) | 0 (0.0%) |
| 60 to 64 Years | 401 (71.2%) | 0 (0.0%) |
| 65 to 74 Years | 167 (25.4%) | 0 (0.0%) |
| 75 Years and over | 45 (4.9%) | 0 (0.0%) |
| Total | 3,358 (61.9%) | 67 (2.0%) |
Employment Status by Educational Attainment in Litchfield
According to labor force statistics for Litchfield, 82.4% of individuals (2,588) out of the total population between 25 and 64 years of age (3,141) are in the labor force, with 1.0% or 26 of them being unemployed. The group with the highest labor force participation rate are those with the educational attainment of bachelor's degree or higher, with 95.4% or 587 individuals in the labor force. Within the labor force, individuals with bachelor's degree or higher education have the highest percentage of unemployment, with 1.7% or 10 of them being unemployed.
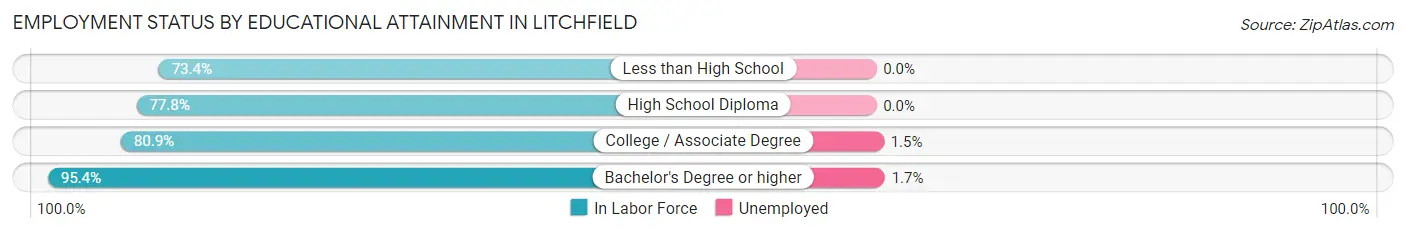
| Educational Attainment | In Labor Force | Unemployed |
| Less than High School | 116 (73.4%) | 0 (0.0%) |
| High School Diploma | 807 (77.8%) | 0 (0.0%) |
| College / Associate Degree | 1,077 (80.9%) | 20 (1.5%) |
| Bachelor's Degree or higher | 587 (95.4%) | 10 (1.7%) |
| Total | 2,588 (82.4%) | 31 (1.0%) |
Employment Occupations by Sex in Litchfield
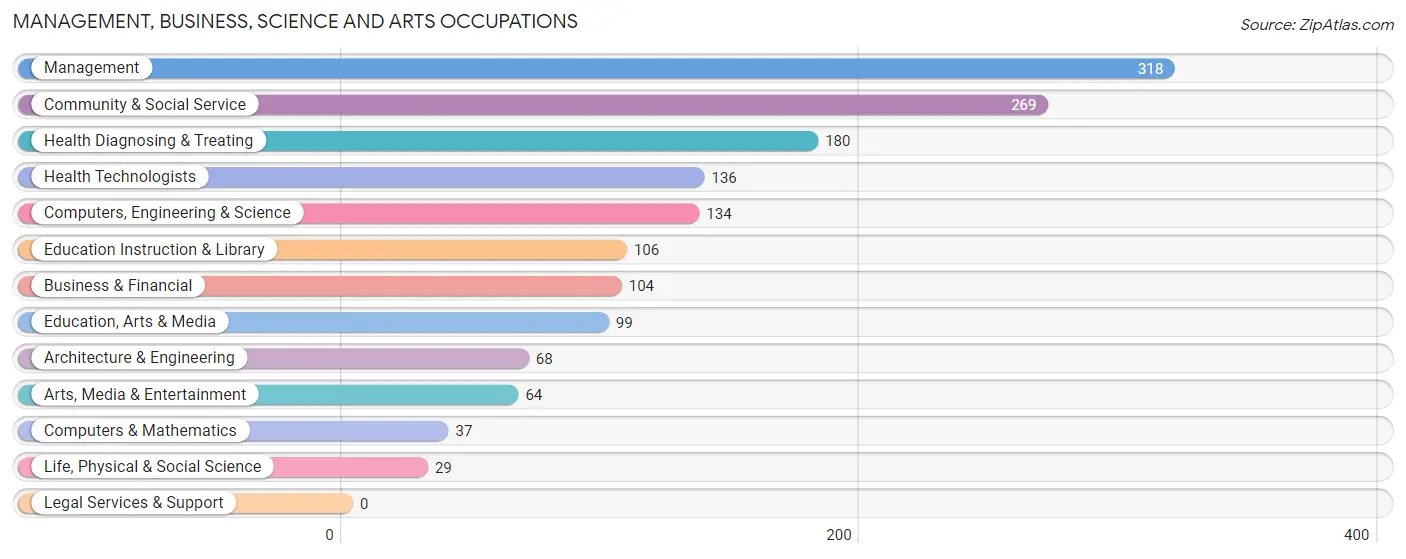
Management, Business, Science and Arts Occupations
The most common Management, Business, Science and Arts occupations in Litchfield are Management (318 | 9.7%), Community & Social Service (269 | 8.2%), Health Diagnosing & Treating (180 | 5.5%), Health Technologists (136 | 4.2%), and Computers, Engineering & Science (134 | 4.1%).
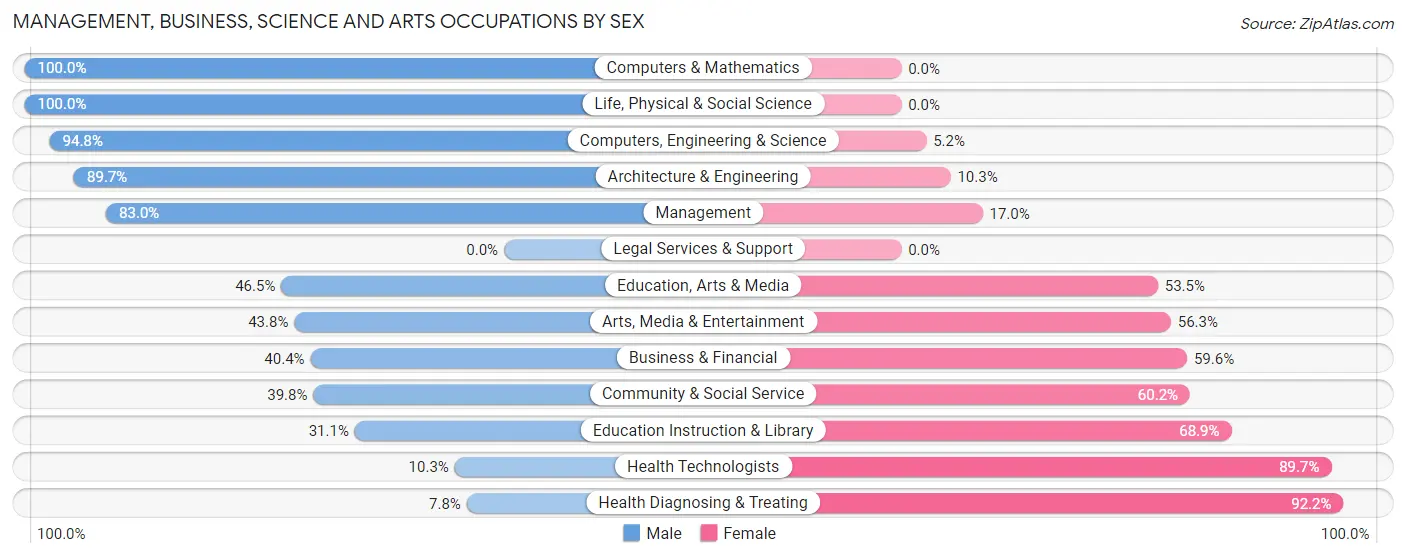
Management, Business, Science and Arts Occupations by Sex
Within the Management, Business, Science and Arts occupations in Litchfield, the most male-oriented occupations are Computers & Mathematics (100.0%), Life, Physical & Social Science (100.0%), and Computers, Engineering & Science (94.8%), while the most female-oriented occupations are Health Diagnosing & Treating (92.2%), Health Technologists (89.7%), and Education Instruction & Library (68.9%).
| Occupation | Male | Female |
| Management | 264 (83.0%) | 54 (17.0%) |
| Business & Financial | 42 (40.4%) | 62 (59.6%) |
| Computers, Engineering & Science | 127 (94.8%) | 7 (5.2%) |
| Computers & Mathematics | 37 (100.0%) | 0 (0.0%) |
| Architecture & Engineering | 61 (89.7%) | 7 (10.3%) |
| Life, Physical & Social Science | 29 (100.0%) | 0 (0.0%) |
| Community & Social Service | 107 (39.8%) | 162 (60.2%) |
| Education, Arts & Media | 46 (46.5%) | 53 (53.5%) |
| Legal Services & Support | 0 (0.0%) | 0 (0.0%) |
| Education Instruction & Library | 33 (31.1%) | 73 (68.9%) |
| Arts, Media & Entertainment | 28 (43.8%) | 36 (56.2%) |
| Health Diagnosing & Treating | 14 (7.8%) | 166 (92.2%) |
| Health Technologists | 14 (10.3%) | 122 (89.7%) |
| Total (Category) | 554 (55.1%) | 451 (44.9%) |
| Total (Overall) | 1,746 (53.3%) | 1,532 (46.7%) |
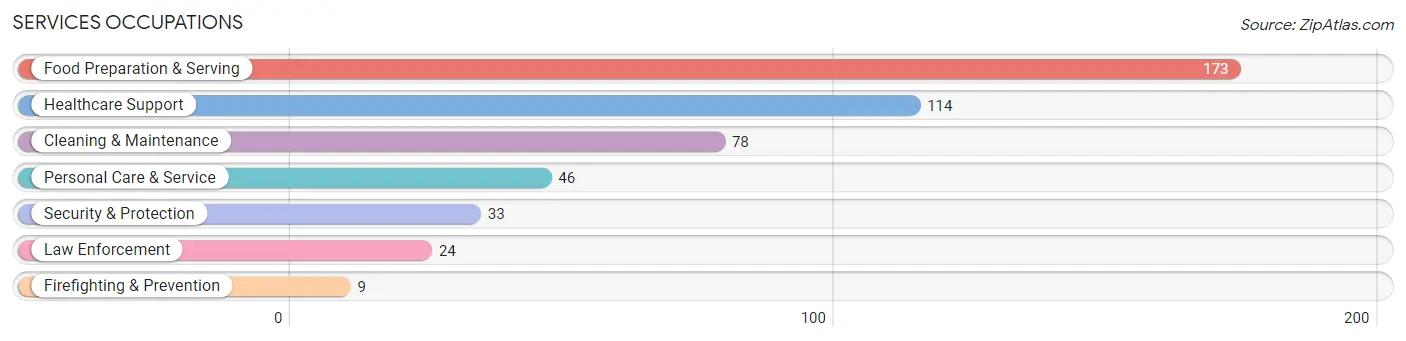
Services Occupations
The most common Services occupations in Litchfield are Food Preparation & Serving (173 | 5.3%), Healthcare Support (114 | 3.5%), Cleaning & Maintenance (78 | 2.4%), Personal Care & Service (46 | 1.4%), and Security & Protection (33 | 1.0%).
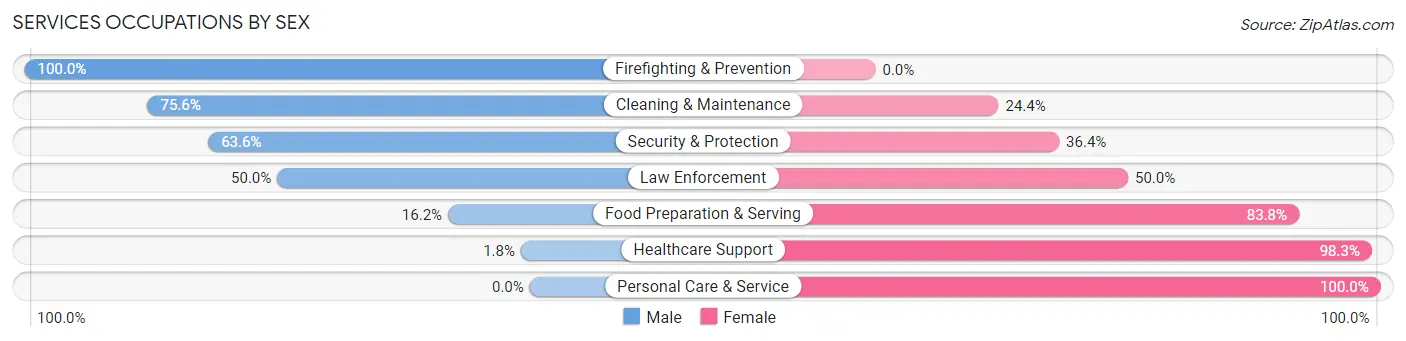
Services Occupations by Sex
Within the Services occupations in Litchfield, the most male-oriented occupations are Firefighting & Prevention (100.0%), Cleaning & Maintenance (75.6%), and Security & Protection (63.6%), while the most female-oriented occupations are Personal Care & Service (100.0%), Healthcare Support (98.3%), and Food Preparation & Serving (83.8%).
| Occupation | Male | Female |
| Healthcare Support | 2 (1.8%) | 112 (98.3%) |
| Security & Protection | 21 (63.6%) | 12 (36.4%) |
| Firefighting & Prevention | 9 (100.0%) | 0 (0.0%) |
| Law Enforcement | 12 (50.0%) | 12 (50.0%) |
| Food Preparation & Serving | 28 (16.2%) | 145 (83.8%) |
| Cleaning & Maintenance | 59 (75.6%) | 19 (24.4%) |
| Personal Care & Service | 0 (0.0%) | 46 (100.0%) |
| Total (Category) | 110 (24.8%) | 334 (75.2%) |
| Total (Overall) | 1,746 (53.3%) | 1,532 (46.7%) |
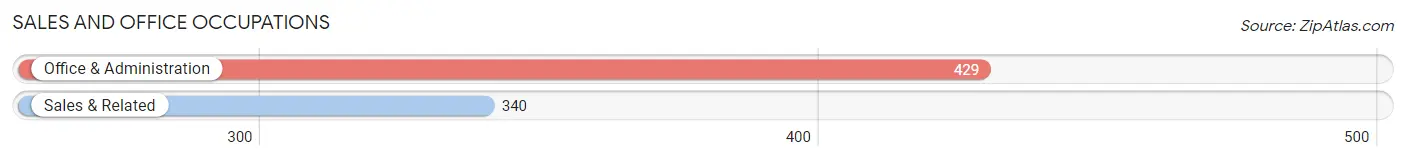
Sales and Office Occupations
The most common Sales and Office occupations in Litchfield are Office & Administration (429 | 13.1%), and Sales & Related (340 | 10.4%).
Sales and Office Occupations by Sex
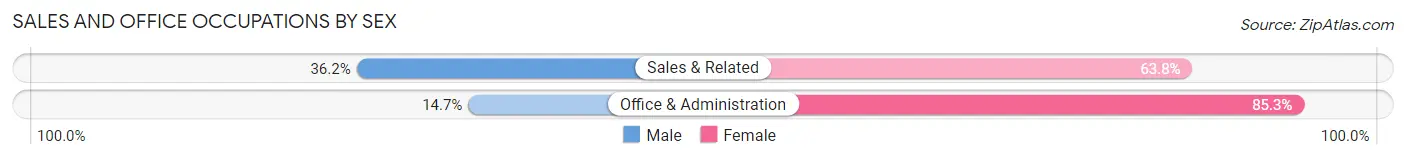
| Occupation | Male | Female |
| Sales & Related | 123 (36.2%) | 217 (63.8%) |
| Office & Administration | 63 (14.7%) | 366 (85.3%) |
| Total (Category) | 186 (24.2%) | 583 (75.8%) |
| Total (Overall) | 1,746 (53.3%) | 1,532 (46.7%) |
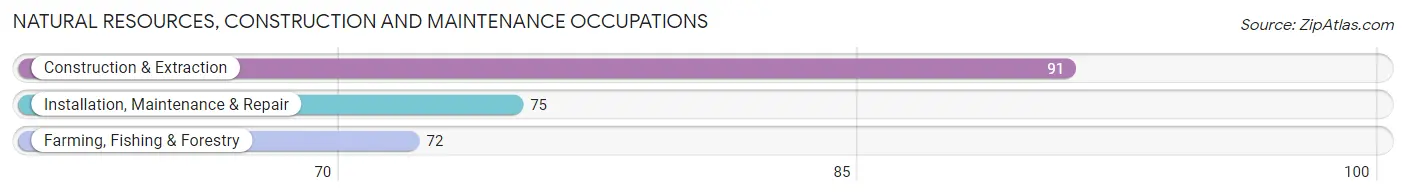
Natural Resources, Construction and Maintenance Occupations
The most common Natural Resources, Construction and Maintenance occupations in Litchfield are Construction & Extraction (91 | 2.8%), Installation, Maintenance & Repair (75 | 2.3%), and Farming, Fishing & Forestry (72 | 2.2%).
Natural Resources, Construction and Maintenance Occupations by Sex
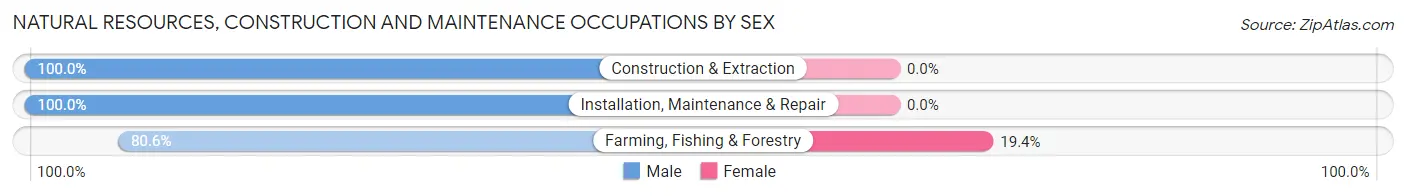
| Occupation | Male | Female |
| Farming, Fishing & Forestry | 58 (80.6%) | 14 (19.4%) |
| Construction & Extraction | 91 (100.0%) | 0 (0.0%) |
| Installation, Maintenance & Repair | 75 (100.0%) | 0 (0.0%) |
| Total (Category) | 224 (94.1%) | 14 (5.9%) |
| Total (Overall) | 1,746 (53.3%) | 1,532 (46.7%) |
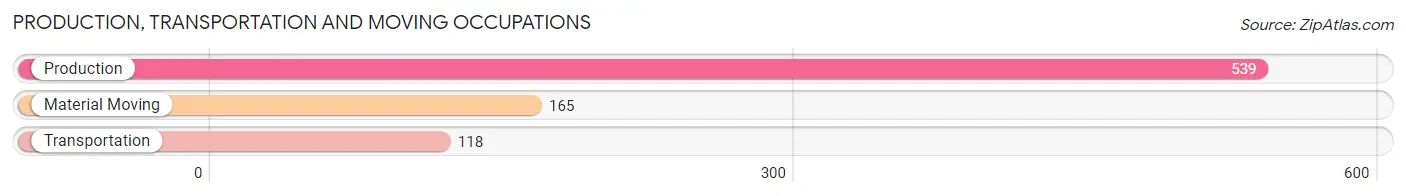
Production, Transportation and Moving Occupations
The most common Production, Transportation and Moving occupations in Litchfield are Production (539 | 16.4%), Material Moving (165 | 5.0%), and Transportation (118 | 3.6%).
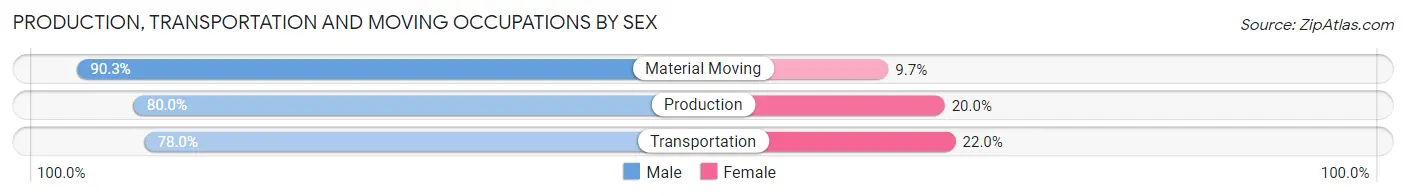
Production, Transportation and Moving Occupations by Sex
| Occupation | Male | Female |
| Production | 431 (80.0%) | 108 (20.0%) |
| Transportation | 92 (78.0%) | 26 (22.0%) |
| Material Moving | 149 (90.3%) | 16 (9.7%) |
| Total (Category) | 672 (81.8%) | 150 (18.2%) |
| Total (Overall) | 1,746 (53.3%) | 1,532 (46.7%) |
Employment Industries by Sex in Litchfield
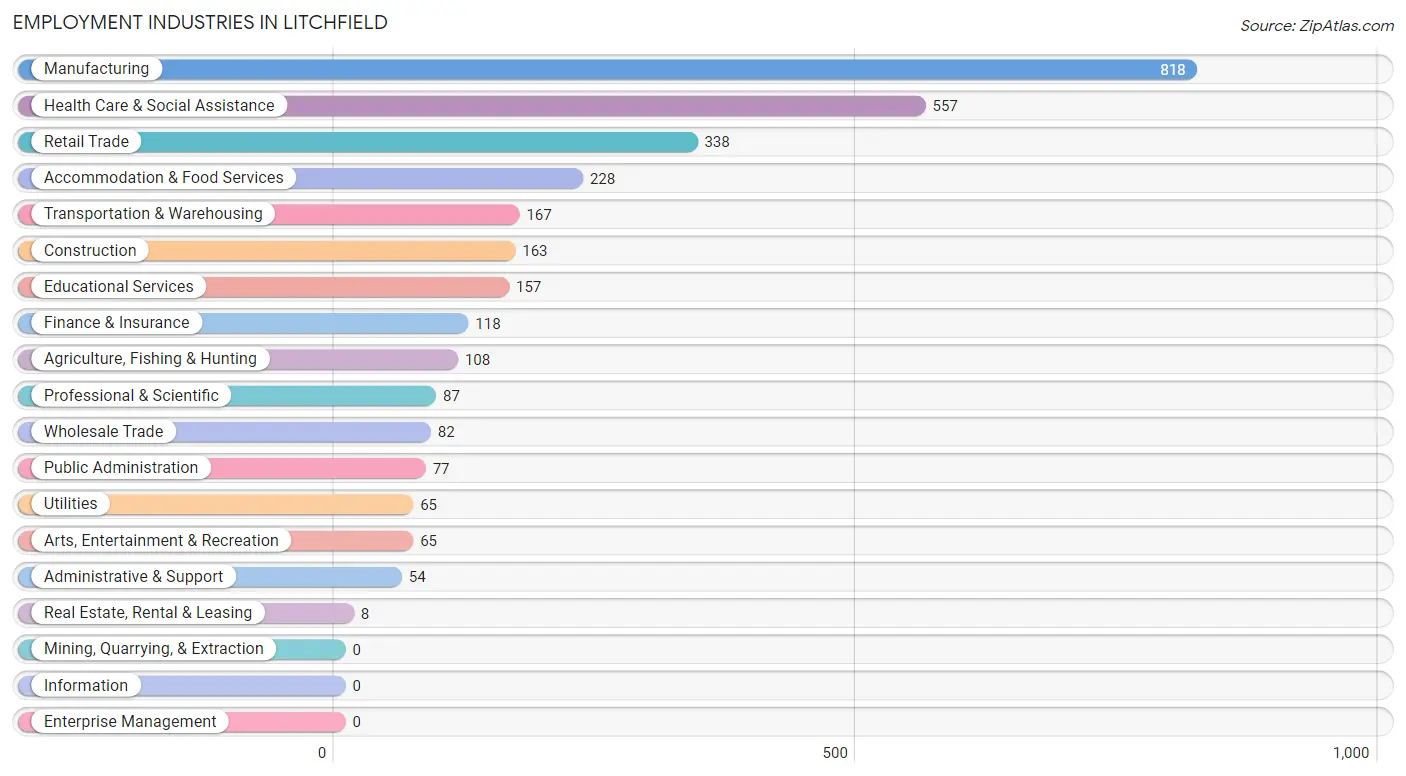
Employment Industries in Litchfield
The major employment industries in Litchfield include Manufacturing (818 | 24.9%), Health Care & Social Assistance (557 | 17.0%), Retail Trade (338 | 10.3%), Accommodation & Food Services (228 | 7.0%), and Transportation & Warehousing (167 | 5.1%).
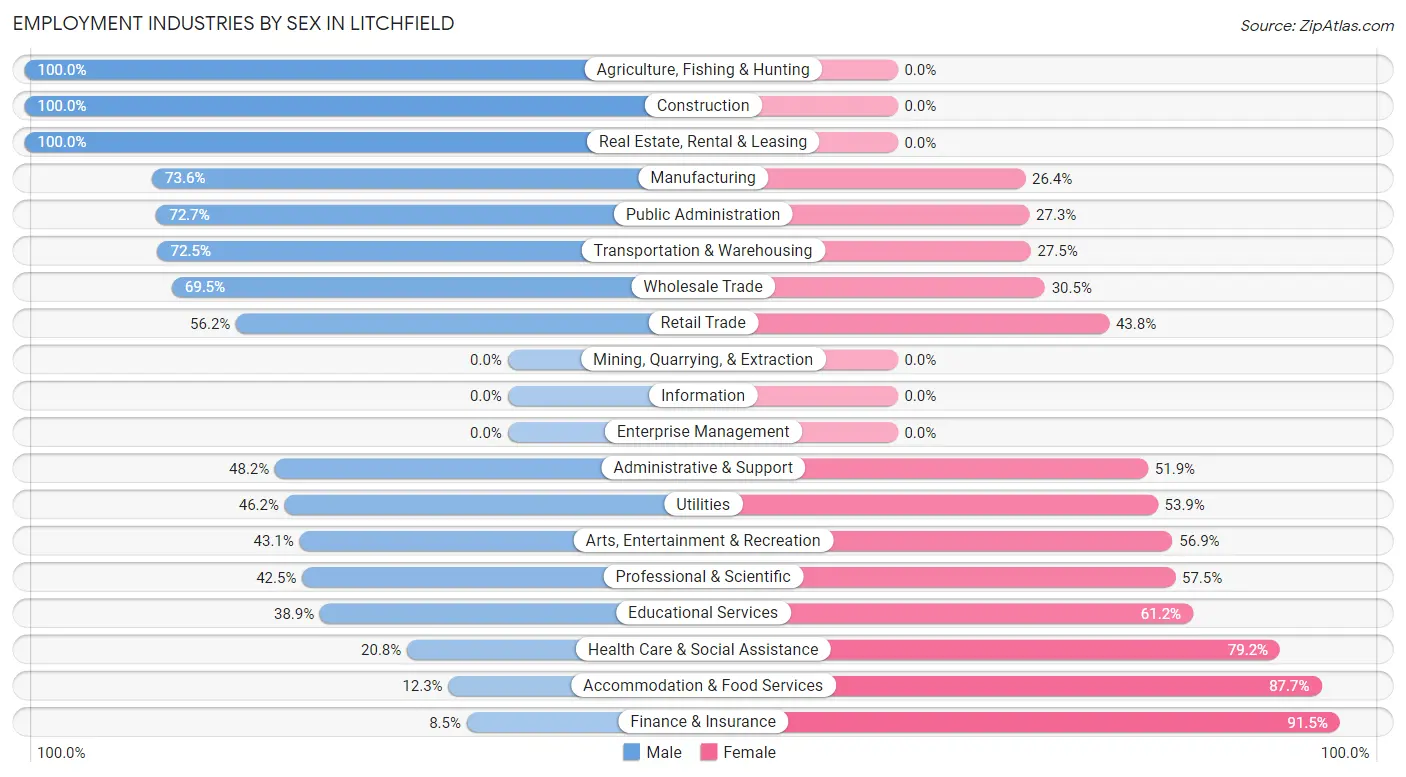
Employment Industries by Sex in Litchfield
The Litchfield industries that see more men than women are Agriculture, Fishing & Hunting (100.0%), Construction (100.0%), and Real Estate, Rental & Leasing (100.0%), whereas the industries that tend to have a higher number of women are Finance & Insurance (91.5%), Accommodation & Food Services (87.7%), and Health Care & Social Assistance (79.2%).
| Industry | Male | Female |
| Agriculture, Fishing & Hunting | 108 (100.0%) | 0 (0.0%) |
| Mining, Quarrying, & Extraction | 0 (0.0%) | 0 (0.0%) |
| Construction | 163 (100.0%) | 0 (0.0%) |
| Manufacturing | 602 (73.6%) | 216 (26.4%) |
| Wholesale Trade | 57 (69.5%) | 25 (30.5%) |
| Retail Trade | 190 (56.2%) | 148 (43.8%) |
| Transportation & Warehousing | 121 (72.5%) | 46 (27.5%) |
| Utilities | 30 (46.2%) | 35 (53.8%) |
| Information | 0 (0.0%) | 0 (0.0%) |
| Finance & Insurance | 10 (8.5%) | 108 (91.5%) |
| Real Estate, Rental & Leasing | 8 (100.0%) | 0 (0.0%) |
| Professional & Scientific | 37 (42.5%) | 50 (57.5%) |
| Enterprise Management | 0 (0.0%) | 0 (0.0%) |
| Administrative & Support | 26 (48.1%) | 28 (51.8%) |
| Educational Services | 61 (38.9%) | 96 (61.2%) |
| Health Care & Social Assistance | 116 (20.8%) | 441 (79.2%) |
| Arts, Entertainment & Recreation | 28 (43.1%) | 37 (56.9%) |
| Accommodation & Food Services | 28 (12.3%) | 200 (87.7%) |
| Public Administration | 56 (72.7%) | 21 (27.3%) |
| Total | 1,746 (53.3%) | 1,532 (46.7%) |
Education in Litchfield
School Enrollment in Litchfield
The most common levels of schooling among the 1,282 students in Litchfield are elementary school (309 | 24.1%), high school (298 | 23.2%), and college / undergraduate (277 | 21.6%).
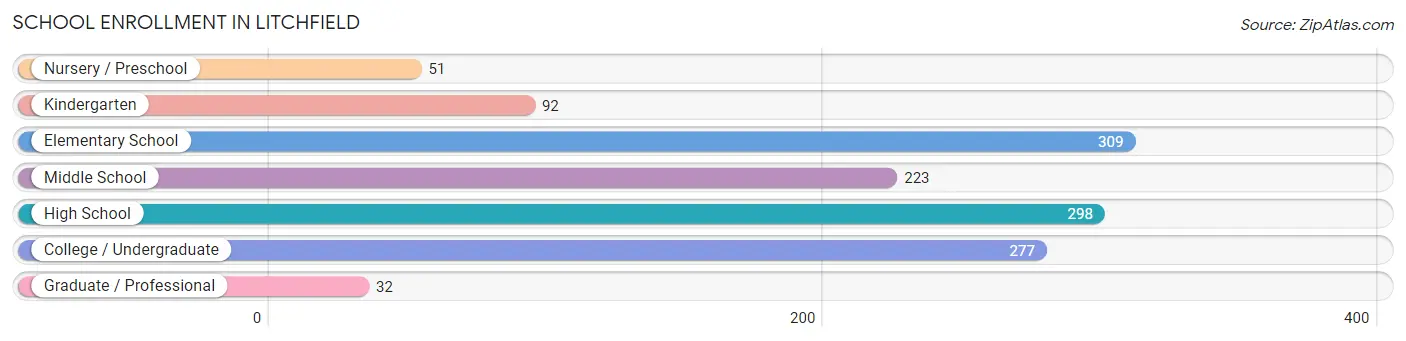
| School Level | # Students | % Students |
| Nursery / Preschool | 51 | 4.0% |
| Kindergarten | 92 | 7.2% |
| Elementary School | 309 | 24.1% |
| Middle School | 223 | 17.4% |
| High School | 298 | 23.2% |
| College / Undergraduate | 277 | 21.6% |
| Graduate / Professional | 32 | 2.5% |
| Total | 1,282 | 100.0% |
School Enrollment by Age by Funding Source in Litchfield
Out of a total of 1,282 students who are enrolled in schools in Litchfield, 106 (8.3%) attend a private institution, while the remaining 1,176 (91.7%) are enrolled in public schools. The age group of 35 years and over has the highest likelihood of being enrolled in private schools, with 11 (26.2% in the age bracket) enrolled. Conversely, the age group of 3 to 4 year olds has the lowest likelihood of being enrolled in a private school, with 18 (100.0% in the age bracket) attending a public institution.
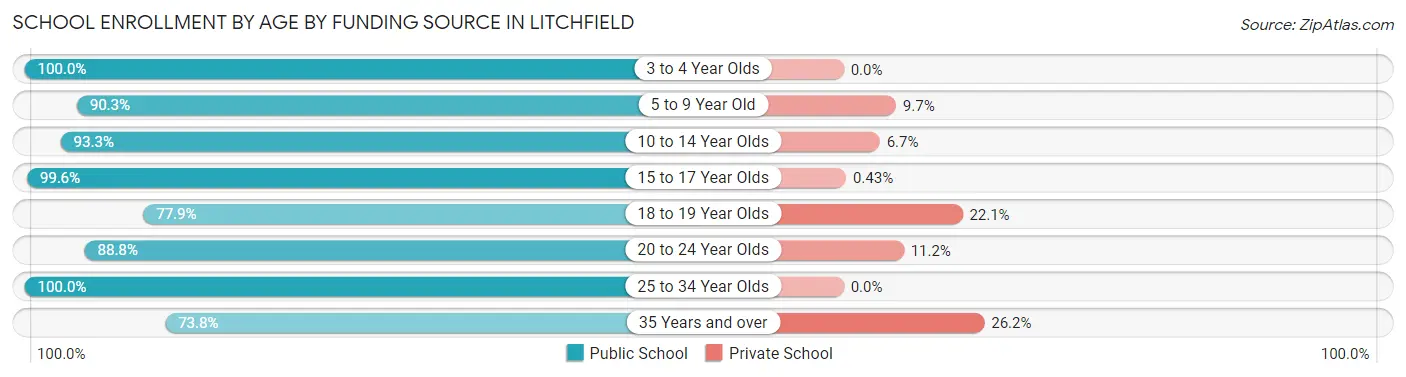
| Age Bracket | Public School | Private School |
| 3 to 4 Year Olds | 18 (100.0%) | 0 (0.0%) |
| 5 to 9 Year Old | 297 (90.3%) | 32 (9.7%) |
| 10 to 14 Year Olds | 320 (93.3%) | 23 (6.7%) |
| 15 to 17 Year Olds | 232 (99.6%) | 1 (0.4%) |
| 18 to 19 Year Olds | 81 (77.9%) | 23 (22.1%) |
| 20 to 24 Year Olds | 135 (88.8%) | 17 (11.2%) |
| 25 to 34 Year Olds | 61 (100.0%) | 0 (0.0%) |
| 35 Years and over | 31 (73.8%) | 11 (26.2%) |
| Total | 1,176 (91.7%) | 106 (8.3%) |
Educational Attainment by Field of Study in Litchfield
Education (246 | 23.7%), business (184 | 17.8%), science & technology (107 | 10.3%), arts & humanities (91 | 8.8%), and liberal arts & history (71 | 6.9%) are the most common fields of study among 1,036 individuals in Litchfield who have obtained a bachelor's degree or higher.
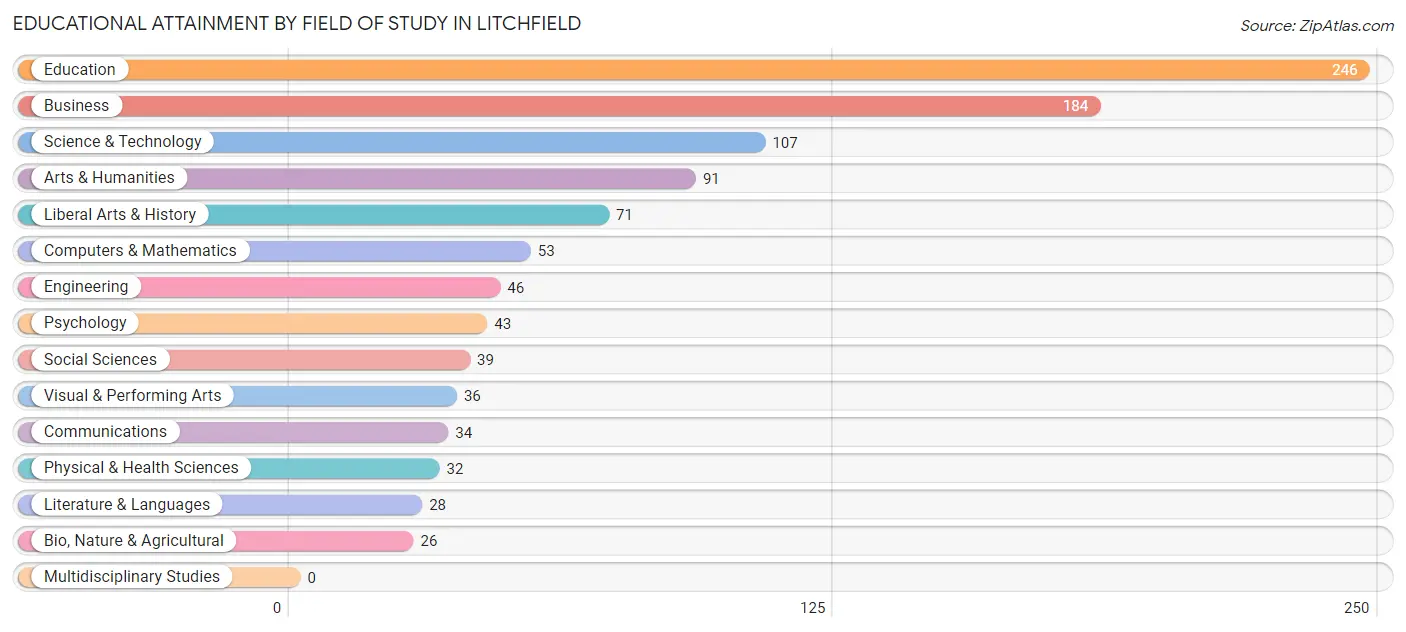
| Field of Study | # Graduates | % Graduates |
| Computers & Mathematics | 53 | 5.1% |
| Bio, Nature & Agricultural | 26 | 2.5% |
| Physical & Health Sciences | 32 | 3.1% |
| Psychology | 43 | 4.2% |
| Social Sciences | 39 | 3.8% |
| Engineering | 46 | 4.4% |
| Multidisciplinary Studies | 0 | 0.0% |
| Science & Technology | 107 | 10.3% |
| Business | 184 | 17.8% |
| Education | 246 | 23.7% |
| Literature & Languages | 28 | 2.7% |
| Liberal Arts & History | 71 | 6.9% |
| Visual & Performing Arts | 36 | 3.5% |
| Communications | 34 | 3.3% |
| Arts & Humanities | 91 | 8.8% |
| Total | 1,036 | 100.0% |
Transportation & Commute in Litchfield
Vehicle Availability by Sex in Litchfield
The most prevalent vehicle ownership categories in Litchfield are males with 2 vehicles (712, accounting for 42.0%) and females with 2 vehicles (583, making up 46.5%).
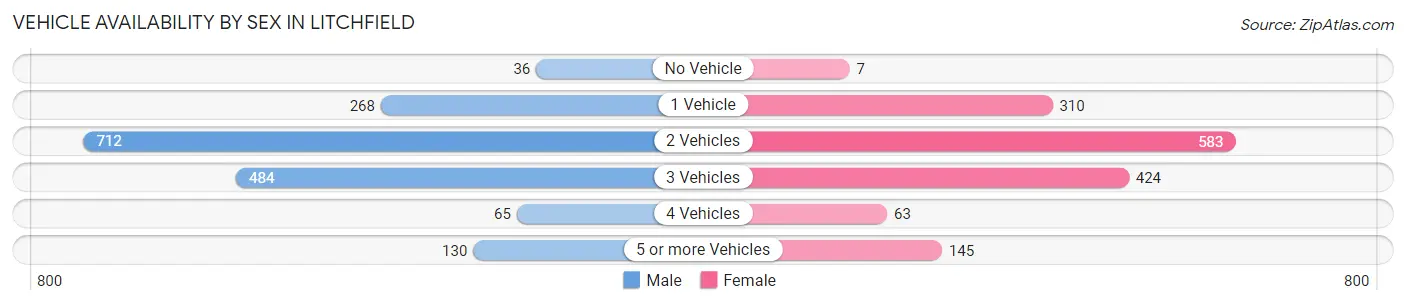
| Vehicles Available | Male | Female |
| No Vehicle | 36 (2.1%) | 7 (0.5%) |
| 1 Vehicle | 268 (15.8%) | 310 (20.2%) |
| 2 Vehicles | 712 (42.0%) | 583 (38.1%) |
| 3 Vehicles | 484 (28.5%) | 424 (27.7%) |
| 4 Vehicles | 65 (3.8%) | 63 (4.1%) |
| 5 or more Vehicles | 130 (7.7%) | 145 (9.5%) |
| Total | 1,695 (100.0%) | 1,532 (100.0%) |
Commute Time in Litchfield
The most frequently occuring commute durations in Litchfield are 5 to 9 minutes (1,226 commuters, 39.1%), 10 to 14 minutes (349 commuters, 11.1%), and less than 5 minutes (311 commuters, 9.9%).
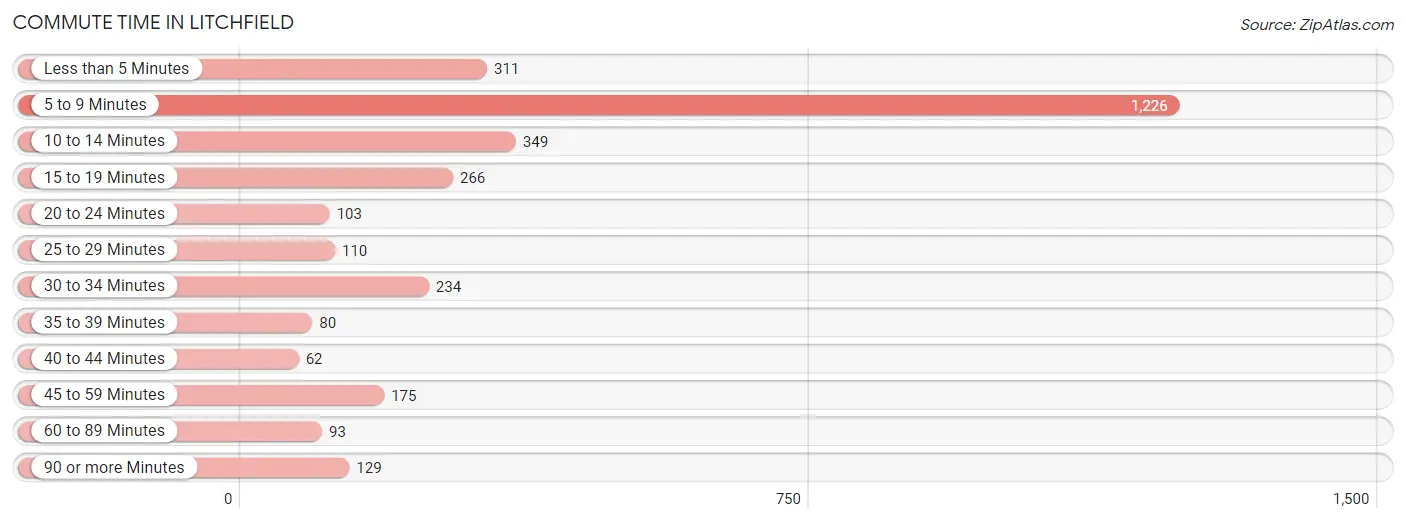
| Commute Time | # Commuters | % Commuters |
| Less than 5 Minutes | 311 | 9.9% |
| 5 to 9 Minutes | 1,226 | 39.1% |
| 10 to 14 Minutes | 349 | 11.1% |
| 15 to 19 Minutes | 266 | 8.5% |
| 20 to 24 Minutes | 103 | 3.3% |
| 25 to 29 Minutes | 110 | 3.5% |
| 30 to 34 Minutes | 234 | 7.5% |
| 35 to 39 Minutes | 80 | 2.5% |
| 40 to 44 Minutes | 62 | 2.0% |
| 45 to 59 Minutes | 175 | 5.6% |
| 60 to 89 Minutes | 93 | 3.0% |
| 90 or more Minutes | 129 | 4.1% |
Commute Time by Sex in Litchfield
The most common commute times in Litchfield are 5 to 9 minutes (570 commuters, 34.2%) for males and 5 to 9 minutes (656 commuters, 44.5%) for females.
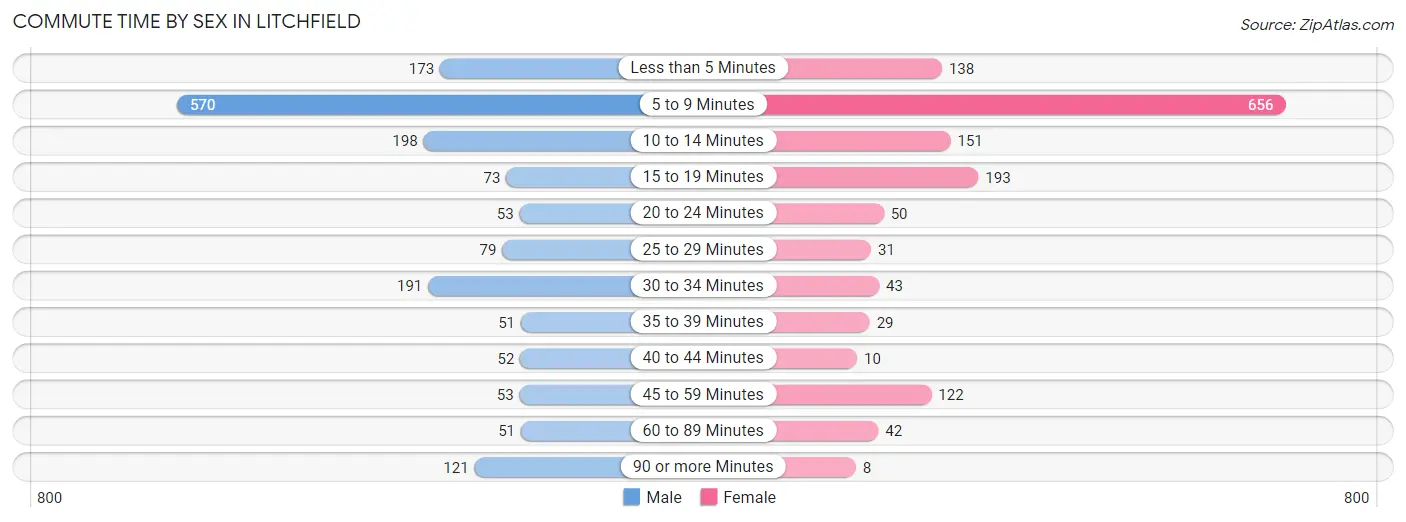
| Commute Time | Male | Female |
| Less than 5 Minutes | 173 (10.4%) | 138 (9.4%) |
| 5 to 9 Minutes | 570 (34.2%) | 656 (44.5%) |
| 10 to 14 Minutes | 198 (11.9%) | 151 (10.2%) |
| 15 to 19 Minutes | 73 (4.4%) | 193 (13.1%) |
| 20 to 24 Minutes | 53 (3.2%) | 50 (3.4%) |
| 25 to 29 Minutes | 79 (4.7%) | 31 (2.1%) |
| 30 to 34 Minutes | 191 (11.5%) | 43 (2.9%) |
| 35 to 39 Minutes | 51 (3.1%) | 29 (2.0%) |
| 40 to 44 Minutes | 52 (3.1%) | 10 (0.7%) |
| 45 to 59 Minutes | 53 (3.2%) | 122 (8.3%) |
| 60 to 89 Minutes | 51 (3.1%) | 42 (2.9%) |
| 90 or more Minutes | 121 (7.3%) | 8 (0.5%) |
Time of Departure to Work by Sex in Litchfield
The most frequent times of departure to work in Litchfield are 5:30 AM to 5:59 AM (335, 20.1%) for males and 7:30 AM to 7:59 AM (346, 23.5%) for females.
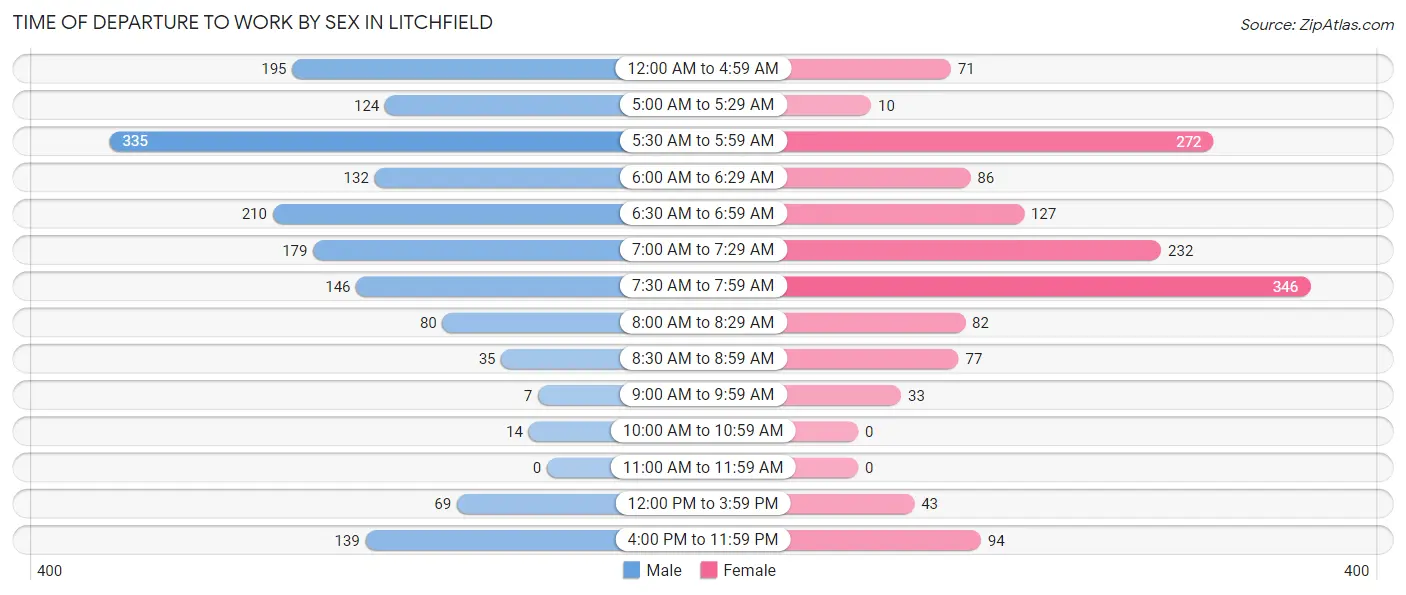
| Time of Departure | Male | Female |
| 12:00 AM to 4:59 AM | 195 (11.7%) | 71 (4.8%) |
| 5:00 AM to 5:29 AM | 124 (7.4%) | 10 (0.7%) |
| 5:30 AM to 5:59 AM | 335 (20.1%) | 272 (18.5%) |
| 6:00 AM to 6:29 AM | 132 (7.9%) | 86 (5.8%) |
| 6:30 AM to 6:59 AM | 210 (12.6%) | 127 (8.6%) |
| 7:00 AM to 7:29 AM | 179 (10.7%) | 232 (15.8%) |
| 7:30 AM to 7:59 AM | 146 (8.8%) | 346 (23.5%) |
| 8:00 AM to 8:29 AM | 80 (4.8%) | 82 (5.6%) |
| 8:30 AM to 8:59 AM | 35 (2.1%) | 77 (5.2%) |
| 9:00 AM to 9:59 AM | 7 (0.4%) | 33 (2.2%) |
| 10:00 AM to 10:59 AM | 14 (0.8%) | 0 (0.0%) |
| 11:00 AM to 11:59 AM | 0 (0.0%) | 0 (0.0%) |
| 12:00 PM to 3:59 PM | 69 (4.1%) | 43 (2.9%) |
| 4:00 PM to 11:59 PM | 139 (8.4%) | 94 (6.4%) |
| Total | 1,665 (100.0%) | 1,473 (100.0%) |
Housing Occupancy in Litchfield
Occupancy by Ownership in Litchfield
Of the total 2,816 dwellings in Litchfield, owner-occupied units account for 2,018 (71.7%), while renter-occupied units make up 798 (28.3%).
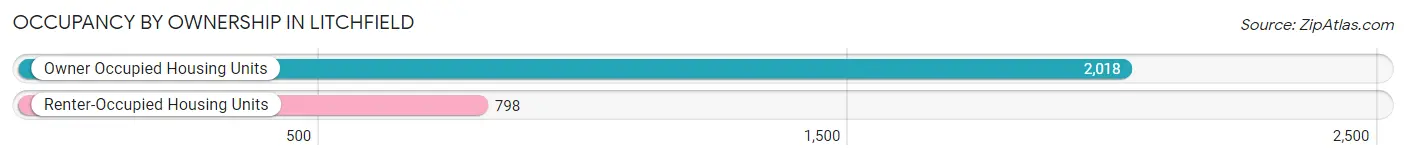
| Occupancy | # Housing Units | % Housing Units |
| Owner Occupied Housing Units | 2,018 | 71.7% |
| Renter-Occupied Housing Units | 798 | 28.3% |
| Total Occupied Housing Units | 2,816 | 100.0% |
Occupancy by Household Size in Litchfield
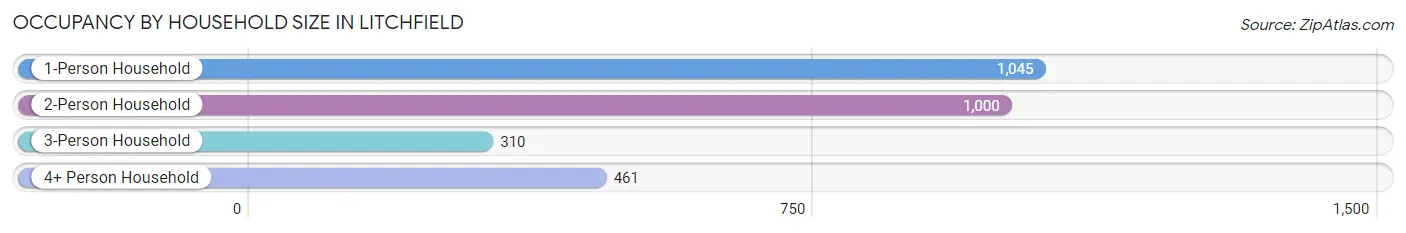
| Household Size | # Housing Units | % Housing Units |
| 1-Person Household | 1,045 | 37.1% |
| 2-Person Household | 1,000 | 35.5% |
| 3-Person Household | 310 | 11.0% |
| 4+ Person Household | 461 | 16.4% |
| Total Housing Units | 2,816 | 100.0% |
Occupancy by Ownership by Household Size in Litchfield

| Household Size | Owner-occupied | Renter-occupied |
| 1-Person Household | 502 (48.0%) | 543 (52.0%) |
| 2-Person Household | 867 (86.7%) | 133 (13.3%) |
| 3-Person Household | 278 (89.7%) | 32 (10.3%) |
| 4+ Person Household | 371 (80.5%) | 90 (19.5%) |
| Total Housing Units | 2,018 (71.7%) | 798 (28.3%) |
Occupancy by Educational Attainment in Litchfield
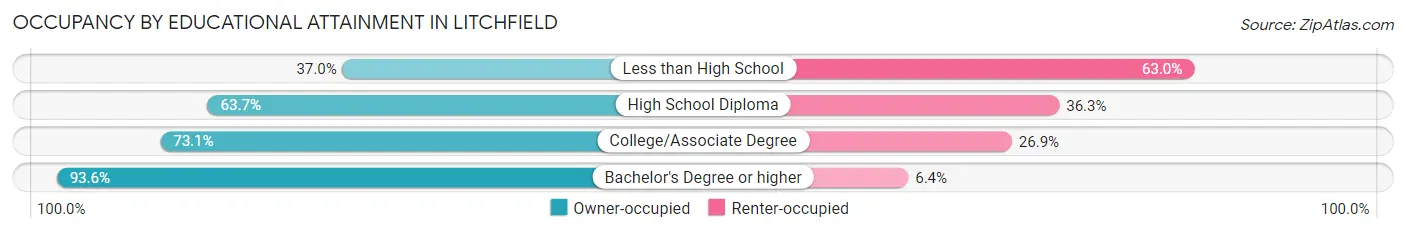
| Household Size | Owner-occupied | Renter-occupied |
| Less than High School | 44 (37.0%) | 75 (63.0%) |
| High School Diploma | 681 (63.7%) | 388 (36.3%) |
| College/Associate Degree | 823 (73.1%) | 303 (26.9%) |
| Bachelor's Degree or higher | 470 (93.6%) | 32 (6.4%) |
Occupancy by Age of Householder in Litchfield
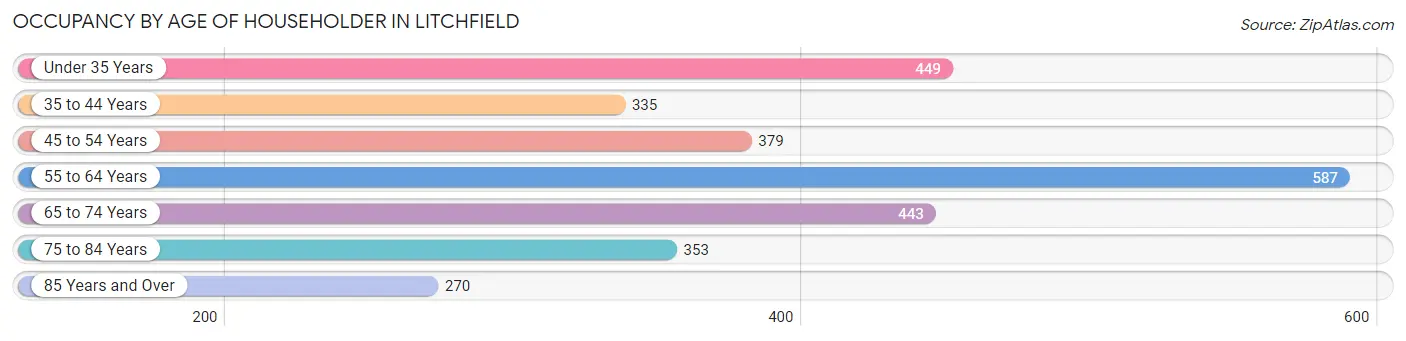
| Age Bracket | # Households | % Households |
| Under 35 Years | 449 | 15.9% |
| 35 to 44 Years | 335 | 11.9% |
| 45 to 54 Years | 379 | 13.5% |
| 55 to 64 Years | 587 | 20.8% |
| 65 to 74 Years | 443 | 15.7% |
| 75 to 84 Years | 353 | 12.5% |
| 85 Years and Over | 270 | 9.6% |
| Total | 2,816 | 100.0% |
Housing Finances in Litchfield
Median Income by Occupancy in Litchfield
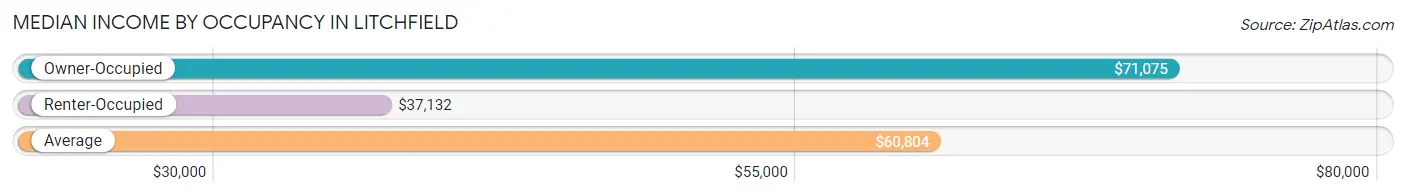
| Occupancy Type | # Households | Median Income |
| Owner-Occupied | 2,018 (71.7%) | $71,075 |
| Renter-Occupied | 798 (28.3%) | $37,132 |
| Average | 2,816 (100.0%) | $60,804 |
Occupancy by Householder Income Bracket in Litchfield
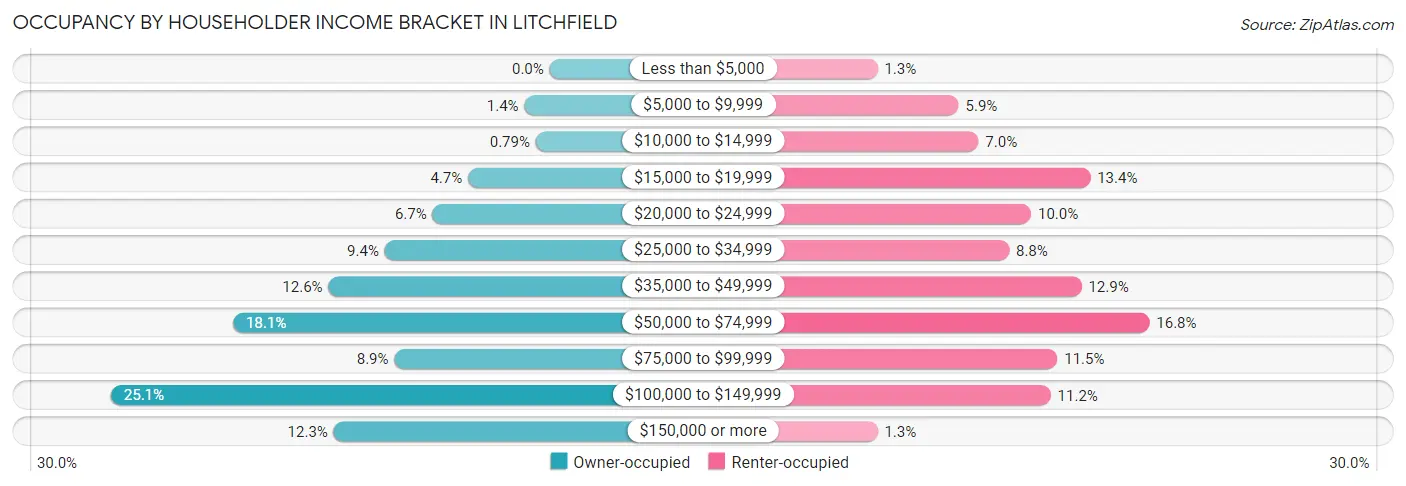
| Income Bracket | Owner-occupied | Renter-occupied |
| Less than $5,000 | 0 (0.0%) | 10 (1.3%) |
| $5,000 to $9,999 | 29 (1.4%) | 47 (5.9%) |
| $10,000 to $14,999 | 16 (0.8%) | 56 (7.0%) |
| $15,000 to $19,999 | 94 (4.7%) | 107 (13.4%) |
| $20,000 to $24,999 | 135 (6.7%) | 80 (10.0%) |
| $25,000 to $34,999 | 190 (9.4%) | 70 (8.8%) |
| $35,000 to $49,999 | 255 (12.6%) | 103 (12.9%) |
| $50,000 to $74,999 | 365 (18.1%) | 134 (16.8%) |
| $75,000 to $99,999 | 179 (8.9%) | 92 (11.5%) |
| $100,000 to $149,999 | 506 (25.1%) | 89 (11.2%) |
| $150,000 or more | 249 (12.3%) | 10 (1.3%) |
| Total | 2,018 (100.0%) | 798 (100.0%) |
Monthly Housing Cost Tiers in Litchfield
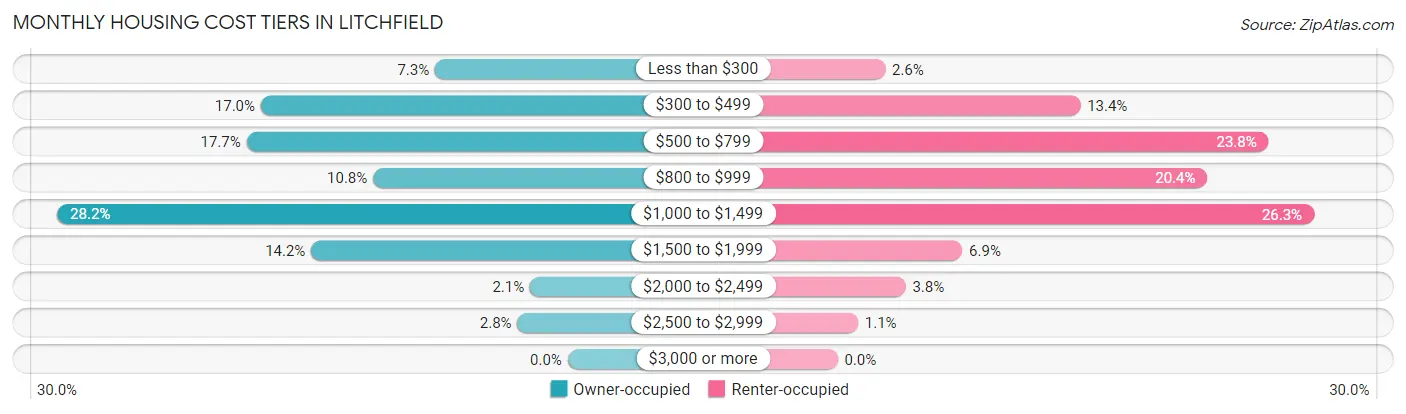
| Monthly Cost | Owner-occupied | Renter-occupied |
| Less than $300 | 148 (7.3%) | 21 (2.6%) |
| $300 to $499 | 342 (17.0%) | 107 (13.4%) |
| $500 to $799 | 358 (17.7%) | 190 (23.8%) |
| $800 to $999 | 217 (10.7%) | 163 (20.4%) |
| $1,000 to $1,499 | 569 (28.2%) | 210 (26.3%) |
| $1,500 to $1,999 | 286 (14.2%) | 55 (6.9%) |
| $2,000 to $2,499 | 42 (2.1%) | 30 (3.8%) |
| $2,500 to $2,999 | 56 (2.8%) | 9 (1.1%) |
| $3,000 or more | 0 (0.0%) | 0 (0.0%) |
| Total | 2,018 (100.0%) | 798 (100.0%) |
Physical Housing Characteristics in Litchfield
Housing Structures in Litchfield
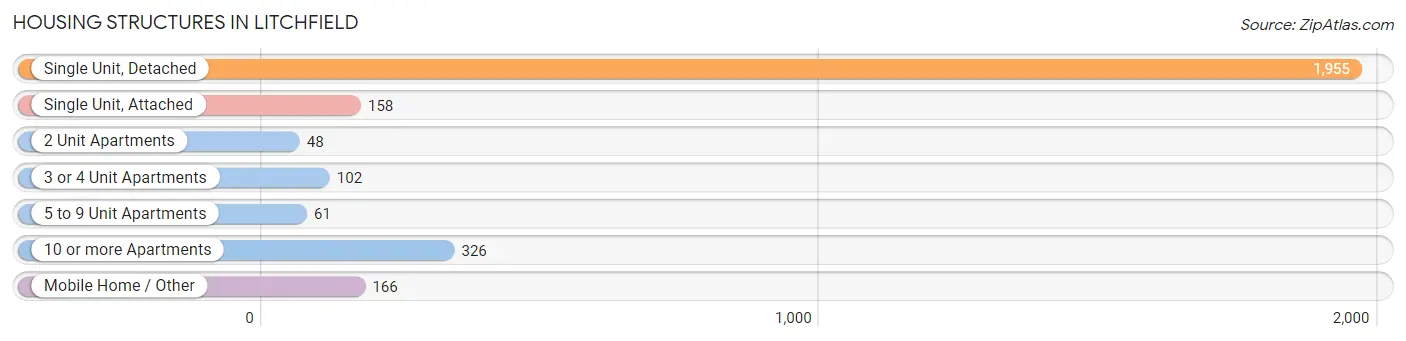
| Structure Type | # Housing Units | % Housing Units |
| Single Unit, Detached | 1,955 | 69.4% |
| Single Unit, Attached | 158 | 5.6% |
| 2 Unit Apartments | 48 | 1.7% |
| 3 or 4 Unit Apartments | 102 | 3.6% |
| 5 to 9 Unit Apartments | 61 | 2.2% |
| 10 or more Apartments | 326 | 11.6% |
| Mobile Home / Other | 166 | 5.9% |
| Total | 2,816 | 100.0% |
Housing Structures by Occupancy in Litchfield
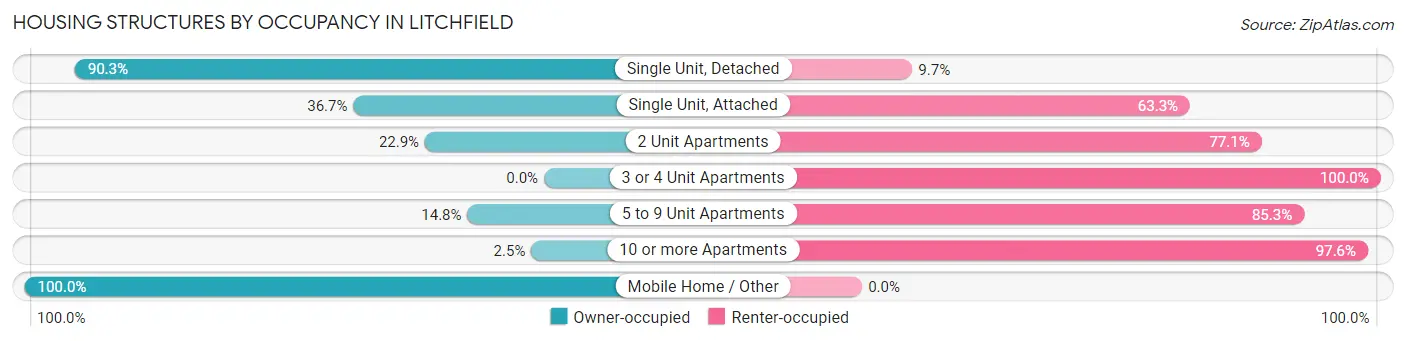
| Structure Type | Owner-occupied | Renter-occupied |
| Single Unit, Detached | 1,766 (90.3%) | 189 (9.7%) |
| Single Unit, Attached | 58 (36.7%) | 100 (63.3%) |
| 2 Unit Apartments | 11 (22.9%) | 37 (77.1%) |
| 3 or 4 Unit Apartments | 0 (0.0%) | 102 (100.0%) |
| 5 to 9 Unit Apartments | 9 (14.7%) | 52 (85.3%) |
| 10 or more Apartments | 8 (2.5%) | 318 (97.6%) |
| Mobile Home / Other | 166 (100.0%) | 0 (0.0%) |
| Total | 2,018 (71.7%) | 798 (28.3%) |
Housing Structures by Number of Rooms in Litchfield
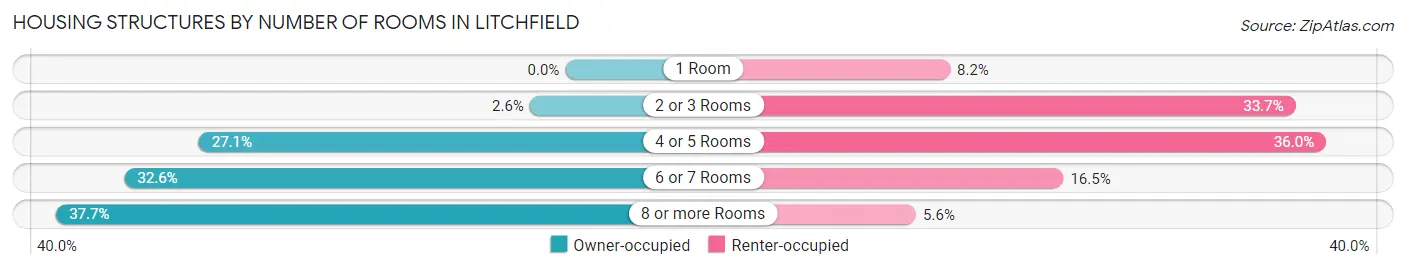
| Number of Rooms | Owner-occupied | Renter-occupied |
| 1 Room | 0 (0.0%) | 65 (8.2%) |
| 2 or 3 Rooms | 53 (2.6%) | 269 (33.7%) |
| 4 or 5 Rooms | 547 (27.1%) | 287 (36.0%) |
| 6 or 7 Rooms | 658 (32.6%) | 132 (16.5%) |
| 8 or more Rooms | 760 (37.7%) | 45 (5.6%) |
| Total | 2,018 (100.0%) | 798 (100.0%) |
Housing Structure by Heating Type in Litchfield
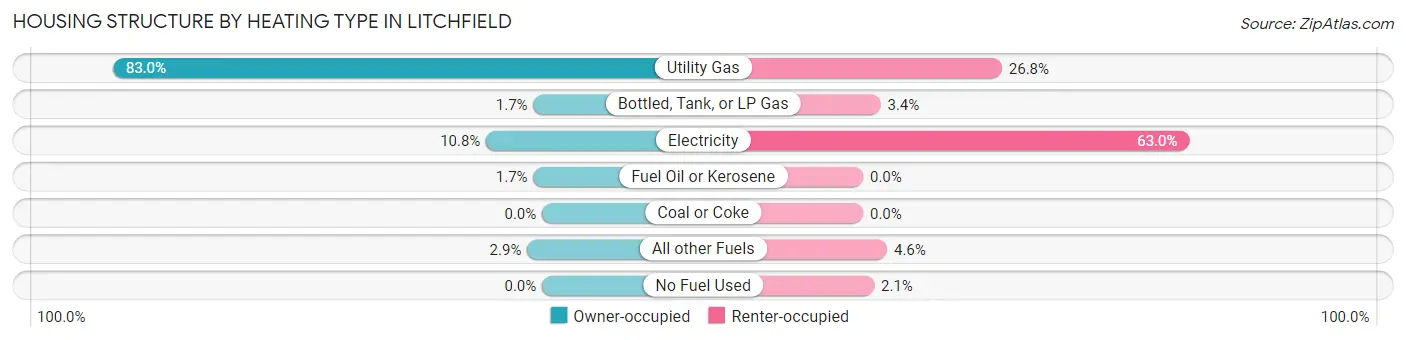
| Heating Type | Owner-occupied | Renter-occupied |
| Utility Gas | 1,674 (83.0%) | 214 (26.8%) |
| Bottled, Tank, or LP Gas | 34 (1.7%) | 27 (3.4%) |
| Electricity | 218 (10.8%) | 503 (63.0%) |
| Fuel Oil or Kerosene | 34 (1.7%) | 0 (0.0%) |
| Coal or Coke | 0 (0.0%) | 0 (0.0%) |
| All other Fuels | 58 (2.9%) | 37 (4.6%) |
| No Fuel Used | 0 (0.0%) | 17 (2.1%) |
| Total | 2,018 (100.0%) | 798 (100.0%) |
Household Vehicle Usage in Litchfield
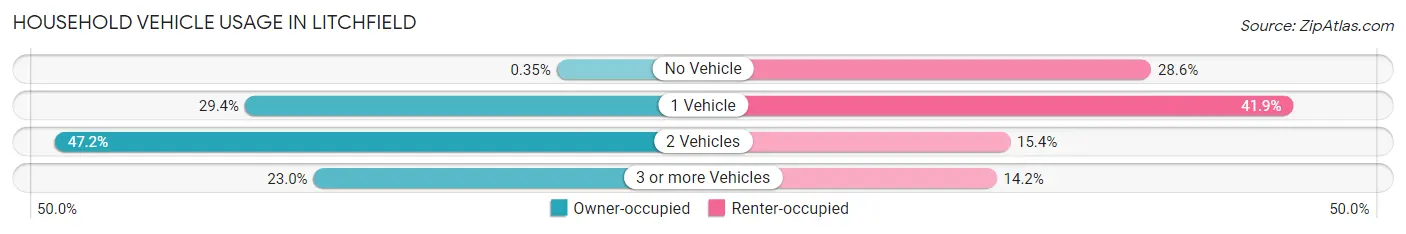
| Vehicles per Household | Owner-occupied | Renter-occupied |
| No Vehicle | 7 (0.4%) | 228 (28.6%) |
| 1 Vehicle | 594 (29.4%) | 334 (41.8%) |
| 2 Vehicles | 952 (47.2%) | 123 (15.4%) |
| 3 or more Vehicles | 465 (23.0%) | 113 (14.2%) |
| Total | 2,018 (100.0%) | 798 (100.0%) |
Real Estate & Mortgages in Litchfield
Real Estate and Mortgage Overview in Litchfield
| Characteristic | Without Mortgage | With Mortgage |
| Housing Units | 822 | 1,196 |
| Median Property Value | $170,500 | $168,900 |
| Median Household Income | $45,577 | $161 |
| Monthly Housing Costs | $475 | $0 |
| Real Estate Taxes | $1,772 | $12 |
Property Value by Mortgage Status in Litchfield
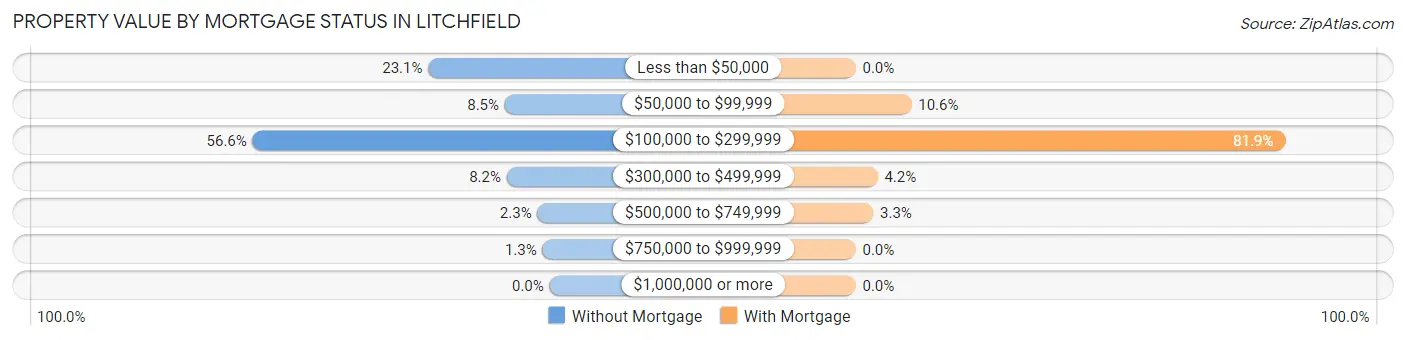
| Property Value | Without Mortgage | With Mortgage |
| Less than $50,000 | 190 (23.1%) | 0 (0.0%) |
| $50,000 to $99,999 | 70 (8.5%) | 127 (10.6%) |
| $100,000 to $299,999 | 465 (56.6%) | 979 (81.9%) |
| $300,000 to $499,999 | 67 (8.2%) | 50 (4.2%) |
| $500,000 to $749,999 | 19 (2.3%) | 40 (3.3%) |
| $750,000 to $999,999 | 11 (1.3%) | 0 (0.0%) |
| $1,000,000 or more | 0 (0.0%) | 0 (0.0%) |
| Total | 822 (100.0%) | 1,196 (100.0%) |
Household Income by Mortgage Status in Litchfield
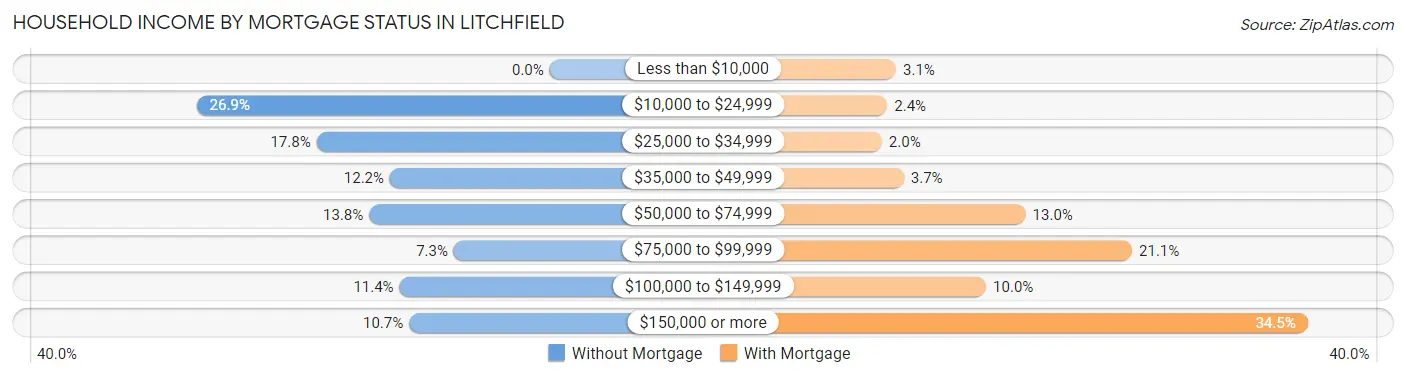
| Household Income | Without Mortgage | With Mortgage |
| Less than $10,000 | 0 (0.0%) | 37 (3.1%) |
| $10,000 to $24,999 | 221 (26.9%) | 29 (2.4%) |
| $25,000 to $34,999 | 146 (17.8%) | 24 (2.0%) |
| $35,000 to $49,999 | 100 (12.2%) | 44 (3.7%) |
| $50,000 to $74,999 | 113 (13.8%) | 155 (13.0%) |
| $75,000 to $99,999 | 60 (7.3%) | 252 (21.1%) |
| $100,000 to $149,999 | 94 (11.4%) | 119 (10.0%) |
| $150,000 or more | 88 (10.7%) | 412 (34.4%) |
| Total | 822 (100.0%) | 1,196 (100.0%) |
Property Value to Household Income Ratio in Litchfield
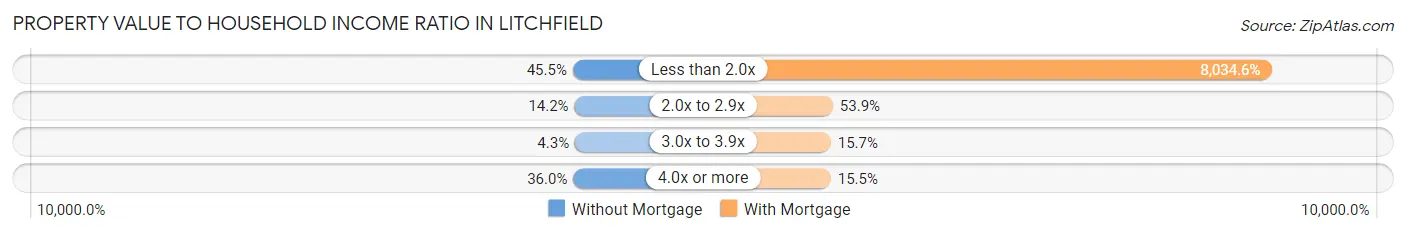
| Value-to-Income Ratio | Without Mortgage | With Mortgage |
| Less than 2.0x | 374 (45.5%) | 96,094 (8,034.6%) |
| 2.0x to 2.9x | 117 (14.2%) | 645 (53.9%) |
| 3.0x to 3.9x | 35 (4.3%) | 188 (15.7%) |
| 4.0x or more | 296 (36.0%) | 185 (15.5%) |
| Total | 822 (100.0%) | 1,196 (100.0%) |
Real Estate Taxes by Mortgage Status in Litchfield
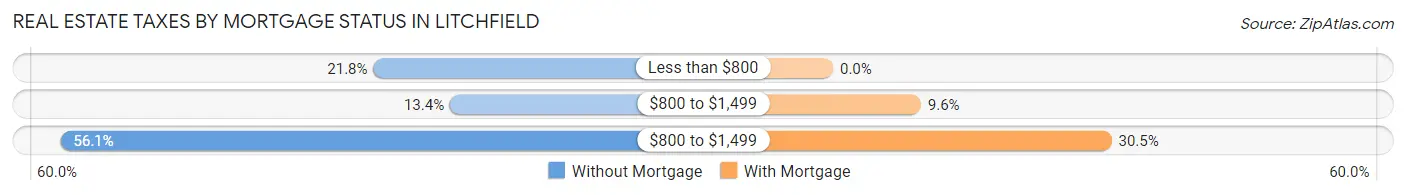
| Property Taxes | Without Mortgage | With Mortgage |
| Less than $800 | 179 (21.8%) | 0 (0.0%) |
| $800 to $1,499 | 110 (13.4%) | 115 (9.6%) |
| $800 to $1,499 | 461 (56.1%) | 365 (30.5%) |
| Total | 822 (100.0%) | 1,196 (100.0%) |
Health & Disability in Litchfield
Health Insurance Coverage by Age in Litchfield
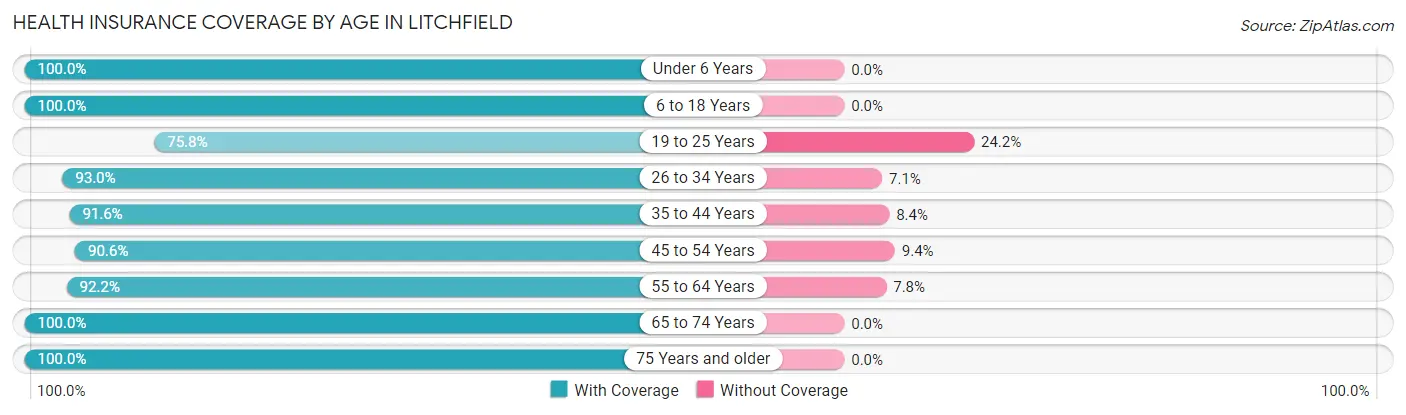
| Age Bracket | With Coverage | Without Coverage |
| Under 6 Years | 415 (100.0%) | 0 (0.0%) |
| 6 to 18 Years | 951 (100.0%) | 0 (0.0%) |
| 19 to 25 Years | 467 (75.8%) | 149 (24.2%) |
| 26 to 34 Years | 514 (92.9%) | 39 (7.0%) |
| 35 to 44 Years | 624 (91.6%) | 57 (8.4%) |
| 45 to 54 Years | 596 (90.6%) | 62 (9.4%) |
| 55 to 64 Years | 989 (92.2%) | 84 (7.8%) |
| 65 to 74 Years | 656 (100.0%) | 0 (0.0%) |
| 75 Years and older | 842 (100.0%) | 0 (0.0%) |
| Total | 6,054 (93.9%) | 391 (6.1%) |
Health Insurance Coverage by Citizenship Status in Litchfield
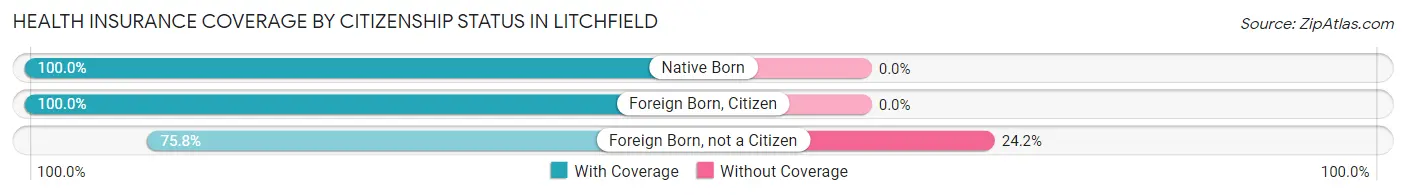
| Citizenship Status | With Coverage | Without Coverage |
| Native Born | 415 (100.0%) | 0 (0.0%) |
| Foreign Born, Citizen | 951 (100.0%) | 0 (0.0%) |
| Foreign Born, not a Citizen | 467 (75.8%) | 149 (24.2%) |
Health Insurance Coverage by Household Income in Litchfield
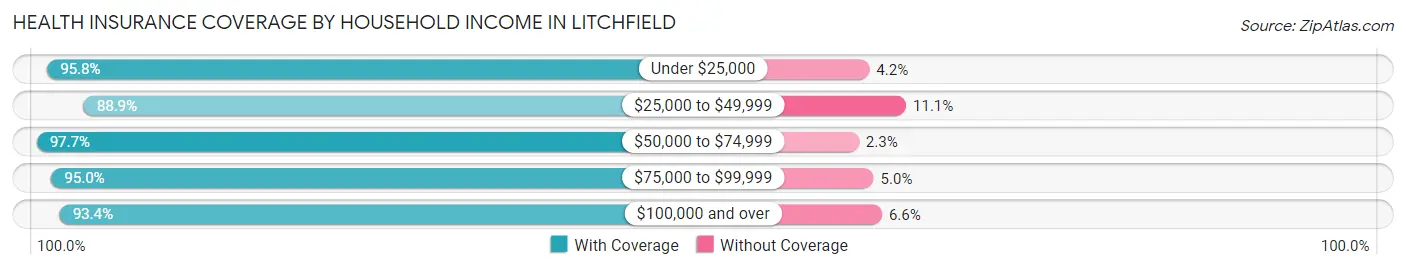
| Household Income | With Coverage | Without Coverage |
| Under $25,000 | 655 (95.8%) | 29 (4.2%) |
| $25,000 to $49,999 | 944 (88.9%) | 118 (11.1%) |
| $50,000 to $74,999 | 1,033 (97.7%) | 24 (2.3%) |
| $75,000 to $99,999 | 869 (95.0%) | 46 (5.0%) |
| $100,000 and over | 2,465 (93.4%) | 174 (6.6%) |
Public vs Private Health Insurance Coverage by Age in Litchfield
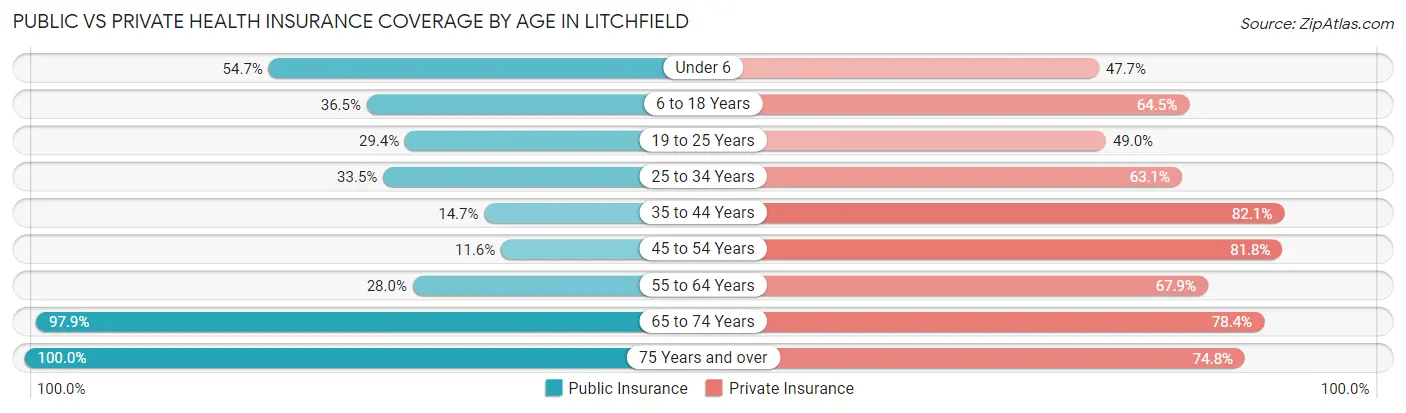
| Age Bracket | Public Insurance | Private Insurance |
| Under 6 | 227 (54.7%) | 198 (47.7%) |
| 6 to 18 Years | 347 (36.5%) | 613 (64.5%) |
| 19 to 25 Years | 181 (29.4%) | 302 (49.0%) |
| 25 to 34 Years | 185 (33.5%) | 349 (63.1%) |
| 35 to 44 Years | 100 (14.7%) | 559 (82.1%) |
| 45 to 54 Years | 76 (11.6%) | 538 (81.8%) |
| 55 to 64 Years | 300 (28.0%) | 729 (67.9%) |
| 65 to 74 Years | 642 (97.9%) | 514 (78.3%) |
| 75 Years and over | 842 (100.0%) | 630 (74.8%) |
| Total | 2,900 (45.0%) | 4,432 (68.8%) |
Disability Status by Sex by Age in Litchfield
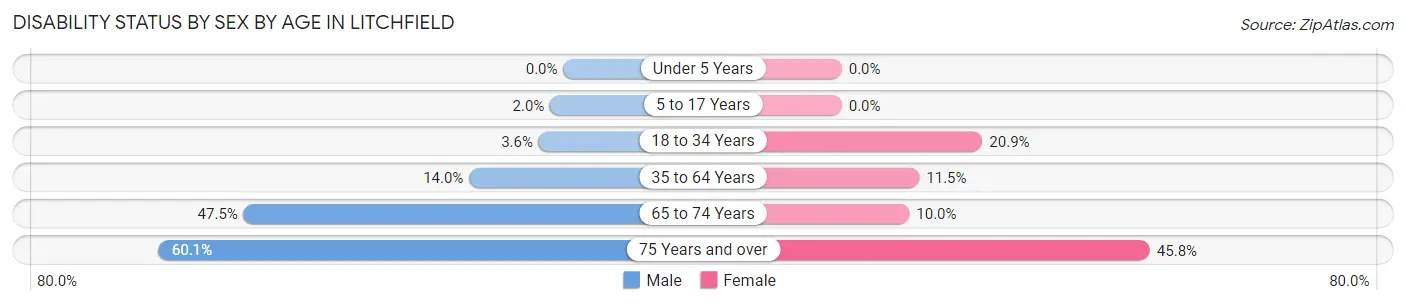
| Age Bracket | Male | Female |
| Under 5 Years | 0 (0.0%) | 0 (0.0%) |
| 5 to 17 Years | 9 (2.0%) | 0 (0.0%) |
| 18 to 34 Years | 23 (3.6%) | 128 (20.9%) |
| 35 to 64 Years | 177 (14.0%) | 132 (11.5%) |
| 65 to 74 Years | 122 (47.5%) | 40 (10.0%) |
| 75 Years and over | 209 (60.1%) | 226 (45.8%) |
Disability Class by Sex by Age in Litchfield
Disability Class: Hearing Difficulty
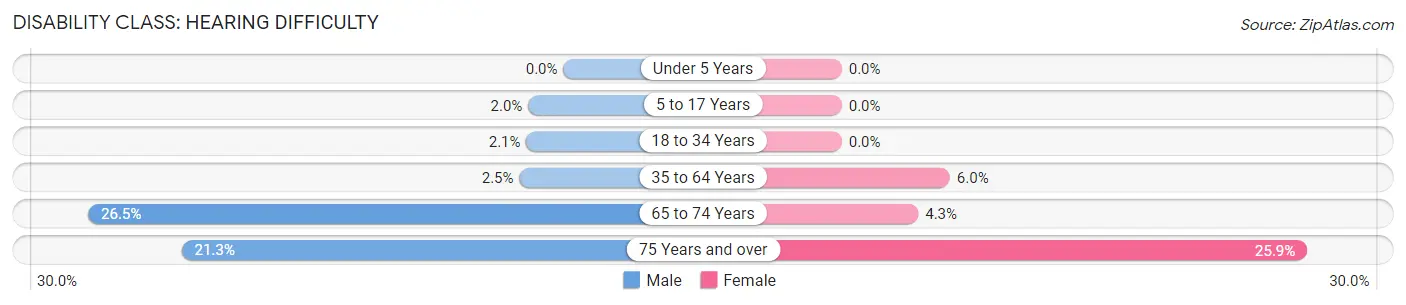
| Age Bracket | Male | Female |
| Under 5 Years | 0 (0.0%) | 0 (0.0%) |
| 5 to 17 Years | 9 (2.0%) | 0 (0.0%) |
| 18 to 34 Years | 13 (2.1%) | 0 (0.0%) |
| 35 to 64 Years | 31 (2.5%) | 69 (6.0%) |
| 65 to 74 Years | 68 (26.5%) | 17 (4.3%) |
| 75 Years and over | 74 (21.3%) | 128 (25.9%) |
Disability Class: Vision Difficulty
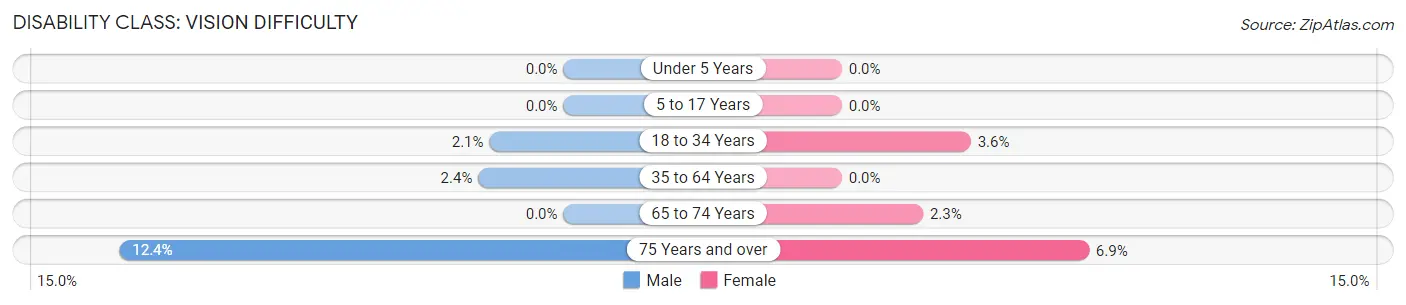
| Age Bracket | Male | Female |
| Under 5 Years | 0 (0.0%) | 0 (0.0%) |
| 5 to 17 Years | 0 (0.0%) | 0 (0.0%) |
| 18 to 34 Years | 13 (2.1%) | 22 (3.6%) |
| 35 to 64 Years | 30 (2.4%) | 0 (0.0%) |
| 65 to 74 Years | 0 (0.0%) | 9 (2.3%) |
| 75 Years and over | 43 (12.4%) | 34 (6.9%) |
Disability Class: Cognitive Difficulty
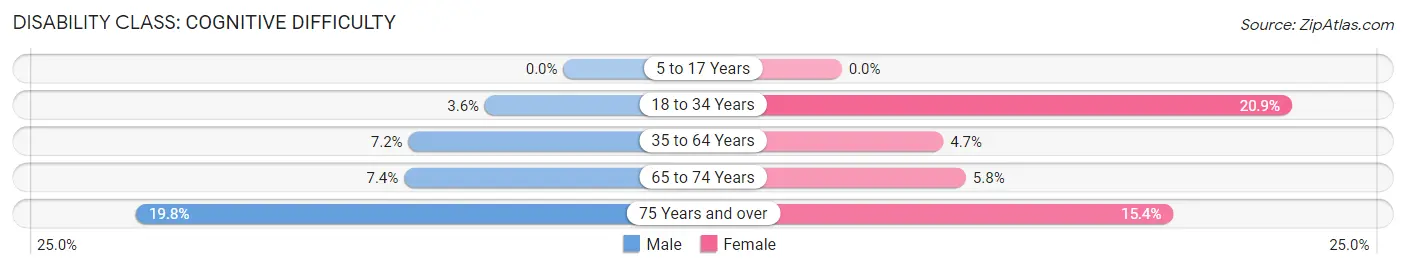
| Age Bracket | Male | Female |
| 5 to 17 Years | 0 (0.0%) | 0 (0.0%) |
| 18 to 34 Years | 23 (3.6%) | 128 (20.9%) |
| 35 to 64 Years | 91 (7.2%) | 54 (4.7%) |
| 65 to 74 Years | 19 (7.4%) | 23 (5.8%) |
| 75 Years and over | 69 (19.8%) | 76 (15.4%) |
Disability Class: Ambulatory Difficulty
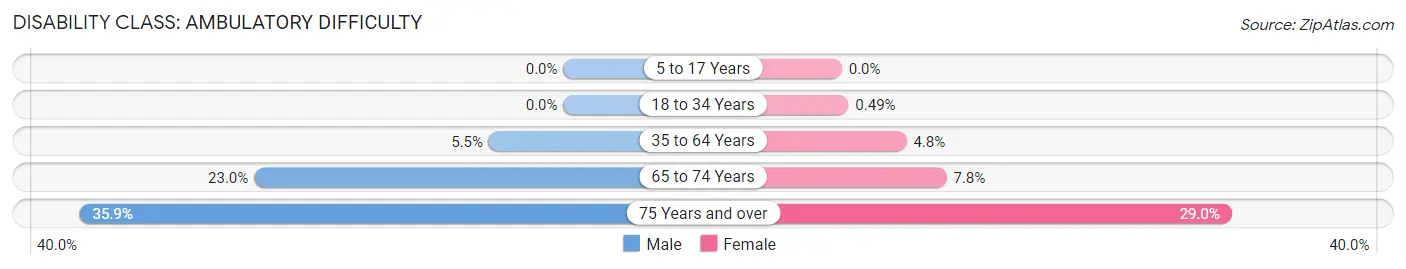
| Age Bracket | Male | Female |
| 5 to 17 Years | 0 (0.0%) | 0 (0.0%) |
| 18 to 34 Years | 0 (0.0%) | 3 (0.5%) |
| 35 to 64 Years | 70 (5.5%) | 55 (4.8%) |
| 65 to 74 Years | 59 (23.0%) | 31 (7.8%) |
| 75 Years and over | 125 (35.9%) | 143 (28.9%) |
Disability Class: Self-Care Difficulty
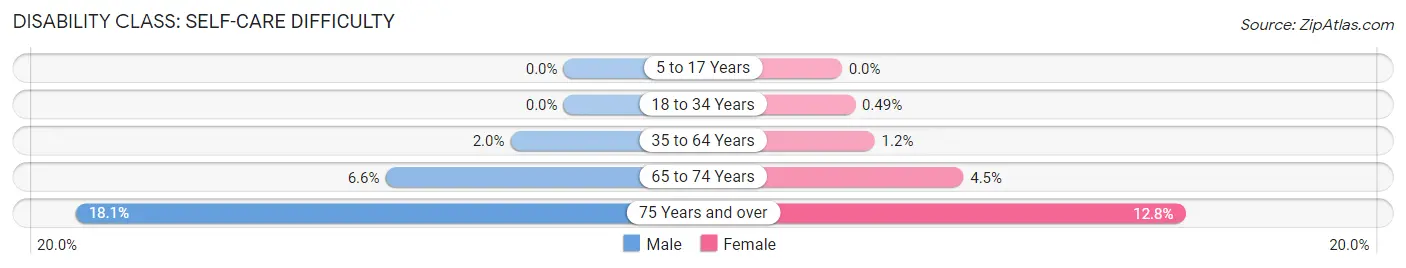
| Age Bracket | Male | Female |
| 5 to 17 Years | 0 (0.0%) | 0 (0.0%) |
| 18 to 34 Years | 0 (0.0%) | 3 (0.5%) |
| 35 to 64 Years | 25 (2.0%) | 14 (1.2%) |
| 65 to 74 Years | 17 (6.6%) | 18 (4.5%) |
| 75 Years and over | 63 (18.1%) | 63 (12.8%) |
Technology Access in Litchfield
Computing Device Access in Litchfield
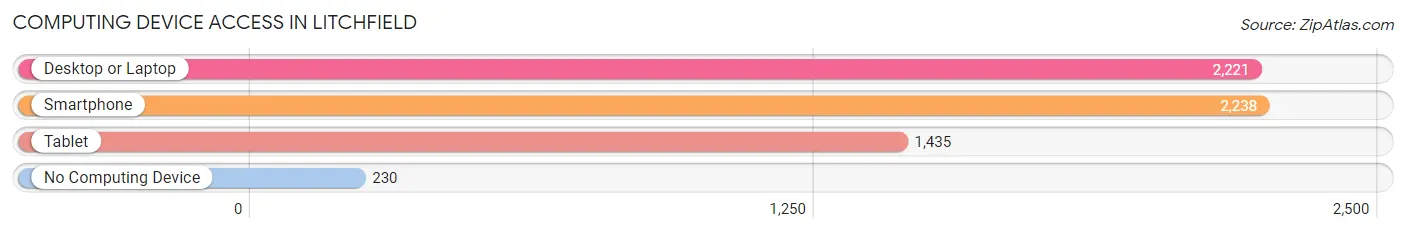
| Device Type | # Households | % Households |
| Desktop or Laptop | 2,221 | 78.9% |
| Smartphone | 2,238 | 79.5% |
| Tablet | 1,435 | 51.0% |
| No Computing Device | 230 | 8.2% |
| Total | 2,816 | 100.0% |
Internet Access in Litchfield
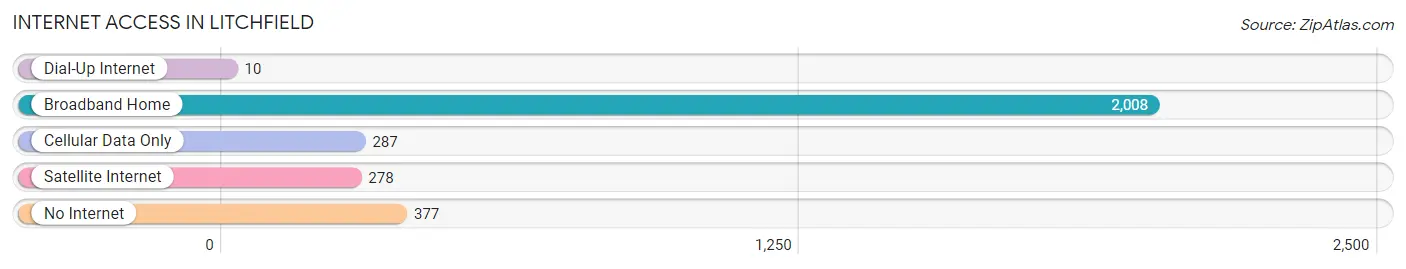
| Internet Type | # Households | % Households |
| Dial-Up Internet | 10 | 0.4% |
| Broadband Home | 2,008 | 71.3% |
| Cellular Data Only | 287 | 10.2% |
| Satellite Internet | 278 | 9.9% |
| No Internet | 377 | 13.4% |
| Total | 2,816 | 100.0% |
Litchfield Summary
Litchfield, Minnesota is a small city located in Meeker County, Minnesota. It is situated in the central part of the state, approximately 70 miles northwest of Minneapolis. The city has a population of approximately 8,000 people and is the county seat of Meeker County.
History
The area that is now Litchfield was first settled in 1856 by a group of settlers from New York. The settlers named the area after their hometown of Litchfield, Connecticut. The city was officially incorporated in 1872.
In the late 19th century, Litchfield was a thriving agricultural community. The city was home to several grain elevators, a creamery, and a flour mill. The city also had a number of businesses, including a hotel, a bank, and a newspaper.
In the early 20th century, Litchfield experienced a period of growth and development. The city was home to several manufacturing companies, including a furniture factory, a canning factory, and a shoe factory. The city also had a number of retail stores, including a department store, a hardware store, and a drug store.
Geography
Litchfield is located in the central part of Minnesota, approximately 70 miles northwest of Minneapolis. The city is situated in Meeker County, which is part of the Central Minnesota region. The city is located on the banks of the Crow River, which flows through the city.
The city has a total area of 4.2 square miles, all of which is land. The city has a humid continental climate, with cold winters and warm summers. The average annual temperature is 43 degrees Fahrenheit.
Economy
The economy of Litchfield is largely based on agriculture and manufacturing. The city is home to several grain elevators, a creamery, and a flour mill. The city also has a number of manufacturing companies, including a furniture factory, a canning factory, and a shoe factory.
The city also has a number of retail stores, including a department store, a hardware store, and a drug store. The city is also home to several medical facilities, including a hospital and a clinic.
Demographics
As of the 2010 census, the population of Litchfield was 8,000. The racial makeup of the city was 95.3% White, 0.7% African American, 0.3% Native American, 0.7% Asian, 0.1% Pacific Islander, and 2.8% from other races. The median household income was $45,000.
The city has a large number of churches, including Catholic, Lutheran, Methodist, and Baptist. The city also has a number of parks, including a city park, a county park, and a state park. The city is also home to a number of schools, including a public high school, a public middle school, and a public elementary school.
Common Questions
What is Per Capita Income in Litchfield?
Per Capita income in Litchfield is $39,099.
What is the Median Family Income in Litchfield?
Median Family Income in Litchfield is $82,436.
What is the Median Household income in Litchfield?
Median Household Income in Litchfield is $60,804.
What is Income or Wage Gap in Litchfield?
Income or Wage Gap in Litchfield is 32.9%.
Women in Litchfield earn 67.1 cents for every dollar earned by a man.
What is Inequality or Gini Index in Litchfield?
Inequality or Gini Index in Litchfield is 0.48.
What is the Total Population of Litchfield?
Total Population of Litchfield is 6,598.
What is the Total Male Population of Litchfield?
Total Male Population of Litchfield is 3,351.
What is the Total Female Population of Litchfield?
Total Female Population of Litchfield is 3,247.
What is the Ratio of Males per 100 Females in Litchfield?
There are 103.20 Males per 100 Females in Litchfield.
What is the Ratio of Females per 100 Males in Litchfield?
There are 96.90 Females per 100 Males in Litchfield.
What is the Median Population Age in Litchfield?
Median Population Age in Litchfield is 45.3 Years.
What is the Average Family Size in Litchfield
Average Family Size in Litchfield is 2.9 People.
What is the Average Household Size in Litchfield
Average Household Size in Litchfield is 2.3 People.
How Large is the Labor Force in Litchfield?
There are 3,358 People in the Labor Forcein in Litchfield.
What is the Percentage of People in the Labor Force in Litchfield?
61.9% of People are in the Labor Force in Litchfield.
What is the Unemployment Rate in Litchfield?
Unemployment Rate in Litchfield is 2.0%.