Lancaster, MN
Lancaster Map
Lancaster Overview
353
TOTAL POPULATION
188
MALE POPULATION
165
FEMALE POPULATION
113.94
MALES / 100 FEMALES
87.77
FEMALES / 100 MALES
42.5
MEDIAN AGE
2.8
AVG FAMILY SIZE
2.3
AVG HOUSEHOLD SIZE
$31,535
PER CAPITA INCOME
$85,833
AVG FAMILY INCOME
$58,750
AVG HOUSEHOLD INCOME
23.7%
WAGE / INCOME GAP [ % ]
76.2¢/ $1
WAGE / INCOME GAP [ $ ]
0.30
INEQUALITY / GINI INDEX
165
LABOR FORCE [ PEOPLE ]
62.3%
PERCENT IN LABOR FORCE
1.2%
UNEMPLOYMENT RATE
Lancaster Zip Codes
Lancaster Area Codes
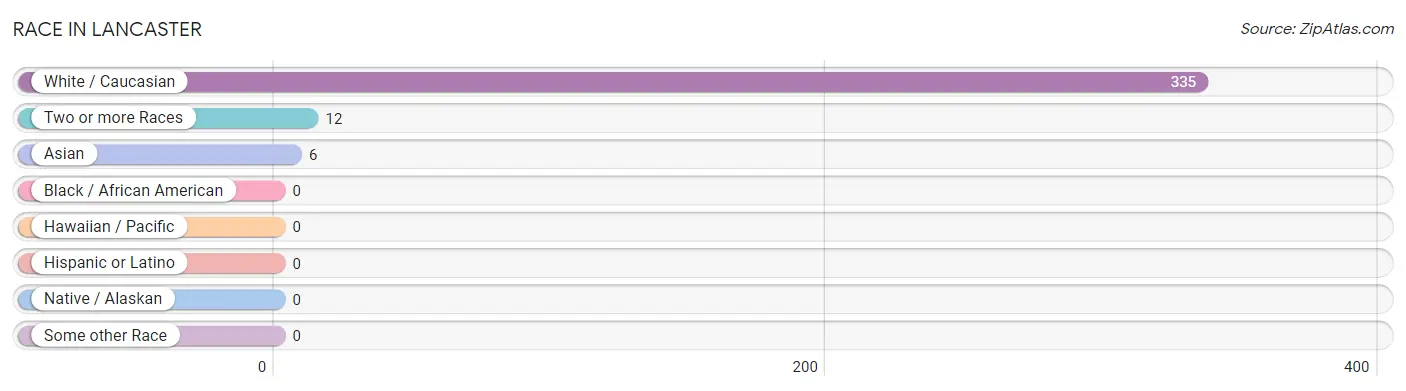
Race in Lancaster
The most populous races in Lancaster are White / Caucasian (335 | 94.9%), Two or more Races (12 | 3.4%), and Asian (6 | 1.7%).
| Race | # Population | % Population |
| Asian | 6 | 1.7% |
| Black / African American | 0 | 0.0% |
| Hawaiian / Pacific | 0 | 0.0% |
| Hispanic or Latino | 0 | 0.0% |
| Native / Alaskan | 0 | 0.0% |
| White / Caucasian | 335 | 94.9% |
| Two or more Races | 12 | 3.4% |
| Some other Race | 0 | 0.0% |
| Total | 353 | 100.0% |
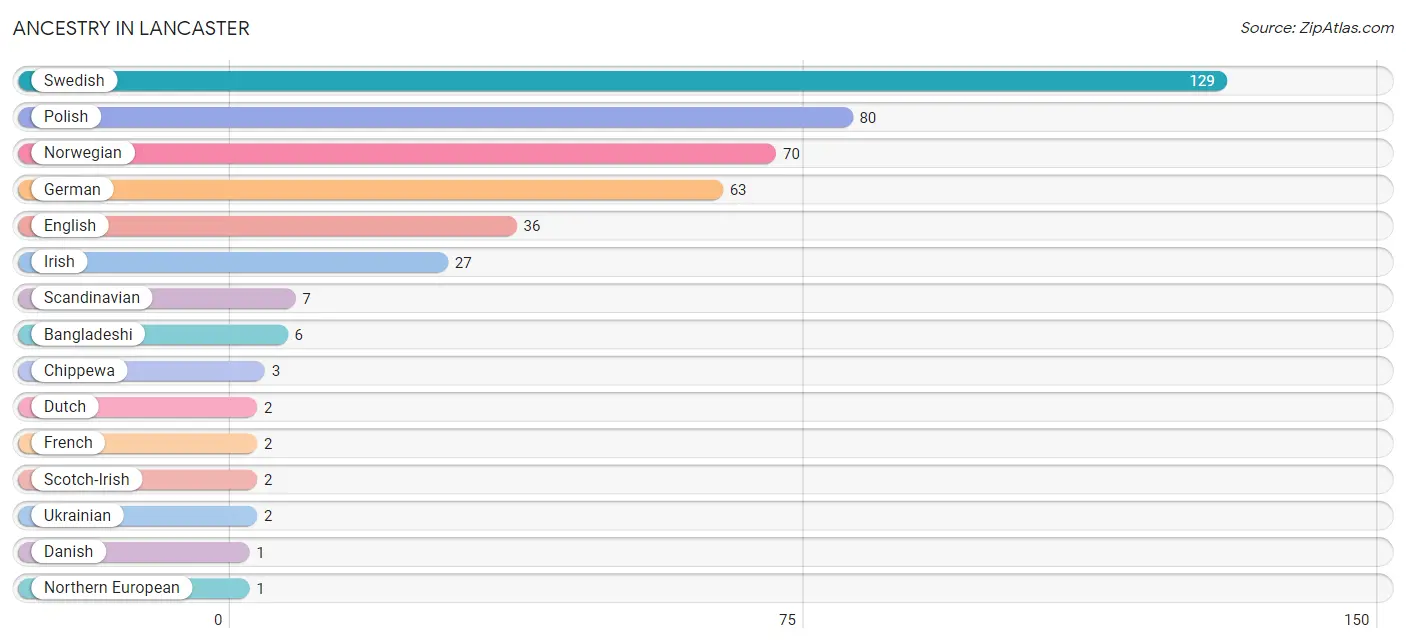
Ancestry in Lancaster
The most populous ancestries reported in Lancaster are Swedish (129 | 36.5%), Polish (80 | 22.7%), Norwegian (70 | 19.8%), German (63 | 17.8%), and English (36 | 10.2%), together accounting for 107.1% of all Lancaster residents.
| Ancestry | # Population | % Population |
| Bangladeshi | 6 | 1.7% |
| Chippewa | 3 | 0.9% |
| Danish | 1 | 0.3% |
| Dutch | 2 | 0.6% |
| English | 36 | 10.2% |
| French | 2 | 0.6% |
| German | 63 | 17.8% |
| Irish | 27 | 7.6% |
| Northern European | 1 | 0.3% |
| Norwegian | 70 | 19.8% |
| Polish | 80 | 22.7% |
| Scandinavian | 7 | 2.0% |
| Scotch-Irish | 2 | 0.6% |
| Swedish | 129 | 36.5% |
| Ukrainian | 2 | 0.6% | View All 15 Rows |
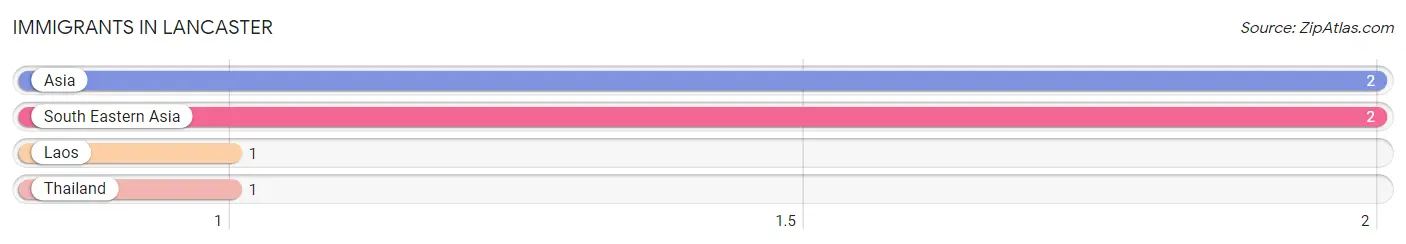
Immigrants in Lancaster
The most numerous immigrant groups reported in Lancaster came from Asia (2 | 0.6%), South Eastern Asia (2 | 0.6%), Laos (1 | 0.3%), and Thailand (1 | 0.3%), together accounting for 1.7% of all Lancaster residents.
| Immigration Origin | # Population | % Population |
| Asia | 2 | 0.6% |
| Laos | 1 | 0.3% |
| South Eastern Asia | 2 | 0.6% |
| Thailand | 1 | 0.3% | View All 4 Rows |
Sex and Age in Lancaster
Sex and Age in Lancaster
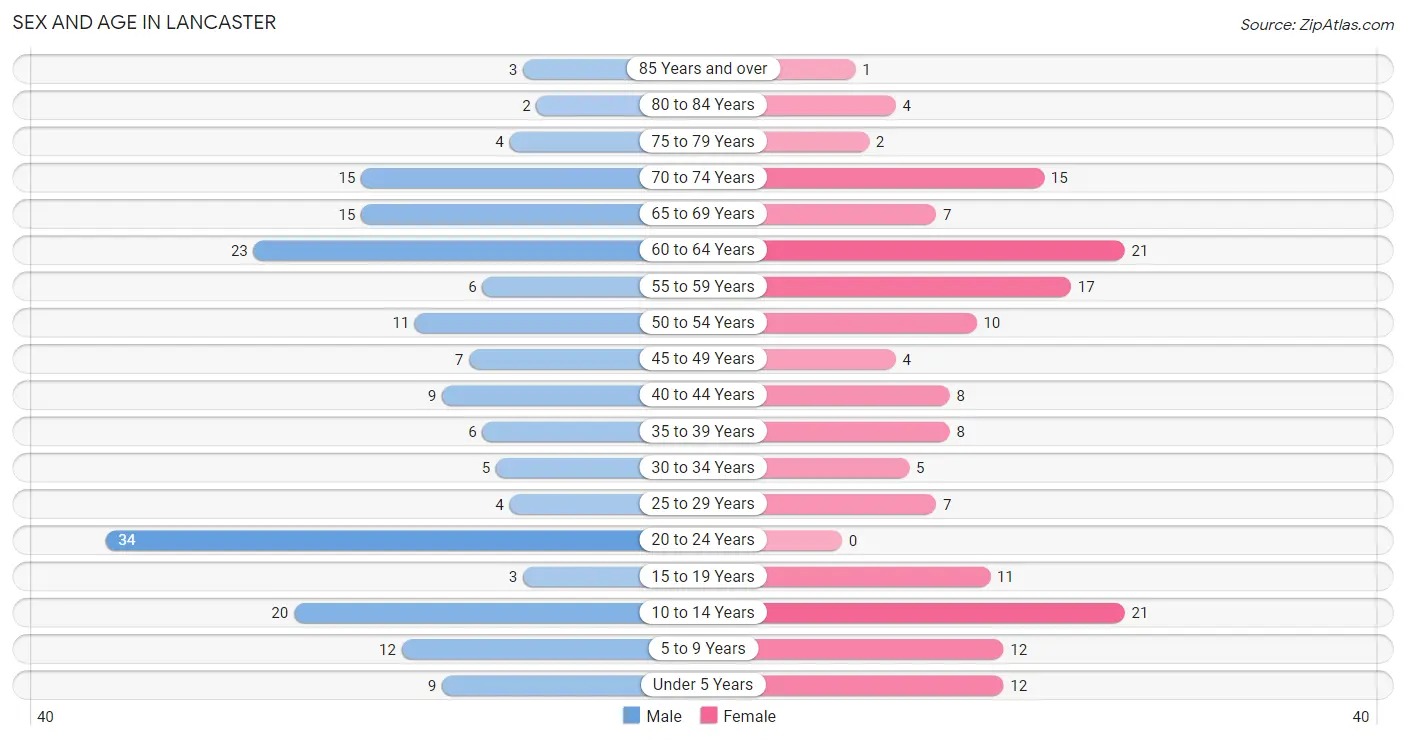
The most populous age groups in Lancaster are 20 to 24 Years (34 | 18.1%) for men and 10 to 14 Years (21 | 12.7%) for women.
| Age Bracket | Male | Female |
| Under 5 Years | 9 (4.8%) | 12 (7.3%) |
| 5 to 9 Years | 12 (6.4%) | 12 (7.3%) |
| 10 to 14 Years | 20 (10.6%) | 21 (12.7%) |
| 15 to 19 Years | 3 (1.6%) | 11 (6.7%) |
| 20 to 24 Years | 34 (18.1%) | 0 (0.0%) |
| 25 to 29 Years | 4 (2.1%) | 7 (4.2%) |
| 30 to 34 Years | 5 (2.7%) | 5 (3.0%) |
| 35 to 39 Years | 6 (3.2%) | 8 (4.9%) |
| 40 to 44 Years | 9 (4.8%) | 8 (4.9%) |
| 45 to 49 Years | 7 (3.7%) | 4 (2.4%) |
| 50 to 54 Years | 11 (5.9%) | 10 (6.1%) |
| 55 to 59 Years | 6 (3.2%) | 17 (10.3%) |
| 60 to 64 Years | 23 (12.2%) | 21 (12.7%) |
| 65 to 69 Years | 15 (8.0%) | 7 (4.2%) |
| 70 to 74 Years | 15 (8.0%) | 15 (9.1%) |
| 75 to 79 Years | 4 (2.1%) | 2 (1.2%) |
| 80 to 84 Years | 2 (1.1%) | 4 (2.4%) |
| 85 Years and over | 3 (1.6%) | 1 (0.6%) |
| Total | 188 (100.0%) | 165 (100.0%) |
Families and Households in Lancaster
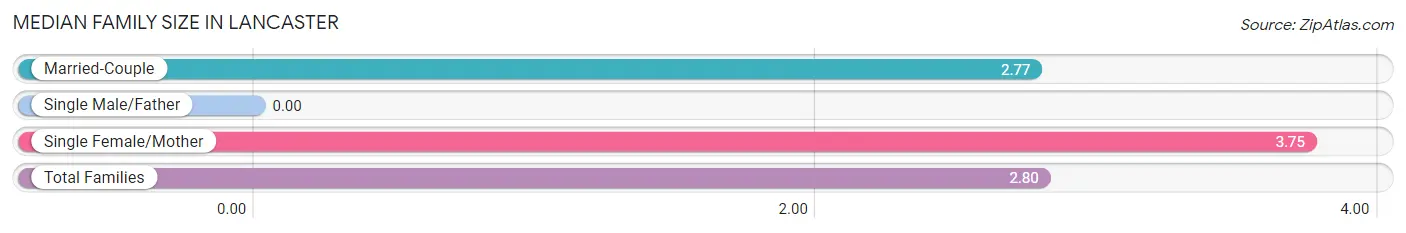
Median Family Size in Lancaster
| Family Type | # Families | Family Size |
| Married-Couple | 98 (96.1%) | 2.77 |
| Single Male/Father | 0 (0.0%) | - |
| Single Female/Mother | 4 (3.9%) | 3.75 |
| Total Families | 102 (100.0%) | 2.80 |
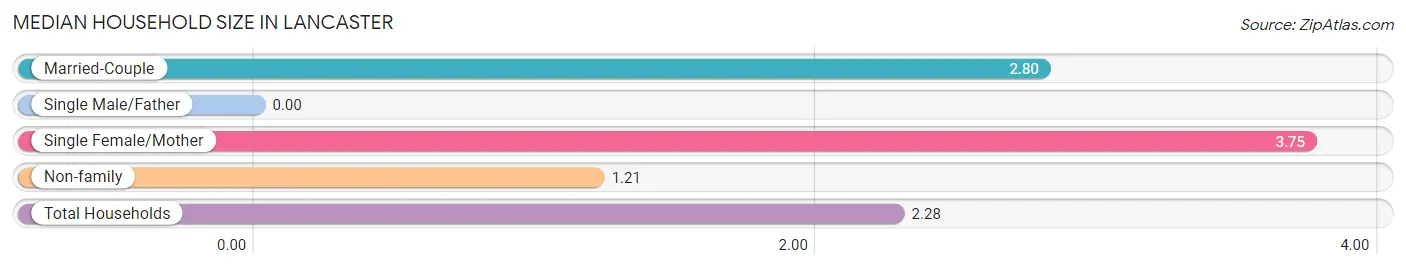
Median Household Size in Lancaster
| Household Type | # Households | Household Size |
| Married-Couple | 98 (63.2%) | 2.80 |
| Single Male/Father | 0 (0.0%) | - |
| Single Female/Mother | 4 (2.6%) | 3.75 |
| Non-family | 53 (34.2%) | 1.21 |
| Total Households | 155 (100.0%) | 2.28 |
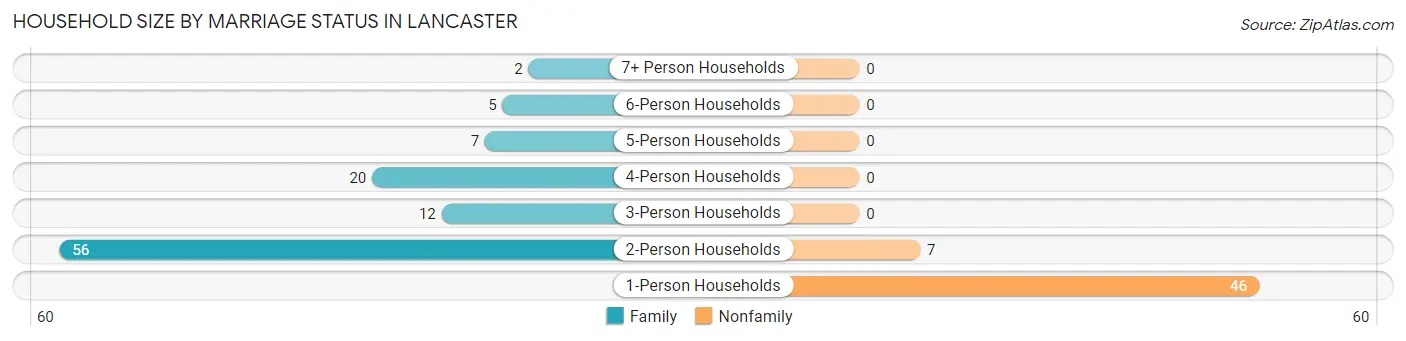
Household Size by Marriage Status in Lancaster
Out of a total of 155 households in Lancaster, 102 (65.8%) are family households, while 53 (34.2%) are nonfamily households. The most numerous type of family households are 2-person households, comprising 56, and the most common type of nonfamily households are 1-person households, comprising 46.
| Household Size | Family Households | Nonfamily Households |
| 1-Person Households | - | 46 (29.7%) |
| 2-Person Households | 56 (36.1%) | 7 (4.5%) |
| 3-Person Households | 12 (7.7%) | 0 (0.0%) |
| 4-Person Households | 20 (12.9%) | 0 (0.0%) |
| 5-Person Households | 7 (4.5%) | 0 (0.0%) |
| 6-Person Households | 5 (3.2%) | 0 (0.0%) |
| 7+ Person Households | 2 (1.3%) | 0 (0.0%) |
| Total | 102 (65.8%) | 53 (34.2%) |
Female Fertility in Lancaster
Fertility by Age in Lancaster
Average fertility rate in Lancaster is 116.0 births per 1,000 women. Women in the age bracket of 20 to 34 years have the highest fertility rate with 250.0 births per 1,000 women. Women in the age bracket of 20 to 34 years acount for 60.0% of all women with births.
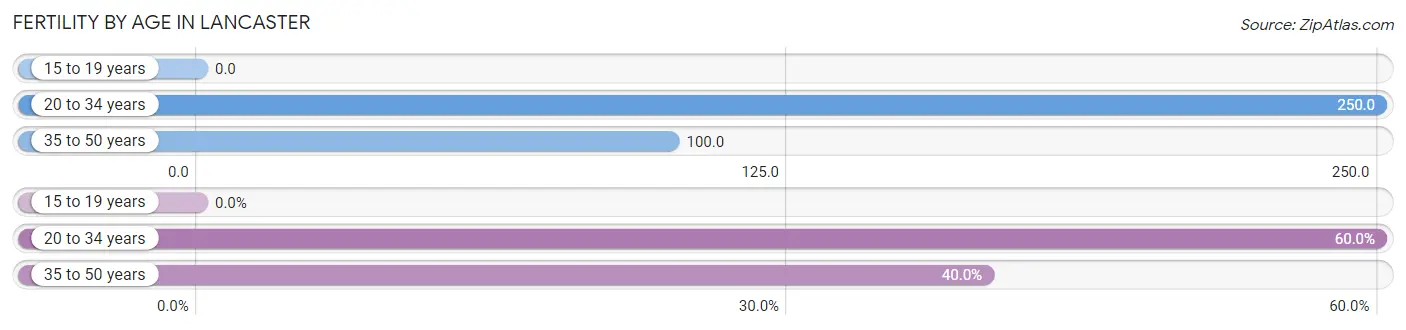
| Age Bracket | Women with Births | Births / 1,000 Women |
| 15 to 19 years | 0 (0.0%) | 0.0 |
| 20 to 34 years | 3 (60.0%) | 250.0 |
| 35 to 50 years | 2 (40.0%) | 100.0 |
| Total | 5 (100.0%) | 116.0 |
Fertility by Age by Marriage Status in Lancaster
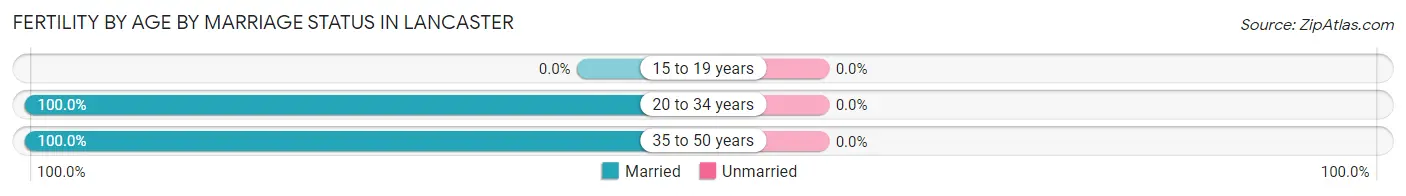
| Age Bracket | Married | Unmarried |
| 15 to 19 years | 0 (0.0%) | 0 (0.0%) |
| 20 to 34 years | 3 (100.0%) | 0 (0.0%) |
| 35 to 50 years | 2 (100.0%) | 0 (0.0%) |
| Total | 5 (100.0%) | 0 (0.0%) |
Fertility by Education in Lancaster
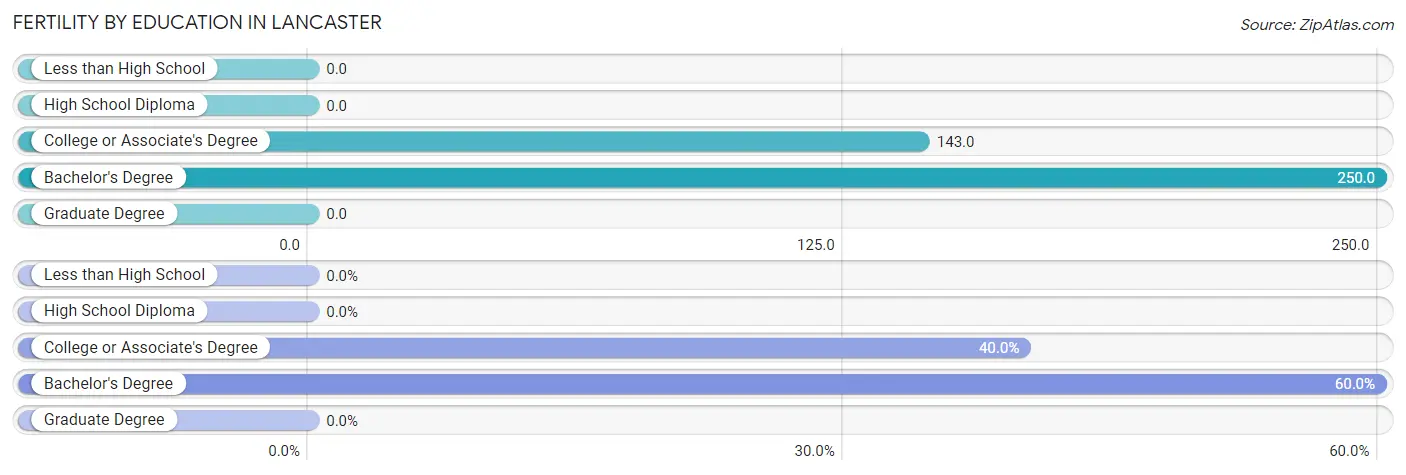
| Educational Attainment | Women with Births | Births / 1,000 Women |
| Less than High School | 0 (0.0%) | 0.0 |
| High School Diploma | 0 (0.0%) | 0.0 |
| College or Associate's Degree | 2 (40.0%) | 143.0 |
| Bachelor's Degree | 3 (60.0%) | 250.0 |
| Graduate Degree | 0 (0.0%) | 0.0 |
| Total | 5 (100.0%) | 116.0 |
Fertility by Education by Marriage Status in Lancaster
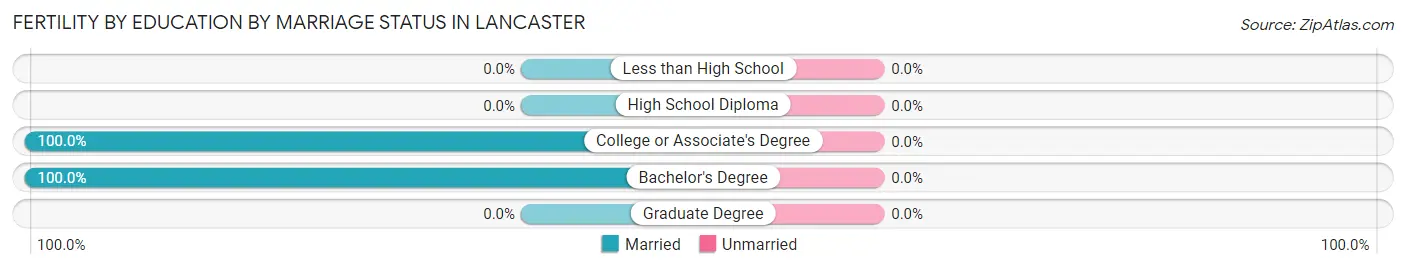
| Educational Attainment | Married | Unmarried |
| Less than High School | 0 (0.0%) | 0 (0.0%) |
| High School Diploma | 0 (0.0%) | 0 (0.0%) |
| College or Associate's Degree | 2 (100.0%) | 0 (0.0%) |
| Bachelor's Degree | 3 (100.0%) | 0 (0.0%) |
| Graduate Degree | 0 (0.0%) | 0 (0.0%) |
| Total | 5 (100.0%) | 0 (0.0%) |
Income in Lancaster
Income Overview in Lancaster
Per Capita Income in Lancaster is $31,535, while median incomes of families and households are $85,833 and $58,750 respectively.
| Characteristic | Number | Measure |
| Per Capita Income | 353 | $31,535 |
| Median Family Income | 102 | $85,833 |
| Mean Family Income | 102 | $88,269 |
| Median Household Income | 155 | $58,750 |
| Mean Household Income | 155 | $72,815 |
| Income Deficit | 102 | $0 |
| Wage / Income Gap (%) | 353 | 23.75% |
| Wage / Income Gap ($) | 353 | 76.25¢ per $1 |
| Gini / Inequality Index | 353 | 0.30 |
Earnings by Sex in Lancaster
Average Earnings in Lancaster are $41,354, $50,000 for men and $38,125 for women, a difference of 23.7%.
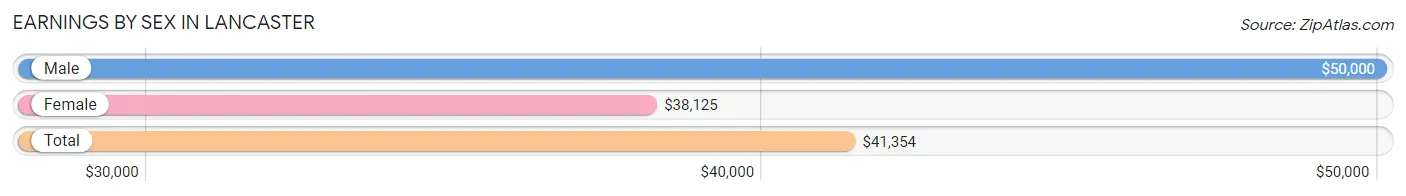
| Sex | Number | Average Earnings |
| Male | 112 (59.3%) | $50,000 |
| Female | 77 (40.7%) | $38,125 |
| Total | 189 (100.0%) | $41,354 |
Earnings by Sex by Income Bracket in Lancaster
The most common earnings brackets in Lancaster are $50,000 to $54,999 for men (22 | 19.6%) and $7,500 to $9,999 for women (14 | 18.2%).
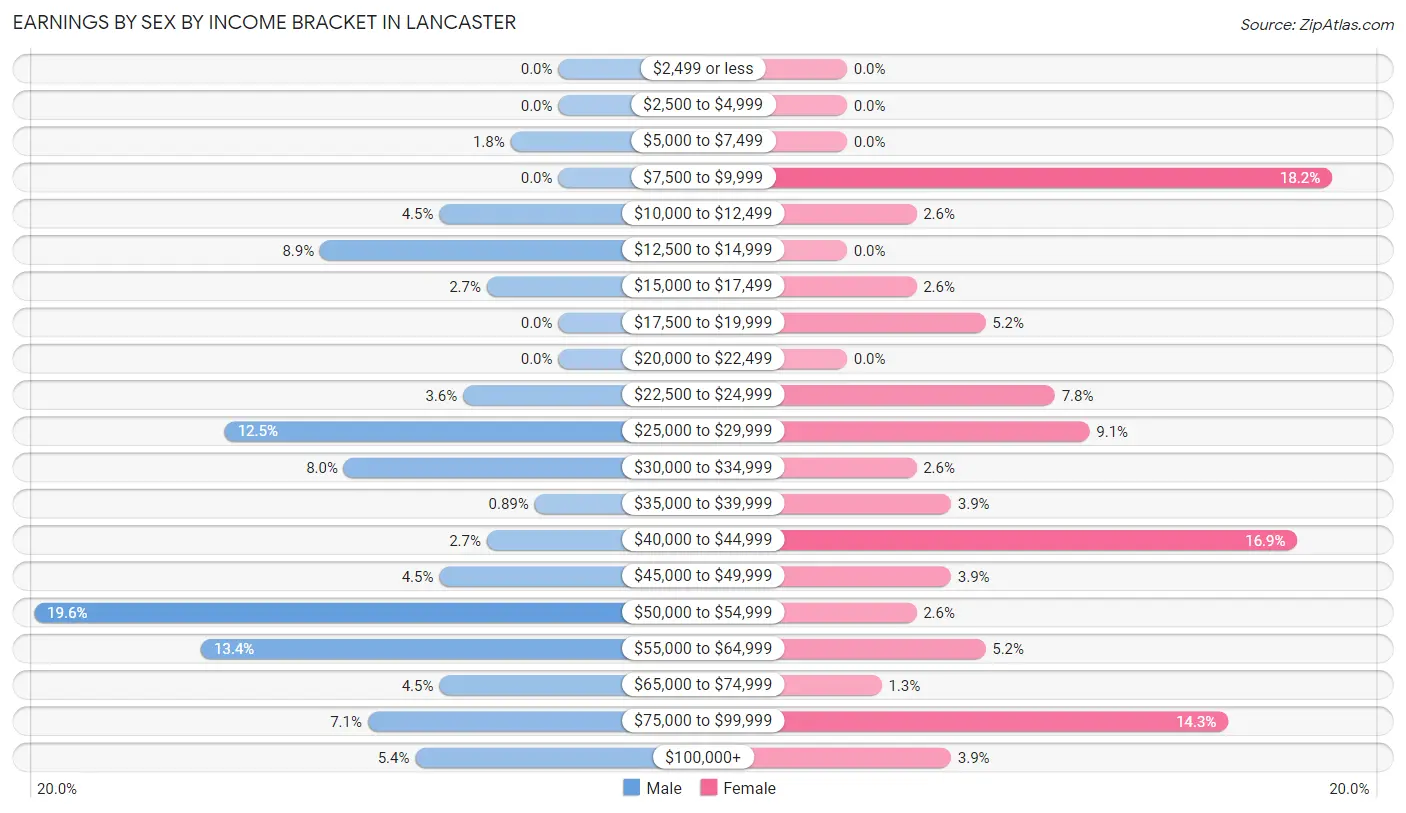
| Income | Male | Female |
| $2,499 or less | 0 (0.0%) | 0 (0.0%) |
| $2,500 to $4,999 | 0 (0.0%) | 0 (0.0%) |
| $5,000 to $7,499 | 2 (1.8%) | 0 (0.0%) |
| $7,500 to $9,999 | 0 (0.0%) | 14 (18.2%) |
| $10,000 to $12,499 | 5 (4.5%) | 2 (2.6%) |
| $12,500 to $14,999 | 10 (8.9%) | 0 (0.0%) |
| $15,000 to $17,499 | 3 (2.7%) | 2 (2.6%) |
| $17,500 to $19,999 | 0 (0.0%) | 4 (5.2%) |
| $20,000 to $22,499 | 0 (0.0%) | 0 (0.0%) |
| $22,500 to $24,999 | 4 (3.6%) | 6 (7.8%) |
| $25,000 to $29,999 | 14 (12.5%) | 7 (9.1%) |
| $30,000 to $34,999 | 9 (8.0%) | 2 (2.6%) |
| $35,000 to $39,999 | 1 (0.9%) | 3 (3.9%) |
| $40,000 to $44,999 | 3 (2.7%) | 13 (16.9%) |
| $45,000 to $49,999 | 5 (4.5%) | 3 (3.9%) |
| $50,000 to $54,999 | 22 (19.6%) | 2 (2.6%) |
| $55,000 to $64,999 | 15 (13.4%) | 4 (5.2%) |
| $65,000 to $74,999 | 5 (4.5%) | 1 (1.3%) |
| $75,000 to $99,999 | 8 (7.1%) | 11 (14.3%) |
| $100,000+ | 6 (5.4%) | 3 (3.9%) |
| Total | 112 (100.0%) | 77 (100.0%) |
Earnings by Sex by Educational Attainment in Lancaster
Average earnings in Lancaster are $45,833 for men and $40,341 for women, a difference of 12.0%. Men with an educational attainment of bachelor's degree enjoy the highest average annual earnings of $97,813, while those with college or associate's degree education earn the least with $40,000. Women with an educational attainment of bachelor's degree earn the most with the average annual earnings of $83,125, while those with college or associate's degree education have the smallest earnings of $25,625.
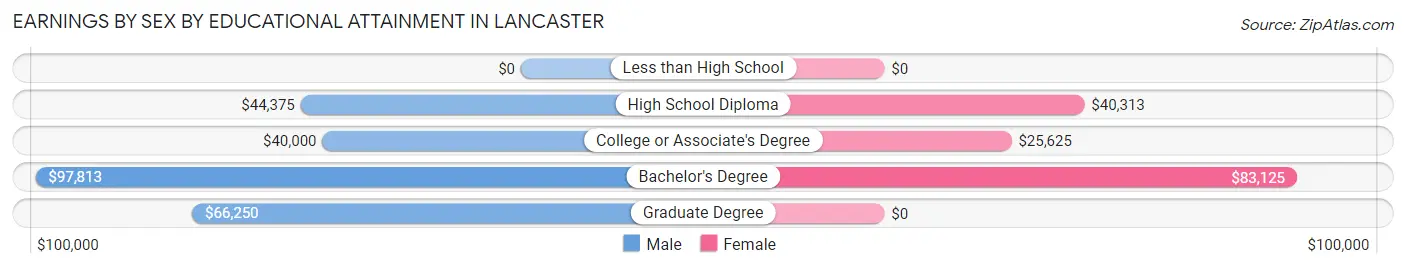
| Educational Attainment | Male Income | Female Income |
| Less than High School | - | - |
| High School Diploma | $44,375 | $40,313 |
| College or Associate's Degree | $40,000 | $25,625 |
| Bachelor's Degree | $97,813 | $83,125 |
| Graduate Degree | $66,250 | $0 |
| Total | $45,833 | $40,341 |
Family Income in Lancaster
Family Income Brackets in Lancaster
According to the Lancaster family income data, there are 27 families falling into the $100,000 to $149,999 income range, which is the most common income bracket and makes up 26.5% of all families.
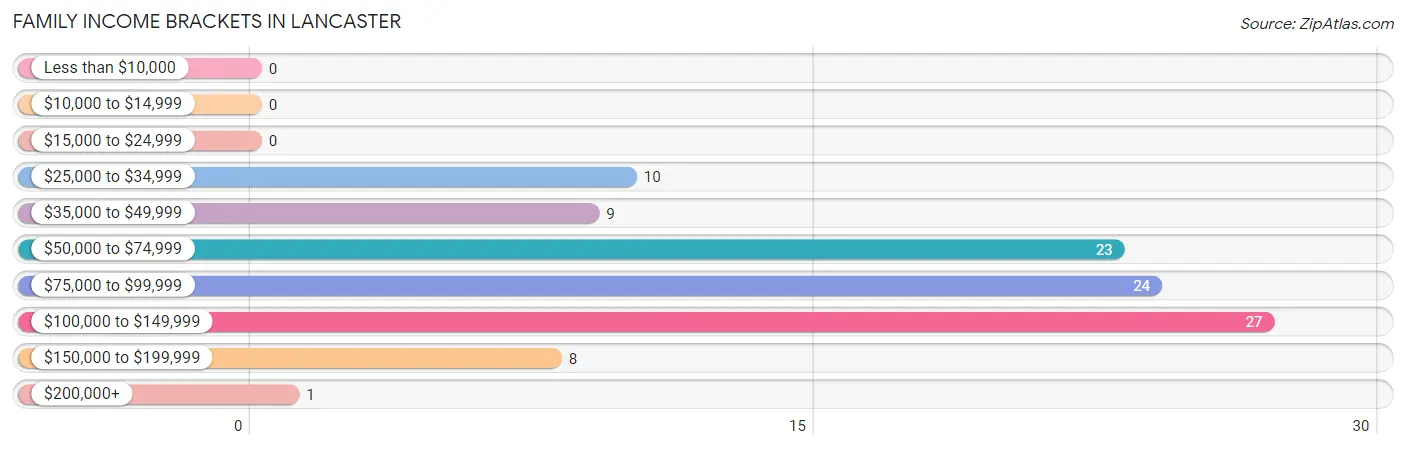
| Income Bracket | # Families | % Families |
| Less than $10,000 | 0 | 0.0% |
| $10,000 to $14,999 | 0 | 0.0% |
| $15,000 to $24,999 | 0 | 0.0% |
| $25,000 to $34,999 | 10 | 9.8% |
| $35,000 to $49,999 | 9 | 8.8% |
| $50,000 to $74,999 | 23 | 22.5% |
| $75,000 to $99,999 | 24 | 23.5% |
| $100,000 to $149,999 | 27 | 26.5% |
| $150,000 to $199,999 | 8 | 7.8% |
| $200,000+ | 1 | 1.0% |
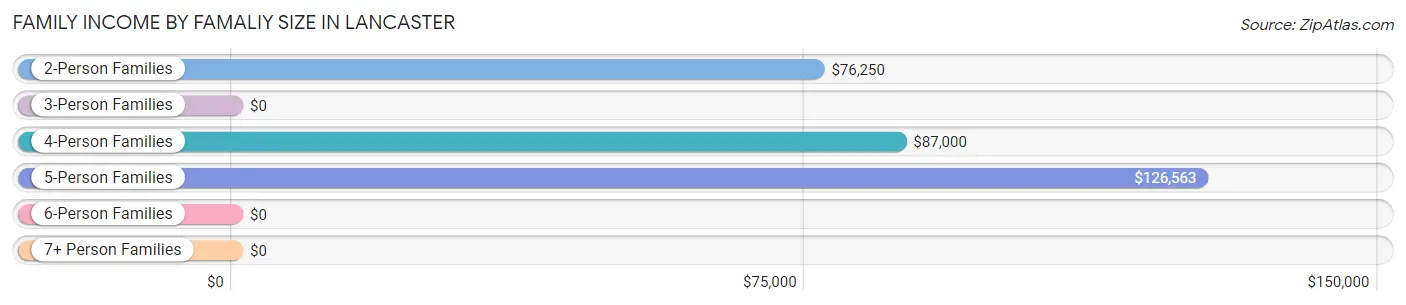
Family Income by Famaliy Size in Lancaster
5-person families (11 | 10.8%) account for the highest median family income in Lancaster with $126,563 per family, while 2-person families (56 | 54.9%) have the highest median income of $38,125 per family member.
| Income Bracket | # Families | Median Income |
| 2-Person Families | 56 (54.9%) | $76,250 |
| 3-Person Families | 12 (11.8%) | $0 |
| 4-Person Families | 20 (19.6%) | $87,000 |
| 5-Person Families | 11 (10.8%) | $126,563 |
| 6-Person Families | 1 (1.0%) | $0 |
| 7+ Person Families | 2 (2.0%) | $0 |
| Total | 102 (100.0%) | $85,833 |
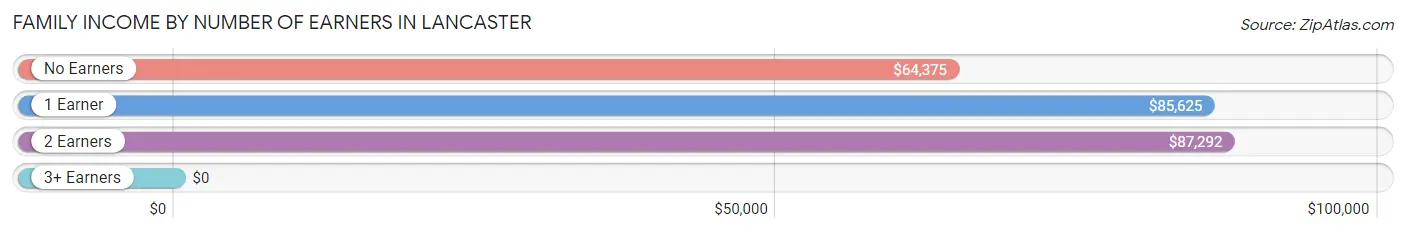
Family Income by Number of Earners in Lancaster
| Number of Earners | # Families | Median Income |
| No Earners | 19 (18.6%) | $64,375 |
| 1 Earner | 22 (21.6%) | $85,625 |
| 2 Earners | 59 (57.8%) | $87,292 |
| 3+ Earners | 2 (2.0%) | $0 |
| Total | 102 (100.0%) | $85,833 |
Household Income in Lancaster
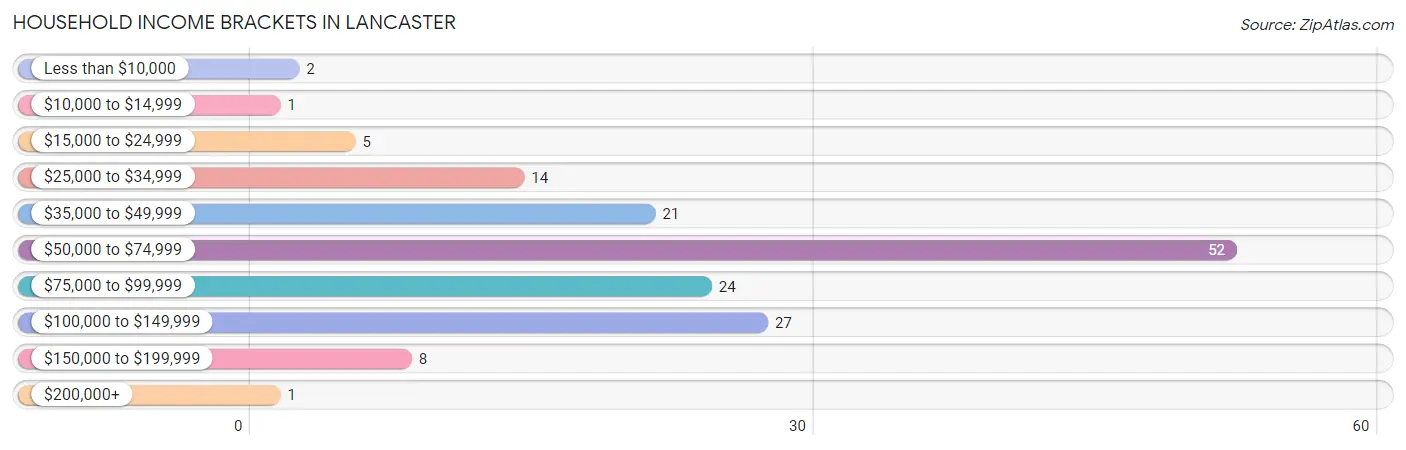
Household Income Brackets in Lancaster
With 52 households falling in the category, the $50,000 to $74,999 income range is the most frequent in Lancaster, accounting for 33.6% of all households. In contrast, only 1 households (0.6%) fall into the $10,000 to $14,999 income bracket, making it the least populous group.
| Income Bracket | # Households | % Households |
| Less than $10,000 | 2 | 1.3% |
| $10,000 to $14,999 | 1 | 0.6% |
| $15,000 to $24,999 | 5 | 3.2% |
| $25,000 to $34,999 | 14 | 9.0% |
| $35,000 to $49,999 | 21 | 13.5% |
| $50,000 to $74,999 | 52 | 33.5% |
| $75,000 to $99,999 | 24 | 15.5% |
| $100,000 to $149,999 | 27 | 17.4% |
| $150,000 to $199,999 | 8 | 5.2% |
| $200,000+ | 1 | 0.6% |
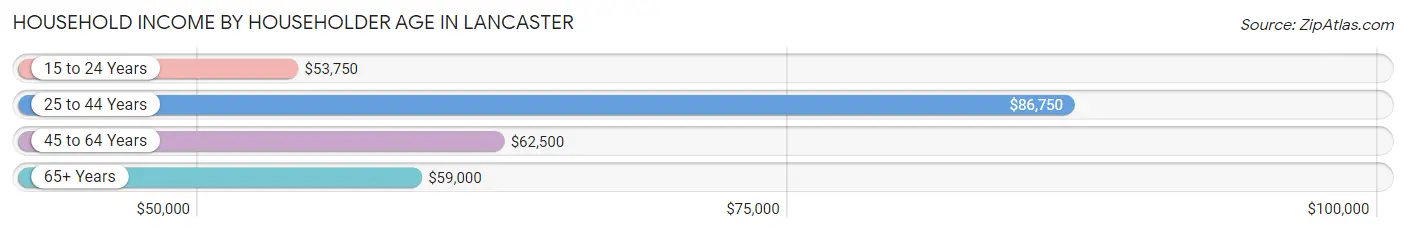
Household Income by Householder Age in Lancaster
The median household income in Lancaster is $58,750, with the highest median household income of $86,750 found in the 25 to 44 years age bracket for the primary householder. A total of 32 households (20.6%) fall into this category. Meanwhile, the 15 to 24 years age bracket for the primary householder has the lowest median household income of $53,750, with 27 households (17.4%) in this group.
| Income Bracket | # Households | Median Income |
| 15 to 24 Years | 27 (17.4%) | $53,750 |
| 25 to 44 Years | 32 (20.6%) | $86,750 |
| 45 to 64 Years | 60 (38.7%) | $62,500 |
| 65+ Years | 36 (23.2%) | $59,000 |
| Total | 155 (100.0%) | $58,750 |
Poverty in Lancaster
Income Below Poverty by Sex and Age in Lancaster
With 0.5% poverty level for males and 4.3% for females among the residents of Lancaster, 75 year old and over males and 18 to 24 year old females are the most vulnerable to poverty, with 1 males (11.1%) and 6 females (100.0%) in their respective age groups living below the poverty level.
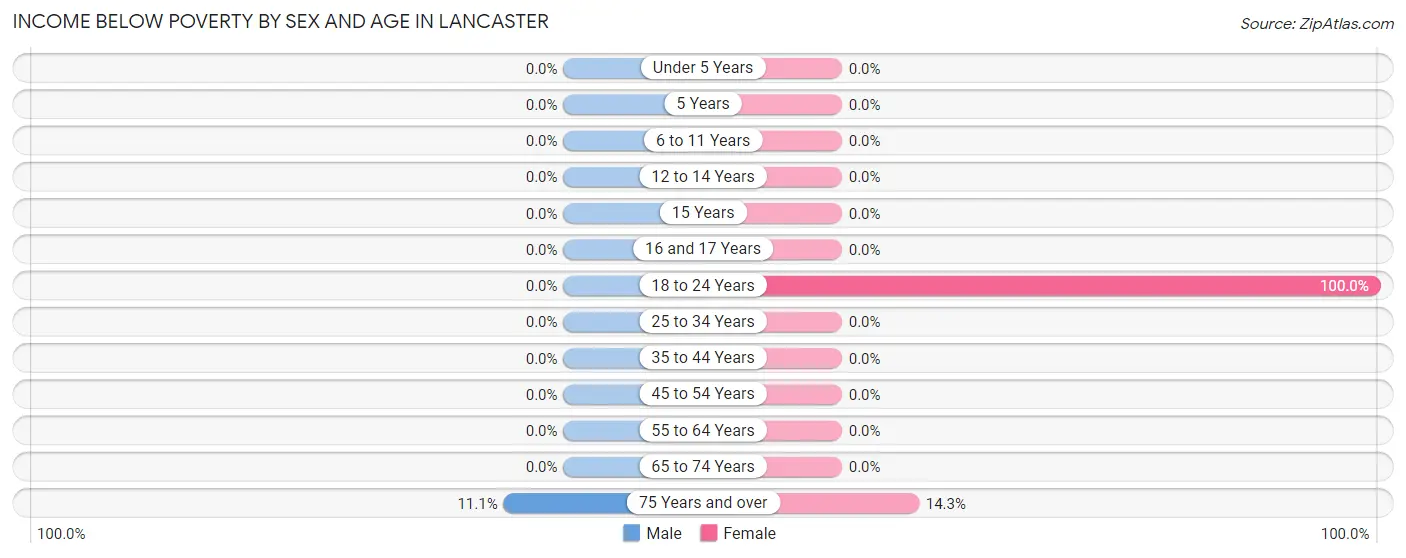
| Age Bracket | Male | Female |
| Under 5 Years | 0 (0.0%) | 0 (0.0%) |
| 5 Years | 0 (0.0%) | 0 (0.0%) |
| 6 to 11 Years | 0 (0.0%) | 0 (0.0%) |
| 12 to 14 Years | 0 (0.0%) | 0 (0.0%) |
| 15 Years | 0 (0.0%) | 0 (0.0%) |
| 16 and 17 Years | 0 (0.0%) | 0 (0.0%) |
| 18 to 24 Years | 0 (0.0%) | 6 (100.0%) |
| 25 to 34 Years | 0 (0.0%) | 0 (0.0%) |
| 35 to 44 Years | 0 (0.0%) | 0 (0.0%) |
| 45 to 54 Years | 0 (0.0%) | 0 (0.0%) |
| 55 to 64 Years | 0 (0.0%) | 0 (0.0%) |
| 65 to 74 Years | 0 (0.0%) | 0 (0.0%) |
| 75 Years and over | 1 (11.1%) | 1 (14.3%) |
| Total | 1 (0.5%) | 7 (4.3%) |
Income Above Poverty by Sex and Age in Lancaster
According to the poverty statistics in Lancaster, males aged under 5 years and females aged under 5 years are the age groups that are most secure financially, with 100.0% of males and 100.0% of females in these age groups living above the poverty line.
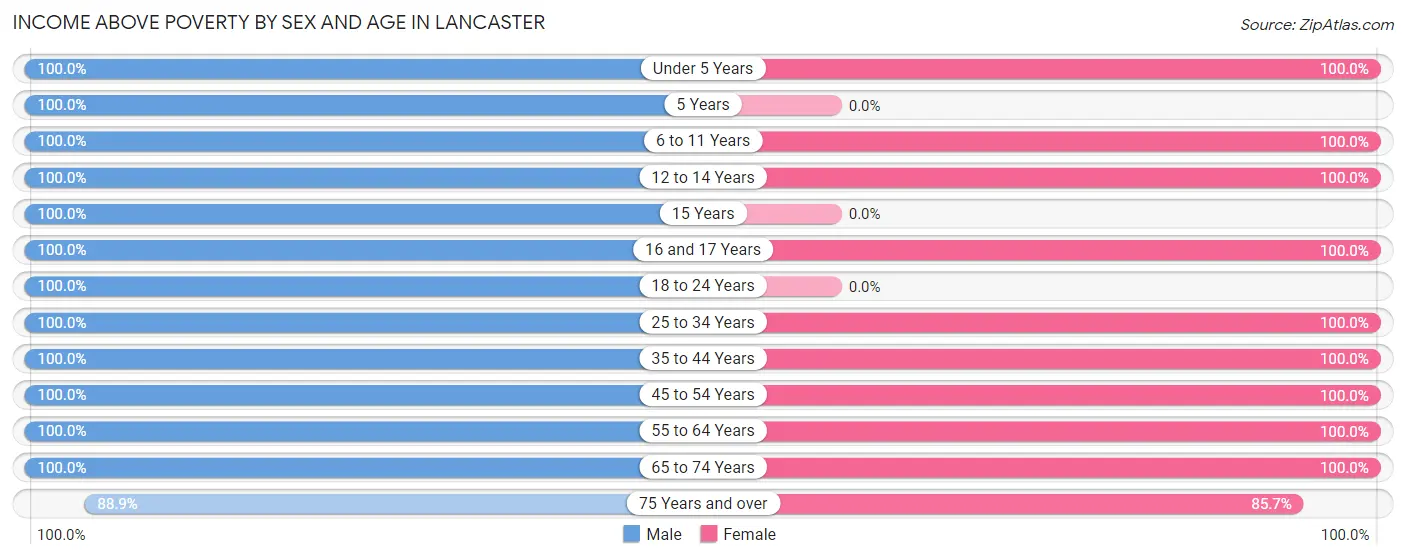
| Age Bracket | Male | Female |
| Under 5 Years | 9 (100.0%) | 12 (100.0%) |
| 5 Years | 4 (100.0%) | 0 (0.0%) |
| 6 to 11 Years | 24 (100.0%) | 20 (100.0%) |
| 12 to 14 Years | 4 (100.0%) | 10 (100.0%) |
| 15 Years | 2 (100.0%) | 0 (0.0%) |
| 16 and 17 Years | 1 (100.0%) | 5 (100.0%) |
| 18 to 24 Years | 34 (100.0%) | 0 (0.0%) |
| 25 to 34 Years | 9 (100.0%) | 12 (100.0%) |
| 35 to 44 Years | 15 (100.0%) | 16 (100.0%) |
| 45 to 54 Years | 18 (100.0%) | 14 (100.0%) |
| 55 to 64 Years | 29 (100.0%) | 38 (100.0%) |
| 65 to 74 Years | 30 (100.0%) | 22 (100.0%) |
| 75 Years and over | 8 (88.9%) | 6 (85.7%) |
| Total | 187 (99.5%) | 155 (95.7%) |
Income Below Poverty Among Married-Couple Families in Lancaster
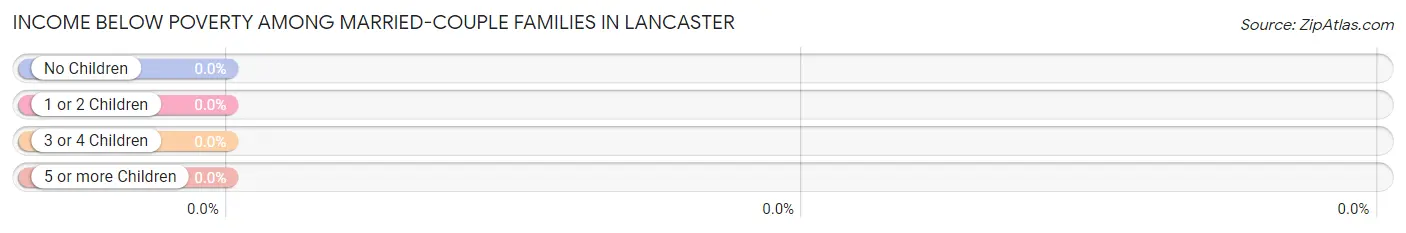
| Children | Above Poverty | Below Poverty |
| No Children | 58 (100.0%) | 0 (0.0%) |
| 1 or 2 Children | 26 (100.0%) | 0 (0.0%) |
| 3 or 4 Children | 12 (100.0%) | 0 (0.0%) |
| 5 or more Children | 2 (100.0%) | 0 (0.0%) |
| Total | 98 (100.0%) | 0 (0.0%) |
Income Below Poverty Among Single-Parent Households in Lancaster
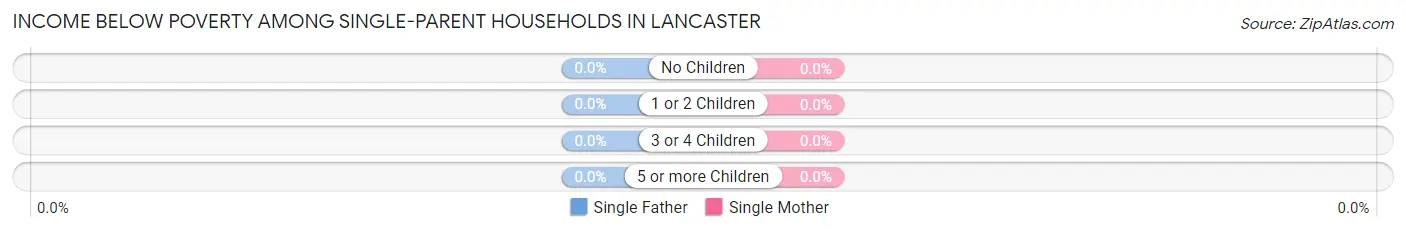
| Children | Single Father | Single Mother |
| No Children | 0 (0.0%) | 0 (0.0%) |
| 1 or 2 Children | 0 (0.0%) | 0 (0.0%) |
| 3 or 4 Children | 0 (0.0%) | 0 (0.0%) |
| 5 or more Children | 0 (0.0%) | 0 (0.0%) |
| Total | 0 (0.0%) | 0 (0.0%) |
Income Below Poverty Among Married-Couple vs Single-Parent Households in Lancaster

| Children | Married-Couple Families | Single-Parent Households |
| No Children | 0 (0.0%) | 0 (0.0%) |
| 1 or 2 Children | 0 (0.0%) | 0 (0.0%) |
| 3 or 4 Children | 0 (0.0%) | 0 (0.0%) |
| 5 or more Children | 0 (0.0%) | 0 (0.0%) |
| Total | 0 (0.0%) | 0 (0.0%) |
Employment Characteristics in Lancaster
Employment by Class of Employer in Lancaster
Among the 163 employed individuals in Lancaster, private company employees (89 | 54.6%), federal government employees (24 | 14.7%), and self-employed (not incorporated) (18 | 11.0%) make up the most common classes of employment.
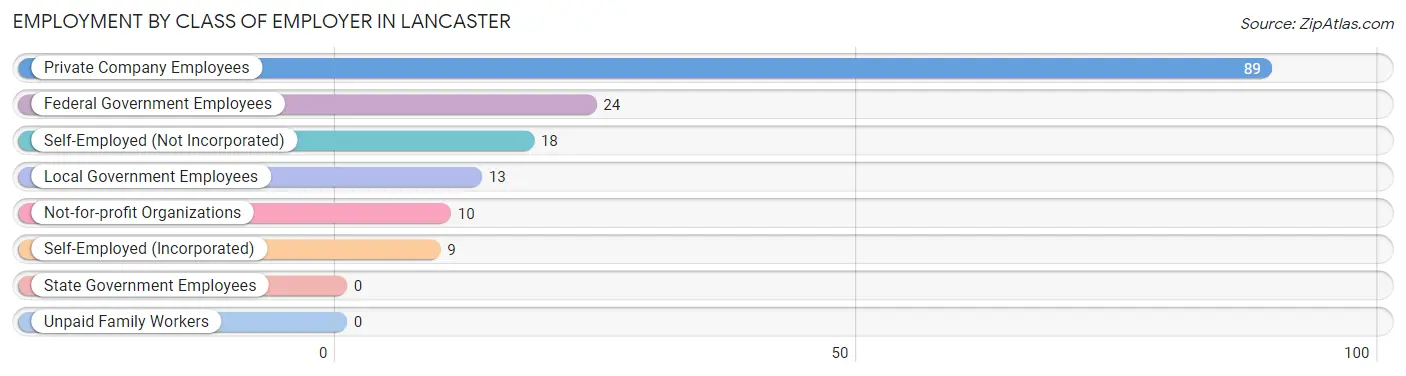
| Employer Class | # Employees | % Employees |
| Private Company Employees | 89 | 54.6% |
| Self-Employed (Incorporated) | 9 | 5.5% |
| Self-Employed (Not Incorporated) | 18 | 11.0% |
| Not-for-profit Organizations | 10 | 6.1% |
| Local Government Employees | 13 | 8.0% |
| State Government Employees | 0 | 0.0% |
| Federal Government Employees | 24 | 14.7% |
| Unpaid Family Workers | 0 | 0.0% |
| Total | 163 | 100.0% |
Employment Status by Age in Lancaster
According to the labor force statistics for Lancaster, out of the total population over 16 years of age (265), 62.3% or 165 individuals are in the labor force, with 1.2% or 2 of them unemployed. The age group with the highest labor force participation rate is 20 to 24 years, with 100.0% or 34 individuals in the labor force. Within the labor force, the 65 to 74 years age range has the highest percentage of unemployed individuals, with 50.0% or 2 of them being unemployed.
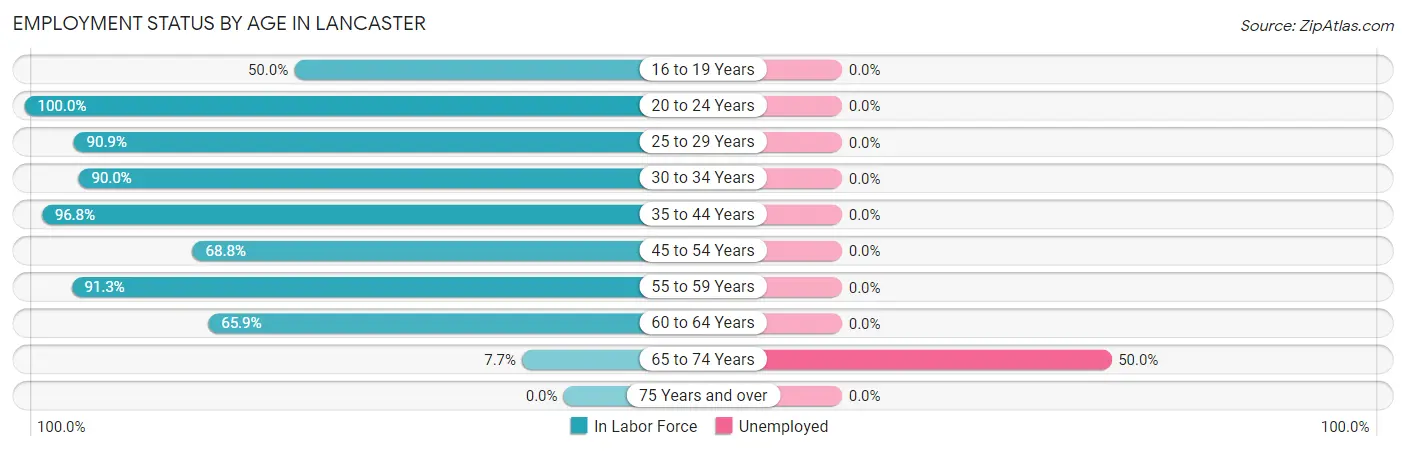
| Age Bracket | In Labor Force | Unemployed |
| 16 to 19 Years | 6 (50.0%) | 0 (0.0%) |
| 20 to 24 Years | 34 (100.0%) | 0 (0.0%) |
| 25 to 29 Years | 10 (90.9%) | 0 (0.0%) |
| 30 to 34 Years | 9 (90.0%) | 0 (0.0%) |
| 35 to 44 Years | 30 (96.8%) | 0 (0.0%) |
| 45 to 54 Years | 22 (68.8%) | 0 (0.0%) |
| 55 to 59 Years | 21 (91.3%) | 0 (0.0%) |
| 60 to 64 Years | 29 (65.9%) | 0 (0.0%) |
| 65 to 74 Years | 4 (7.7%) | 2 (50.0%) |
| 75 Years and over | 0 (0.0%) | 0 (0.0%) |
| Total | 165 (62.3%) | 2 (1.2%) |
Employment Status by Educational Attainment in Lancaster
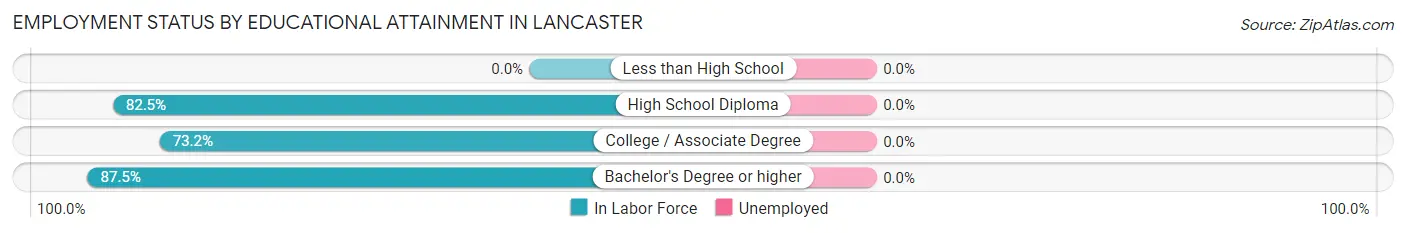
| Educational Attainment | In Labor Force | Unemployed |
| Less than High School | 0 (0.0%) | 0 (0.0%) |
| High School Diploma | 52 (82.5%) | 0 (0.0%) |
| College / Associate Degree | 41 (73.2%) | 0 (0.0%) |
| Bachelor's Degree or higher | 28 (87.5%) | 0 (0.0%) |
| Total | 121 (80.1%) | 0 (0.0%) |
Employment Occupations by Sex in Lancaster
Management, Business, Science and Arts Occupations
The most common Management, Business, Science and Arts occupations in Lancaster are Management (14 | 8.6%), Business & Financial (11 | 6.8%), Community & Social Service (9 | 5.5%), Education Instruction & Library (9 | 5.5%), and Health Diagnosing & Treating (5 | 3.1%).
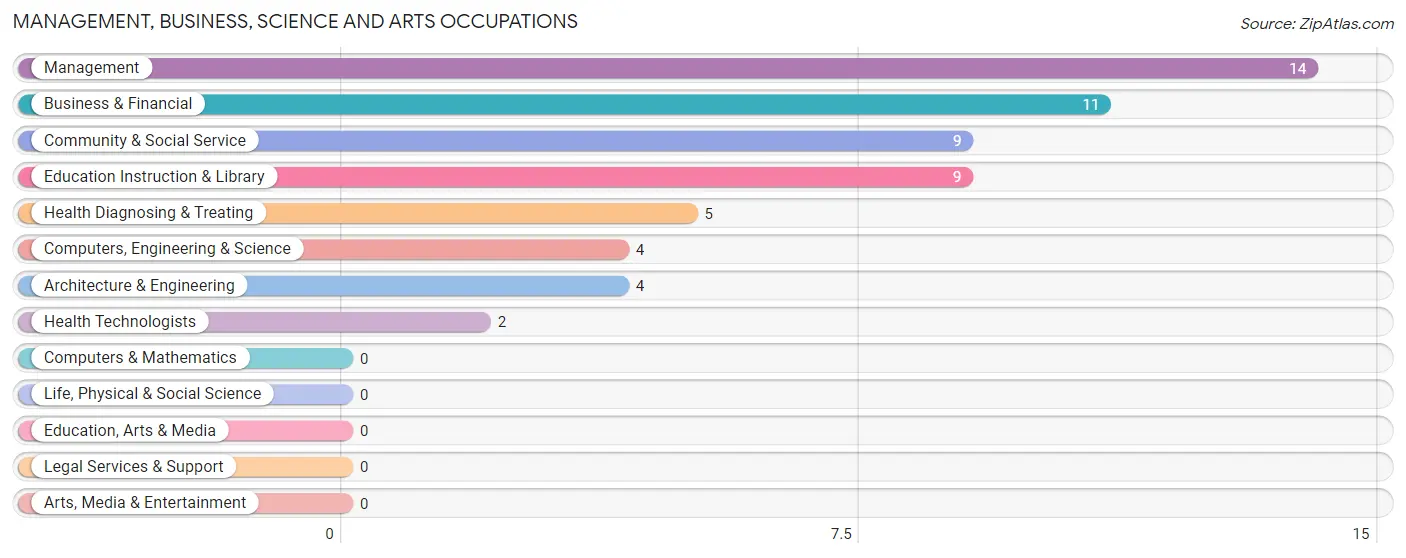
Management, Business, Science and Arts Occupations by Sex
Within the Management, Business, Science and Arts occupations in Lancaster, the most male-oriented occupations are Community & Social Service (88.9%), Education Instruction & Library (88.9%), and Management (85.7%), while the most female-oriented occupations are Computers, Engineering & Science (100.0%), Architecture & Engineering (100.0%), and Health Diagnosing & Treating (100.0%).
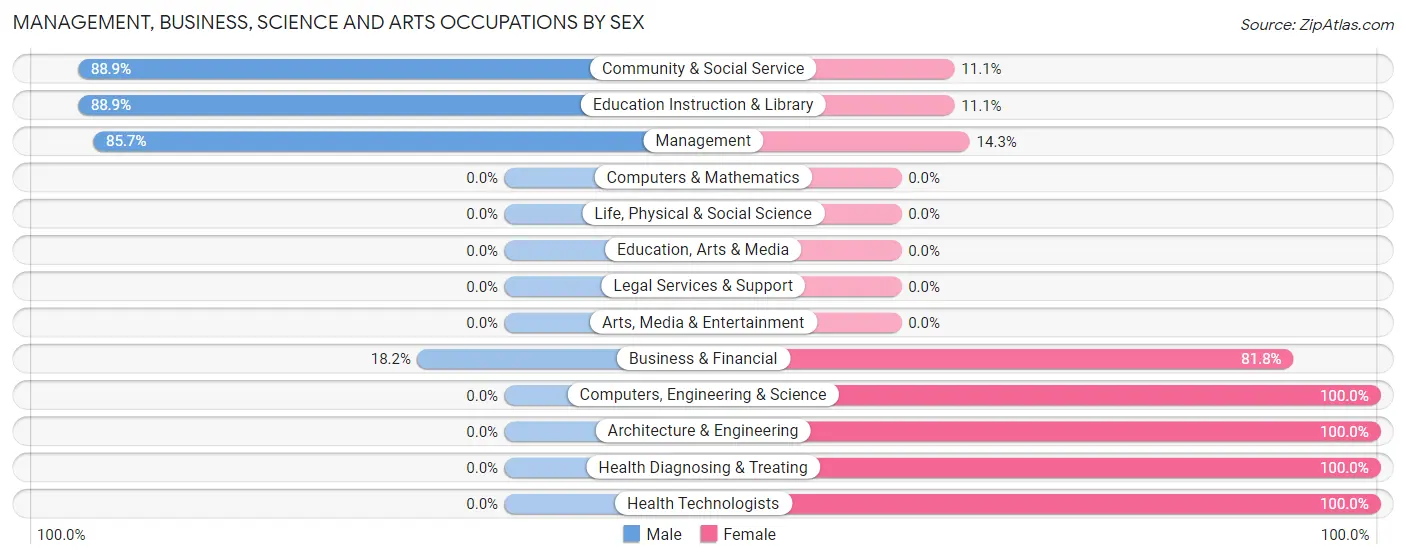
| Occupation | Male | Female |
| Management | 12 (85.7%) | 2 (14.3%) |
| Business & Financial | 2 (18.2%) | 9 (81.8%) |
| Computers, Engineering & Science | 0 (0.0%) | 4 (100.0%) |
| Computers & Mathematics | 0 (0.0%) | 0 (0.0%) |
| Architecture & Engineering | 0 (0.0%) | 4 (100.0%) |
| Life, Physical & Social Science | 0 (0.0%) | 0 (0.0%) |
| Community & Social Service | 8 (88.9%) | 1 (11.1%) |
| Education, Arts & Media | 0 (0.0%) | 0 (0.0%) |
| Legal Services & Support | 0 (0.0%) | 0 (0.0%) |
| Education Instruction & Library | 8 (88.9%) | 1 (11.1%) |
| Arts, Media & Entertainment | 0 (0.0%) | 0 (0.0%) |
| Health Diagnosing & Treating | 0 (0.0%) | 5 (100.0%) |
| Health Technologists | 0 (0.0%) | 2 (100.0%) |
| Total (Category) | 22 (51.2%) | 21 (48.8%) |
| Total (Overall) | 90 (55.2%) | 73 (44.8%) |
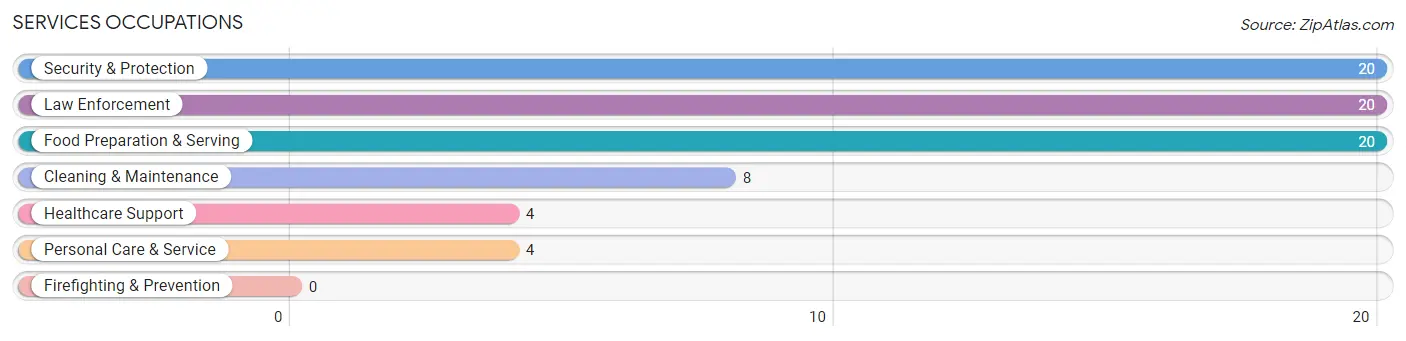
Services Occupations
The most common Services occupations in Lancaster are Security & Protection (20 | 12.3%), Law Enforcement (20 | 12.3%), Food Preparation & Serving (20 | 12.3%), Cleaning & Maintenance (8 | 4.9%), and Healthcare Support (4 | 2.5%).
Services Occupations by Sex
Within the Services occupations in Lancaster, the most male-oriented occupations are Security & Protection (100.0%), Law Enforcement (100.0%), and Food Preparation & Serving (5.0%), while the most female-oriented occupations are Healthcare Support (100.0%), Cleaning & Maintenance (100.0%), and Personal Care & Service (100.0%).
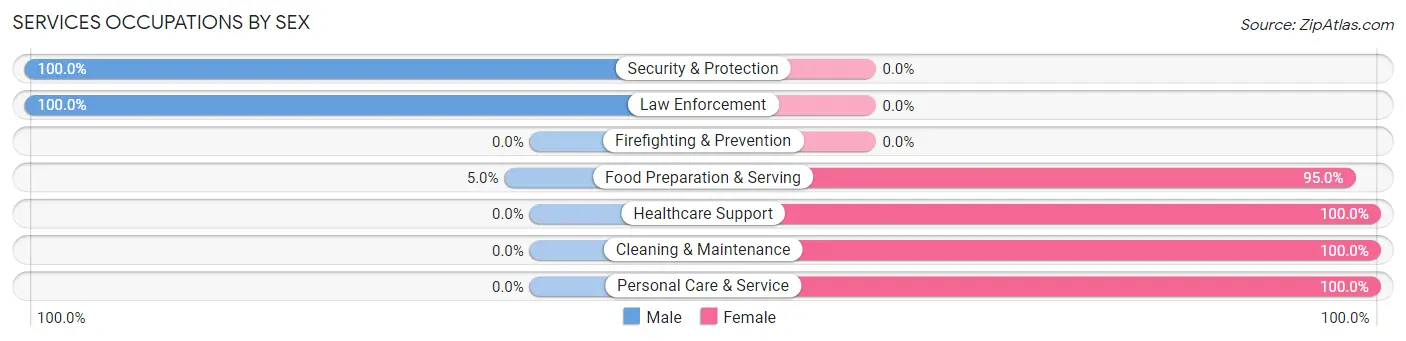
| Occupation | Male | Female |
| Healthcare Support | 0 (0.0%) | 4 (100.0%) |
| Security & Protection | 20 (100.0%) | 0 (0.0%) |
| Firefighting & Prevention | 0 (0.0%) | 0 (0.0%) |
| Law Enforcement | 20 (100.0%) | 0 (0.0%) |
| Food Preparation & Serving | 1 (5.0%) | 19 (95.0%) |
| Cleaning & Maintenance | 0 (0.0%) | 8 (100.0%) |
| Personal Care & Service | 0 (0.0%) | 4 (100.0%) |
| Total (Category) | 21 (37.5%) | 35 (62.5%) |
| Total (Overall) | 90 (55.2%) | 73 (44.8%) |
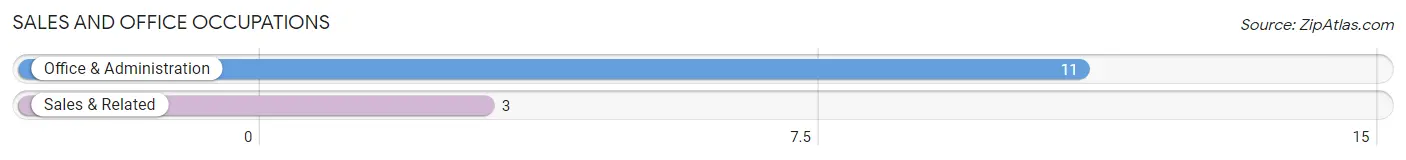
Sales and Office Occupations
The most common Sales and Office occupations in Lancaster are Office & Administration (11 | 6.8%), and Sales & Related (3 | 1.8%).
Sales and Office Occupations by Sex

| Occupation | Male | Female |
| Sales & Related | 3 (100.0%) | 0 (0.0%) |
| Office & Administration | 2 (18.2%) | 9 (81.8%) |
| Total (Category) | 5 (35.7%) | 9 (64.3%) |
| Total (Overall) | 90 (55.2%) | 73 (44.8%) |
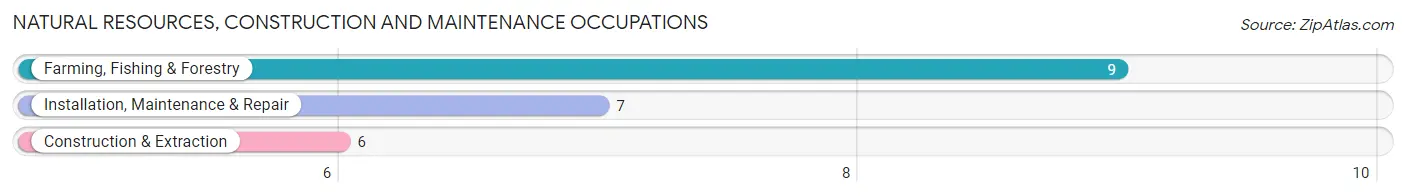
Natural Resources, Construction and Maintenance Occupations
The most common Natural Resources, Construction and Maintenance occupations in Lancaster are Farming, Fishing & Forestry (9 | 5.5%), Installation, Maintenance & Repair (7 | 4.3%), and Construction & Extraction (6 | 3.7%).
Natural Resources, Construction and Maintenance Occupations by Sex
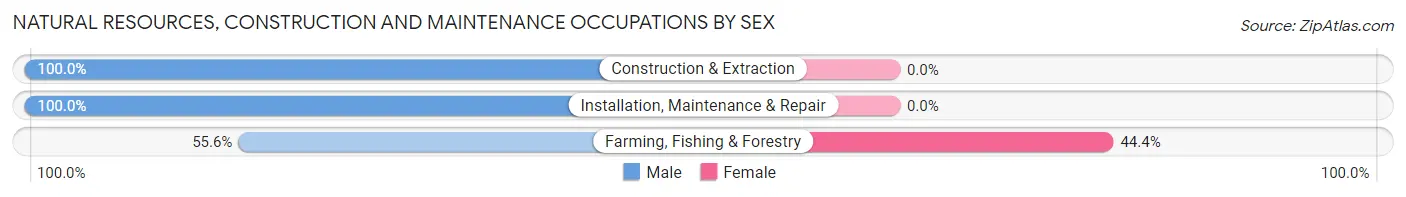
| Occupation | Male | Female |
| Farming, Fishing & Forestry | 5 (55.6%) | 4 (44.4%) |
| Construction & Extraction | 6 (100.0%) | 0 (0.0%) |
| Installation, Maintenance & Repair | 7 (100.0%) | 0 (0.0%) |
| Total (Category) | 18 (81.8%) | 4 (18.2%) |
| Total (Overall) | 90 (55.2%) | 73 (44.8%) |
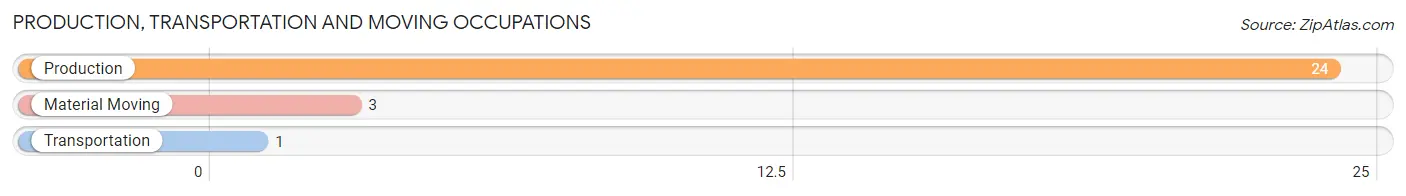
Production, Transportation and Moving Occupations
The most common Production, Transportation and Moving occupations in Lancaster are Production (24 | 14.7%), Material Moving (3 | 1.8%), and Transportation (1 | 0.6%).
Production, Transportation and Moving Occupations by Sex
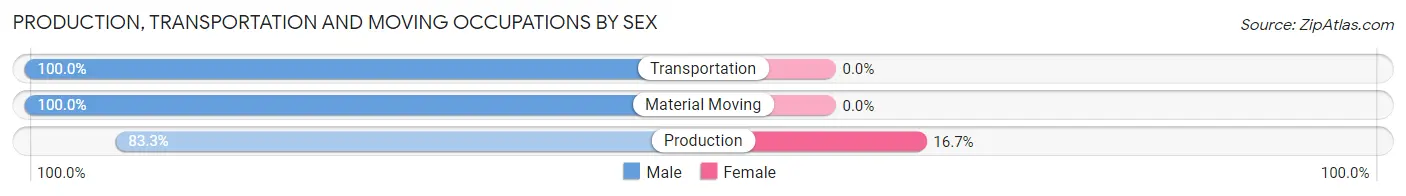
| Occupation | Male | Female |
| Production | 20 (83.3%) | 4 (16.7%) |
| Transportation | 1 (100.0%) | 0 (0.0%) |
| Material Moving | 3 (100.0%) | 0 (0.0%) |
| Total (Category) | 24 (85.7%) | 4 (14.3%) |
| Total (Overall) | 90 (55.2%) | 73 (44.8%) |
Employment Industries by Sex in Lancaster
Employment Industries in Lancaster
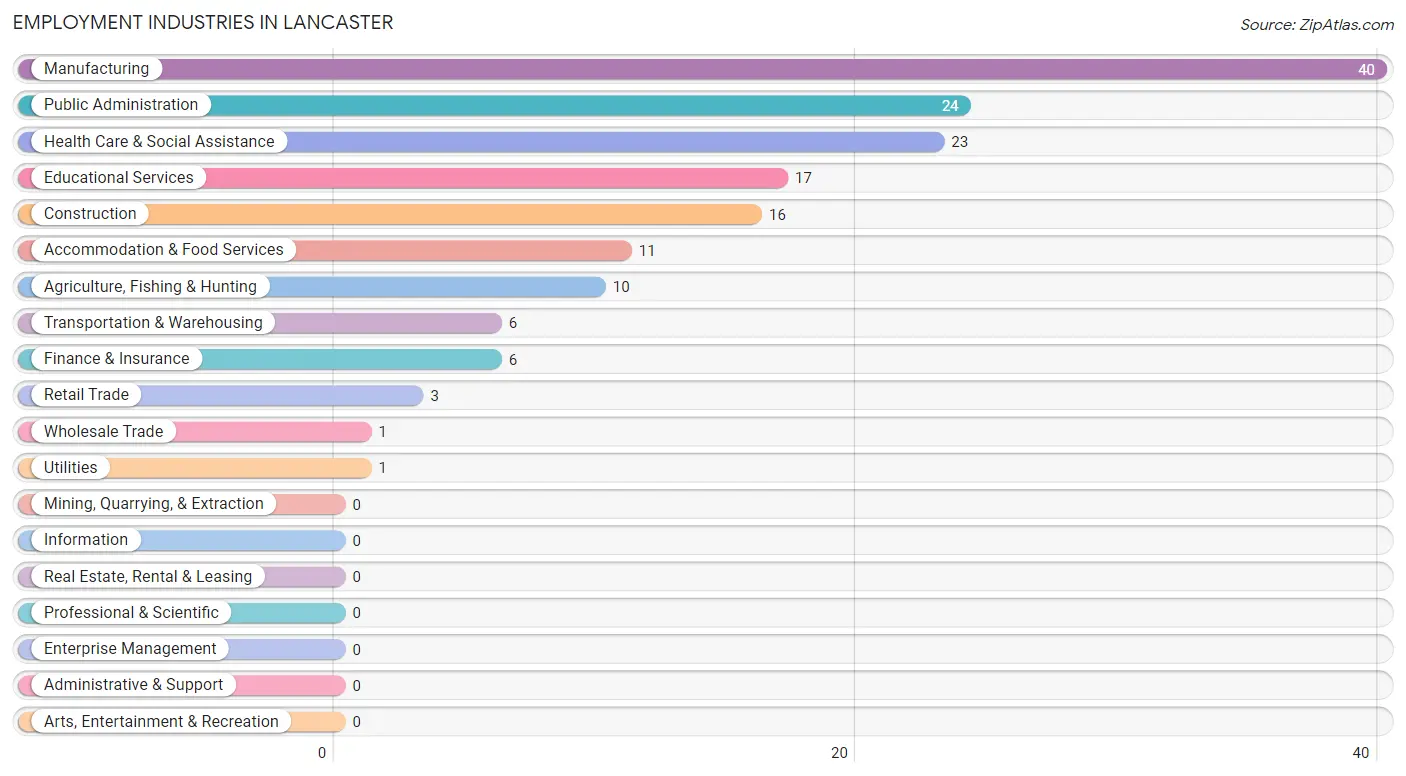
The major employment industries in Lancaster include Manufacturing (40 | 24.5%), Public Administration (24 | 14.7%), Health Care & Social Assistance (23 | 14.1%), Educational Services (17 | 10.4%), and Construction (16 | 9.8%).
Employment Industries by Sex in Lancaster
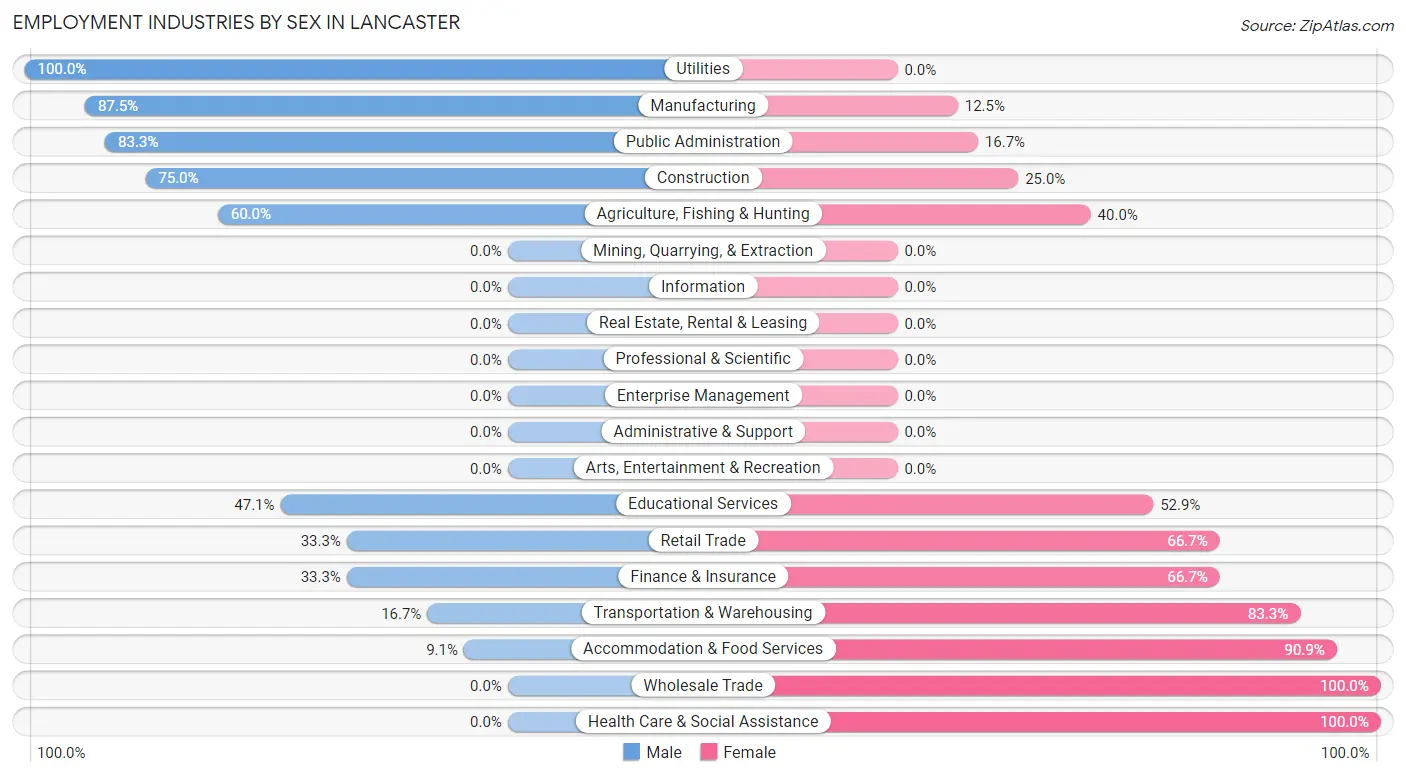
The Lancaster industries that see more men than women are Utilities (100.0%), Manufacturing (87.5%), and Public Administration (83.3%), whereas the industries that tend to have a higher number of women are Wholesale Trade (100.0%), Health Care & Social Assistance (100.0%), and Accommodation & Food Services (90.9%).
| Industry | Male | Female |
| Agriculture, Fishing & Hunting | 6 (60.0%) | 4 (40.0%) |
| Mining, Quarrying, & Extraction | 0 (0.0%) | 0 (0.0%) |
| Construction | 12 (75.0%) | 4 (25.0%) |
| Manufacturing | 35 (87.5%) | 5 (12.5%) |
| Wholesale Trade | 0 (0.0%) | 1 (100.0%) |
| Retail Trade | 1 (33.3%) | 2 (66.7%) |
| Transportation & Warehousing | 1 (16.7%) | 5 (83.3%) |
| Utilities | 1 (100.0%) | 0 (0.0%) |
| Information | 0 (0.0%) | 0 (0.0%) |
| Finance & Insurance | 2 (33.3%) | 4 (66.7%) |
| Real Estate, Rental & Leasing | 0 (0.0%) | 0 (0.0%) |
| Professional & Scientific | 0 (0.0%) | 0 (0.0%) |
| Enterprise Management | 0 (0.0%) | 0 (0.0%) |
| Administrative & Support | 0 (0.0%) | 0 (0.0%) |
| Educational Services | 8 (47.1%) | 9 (52.9%) |
| Health Care & Social Assistance | 0 (0.0%) | 23 (100.0%) |
| Arts, Entertainment & Recreation | 0 (0.0%) | 0 (0.0%) |
| Accommodation & Food Services | 1 (9.1%) | 10 (90.9%) |
| Public Administration | 20 (83.3%) | 4 (16.7%) |
| Total | 90 (55.2%) | 73 (44.8%) |
Education in Lancaster
School Enrollment in Lancaster
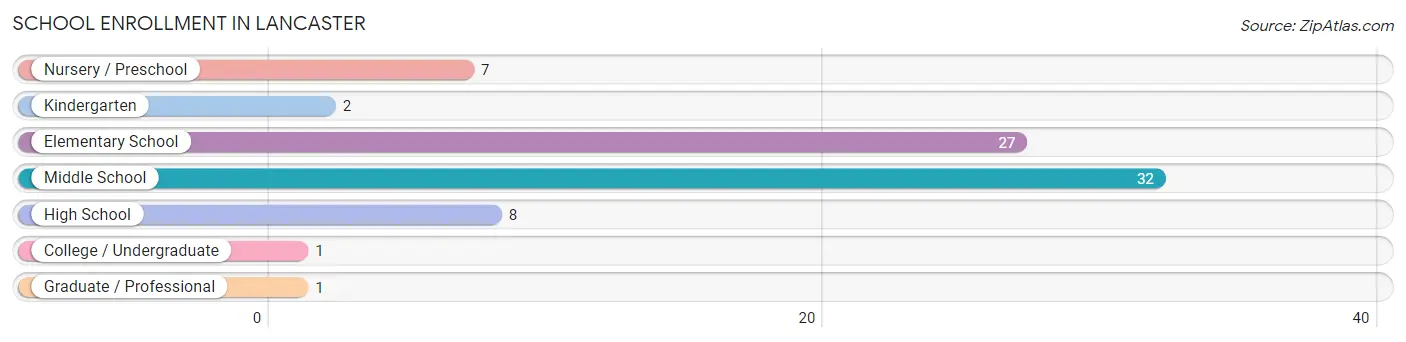
The most common levels of schooling among the 78 students in Lancaster are middle school (32 | 41.0%), elementary school (27 | 34.6%), and high school (8 | 10.3%).
| School Level | # Students | % Students |
| Nursery / Preschool | 7 | 9.0% |
| Kindergarten | 2 | 2.6% |
| Elementary School | 27 | 34.6% |
| Middle School | 32 | 41.0% |
| High School | 8 | 10.3% |
| College / Undergraduate | 1 | 1.3% |
| Graduate / Professional | 1 | 1.3% |
| Total | 78 | 100.0% |
School Enrollment by Age by Funding Source in Lancaster
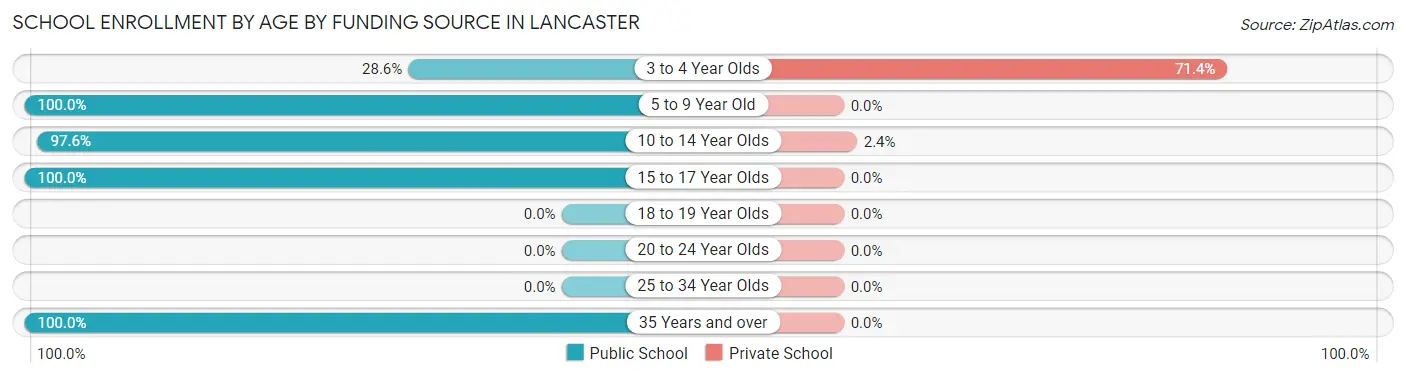
Out of a total of 78 students who are enrolled in schools in Lancaster, 6 (7.7%) attend a private institution, while the remaining 72 (92.3%) are enrolled in public schools. The age group of 3 to 4 year olds has the highest likelihood of being enrolled in private schools, with 5 (71.4% in the age bracket) enrolled. Conversely, the age group of 5 to 9 year old has the lowest likelihood of being enrolled in a private school, with 20 (100.0% in the age bracket) attending a public institution.
| Age Bracket | Public School | Private School |
| 3 to 4 Year Olds | 2 (28.6%) | 5 (71.4%) |
| 5 to 9 Year Old | 20 (100.0%) | 0 (0.0%) |
| 10 to 14 Year Olds | 40 (97.6%) | 1 (2.4%) |
| 15 to 17 Year Olds | 8 (100.0%) | 0 (0.0%) |
| 18 to 19 Year Olds | 0 (0.0%) | 0 (0.0%) |
| 20 to 24 Year Olds | 0 (0.0%) | 0 (0.0%) |
| 25 to 34 Year Olds | 0 (0.0%) | 0 (0.0%) |
| 35 Years and over | 2 (100.0%) | 0 (0.0%) |
| Total | 72 (92.3%) | 6 (7.7%) |
Educational Attainment by Field of Study in Lancaster
Education (21 | 40.4%), business (9 | 17.3%), science & technology (8 | 15.4%), arts & humanities (7 | 13.5%), and engineering (4 | 7.7%) are the most common fields of study among 52 individuals in Lancaster who have obtained a bachelor's degree or higher.
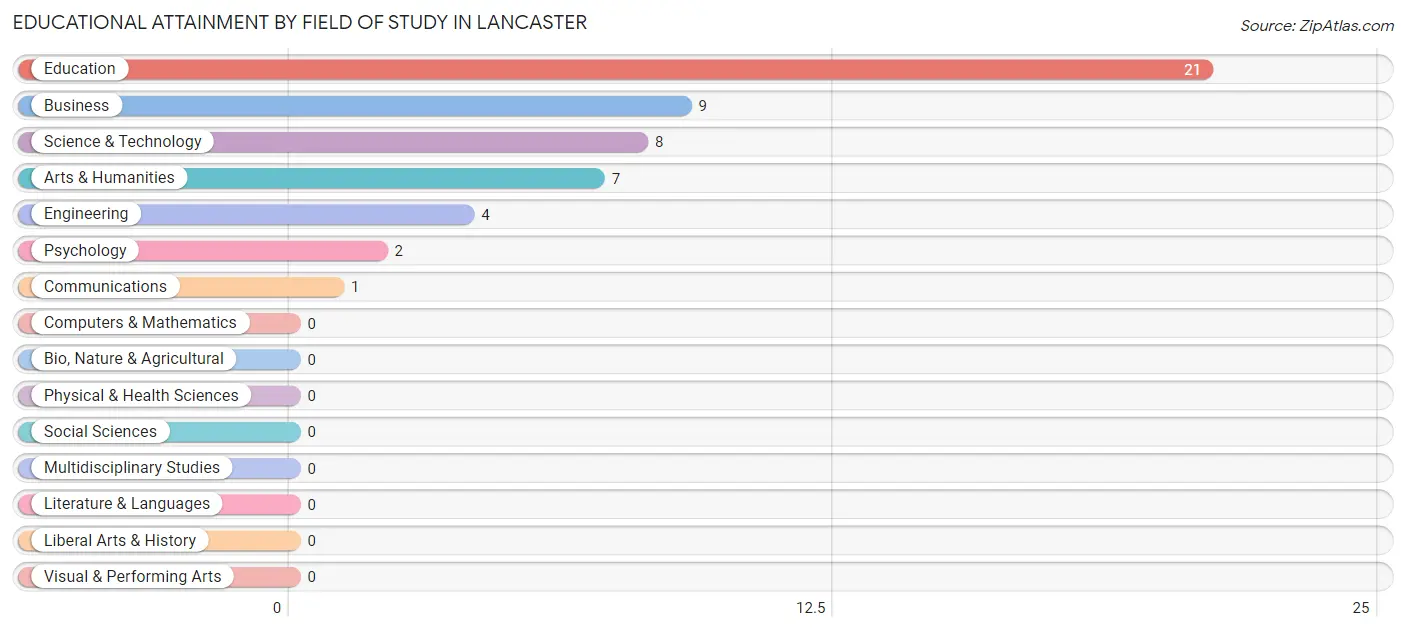
| Field of Study | # Graduates | % Graduates |
| Computers & Mathematics | 0 | 0.0% |
| Bio, Nature & Agricultural | 0 | 0.0% |
| Physical & Health Sciences | 0 | 0.0% |
| Psychology | 2 | 3.8% |
| Social Sciences | 0 | 0.0% |
| Engineering | 4 | 7.7% |
| Multidisciplinary Studies | 0 | 0.0% |
| Science & Technology | 8 | 15.4% |
| Business | 9 | 17.3% |
| Education | 21 | 40.4% |
| Literature & Languages | 0 | 0.0% |
| Liberal Arts & History | 0 | 0.0% |
| Visual & Performing Arts | 0 | 0.0% |
| Communications | 1 | 1.9% |
| Arts & Humanities | 7 | 13.5% |
| Total | 52 | 100.0% |
Transportation & Commute in Lancaster
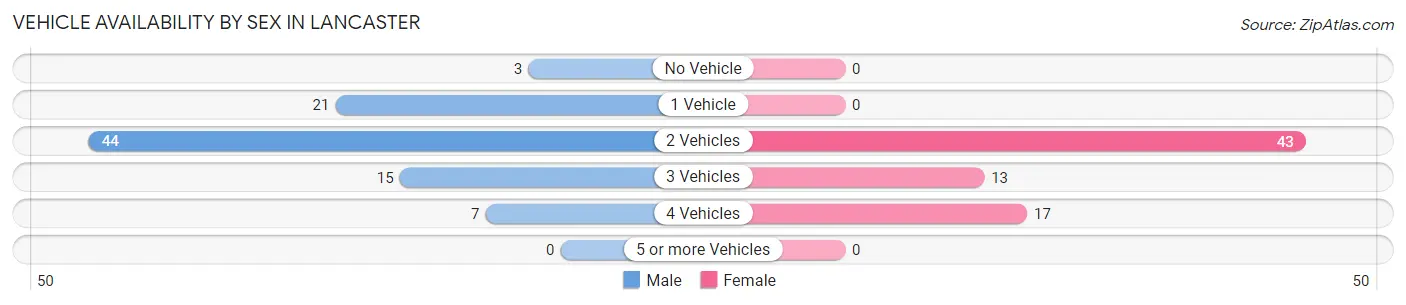
Vehicle Availability by Sex in Lancaster
The most prevalent vehicle ownership categories in Lancaster are males with 2 vehicles (44, accounting for 48.9%) and females with 2 vehicles (43, making up 60.3%).
| Vehicles Available | Male | Female |
| No Vehicle | 3 (3.3%) | 0 (0.0%) |
| 1 Vehicle | 21 (23.3%) | 0 (0.0%) |
| 2 Vehicles | 44 (48.9%) | 43 (58.9%) |
| 3 Vehicles | 15 (16.7%) | 13 (17.8%) |
| 4 Vehicles | 7 (7.8%) | 17 (23.3%) |
| 5 or more Vehicles | 0 (0.0%) | 0 (0.0%) |
| Total | 90 (100.0%) | 73 (100.0%) |
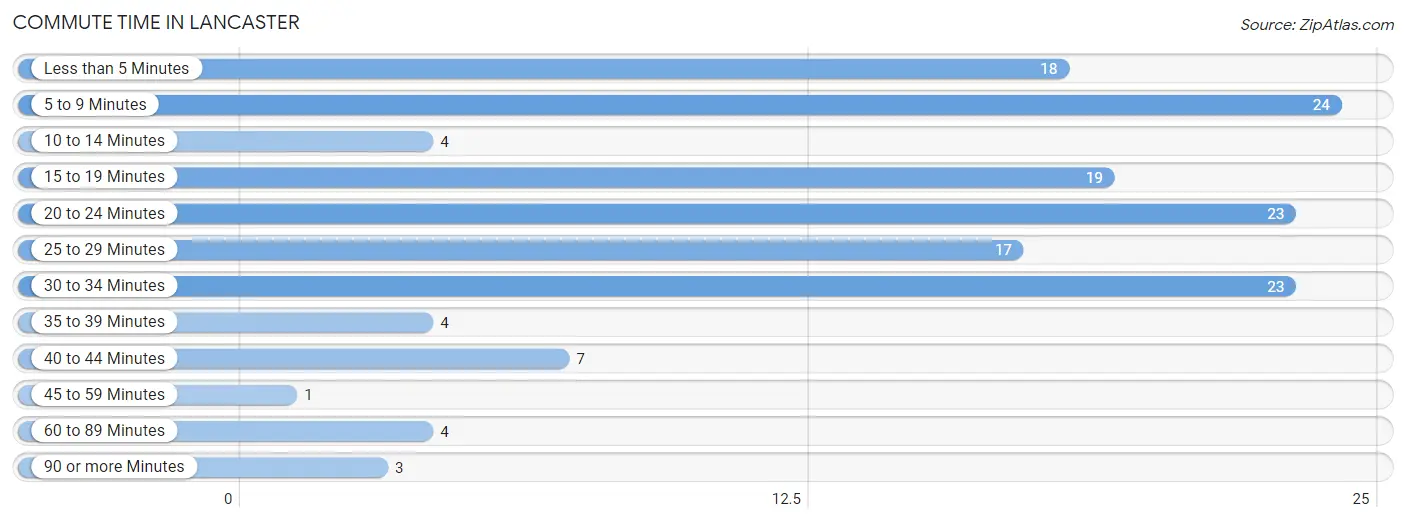
Commute Time in Lancaster
The most frequently occuring commute durations in Lancaster are 5 to 9 minutes (24 commuters, 16.3%), 20 to 24 minutes (23 commuters, 15.7%), and 30 to 34 minutes (23 commuters, 15.7%).
| Commute Time | # Commuters | % Commuters |
| Less than 5 Minutes | 18 | 12.2% |
| 5 to 9 Minutes | 24 | 16.3% |
| 10 to 14 Minutes | 4 | 2.7% |
| 15 to 19 Minutes | 19 | 12.9% |
| 20 to 24 Minutes | 23 | 15.7% |
| 25 to 29 Minutes | 17 | 11.6% |
| 30 to 34 Minutes | 23 | 15.7% |
| 35 to 39 Minutes | 4 | 2.7% |
| 40 to 44 Minutes | 7 | 4.8% |
| 45 to 59 Minutes | 1 | 0.7% |
| 60 to 89 Minutes | 4 | 2.7% |
| 90 or more Minutes | 3 | 2.0% |
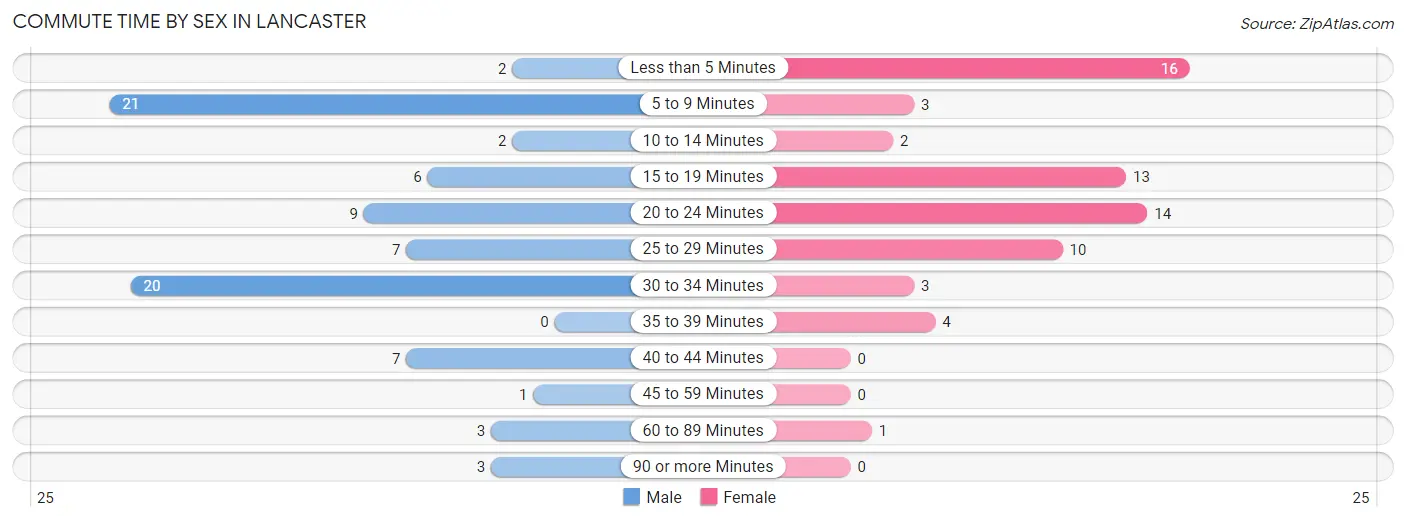
Commute Time by Sex in Lancaster
The most common commute times in Lancaster are 5 to 9 minutes (21 commuters, 25.9%) for males and less than 5 minutes (16 commuters, 24.2%) for females.
| Commute Time | Male | Female |
| Less than 5 Minutes | 2 (2.5%) | 16 (24.2%) |
| 5 to 9 Minutes | 21 (25.9%) | 3 (4.5%) |
| 10 to 14 Minutes | 2 (2.5%) | 2 (3.0%) |
| 15 to 19 Minutes | 6 (7.4%) | 13 (19.7%) |
| 20 to 24 Minutes | 9 (11.1%) | 14 (21.2%) |
| 25 to 29 Minutes | 7 (8.6%) | 10 (15.1%) |
| 30 to 34 Minutes | 20 (24.7%) | 3 (4.5%) |
| 35 to 39 Minutes | 0 (0.0%) | 4 (6.1%) |
| 40 to 44 Minutes | 7 (8.6%) | 0 (0.0%) |
| 45 to 59 Minutes | 1 (1.2%) | 0 (0.0%) |
| 60 to 89 Minutes | 3 (3.7%) | 1 (1.5%) |
| 90 or more Minutes | 3 (3.7%) | 0 (0.0%) |
Time of Departure to Work by Sex in Lancaster
The most frequent times of departure to work in Lancaster are 7:00 AM to 7:29 AM (24, 29.6%) for males and 8:00 AM to 8:29 AM (12, 18.2%) for females.
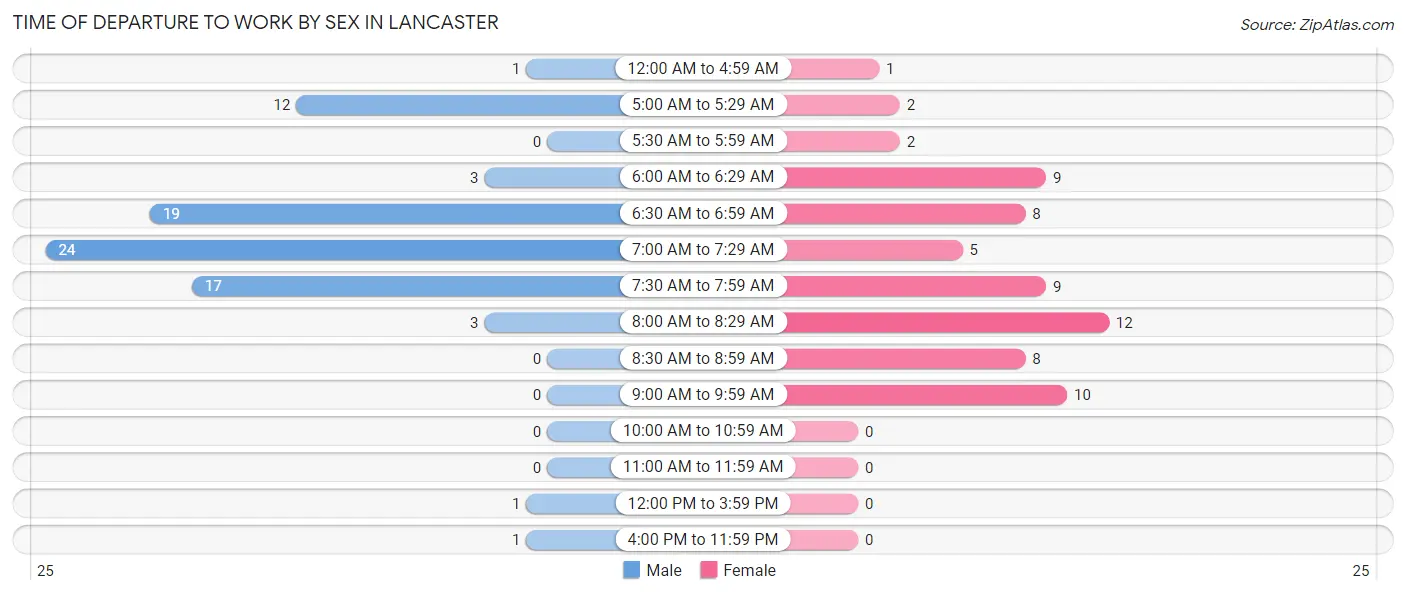
| Time of Departure | Male | Female |
| 12:00 AM to 4:59 AM | 1 (1.2%) | 1 (1.5%) |
| 5:00 AM to 5:29 AM | 12 (14.8%) | 2 (3.0%) |
| 5:30 AM to 5:59 AM | 0 (0.0%) | 2 (3.0%) |
| 6:00 AM to 6:29 AM | 3 (3.7%) | 9 (13.6%) |
| 6:30 AM to 6:59 AM | 19 (23.5%) | 8 (12.1%) |
| 7:00 AM to 7:29 AM | 24 (29.6%) | 5 (7.6%) |
| 7:30 AM to 7:59 AM | 17 (21.0%) | 9 (13.6%) |
| 8:00 AM to 8:29 AM | 3 (3.7%) | 12 (18.2%) |
| 8:30 AM to 8:59 AM | 0 (0.0%) | 8 (12.1%) |
| 9:00 AM to 9:59 AM | 0 (0.0%) | 10 (15.1%) |
| 10:00 AM to 10:59 AM | 0 (0.0%) | 0 (0.0%) |
| 11:00 AM to 11:59 AM | 0 (0.0%) | 0 (0.0%) |
| 12:00 PM to 3:59 PM | 1 (1.2%) | 0 (0.0%) |
| 4:00 PM to 11:59 PM | 1 (1.2%) | 0 (0.0%) |
| Total | 81 (100.0%) | 66 (100.0%) |
Housing Occupancy in Lancaster
Occupancy by Ownership in Lancaster
Of the total 155 dwellings in Lancaster, owner-occupied units account for 110 (71.0%), while renter-occupied units make up 45 (29.0%).
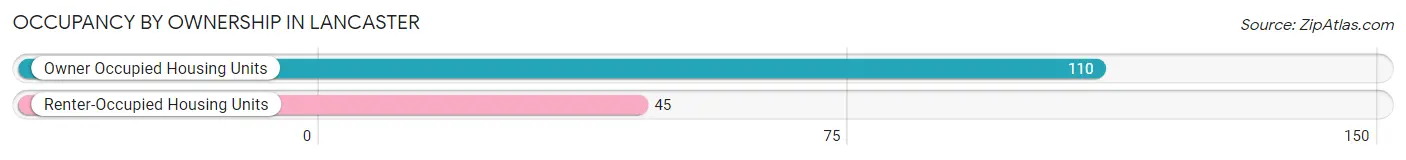
| Occupancy | # Housing Units | % Housing Units |
| Owner Occupied Housing Units | 110 | 71.0% |
| Renter-Occupied Housing Units | 45 | 29.0% |
| Total Occupied Housing Units | 155 | 100.0% |
Occupancy by Household Size in Lancaster
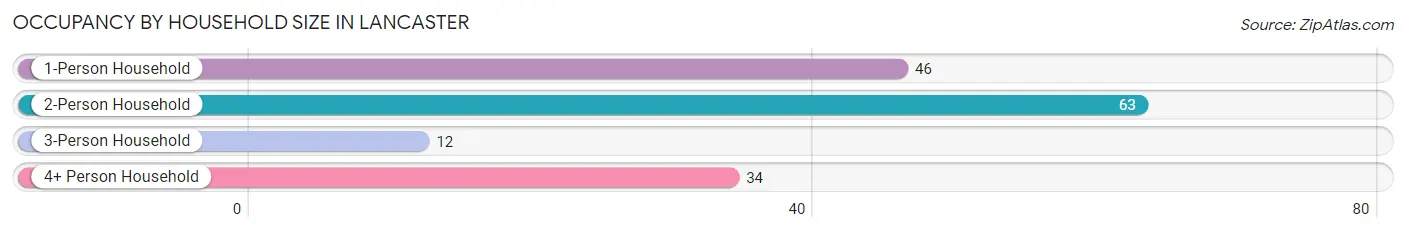
| Household Size | # Housing Units | % Housing Units |
| 1-Person Household | 46 | 29.7% |
| 2-Person Household | 63 | 40.6% |
| 3-Person Household | 12 | 7.7% |
| 4+ Person Household | 34 | 21.9% |
| Total Housing Units | 155 | 100.0% |
Occupancy by Ownership by Household Size in Lancaster
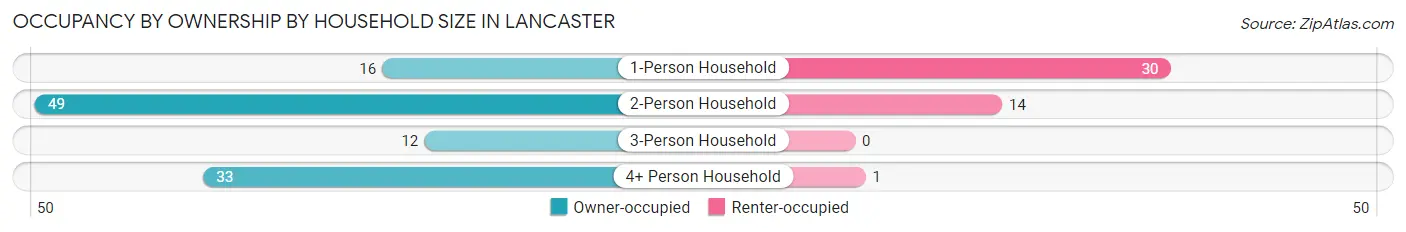
| Household Size | Owner-occupied | Renter-occupied |
| 1-Person Household | 16 (34.8%) | 30 (65.2%) |
| 2-Person Household | 49 (77.8%) | 14 (22.2%) |
| 3-Person Household | 12 (100.0%) | 0 (0.0%) |
| 4+ Person Household | 33 (97.1%) | 1 (2.9%) |
| Total Housing Units | 110 (71.0%) | 45 (29.0%) |
Occupancy by Educational Attainment in Lancaster
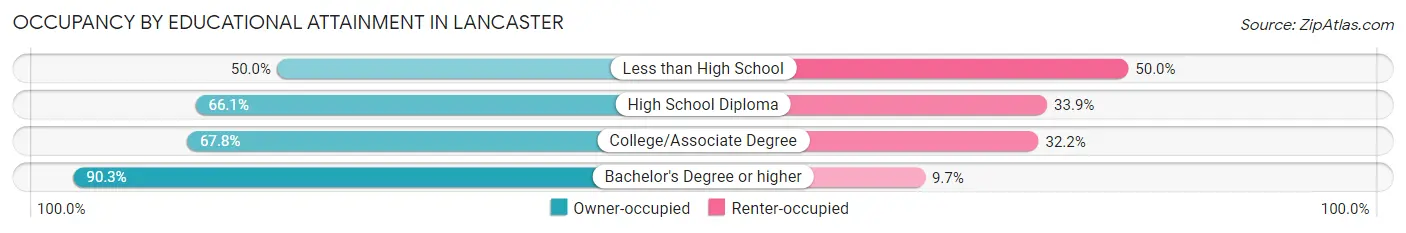
| Household Size | Owner-occupied | Renter-occupied |
| Less than High School | 3 (50.0%) | 3 (50.0%) |
| High School Diploma | 39 (66.1%) | 20 (33.9%) |
| College/Associate Degree | 40 (67.8%) | 19 (32.2%) |
| Bachelor's Degree or higher | 28 (90.3%) | 3 (9.7%) |
Occupancy by Age of Householder in Lancaster
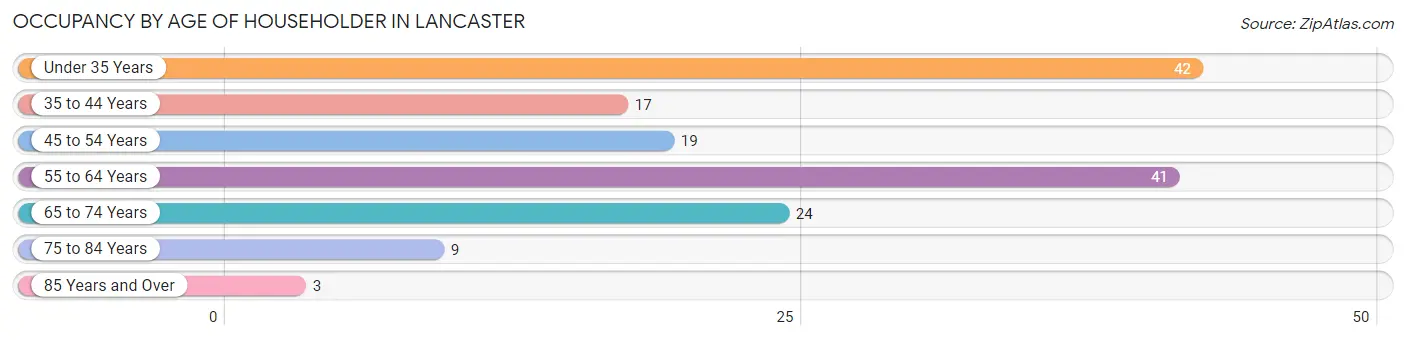
| Age Bracket | # Households | % Households |
| Under 35 Years | 42 | 27.1% |
| 35 to 44 Years | 17 | 11.0% |
| 45 to 54 Years | 19 | 12.3% |
| 55 to 64 Years | 41 | 26.5% |
| 65 to 74 Years | 24 | 15.5% |
| 75 to 84 Years | 9 | 5.8% |
| 85 Years and Over | 3 | 1.9% |
| Total | 155 | 100.0% |
Housing Finances in Lancaster
Median Income by Occupancy in Lancaster
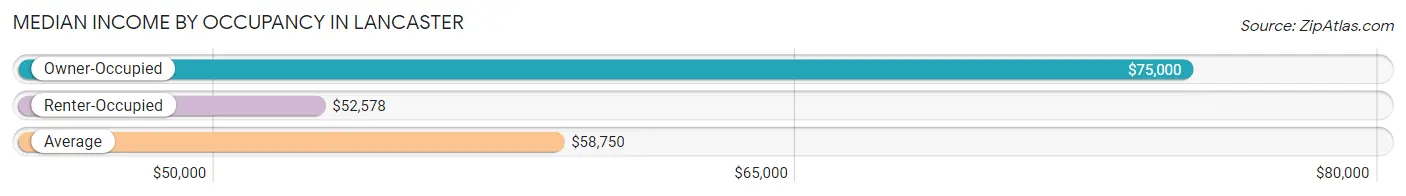
| Occupancy Type | # Households | Median Income |
| Owner-Occupied | 110 (71.0%) | $75,000 |
| Renter-Occupied | 45 (29.0%) | $52,578 |
| Average | 155 (100.0%) | $58,750 |
Occupancy by Householder Income Bracket in Lancaster
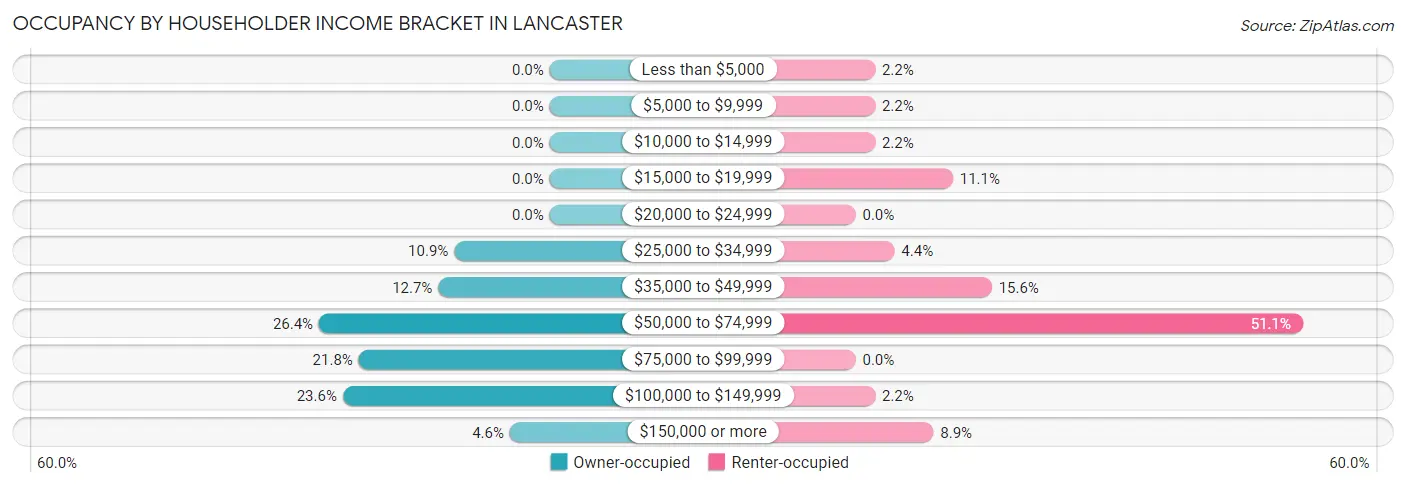
| Income Bracket | Owner-occupied | Renter-occupied |
| Less than $5,000 | 0 (0.0%) | 1 (2.2%) |
| $5,000 to $9,999 | 0 (0.0%) | 1 (2.2%) |
| $10,000 to $14,999 | 0 (0.0%) | 1 (2.2%) |
| $15,000 to $19,999 | 0 (0.0%) | 5 (11.1%) |
| $20,000 to $24,999 | 0 (0.0%) | 0 (0.0%) |
| $25,000 to $34,999 | 12 (10.9%) | 2 (4.4%) |
| $35,000 to $49,999 | 14 (12.7%) | 7 (15.6%) |
| $50,000 to $74,999 | 29 (26.4%) | 23 (51.1%) |
| $75,000 to $99,999 | 24 (21.8%) | 0 (0.0%) |
| $100,000 to $149,999 | 26 (23.6%) | 1 (2.2%) |
| $150,000 or more | 5 (4.5%) | 4 (8.9%) |
| Total | 110 (100.0%) | 45 (100.0%) |
Monthly Housing Cost Tiers in Lancaster
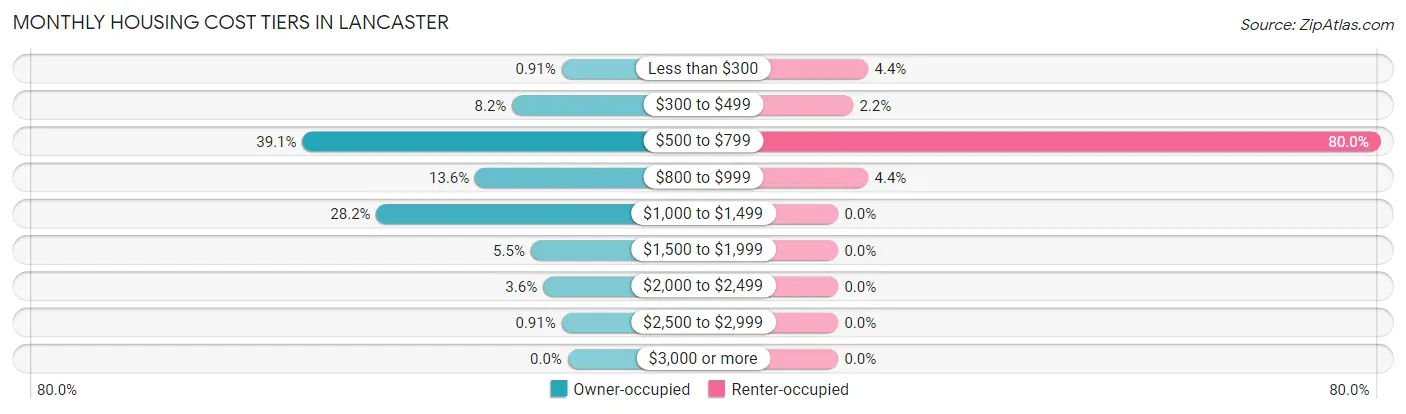
| Monthly Cost | Owner-occupied | Renter-occupied |
| Less than $300 | 1 (0.9%) | 2 (4.4%) |
| $300 to $499 | 9 (8.2%) | 1 (2.2%) |
| $500 to $799 | 43 (39.1%) | 36 (80.0%) |
| $800 to $999 | 15 (13.6%) | 2 (4.4%) |
| $1,000 to $1,499 | 31 (28.2%) | 0 (0.0%) |
| $1,500 to $1,999 | 6 (5.4%) | 0 (0.0%) |
| $2,000 to $2,499 | 4 (3.6%) | 0 (0.0%) |
| $2,500 to $2,999 | 1 (0.9%) | 0 (0.0%) |
| $3,000 or more | 0 (0.0%) | 0 (0.0%) |
| Total | 110 (100.0%) | 45 (100.0%) |
Physical Housing Characteristics in Lancaster
Housing Structures in Lancaster
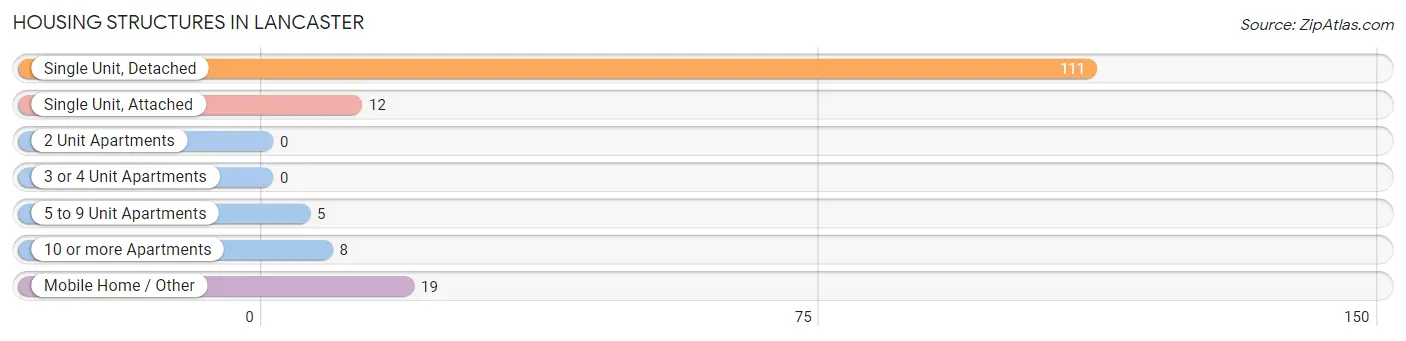
| Structure Type | # Housing Units | % Housing Units |
| Single Unit, Detached | 111 | 71.6% |
| Single Unit, Attached | 12 | 7.7% |
| 2 Unit Apartments | 0 | 0.0% |
| 3 or 4 Unit Apartments | 0 | 0.0% |
| 5 to 9 Unit Apartments | 5 | 3.2% |
| 10 or more Apartments | 8 | 5.2% |
| Mobile Home / Other | 19 | 12.3% |
| Total | 155 | 100.0% |
Housing Structures by Occupancy in Lancaster
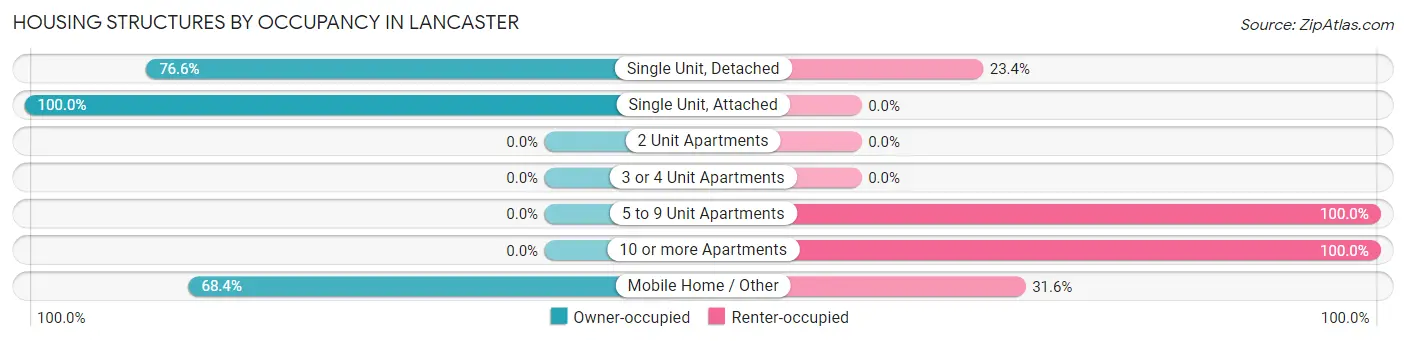
| Structure Type | Owner-occupied | Renter-occupied |
| Single Unit, Detached | 85 (76.6%) | 26 (23.4%) |
| Single Unit, Attached | 12 (100.0%) | 0 (0.0%) |
| 2 Unit Apartments | 0 (0.0%) | 0 (0.0%) |
| 3 or 4 Unit Apartments | 0 (0.0%) | 0 (0.0%) |
| 5 to 9 Unit Apartments | 0 (0.0%) | 5 (100.0%) |
| 10 or more Apartments | 0 (0.0%) | 8 (100.0%) |
| Mobile Home / Other | 13 (68.4%) | 6 (31.6%) |
| Total | 110 (71.0%) | 45 (29.0%) |
Housing Structures by Number of Rooms in Lancaster
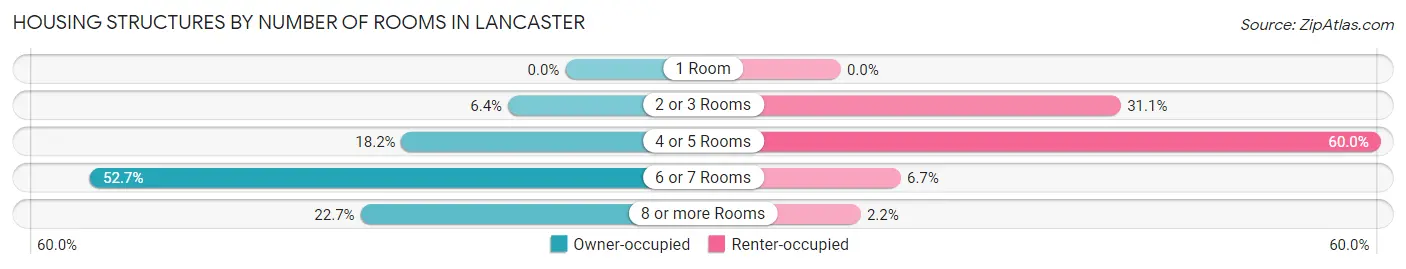
| Number of Rooms | Owner-occupied | Renter-occupied |
| 1 Room | 0 (0.0%) | 0 (0.0%) |
| 2 or 3 Rooms | 7 (6.4%) | 14 (31.1%) |
| 4 or 5 Rooms | 20 (18.2%) | 27 (60.0%) |
| 6 or 7 Rooms | 58 (52.7%) | 3 (6.7%) |
| 8 or more Rooms | 25 (22.7%) | 1 (2.2%) |
| Total | 110 (100.0%) | 45 (100.0%) |
Housing Structure by Heating Type in Lancaster
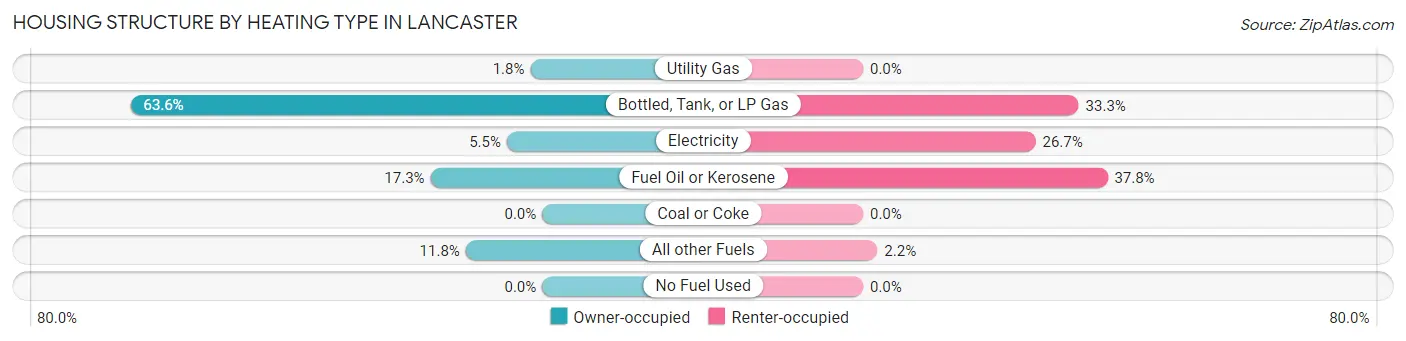
| Heating Type | Owner-occupied | Renter-occupied |
| Utility Gas | 2 (1.8%) | 0 (0.0%) |
| Bottled, Tank, or LP Gas | 70 (63.6%) | 15 (33.3%) |
| Electricity | 6 (5.4%) | 12 (26.7%) |
| Fuel Oil or Kerosene | 19 (17.3%) | 17 (37.8%) |
| Coal or Coke | 0 (0.0%) | 0 (0.0%) |
| All other Fuels | 13 (11.8%) | 1 (2.2%) |
| No Fuel Used | 0 (0.0%) | 0 (0.0%) |
| Total | 110 (100.0%) | 45 (100.0%) |
Household Vehicle Usage in Lancaster
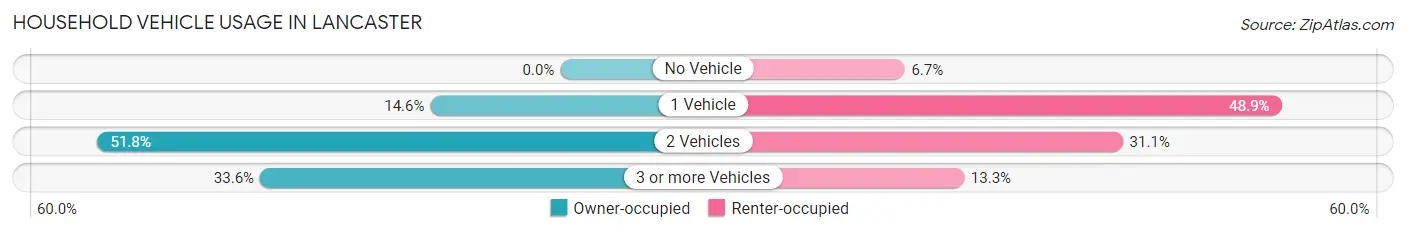
| Vehicles per Household | Owner-occupied | Renter-occupied |
| No Vehicle | 0 (0.0%) | 3 (6.7%) |
| 1 Vehicle | 16 (14.5%) | 22 (48.9%) |
| 2 Vehicles | 57 (51.8%) | 14 (31.1%) |
| 3 or more Vehicles | 37 (33.6%) | 6 (13.3%) |
| Total | 110 (100.0%) | 45 (100.0%) |
Real Estate & Mortgages in Lancaster
Real Estate and Mortgage Overview in Lancaster
| Characteristic | Without Mortgage | With Mortgage |
| Housing Units | 58 | 52 |
| Median Property Value | - | - |
| Median Household Income | $78,750 | $3 |
| Monthly Housing Costs | $625 | $0 |
| Real Estate Taxes | $1,725 | $0 |
Property Value by Mortgage Status in Lancaster
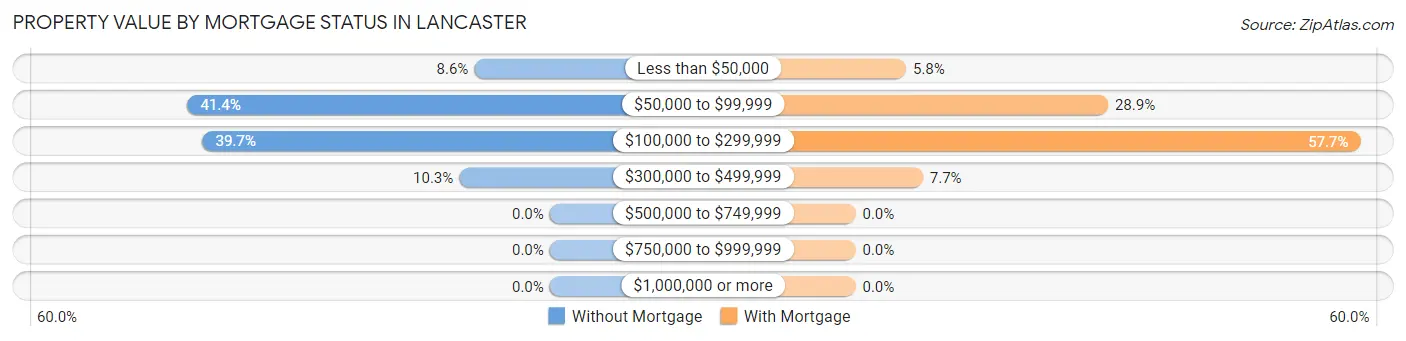
| Property Value | Without Mortgage | With Mortgage |
| Less than $50,000 | 5 (8.6%) | 3 (5.8%) |
| $50,000 to $99,999 | 24 (41.4%) | 15 (28.8%) |
| $100,000 to $299,999 | 23 (39.7%) | 30 (57.7%) |
| $300,000 to $499,999 | 6 (10.3%) | 4 (7.7%) |
| $500,000 to $749,999 | 0 (0.0%) | 0 (0.0%) |
| $750,000 to $999,999 | 0 (0.0%) | 0 (0.0%) |
| $1,000,000 or more | 0 (0.0%) | 0 (0.0%) |
| Total | 58 (100.0%) | 52 (100.0%) |
Household Income by Mortgage Status in Lancaster
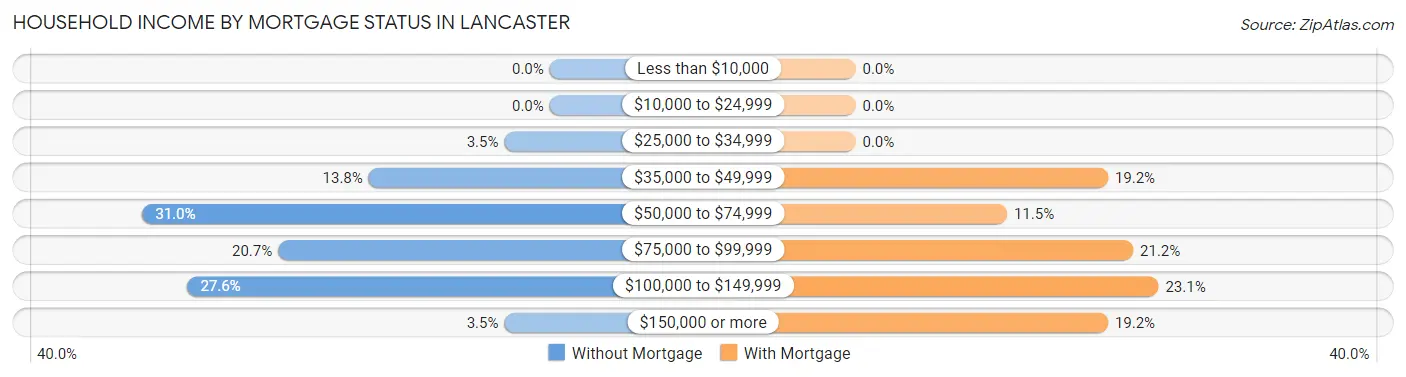
| Household Income | Without Mortgage | With Mortgage |
| Less than $10,000 | 0 (0.0%) | 0 (0.0%) |
| $10,000 to $24,999 | 0 (0.0%) | 0 (0.0%) |
| $25,000 to $34,999 | 2 (3.5%) | 0 (0.0%) |
| $35,000 to $49,999 | 8 (13.8%) | 10 (19.2%) |
| $50,000 to $74,999 | 18 (31.0%) | 6 (11.5%) |
| $75,000 to $99,999 | 12 (20.7%) | 11 (21.1%) |
| $100,000 to $149,999 | 16 (27.6%) | 12 (23.1%) |
| $150,000 or more | 2 (3.5%) | 10 (19.2%) |
| Total | 58 (100.0%) | 52 (100.0%) |
Property Value to Household Income Ratio in Lancaster
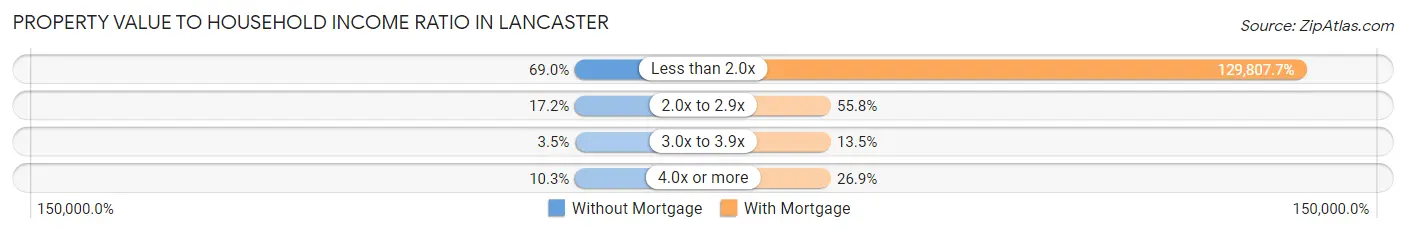
| Value-to-Income Ratio | Without Mortgage | With Mortgage |
| Less than 2.0x | 40 (69.0%) | 67,500 (129,807.7%) |
| 2.0x to 2.9x | 10 (17.2%) | 29 (55.8%) |
| 3.0x to 3.9x | 2 (3.5%) | 7 (13.5%) |
| 4.0x or more | 6 (10.3%) | 14 (26.9%) |
| Total | 58 (100.0%) | 52 (100.0%) |
Real Estate Taxes by Mortgage Status in Lancaster
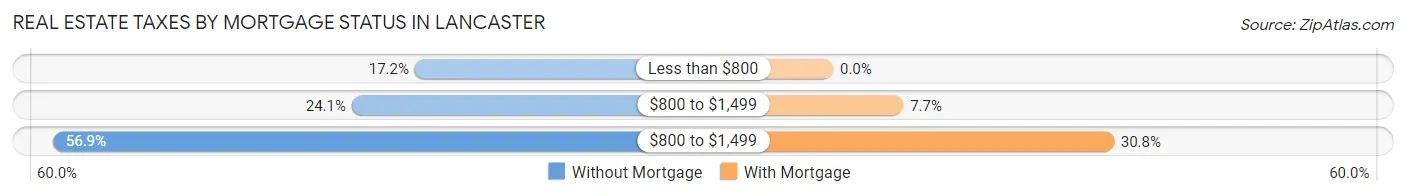
| Property Taxes | Without Mortgage | With Mortgage |
| Less than $800 | 10 (17.2%) | 0 (0.0%) |
| $800 to $1,499 | 14 (24.1%) | 4 (7.7%) |
| $800 to $1,499 | 33 (56.9%) | 16 (30.8%) |
| Total | 58 (100.0%) | 52 (100.0%) |
Health & Disability in Lancaster
Health Insurance Coverage by Age in Lancaster
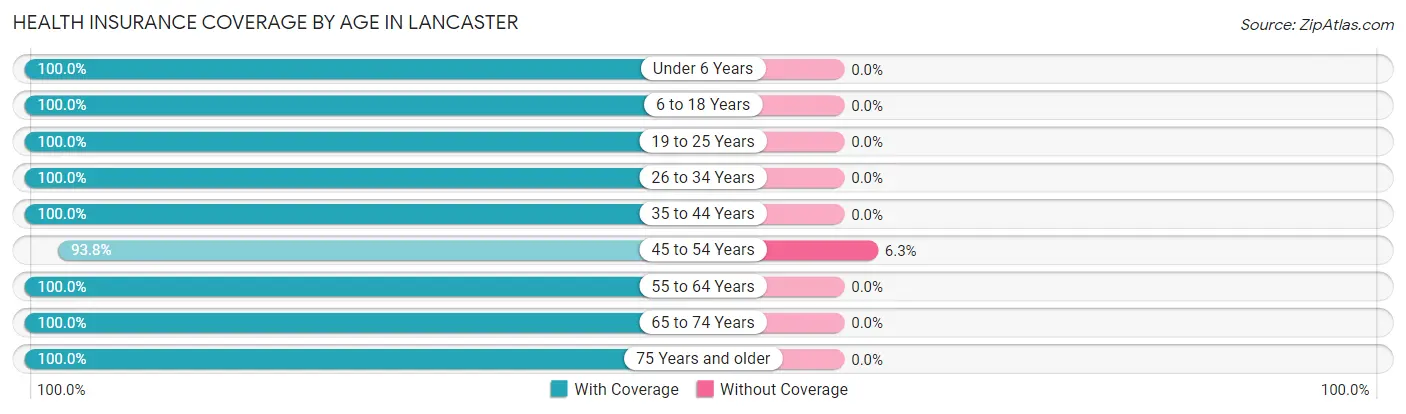
| Age Bracket | With Coverage | Without Coverage |
| Under 6 Years | 25 (100.0%) | 0 (0.0%) |
| 6 to 18 Years | 69 (100.0%) | 0 (0.0%) |
| 19 to 25 Years | 40 (100.0%) | 0 (0.0%) |
| 26 to 34 Years | 21 (100.0%) | 0 (0.0%) |
| 35 to 44 Years | 31 (100.0%) | 0 (0.0%) |
| 45 to 54 Years | 30 (93.8%) | 2 (6.2%) |
| 55 to 64 Years | 67 (100.0%) | 0 (0.0%) |
| 65 to 74 Years | 52 (100.0%) | 0 (0.0%) |
| 75 Years and older | 16 (100.0%) | 0 (0.0%) |
| Total | 351 (99.4%) | 2 (0.6%) |
Health Insurance Coverage by Citizenship Status in Lancaster
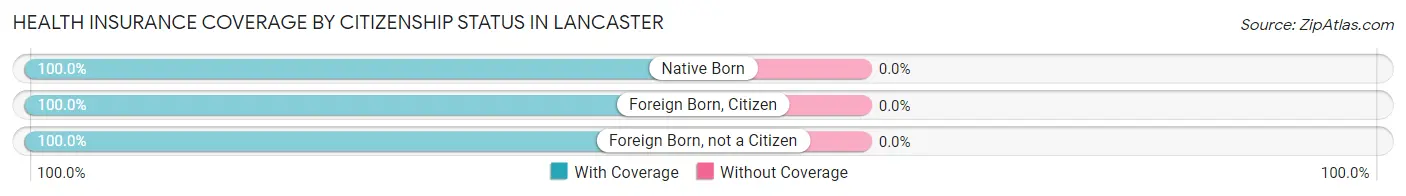
| Citizenship Status | With Coverage | Without Coverage |
| Native Born | 25 (100.0%) | 0 (0.0%) |
| Foreign Born, Citizen | 69 (100.0%) | 0 (0.0%) |
| Foreign Born, not a Citizen | 40 (100.0%) | 0 (0.0%) |
Health Insurance Coverage by Household Income in Lancaster
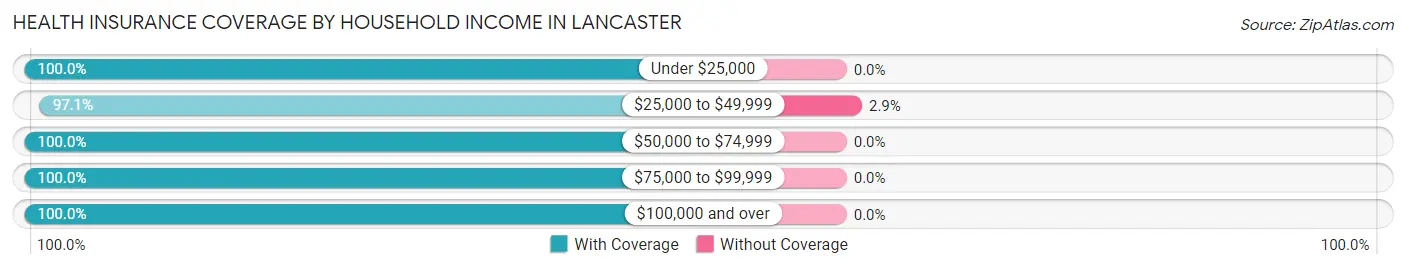
| Household Income | With Coverage | Without Coverage |
| Under $25,000 | 8 (100.0%) | 0 (0.0%) |
| $25,000 to $49,999 | 68 (97.1%) | 2 (2.9%) |
| $50,000 to $74,999 | 85 (100.0%) | 0 (0.0%) |
| $75,000 to $99,999 | 68 (100.0%) | 0 (0.0%) |
| $100,000 and over | 122 (100.0%) | 0 (0.0%) |
Public vs Private Health Insurance Coverage by Age in Lancaster
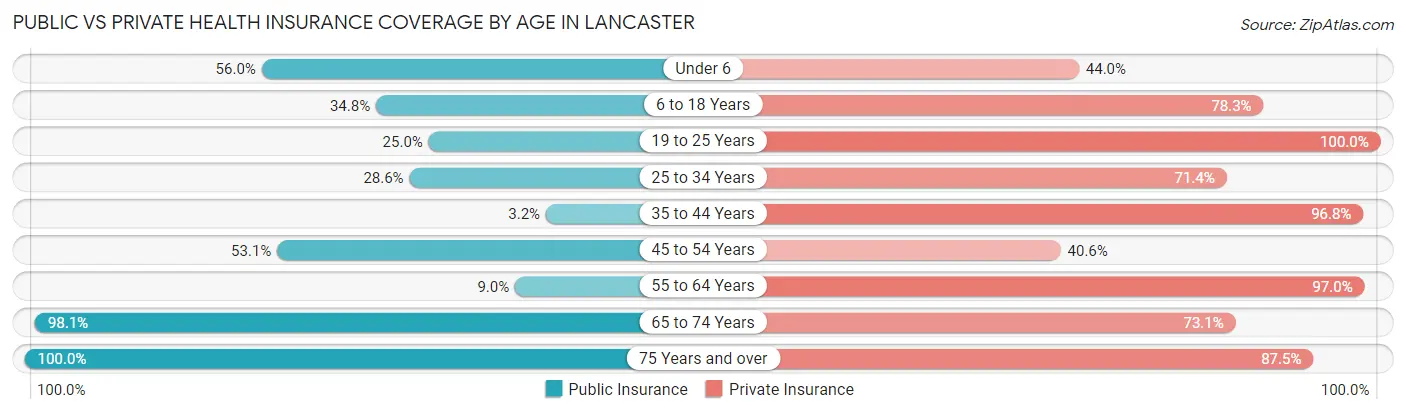
| Age Bracket | Public Insurance | Private Insurance |
| Under 6 | 14 (56.0%) | 11 (44.0%) |
| 6 to 18 Years | 24 (34.8%) | 54 (78.3%) |
| 19 to 25 Years | 10 (25.0%) | 40 (100.0%) |
| 25 to 34 Years | 6 (28.6%) | 15 (71.4%) |
| 35 to 44 Years | 1 (3.2%) | 30 (96.8%) |
| 45 to 54 Years | 17 (53.1%) | 13 (40.6%) |
| 55 to 64 Years | 6 (9.0%) | 65 (97.0%) |
| 65 to 74 Years | 51 (98.1%) | 38 (73.1%) |
| 75 Years and over | 16 (100.0%) | 14 (87.5%) |
| Total | 145 (41.1%) | 280 (79.3%) |
Disability Status by Sex by Age in Lancaster
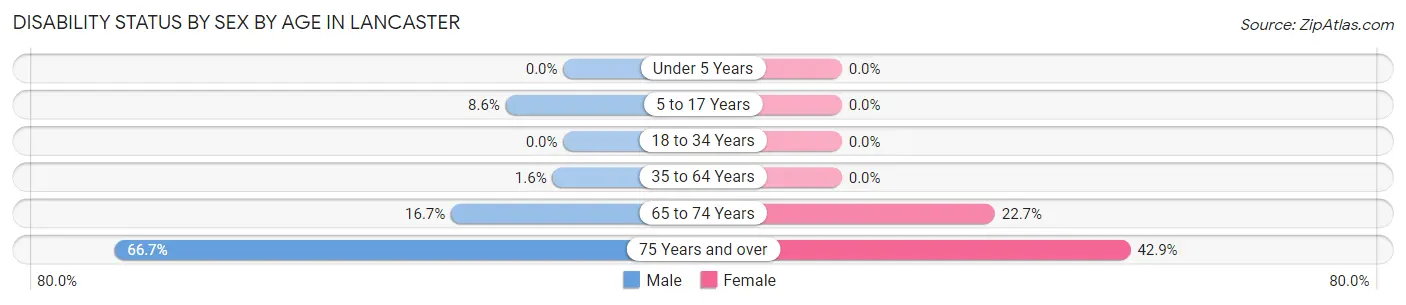
| Age Bracket | Male | Female |
| Under 5 Years | 0 (0.0%) | 0 (0.0%) |
| 5 to 17 Years | 3 (8.6%) | 0 (0.0%) |
| 18 to 34 Years | 0 (0.0%) | 0 (0.0%) |
| 35 to 64 Years | 1 (1.6%) | 0 (0.0%) |
| 65 to 74 Years | 5 (16.7%) | 5 (22.7%) |
| 75 Years and over | 6 (66.7%) | 3 (42.9%) |
Disability Class by Sex by Age in Lancaster
Disability Class: Hearing Difficulty
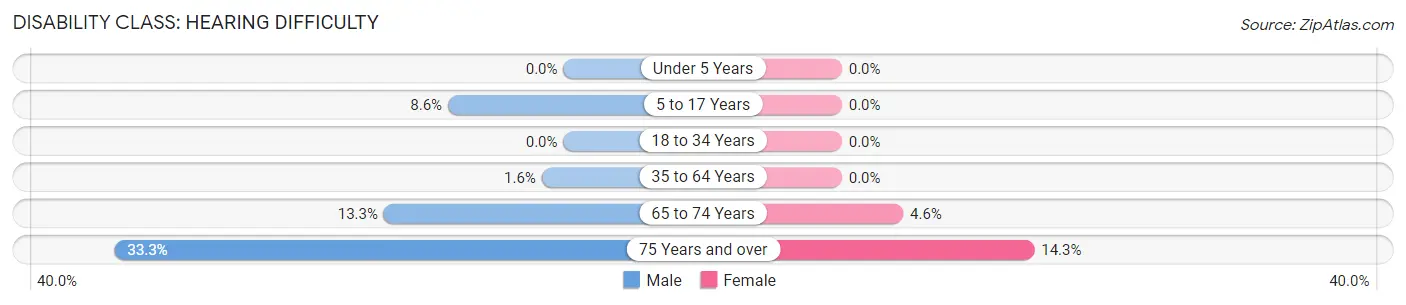
| Age Bracket | Male | Female |
| Under 5 Years | 0 (0.0%) | 0 (0.0%) |
| 5 to 17 Years | 3 (8.6%) | 0 (0.0%) |
| 18 to 34 Years | 0 (0.0%) | 0 (0.0%) |
| 35 to 64 Years | 1 (1.6%) | 0 (0.0%) |
| 65 to 74 Years | 4 (13.3%) | 1 (4.5%) |
| 75 Years and over | 3 (33.3%) | 1 (14.3%) |
Disability Class: Vision Difficulty
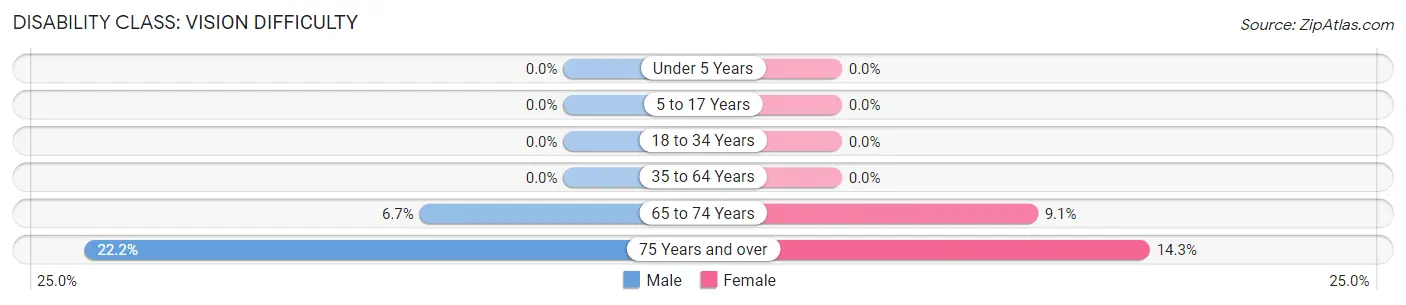
| Age Bracket | Male | Female |
| Under 5 Years | 0 (0.0%) | 0 (0.0%) |
| 5 to 17 Years | 0 (0.0%) | 0 (0.0%) |
| 18 to 34 Years | 0 (0.0%) | 0 (0.0%) |
| 35 to 64 Years | 0 (0.0%) | 0 (0.0%) |
| 65 to 74 Years | 2 (6.7%) | 2 (9.1%) |
| 75 Years and over | 2 (22.2%) | 1 (14.3%) |
Disability Class: Cognitive Difficulty
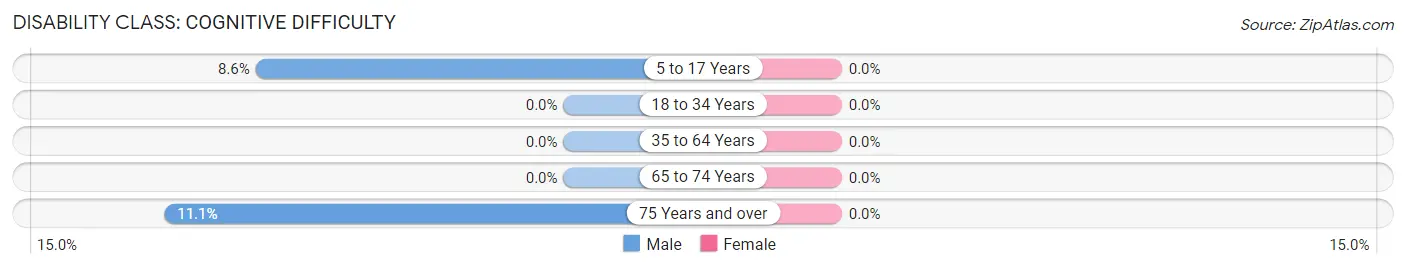
| Age Bracket | Male | Female |
| 5 to 17 Years | 3 (8.6%) | 0 (0.0%) |
| 18 to 34 Years | 0 (0.0%) | 0 (0.0%) |
| 35 to 64 Years | 0 (0.0%) | 0 (0.0%) |
| 65 to 74 Years | 0 (0.0%) | 0 (0.0%) |
| 75 Years and over | 1 (11.1%) | 0 (0.0%) |
Disability Class: Ambulatory Difficulty

| Age Bracket | Male | Female |
| 5 to 17 Years | 3 (8.6%) | 0 (0.0%) |
| 18 to 34 Years | 0 (0.0%) | 0 (0.0%) |
| 35 to 64 Years | 0 (0.0%) | 0 (0.0%) |
| 65 to 74 Years | 3 (10.0%) | 2 (9.1%) |
| 75 Years and over | 3 (33.3%) | 2 (28.6%) |
Disability Class: Self-Care Difficulty
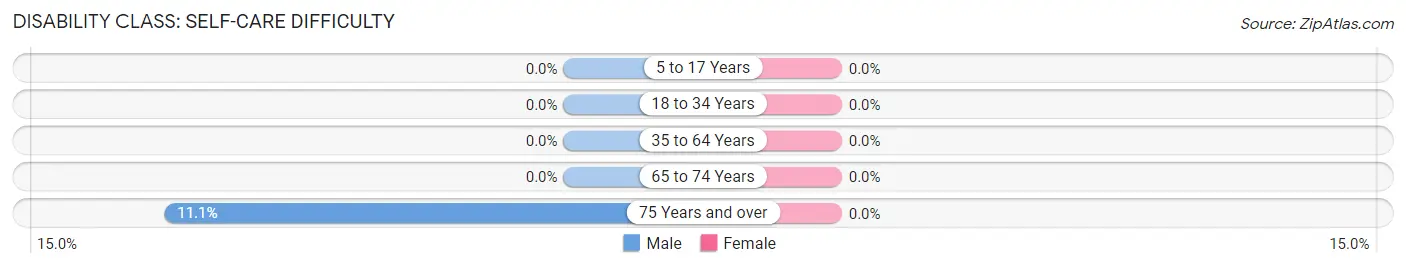
| Age Bracket | Male | Female |
| 5 to 17 Years | 0 (0.0%) | 0 (0.0%) |
| 18 to 34 Years | 0 (0.0%) | 0 (0.0%) |
| 35 to 64 Years | 0 (0.0%) | 0 (0.0%) |
| 65 to 74 Years | 0 (0.0%) | 0 (0.0%) |
| 75 Years and over | 1 (11.1%) | 0 (0.0%) |
Technology Access in Lancaster
Computing Device Access in Lancaster
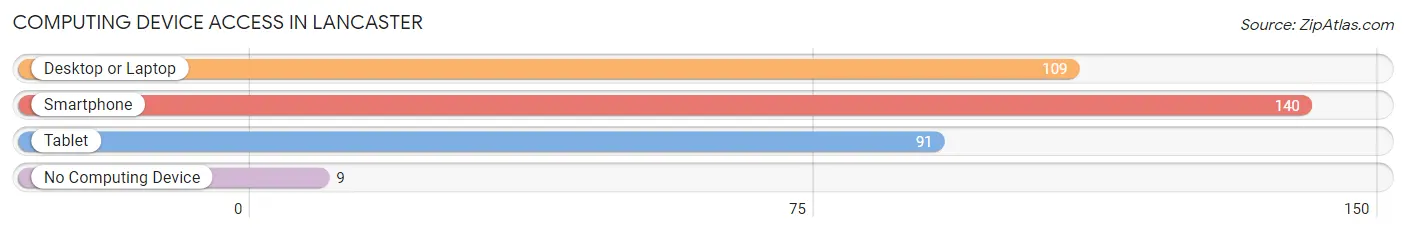
| Device Type | # Households | % Households |
| Desktop or Laptop | 109 | 70.3% |
| Smartphone | 140 | 90.3% |
| Tablet | 91 | 58.7% |
| No Computing Device | 9 | 5.8% |
| Total | 155 | 100.0% |
Internet Access in Lancaster
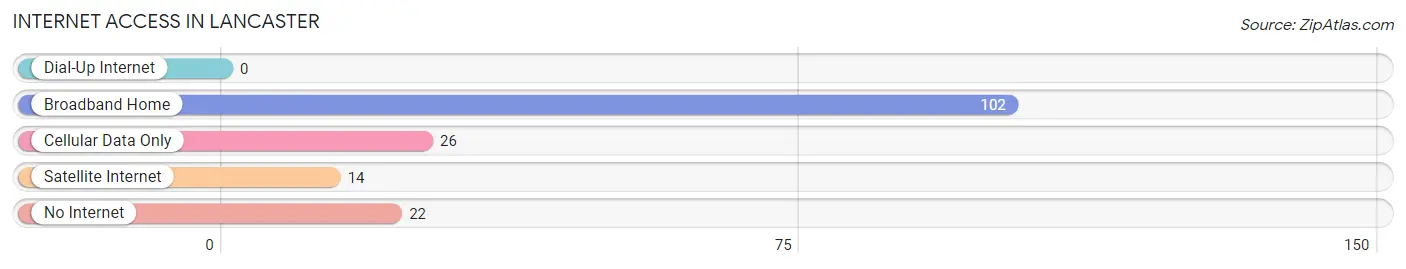
| Internet Type | # Households | % Households |
| Dial-Up Internet | 0 | 0.0% |
| Broadband Home | 102 | 65.8% |
| Cellular Data Only | 26 | 16.8% |
| Satellite Internet | 14 | 9.0% |
| No Internet | 22 | 14.2% |
| Total | 155 | 100.0% |
Lancaster Summary
Lancaster, Minnesota is a small city located in the southeastern corner of the state, in the heart of the Driftless Area. The city is situated on the banks of the Mississippi River, and is surrounded by rolling hills and lush forests. The city is home to a population of just over 1,000 people, and is the county seat of Fillmore County.
History
The area that is now Lancaster was first settled in 1854 by a group of settlers from New York. The settlers named the area after Lancaster, New York, and the city was officially incorporated in 1856. The city was originally a farming community, and the main crops grown were wheat, oats, and corn. The city also had a thriving lumber industry, and the lumber was used to build homes and businesses in the area.
In the late 19th century, the city began to grow and develop. The railroad arrived in 1879, and the city became a major shipping hub for the region. The city also became a popular tourist destination, and many people came to the area to enjoy the natural beauty of the area.
Geography
Lancaster is located in the southeastern corner of Minnesota, in the heart of the Driftless Area. The city is situated on the banks of the Mississippi River, and is surrounded by rolling hills and lush forests. The city is located about 50 miles south of the Twin Cities, and is about a two-hour drive from Minneapolis.
The city has a total area of 1.2 square miles, all of which is land. The city has a humid continental climate, with cold winters and warm summers. The average annual temperature is around 45 degrees Fahrenheit, and the average annual precipitation is around 30 inches.
Economy
The economy of Lancaster is largely based on agriculture and tourism. The city is home to several farms, and the main crops grown are wheat, oats, and corn. The city also has a thriving lumber industry, and the lumber is used to build homes and businesses in the area.
The city is also a popular tourist destination, and many people come to the area to enjoy the natural beauty of the area. The city is home to several parks, including the Lancaster State Park, which offers camping, fishing, and hiking opportunities. The city also has several museums, including the Fillmore County Historical Society Museum, which showcases the history of the area.
Demographics
As of the 2010 census, the population of Lancaster was 1,072. The racial makeup of the city was 97.2% White, 0.7% African American, 0.2% Native American, 0.2% Asian, 0.2% from other races, and 1.7% from two or more races. Hispanic or Latino of any race were 0.7% of the population.
The median income for a household in the city was $41,250, and the median income for a family was $50,000. The per capita income for the city was $20,845. About 11.2% of families and 14.2% of the population were below the poverty line, including 18.2% of those under age 18 and 8.3% of those age 65 or over.
Common Questions
What is the Total Population of Lancaster?
Total Population of Lancaster is 353.
What is the Total Male Population of Lancaster?
Total Male Population of Lancaster is 188.
What is the Total Female Population of Lancaster?
Total Female Population of Lancaster is 165.
What is the Ratio of Males per 100 Females in Lancaster?
There are 113.94 Males per 100 Females in Lancaster.
What is the Ratio of Females per 100 Males in Lancaster?
There are 87.77 Females per 100 Males in Lancaster.
What is the Median Population Age in Lancaster?
Median Population Age in Lancaster is 42.5 Years.
What is the Average Family Size in Lancaster
Average Family Size in Lancaster is 2.8 People.
What is the Average Household Size in Lancaster
Average Household Size in Lancaster is 2.3 People.
What is Per Capita Income in Lancaster?
Per Capita income in Lancaster is $31,535.
What is the Median Family Income in Lancaster?
Median Family Income in Lancaster is $85,833.
What is the Median Household income in Lancaster?
Median Household Income in Lancaster is $58,750.
What is Income or Wage Gap in Lancaster?
Income or Wage Gap in Lancaster is 23.7%.
Women in Lancaster earn 76.2 cents for every dollar earned by a man.
What is Inequality or Gini Index in Lancaster?
Inequality or Gini Index in Lancaster is 0.30.
How Large is the Labor Force in Lancaster?
There are 165 People in the Labor Forcein in Lancaster.
What is the Percentage of People in the Labor Force in Lancaster?
62.3% of People are in the Labor Force in Lancaster.
What is the Unemployment Rate in Lancaster?
Unemployment Rate in Lancaster is 1.2%.