Lakeland Shores, MN Map & Demographics
Lakeland Shores Map
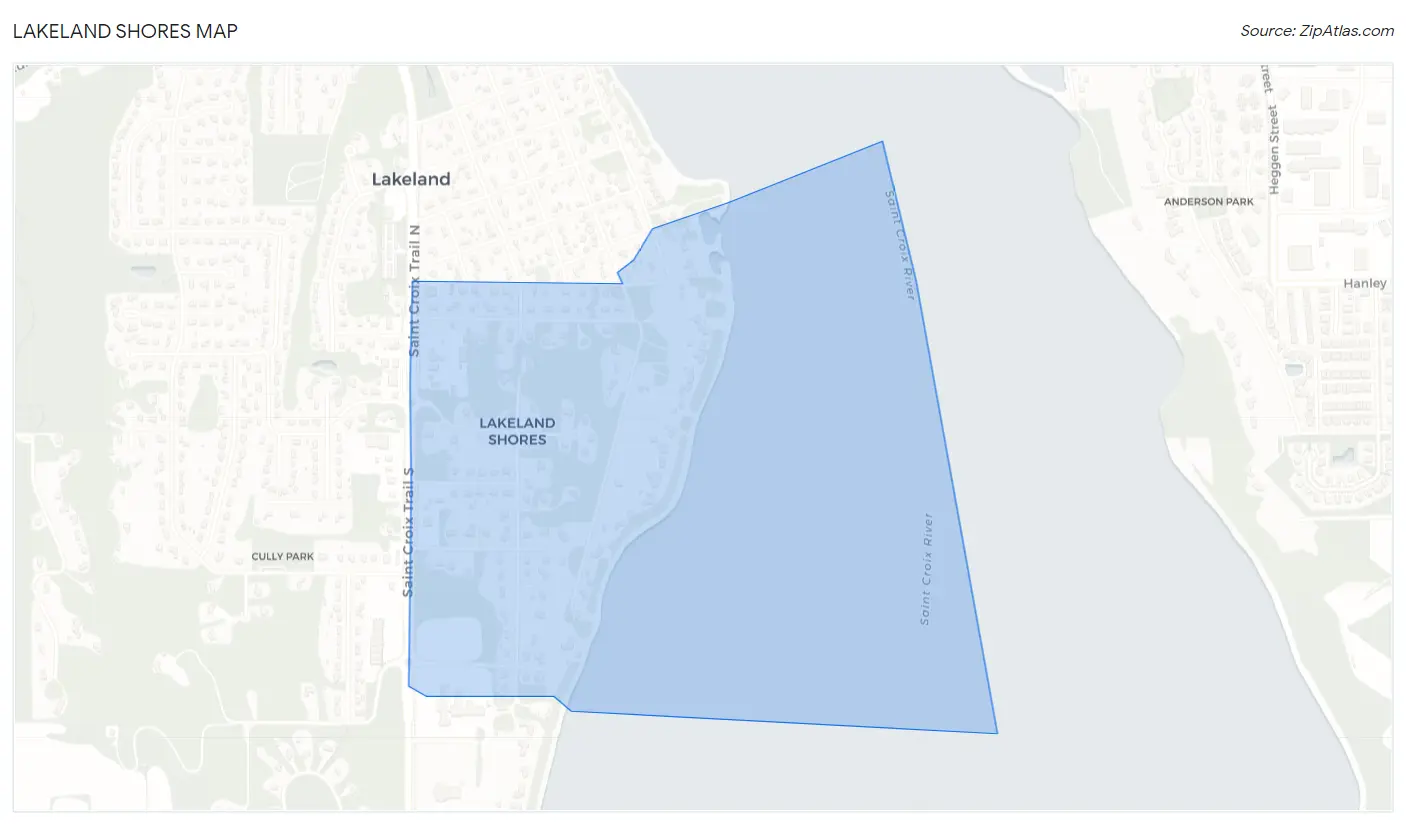
Lakeland Shores Overview
$57,057
PER CAPITA INCOME
$132,500
AVG FAMILY INCOME
$131,429
AVG HOUSEHOLD INCOME
38.5%
WAGE / INCOME GAP [ % ]
61.5¢/ $1
WAGE / INCOME GAP [ $ ]
0.39
INEQUALITY / GINI INDEX
330
TOTAL POPULATION
164
MALE POPULATION
166
FEMALE POPULATION
98.80
MALES / 100 FEMALES
101.22
FEMALES / 100 MALES
43.1
MEDIAN AGE
3.0
AVG FAMILY SIZE
2.8
AVG HOUSEHOLD SIZE
150
LABOR FORCE [ PEOPLE ]
58.4%
PERCENT IN LABOR FORCE
Lakeland Shores Area Codes
Income in Lakeland Shores
Income Overview in Lakeland Shores
Per Capita Income in Lakeland Shores is $57,057, while median incomes of families and households are $132,500 and $131,429 respectively.
| Characteristic | Number | Measure |
| Per Capita Income | 330 | $57,057 |
| Median Family Income | 98 | $132,500 |
| Mean Family Income | 98 | $156,446 |
| Median Household Income | 120 | $131,429 |
| Mean Household Income | 120 | $148,184 |
| Income Deficit | 98 | $0 |
| Wage / Income Gap (%) | 330 | 38.47% |
| Wage / Income Gap ($) | 330 | 61.53¢ per $1 |
| Gini / Inequality Index | 330 | 0.39 |
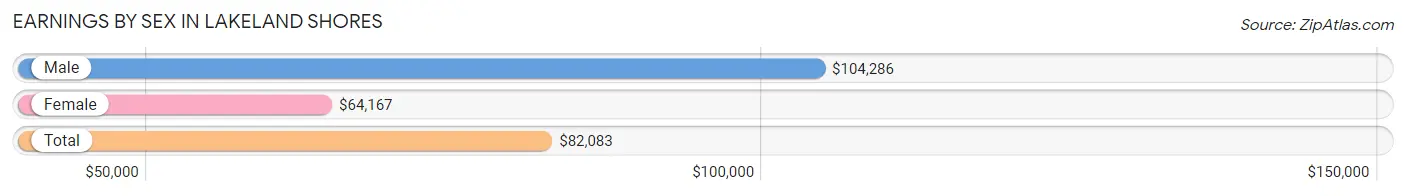
Earnings by Sex in Lakeland Shores
Average Earnings in Lakeland Shores are $82,083, $104,286 for men and $64,167 for women, a difference of 38.5%.
| Sex | Number | Average Earnings |
| Male | 88 (55.7%) | $104,286 |
| Female | 70 (44.3%) | $64,167 |
| Total | 158 (100.0%) | $82,083 |
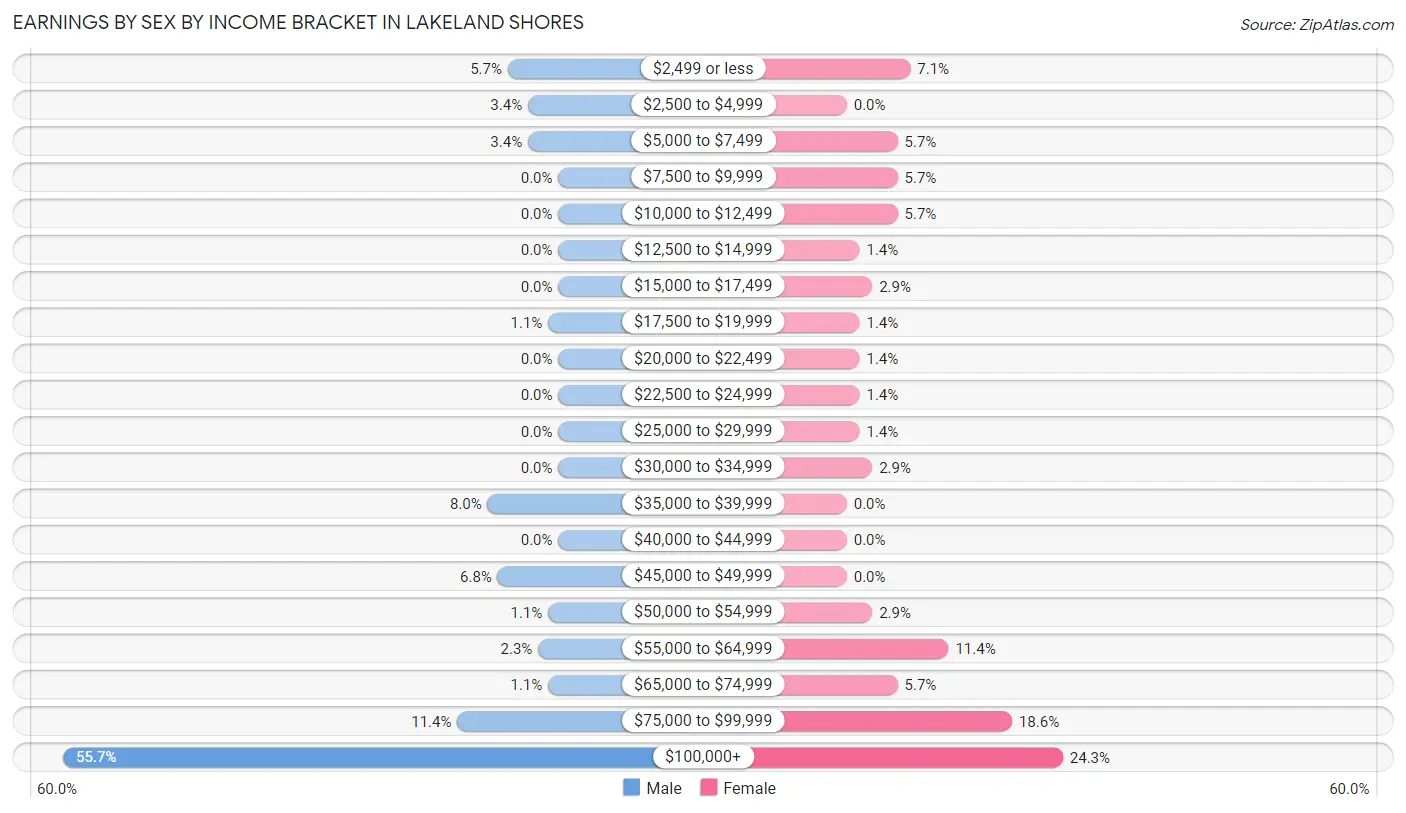
Earnings by Sex by Income Bracket in Lakeland Shores
The most common earnings brackets in Lakeland Shores are $100,000+ for men (49 | 55.7%) and $100,000+ for women (17 | 24.3%).
| Income | Male | Female |
| $2,499 or less | 5 (5.7%) | 5 (7.1%) |
| $2,500 to $4,999 | 3 (3.4%) | 0 (0.0%) |
| $5,000 to $7,499 | 3 (3.4%) | 4 (5.7%) |
| $7,500 to $9,999 | 0 (0.0%) | 4 (5.7%) |
| $10,000 to $12,499 | 0 (0.0%) | 4 (5.7%) |
| $12,500 to $14,999 | 0 (0.0%) | 1 (1.4%) |
| $15,000 to $17,499 | 0 (0.0%) | 2 (2.9%) |
| $17,500 to $19,999 | 1 (1.1%) | 1 (1.4%) |
| $20,000 to $22,499 | 0 (0.0%) | 1 (1.4%) |
| $22,500 to $24,999 | 0 (0.0%) | 1 (1.4%) |
| $25,000 to $29,999 | 0 (0.0%) | 1 (1.4%) |
| $30,000 to $34,999 | 0 (0.0%) | 2 (2.9%) |
| $35,000 to $39,999 | 7 (8.0%) | 0 (0.0%) |
| $40,000 to $44,999 | 0 (0.0%) | 0 (0.0%) |
| $45,000 to $49,999 | 6 (6.8%) | 0 (0.0%) |
| $50,000 to $54,999 | 1 (1.1%) | 2 (2.9%) |
| $55,000 to $64,999 | 2 (2.3%) | 8 (11.4%) |
| $65,000 to $74,999 | 1 (1.1%) | 4 (5.7%) |
| $75,000 to $99,999 | 10 (11.4%) | 13 (18.6%) |
| $100,000+ | 49 (55.7%) | 17 (24.3%) |
| Total | 88 (100.0%) | 70 (100.0%) |
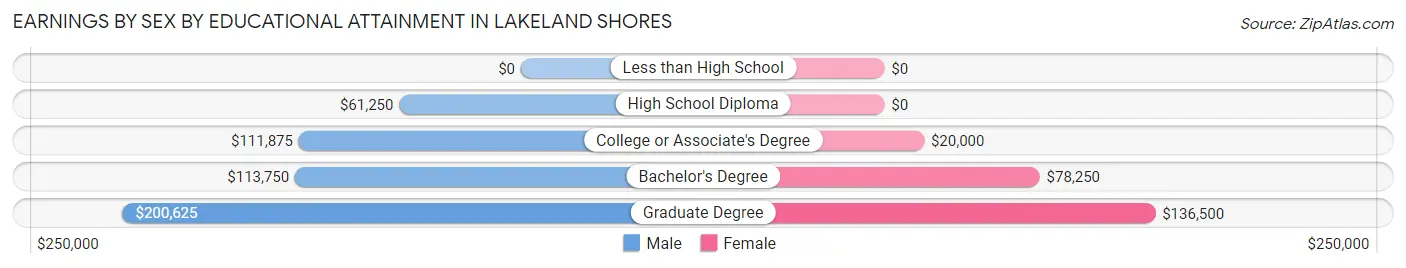
Earnings by Sex by Educational Attainment in Lakeland Shores
Average earnings in Lakeland Shores are $111,042 for men and $75,000 for women, a difference of 32.5%. Men with an educational attainment of graduate degree enjoy the highest average annual earnings of $200,625, while those with high school diploma education earn the least with $61,250. Women with an educational attainment of graduate degree earn the most with the average annual earnings of $136,500, while those with college or associate's degree education have the smallest earnings of $20,000.
| Educational Attainment | Male Income | Female Income |
| Less than High School | - | - |
| High School Diploma | $61,250 | $0 |
| College or Associate's Degree | $111,875 | $20,000 |
| Bachelor's Degree | $113,750 | $78,250 |
| Graduate Degree | $200,625 | $136,500 |
| Total | $111,042 | $75,000 |
Family Income in Lakeland Shores
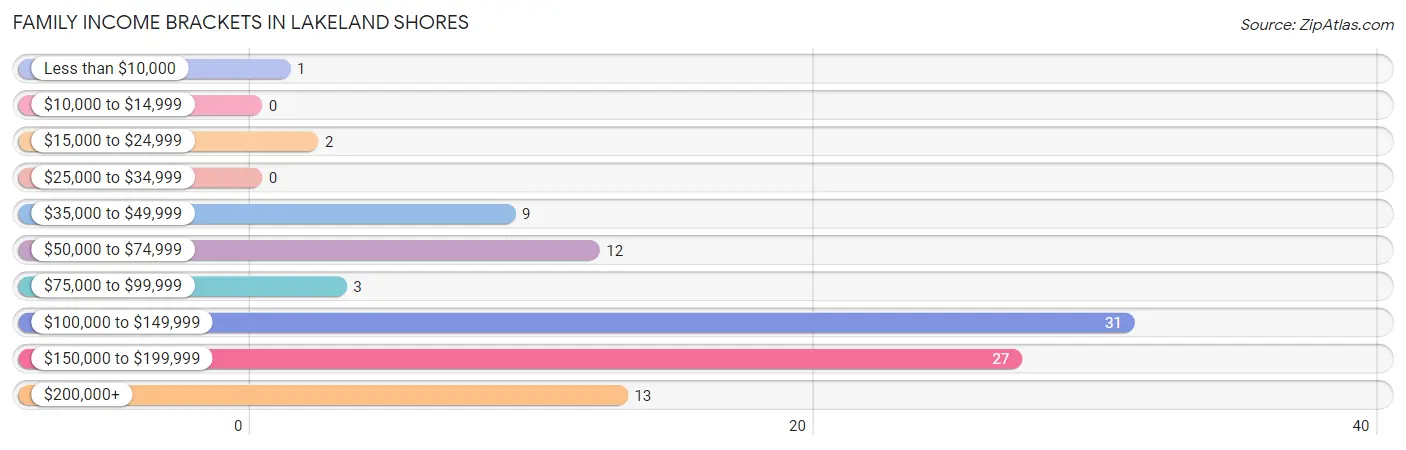
Family Income Brackets in Lakeland Shores
According to the Lakeland Shores family income data, there are 31 families falling into the $100,000 to $149,999 income range, which is the most common income bracket and makes up 31.6% of all families.
| Income Bracket | # Families | % Families |
| Less than $10,000 | 1 | 1.0% |
| $10,000 to $14,999 | 0 | 0.0% |
| $15,000 to $24,999 | 2 | 2.0% |
| $25,000 to $34,999 | 0 | 0.0% |
| $35,000 to $49,999 | 9 | 9.2% |
| $50,000 to $74,999 | 12 | 12.2% |
| $75,000 to $99,999 | 3 | 3.1% |
| $100,000 to $149,999 | 31 | 31.6% |
| $150,000 to $199,999 | 27 | 27.6% |
| $200,000+ | 13 | 13.3% |
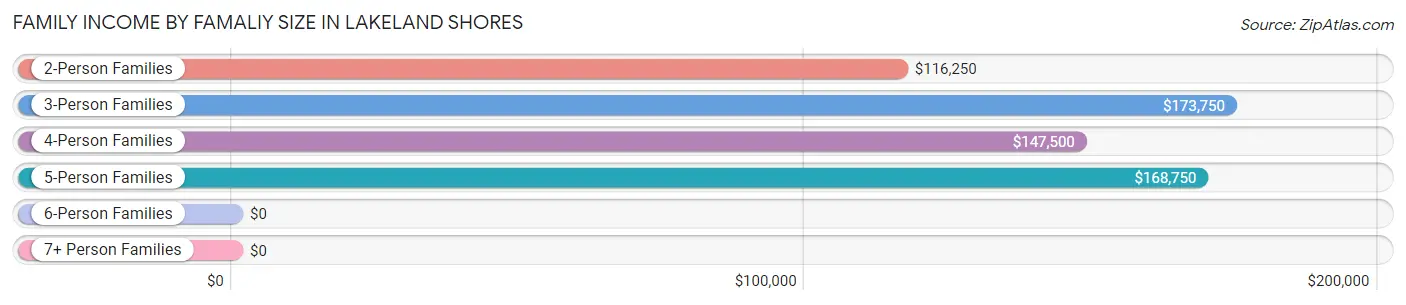
Family Income by Famaliy Size in Lakeland Shores
3-person families (15 | 15.3%) account for the highest median family income in Lakeland Shores with $173,750 per family, while 2-person families (48 | 49.0%) have the highest median income of $58,125 per family member.
| Income Bracket | # Families | Median Income |
| 2-Person Families | 48 (49.0%) | $116,250 |
| 3-Person Families | 15 (15.3%) | $173,750 |
| 4-Person Families | 20 (20.4%) | $147,500 |
| 5-Person Families | 12 (12.2%) | $168,750 |
| 6-Person Families | 1 (1.0%) | $0 |
| 7+ Person Families | 2 (2.0%) | $0 |
| Total | 98 (100.0%) | $132,500 |
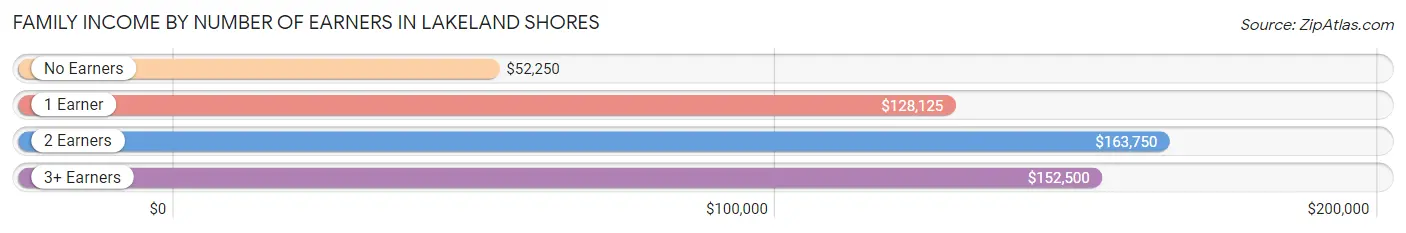
Family Income by Number of Earners in Lakeland Shores
The median family income in Lakeland Shores is $132,500, with families comprising 2 earners (47) having the highest median family income of $163,750, while families with no earners (21) have the lowest median family income of $52,250, accounting for 48.0% and 21.4% of families, respectively.
| Number of Earners | # Families | Median Income |
| No Earners | 21 (21.4%) | $52,250 |
| 1 Earner | 24 (24.5%) | $128,125 |
| 2 Earners | 47 (48.0%) | $163,750 |
| 3+ Earners | 6 (6.1%) | $152,500 |
| Total | 98 (100.0%) | $132,500 |
Household Income in Lakeland Shores
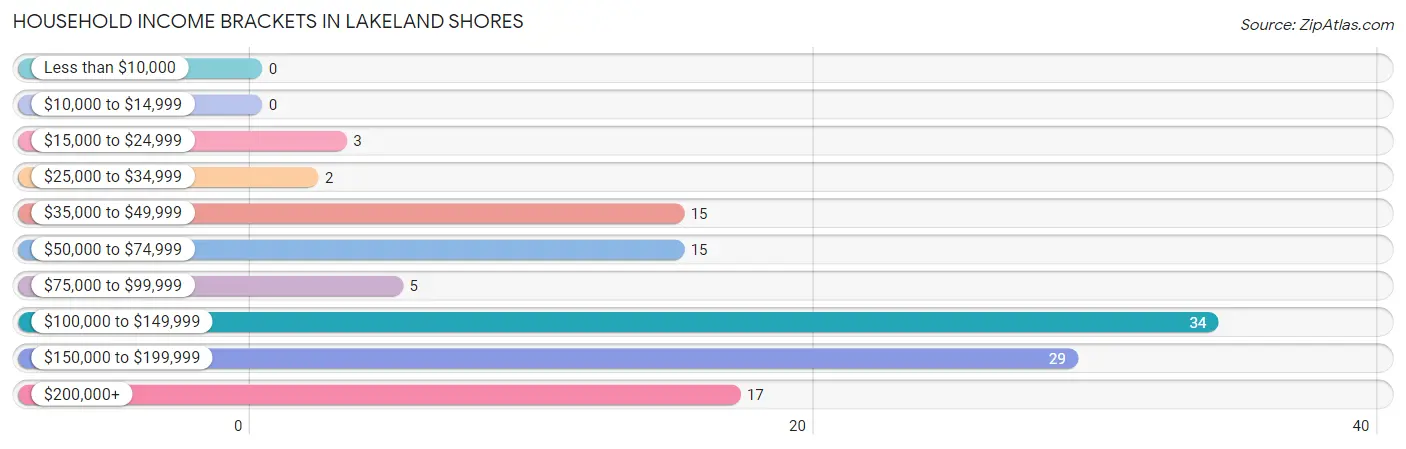
Household Income Brackets in Lakeland Shores
With 34 households falling in the category, the $100,000 to $149,999 income range is the most frequent in Lakeland Shores, accounting for 28.3% of all households.
| Income Bracket | # Households | % Households |
| Less than $10,000 | 0 | 0.0% |
| $10,000 to $14,999 | 0 | 0.0% |
| $15,000 to $24,999 | 3 | 2.5% |
| $25,000 to $34,999 | 2 | 1.7% |
| $35,000 to $49,999 | 15 | 12.5% |
| $50,000 to $74,999 | 15 | 12.5% |
| $75,000 to $99,999 | 5 | 4.2% |
| $100,000 to $149,999 | 34 | 28.3% |
| $150,000 to $199,999 | 29 | 24.2% |
| $200,000+ | 17 | 14.2% |
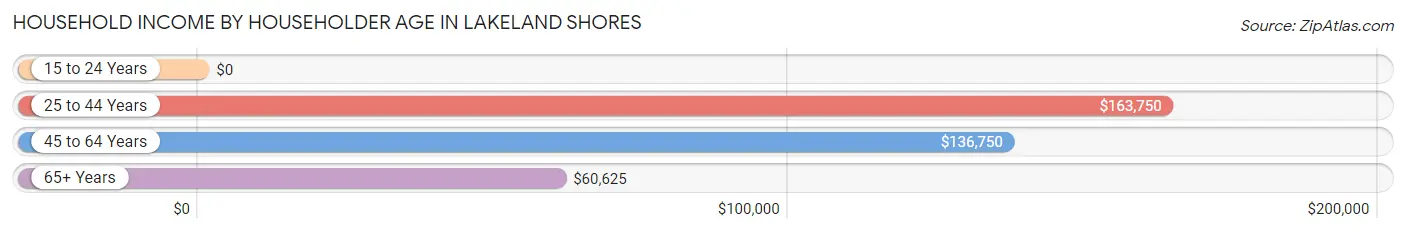
Household Income by Householder Age in Lakeland Shores
The median household income in Lakeland Shores is $131,429, with the highest median household income of $163,750 found in the 25 to 44 years age bracket for the primary householder. A total of 36 households (30.0%) fall into this category.
| Income Bracket | # Households | Median Income |
| 15 to 24 Years | 0 (0.0%) | $0 |
| 25 to 44 Years | 36 (30.0%) | $163,750 |
| 45 to 64 Years | 39 (32.5%) | $136,750 |
| 65+ Years | 45 (37.5%) | $60,625 |
| Total | 120 (100.0%) | $131,429 |
Poverty in Lakeland Shores
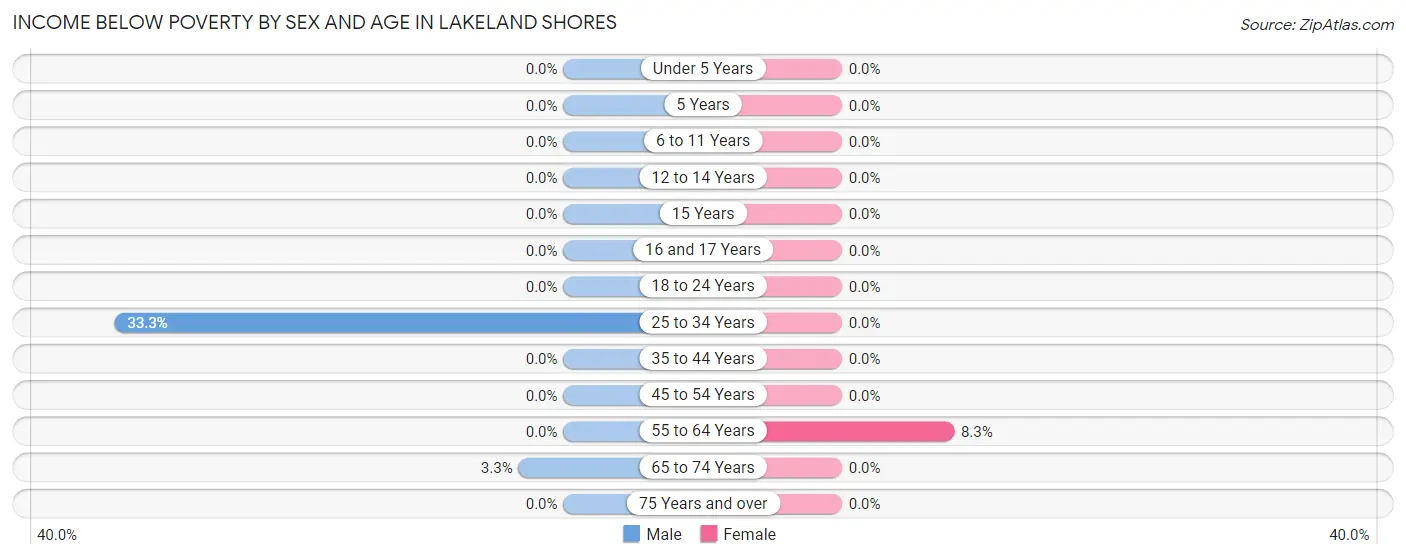
Income Below Poverty by Sex and Age in Lakeland Shores
With 3.0% poverty level for males and 1.2% for females among the residents of Lakeland Shores, 25 to 34 year old males and 55 to 64 year old females are the most vulnerable to poverty, with 4 males (33.3%) and 2 females (8.3%) in their respective age groups living below the poverty level.
| Age Bracket | Male | Female |
| Under 5 Years | 0 (0.0%) | 0 (0.0%) |
| 5 Years | 0 (0.0%) | 0 (0.0%) |
| 6 to 11 Years | 0 (0.0%) | 0 (0.0%) |
| 12 to 14 Years | 0 (0.0%) | 0 (0.0%) |
| 15 Years | 0 (0.0%) | 0 (0.0%) |
| 16 and 17 Years | 0 (0.0%) | 0 (0.0%) |
| 18 to 24 Years | 0 (0.0%) | 0 (0.0%) |
| 25 to 34 Years | 4 (33.3%) | 0 (0.0%) |
| 35 to 44 Years | 0 (0.0%) | 0 (0.0%) |
| 45 to 54 Years | 0 (0.0%) | 0 (0.0%) |
| 55 to 64 Years | 0 (0.0%) | 2 (8.3%) |
| 65 to 74 Years | 1 (3.3%) | 0 (0.0%) |
| 75 Years and over | 0 (0.0%) | 0 (0.0%) |
| Total | 5 (3.0%) | 2 (1.2%) |
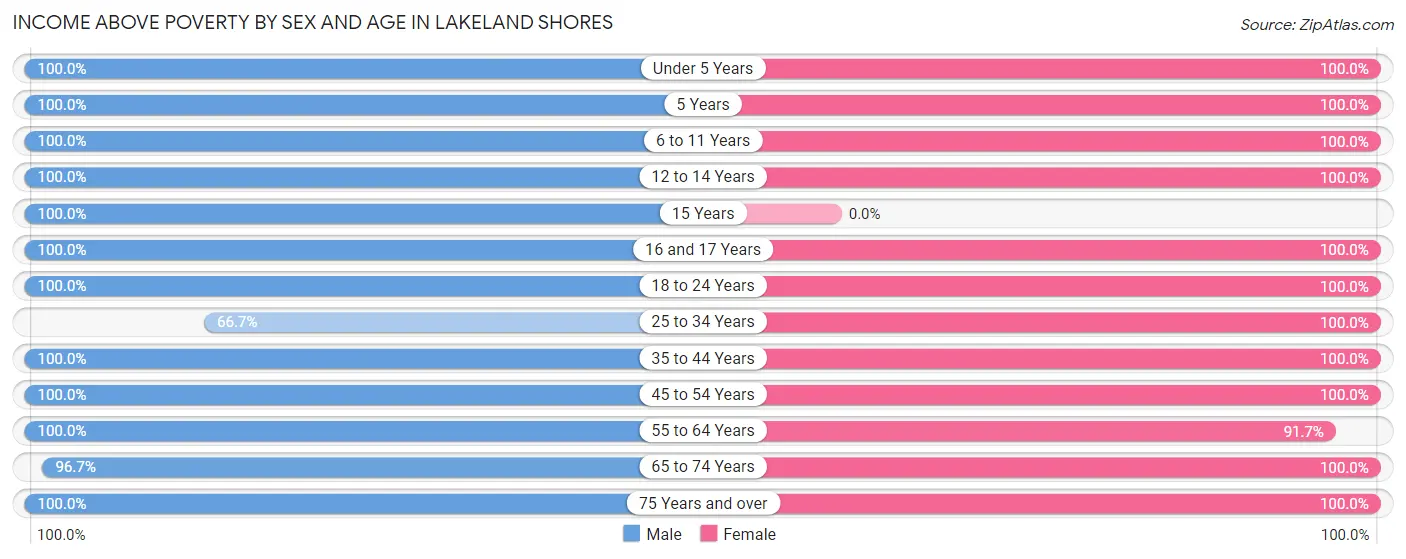
Income Above Poverty by Sex and Age in Lakeland Shores
According to the poverty statistics in Lakeland Shores, males aged under 5 years and females aged under 5 years are the age groups that are most secure financially, with 100.0% of males and 100.0% of females in these age groups living above the poverty line.
| Age Bracket | Male | Female |
| Under 5 Years | 12 (100.0%) | 8 (100.0%) |
| 5 Years | 3 (100.0%) | 2 (100.0%) |
| 6 to 11 Years | 18 (100.0%) | 19 (100.0%) |
| 12 to 14 Years | 3 (100.0%) | 5 (100.0%) |
| 15 Years | 3 (100.0%) | 0 (0.0%) |
| 16 and 17 Years | 5 (100.0%) | 7 (100.0%) |
| 18 to 24 Years | 8 (100.0%) | 8 (100.0%) |
| 25 to 34 Years | 8 (66.7%) | 16 (100.0%) |
| 35 to 44 Years | 24 (100.0%) | 22 (100.0%) |
| 45 to 54 Years | 23 (100.0%) | 19 (100.0%) |
| 55 to 64 Years | 11 (100.0%) | 22 (91.7%) |
| 65 to 74 Years | 29 (96.7%) | 26 (100.0%) |
| 75 Years and over | 12 (100.0%) | 10 (100.0%) |
| Total | 159 (97.0%) | 164 (98.8%) |
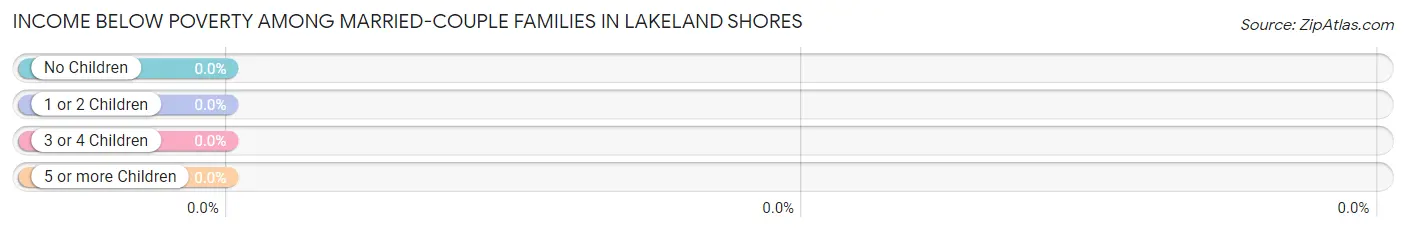
Income Below Poverty Among Married-Couple Families in Lakeland Shores
| Children | Above Poverty | Below Poverty |
| No Children | 48 (100.0%) | 0 (0.0%) |
| 1 or 2 Children | 30 (100.0%) | 0 (0.0%) |
| 3 or 4 Children | 7 (100.0%) | 0 (0.0%) |
| 5 or more Children | 2 (100.0%) | 0 (0.0%) |
| Total | 87 (100.0%) | 0 (0.0%) |
Income Below Poverty Among Single-Parent Households in Lakeland Shores
According to the poverty data in Lakeland Shores, 33.3% or 1 single-father households and 25.0% or 2 single-mother households are living below the poverty line. Among single-father households, those with no children have the highest poverty rate, with 1 households (50.0%) experiencing poverty. Likewise, among single-mother households, those with no children have the highest poverty rate, with 2 households (50.0%) falling below the poverty line.
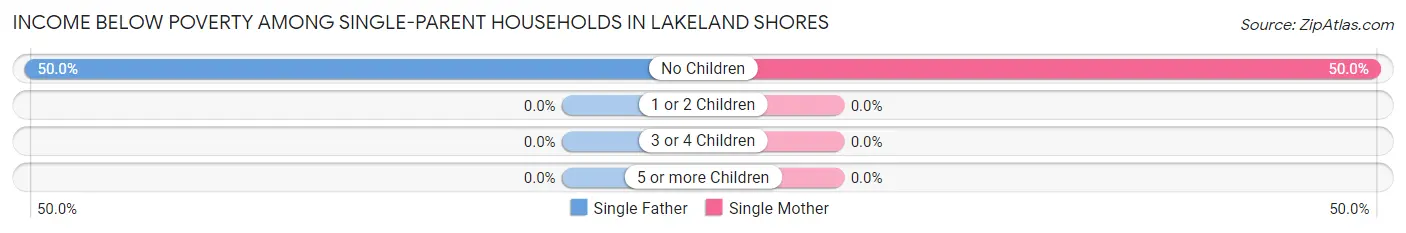
| Children | Single Father | Single Mother |
| No Children | 1 (50.0%) | 2 (50.0%) |
| 1 or 2 Children | 0 (0.0%) | 0 (0.0%) |
| 3 or 4 Children | 0 (0.0%) | 0 (0.0%) |
| 5 or more Children | 0 (0.0%) | 0 (0.0%) |
| Total | 1 (33.3%) | 2 (25.0%) |
Income Below Poverty Among Married-Couple vs Single-Parent Households in Lakeland Shores
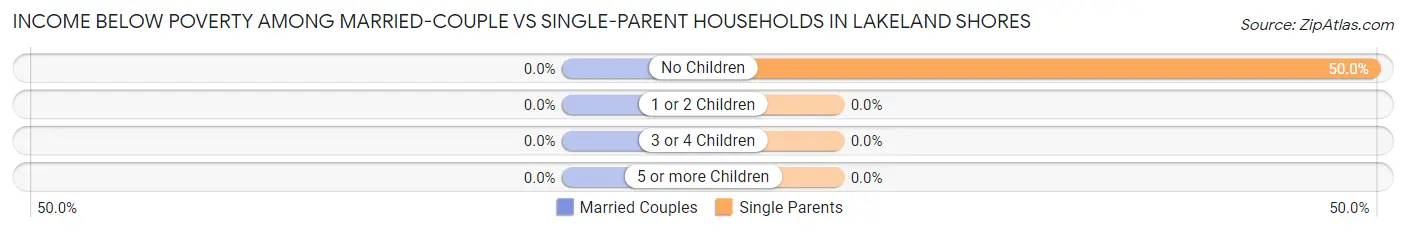
| Children | Married-Couple Families | Single-Parent Households |
| No Children | 0 (0.0%) | 3 (50.0%) |
| 1 or 2 Children | 0 (0.0%) | 0 (0.0%) |
| 3 or 4 Children | 0 (0.0%) | 0 (0.0%) |
| 5 or more Children | 0 (0.0%) | 0 (0.0%) |
| Total | 0 (0.0%) | 3 (27.3%) |
Race in Lakeland Shores
The most populous races in Lakeland Shores are White / Caucasian (320 | 97.0%), Two or more Races (8 | 2.4%), and Asian (2 | 0.6%).
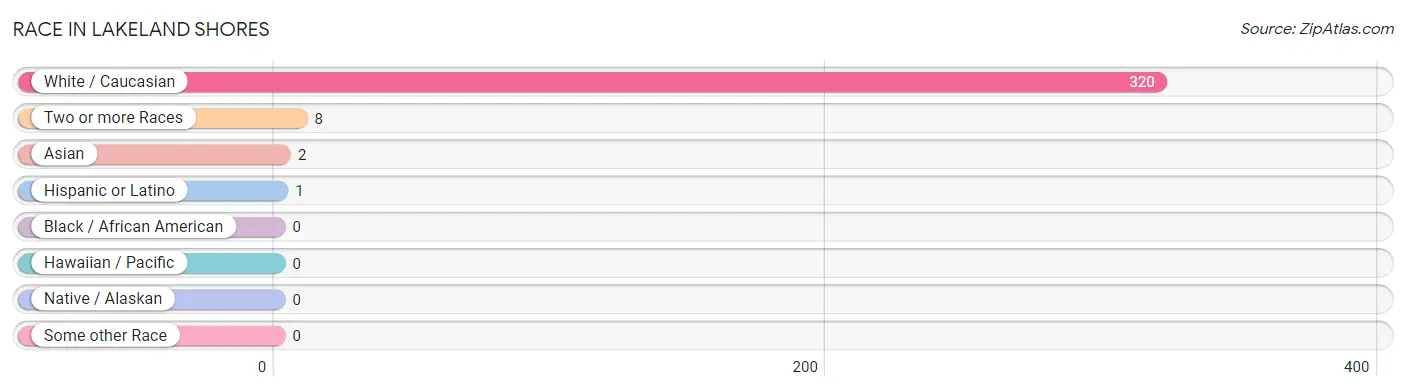
| Race | # Population | % Population |
| Asian | 2 | 0.6% |
| Black / African American | 0 | 0.0% |
| Hawaiian / Pacific | 0 | 0.0% |
| Hispanic or Latino | 1 | 0.3% |
| Native / Alaskan | 0 | 0.0% |
| White / Caucasian | 320 | 97.0% |
| Two or more Races | 8 | 2.4% |
| Some other Race | 0 | 0.0% |
| Total | 330 | 100.0% |
Ancestry in Lakeland Shores
The most populous ancestries reported in Lakeland Shores are German (136 | 41.2%), Irish (54 | 16.4%), Swedish (45 | 13.6%), Norwegian (41 | 12.4%), and English (27 | 8.2%), together accounting for 91.8% of all Lakeland Shores residents.
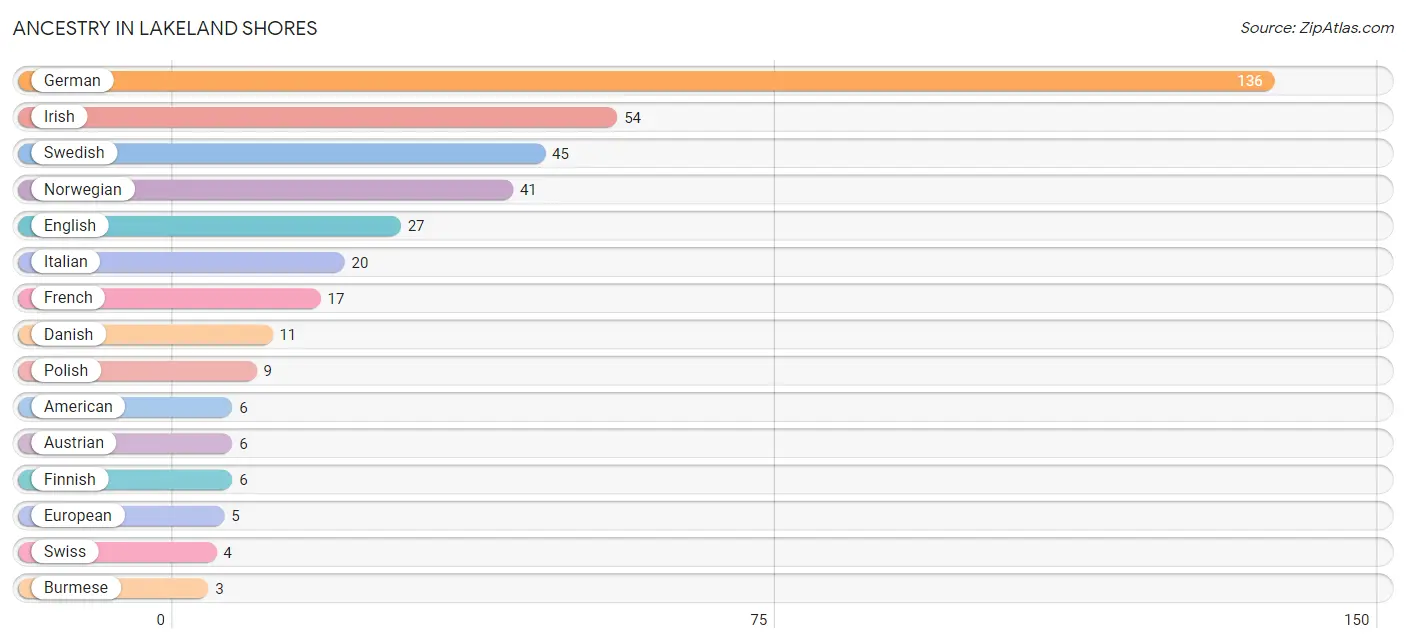
| Ancestry | # Population | % Population |
| American | 6 | 1.8% |
| Austrian | 6 | 1.8% |
| British | 1 | 0.3% |
| Burmese | 3 | 0.9% |
| Danish | 11 | 3.3% |
| Dutch | 1 | 0.3% |
| English | 27 | 8.2% |
| European | 5 | 1.5% |
| Finnish | 6 | 1.8% |
| French | 17 | 5.1% |
| French Canadian | 1 | 0.3% |
| German | 136 | 41.2% |
| Hungarian | 2 | 0.6% |
| Irish | 54 | 16.4% |
| Italian | 20 | 6.1% |
| Jamaican | 1 | 0.3% |
| Norwegian | 41 | 12.4% |
| Polish | 9 | 2.7% |
| Russian | 2 | 0.6% |
| Scandinavian | 3 | 0.9% |
| Scotch-Irish | 1 | 0.3% |
| Slovak | 2 | 0.6% |
| Spanish | 1 | 0.3% |
| Swedish | 45 | 13.6% |
| Swiss | 4 | 1.2% | View All 25 Rows |
Immigrants in Lakeland Shores
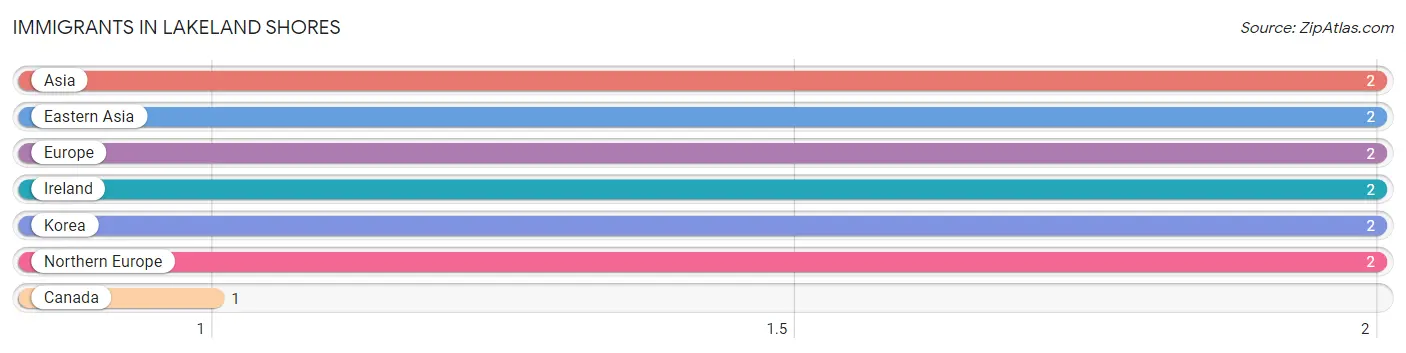
The most numerous immigrant groups reported in Lakeland Shores came from Asia (2 | 0.6%), Eastern Asia (2 | 0.6%), Europe (2 | 0.6%), Ireland (2 | 0.6%), and Korea (2 | 0.6%), together accounting for 3.1% of all Lakeland Shores residents.
| Immigration Origin | # Population | % Population |
| Asia | 2 | 0.6% |
| Canada | 1 | 0.3% |
| Eastern Asia | 2 | 0.6% |
| Europe | 2 | 0.6% |
| Ireland | 2 | 0.6% |
| Korea | 2 | 0.6% |
| Northern Europe | 2 | 0.6% | View All 7 Rows |
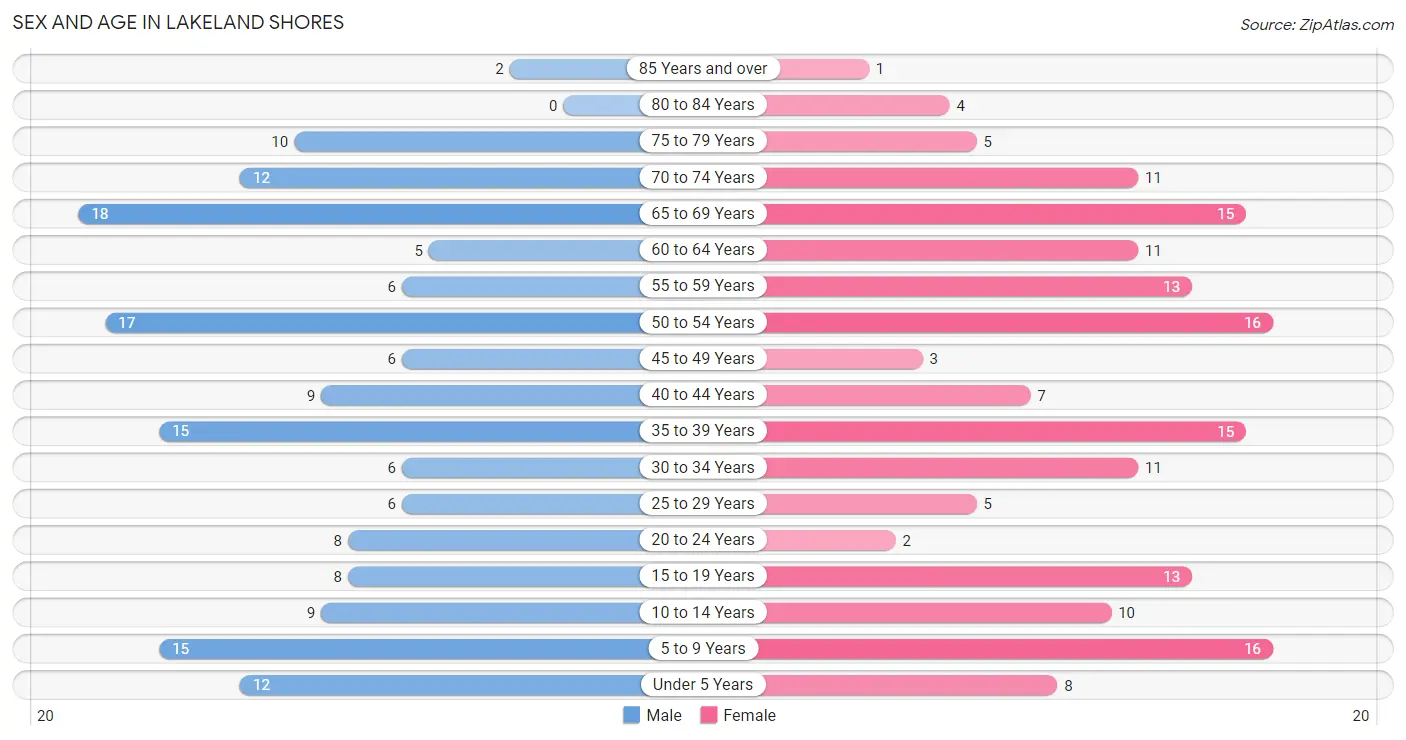
Sex and Age in Lakeland Shores
Sex and Age in Lakeland Shores
The most populous age groups in Lakeland Shores are 65 to 69 Years (18 | 11.0%) for men and 5 to 9 Years (16 | 9.6%) for women.
| Age Bracket | Male | Female |
| Under 5 Years | 12 (7.3%) | 8 (4.8%) |
| 5 to 9 Years | 15 (9.1%) | 16 (9.6%) |
| 10 to 14 Years | 9 (5.5%) | 10 (6.0%) |
| 15 to 19 Years | 8 (4.9%) | 13 (7.8%) |
| 20 to 24 Years | 8 (4.9%) | 2 (1.2%) |
| 25 to 29 Years | 6 (3.7%) | 5 (3.0%) |
| 30 to 34 Years | 6 (3.7%) | 11 (6.6%) |
| 35 to 39 Years | 15 (9.1%) | 15 (9.0%) |
| 40 to 44 Years | 9 (5.5%) | 7 (4.2%) |
| 45 to 49 Years | 6 (3.7%) | 3 (1.8%) |
| 50 to 54 Years | 17 (10.4%) | 16 (9.6%) |
| 55 to 59 Years | 6 (3.7%) | 13 (7.8%) |
| 60 to 64 Years | 5 (3.0%) | 11 (6.6%) |
| 65 to 69 Years | 18 (11.0%) | 15 (9.0%) |
| 70 to 74 Years | 12 (7.3%) | 11 (6.6%) |
| 75 to 79 Years | 10 (6.1%) | 5 (3.0%) |
| 80 to 84 Years | 0 (0.0%) | 4 (2.4%) |
| 85 Years and over | 2 (1.2%) | 1 (0.6%) |
| Total | 164 (100.0%) | 166 (100.0%) |
Families and Households in Lakeland Shores
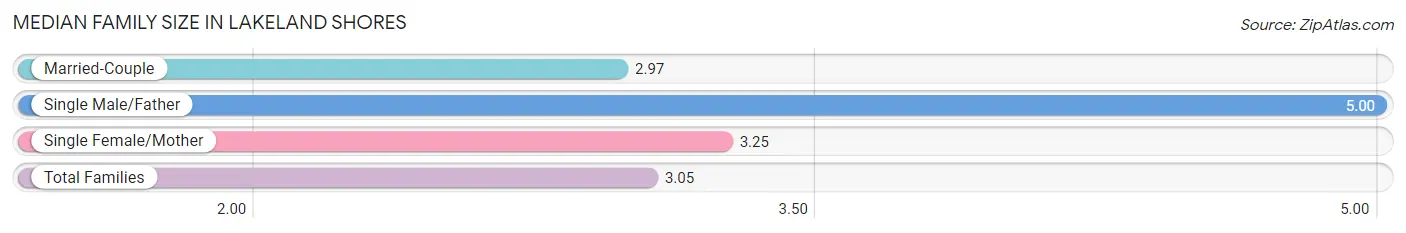
Median Family Size in Lakeland Shores
The median family size in Lakeland Shores is 3.05 persons per family, with single male/father families (3 | 3.1%) accounting for the largest median family size of 5 persons per family. On the other hand, married-couple families (87 | 88.8%) represent the smallest median family size with 2.97 persons per family.
| Family Type | # Families | Family Size |
| Married-Couple | 87 (88.8%) | 2.97 |
| Single Male/Father | 3 (3.1%) | 5.00 |
| Single Female/Mother | 8 (8.2%) | 3.25 |
| Total Families | 98 (100.0%) | 3.05 |
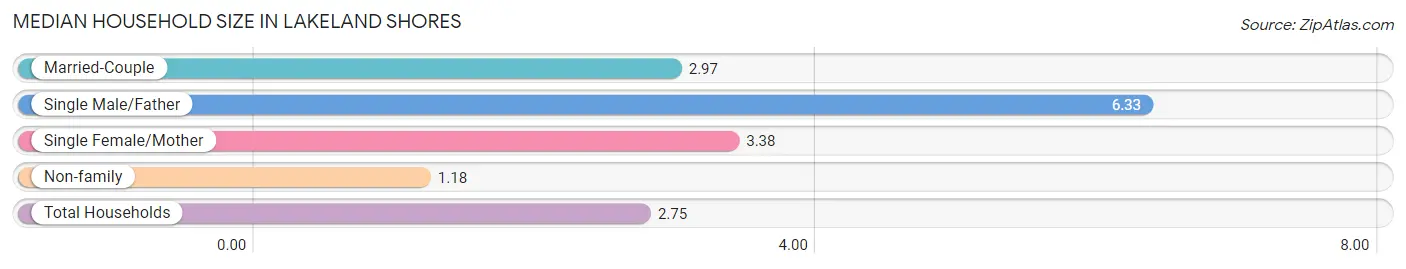
Median Household Size in Lakeland Shores
The median household size in Lakeland Shores is 2.75 persons per household, with single male/father households (3 | 2.5%) accounting for the largest median household size of 6.33 persons per household. non-family households (22 | 18.3%) represent the smallest median household size with 1.18 persons per household.
| Household Type | # Households | Household Size |
| Married-Couple | 87 (72.5%) | 2.97 |
| Single Male/Father | 3 (2.5%) | 6.33 |
| Single Female/Mother | 8 (6.7%) | 3.38 |
| Non-family | 22 (18.3%) | 1.18 |
| Total Households | 120 (100.0%) | 2.75 |
Household Size by Marriage Status in Lakeland Shores
Out of a total of 120 households in Lakeland Shores, 98 (81.7%) are family households, while 22 (18.3%) are nonfamily households. The most numerous type of family households are 2-person households, comprising 47, and the most common type of nonfamily households are 1-person households, comprising 18.
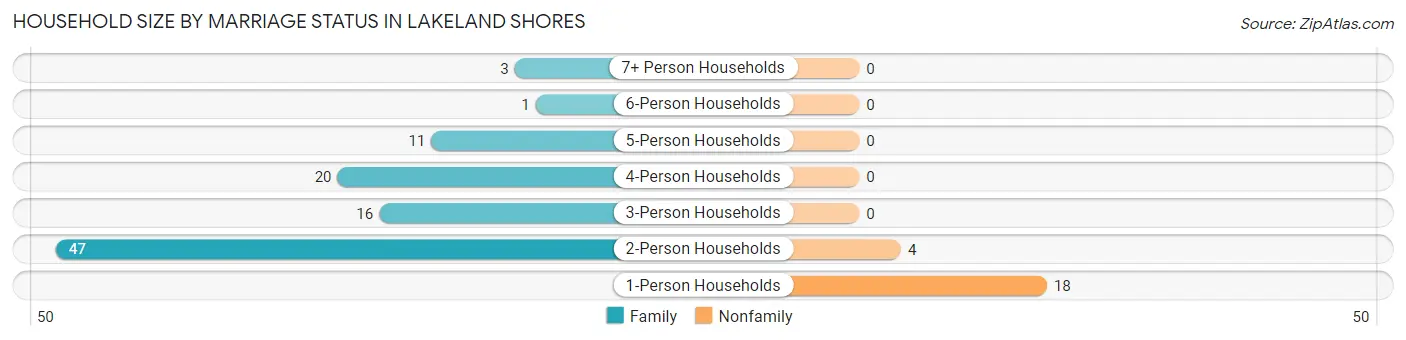
| Household Size | Family Households | Nonfamily Households |
| 1-Person Households | - | 18 (15.0%) |
| 2-Person Households | 47 (39.2%) | 4 (3.3%) |
| 3-Person Households | 16 (13.3%) | 0 (0.0%) |
| 4-Person Households | 20 (16.7%) | 0 (0.0%) |
| 5-Person Households | 11 (9.2%) | 0 (0.0%) |
| 6-Person Households | 1 (0.8%) | 0 (0.0%) |
| 7+ Person Households | 3 (2.5%) | 0 (0.0%) |
| Total | 98 (81.7%) | 22 (18.3%) |
Female Fertility in Lakeland Shores
Fertility by Age in Lakeland Shores
| Age Bracket | Women with Births | Births / 1,000 Women |
| 15 to 19 years | 0 (0.0%) | 0.0 |
| 20 to 34 years | 0 (0.0%) | 0.0 |
| 35 to 50 years | 0 (0.0%) | 0.0 |
| Total | 0 (0.0%) | 0.0 |
Fertility by Age by Marriage Status in Lakeland Shores
| Age Bracket | Married | Unmarried |
| 15 to 19 years | 0 (0.0%) | 0 (0.0%) |
| 20 to 34 years | 0 (0.0%) | 0 (0.0%) |
| 35 to 50 years | 0 (0.0%) | 0 (0.0%) |
| Total | 0 (0.0%) | 0 (0.0%) |
Fertility by Education in Lakeland Shores
| Educational Attainment | Women with Births | Births / 1,000 Women |
| Less than High School | 0 (0.0%) | 0.0 |
| High School Diploma | 0 (0.0%) | 0.0 |
| College or Associate's Degree | 0 (0.0%) | 0.0 |
| Bachelor's Degree | 0 (0.0%) | 0.0 |
| Graduate Degree | 0 (0.0%) | 0.0 |
| Total | 0 (0.0%) | 0.0 |
Fertility by Education by Marriage Status in Lakeland Shores
| Educational Attainment | Married | Unmarried |
| Less than High School | 0 (0.0%) | 0 (0.0%) |
| High School Diploma | 0 (0.0%) | 0 (0.0%) |
| College or Associate's Degree | 0 (0.0%) | 0 (0.0%) |
| Bachelor's Degree | 0 (0.0%) | 0 (0.0%) |
| Graduate Degree | 0 (0.0%) | 0 (0.0%) |
| Total | 0 (0.0%) | 0 (0.0%) |
Employment Characteristics in Lakeland Shores
Employment by Class of Employer in Lakeland Shores
Among the 150 employed individuals in Lakeland Shores, private company employees (93 | 62.0%), local government employees (18 | 12.0%), and self-employed (incorporated) (17 | 11.3%) make up the most common classes of employment.
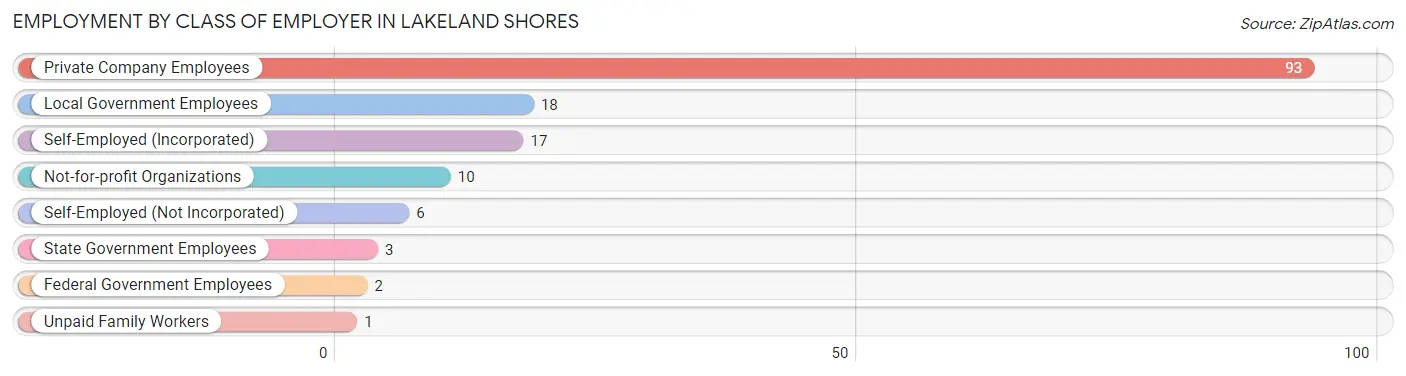
| Employer Class | # Employees | % Employees |
| Private Company Employees | 93 | 62.0% |
| Self-Employed (Incorporated) | 17 | 11.3% |
| Self-Employed (Not Incorporated) | 6 | 4.0% |
| Not-for-profit Organizations | 10 | 6.7% |
| Local Government Employees | 18 | 12.0% |
| State Government Employees | 3 | 2.0% |
| Federal Government Employees | 2 | 1.3% |
| Unpaid Family Workers | 1 | 0.7% |
| Total | 150 | 100.0% |
Employment Status by Age in Lakeland Shores
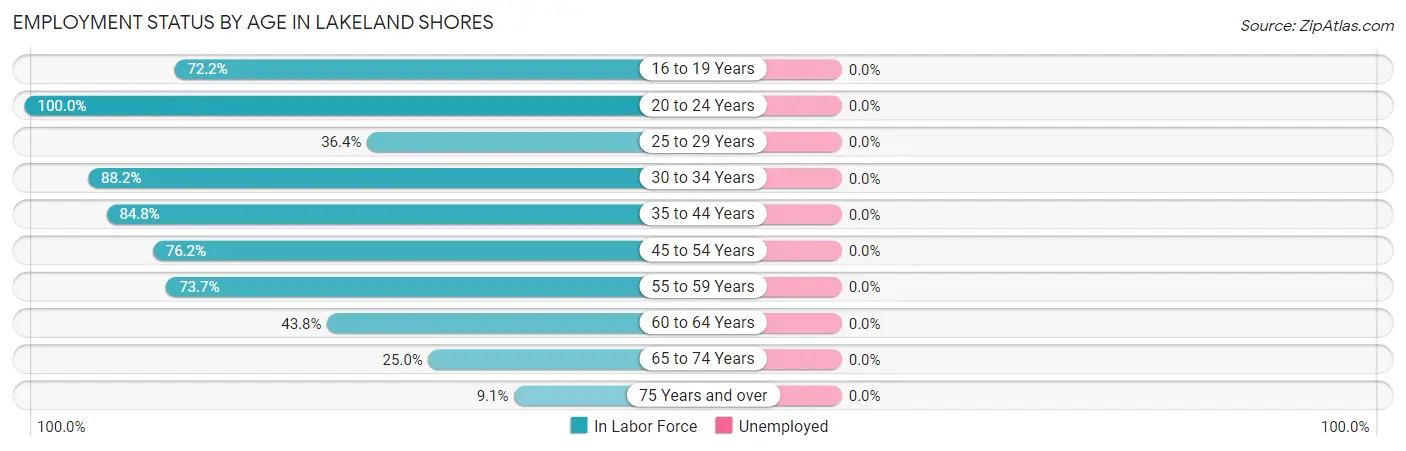
| Age Bracket | In Labor Force | Unemployed |
| 16 to 19 Years | 13 (72.2%) | 0 (0.0%) |
| 20 to 24 Years | 10 (100.0%) | 0 (0.0%) |
| 25 to 29 Years | 4 (36.4%) | 0 (0.0%) |
| 30 to 34 Years | 15 (88.2%) | 0 (0.0%) |
| 35 to 44 Years | 39 (84.8%) | 0 (0.0%) |
| 45 to 54 Years | 32 (76.2%) | 0 (0.0%) |
| 55 to 59 Years | 14 (73.7%) | 0 (0.0%) |
| 60 to 64 Years | 7 (43.8%) | 0 (0.0%) |
| 65 to 74 Years | 14 (25.0%) | 0 (0.0%) |
| 75 Years and over | 2 (9.1%) | 0 (0.0%) |
| Total | 150 (58.4%) | 0 (0.0%) |
Employment Status by Educational Attainment in Lakeland Shores
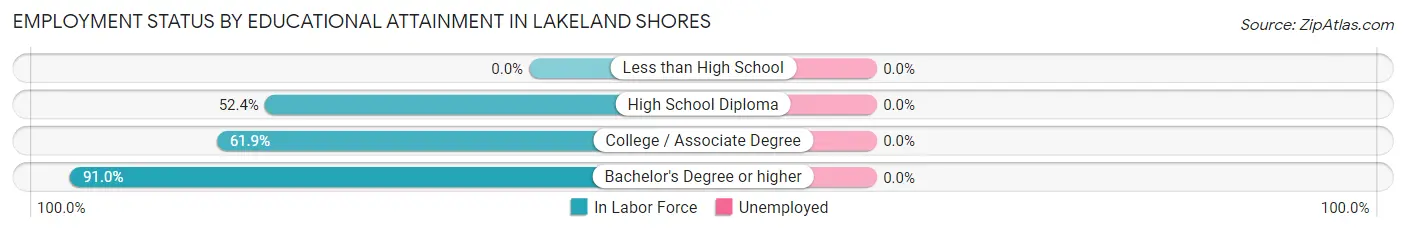
| Educational Attainment | In Labor Force | Unemployed |
| Less than High School | 0 (0.0%) | 0 (0.0%) |
| High School Diploma | 11 (52.4%) | 0 (0.0%) |
| College / Associate Degree | 39 (61.9%) | 0 (0.0%) |
| Bachelor's Degree or higher | 61 (91.0%) | 0 (0.0%) |
| Total | 111 (73.5%) | 0 (0.0%) |
Employment Occupations by Sex in Lakeland Shores
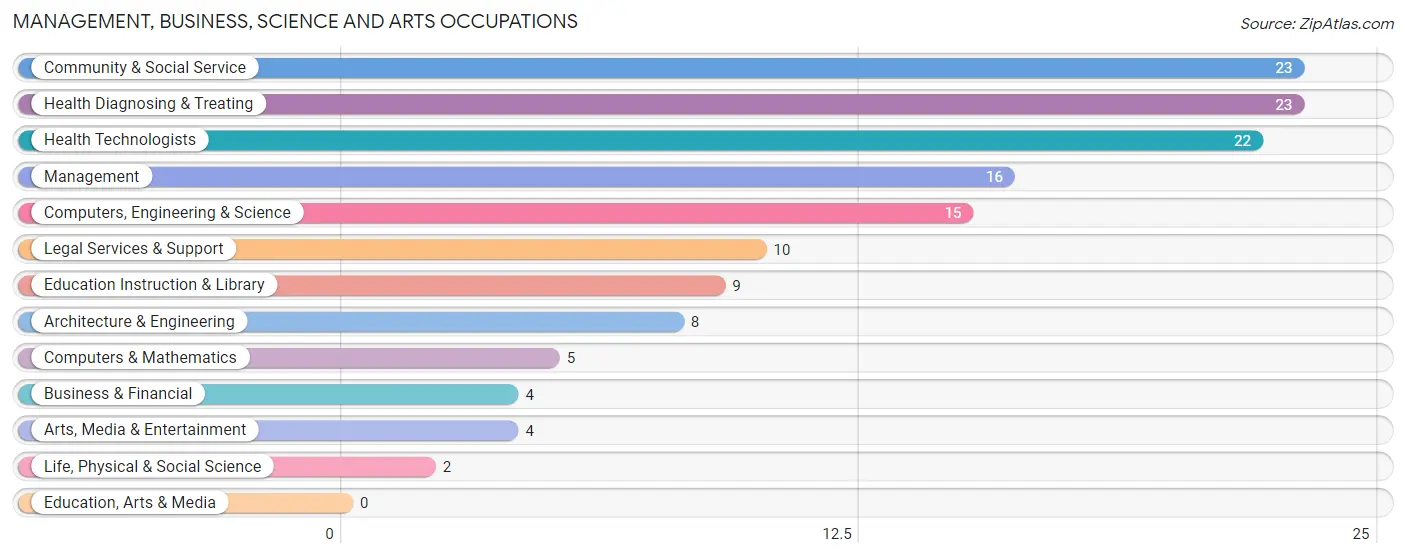
Management, Business, Science and Arts Occupations
The most common Management, Business, Science and Arts occupations in Lakeland Shores are Community & Social Service (23 | 15.3%), Health Diagnosing & Treating (23 | 15.3%), Health Technologists (22 | 14.7%), Management (16 | 10.7%), and Computers, Engineering & Science (15 | 10.0%).
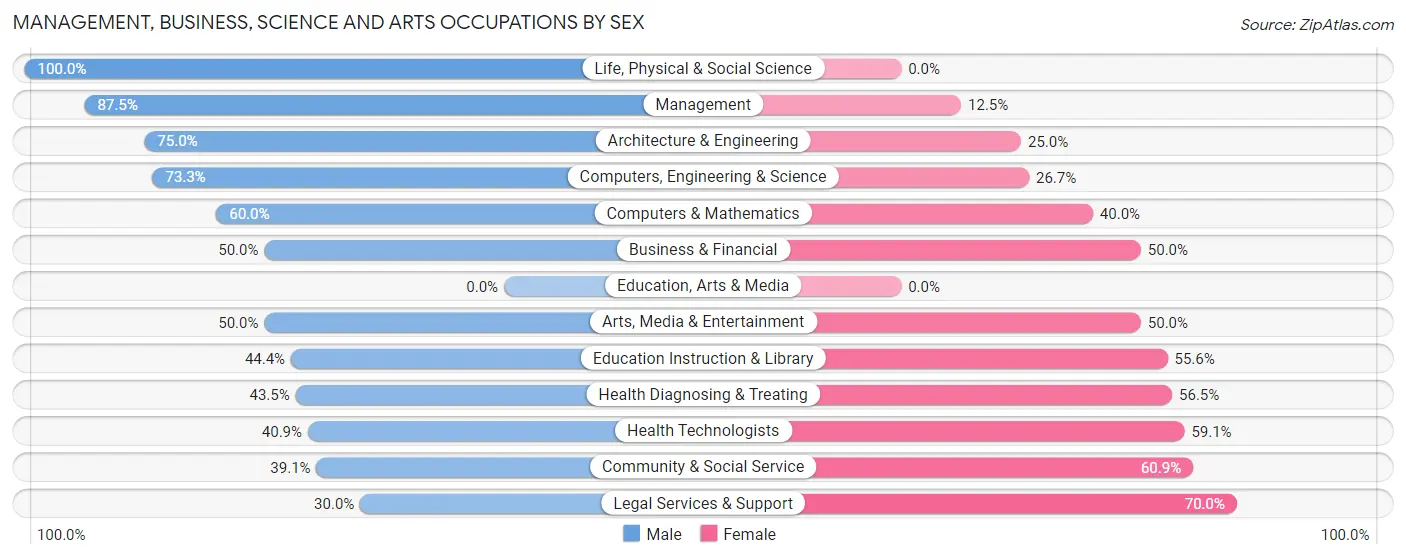
Management, Business, Science and Arts Occupations by Sex
Within the Management, Business, Science and Arts occupations in Lakeland Shores, the most male-oriented occupations are Life, Physical & Social Science (100.0%), Management (87.5%), and Architecture & Engineering (75.0%), while the most female-oriented occupations are Legal Services & Support (70.0%), Community & Social Service (60.9%), and Health Technologists (59.1%).
| Occupation | Male | Female |
| Management | 14 (87.5%) | 2 (12.5%) |
| Business & Financial | 2 (50.0%) | 2 (50.0%) |
| Computers, Engineering & Science | 11 (73.3%) | 4 (26.7%) |
| Computers & Mathematics | 3 (60.0%) | 2 (40.0%) |
| Architecture & Engineering | 6 (75.0%) | 2 (25.0%) |
| Life, Physical & Social Science | 2 (100.0%) | 0 (0.0%) |
| Community & Social Service | 9 (39.1%) | 14 (60.9%) |
| Education, Arts & Media | 0 (0.0%) | 0 (0.0%) |
| Legal Services & Support | 3 (30.0%) | 7 (70.0%) |
| Education Instruction & Library | 4 (44.4%) | 5 (55.6%) |
| Arts, Media & Entertainment | 2 (50.0%) | 2 (50.0%) |
| Health Diagnosing & Treating | 10 (43.5%) | 13 (56.5%) |
| Health Technologists | 9 (40.9%) | 13 (59.1%) |
| Total (Category) | 46 (56.8%) | 35 (43.2%) |
| Total (Overall) | 85 (56.7%) | 65 (43.3%) |
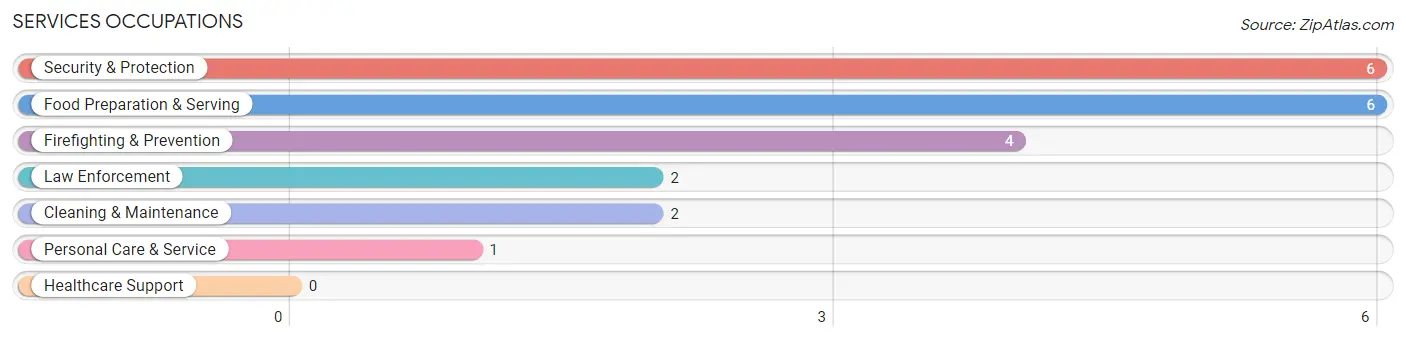
Services Occupations
The most common Services occupations in Lakeland Shores are Security & Protection (6 | 4.0%), Food Preparation & Serving (6 | 4.0%), Firefighting & Prevention (4 | 2.7%), Law Enforcement (2 | 1.3%), and Cleaning & Maintenance (2 | 1.3%).
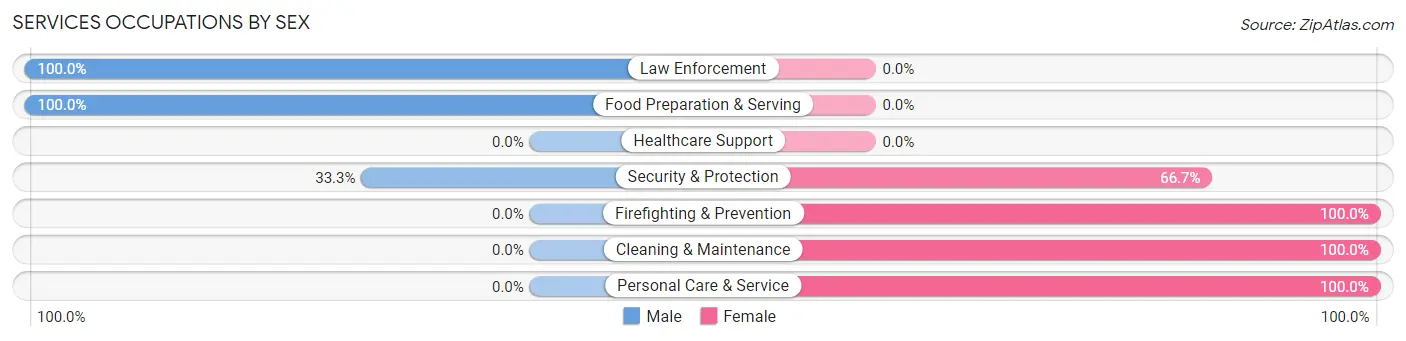
Services Occupations by Sex
Within the Services occupations in Lakeland Shores, the most male-oriented occupations are Law Enforcement (100.0%), Food Preparation & Serving (100.0%), and Security & Protection (33.3%), while the most female-oriented occupations are Firefighting & Prevention (100.0%), Cleaning & Maintenance (100.0%), and Personal Care & Service (100.0%).
| Occupation | Male | Female |
| Healthcare Support | 0 (0.0%) | 0 (0.0%) |
| Security & Protection | 2 (33.3%) | 4 (66.7%) |
| Firefighting & Prevention | 0 (0.0%) | 4 (100.0%) |
| Law Enforcement | 2 (100.0%) | 0 (0.0%) |
| Food Preparation & Serving | 6 (100.0%) | 0 (0.0%) |
| Cleaning & Maintenance | 0 (0.0%) | 2 (100.0%) |
| Personal Care & Service | 0 (0.0%) | 1 (100.0%) |
| Total (Category) | 8 (53.3%) | 7 (46.7%) |
| Total (Overall) | 85 (56.7%) | 65 (43.3%) |
Sales and Office Occupations
The most common Sales and Office occupations in Lakeland Shores are Office & Administration (13 | 8.7%), and Sales & Related (7 | 4.7%).
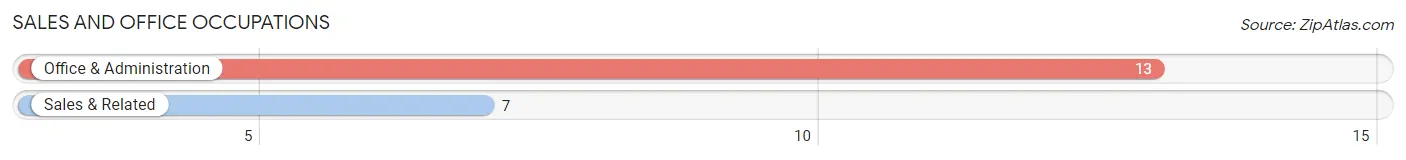
Sales and Office Occupations by Sex
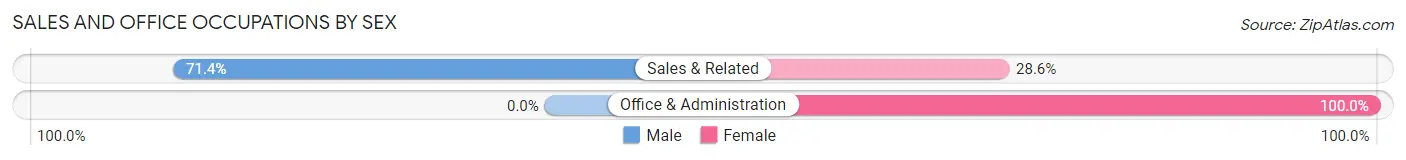
| Occupation | Male | Female |
| Sales & Related | 5 (71.4%) | 2 (28.6%) |
| Office & Administration | 0 (0.0%) | 13 (100.0%) |
| Total (Category) | 5 (25.0%) | 15 (75.0%) |
| Total (Overall) | 85 (56.7%) | 65 (43.3%) |
Natural Resources, Construction and Maintenance Occupations
The most common Natural Resources, Construction and Maintenance occupations in Lakeland Shores are Construction & Extraction (2 | 1.3%), and Installation, Maintenance & Repair (2 | 1.3%).
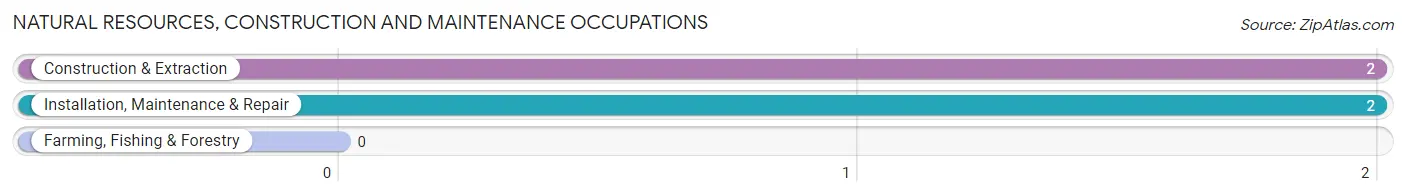
Natural Resources, Construction and Maintenance Occupations by Sex
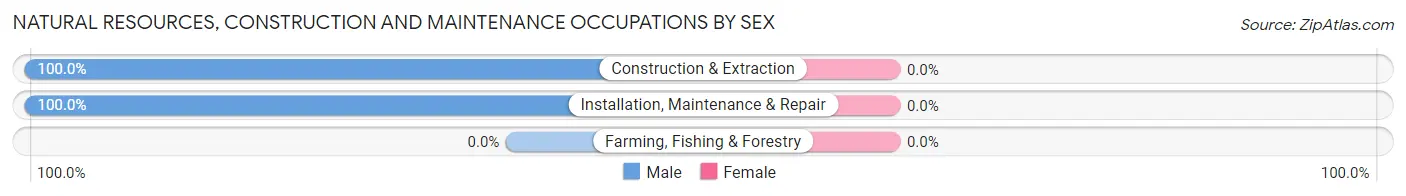
| Occupation | Male | Female |
| Farming, Fishing & Forestry | 0 (0.0%) | 0 (0.0%) |
| Construction & Extraction | 2 (100.0%) | 0 (0.0%) |
| Installation, Maintenance & Repair | 2 (100.0%) | 0 (0.0%) |
| Total (Category) | 4 (100.0%) | 0 (0.0%) |
| Total (Overall) | 85 (56.7%) | 65 (43.3%) |
Production, Transportation and Moving Occupations
The most common Production, Transportation and Moving occupations in Lakeland Shores are Production (16 | 10.7%), Transportation (11 | 7.3%), and Material Moving (3 | 2.0%).
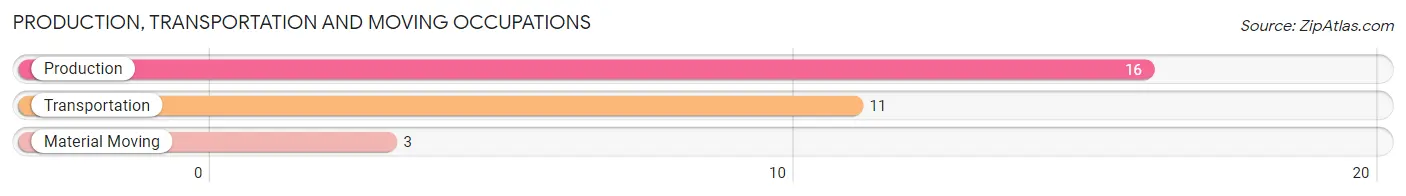
Production, Transportation and Moving Occupations by Sex
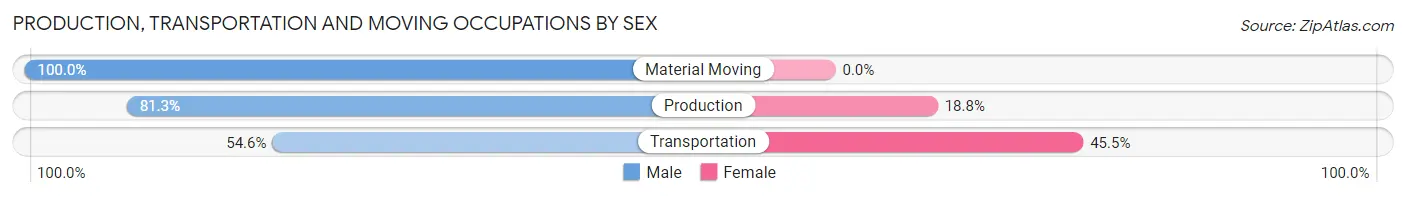
| Occupation | Male | Female |
| Production | 13 (81.2%) | 3 (18.8%) |
| Transportation | 6 (54.5%) | 5 (45.5%) |
| Material Moving | 3 (100.0%) | 0 (0.0%) |
| Total (Category) | 22 (73.3%) | 8 (26.7%) |
| Total (Overall) | 85 (56.7%) | 65 (43.3%) |
Employment Industries by Sex in Lakeland Shores
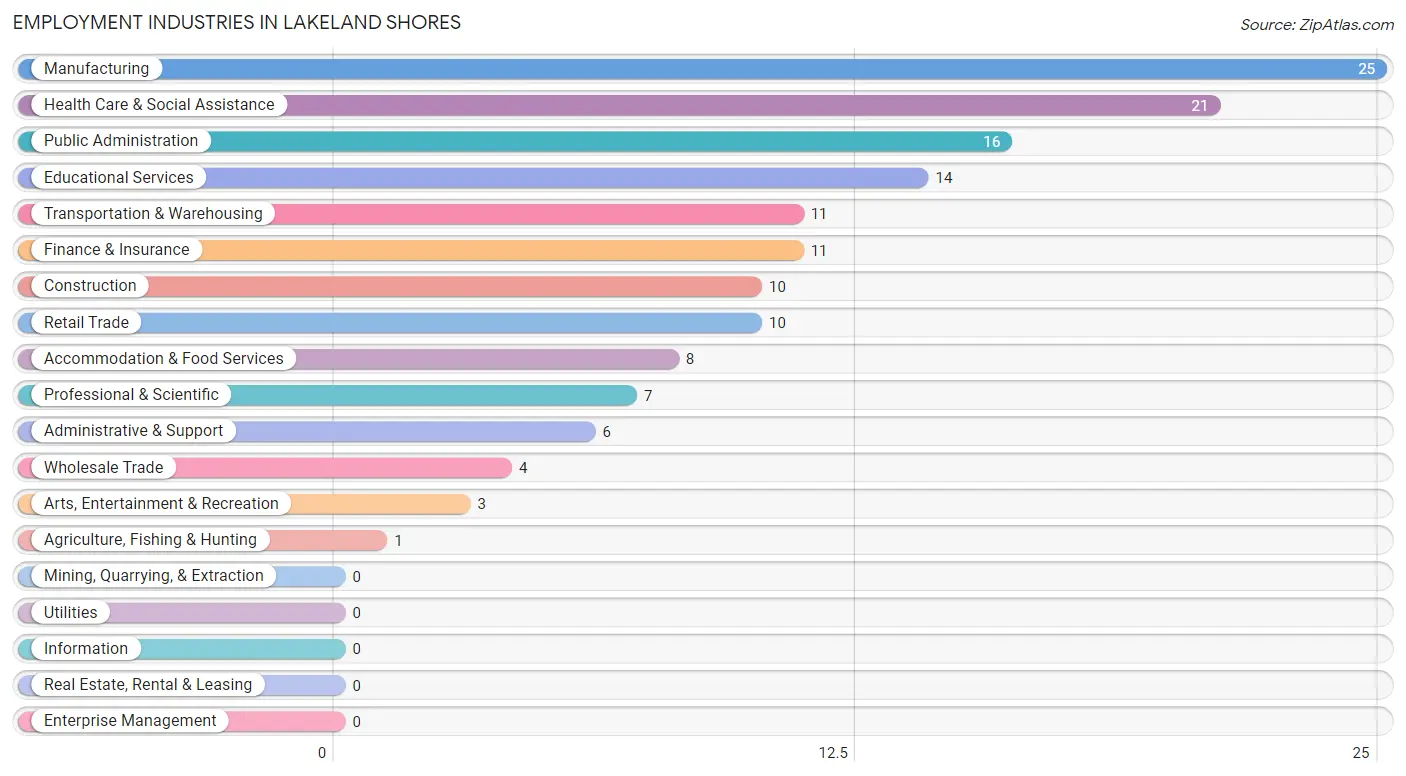
Employment Industries in Lakeland Shores
The major employment industries in Lakeland Shores include Manufacturing (25 | 16.7%), Health Care & Social Assistance (21 | 14.0%), Public Administration (16 | 10.7%), Educational Services (14 | 9.3%), and Transportation & Warehousing (11 | 7.3%).
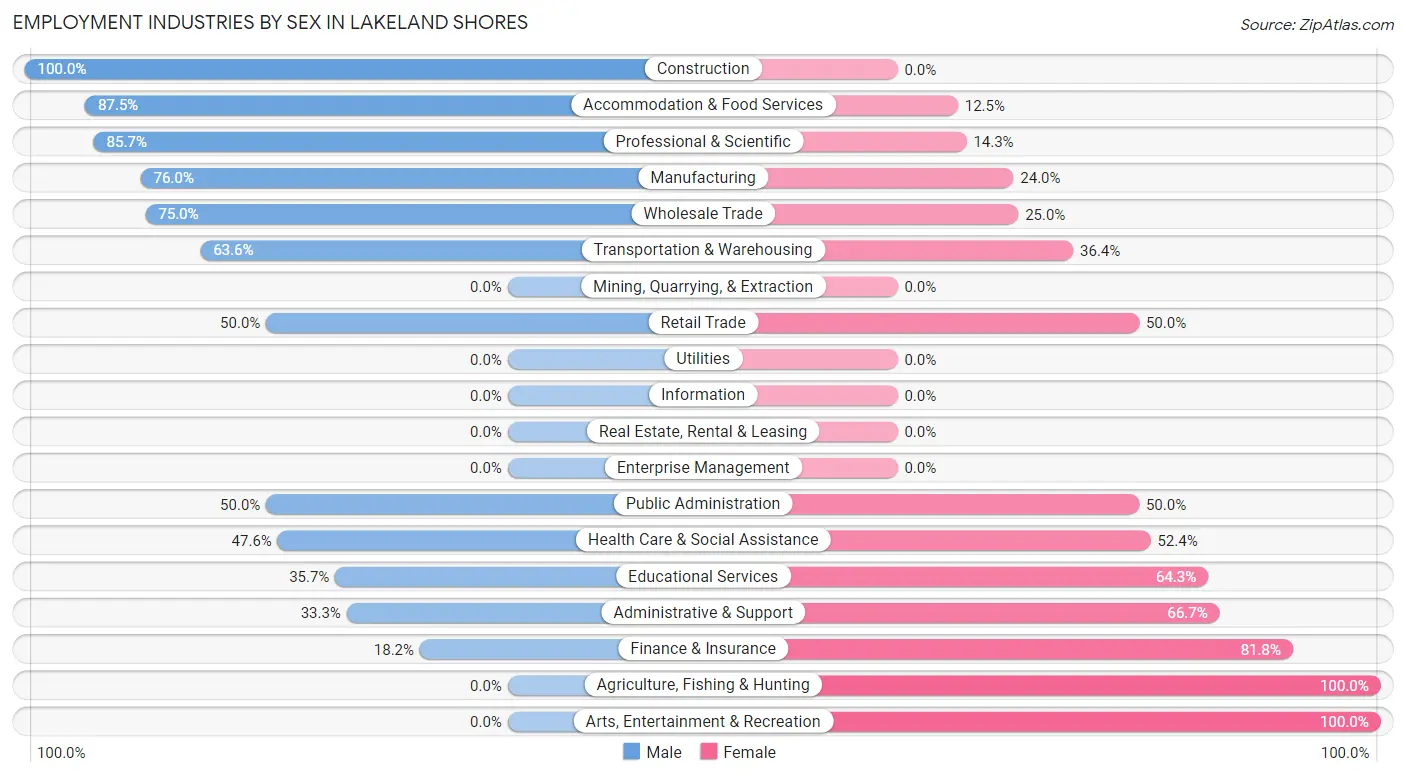
Employment Industries by Sex in Lakeland Shores
The Lakeland Shores industries that see more men than women are Construction (100.0%), Accommodation & Food Services (87.5%), and Professional & Scientific (85.7%), whereas the industries that tend to have a higher number of women are Agriculture, Fishing & Hunting (100.0%), Arts, Entertainment & Recreation (100.0%), and Finance & Insurance (81.8%).
| Industry | Male | Female |
| Agriculture, Fishing & Hunting | 0 (0.0%) | 1 (100.0%) |
| Mining, Quarrying, & Extraction | 0 (0.0%) | 0 (0.0%) |
| Construction | 10 (100.0%) | 0 (0.0%) |
| Manufacturing | 19 (76.0%) | 6 (24.0%) |
| Wholesale Trade | 3 (75.0%) | 1 (25.0%) |
| Retail Trade | 5 (50.0%) | 5 (50.0%) |
| Transportation & Warehousing | 7 (63.6%) | 4 (36.4%) |
| Utilities | 0 (0.0%) | 0 (0.0%) |
| Information | 0 (0.0%) | 0 (0.0%) |
| Finance & Insurance | 2 (18.2%) | 9 (81.8%) |
| Real Estate, Rental & Leasing | 0 (0.0%) | 0 (0.0%) |
| Professional & Scientific | 6 (85.7%) | 1 (14.3%) |
| Enterprise Management | 0 (0.0%) | 0 (0.0%) |
| Administrative & Support | 2 (33.3%) | 4 (66.7%) |
| Educational Services | 5 (35.7%) | 9 (64.3%) |
| Health Care & Social Assistance | 10 (47.6%) | 11 (52.4%) |
| Arts, Entertainment & Recreation | 0 (0.0%) | 3 (100.0%) |
| Accommodation & Food Services | 7 (87.5%) | 1 (12.5%) |
| Public Administration | 8 (50.0%) | 8 (50.0%) |
| Total | 85 (56.7%) | 65 (43.3%) |
Education in Lakeland Shores
School Enrollment in Lakeland Shores
The most common levels of schooling among the 80 students in Lakeland Shores are elementary school (24 | 30.0%), high school (17 | 21.2%), and middle school (16 | 20.0%).
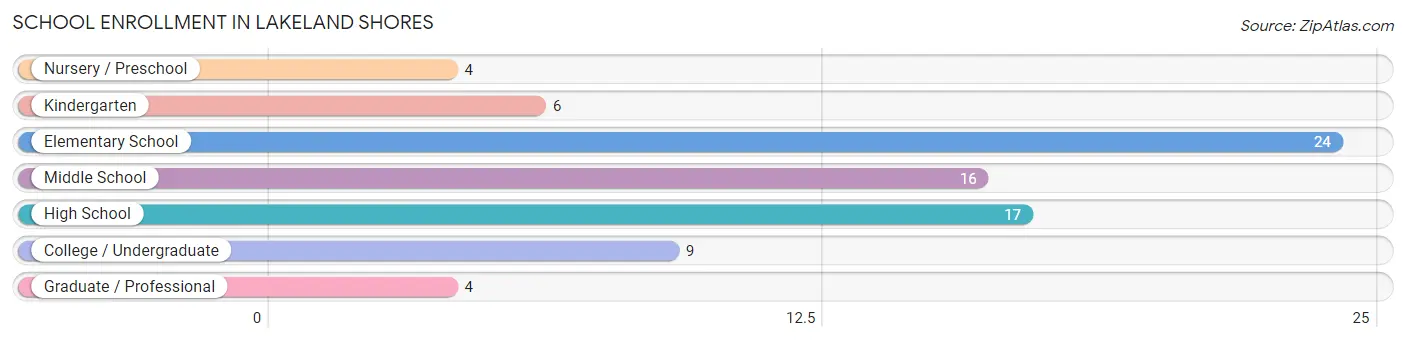
| School Level | # Students | % Students |
| Nursery / Preschool | 4 | 5.0% |
| Kindergarten | 6 | 7.5% |
| Elementary School | 24 | 30.0% |
| Middle School | 16 | 20.0% |
| High School | 17 | 21.2% |
| College / Undergraduate | 9 | 11.3% |
| Graduate / Professional | 4 | 5.0% |
| Total | 80 | 100.0% |
School Enrollment by Age by Funding Source in Lakeland Shores
Out of a total of 80 students who are enrolled in schools in Lakeland Shores, 21 (26.3%) attend a private institution, while the remaining 59 (73.7%) are enrolled in public schools. The age group of 18 to 19 year olds has the highest likelihood of being enrolled in private schools, with 6 (100.0% in the age bracket) enrolled. Conversely, the age group of 20 to 24 year olds has the lowest likelihood of being enrolled in a private school, with 2 (100.0% in the age bracket) attending a public institution.
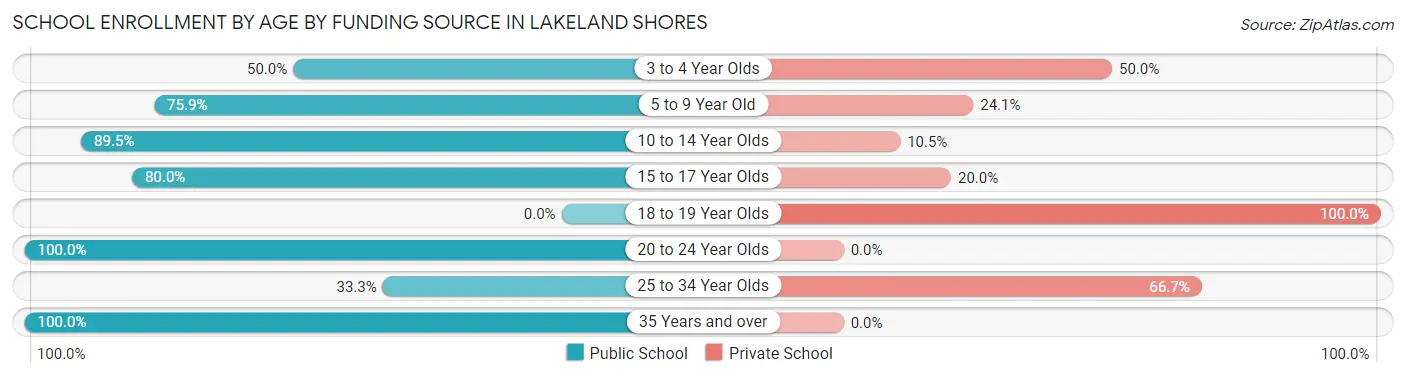
| Age Bracket | Public School | Private School |
| 3 to 4 Year Olds | 1 (50.0%) | 1 (50.0%) |
| 5 to 9 Year Old | 22 (75.9%) | 7 (24.1%) |
| 10 to 14 Year Olds | 17 (89.5%) | 2 (10.5%) |
| 15 to 17 Year Olds | 12 (80.0%) | 3 (20.0%) |
| 18 to 19 Year Olds | 0 (0.0%) | 6 (100.0%) |
| 20 to 24 Year Olds | 2 (100.0%) | 0 (0.0%) |
| 25 to 34 Year Olds | 1 (33.3%) | 2 (66.7%) |
| 35 Years and over | 4 (100.0%) | 0 (0.0%) |
| Total | 59 (73.8%) | 21 (26.3%) |
Educational Attainment by Field of Study in Lakeland Shores
Business (21 | 20.4%), education (19 | 18.4%), science & technology (12 | 11.7%), arts & humanities (11 | 10.7%), and bio, nature & agricultural (10 | 9.7%) are the most common fields of study among 103 individuals in Lakeland Shores who have obtained a bachelor's degree or higher.
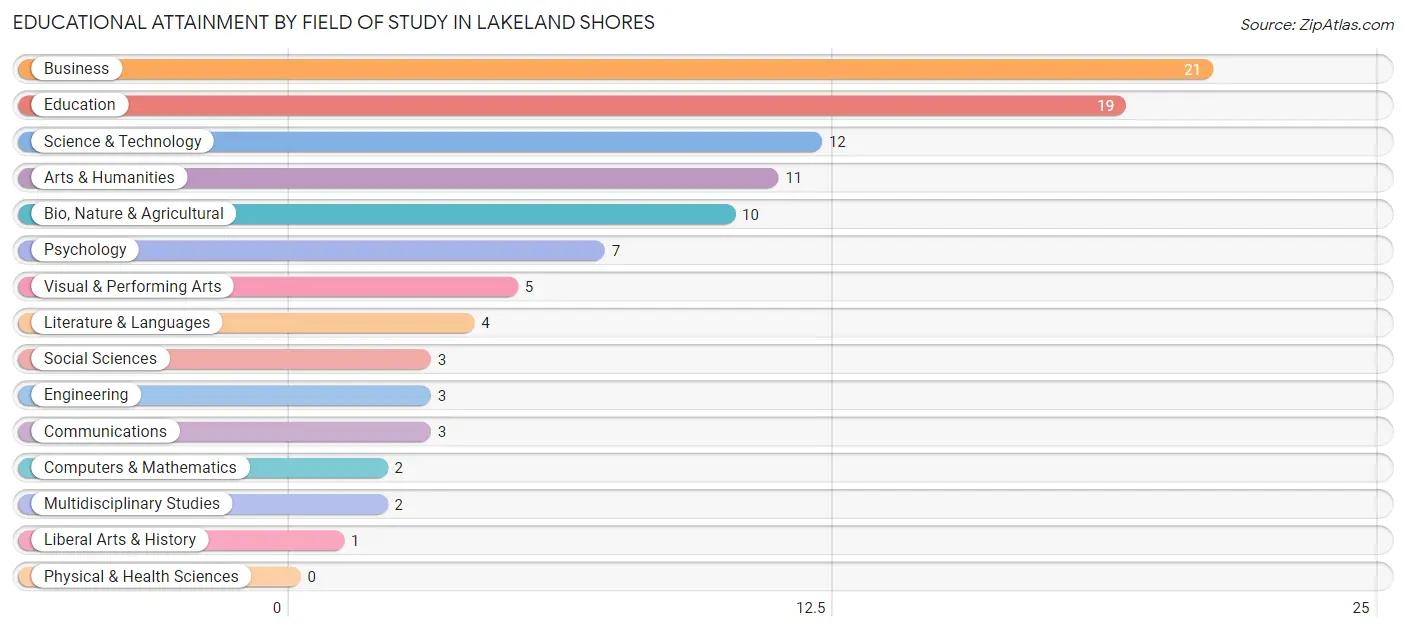
| Field of Study | # Graduates | % Graduates |
| Computers & Mathematics | 2 | 1.9% |
| Bio, Nature & Agricultural | 10 | 9.7% |
| Physical & Health Sciences | 0 | 0.0% |
| Psychology | 7 | 6.8% |
| Social Sciences | 3 | 2.9% |
| Engineering | 3 | 2.9% |
| Multidisciplinary Studies | 2 | 1.9% |
| Science & Technology | 12 | 11.7% |
| Business | 21 | 20.4% |
| Education | 19 | 18.4% |
| Literature & Languages | 4 | 3.9% |
| Liberal Arts & History | 1 | 1.0% |
| Visual & Performing Arts | 5 | 4.9% |
| Communications | 3 | 2.9% |
| Arts & Humanities | 11 | 10.7% |
| Total | 103 | 100.0% |
Transportation & Commute in Lakeland Shores
Vehicle Availability by Sex in Lakeland Shores
The most prevalent vehicle ownership categories in Lakeland Shores are males with 2 vehicles (36, accounting for 42.3%) and females with 2 vehicles (38, making up 55.4%).
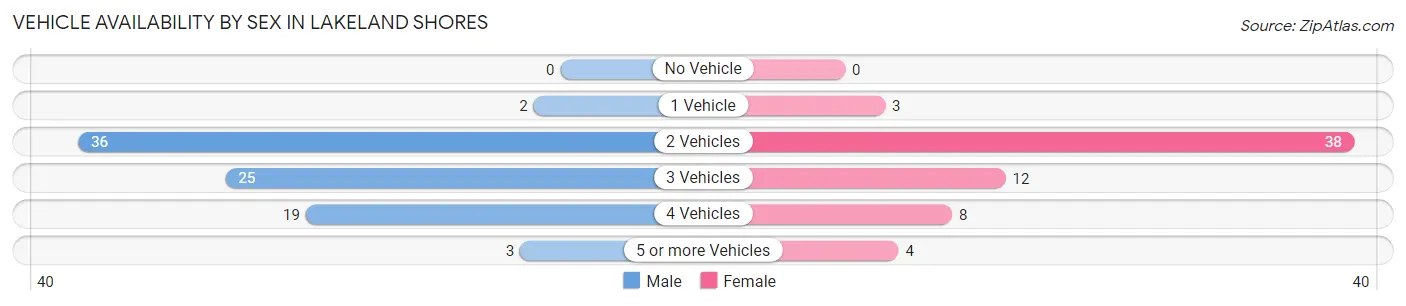
| Vehicles Available | Male | Female |
| No Vehicle | 0 (0.0%) | 0 (0.0%) |
| 1 Vehicle | 2 (2.4%) | 3 (4.6%) |
| 2 Vehicles | 36 (42.3%) | 38 (58.5%) |
| 3 Vehicles | 25 (29.4%) | 12 (18.5%) |
| 4 Vehicles | 19 (22.4%) | 8 (12.3%) |
| 5 or more Vehicles | 3 (3.5%) | 4 (6.1%) |
| Total | 85 (100.0%) | 65 (100.0%) |
Commute Time in Lakeland Shores
The most frequently occuring commute durations in Lakeland Shores are 10 to 14 minutes (30 commuters, 22.1%), 30 to 34 minutes (28 commuters, 20.6%), and 20 to 24 minutes (16 commuters, 11.8%).
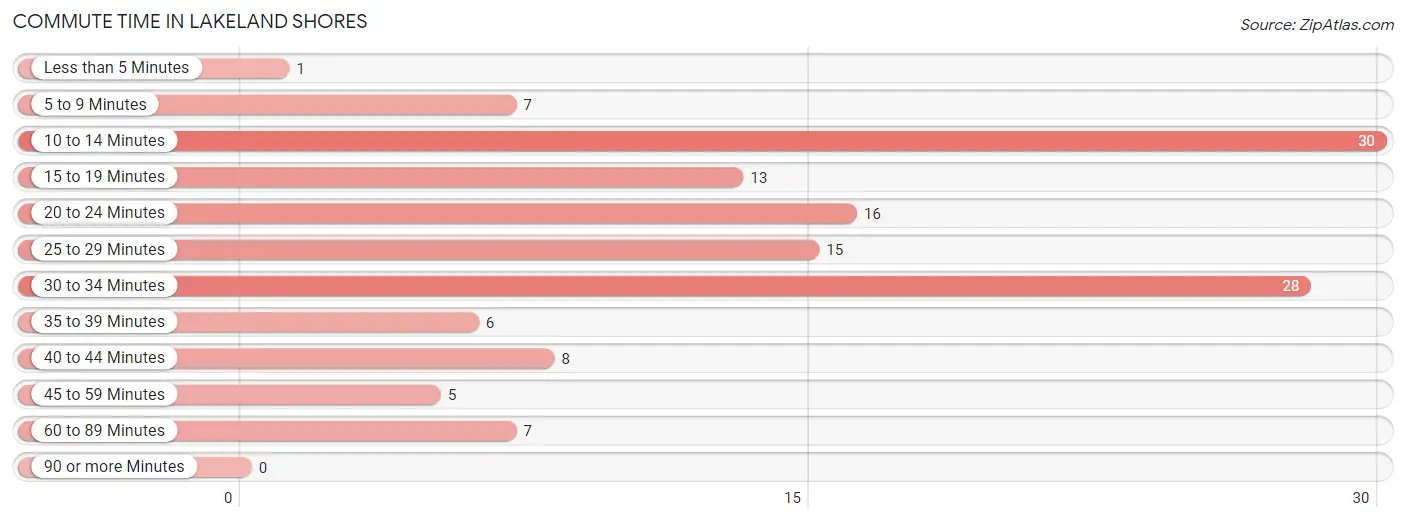
| Commute Time | # Commuters | % Commuters |
| Less than 5 Minutes | 1 | 0.7% |
| 5 to 9 Minutes | 7 | 5.1% |
| 10 to 14 Minutes | 30 | 22.1% |
| 15 to 19 Minutes | 13 | 9.6% |
| 20 to 24 Minutes | 16 | 11.8% |
| 25 to 29 Minutes | 15 | 11.0% |
| 30 to 34 Minutes | 28 | 20.6% |
| 35 to 39 Minutes | 6 | 4.4% |
| 40 to 44 Minutes | 8 | 5.9% |
| 45 to 59 Minutes | 5 | 3.7% |
| 60 to 89 Minutes | 7 | 5.1% |
| 90 or more Minutes | 0 | 0.0% |
Commute Time by Sex in Lakeland Shores
The most common commute times in Lakeland Shores are 10 to 14 minutes (24 commuters, 32.0%) for males and 30 to 34 minutes (17 commuters, 27.9%) for females.
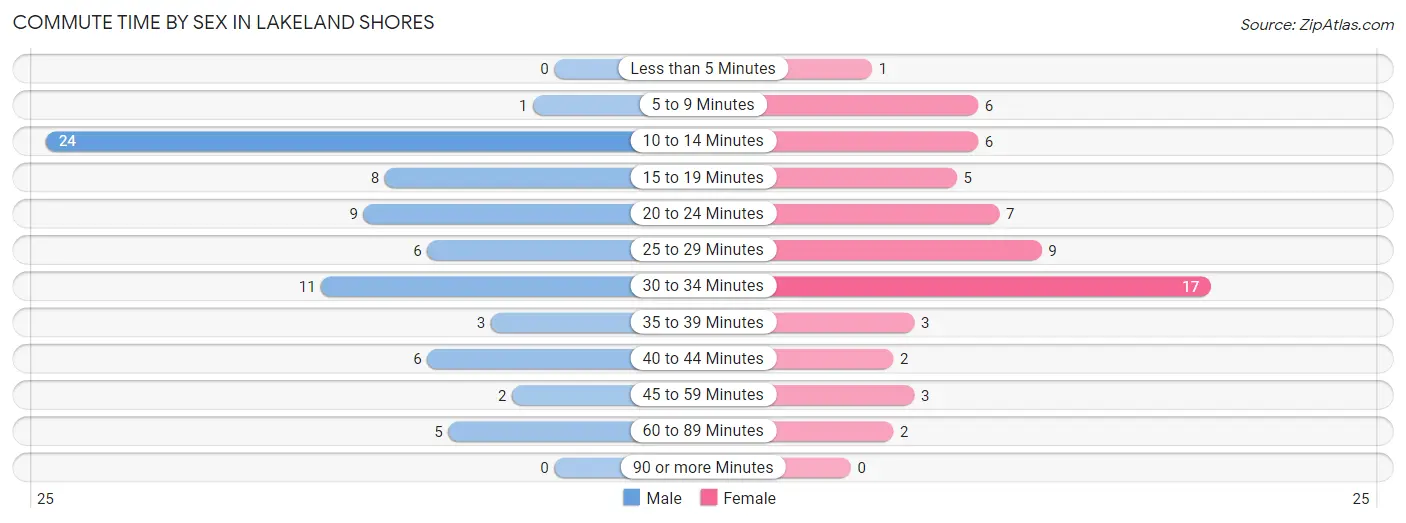
| Commute Time | Male | Female |
| Less than 5 Minutes | 0 (0.0%) | 1 (1.6%) |
| 5 to 9 Minutes | 1 (1.3%) | 6 (9.8%) |
| 10 to 14 Minutes | 24 (32.0%) | 6 (9.8%) |
| 15 to 19 Minutes | 8 (10.7%) | 5 (8.2%) |
| 20 to 24 Minutes | 9 (12.0%) | 7 (11.5%) |
| 25 to 29 Minutes | 6 (8.0%) | 9 (14.7%) |
| 30 to 34 Minutes | 11 (14.7%) | 17 (27.9%) |
| 35 to 39 Minutes | 3 (4.0%) | 3 (4.9%) |
| 40 to 44 Minutes | 6 (8.0%) | 2 (3.3%) |
| 45 to 59 Minutes | 2 (2.7%) | 3 (4.9%) |
| 60 to 89 Minutes | 5 (6.7%) | 2 (3.3%) |
| 90 or more Minutes | 0 (0.0%) | 0 (0.0%) |
Time of Departure to Work by Sex in Lakeland Shores
The most frequent times of departure to work in Lakeland Shores are 7:00 AM to 7:29 AM (20, 26.7%) for males and 10:00 AM to 10:59 AM (11, 18.0%) for females.
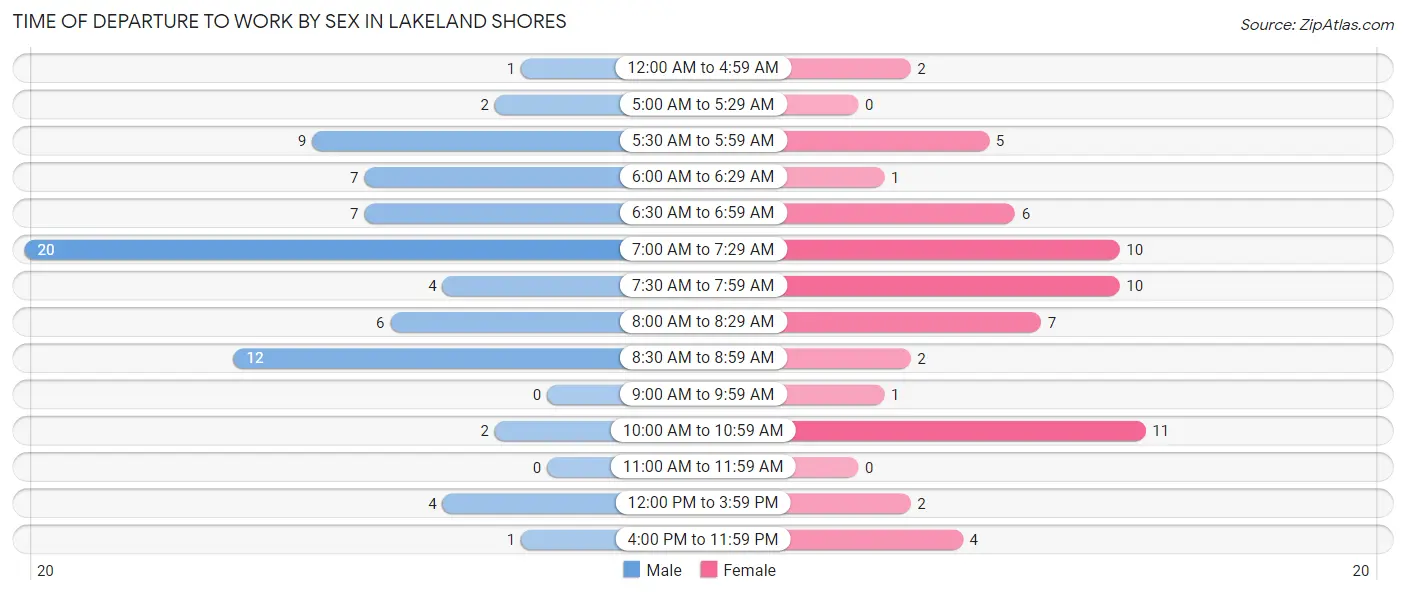
| Time of Departure | Male | Female |
| 12:00 AM to 4:59 AM | 1 (1.3%) | 2 (3.3%) |
| 5:00 AM to 5:29 AM | 2 (2.7%) | 0 (0.0%) |
| 5:30 AM to 5:59 AM | 9 (12.0%) | 5 (8.2%) |
| 6:00 AM to 6:29 AM | 7 (9.3%) | 1 (1.6%) |
| 6:30 AM to 6:59 AM | 7 (9.3%) | 6 (9.8%) |
| 7:00 AM to 7:29 AM | 20 (26.7%) | 10 (16.4%) |
| 7:30 AM to 7:59 AM | 4 (5.3%) | 10 (16.4%) |
| 8:00 AM to 8:29 AM | 6 (8.0%) | 7 (11.5%) |
| 8:30 AM to 8:59 AM | 12 (16.0%) | 2 (3.3%) |
| 9:00 AM to 9:59 AM | 0 (0.0%) | 1 (1.6%) |
| 10:00 AM to 10:59 AM | 2 (2.7%) | 11 (18.0%) |
| 11:00 AM to 11:59 AM | 0 (0.0%) | 0 (0.0%) |
| 12:00 PM to 3:59 PM | 4 (5.3%) | 2 (3.3%) |
| 4:00 PM to 11:59 PM | 1 (1.3%) | 4 (6.6%) |
| Total | 75 (100.0%) | 61 (100.0%) |
Housing Occupancy in Lakeland Shores
Occupancy by Ownership in Lakeland Shores
Of the total 120 dwellings in Lakeland Shores, owner-occupied units account for 110 (91.7%), while renter-occupied units make up 10 (8.3%).
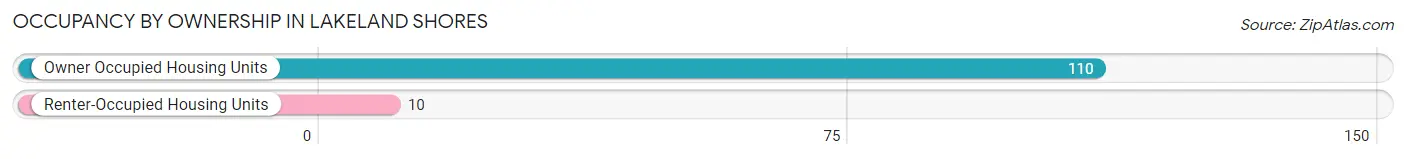
| Occupancy | # Housing Units | % Housing Units |
| Owner Occupied Housing Units | 110 | 91.7% |
| Renter-Occupied Housing Units | 10 | 8.3% |
| Total Occupied Housing Units | 120 | 100.0% |
Occupancy by Household Size in Lakeland Shores
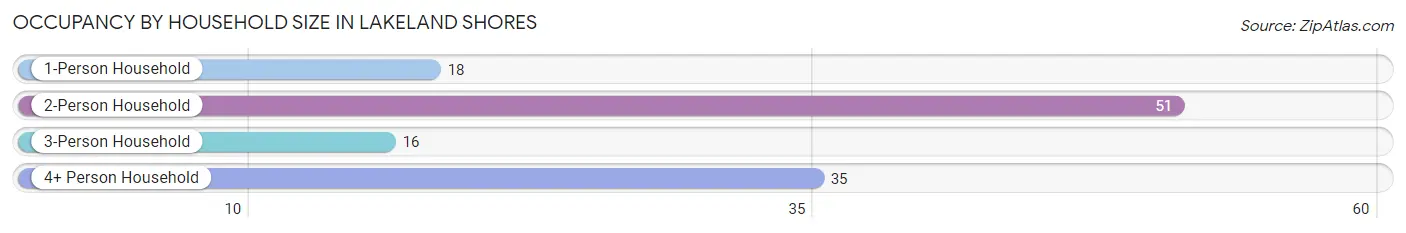
| Household Size | # Housing Units | % Housing Units |
| 1-Person Household | 18 | 15.0% |
| 2-Person Household | 51 | 42.5% |
| 3-Person Household | 16 | 13.3% |
| 4+ Person Household | 35 | 29.2% |
| Total Housing Units | 120 | 100.0% |
Occupancy by Ownership by Household Size in Lakeland Shores
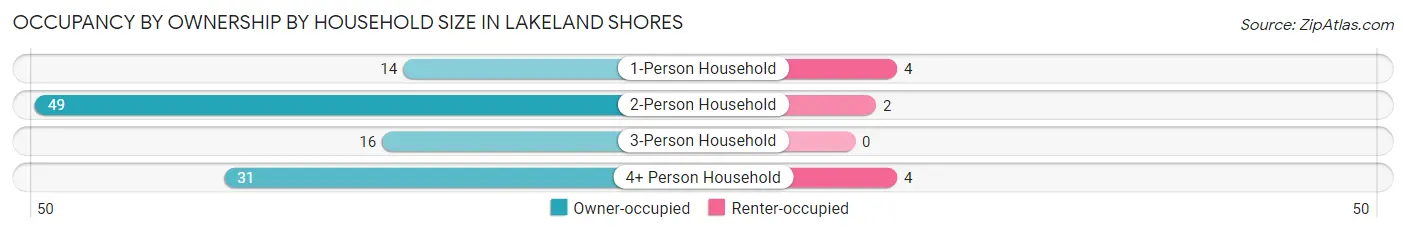
| Household Size | Owner-occupied | Renter-occupied |
| 1-Person Household | 14 (77.8%) | 4 (22.2%) |
| 2-Person Household | 49 (96.1%) | 2 (3.9%) |
| 3-Person Household | 16 (100.0%) | 0 (0.0%) |
| 4+ Person Household | 31 (88.6%) | 4 (11.4%) |
| Total Housing Units | 110 (91.7%) | 10 (8.3%) |
Occupancy by Educational Attainment in Lakeland Shores
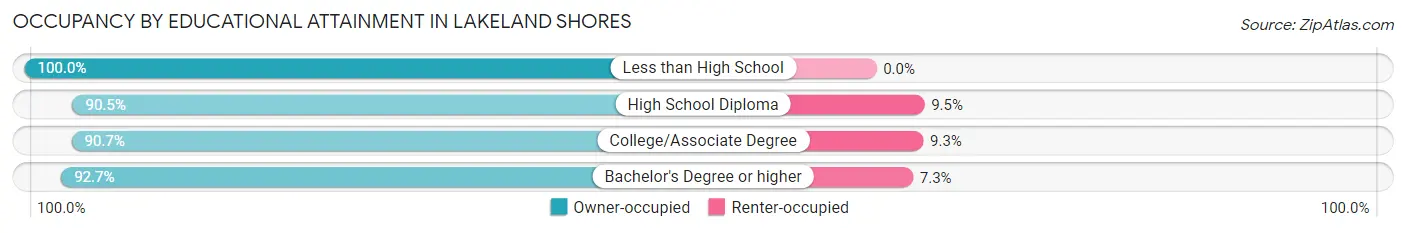
| Household Size | Owner-occupied | Renter-occupied |
| Less than High School | 1 (100.0%) | 0 (0.0%) |
| High School Diploma | 19 (90.5%) | 2 (9.5%) |
| College/Associate Degree | 39 (90.7%) | 4 (9.3%) |
| Bachelor's Degree or higher | 51 (92.7%) | 4 (7.3%) |
Occupancy by Age of Householder in Lakeland Shores
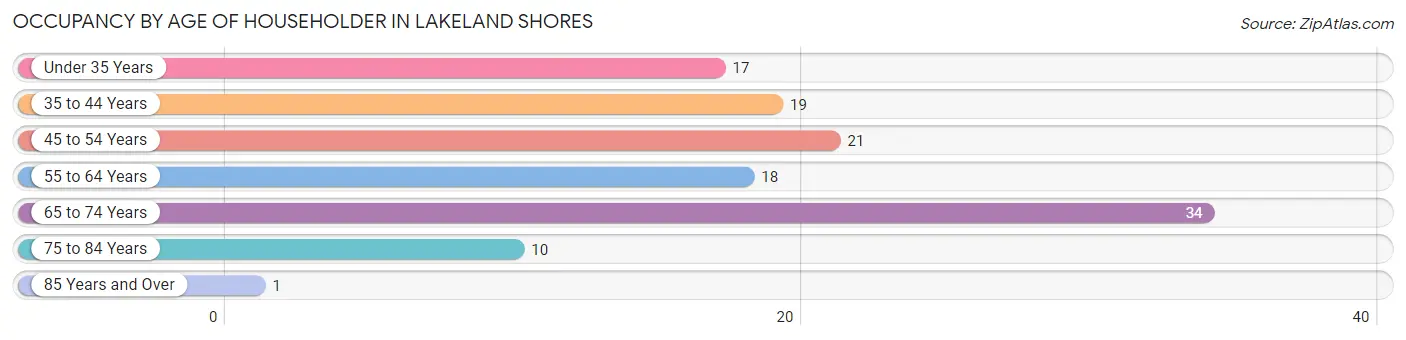
| Age Bracket | # Households | % Households |
| Under 35 Years | 17 | 14.2% |
| 35 to 44 Years | 19 | 15.8% |
| 45 to 54 Years | 21 | 17.5% |
| 55 to 64 Years | 18 | 15.0% |
| 65 to 74 Years | 34 | 28.3% |
| 75 to 84 Years | 10 | 8.3% |
| 85 Years and Over | 1 | 0.8% |
| Total | 120 | 100.0% |
Housing Finances in Lakeland Shores
Median Income by Occupancy in Lakeland Shores
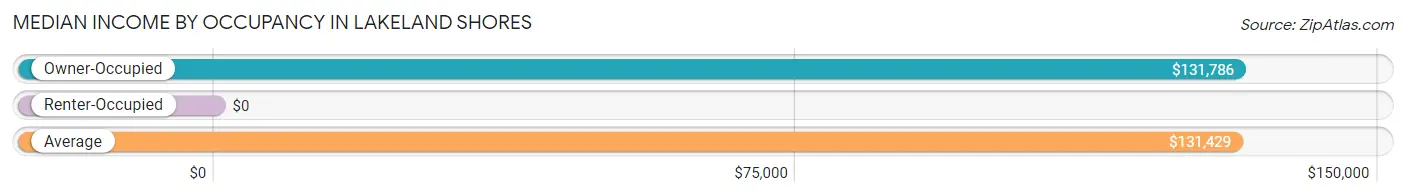
| Occupancy Type | # Households | Median Income |
| Owner-Occupied | 110 (91.7%) | $131,786 |
| Renter-Occupied | 10 (8.3%) | $0 |
| Average | 120 (100.0%) | $131,429 |
Occupancy by Householder Income Bracket in Lakeland Shores
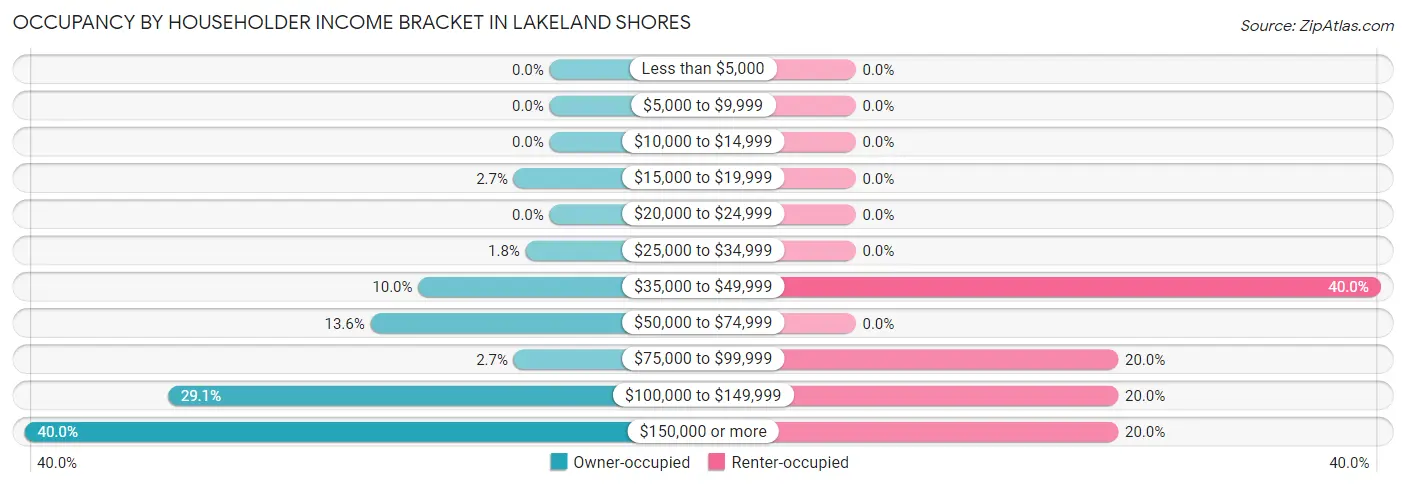
| Income Bracket | Owner-occupied | Renter-occupied |
| Less than $5,000 | 0 (0.0%) | 0 (0.0%) |
| $5,000 to $9,999 | 0 (0.0%) | 0 (0.0%) |
| $10,000 to $14,999 | 0 (0.0%) | 0 (0.0%) |
| $15,000 to $19,999 | 3 (2.7%) | 0 (0.0%) |
| $20,000 to $24,999 | 0 (0.0%) | 0 (0.0%) |
| $25,000 to $34,999 | 2 (1.8%) | 0 (0.0%) |
| $35,000 to $49,999 | 11 (10.0%) | 4 (40.0%) |
| $50,000 to $74,999 | 15 (13.6%) | 0 (0.0%) |
| $75,000 to $99,999 | 3 (2.7%) | 2 (20.0%) |
| $100,000 to $149,999 | 32 (29.1%) | 2 (20.0%) |
| $150,000 or more | 44 (40.0%) | 2 (20.0%) |
| Total | 110 (100.0%) | 10 (100.0%) |
Monthly Housing Cost Tiers in Lakeland Shores
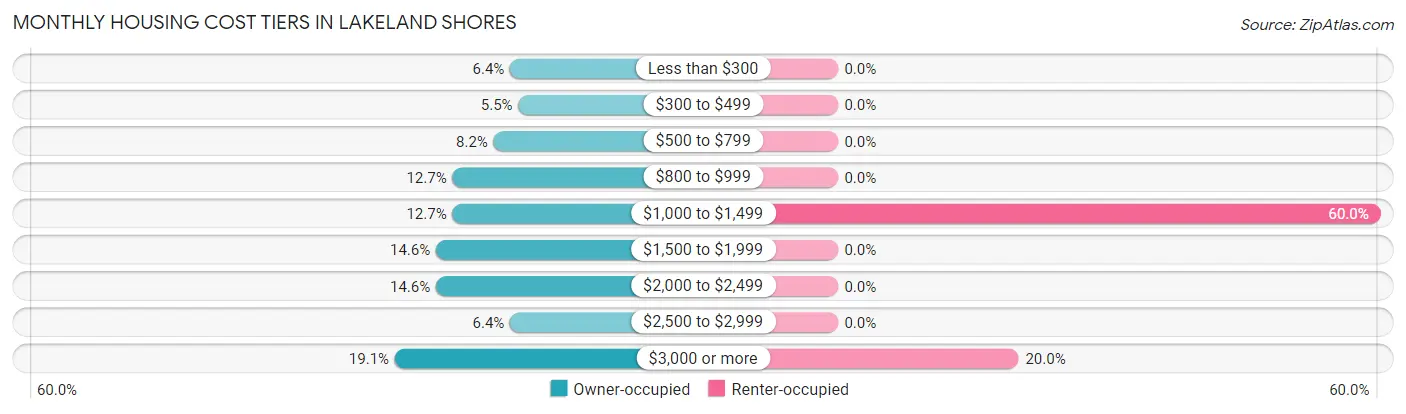
| Monthly Cost | Owner-occupied | Renter-occupied |
| Less than $300 | 7 (6.4%) | 0 (0.0%) |
| $300 to $499 | 6 (5.4%) | 0 (0.0%) |
| $500 to $799 | 9 (8.2%) | 0 (0.0%) |
| $800 to $999 | 14 (12.7%) | 0 (0.0%) |
| $1,000 to $1,499 | 14 (12.7%) | 6 (60.0%) |
| $1,500 to $1,999 | 16 (14.5%) | 0 (0.0%) |
| $2,000 to $2,499 | 16 (14.5%) | 0 (0.0%) |
| $2,500 to $2,999 | 7 (6.4%) | 0 (0.0%) |
| $3,000 or more | 21 (19.1%) | 2 (20.0%) |
| Total | 110 (100.0%) | 10 (100.0%) |
Physical Housing Characteristics in Lakeland Shores
Housing Structures in Lakeland Shores
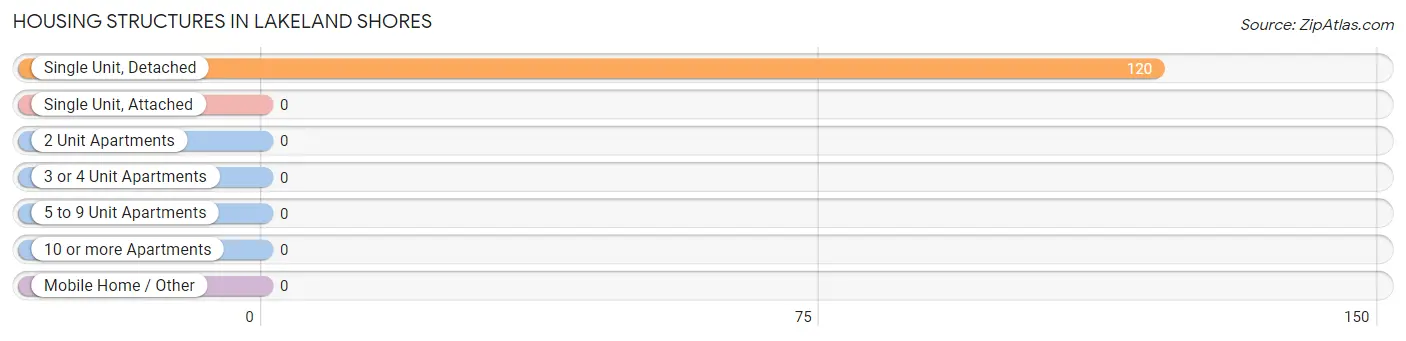
| Structure Type | # Housing Units | % Housing Units |
| Single Unit, Detached | 120 | 100.0% |
| Single Unit, Attached | 0 | 0.0% |
| 2 Unit Apartments | 0 | 0.0% |
| 3 or 4 Unit Apartments | 0 | 0.0% |
| 5 to 9 Unit Apartments | 0 | 0.0% |
| 10 or more Apartments | 0 | 0.0% |
| Mobile Home / Other | 0 | 0.0% |
| Total | 120 | 100.0% |
Housing Structures by Occupancy in Lakeland Shores
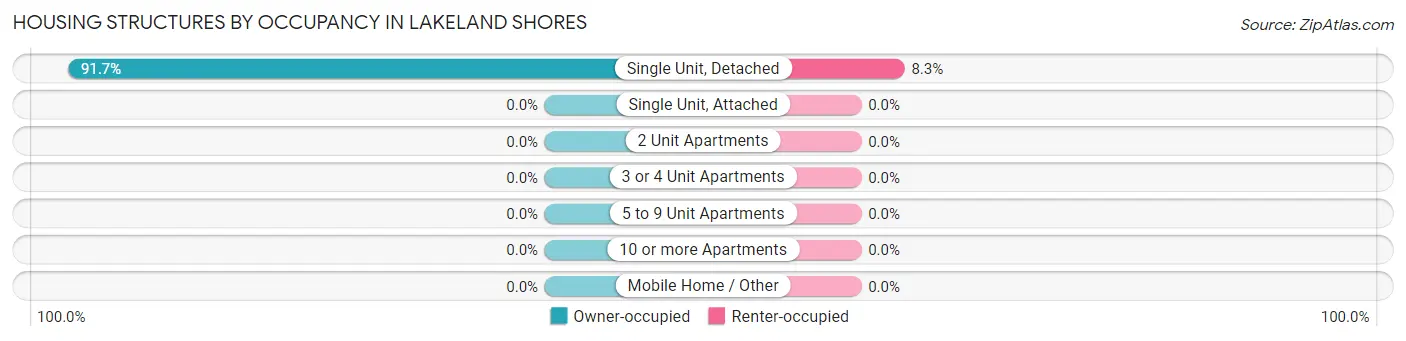
| Structure Type | Owner-occupied | Renter-occupied |
| Single Unit, Detached | 110 (91.7%) | 10 (8.3%) |
| Single Unit, Attached | 0 (0.0%) | 0 (0.0%) |
| 2 Unit Apartments | 0 (0.0%) | 0 (0.0%) |
| 3 or 4 Unit Apartments | 0 (0.0%) | 0 (0.0%) |
| 5 to 9 Unit Apartments | 0 (0.0%) | 0 (0.0%) |
| 10 or more Apartments | 0 (0.0%) | 0 (0.0%) |
| Mobile Home / Other | 0 (0.0%) | 0 (0.0%) |
| Total | 110 (91.7%) | 10 (8.3%) |
Housing Structures by Number of Rooms in Lakeland Shores
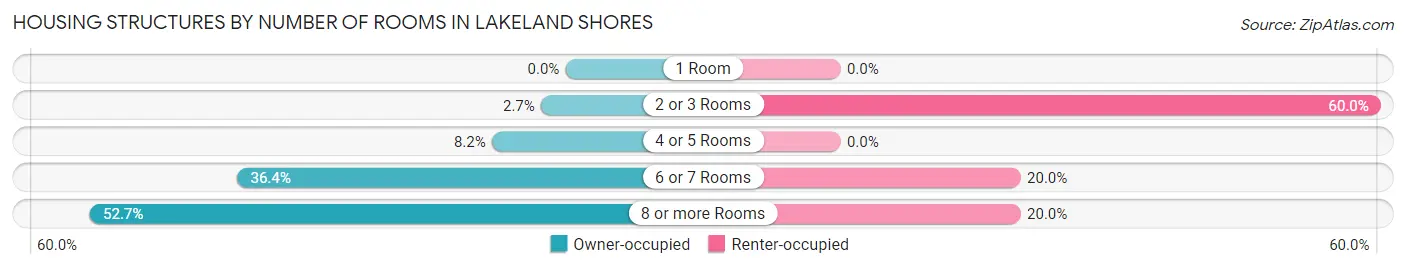
| Number of Rooms | Owner-occupied | Renter-occupied |
| 1 Room | 0 (0.0%) | 0 (0.0%) |
| 2 or 3 Rooms | 3 (2.7%) | 6 (60.0%) |
| 4 or 5 Rooms | 9 (8.2%) | 0 (0.0%) |
| 6 or 7 Rooms | 40 (36.4%) | 2 (20.0%) |
| 8 or more Rooms | 58 (52.7%) | 2 (20.0%) |
| Total | 110 (100.0%) | 10 (100.0%) |
Housing Structure by Heating Type in Lakeland Shores
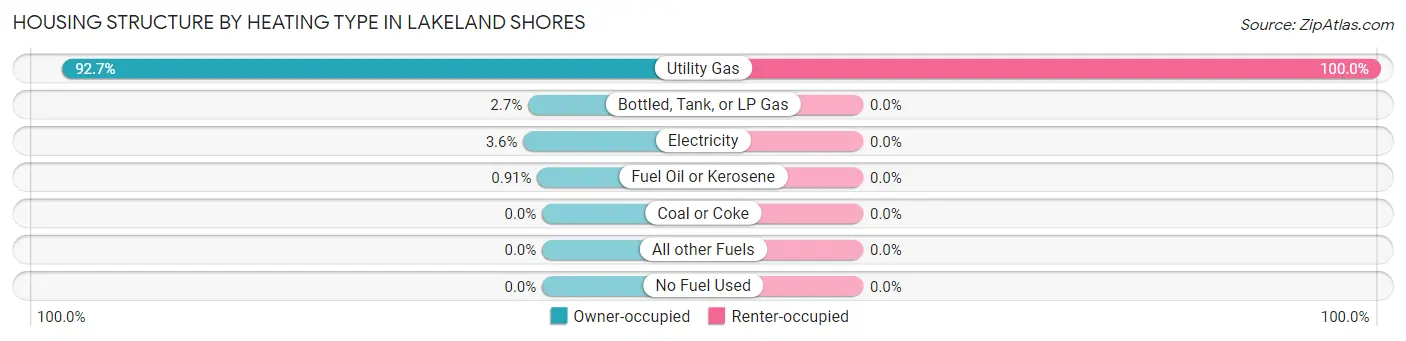
| Heating Type | Owner-occupied | Renter-occupied |
| Utility Gas | 102 (92.7%) | 10 (100.0%) |
| Bottled, Tank, or LP Gas | 3 (2.7%) | 0 (0.0%) |
| Electricity | 4 (3.6%) | 0 (0.0%) |
| Fuel Oil or Kerosene | 1 (0.9%) | 0 (0.0%) |
| Coal or Coke | 0 (0.0%) | 0 (0.0%) |
| All other Fuels | 0 (0.0%) | 0 (0.0%) |
| No Fuel Used | 0 (0.0%) | 0 (0.0%) |
| Total | 110 (100.0%) | 10 (100.0%) |
Household Vehicle Usage in Lakeland Shores
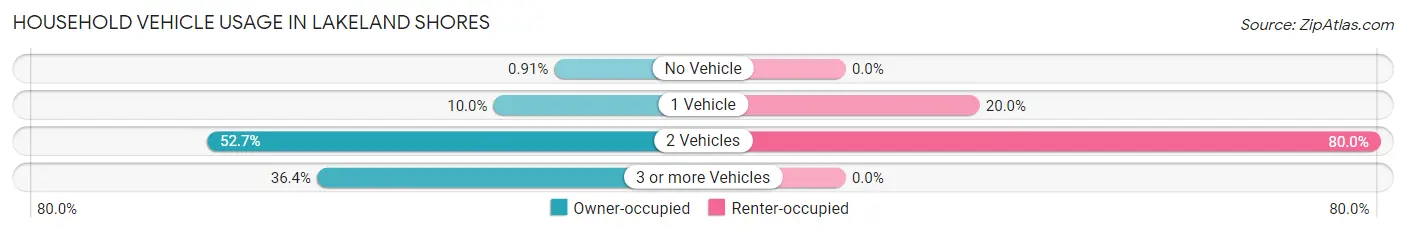
| Vehicles per Household | Owner-occupied | Renter-occupied |
| No Vehicle | 1 (0.9%) | 0 (0.0%) |
| 1 Vehicle | 11 (10.0%) | 2 (20.0%) |
| 2 Vehicles | 58 (52.7%) | 8 (80.0%) |
| 3 or more Vehicles | 40 (36.4%) | 0 (0.0%) |
| Total | 110 (100.0%) | 10 (100.0%) |
Real Estate & Mortgages in Lakeland Shores
Real Estate and Mortgage Overview in Lakeland Shores
| Characteristic | Without Mortgage | With Mortgage |
| Housing Units | 42 | 68 |
| Median Property Value | $385,700 | $415,400 |
| Median Household Income | - | - |
| Monthly Housing Costs | $680 | $21 |
| Real Estate Taxes | $3,250 | $2 |
Property Value by Mortgage Status in Lakeland Shores
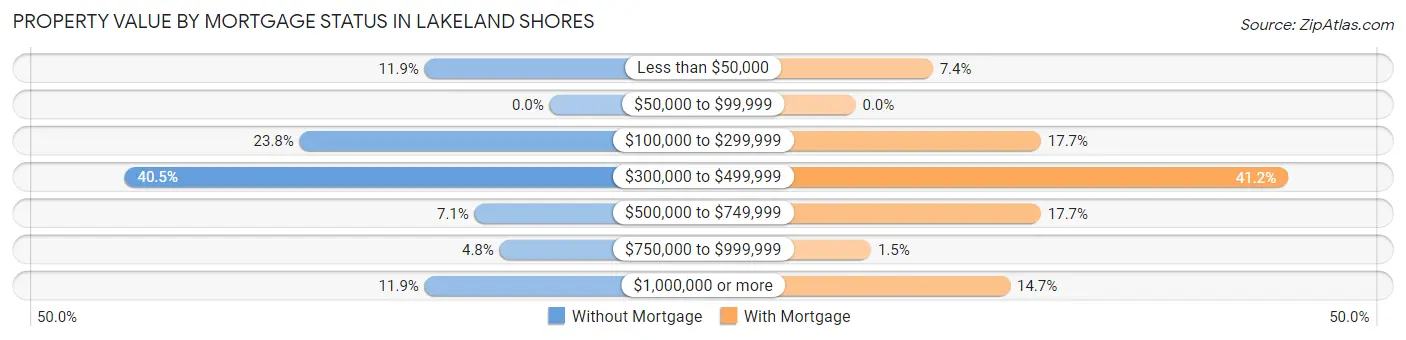
| Property Value | Without Mortgage | With Mortgage |
| Less than $50,000 | 5 (11.9%) | 5 (7.3%) |
| $50,000 to $99,999 | 0 (0.0%) | 0 (0.0%) |
| $100,000 to $299,999 | 10 (23.8%) | 12 (17.6%) |
| $300,000 to $499,999 | 17 (40.5%) | 28 (41.2%) |
| $500,000 to $749,999 | 3 (7.1%) | 12 (17.6%) |
| $750,000 to $999,999 | 2 (4.8%) | 1 (1.5%) |
| $1,000,000 or more | 5 (11.9%) | 10 (14.7%) |
| Total | 42 (100.0%) | 68 (100.0%) |
Household Income by Mortgage Status in Lakeland Shores
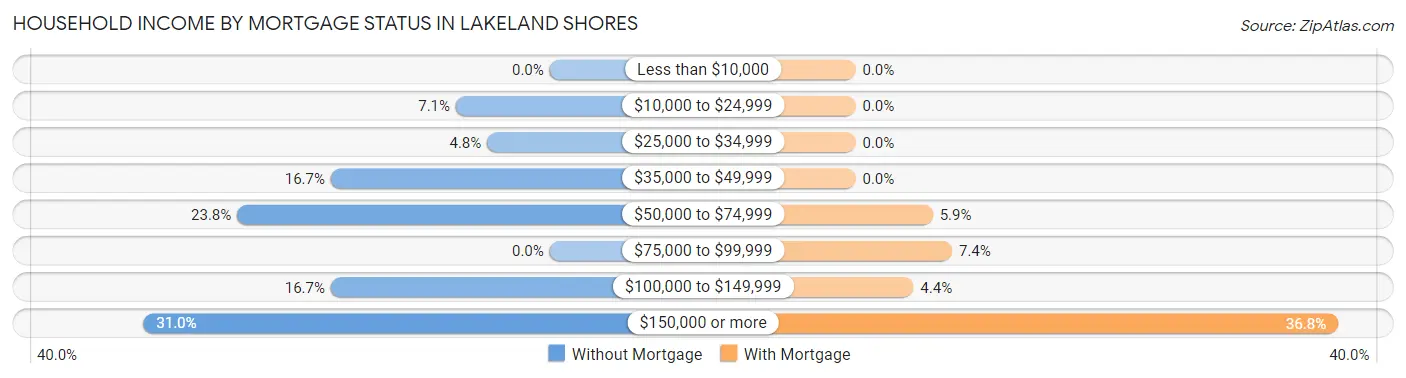
| Household Income | Without Mortgage | With Mortgage |
| Less than $10,000 | 0 (0.0%) | 0 (0.0%) |
| $10,000 to $24,999 | 3 (7.1%) | 0 (0.0%) |
| $25,000 to $34,999 | 2 (4.8%) | 0 (0.0%) |
| $35,000 to $49,999 | 7 (16.7%) | 0 (0.0%) |
| $50,000 to $74,999 | 10 (23.8%) | 4 (5.9%) |
| $75,000 to $99,999 | 0 (0.0%) | 5 (7.3%) |
| $100,000 to $149,999 | 7 (16.7%) | 3 (4.4%) |
| $150,000 or more | 13 (30.9%) | 25 (36.8%) |
| Total | 42 (100.0%) | 68 (100.0%) |
Property Value to Household Income Ratio in Lakeland Shores
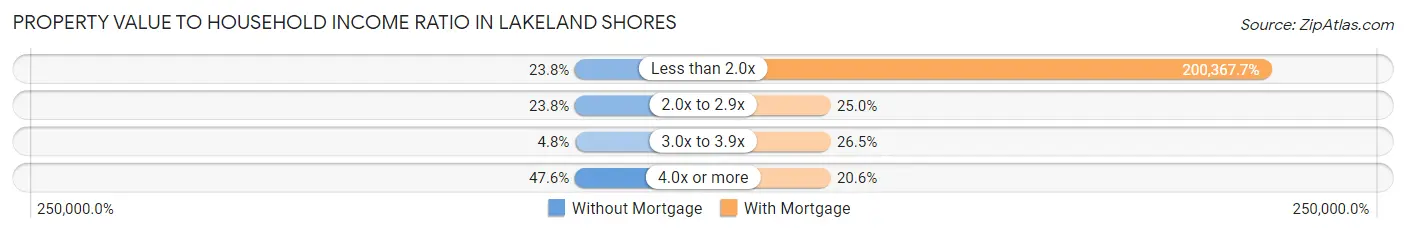
| Value-to-Income Ratio | Without Mortgage | With Mortgage |
| Less than 2.0x | 10 (23.8%) | 136,250 (200,367.7%) |
| 2.0x to 2.9x | 10 (23.8%) | 17 (25.0%) |
| 3.0x to 3.9x | 2 (4.8%) | 18 (26.5%) |
| 4.0x or more | 20 (47.6%) | 14 (20.6%) |
| Total | 42 (100.0%) | 68 (100.0%) |
Real Estate Taxes by Mortgage Status in Lakeland Shores
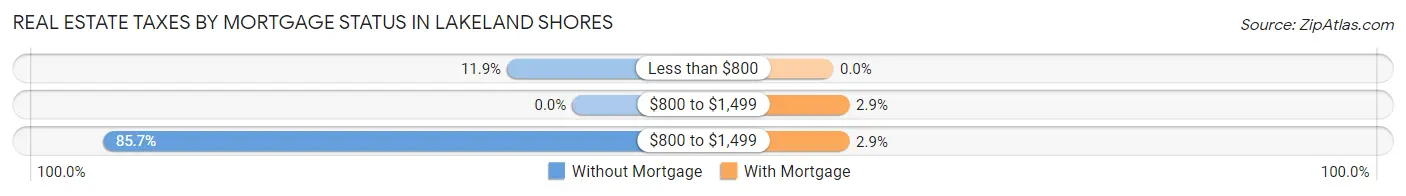
| Property Taxes | Without Mortgage | With Mortgage |
| Less than $800 | 5 (11.9%) | 0 (0.0%) |
| $800 to $1,499 | 0 (0.0%) | 2 (2.9%) |
| $800 to $1,499 | 36 (85.7%) | 2 (2.9%) |
| Total | 42 (100.0%) | 68 (100.0%) |
Health & Disability in Lakeland Shores
Health Insurance Coverage by Age in Lakeland Shores
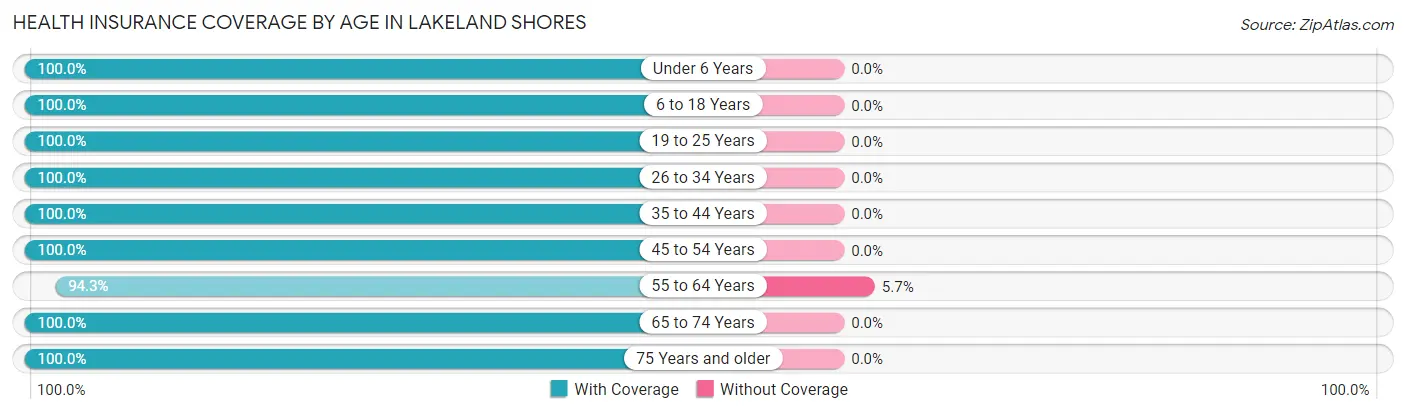
| Age Bracket | With Coverage | Without Coverage |
| Under 6 Years | 25 (100.0%) | 0 (0.0%) |
| 6 to 18 Years | 62 (100.0%) | 0 (0.0%) |
| 19 to 25 Years | 15 (100.0%) | 0 (0.0%) |
| 26 to 34 Years | 27 (100.0%) | 0 (0.0%) |
| 35 to 44 Years | 46 (100.0%) | 0 (0.0%) |
| 45 to 54 Years | 42 (100.0%) | 0 (0.0%) |
| 55 to 64 Years | 33 (94.3%) | 2 (5.7%) |
| 65 to 74 Years | 56 (100.0%) | 0 (0.0%) |
| 75 Years and older | 22 (100.0%) | 0 (0.0%) |
| Total | 328 (99.4%) | 2 (0.6%) |
Health Insurance Coverage by Citizenship Status in Lakeland Shores
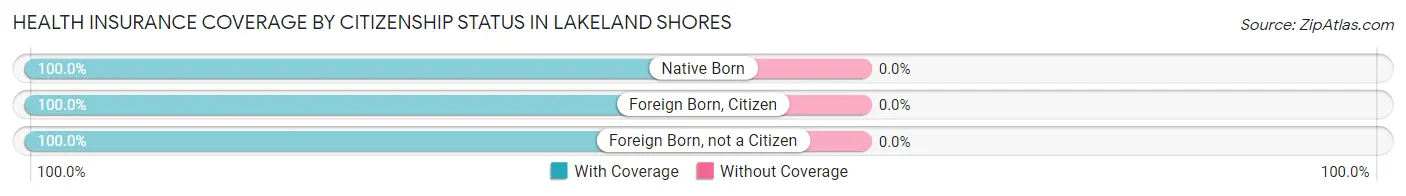
| Citizenship Status | With Coverage | Without Coverage |
| Native Born | 25 (100.0%) | 0 (0.0%) |
| Foreign Born, Citizen | 62 (100.0%) | 0 (0.0%) |
| Foreign Born, not a Citizen | 15 (100.0%) | 0 (0.0%) |
Health Insurance Coverage by Household Income in Lakeland Shores
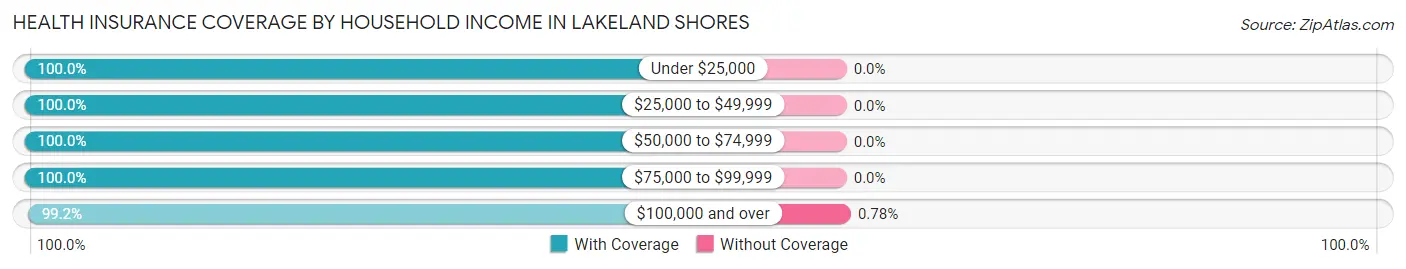
| Household Income | With Coverage | Without Coverage |
| Under $25,000 | 5 (100.0%) | 0 (0.0%) |
| $25,000 to $49,999 | 32 (100.0%) | 0 (0.0%) |
| $50,000 to $74,999 | 28 (100.0%) | 0 (0.0%) |
| $75,000 to $99,999 | 7 (100.0%) | 0 (0.0%) |
| $100,000 and over | 256 (99.2%) | 2 (0.8%) |
Public vs Private Health Insurance Coverage by Age in Lakeland Shores
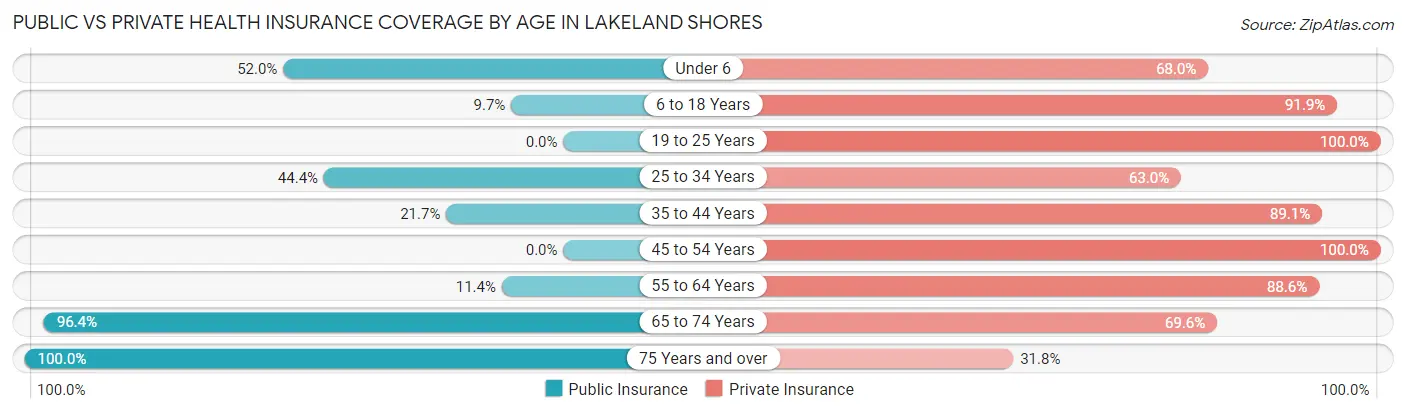
| Age Bracket | Public Insurance | Private Insurance |
| Under 6 | 13 (52.0%) | 17 (68.0%) |
| 6 to 18 Years | 6 (9.7%) | 57 (91.9%) |
| 19 to 25 Years | 0 (0.0%) | 15 (100.0%) |
| 25 to 34 Years | 12 (44.4%) | 17 (63.0%) |
| 35 to 44 Years | 10 (21.7%) | 41 (89.1%) |
| 45 to 54 Years | 0 (0.0%) | 42 (100.0%) |
| 55 to 64 Years | 4 (11.4%) | 31 (88.6%) |
| 65 to 74 Years | 54 (96.4%) | 39 (69.6%) |
| 75 Years and over | 22 (100.0%) | 7 (31.8%) |
| Total | 121 (36.7%) | 266 (80.6%) |
Disability Status by Sex by Age in Lakeland Shores
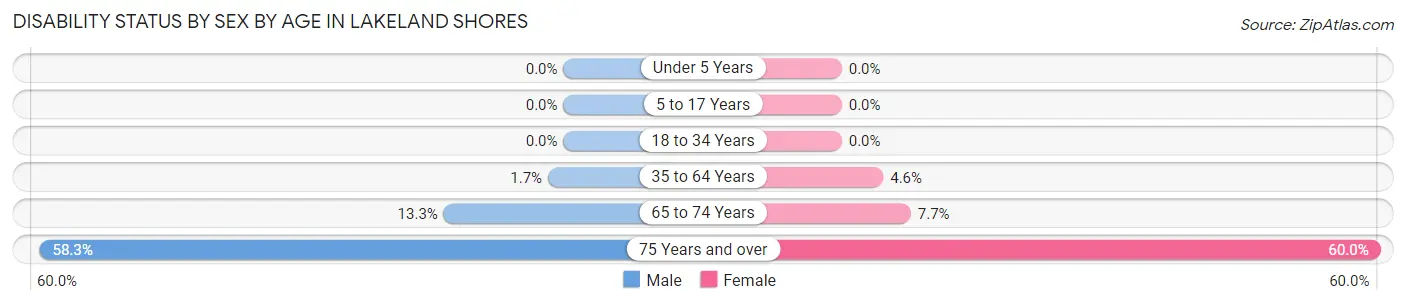
| Age Bracket | Male | Female |
| Under 5 Years | 0 (0.0%) | 0 (0.0%) |
| 5 to 17 Years | 0 (0.0%) | 0 (0.0%) |
| 18 to 34 Years | 0 (0.0%) | 0 (0.0%) |
| 35 to 64 Years | 1 (1.7%) | 3 (4.6%) |
| 65 to 74 Years | 4 (13.3%) | 2 (7.7%) |
| 75 Years and over | 7 (58.3%) | 6 (60.0%) |
Disability Class by Sex by Age in Lakeland Shores
Disability Class: Hearing Difficulty
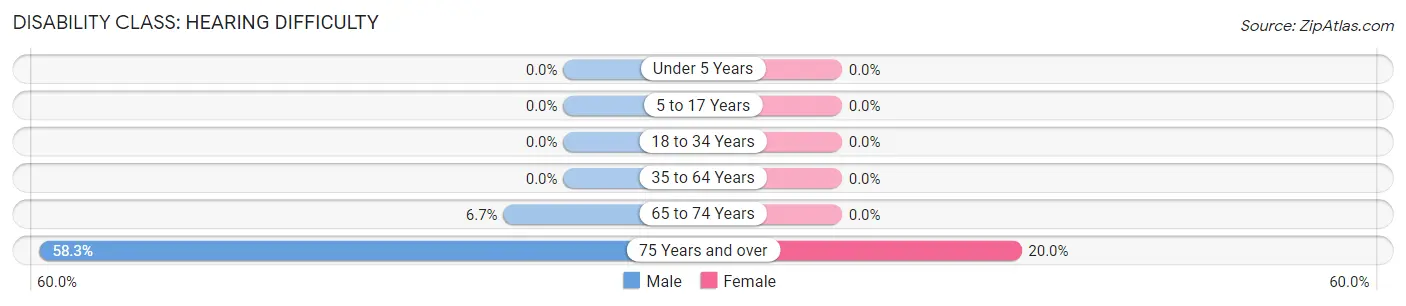
| Age Bracket | Male | Female |
| Under 5 Years | 0 (0.0%) | 0 (0.0%) |
| 5 to 17 Years | 0 (0.0%) | 0 (0.0%) |
| 18 to 34 Years | 0 (0.0%) | 0 (0.0%) |
| 35 to 64 Years | 0 (0.0%) | 0 (0.0%) |
| 65 to 74 Years | 2 (6.7%) | 0 (0.0%) |
| 75 Years and over | 7 (58.3%) | 2 (20.0%) |
Disability Class: Vision Difficulty
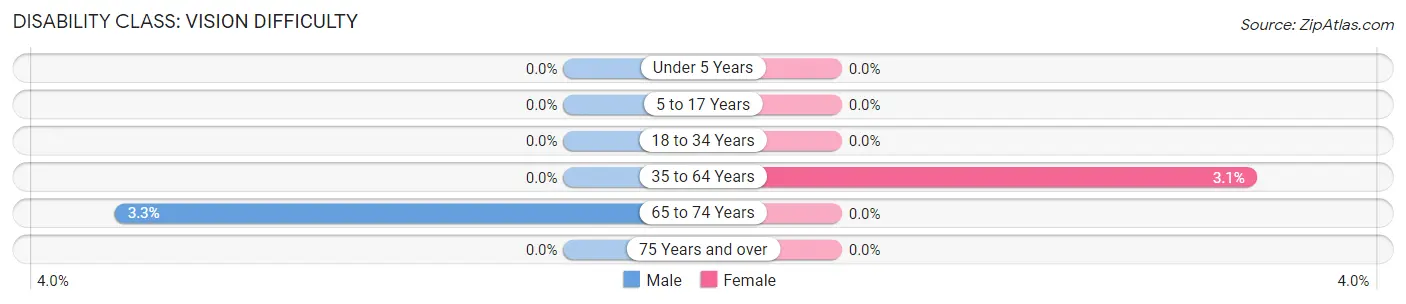
| Age Bracket | Male | Female |
| Under 5 Years | 0 (0.0%) | 0 (0.0%) |
| 5 to 17 Years | 0 (0.0%) | 0 (0.0%) |
| 18 to 34 Years | 0 (0.0%) | 0 (0.0%) |
| 35 to 64 Years | 0 (0.0%) | 2 (3.1%) |
| 65 to 74 Years | 1 (3.3%) | 0 (0.0%) |
| 75 Years and over | 0 (0.0%) | 0 (0.0%) |
Disability Class: Cognitive Difficulty
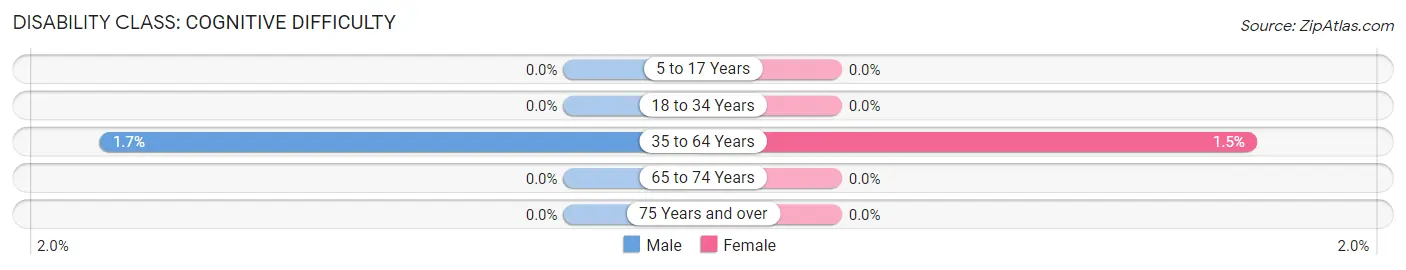
| Age Bracket | Male | Female |
| 5 to 17 Years | 0 (0.0%) | 0 (0.0%) |
| 18 to 34 Years | 0 (0.0%) | 0 (0.0%) |
| 35 to 64 Years | 1 (1.7%) | 1 (1.5%) |
| 65 to 74 Years | 0 (0.0%) | 0 (0.0%) |
| 75 Years and over | 0 (0.0%) | 0 (0.0%) |
Disability Class: Ambulatory Difficulty
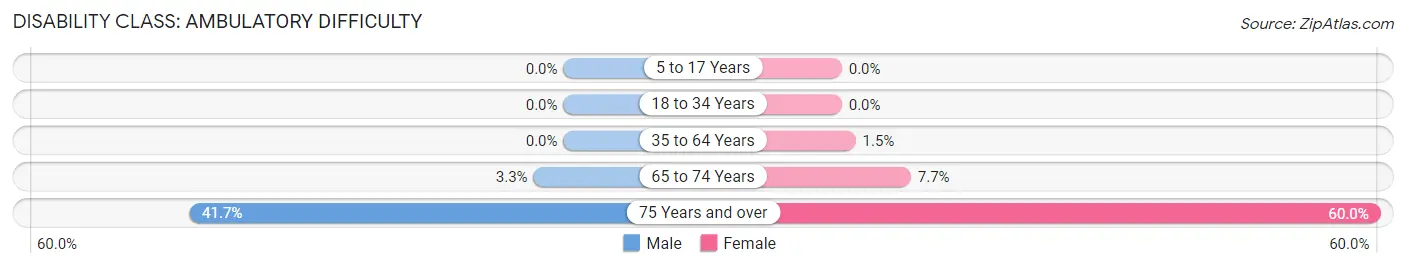
| Age Bracket | Male | Female |
| 5 to 17 Years | 0 (0.0%) | 0 (0.0%) |
| 18 to 34 Years | 0 (0.0%) | 0 (0.0%) |
| 35 to 64 Years | 0 (0.0%) | 1 (1.5%) |
| 65 to 74 Years | 1 (3.3%) | 2 (7.7%) |
| 75 Years and over | 5 (41.7%) | 6 (60.0%) |
Disability Class: Self-Care Difficulty
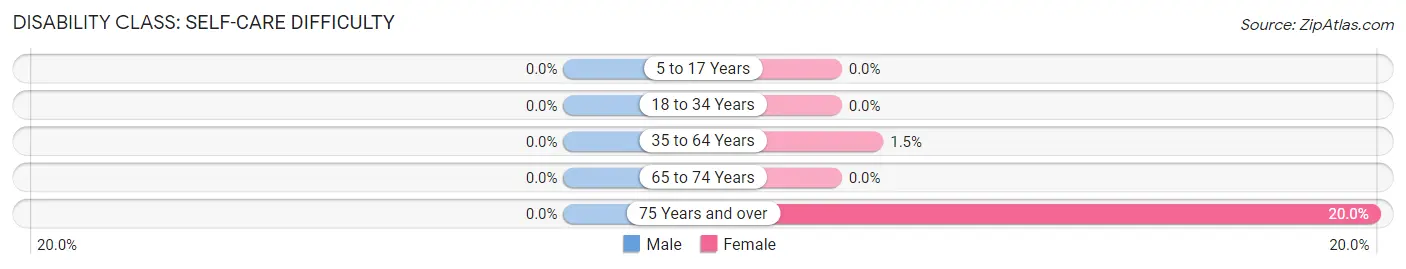
| Age Bracket | Male | Female |
| 5 to 17 Years | 0 (0.0%) | 0 (0.0%) |
| 18 to 34 Years | 0 (0.0%) | 0 (0.0%) |
| 35 to 64 Years | 0 (0.0%) | 1 (1.5%) |
| 65 to 74 Years | 0 (0.0%) | 0 (0.0%) |
| 75 Years and over | 0 (0.0%) | 2 (20.0%) |
Technology Access in Lakeland Shores
Computing Device Access in Lakeland Shores
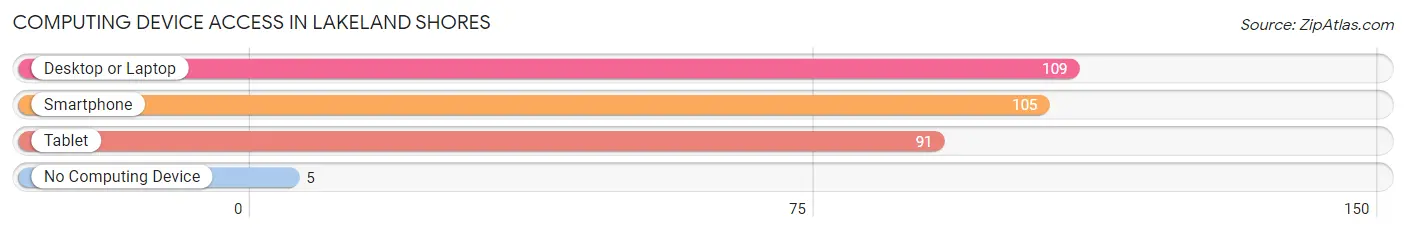
| Device Type | # Households | % Households |
| Desktop or Laptop | 109 | 90.8% |
| Smartphone | 105 | 87.5% |
| Tablet | 91 | 75.8% |
| No Computing Device | 5 | 4.2% |
| Total | 120 | 100.0% |
Internet Access in Lakeland Shores
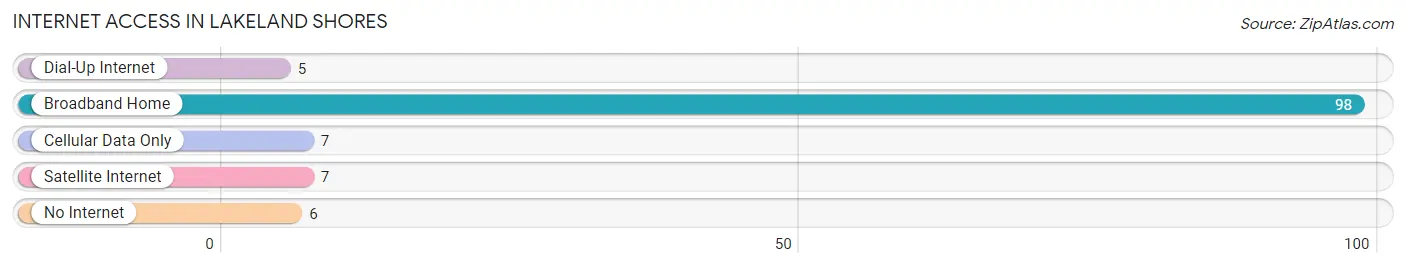
| Internet Type | # Households | % Households |
| Dial-Up Internet | 5 | 4.2% |
| Broadband Home | 98 | 81.7% |
| Cellular Data Only | 7 | 5.8% |
| Satellite Internet | 7 | 5.8% |
| No Internet | 6 | 5.0% |
| Total | 120 | 100.0% |
Lakeland Shores Summary
Lakeland Shores, Minnesota is a small city located in the northern part of the state, just south of the city of Duluth. It is situated on the western shore of Lake Superior, the largest of the Great Lakes. The city is home to a population of just over 4,000 people, and is a popular destination for tourists and outdoor enthusiasts alike.
History
The area that is now Lakeland Shores was first settled in the late 1800s by a group of Finnish immigrants. The immigrants were drawn to the area by the abundance of natural resources, including timber and fish. The settlers established a small fishing village, which eventually grew into the city of Lakeland Shores.
The city was officially incorporated in 1909, and the first mayor was elected in 1910. The city quickly grew in size and population, and by the 1920s it had become a popular tourist destination. The city was known for its beautiful beaches, and it was a popular spot for swimming, boating, and fishing.
Geography
Lakeland Shores is located in the northern part of Minnesota, just south of the city of Duluth. It is situated on the western shore of Lake Superior, the largest of the Great Lakes. The city is surrounded by a number of smaller lakes, including Lake Superior, Lake Vermilion, and Lake of the Woods. The city is also home to a number of parks and nature preserves, including the Lakeland Shores State Park.
The city has a total area of 8.3 square miles, of which 7.9 square miles is land and 0.4 square miles is water. The city is located at an elevation of 1,072 feet above sea level.
Economy
The economy of Lakeland Shores is largely based on tourism and outdoor recreation. The city is home to a number of resorts and hotels, as well as a variety of restaurants and shops. The city is also home to a number of marinas, which provide access to the many lakes in the area.
The city is also home to a number of manufacturing and industrial businesses, including a paper mill and a lumber mill. The city is also home to a number of small businesses, including retail stores, restaurants, and other services.
Demographics
As of the 2010 census, the population of Lakeland Shores was 4,072. The racial makeup of the city was 97.2% White, 0.7% African American, 0.3% Native American, 0.3% Asian, 0.1% Pacific Islander, 0.3% from other races, and 1.2% from two or more races. Hispanic or Latino of any race were 1.2% of the population.
The median household income in the city was $45,938, and the median family income was $51,938. The per capita income for the city was $21,938. About 8.2% of families and 10.2% of the population were below the poverty line, including 14.2% of those under age 18 and 6.2% of those age 65 or over.
Common Questions
What is Per Capita Income in Lakeland Shores?
Per Capita income in Lakeland Shores is $57,057.
What is the Median Family Income in Lakeland Shores?
Median Family Income in Lakeland Shores is $132,500.
What is the Median Household income in Lakeland Shores?
Median Household Income in Lakeland Shores is $131,429.
What is Income or Wage Gap in Lakeland Shores?
Income or Wage Gap in Lakeland Shores is 38.5%.
Women in Lakeland Shores earn 61.5 cents for every dollar earned by a man.
What is Inequality or Gini Index in Lakeland Shores?
Inequality or Gini Index in Lakeland Shores is 0.39.
What is the Total Population of Lakeland Shores?
Total Population of Lakeland Shores is 330.
What is the Total Male Population of Lakeland Shores?
Total Male Population of Lakeland Shores is 164.
What is the Total Female Population of Lakeland Shores?
Total Female Population of Lakeland Shores is 166.
What is the Ratio of Males per 100 Females in Lakeland Shores?
There are 98.80 Males per 100 Females in Lakeland Shores.
What is the Ratio of Females per 100 Males in Lakeland Shores?
There are 101.22 Females per 100 Males in Lakeland Shores.
What is the Median Population Age in Lakeland Shores?
Median Population Age in Lakeland Shores is 43.1 Years.
What is the Average Family Size in Lakeland Shores
Average Family Size in Lakeland Shores is 3.0 People.
What is the Average Household Size in Lakeland Shores
Average Household Size in Lakeland Shores is 2.8 People.
How Large is the Labor Force in Lakeland Shores?
There are 150 People in the Labor Forcein in Lakeland Shores.
What is the Percentage of People in the Labor Force in Lakeland Shores?
58.4% of People are in the Labor Force in Lakeland Shores.