Lake George, MN Map & Demographics
Lake George Map
Lake George Overview
$32,617
PER CAPITA INCOME
$64,688
AVG FAMILY INCOME
$67,500
AVG HOUSEHOLD INCOME
51.6%
WAGE / INCOME GAP [ % ]
48.4¢/ $1
WAGE / INCOME GAP [ $ ]
0.33
INEQUALITY / GINI INDEX
256
TOTAL POPULATION
149
MALE POPULATION
107
FEMALE POPULATION
139.25
MALES / 100 FEMALES
71.81
FEMALES / 100 MALES
49.2
MEDIAN AGE
3.2
AVG FAMILY SIZE
2.9
AVG HOUSEHOLD SIZE
124
LABOR FORCE [ PEOPLE ]
56.1%
PERCENT IN LABOR FORCE
16.1%
UNEMPLOYMENT RATE
Lake George Zip Codes
Lake George Area Codes
Income in Lake George
Income Overview in Lake George
Per Capita Income in Lake George is $32,617, while median incomes of families and households are $64,688 and $67,500 respectively.
| Characteristic | Number | Measure |
| Per Capita Income | 256 | $32,617 |
| Median Family Income | 71 | $64,688 |
| Mean Family Income | 71 | $79,168 |
| Median Household Income | 88 | $67,500 |
| Mean Household Income | 88 | $86,292 |
| Income Deficit | 71 | $0 |
| Wage / Income Gap (%) | 256 | 51.65% |
| Wage / Income Gap ($) | 256 | 48.35¢ per $1 |
| Gini / Inequality Index | 256 | 0.33 |
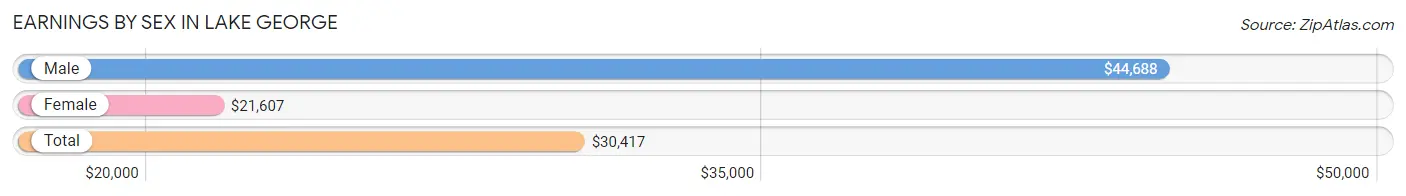
Earnings by Sex in Lake George
Average Earnings in Lake George are $30,417, $44,688 for men and $21,607 for women, a difference of 51.6%.
| Sex | Number | Average Earnings |
| Male | 76 (56.7%) | $44,688 |
| Female | 58 (43.3%) | $21,607 |
| Total | 134 (100.0%) | $30,417 |
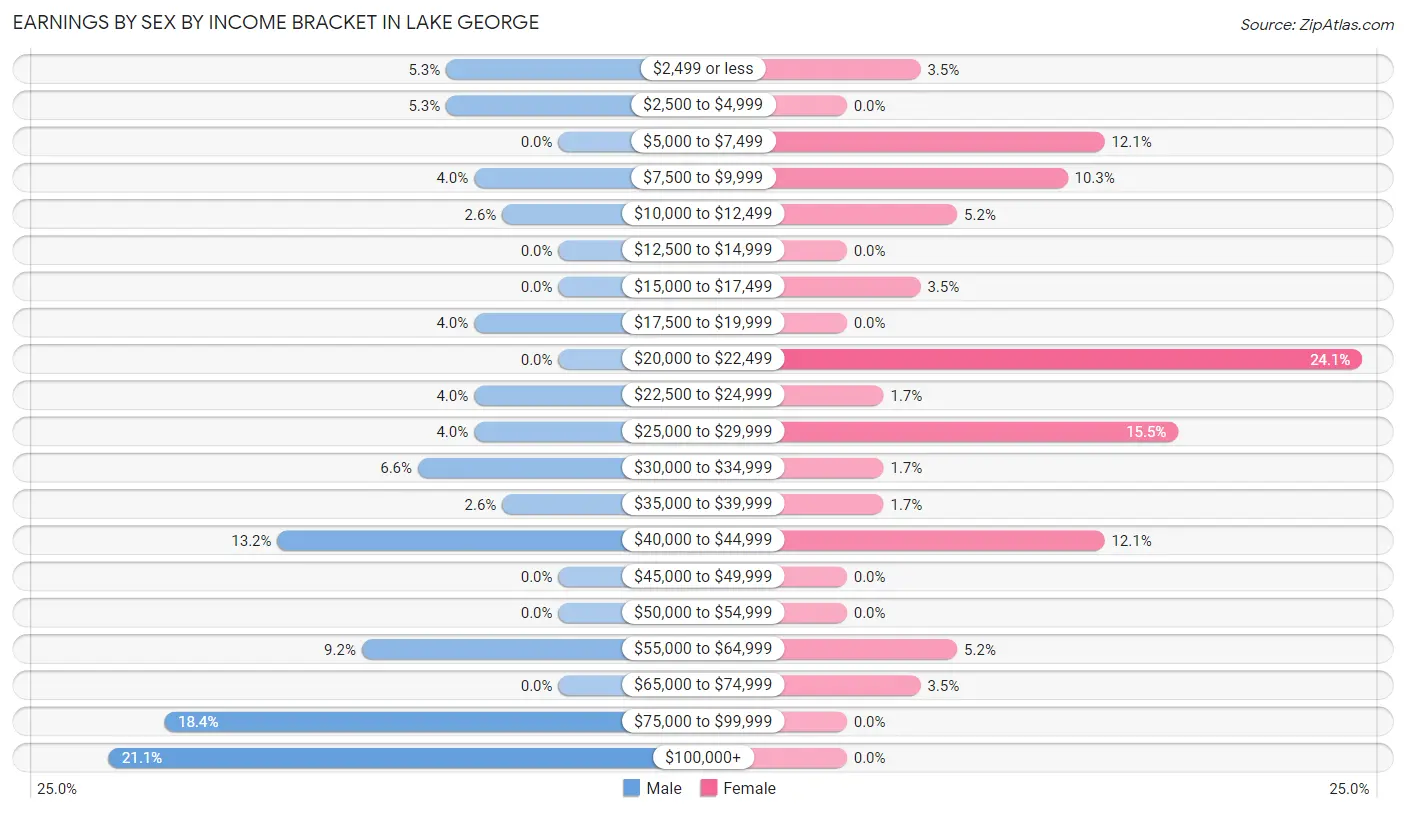
Earnings by Sex by Income Bracket in Lake George
The most common earnings brackets in Lake George are $100,000+ for men (16 | 21.0%) and $20,000 to $22,499 for women (14 | 24.1%).
| Income | Male | Female |
| $2,499 or less | 4 (5.3%) | 2 (3.5%) |
| $2,500 to $4,999 | 4 (5.3%) | 0 (0.0%) |
| $5,000 to $7,499 | 0 (0.0%) | 7 (12.1%) |
| $7,500 to $9,999 | 3 (4.0%) | 6 (10.3%) |
| $10,000 to $12,499 | 2 (2.6%) | 3 (5.2%) |
| $12,500 to $14,999 | 0 (0.0%) | 0 (0.0%) |
| $15,000 to $17,499 | 0 (0.0%) | 2 (3.5%) |
| $17,500 to $19,999 | 3 (4.0%) | 0 (0.0%) |
| $20,000 to $22,499 | 0 (0.0%) | 14 (24.1%) |
| $22,500 to $24,999 | 3 (4.0%) | 1 (1.7%) |
| $25,000 to $29,999 | 3 (4.0%) | 9 (15.5%) |
| $30,000 to $34,999 | 5 (6.6%) | 1 (1.7%) |
| $35,000 to $39,999 | 2 (2.6%) | 1 (1.7%) |
| $40,000 to $44,999 | 10 (13.2%) | 7 (12.1%) |
| $45,000 to $49,999 | 0 (0.0%) | 0 (0.0%) |
| $50,000 to $54,999 | 0 (0.0%) | 0 (0.0%) |
| $55,000 to $64,999 | 7 (9.2%) | 3 (5.2%) |
| $65,000 to $74,999 | 0 (0.0%) | 2 (3.5%) |
| $75,000 to $99,999 | 14 (18.4%) | 0 (0.0%) |
| $100,000+ | 16 (21.0%) | 0 (0.0%) |
| Total | 76 (100.0%) | 58 (100.0%) |
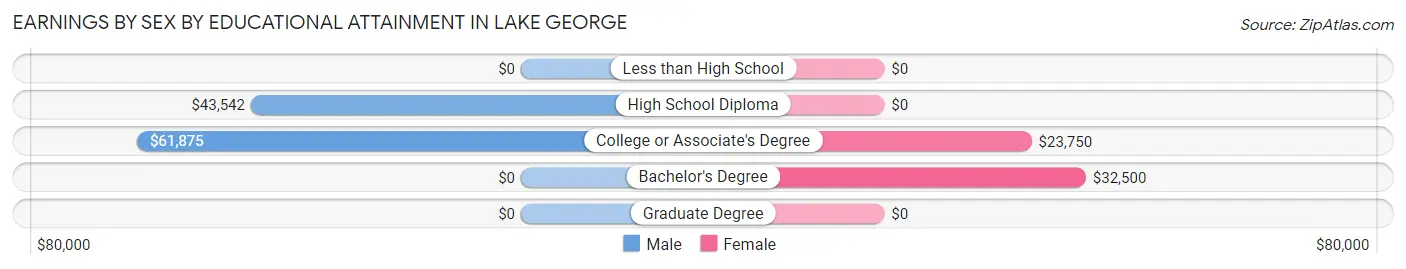
Earnings by Sex by Educational Attainment in Lake George
Average earnings in Lake George are $60,000 for men and $27,857 for women, a difference of 53.6%. Men with an educational attainment of college or associate's degree enjoy the highest average annual earnings of $61,875, while those with high school diploma education earn the least with $43,542. Women with an educational attainment of bachelor's degree earn the most with the average annual earnings of $32,500, while those with college or associate's degree education have the smallest earnings of $23,750.
| Educational Attainment | Male Income | Female Income |
| Less than High School | - | - |
| High School Diploma | $43,542 | $0 |
| College or Associate's Degree | $61,875 | $23,750 |
| Bachelor's Degree | - | - |
| Graduate Degree | - | - |
| Total | $60,000 | $27,857 |
Family Income in Lake George
Family Income Brackets in Lake George
According to the Lake George family income data, there are 18 families falling into the $50,000 to $74,999 income range, which is the most common income bracket and makes up 25.4% of all families.
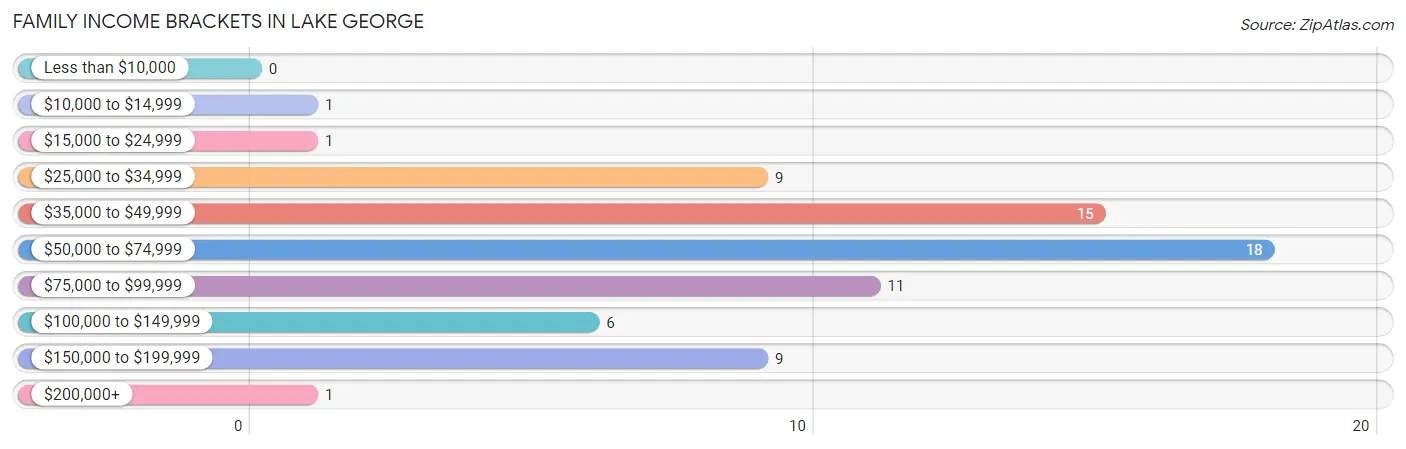
| Income Bracket | # Families | % Families |
| Less than $10,000 | 0 | 0.0% |
| $10,000 to $14,999 | 1 | 1.4% |
| $15,000 to $24,999 | 1 | 1.4% |
| $25,000 to $34,999 | 9 | 12.7% |
| $35,000 to $49,999 | 15 | 21.1% |
| $50,000 to $74,999 | 18 | 25.4% |
| $75,000 to $99,999 | 11 | 15.5% |
| $100,000 to $149,999 | 6 | 8.5% |
| $150,000 to $199,999 | 9 | 12.7% |
| $200,000+ | 1 | 1.4% |
Family Income by Famaliy Size in Lake George
4-person families (20 | 28.2%) account for the highest median family income in Lake George with $139,375 per family, while 4-person families (20 | 28.2%) have the highest median income of $34,844 per family member.
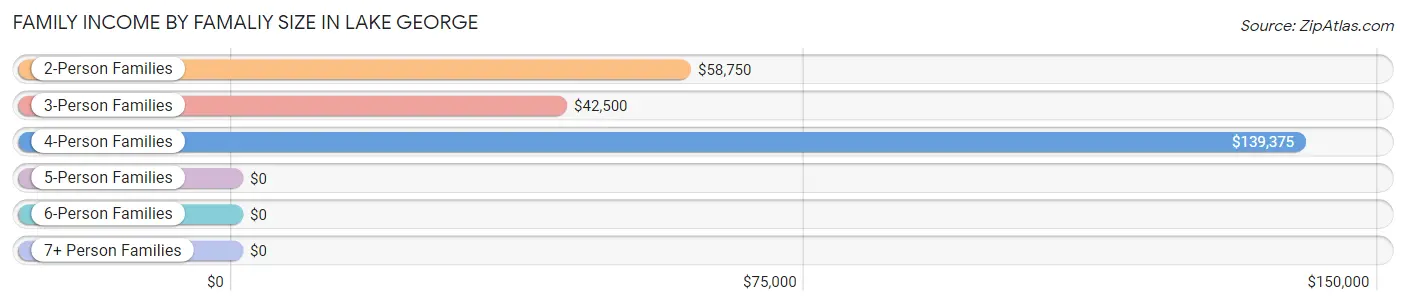
| Income Bracket | # Families | Median Income |
| 2-Person Families | 35 (49.3%) | $58,750 |
| 3-Person Families | 12 (16.9%) | $42,500 |
| 4-Person Families | 20 (28.2%) | $139,375 |
| 5-Person Families | 4 (5.6%) | $0 |
| 6-Person Families | 0 (0.0%) | $0 |
| 7+ Person Families | 0 (0.0%) | $0 |
| Total | 71 (100.0%) | $64,688 |
Family Income by Number of Earners in Lake George
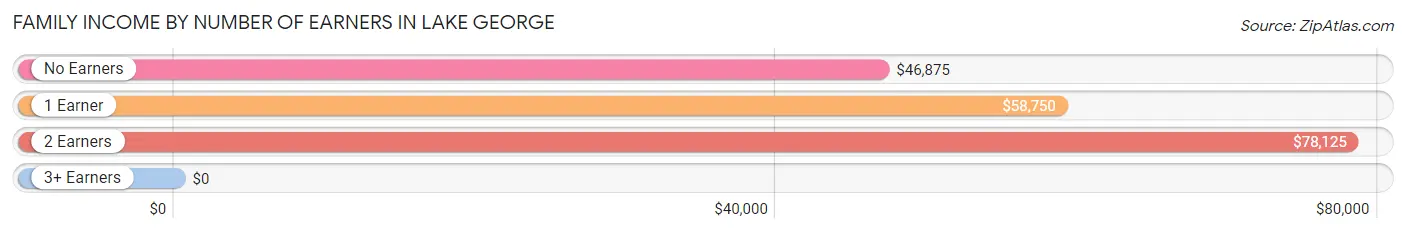
| Number of Earners | # Families | Median Income |
| No Earners | 16 (22.5%) | $46,875 |
| 1 Earner | 23 (32.4%) | $58,750 |
| 2 Earners | 25 (35.2%) | $78,125 |
| 3+ Earners | 7 (9.9%) | $0 |
| Total | 71 (100.0%) | $64,688 |
Household Income in Lake George
Household Income Brackets in Lake George
With 21 households falling in the category, the $50,000 to $74,999 income range is the most frequent in Lake George, accounting for 23.9% of all households. In contrast, only 1 households (1.1%) fall into the less than $10,000 income bracket, making it the least populous group.
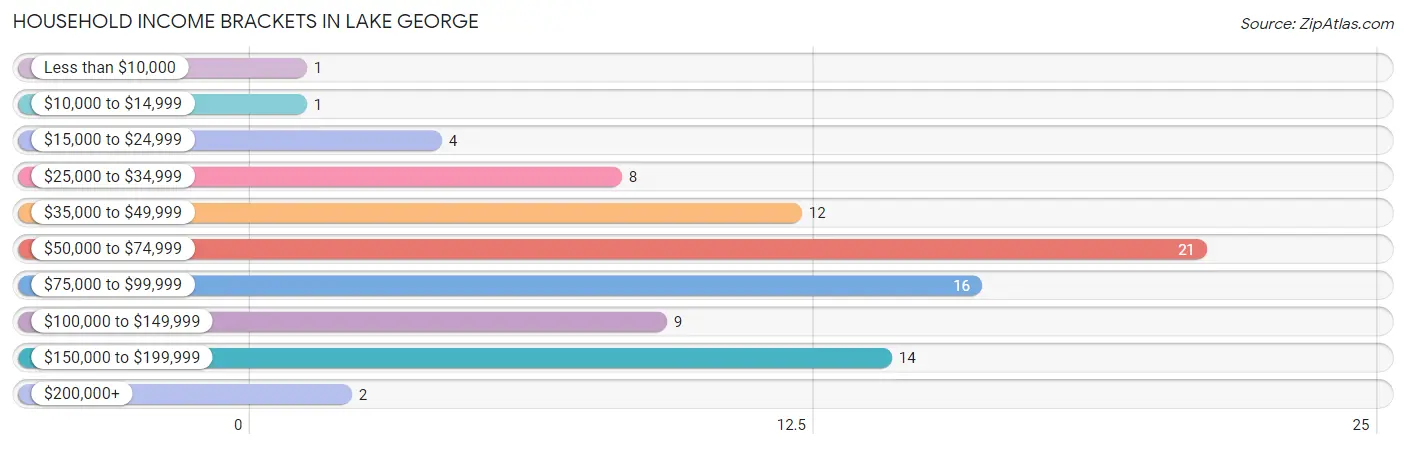
| Income Bracket | # Households | % Households |
| Less than $10,000 | 1 | 1.1% |
| $10,000 to $14,999 | 1 | 1.1% |
| $15,000 to $24,999 | 4 | 4.5% |
| $25,000 to $34,999 | 8 | 9.1% |
| $35,000 to $49,999 | 12 | 13.6% |
| $50,000 to $74,999 | 21 | 23.9% |
| $75,000 to $99,999 | 16 | 18.2% |
| $100,000 to $149,999 | 9 | 10.2% |
| $150,000 to $199,999 | 14 | 15.9% |
| $200,000+ | 2 | 2.3% |
Household Income by Householder Age in Lake George
The median household income in Lake George is $67,500, with the highest median household income of $105,000 found in the 25 to 44 years age bracket for the primary householder. A total of 16 households (18.2%) fall into this category. Meanwhile, the 15 to 24 years age bracket for the primary householder has the lowest median household income of $0, with 3 households (3.4%) in this group.
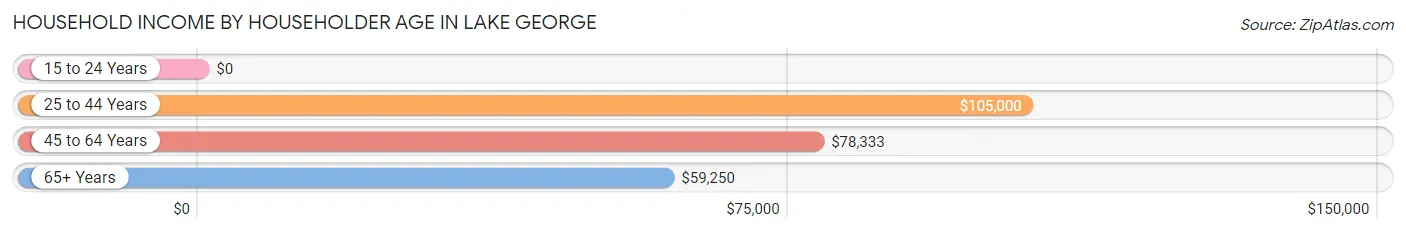
| Income Bracket | # Households | Median Income |
| 15 to 24 Years | 3 (3.4%) | $0 |
| 25 to 44 Years | 16 (18.2%) | $105,000 |
| 45 to 64 Years | 30 (34.1%) | $78,333 |
| 65+ Years | 39 (44.3%) | $59,250 |
| Total | 88 (100.0%) | $67,500 |
Poverty in Lake George
Income Below Poverty by Sex and Age in Lake George
With 1.3% poverty level for males and 4.7% for females among the residents of Lake George, 65 to 74 year old males and 35 to 44 year old females are the most vulnerable to poverty, with 2 males (6.7%) and 3 females (27.3%) in their respective age groups living below the poverty level.
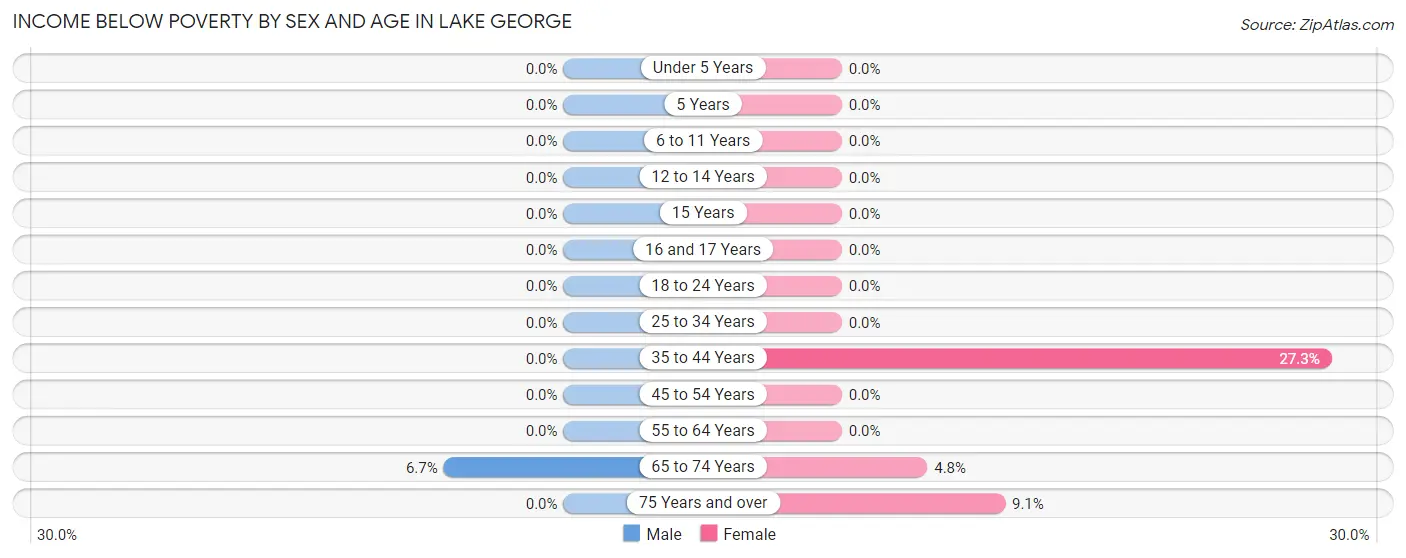
| Age Bracket | Male | Female |
| Under 5 Years | 0 (0.0%) | 0 (0.0%) |
| 5 Years | 0 (0.0%) | 0 (0.0%) |
| 6 to 11 Years | 0 (0.0%) | 0 (0.0%) |
| 12 to 14 Years | 0 (0.0%) | 0 (0.0%) |
| 15 Years | 0 (0.0%) | 0 (0.0%) |
| 16 and 17 Years | 0 (0.0%) | 0 (0.0%) |
| 18 to 24 Years | 0 (0.0%) | 0 (0.0%) |
| 25 to 34 Years | 0 (0.0%) | 0 (0.0%) |
| 35 to 44 Years | 0 (0.0%) | 3 (27.3%) |
| 45 to 54 Years | 0 (0.0%) | 0 (0.0%) |
| 55 to 64 Years | 0 (0.0%) | 0 (0.0%) |
| 65 to 74 Years | 2 (6.7%) | 1 (4.8%) |
| 75 Years and over | 0 (0.0%) | 1 (9.1%) |
| Total | 2 (1.3%) | 5 (4.7%) |
Income Above Poverty by Sex and Age in Lake George
According to the poverty statistics in Lake George, males aged under 5 years and females aged under 5 years are the age groups that are most secure financially, with 100.0% of males and 100.0% of females in these age groups living above the poverty line.
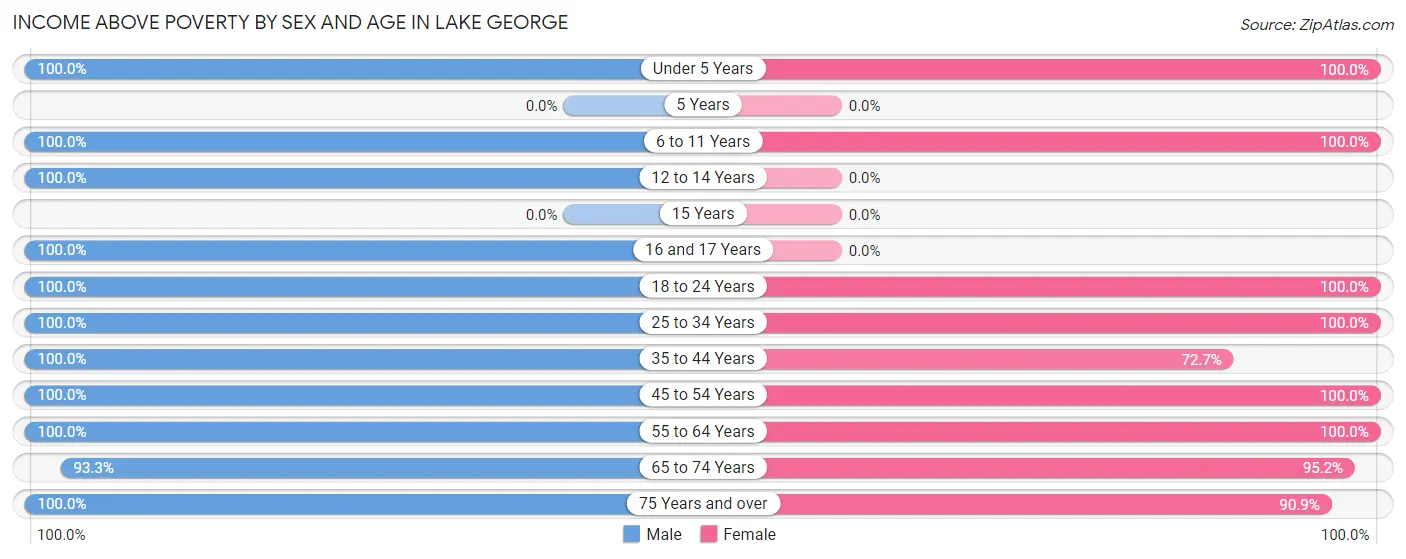
| Age Bracket | Male | Female |
| Under 5 Years | 7 (100.0%) | 6 (100.0%) |
| 5 Years | 0 (0.0%) | 0 (0.0%) |
| 6 to 11 Years | 13 (100.0%) | 2 (100.0%) |
| 12 to 14 Years | 7 (100.0%) | 0 (0.0%) |
| 15 Years | 0 (0.0%) | 0 (0.0%) |
| 16 and 17 Years | 4 (100.0%) | 0 (0.0%) |
| 18 to 24 Years | 13 (100.0%) | 18 (100.0%) |
| 25 to 34 Years | 8 (100.0%) | 7 (100.0%) |
| 35 to 44 Years | 17 (100.0%) | 8 (72.7%) |
| 45 to 54 Years | 27 (100.0%) | 16 (100.0%) |
| 55 to 64 Years | 10 (100.0%) | 15 (100.0%) |
| 65 to 74 Years | 28 (93.3%) | 20 (95.2%) |
| 75 Years and over | 13 (100.0%) | 10 (90.9%) |
| Total | 147 (98.7%) | 102 (95.3%) |
Income Below Poverty Among Married-Couple Families in Lake George
The poverty statistics for married-couple families in Lake George show that 3.6% or 2 of the total 55 families live below the poverty line. Families with no children have the highest poverty rate of 5.1%, comprising of 2 families. On the other hand, families with 1 or 2 children have the lowest poverty rate of 0.0%, which includes 0 families.
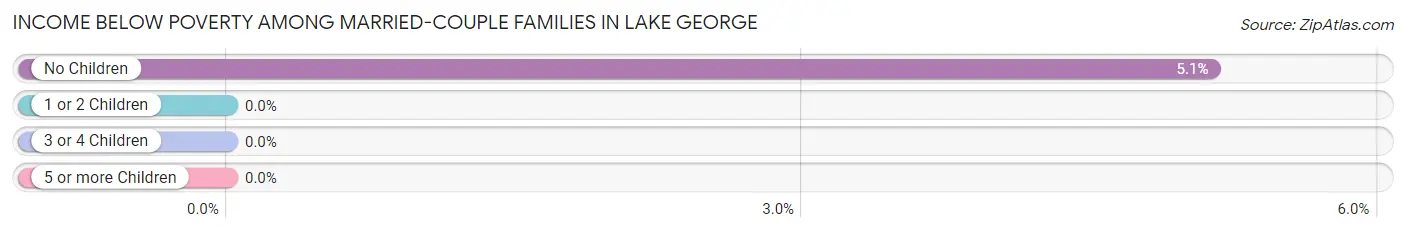
| Children | Above Poverty | Below Poverty |
| No Children | 37 (94.9%) | 2 (5.1%) |
| 1 or 2 Children | 12 (100.0%) | 0 (0.0%) |
| 3 or 4 Children | 4 (100.0%) | 0 (0.0%) |
| 5 or more Children | 0 (0.0%) | 0 (0.0%) |
| Total | 53 (96.4%) | 2 (3.6%) |
Income Below Poverty Among Single-Parent Households in Lake George
| Children | Single Father | Single Mother |
| No Children | 0 (0.0%) | 0 (0.0%) |
| 1 or 2 Children | 0 (0.0%) | 0 (0.0%) |
| 3 or 4 Children | 0 (0.0%) | 0 (0.0%) |
| 5 or more Children | 0 (0.0%) | 0 (0.0%) |
| Total | 0 (0.0%) | 0 (0.0%) |
Income Below Poverty Among Married-Couple vs Single-Parent Households in Lake George
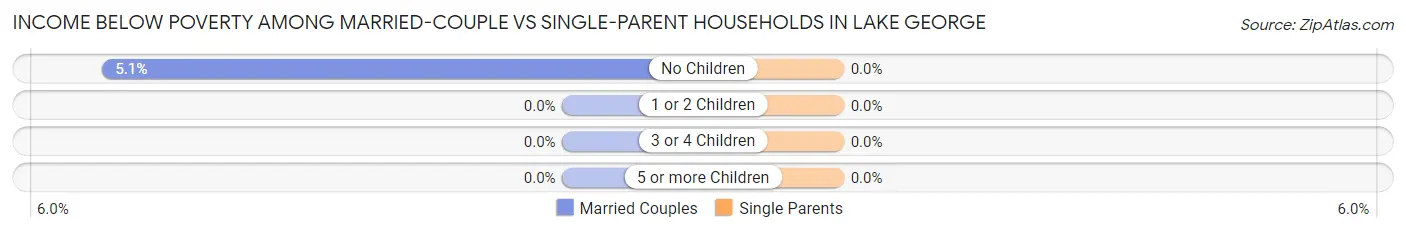
| Children | Married-Couple Families | Single-Parent Households |
| No Children | 2 (5.1%) | 0 (0.0%) |
| 1 or 2 Children | 0 (0.0%) | 0 (0.0%) |
| 3 or 4 Children | 0 (0.0%) | 0 (0.0%) |
| 5 or more Children | 0 (0.0%) | 0 (0.0%) |
| Total | 2 (3.6%) | 0 (0.0%) |
Race in Lake George
The most populous races in Lake George are White / Caucasian (237 | 92.6%), Two or more Races (11 | 4.3%), and Native / Alaskan (8 | 3.1%).

| Race | # Population | % Population |
| Asian | 0 | 0.0% |
| Black / African American | 0 | 0.0% |
| Hawaiian / Pacific | 0 | 0.0% |
| Hispanic or Latino | 0 | 0.0% |
| Native / Alaskan | 8 | 3.1% |
| White / Caucasian | 237 | 92.6% |
| Two or more Races | 11 | 4.3% |
| Some other Race | 0 | 0.0% |
| Total | 256 | 100.0% |
Ancestry in Lake George
The most populous ancestries reported in Lake George are German (121 | 47.3%), Norwegian (29 | 11.3%), Polish (21 | 8.2%), American (16 | 6.2%), and Scandinavian (16 | 6.2%), together accounting for 79.3% of all Lake George residents.
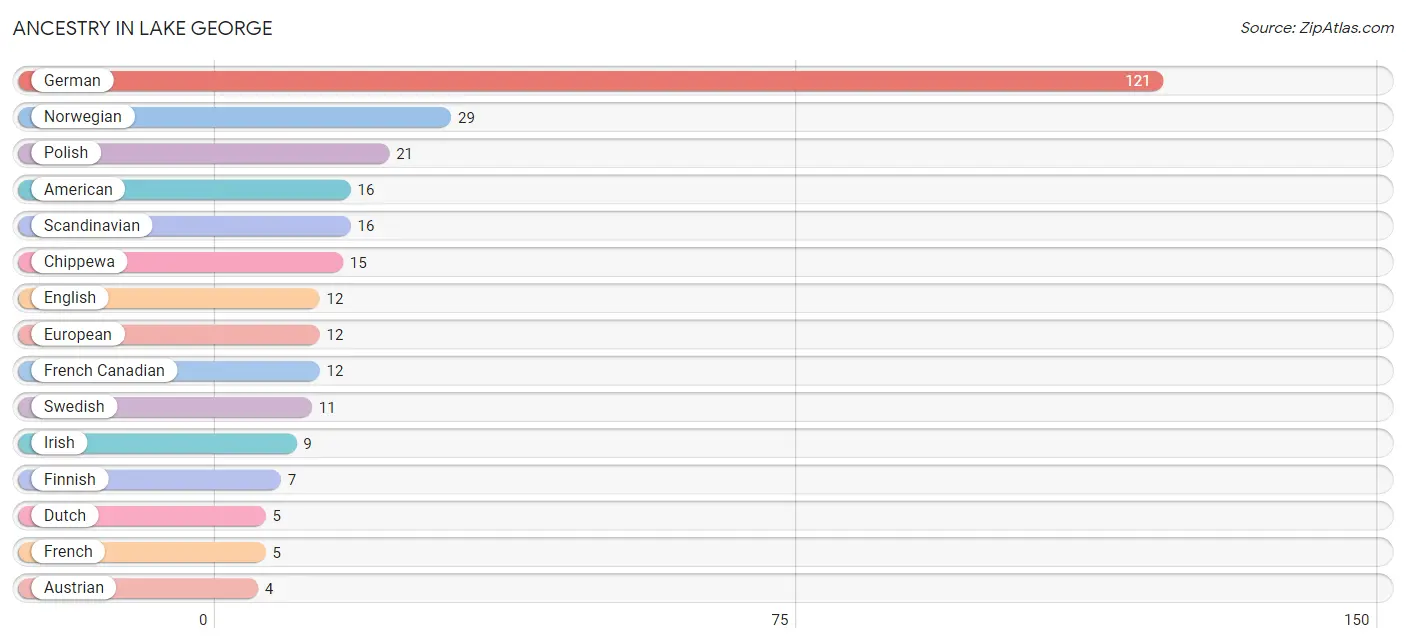
| Ancestry | # Population | % Population |
| American | 16 | 6.2% |
| Austrian | 4 | 1.6% |
| Belgian | 3 | 1.2% |
| Chippewa | 15 | 5.9% |
| Danish | 1 | 0.4% |
| Dutch | 5 | 1.9% |
| English | 12 | 4.7% |
| European | 12 | 4.7% |
| Finnish | 7 | 2.7% |
| French | 5 | 1.9% |
| French Canadian | 12 | 4.7% |
| German | 121 | 47.3% |
| Irish | 9 | 3.5% |
| Italian | 1 | 0.4% |
| Luxembourger | 1 | 0.4% |
| Norwegian | 29 | 11.3% |
| Polish | 21 | 8.2% |
| Scandinavian | 16 | 6.2% |
| Scotch-Irish | 2 | 0.8% |
| Scottish | 1 | 0.4% |
| Swedish | 11 | 4.3% |
| Welsh | 1 | 0.4% | View All 22 Rows |
Immigrants in Lake George
The most numerous immigrant groups reported in Lake George came from Europe (2 | 0.8%), England (1 | 0.4%), Germany (1 | 0.4%), Northern Europe (1 | 0.4%), and Western Europe (1 | 0.4%), together accounting for 2.3% of all Lake George residents.
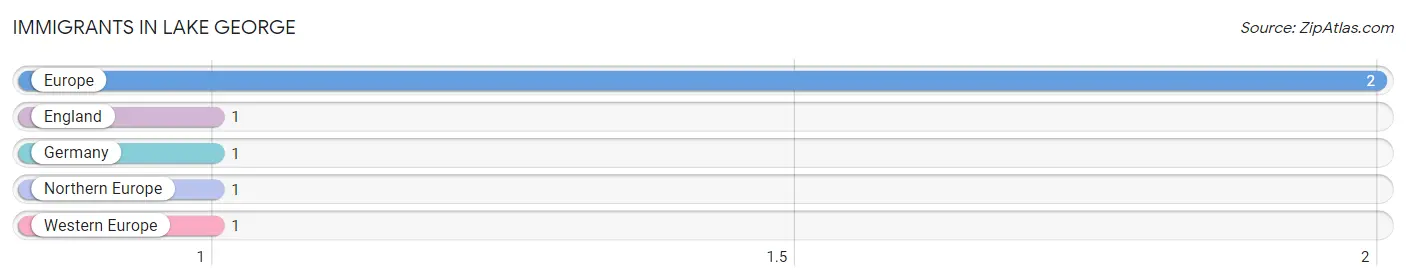
| Immigration Origin | # Population | % Population |
| England | 1 | 0.4% |
| Europe | 2 | 0.8% |
| Germany | 1 | 0.4% |
| Northern Europe | 1 | 0.4% |
| Western Europe | 1 | 0.4% | View All 5 Rows |
Sex and Age in Lake George
Sex and Age in Lake George
The most populous age groups in Lake George are 50 to 54 Years (19 | 12.8%) for men and 45 to 49 Years (16 | 14.9%) for women.
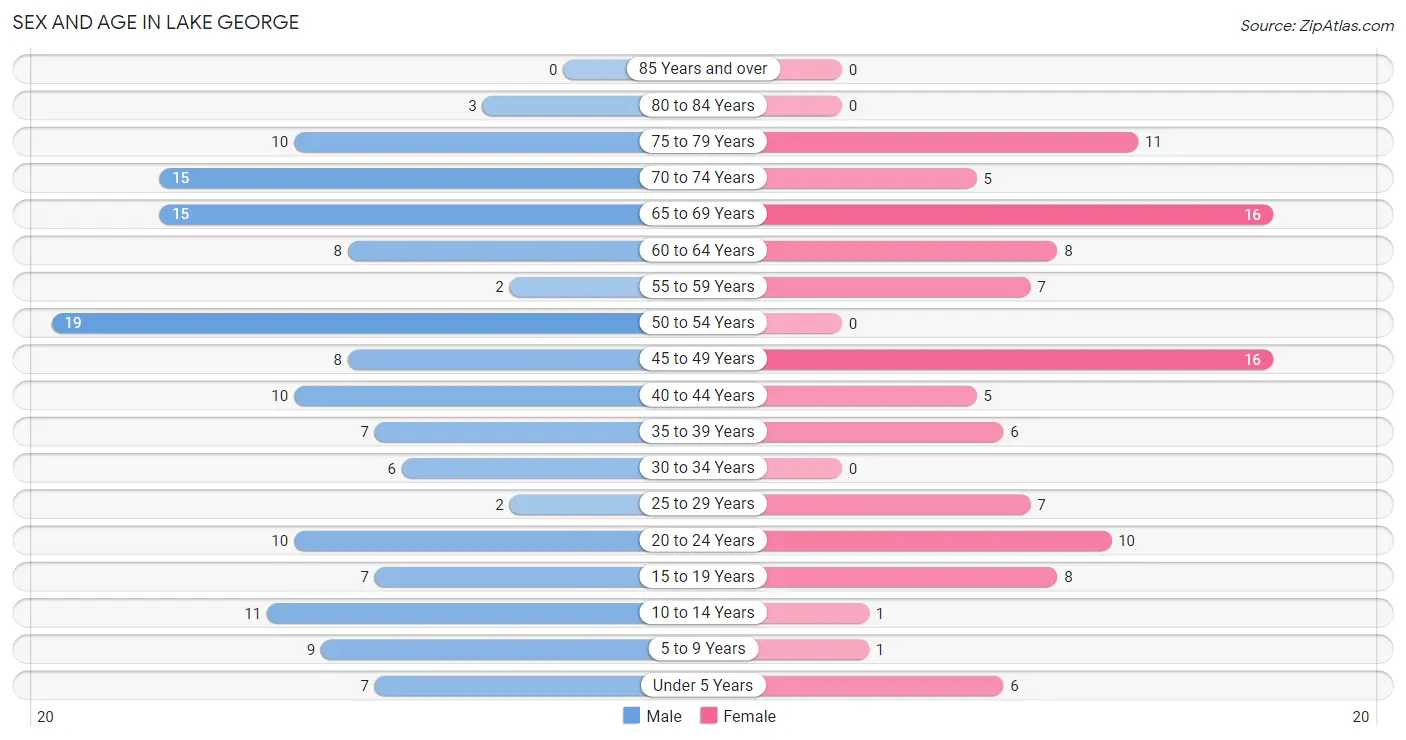
| Age Bracket | Male | Female |
| Under 5 Years | 7 (4.7%) | 6 (5.6%) |
| 5 to 9 Years | 9 (6.0%) | 1 (0.9%) |
| 10 to 14 Years | 11 (7.4%) | 1 (0.9%) |
| 15 to 19 Years | 7 (4.7%) | 8 (7.5%) |
| 20 to 24 Years | 10 (6.7%) | 10 (9.3%) |
| 25 to 29 Years | 2 (1.3%) | 7 (6.5%) |
| 30 to 34 Years | 6 (4.0%) | 0 (0.0%) |
| 35 to 39 Years | 7 (4.7%) | 6 (5.6%) |
| 40 to 44 Years | 10 (6.7%) | 5 (4.7%) |
| 45 to 49 Years | 8 (5.4%) | 16 (14.9%) |
| 50 to 54 Years | 19 (12.8%) | 0 (0.0%) |
| 55 to 59 Years | 2 (1.3%) | 7 (6.5%) |
| 60 to 64 Years | 8 (5.4%) | 8 (7.5%) |
| 65 to 69 Years | 15 (10.1%) | 16 (14.9%) |
| 70 to 74 Years | 15 (10.1%) | 5 (4.7%) |
| 75 to 79 Years | 10 (6.7%) | 11 (10.3%) |
| 80 to 84 Years | 3 (2.0%) | 0 (0.0%) |
| 85 Years and over | 0 (0.0%) | 0 (0.0%) |
| Total | 149 (100.0%) | 107 (100.0%) |
Families and Households in Lake George
Median Family Size in Lake George
The median family size in Lake George is 3.18 persons per family, with single male/father families (7 | 9.9%) accounting for the largest median family size of 4.71 persons per family. On the other hand, single female/mother families (9 | 12.7%) represent the smallest median family size with 2.78 persons per family.
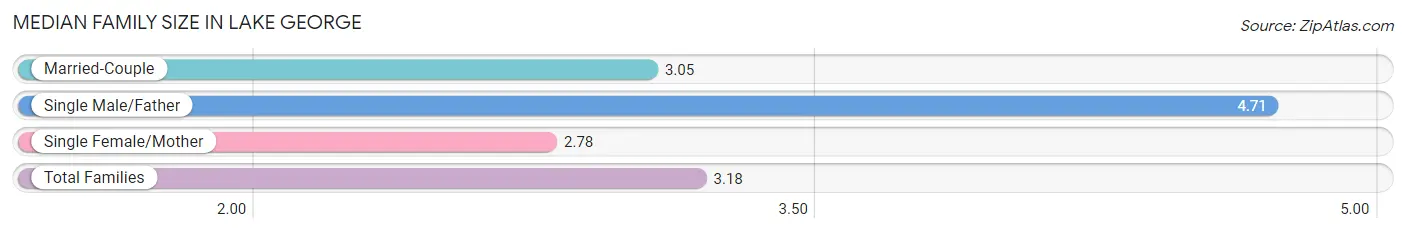
| Family Type | # Families | Family Size |
| Married-Couple | 55 (77.5%) | 3.05 |
| Single Male/Father | 7 (9.9%) | 4.71 |
| Single Female/Mother | 9 (12.7%) | 2.78 |
| Total Families | 71 (100.0%) | 3.18 |
Median Household Size in Lake George
The median household size in Lake George is 2.91 persons per household, with single male/father households (7 | 8.0%) accounting for the largest median household size of 4.86 persons per household. non-family households (17 | 19.3%) represent the smallest median household size with 1.18 persons per household.
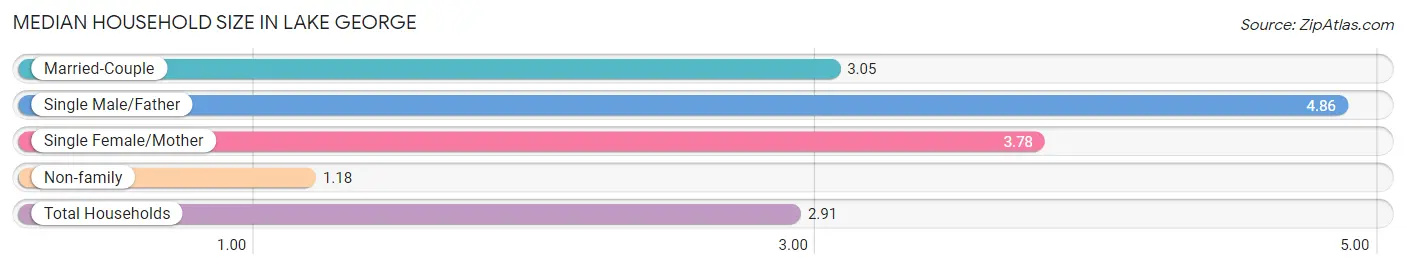
| Household Type | # Households | Household Size |
| Married-Couple | 55 (62.5%) | 3.05 |
| Single Male/Father | 7 (8.0%) | 4.86 |
| Single Female/Mother | 9 (10.2%) | 3.78 |
| Non-family | 17 (19.3%) | 1.18 |
| Total Households | 88 (100.0%) | 2.91 |
Household Size by Marriage Status in Lake George
Out of a total of 88 households in Lake George, 71 (80.7%) are family households, while 17 (19.3%) are nonfamily households. The most numerous type of family households are 2-person households, comprising 33, and the most common type of nonfamily households are 1-person households, comprising 12.
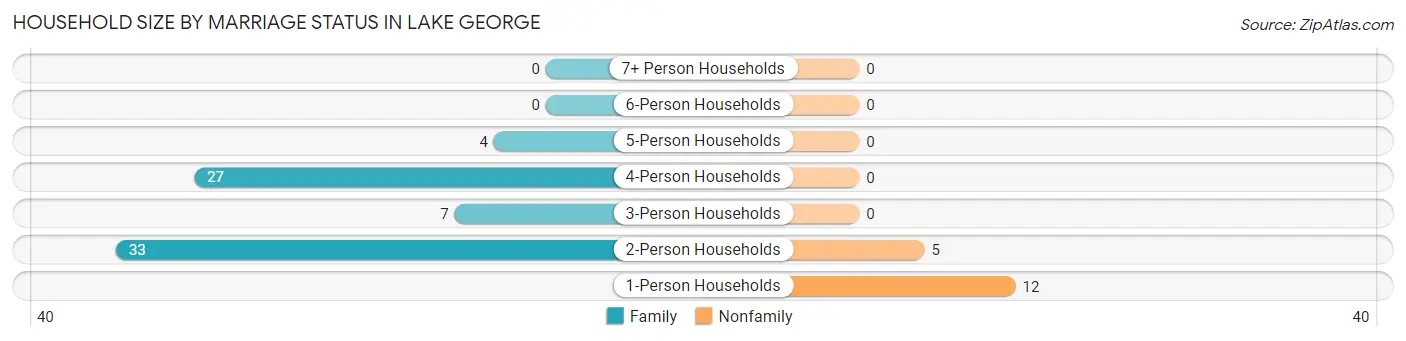
| Household Size | Family Households | Nonfamily Households |
| 1-Person Households | - | 12 (13.6%) |
| 2-Person Households | 33 (37.5%) | 5 (5.7%) |
| 3-Person Households | 7 (8.0%) | 0 (0.0%) |
| 4-Person Households | 27 (30.7%) | 0 (0.0%) |
| 5-Person Households | 4 (4.5%) | 0 (0.0%) |
| 6-Person Households | 0 (0.0%) | 0 (0.0%) |
| 7+ Person Households | 0 (0.0%) | 0 (0.0%) |
| Total | 71 (80.7%) | 17 (19.3%) |
Female Fertility in Lake George
Fertility by Age in Lake George
| Age Bracket | Women with Births | Births / 1,000 Women |
| 15 to 19 years | 0 (0.0%) | 0.0 |
| 20 to 34 years | 0 (0.0%) | 0.0 |
| 35 to 50 years | 0 (0.0%) | 0.0 |
| Total | 0 (0.0%) | 0.0 |
Fertility by Age by Marriage Status in Lake George
| Age Bracket | Married | Unmarried |
| 15 to 19 years | 0 (0.0%) | 0 (0.0%) |
| 20 to 34 years | 0 (0.0%) | 0 (0.0%) |
| 35 to 50 years | 0 (0.0%) | 0 (0.0%) |
| Total | 0 (0.0%) | 0 (0.0%) |
Fertility by Education in Lake George
| Educational Attainment | Women with Births | Births / 1,000 Women |
| Less than High School | 0 (0.0%) | 0.0 |
| High School Diploma | 0 (0.0%) | 0.0 |
| College or Associate's Degree | 0 (0.0%) | 0.0 |
| Bachelor's Degree | 0 (0.0%) | 0.0 |
| Graduate Degree | 0 (0.0%) | 0.0 |
| Total | 0 (0.0%) | 0.0 |
Fertility by Education by Marriage Status in Lake George
| Educational Attainment | Married | Unmarried |
| Less than High School | 0 (0.0%) | 0 (0.0%) |
| High School Diploma | 0 (0.0%) | 0 (0.0%) |
| College or Associate's Degree | 0 (0.0%) | 0 (0.0%) |
| Bachelor's Degree | 0 (0.0%) | 0 (0.0%) |
| Graduate Degree | 0 (0.0%) | 0 (0.0%) |
| Total | 0 (0.0%) | 0 (0.0%) |
Employment Characteristics in Lake George
Employment by Class of Employer in Lake George
Among the 102 employed individuals in Lake George, private company employees (60 | 58.8%), local government employees (12 | 11.8%), and not-for-profit organizations (10 | 9.8%) make up the most common classes of employment.
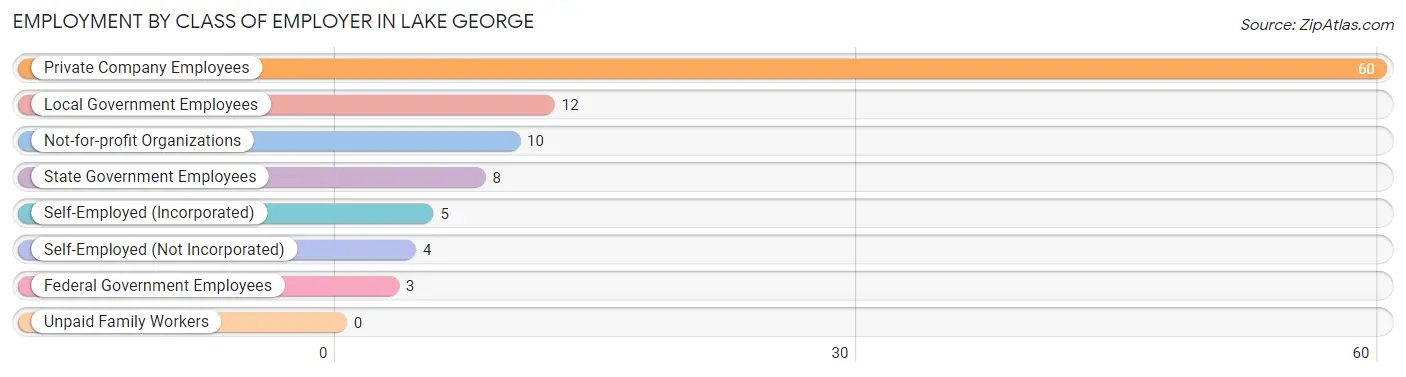
| Employer Class | # Employees | % Employees |
| Private Company Employees | 60 | 58.8% |
| Self-Employed (Incorporated) | 5 | 4.9% |
| Self-Employed (Not Incorporated) | 4 | 3.9% |
| Not-for-profit Organizations | 10 | 9.8% |
| Local Government Employees | 12 | 11.8% |
| State Government Employees | 8 | 7.8% |
| Federal Government Employees | 3 | 2.9% |
| Unpaid Family Workers | 0 | 0.0% |
| Total | 102 | 100.0% |
Employment Status by Age in Lake George
According to the labor force statistics for Lake George, out of the total population over 16 years of age (221), 56.1% or 124 individuals are in the labor force, with 16.1% or 20 of them unemployed. The age group with the highest labor force participation rate is 30 to 34 years, with 100.0% or 6 individuals in the labor force. Within the labor force, the 75 years and over age range has the highest percentage of unemployed individuals, with 100.0% or 2 of them being unemployed.
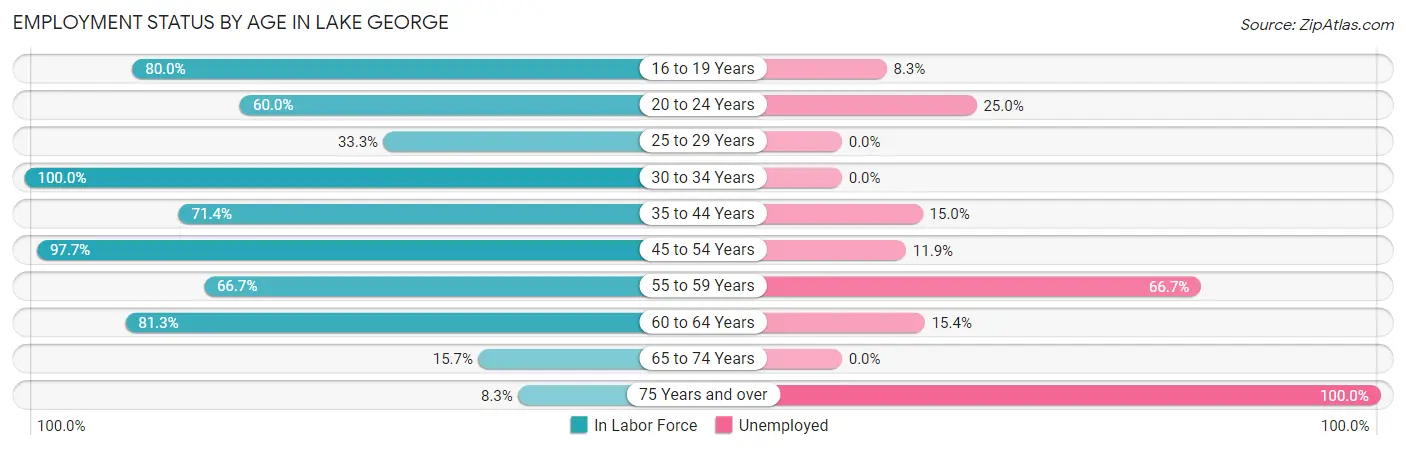
| Age Bracket | In Labor Force | Unemployed |
| 16 to 19 Years | 12 (80.0%) | 1 (8.3%) |
| 20 to 24 Years | 12 (60.0%) | 3 (25.0%) |
| 25 to 29 Years | 3 (33.3%) | 0 (0.0%) |
| 30 to 34 Years | 6 (100.0%) | 0 (0.0%) |
| 35 to 44 Years | 20 (71.4%) | 3 (15.0%) |
| 45 to 54 Years | 42 (97.7%) | 5 (11.9%) |
| 55 to 59 Years | 6 (66.7%) | 4 (66.7%) |
| 60 to 64 Years | 13 (81.3%) | 2 (15.4%) |
| 65 to 74 Years | 8 (15.7%) | 0 (0.0%) |
| 75 Years and over | 2 (8.3%) | 2 (100.0%) |
| Total | 124 (56.1%) | 20 (16.1%) |
Employment Status by Educational Attainment in Lake George
According to labor force statistics for Lake George, 81.1% of individuals (90) out of the total population between 25 and 64 years of age (111) are in the labor force, with 15.6% or 14 of them being unemployed. The group with the highest labor force participation rate are those with the educational attainment of high school diploma, with 91.4% or 32 individuals in the labor force. Within the labor force, individuals with high school diploma education have the highest percentage of unemployment, with 25.0% or 8 of them being unemployed.
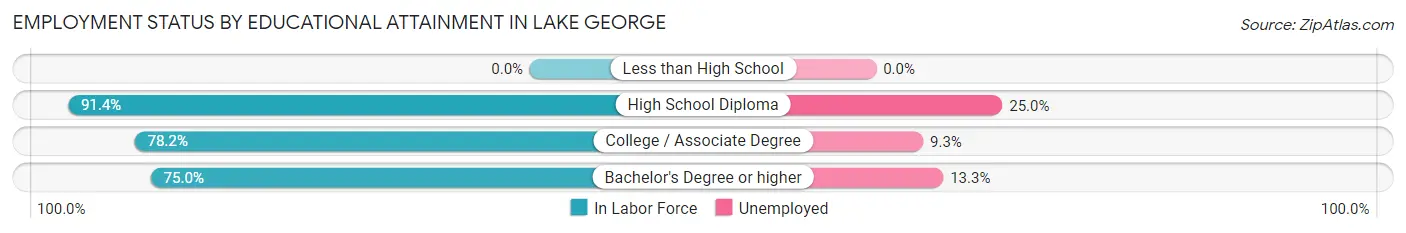
| Educational Attainment | In Labor Force | Unemployed |
| Less than High School | 0 (0.0%) | 0 (0.0%) |
| High School Diploma | 32 (91.4%) | 9 (25.0%) |
| College / Associate Degree | 43 (78.2%) | 5 (9.3%) |
| Bachelor's Degree or higher | 15 (75.0%) | 3 (13.3%) |
| Total | 90 (81.1%) | 17 (15.6%) |
Employment Occupations by Sex in Lake George
Management, Business, Science and Arts Occupations
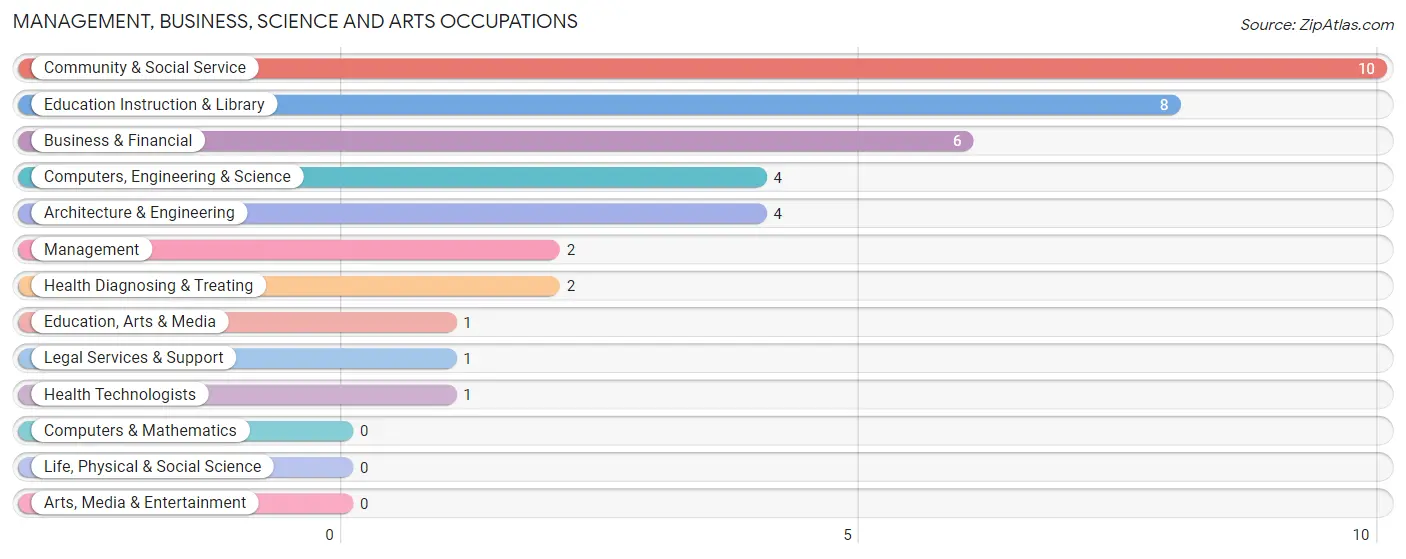
The most common Management, Business, Science and Arts occupations in Lake George are Community & Social Service (10 | 9.6%), Education Instruction & Library (8 | 7.7%), Business & Financial (6 | 5.8%), Computers, Engineering & Science (4 | 3.8%), and Architecture & Engineering (4 | 3.8%).
Management, Business, Science and Arts Occupations by Sex
Within the Management, Business, Science and Arts occupations in Lake George, the most male-oriented occupations are Business & Financial (100.0%), Computers, Engineering & Science (100.0%), and Architecture & Engineering (100.0%), while the most female-oriented occupations are Management (100.0%), Education Instruction & Library (100.0%), and Health Diagnosing & Treating (100.0%).
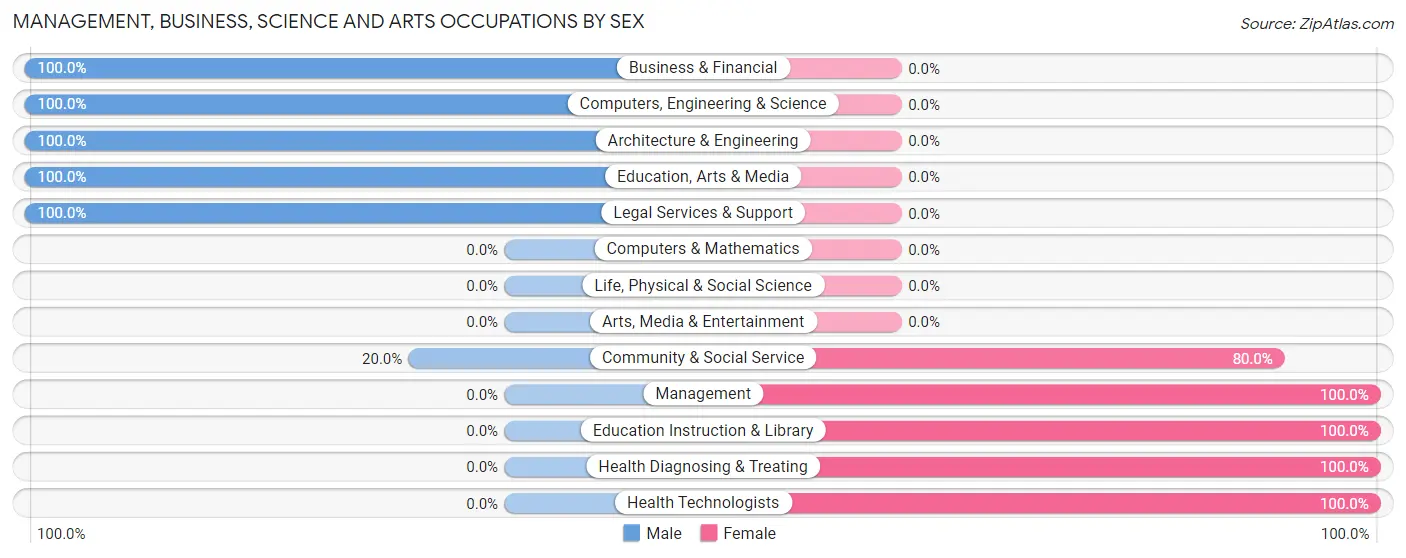
| Occupation | Male | Female |
| Management | 0 (0.0%) | 2 (100.0%) |
| Business & Financial | 6 (100.0%) | 0 (0.0%) |
| Computers, Engineering & Science | 4 (100.0%) | 0 (0.0%) |
| Computers & Mathematics | 0 (0.0%) | 0 (0.0%) |
| Architecture & Engineering | 4 (100.0%) | 0 (0.0%) |
| Life, Physical & Social Science | 0 (0.0%) | 0 (0.0%) |
| Community & Social Service | 2 (20.0%) | 8 (80.0%) |
| Education, Arts & Media | 1 (100.0%) | 0 (0.0%) |
| Legal Services & Support | 1 (100.0%) | 0 (0.0%) |
| Education Instruction & Library | 0 (0.0%) | 8 (100.0%) |
| Arts, Media & Entertainment | 0 (0.0%) | 0 (0.0%) |
| Health Diagnosing & Treating | 0 (0.0%) | 2 (100.0%) |
| Health Technologists | 0 (0.0%) | 1 (100.0%) |
| Total (Category) | 12 (50.0%) | 12 (50.0%) |
| Total (Overall) | 61 (58.7%) | 43 (41.3%) |
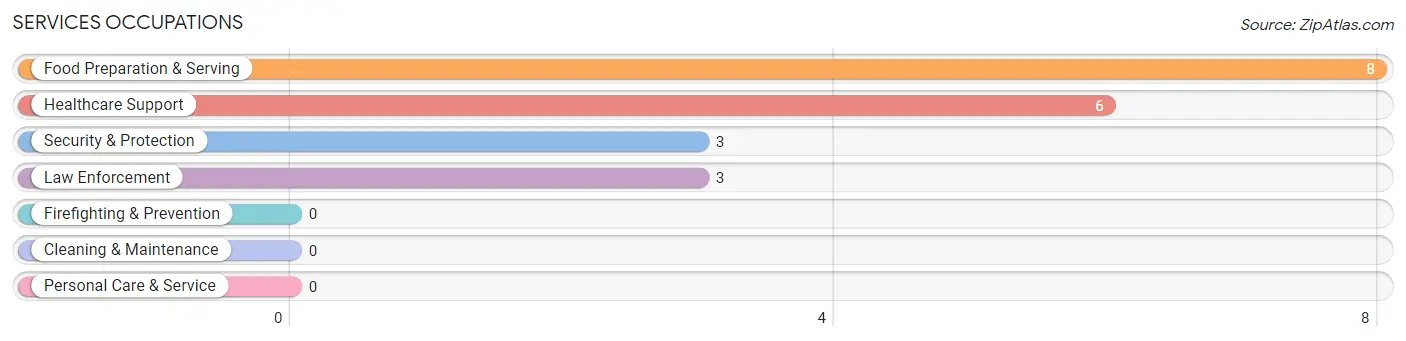
Services Occupations
The most common Services occupations in Lake George are Food Preparation & Serving (8 | 7.7%), Healthcare Support (6 | 5.8%), Security & Protection (3 | 2.9%), and Law Enforcement (3 | 2.9%).
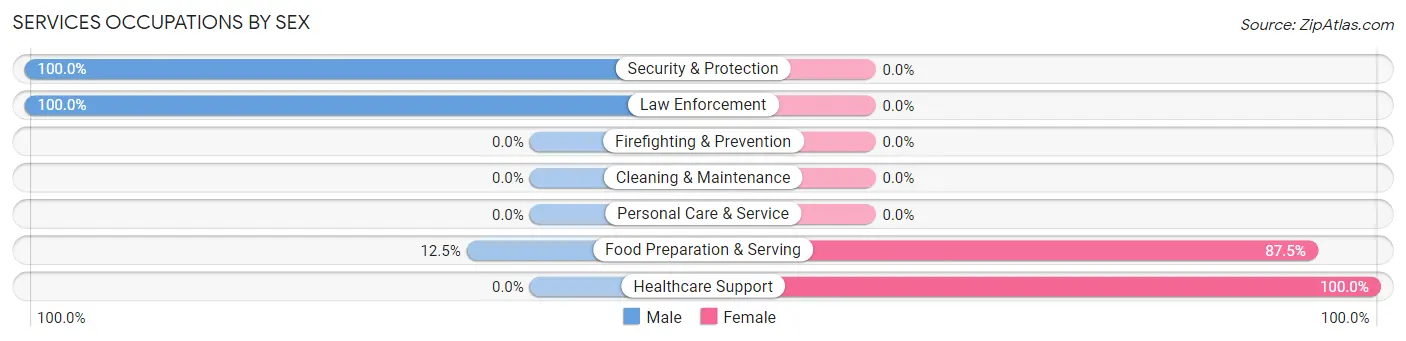
Services Occupations by Sex
Within the Services occupations in Lake George, the most male-oriented occupations are Security & Protection (100.0%), Law Enforcement (100.0%), and Food Preparation & Serving (12.5%), while the most female-oriented occupations are Healthcare Support (100.0%), and Food Preparation & Serving (87.5%).
| Occupation | Male | Female |
| Healthcare Support | 0 (0.0%) | 6 (100.0%) |
| Security & Protection | 3 (100.0%) | 0 (0.0%) |
| Firefighting & Prevention | 0 (0.0%) | 0 (0.0%) |
| Law Enforcement | 3 (100.0%) | 0 (0.0%) |
| Food Preparation & Serving | 1 (12.5%) | 7 (87.5%) |
| Cleaning & Maintenance | 0 (0.0%) | 0 (0.0%) |
| Personal Care & Service | 0 (0.0%) | 0 (0.0%) |
| Total (Category) | 4 (23.5%) | 13 (76.5%) |
| Total (Overall) | 61 (58.7%) | 43 (41.3%) |
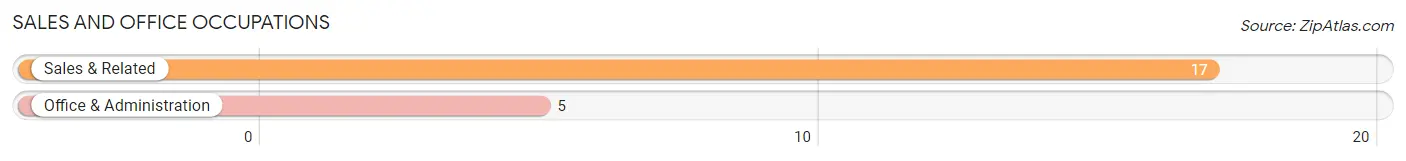
Sales and Office Occupations
The most common Sales and Office occupations in Lake George are Sales & Related (17 | 16.4%), and Office & Administration (5 | 4.8%).
Sales and Office Occupations by Sex

| Occupation | Male | Female |
| Sales & Related | 8 (47.1%) | 9 (52.9%) |
| Office & Administration | 0 (0.0%) | 5 (100.0%) |
| Total (Category) | 8 (36.4%) | 14 (63.6%) |
| Total (Overall) | 61 (58.7%) | 43 (41.3%) |
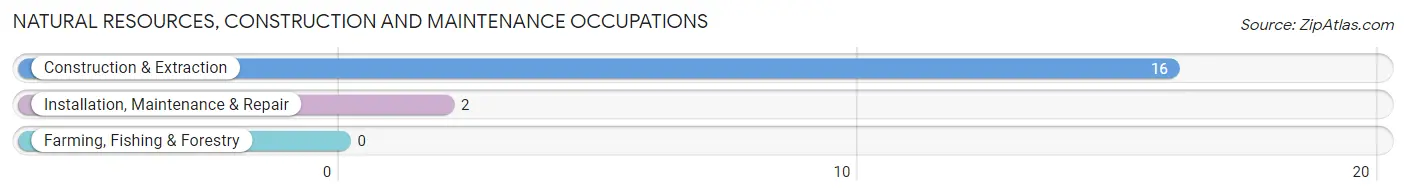
Natural Resources, Construction and Maintenance Occupations
The most common Natural Resources, Construction and Maintenance occupations in Lake George are Construction & Extraction (16 | 15.4%), and Installation, Maintenance & Repair (2 | 1.9%).
Natural Resources, Construction and Maintenance Occupations by Sex
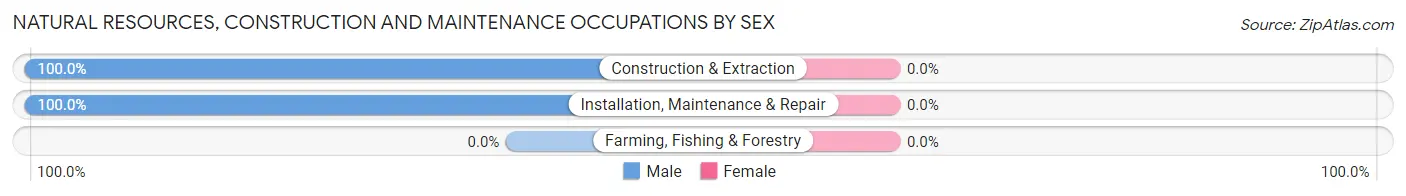
| Occupation | Male | Female |
| Farming, Fishing & Forestry | 0 (0.0%) | 0 (0.0%) |
| Construction & Extraction | 16 (100.0%) | 0 (0.0%) |
| Installation, Maintenance & Repair | 2 (100.0%) | 0 (0.0%) |
| Total (Category) | 18 (100.0%) | 0 (0.0%) |
| Total (Overall) | 61 (58.7%) | 43 (41.3%) |
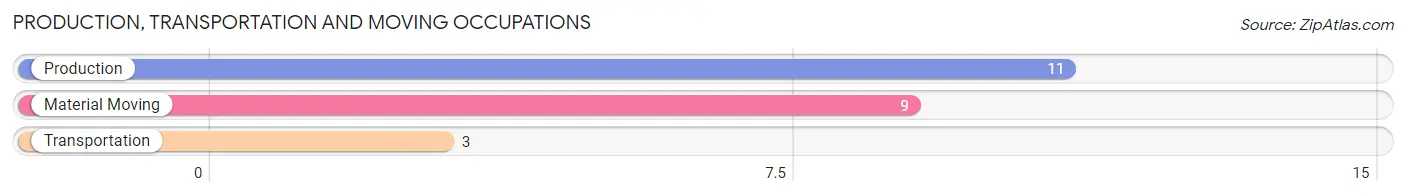
Production, Transportation and Moving Occupations
The most common Production, Transportation and Moving occupations in Lake George are Production (11 | 10.6%), Material Moving (9 | 8.6%), and Transportation (3 | 2.9%).
Production, Transportation and Moving Occupations by Sex
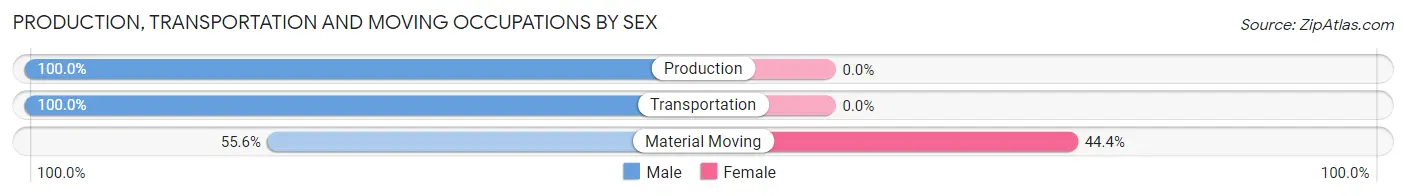
| Occupation | Male | Female |
| Production | 11 (100.0%) | 0 (0.0%) |
| Transportation | 3 (100.0%) | 0 (0.0%) |
| Material Moving | 5 (55.6%) | 4 (44.4%) |
| Total (Category) | 19 (82.6%) | 4 (17.4%) |
| Total (Overall) | 61 (58.7%) | 43 (41.3%) |
Employment Industries by Sex in Lake George
Employment Industries in Lake George
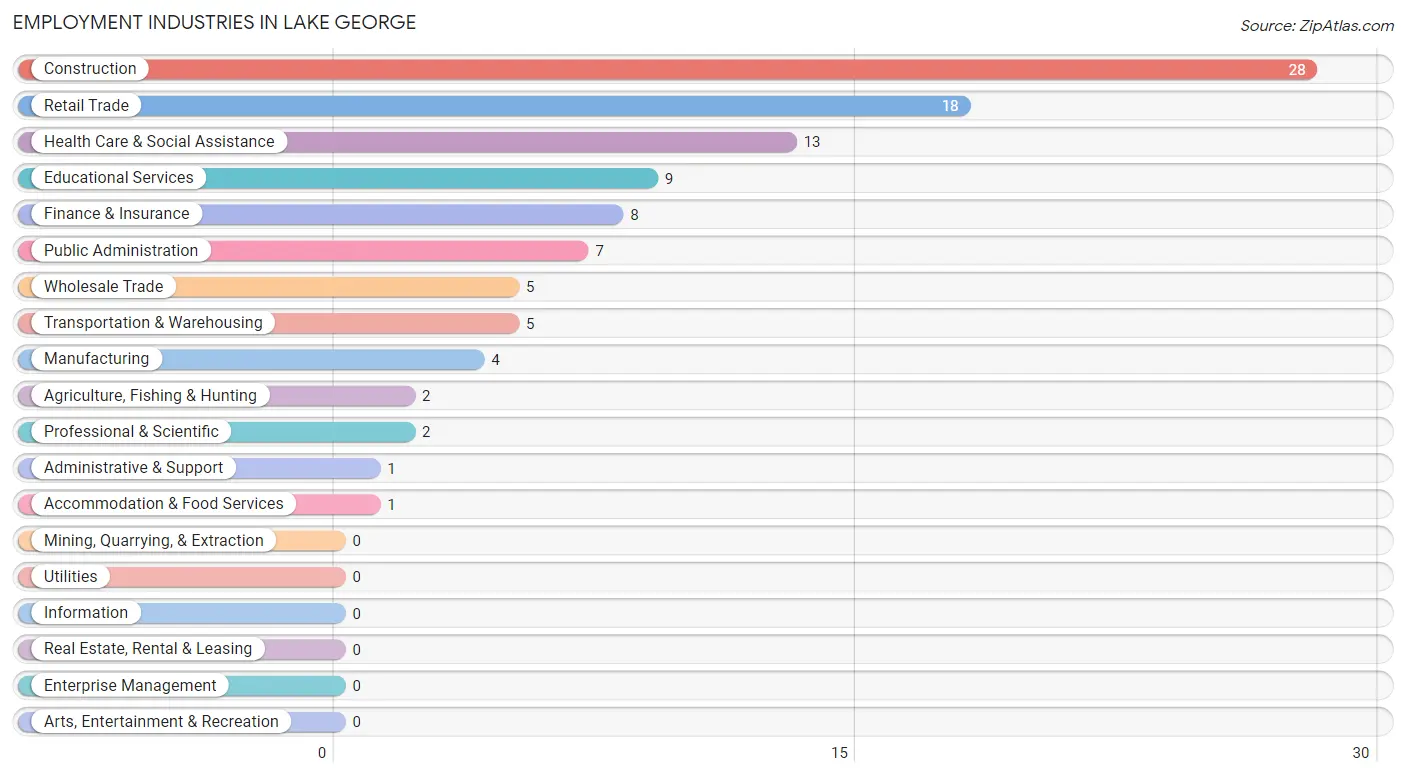
The major employment industries in Lake George include Construction (28 | 26.9%), Retail Trade (18 | 17.3%), Health Care & Social Assistance (13 | 12.5%), Educational Services (9 | 8.6%), and Finance & Insurance (8 | 7.7%).
Employment Industries by Sex in Lake George
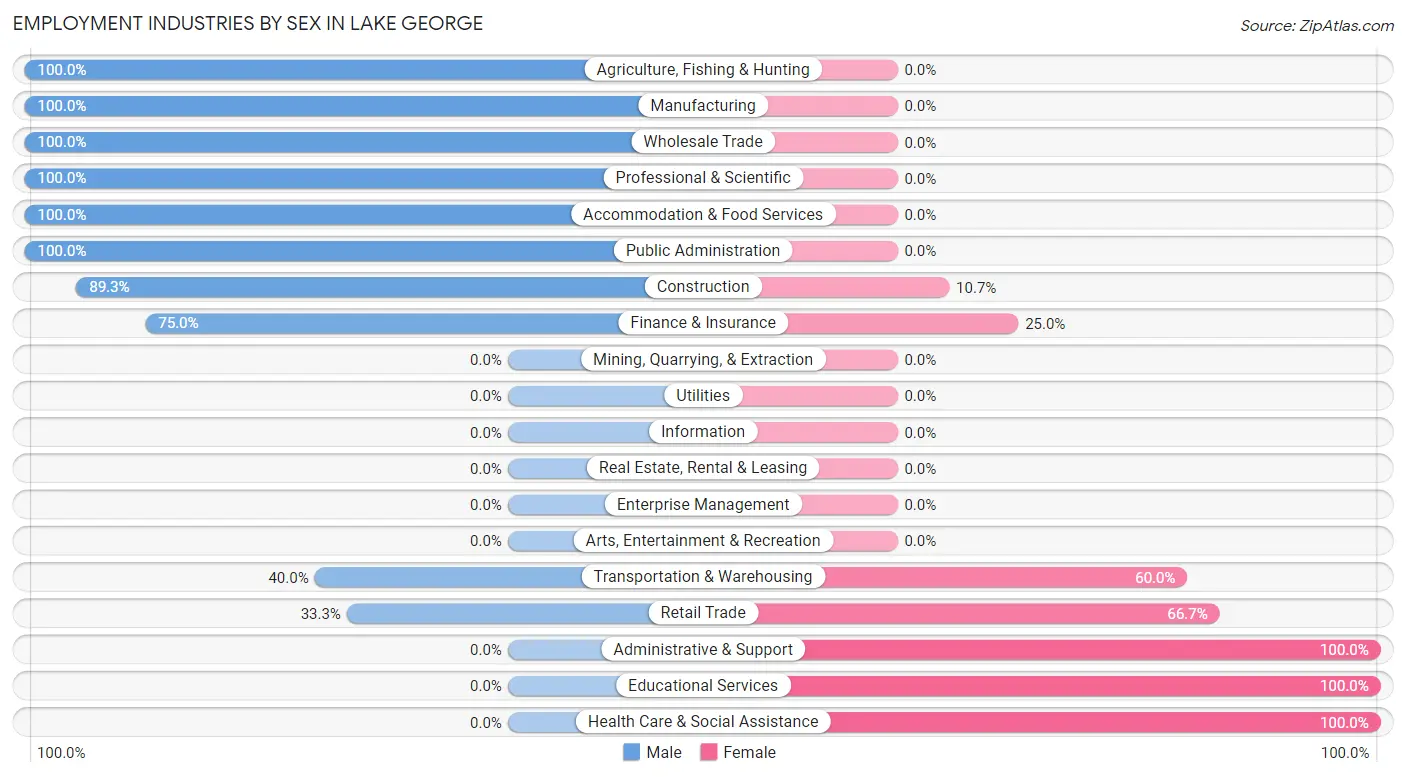
The Lake George industries that see more men than women are Agriculture, Fishing & Hunting (100.0%), Manufacturing (100.0%), and Wholesale Trade (100.0%), whereas the industries that tend to have a higher number of women are Administrative & Support (100.0%), Educational Services (100.0%), and Health Care & Social Assistance (100.0%).
| Industry | Male | Female |
| Agriculture, Fishing & Hunting | 2 (100.0%) | 0 (0.0%) |
| Mining, Quarrying, & Extraction | 0 (0.0%) | 0 (0.0%) |
| Construction | 25 (89.3%) | 3 (10.7%) |
| Manufacturing | 4 (100.0%) | 0 (0.0%) |
| Wholesale Trade | 5 (100.0%) | 0 (0.0%) |
| Retail Trade | 6 (33.3%) | 12 (66.7%) |
| Transportation & Warehousing | 2 (40.0%) | 3 (60.0%) |
| Utilities | 0 (0.0%) | 0 (0.0%) |
| Information | 0 (0.0%) | 0 (0.0%) |
| Finance & Insurance | 6 (75.0%) | 2 (25.0%) |
| Real Estate, Rental & Leasing | 0 (0.0%) | 0 (0.0%) |
| Professional & Scientific | 2 (100.0%) | 0 (0.0%) |
| Enterprise Management | 0 (0.0%) | 0 (0.0%) |
| Administrative & Support | 0 (0.0%) | 1 (100.0%) |
| Educational Services | 0 (0.0%) | 9 (100.0%) |
| Health Care & Social Assistance | 0 (0.0%) | 13 (100.0%) |
| Arts, Entertainment & Recreation | 0 (0.0%) | 0 (0.0%) |
| Accommodation & Food Services | 1 (100.0%) | 0 (0.0%) |
| Public Administration | 7 (100.0%) | 0 (0.0%) |
| Total | 61 (58.7%) | 43 (41.3%) |
Education in Lake George
School Enrollment in Lake George
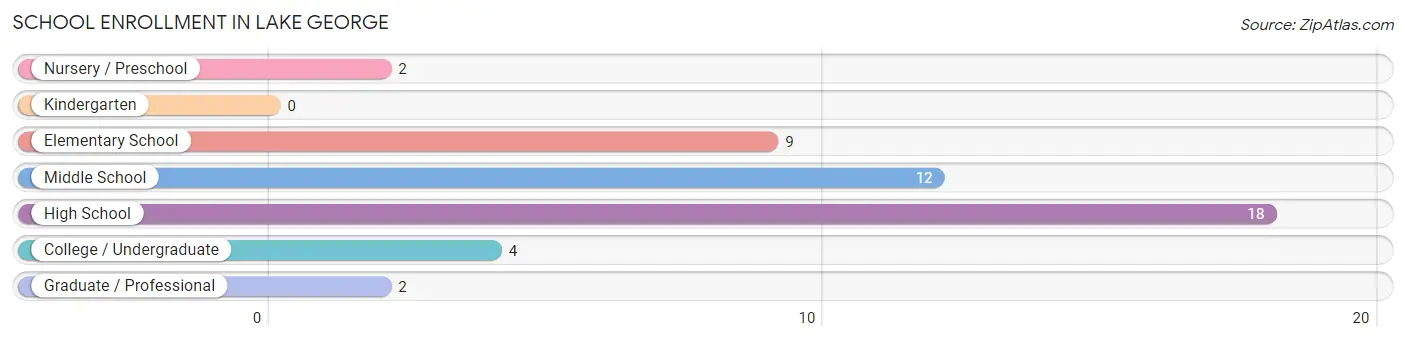
The most common levels of schooling among the 47 students in Lake George are high school (18 | 38.3%), middle school (12 | 25.5%), and elementary school (9 | 19.2%).
| School Level | # Students | % Students |
| Nursery / Preschool | 2 | 4.3% |
| Kindergarten | 0 | 0.0% |
| Elementary School | 9 | 19.2% |
| Middle School | 12 | 25.5% |
| High School | 18 | 38.3% |
| College / Undergraduate | 4 | 8.5% |
| Graduate / Professional | 2 | 4.3% |
| Total | 47 | 100.0% |
School Enrollment by Age by Funding Source in Lake George
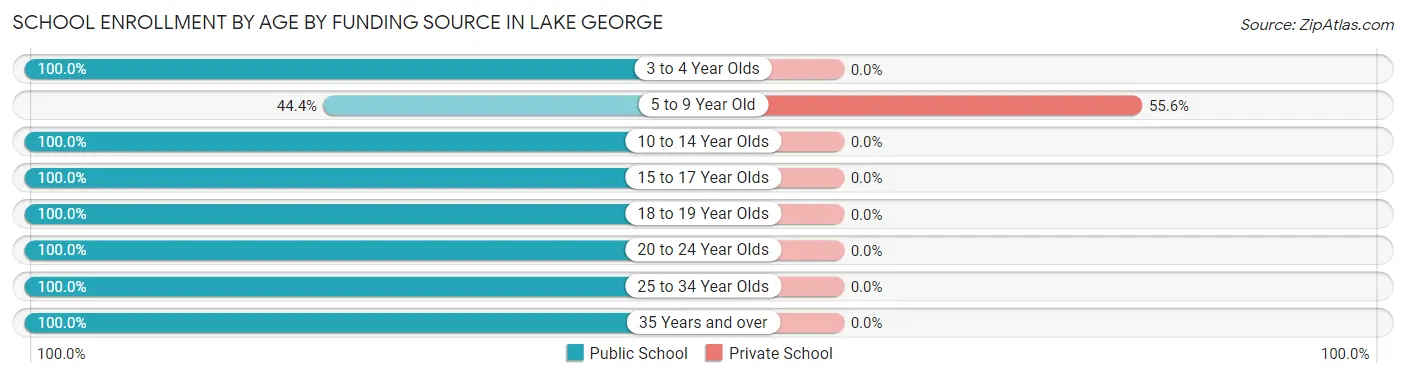
Out of a total of 47 students who are enrolled in schools in Lake George, 5 (10.6%) attend a private institution, while the remaining 42 (89.4%) are enrolled in public schools. The age group of 5 to 9 year old has the highest likelihood of being enrolled in private schools, with 5 (55.6% in the age bracket) enrolled. Conversely, the age group of 3 to 4 year olds has the lowest likelihood of being enrolled in a private school, with 2 (100.0% in the age bracket) attending a public institution.
| Age Bracket | Public School | Private School |
| 3 to 4 Year Olds | 2 (100.0%) | 0 (0.0%) |
| 5 to 9 Year Old | 4 (44.4%) | 5 (55.6%) |
| 10 to 14 Year Olds | 12 (100.0%) | 0 (0.0%) |
| 15 to 17 Year Olds | 4 (100.0%) | 0 (0.0%) |
| 18 to 19 Year Olds | 10 (100.0%) | 0 (0.0%) |
| 20 to 24 Year Olds | 8 (100.0%) | 0 (0.0%) |
| 25 to 34 Year Olds | 1 (100.0%) | 0 (0.0%) |
| 35 Years and over | 1 (100.0%) | 0 (0.0%) |
| Total | 42 (89.4%) | 5 (10.6%) |
Educational Attainment by Field of Study in Lake George
Education (22 | 43.1%), science & technology (11 | 21.6%), engineering (4 | 7.8%), liberal arts & history (4 | 7.8%), and bio, nature & agricultural (3 | 5.9%) are the most common fields of study among 51 individuals in Lake George who have obtained a bachelor's degree or higher.
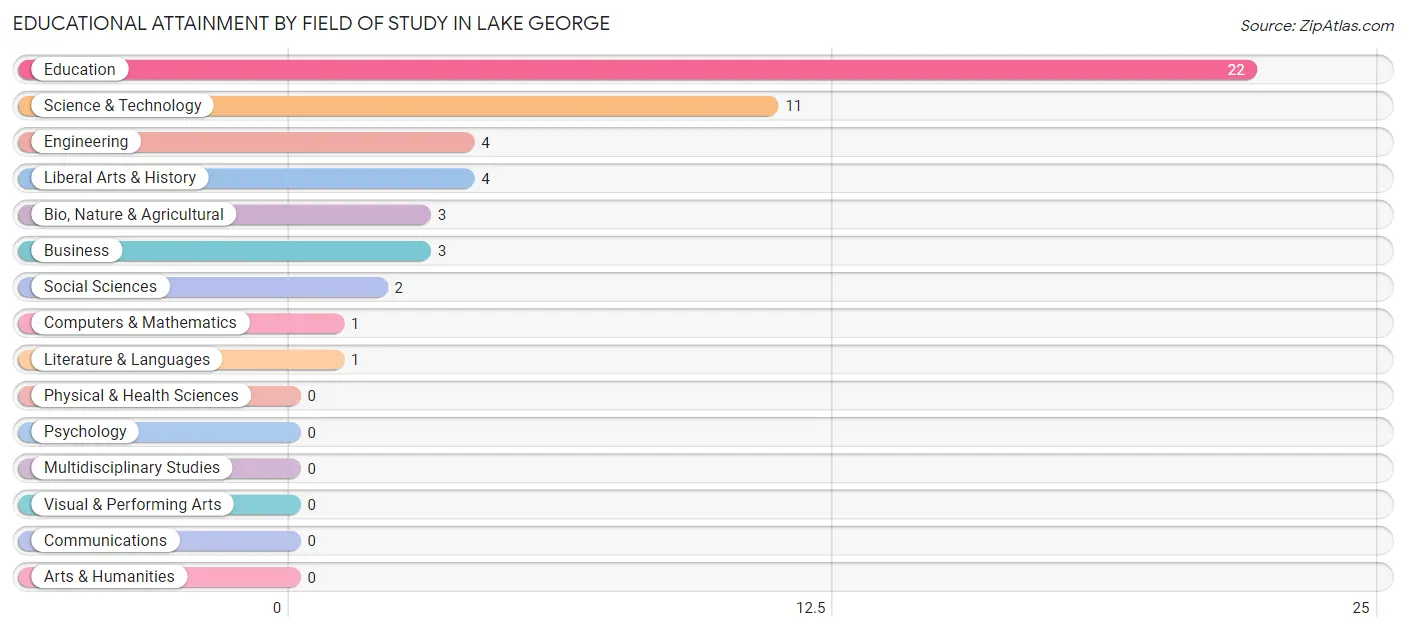
| Field of Study | # Graduates | % Graduates |
| Computers & Mathematics | 1 | 2.0% |
| Bio, Nature & Agricultural | 3 | 5.9% |
| Physical & Health Sciences | 0 | 0.0% |
| Psychology | 0 | 0.0% |
| Social Sciences | 2 | 3.9% |
| Engineering | 4 | 7.8% |
| Multidisciplinary Studies | 0 | 0.0% |
| Science & Technology | 11 | 21.6% |
| Business | 3 | 5.9% |
| Education | 22 | 43.1% |
| Literature & Languages | 1 | 2.0% |
| Liberal Arts & History | 4 | 7.8% |
| Visual & Performing Arts | 0 | 0.0% |
| Communications | 0 | 0.0% |
| Arts & Humanities | 0 | 0.0% |
| Total | 51 | 100.0% |
Transportation & Commute in Lake George
Vehicle Availability by Sex in Lake George
The most prevalent vehicle ownership categories in Lake George are males with 3 vehicles (25, accounting for 42.4%) and females with 3 vehicles (11, making up 58.1%).
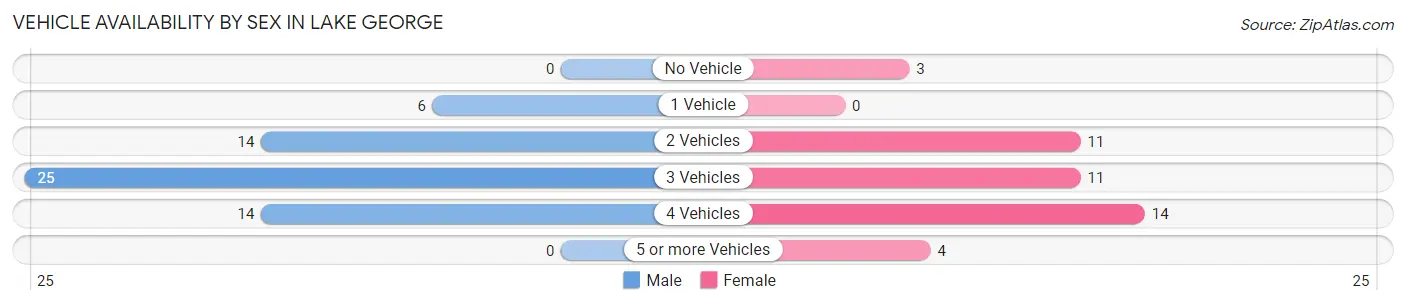
| Vehicles Available | Male | Female |
| No Vehicle | 0 (0.0%) | 3 (7.0%) |
| 1 Vehicle | 6 (10.2%) | 0 (0.0%) |
| 2 Vehicles | 14 (23.7%) | 11 (25.6%) |
| 3 Vehicles | 25 (42.4%) | 11 (25.6%) |
| 4 Vehicles | 14 (23.7%) | 14 (32.6%) |
| 5 or more Vehicles | 0 (0.0%) | 4 (9.3%) |
| Total | 59 (100.0%) | 43 (100.0%) |
Commute Time in Lake George
The most frequently occuring commute durations in Lake George are 30 to 34 minutes (27 commuters, 29.0%), 15 to 19 minutes (15 commuters, 16.1%), and 35 to 39 minutes (14 commuters, 15.0%).
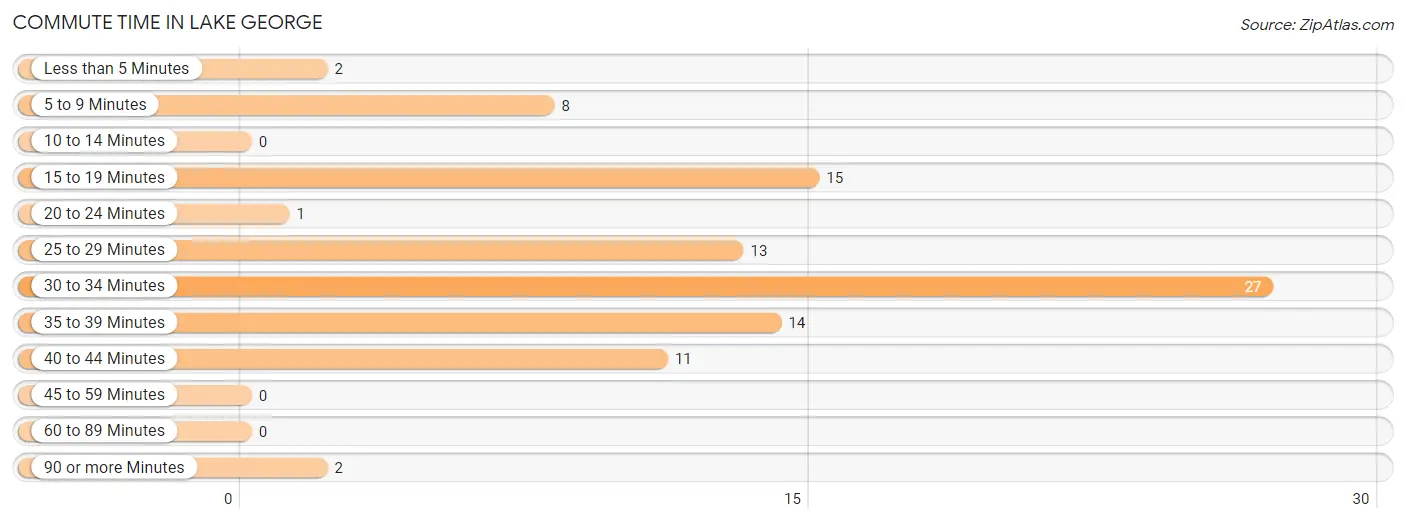
| Commute Time | # Commuters | % Commuters |
| Less than 5 Minutes | 2 | 2.1% |
| 5 to 9 Minutes | 8 | 8.6% |
| 10 to 14 Minutes | 0 | 0.0% |
| 15 to 19 Minutes | 15 | 16.1% |
| 20 to 24 Minutes | 1 | 1.1% |
| 25 to 29 Minutes | 13 | 14.0% |
| 30 to 34 Minutes | 27 | 29.0% |
| 35 to 39 Minutes | 14 | 15.0% |
| 40 to 44 Minutes | 11 | 11.8% |
| 45 to 59 Minutes | 0 | 0.0% |
| 60 to 89 Minutes | 0 | 0.0% |
| 90 or more Minutes | 2 | 2.1% |
Commute Time by Sex in Lake George
The most common commute times in Lake George are 25 to 29 minutes (13 commuters, 25.0%) for males and 30 to 34 minutes (15 commuters, 36.6%) for females.
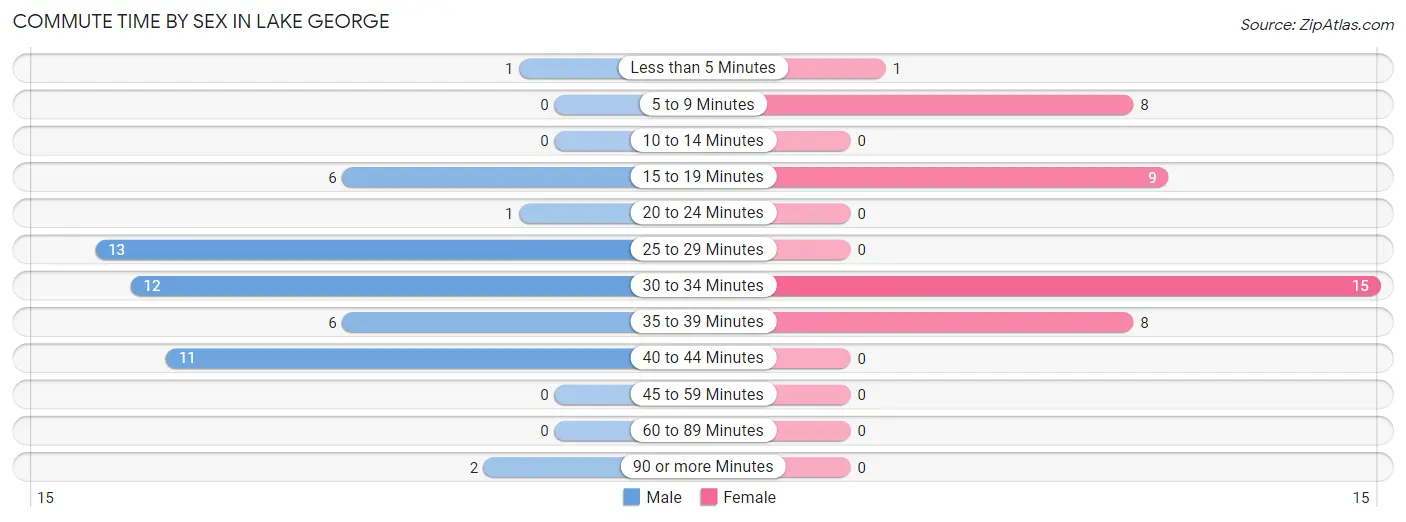
| Commute Time | Male | Female |
| Less than 5 Minutes | 1 (1.9%) | 1 (2.4%) |
| 5 to 9 Minutes | 0 (0.0%) | 8 (19.5%) |
| 10 to 14 Minutes | 0 (0.0%) | 0 (0.0%) |
| 15 to 19 Minutes | 6 (11.5%) | 9 (22.0%) |
| 20 to 24 Minutes | 1 (1.9%) | 0 (0.0%) |
| 25 to 29 Minutes | 13 (25.0%) | 0 (0.0%) |
| 30 to 34 Minutes | 12 (23.1%) | 15 (36.6%) |
| 35 to 39 Minutes | 6 (11.5%) | 8 (19.5%) |
| 40 to 44 Minutes | 11 (21.1%) | 0 (0.0%) |
| 45 to 59 Minutes | 0 (0.0%) | 0 (0.0%) |
| 60 to 89 Minutes | 0 (0.0%) | 0 (0.0%) |
| 90 or more Minutes | 2 (3.8%) | 0 (0.0%) |
Time of Departure to Work by Sex in Lake George
The most frequent times of departure to work in Lake George are 6:00 AM to 6:29 AM (9, 17.3%) for males and 7:30 AM to 7:59 AM (12, 29.3%) for females.
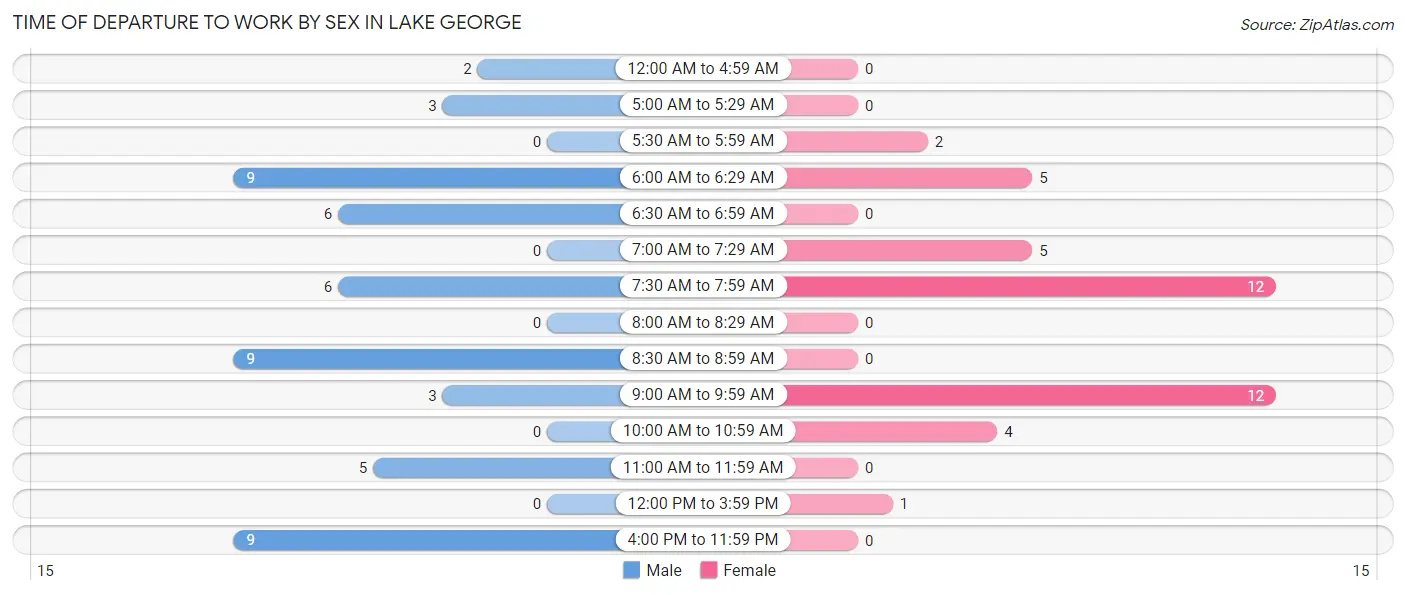
| Time of Departure | Male | Female |
| 12:00 AM to 4:59 AM | 2 (3.8%) | 0 (0.0%) |
| 5:00 AM to 5:29 AM | 3 (5.8%) | 0 (0.0%) |
| 5:30 AM to 5:59 AM | 0 (0.0%) | 2 (4.9%) |
| 6:00 AM to 6:29 AM | 9 (17.3%) | 5 (12.2%) |
| 6:30 AM to 6:59 AM | 6 (11.5%) | 0 (0.0%) |
| 7:00 AM to 7:29 AM | 0 (0.0%) | 5 (12.2%) |
| 7:30 AM to 7:59 AM | 6 (11.5%) | 12 (29.3%) |
| 8:00 AM to 8:29 AM | 0 (0.0%) | 0 (0.0%) |
| 8:30 AM to 8:59 AM | 9 (17.3%) | 0 (0.0%) |
| 9:00 AM to 9:59 AM | 3 (5.8%) | 12 (29.3%) |
| 10:00 AM to 10:59 AM | 0 (0.0%) | 4 (9.8%) |
| 11:00 AM to 11:59 AM | 5 (9.6%) | 0 (0.0%) |
| 12:00 PM to 3:59 PM | 0 (0.0%) | 1 (2.4%) |
| 4:00 PM to 11:59 PM | 9 (17.3%) | 0 (0.0%) |
| Total | 52 (100.0%) | 41 (100.0%) |
Housing Occupancy in Lake George
Occupancy by Ownership in Lake George
Of the total 88 dwellings in Lake George, owner-occupied units account for 76 (86.4%), while renter-occupied units make up 12 (13.6%).
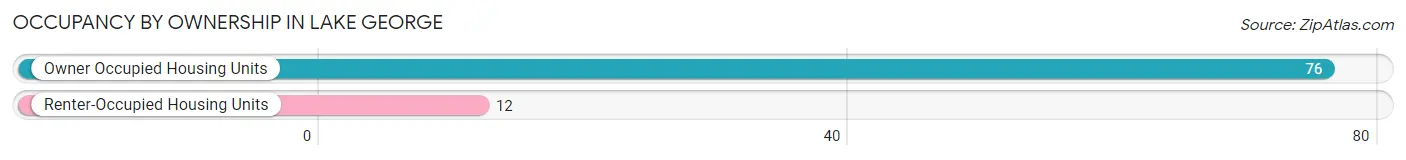
| Occupancy | # Housing Units | % Housing Units |
| Owner Occupied Housing Units | 76 | 86.4% |
| Renter-Occupied Housing Units | 12 | 13.6% |
| Total Occupied Housing Units | 88 | 100.0% |
Occupancy by Household Size in Lake George
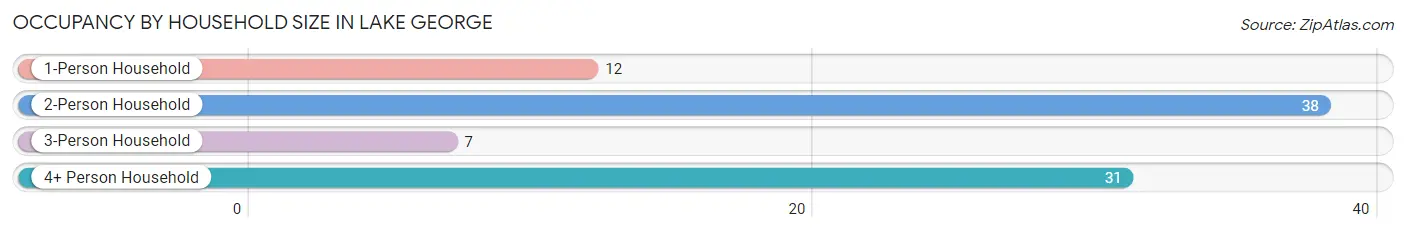
| Household Size | # Housing Units | % Housing Units |
| 1-Person Household | 12 | 13.6% |
| 2-Person Household | 38 | 43.2% |
| 3-Person Household | 7 | 8.0% |
| 4+ Person Household | 31 | 35.2% |
| Total Housing Units | 88 | 100.0% |
Occupancy by Ownership by Household Size in Lake George
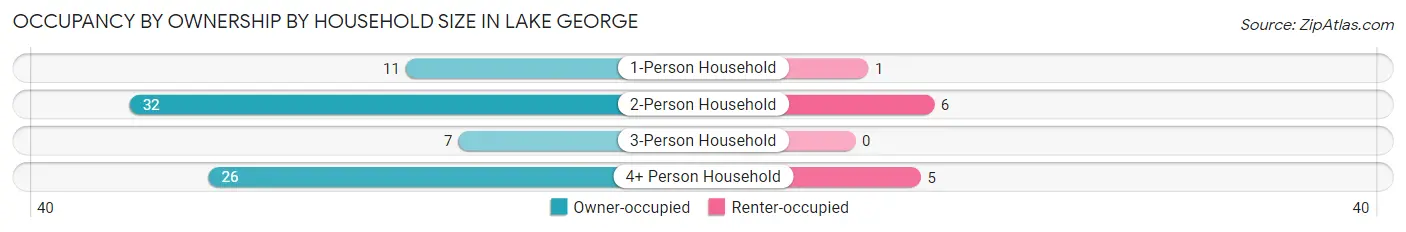
| Household Size | Owner-occupied | Renter-occupied |
| 1-Person Household | 11 (91.7%) | 1 (8.3%) |
| 2-Person Household | 32 (84.2%) | 6 (15.8%) |
| 3-Person Household | 7 (100.0%) | 0 (0.0%) |
| 4+ Person Household | 26 (83.9%) | 5 (16.1%) |
| Total Housing Units | 76 (86.4%) | 12 (13.6%) |
Occupancy by Educational Attainment in Lake George
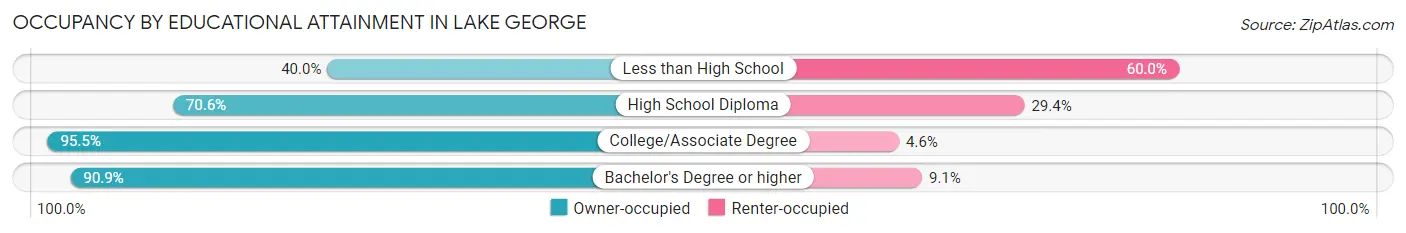
| Household Size | Owner-occupied | Renter-occupied |
| Less than High School | 2 (40.0%) | 3 (60.0%) |
| High School Diploma | 12 (70.6%) | 5 (29.4%) |
| College/Associate Degree | 42 (95.5%) | 2 (4.5%) |
| Bachelor's Degree or higher | 20 (90.9%) | 2 (9.1%) |
Occupancy by Age of Householder in Lake George
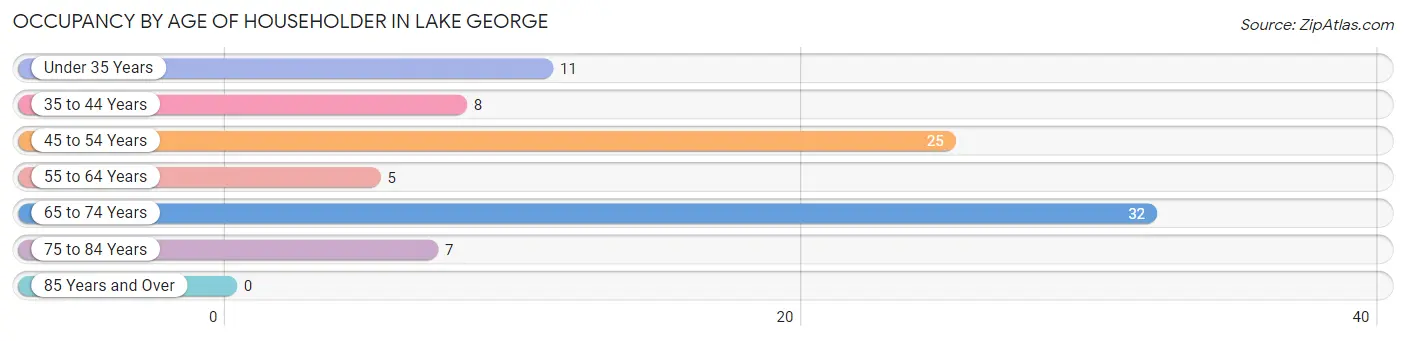
| Age Bracket | # Households | % Households |
| Under 35 Years | 11 | 12.5% |
| 35 to 44 Years | 8 | 9.1% |
| 45 to 54 Years | 25 | 28.4% |
| 55 to 64 Years | 5 | 5.7% |
| 65 to 74 Years | 32 | 36.4% |
| 75 to 84 Years | 7 | 8.0% |
| 85 Years and Over | 0 | 0.0% |
| Total | 88 | 100.0% |
Housing Finances in Lake George
Median Income by Occupancy in Lake George
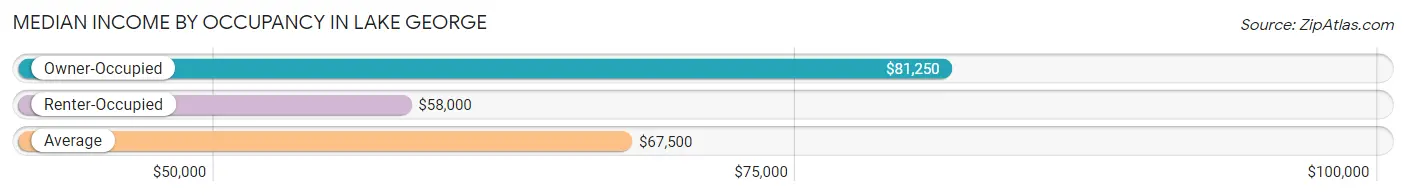
| Occupancy Type | # Households | Median Income |
| Owner-Occupied | 76 (86.4%) | $81,250 |
| Renter-Occupied | 12 (13.6%) | $58,000 |
| Average | 88 (100.0%) | $67,500 |
Occupancy by Householder Income Bracket in Lake George
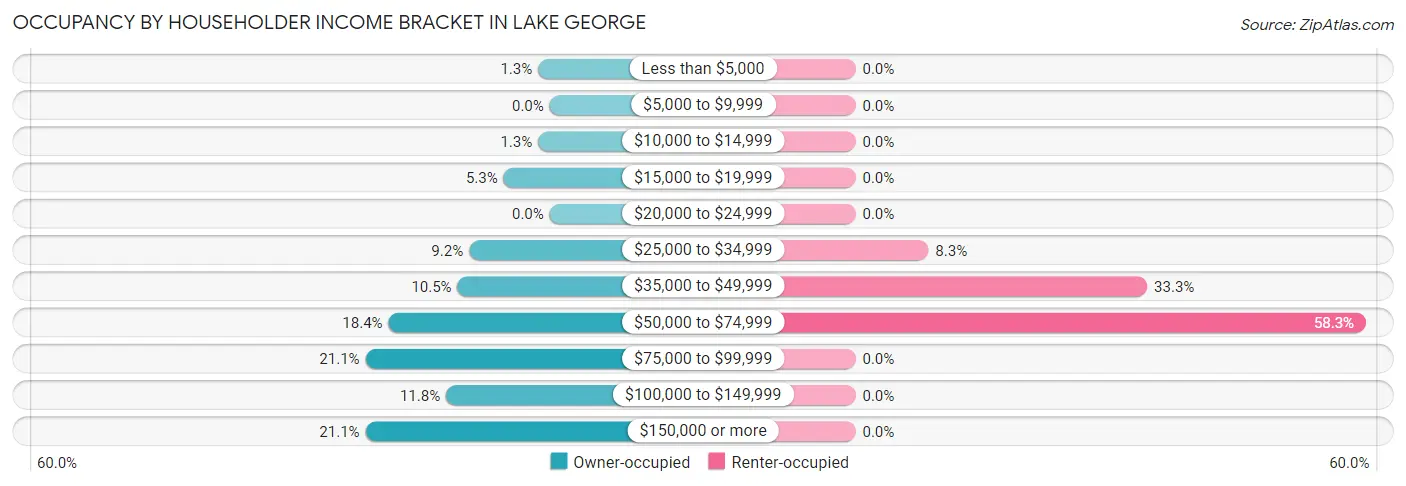
| Income Bracket | Owner-occupied | Renter-occupied |
| Less than $5,000 | 1 (1.3%) | 0 (0.0%) |
| $5,000 to $9,999 | 0 (0.0%) | 0 (0.0%) |
| $10,000 to $14,999 | 1 (1.3%) | 0 (0.0%) |
| $15,000 to $19,999 | 4 (5.3%) | 0 (0.0%) |
| $20,000 to $24,999 | 0 (0.0%) | 0 (0.0%) |
| $25,000 to $34,999 | 7 (9.2%) | 1 (8.3%) |
| $35,000 to $49,999 | 8 (10.5%) | 4 (33.3%) |
| $50,000 to $74,999 | 14 (18.4%) | 7 (58.3%) |
| $75,000 to $99,999 | 16 (21.0%) | 0 (0.0%) |
| $100,000 to $149,999 | 9 (11.8%) | 0 (0.0%) |
| $150,000 or more | 16 (21.0%) | 0 (0.0%) |
| Total | 76 (100.0%) | 12 (100.0%) |
Monthly Housing Cost Tiers in Lake George
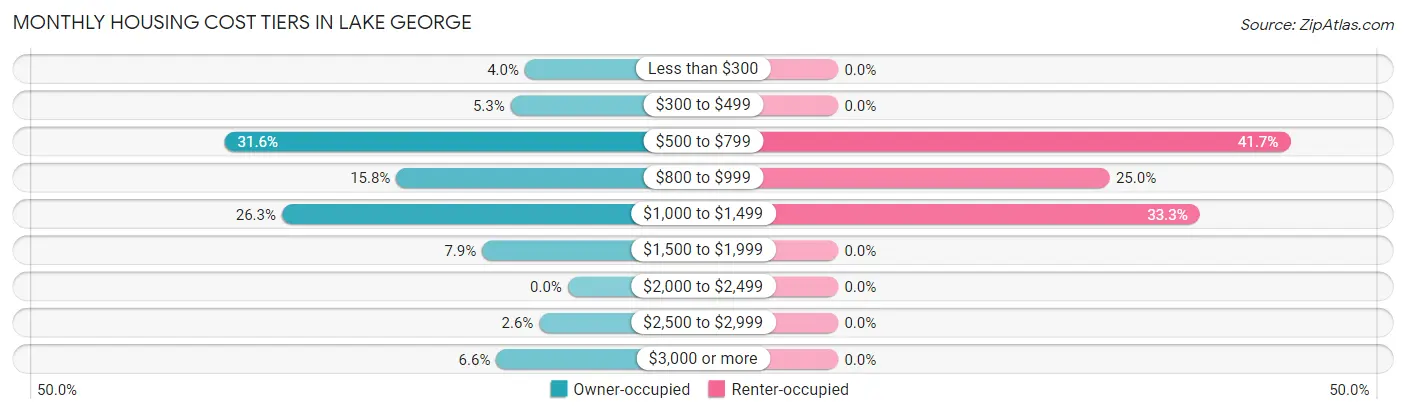
| Monthly Cost | Owner-occupied | Renter-occupied |
| Less than $300 | 3 (4.0%) | 0 (0.0%) |
| $300 to $499 | 4 (5.3%) | 0 (0.0%) |
| $500 to $799 | 24 (31.6%) | 5 (41.7%) |
| $800 to $999 | 12 (15.8%) | 3 (25.0%) |
| $1,000 to $1,499 | 20 (26.3%) | 4 (33.3%) |
| $1,500 to $1,999 | 6 (7.9%) | 0 (0.0%) |
| $2,000 to $2,499 | 0 (0.0%) | 0 (0.0%) |
| $2,500 to $2,999 | 2 (2.6%) | 0 (0.0%) |
| $3,000 or more | 5 (6.6%) | 0 (0.0%) |
| Total | 76 (100.0%) | 12 (100.0%) |
Physical Housing Characteristics in Lake George
Housing Structures in Lake George
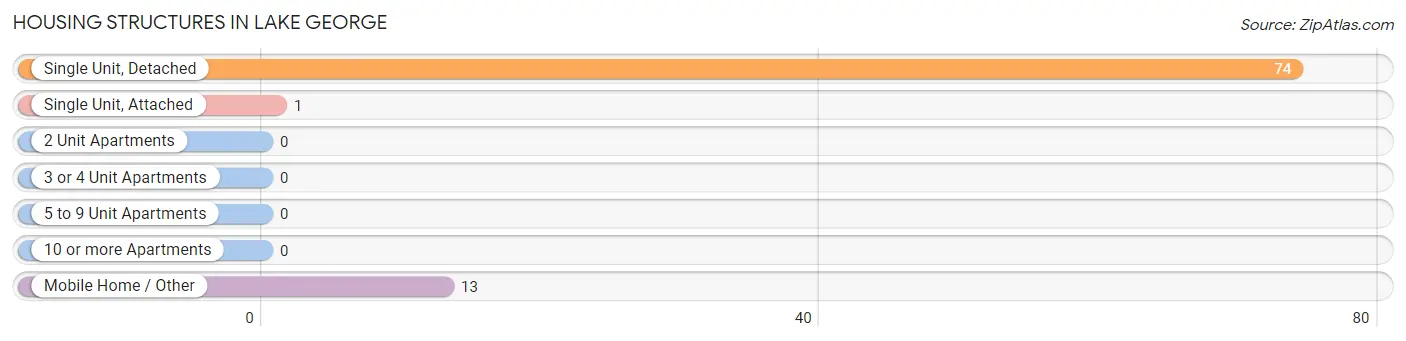
| Structure Type | # Housing Units | % Housing Units |
| Single Unit, Detached | 74 | 84.1% |
| Single Unit, Attached | 1 | 1.1% |
| 2 Unit Apartments | 0 | 0.0% |
| 3 or 4 Unit Apartments | 0 | 0.0% |
| 5 to 9 Unit Apartments | 0 | 0.0% |
| 10 or more Apartments | 0 | 0.0% |
| Mobile Home / Other | 13 | 14.8% |
| Total | 88 | 100.0% |
Housing Structures by Occupancy in Lake George
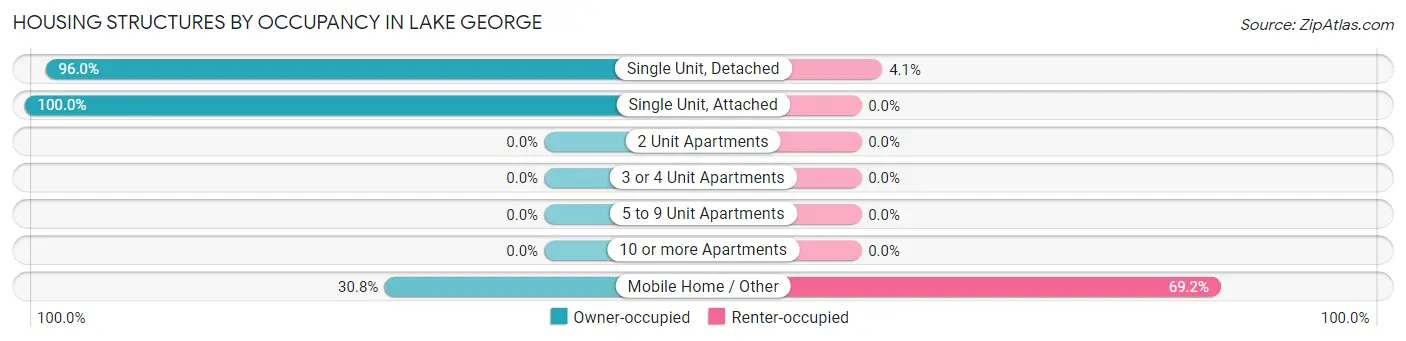
| Structure Type | Owner-occupied | Renter-occupied |
| Single Unit, Detached | 71 (96.0%) | 3 (4.1%) |
| Single Unit, Attached | 1 (100.0%) | 0 (0.0%) |
| 2 Unit Apartments | 0 (0.0%) | 0 (0.0%) |
| 3 or 4 Unit Apartments | 0 (0.0%) | 0 (0.0%) |
| 5 to 9 Unit Apartments | 0 (0.0%) | 0 (0.0%) |
| 10 or more Apartments | 0 (0.0%) | 0 (0.0%) |
| Mobile Home / Other | 4 (30.8%) | 9 (69.2%) |
| Total | 76 (86.4%) | 12 (13.6%) |
Housing Structures by Number of Rooms in Lake George
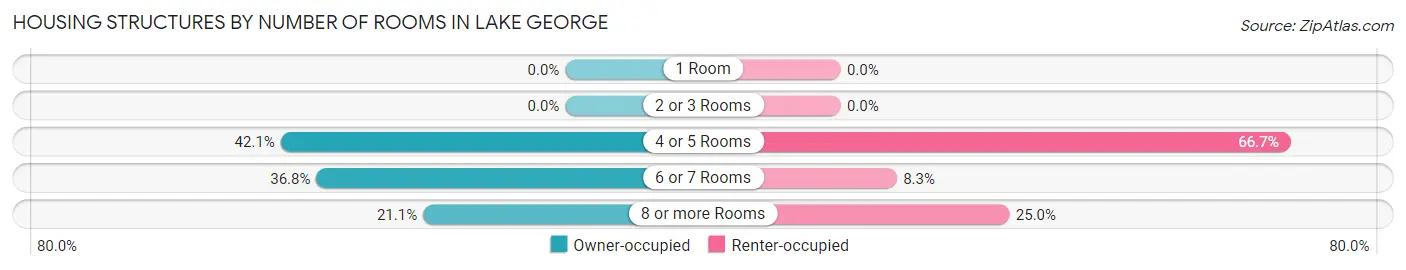
| Number of Rooms | Owner-occupied | Renter-occupied |
| 1 Room | 0 (0.0%) | 0 (0.0%) |
| 2 or 3 Rooms | 0 (0.0%) | 0 (0.0%) |
| 4 or 5 Rooms | 32 (42.1%) | 8 (66.7%) |
| 6 or 7 Rooms | 28 (36.8%) | 1 (8.3%) |
| 8 or more Rooms | 16 (21.0%) | 3 (25.0%) |
| Total | 76 (100.0%) | 12 (100.0%) |
Housing Structure by Heating Type in Lake George
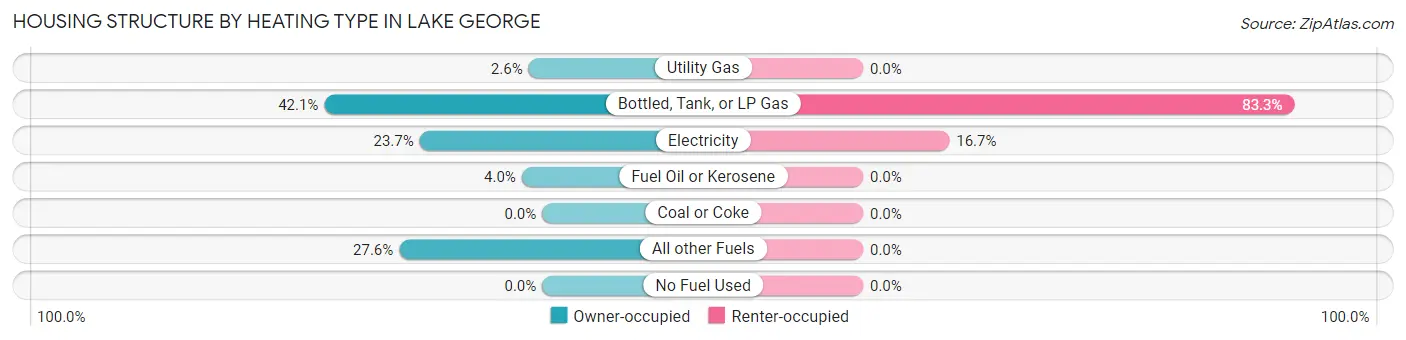
| Heating Type | Owner-occupied | Renter-occupied |
| Utility Gas | 2 (2.6%) | 0 (0.0%) |
| Bottled, Tank, or LP Gas | 32 (42.1%) | 10 (83.3%) |
| Electricity | 18 (23.7%) | 2 (16.7%) |
| Fuel Oil or Kerosene | 3 (4.0%) | 0 (0.0%) |
| Coal or Coke | 0 (0.0%) | 0 (0.0%) |
| All other Fuels | 21 (27.6%) | 0 (0.0%) |
| No Fuel Used | 0 (0.0%) | 0 (0.0%) |
| Total | 76 (100.0%) | 12 (100.0%) |
Household Vehicle Usage in Lake George
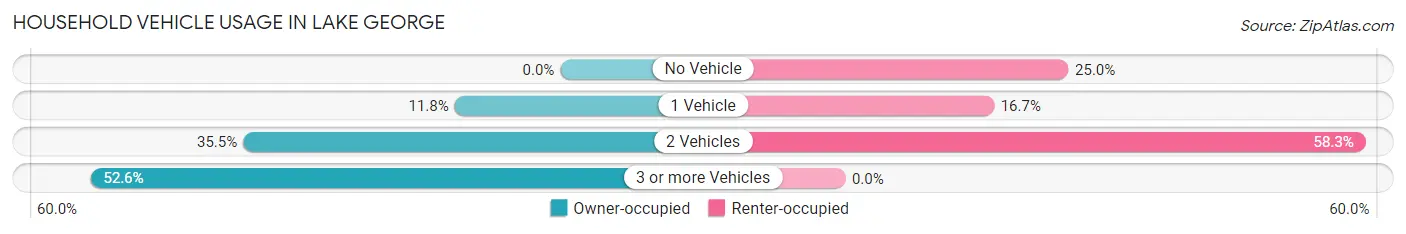
| Vehicles per Household | Owner-occupied | Renter-occupied |
| No Vehicle | 0 (0.0%) | 3 (25.0%) |
| 1 Vehicle | 9 (11.8%) | 2 (16.7%) |
| 2 Vehicles | 27 (35.5%) | 7 (58.3%) |
| 3 or more Vehicles | 40 (52.6%) | 0 (0.0%) |
| Total | 76 (100.0%) | 12 (100.0%) |
Real Estate & Mortgages in Lake George
Real Estate and Mortgage Overview in Lake George
| Characteristic | Without Mortgage | With Mortgage |
| Housing Units | 39 | 37 |
| Median Property Value | $168,800 | $228,100 |
| Median Household Income | $64,375 | $6 |
| Monthly Housing Costs | $596 | $5 |
| Real Estate Taxes | $1,932 | $1 |
Property Value by Mortgage Status in Lake George
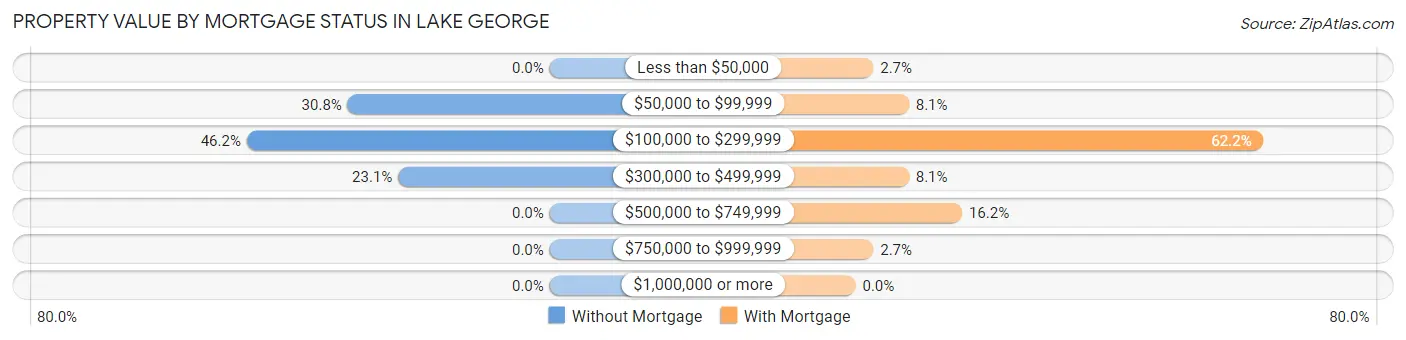
| Property Value | Without Mortgage | With Mortgage |
| Less than $50,000 | 0 (0.0%) | 1 (2.7%) |
| $50,000 to $99,999 | 12 (30.8%) | 3 (8.1%) |
| $100,000 to $299,999 | 18 (46.2%) | 23 (62.2%) |
| $300,000 to $499,999 | 9 (23.1%) | 3 (8.1%) |
| $500,000 to $749,999 | 0 (0.0%) | 6 (16.2%) |
| $750,000 to $999,999 | 0 (0.0%) | 1 (2.7%) |
| $1,000,000 or more | 0 (0.0%) | 0 (0.0%) |
| Total | 39 (100.0%) | 37 (100.0%) |
Household Income by Mortgage Status in Lake George
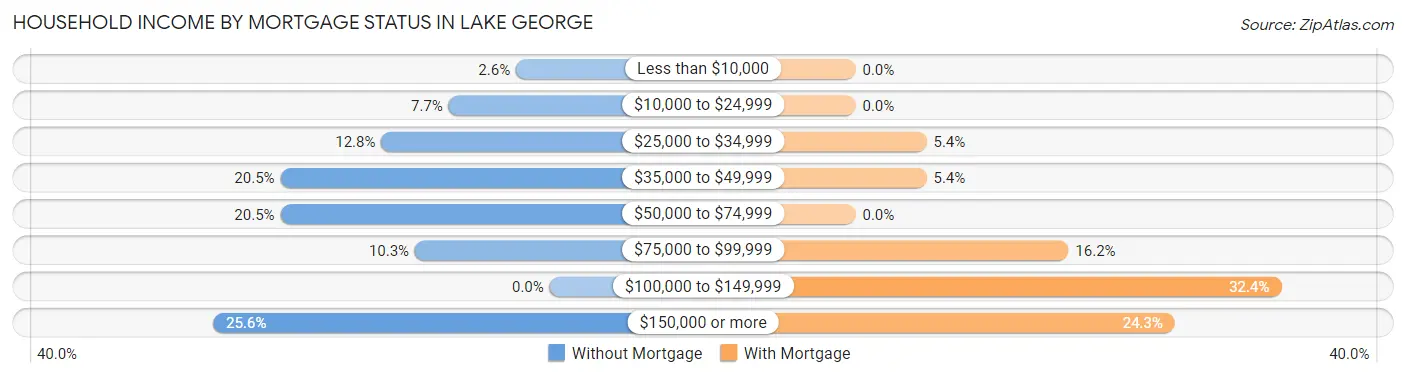
| Household Income | Without Mortgage | With Mortgage |
| Less than $10,000 | 1 (2.6%) | 0 (0.0%) |
| $10,000 to $24,999 | 3 (7.7%) | 0 (0.0%) |
| $25,000 to $34,999 | 5 (12.8%) | 2 (5.4%) |
| $35,000 to $49,999 | 8 (20.5%) | 2 (5.4%) |
| $50,000 to $74,999 | 8 (20.5%) | 0 (0.0%) |
| $75,000 to $99,999 | 4 (10.3%) | 6 (16.2%) |
| $100,000 to $149,999 | 0 (0.0%) | 12 (32.4%) |
| $150,000 or more | 10 (25.6%) | 9 (24.3%) |
| Total | 39 (100.0%) | 37 (100.0%) |
Property Value to Household Income Ratio in Lake George
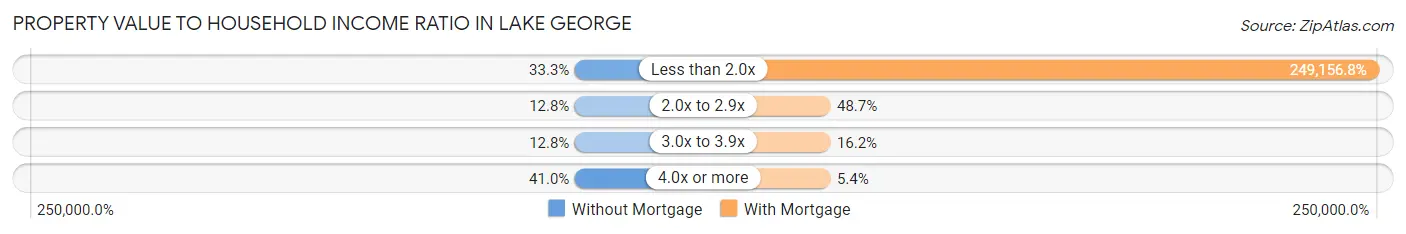
| Value-to-Income Ratio | Without Mortgage | With Mortgage |
| Less than 2.0x | 13 (33.3%) | 92,188 (249,156.8%) |
| 2.0x to 2.9x | 5 (12.8%) | 18 (48.6%) |
| 3.0x to 3.9x | 5 (12.8%) | 6 (16.2%) |
| 4.0x or more | 16 (41.0%) | 2 (5.4%) |
| Total | 39 (100.0%) | 37 (100.0%) |
Real Estate Taxes by Mortgage Status in Lake George
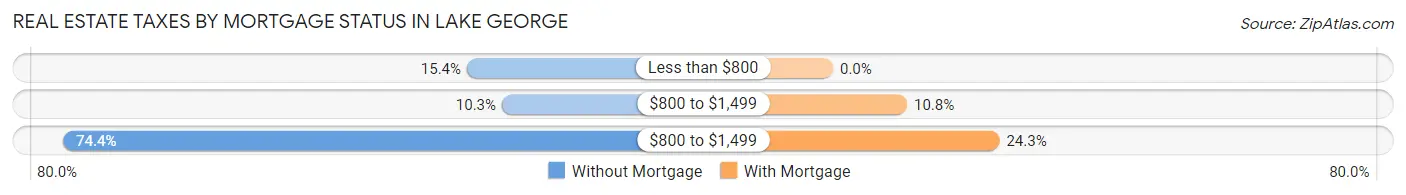
| Property Taxes | Without Mortgage | With Mortgage |
| Less than $800 | 6 (15.4%) | 0 (0.0%) |
| $800 to $1,499 | 4 (10.3%) | 4 (10.8%) |
| $800 to $1,499 | 29 (74.4%) | 9 (24.3%) |
| Total | 39 (100.0%) | 37 (100.0%) |
Health & Disability in Lake George
Health Insurance Coverage by Age in Lake George
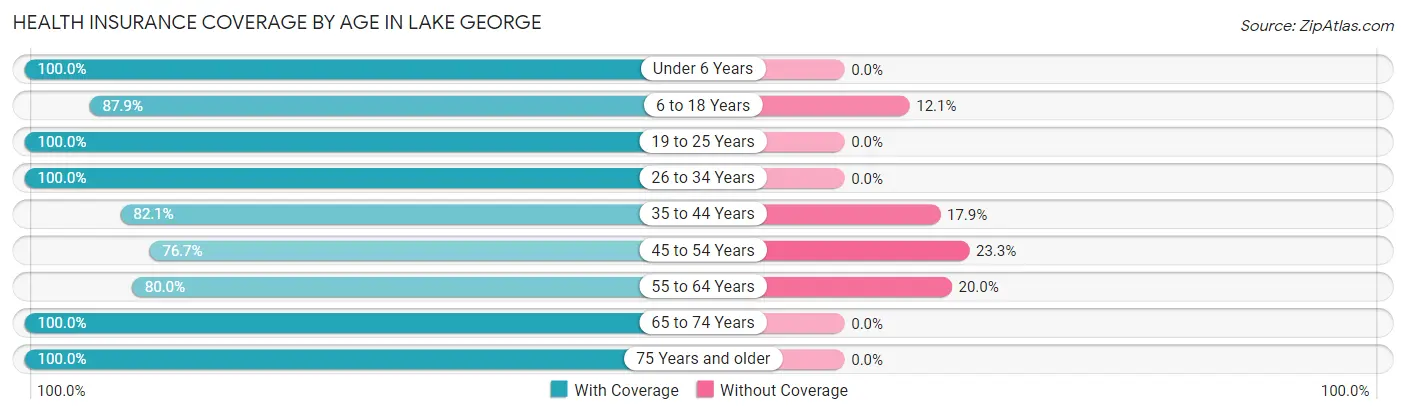
| Age Bracket | With Coverage | Without Coverage |
| Under 6 Years | 13 (100.0%) | 0 (0.0%) |
| 6 to 18 Years | 29 (87.9%) | 4 (12.1%) |
| 19 to 25 Years | 29 (100.0%) | 0 (0.0%) |
| 26 to 34 Years | 10 (100.0%) | 0 (0.0%) |
| 35 to 44 Years | 23 (82.1%) | 5 (17.9%) |
| 45 to 54 Years | 33 (76.7%) | 10 (23.3%) |
| 55 to 64 Years | 20 (80.0%) | 5 (20.0%) |
| 65 to 74 Years | 51 (100.0%) | 0 (0.0%) |
| 75 Years and older | 24 (100.0%) | 0 (0.0%) |
| Total | 232 (90.6%) | 24 (9.4%) |
Health Insurance Coverage by Citizenship Status in Lake George
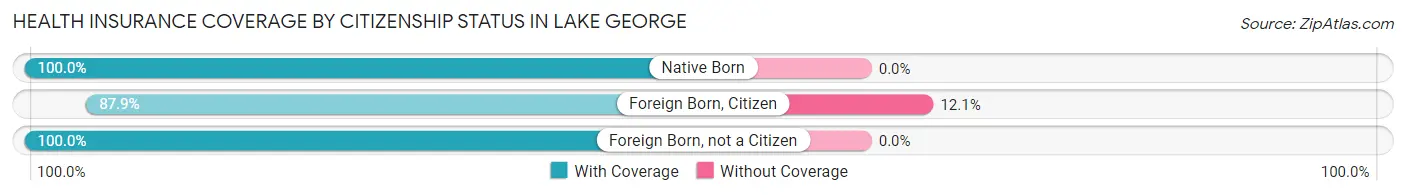
| Citizenship Status | With Coverage | Without Coverage |
| Native Born | 13 (100.0%) | 0 (0.0%) |
| Foreign Born, Citizen | 29 (87.9%) | 4 (12.1%) |
| Foreign Born, not a Citizen | 29 (100.0%) | 0 (0.0%) |
Health Insurance Coverage by Household Income in Lake George
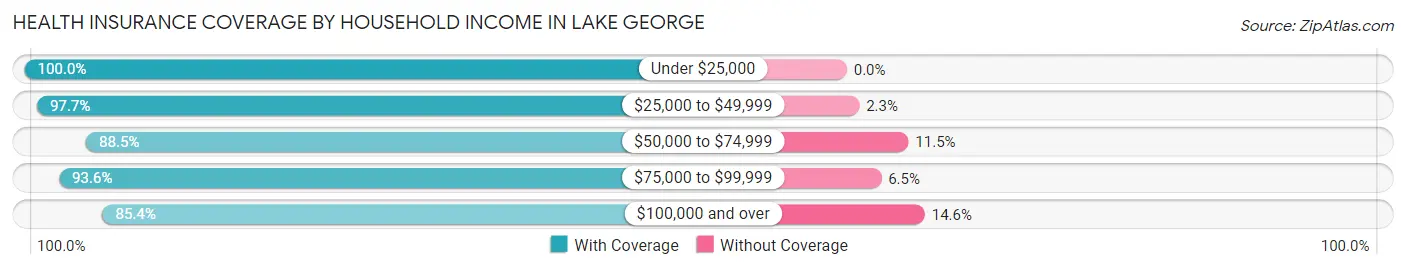
| Household Income | With Coverage | Without Coverage |
| Under $25,000 | 10 (100.0%) | 0 (0.0%) |
| $25,000 to $49,999 | 42 (97.7%) | 1 (2.3%) |
| $50,000 to $74,999 | 46 (88.5%) | 6 (11.5%) |
| $75,000 to $99,999 | 58 (93.5%) | 4 (6.5%) |
| $100,000 and over | 76 (85.4%) | 13 (14.6%) |
Public vs Private Health Insurance Coverage by Age in Lake George
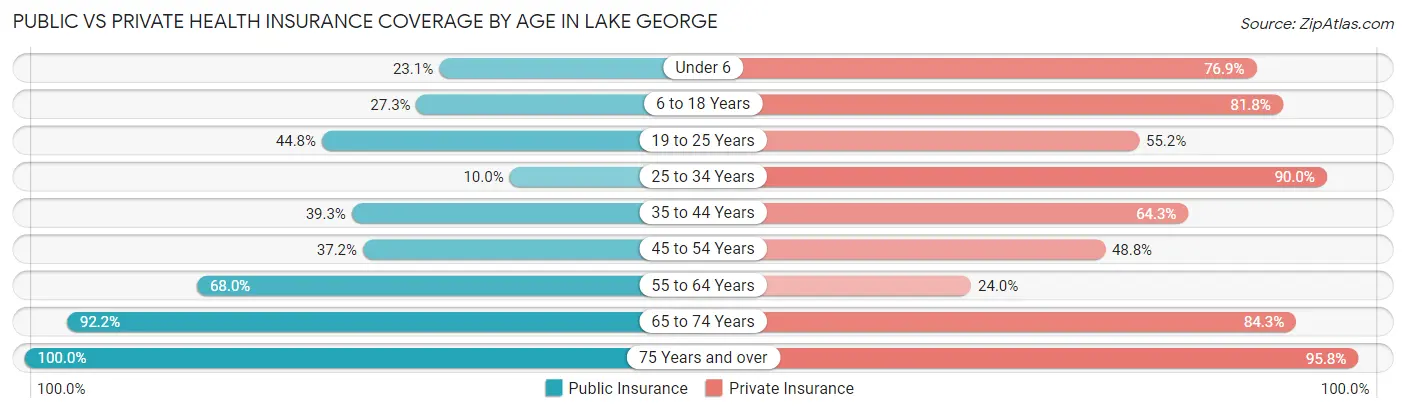
| Age Bracket | Public Insurance | Private Insurance |
| Under 6 | 3 (23.1%) | 10 (76.9%) |
| 6 to 18 Years | 9 (27.3%) | 27 (81.8%) |
| 19 to 25 Years | 13 (44.8%) | 16 (55.2%) |
| 25 to 34 Years | 1 (10.0%) | 9 (90.0%) |
| 35 to 44 Years | 11 (39.3%) | 18 (64.3%) |
| 45 to 54 Years | 16 (37.2%) | 21 (48.8%) |
| 55 to 64 Years | 17 (68.0%) | 6 (24.0%) |
| 65 to 74 Years | 47 (92.2%) | 43 (84.3%) |
| 75 Years and over | 24 (100.0%) | 23 (95.8%) |
| Total | 141 (55.1%) | 173 (67.6%) |
Disability Status by Sex by Age in Lake George
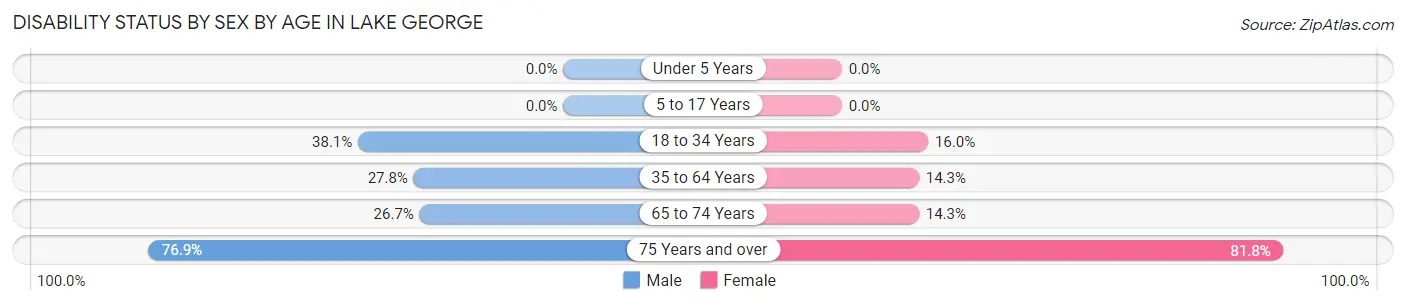
| Age Bracket | Male | Female |
| Under 5 Years | 0 (0.0%) | 0 (0.0%) |
| 5 to 17 Years | 0 (0.0%) | 0 (0.0%) |
| 18 to 34 Years | 8 (38.1%) | 4 (16.0%) |
| 35 to 64 Years | 15 (27.8%) | 6 (14.3%) |
| 65 to 74 Years | 8 (26.7%) | 3 (14.3%) |
| 75 Years and over | 10 (76.9%) | 9 (81.8%) |
Disability Class by Sex by Age in Lake George
Disability Class: Hearing Difficulty
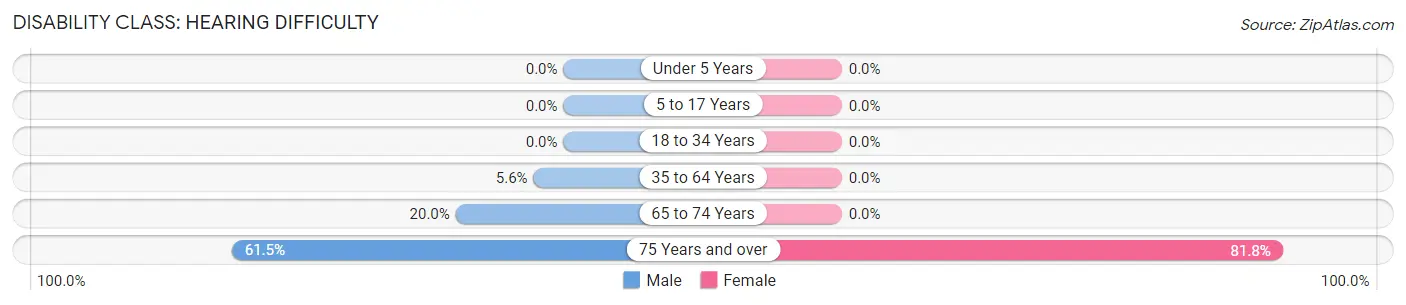
| Age Bracket | Male | Female |
| Under 5 Years | 0 (0.0%) | 0 (0.0%) |
| 5 to 17 Years | 0 (0.0%) | 0 (0.0%) |
| 18 to 34 Years | 0 (0.0%) | 0 (0.0%) |
| 35 to 64 Years | 3 (5.6%) | 0 (0.0%) |
| 65 to 74 Years | 6 (20.0%) | 0 (0.0%) |
| 75 Years and over | 8 (61.5%) | 9 (81.8%) |
Disability Class: Vision Difficulty
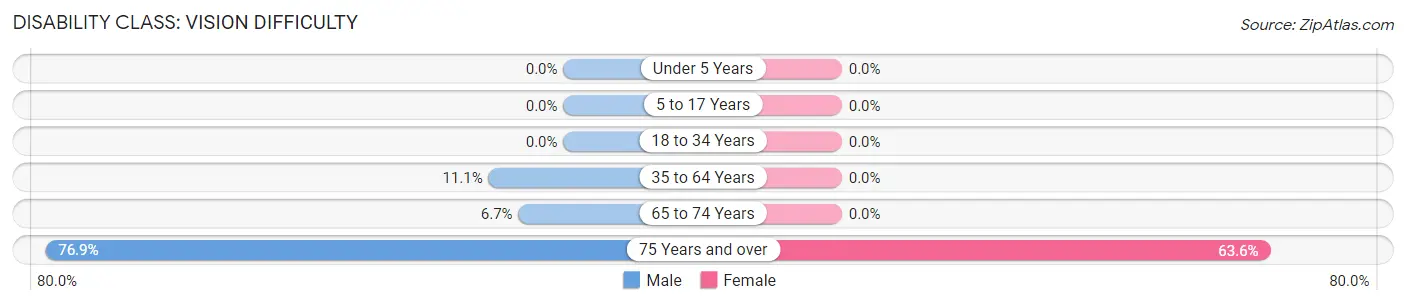
| Age Bracket | Male | Female |
| Under 5 Years | 0 (0.0%) | 0 (0.0%) |
| 5 to 17 Years | 0 (0.0%) | 0 (0.0%) |
| 18 to 34 Years | 0 (0.0%) | 0 (0.0%) |
| 35 to 64 Years | 6 (11.1%) | 0 (0.0%) |
| 65 to 74 Years | 2 (6.7%) | 0 (0.0%) |
| 75 Years and over | 10 (76.9%) | 7 (63.6%) |
Disability Class: Cognitive Difficulty
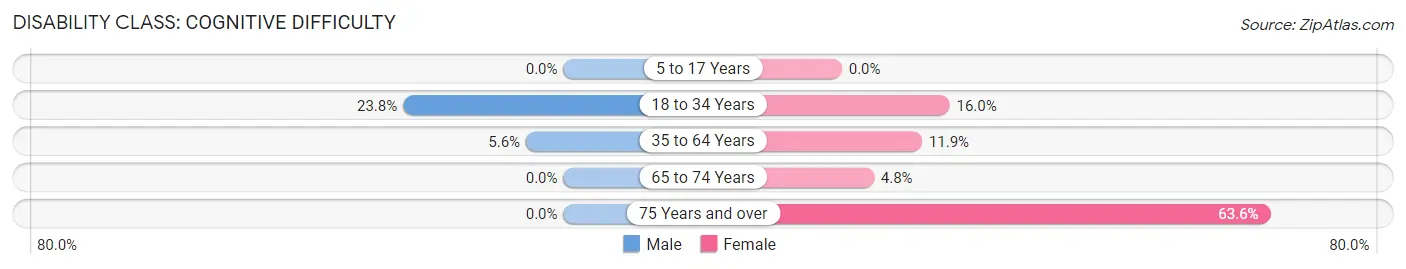
| Age Bracket | Male | Female |
| 5 to 17 Years | 0 (0.0%) | 0 (0.0%) |
| 18 to 34 Years | 5 (23.8%) | 4 (16.0%) |
| 35 to 64 Years | 3 (5.6%) | 5 (11.9%) |
| 65 to 74 Years | 0 (0.0%) | 1 (4.8%) |
| 75 Years and over | 0 (0.0%) | 7 (63.6%) |
Disability Class: Ambulatory Difficulty
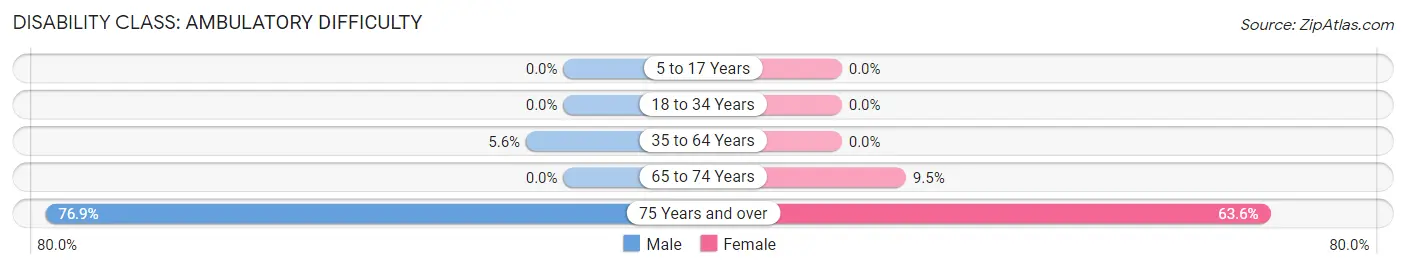
| Age Bracket | Male | Female |
| 5 to 17 Years | 0 (0.0%) | 0 (0.0%) |
| 18 to 34 Years | 0 (0.0%) | 0 (0.0%) |
| 35 to 64 Years | 3 (5.6%) | 0 (0.0%) |
| 65 to 74 Years | 0 (0.0%) | 2 (9.5%) |
| 75 Years and over | 10 (76.9%) | 7 (63.6%) |
Disability Class: Self-Care Difficulty
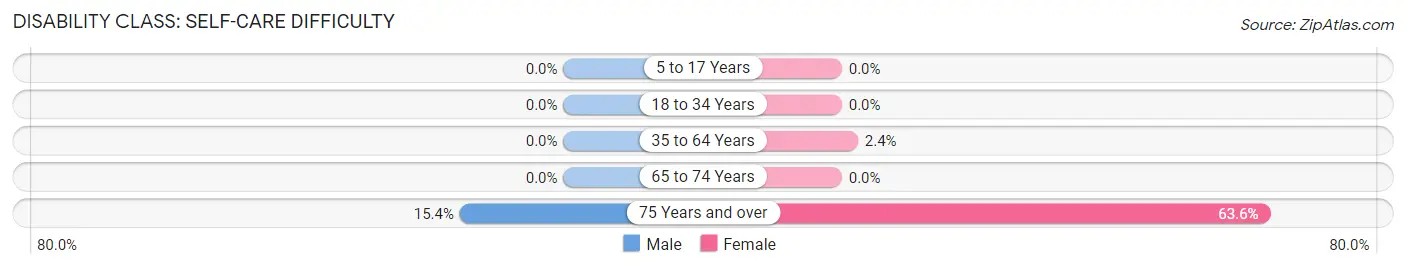
| Age Bracket | Male | Female |
| 5 to 17 Years | 0 (0.0%) | 0 (0.0%) |
| 18 to 34 Years | 0 (0.0%) | 0 (0.0%) |
| 35 to 64 Years | 0 (0.0%) | 1 (2.4%) |
| 65 to 74 Years | 0 (0.0%) | 0 (0.0%) |
| 75 Years and over | 2 (15.4%) | 7 (63.6%) |
Technology Access in Lake George
Computing Device Access in Lake George
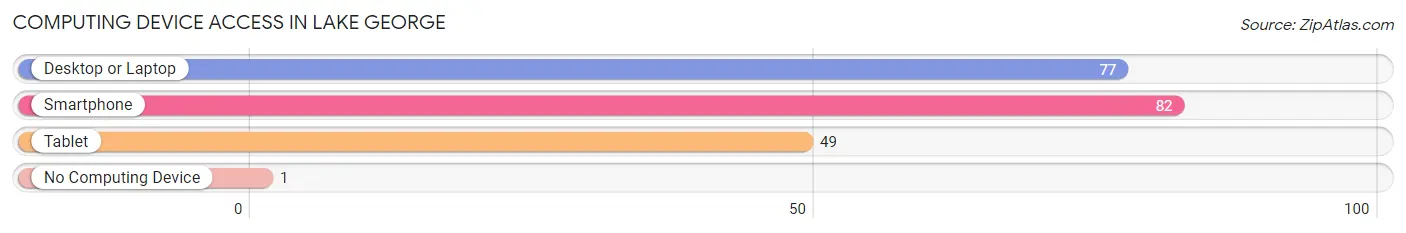
| Device Type | # Households | % Households |
| Desktop or Laptop | 77 | 87.5% |
| Smartphone | 82 | 93.2% |
| Tablet | 49 | 55.7% |
| No Computing Device | 1 | 1.1% |
| Total | 88 | 100.0% |
Internet Access in Lake George
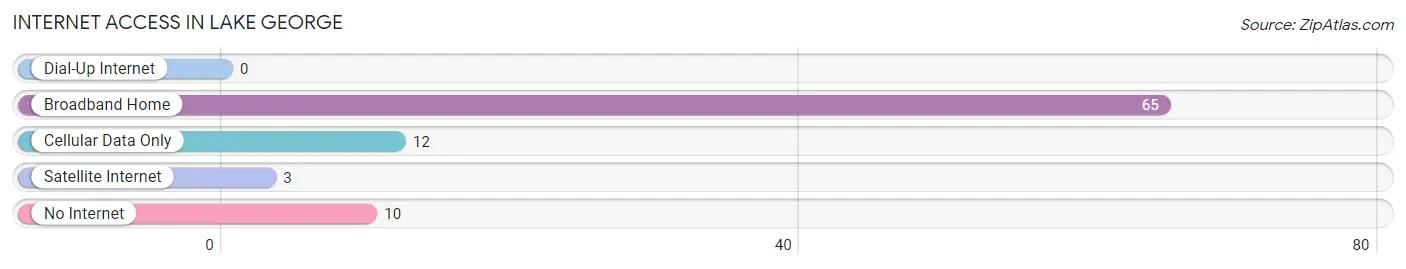
| Internet Type | # Households | % Households |
| Dial-Up Internet | 0 | 0.0% |
| Broadband Home | 65 | 73.9% |
| Cellular Data Only | 12 | 13.6% |
| Satellite Internet | 3 | 3.4% |
| No Internet | 10 | 11.4% |
| Total | 88 | 100.0% |
Lake George Summary
Lake George is a small town located in the state of Minnesota, United States. It is situated in the northern part of the state, in the county of St. Louis. The town has a population of approximately 1,000 people, and is located on the shores of Lake George, a large lake in the area.
History
The area around Lake George has been inhabited for thousands of years by the Ojibwe people. The first European settlers arrived in the area in the late 1800s, and the town of Lake George was officially established in 1887. The town was named after the lake, which was named after the British King George III.
The town grew slowly over the years, and by the early 1900s, it had become a popular tourist destination. The town was home to several resorts, and the lake was a popular spot for fishing and boating.
In the 1950s, the town began to decline as the popularity of the resorts began to wane. The town was hit hard by the Great Depression, and many of the businesses in the area closed. In the 1970s, the town began to experience a resurgence, as new businesses began to open and the population began to grow.
Geography
Lake George is located in the northern part of Minnesota, in the county of St. Louis. The town is situated on the shores of Lake George, a large lake in the area. The lake is approximately 8 miles long and 2 miles wide, and is a popular spot for fishing and boating.
The town is surrounded by forests and lakes, and is located near the Boundary Waters Canoe Area Wilderness. The town is also located near the Superior National Forest, which is home to a variety of wildlife.
Economy
The economy of Lake George is largely based on tourism. The town is home to several resorts, and the lake is a popular spot for fishing and boating. The town is also home to several restaurants, bars, and shops.
The town is also home to several small businesses, including a lumber mill, a sawmill, and a boat repair shop. The town is also home to a small airport, which serves the area.
Demographics
As of the 2010 census, the population of Lake George was 1,000 people. The town is predominantly white, with approximately 95% of the population being white. The town is also home to a small Native American population, with approximately 5% of the population being Native American.
The median household income in the town is approximately $35,000, and the median home value is approximately $150,000. The town has a low unemployment rate, and the majority of the population is employed in the tourism industry.
Conclusion
Lake George is a small town located in the northern part of Minnesota, United States. The town has a population of approximately 1,000 people, and is situated on the shores of Lake George, a large lake in the area. The town is largely based on tourism, and is home to several resorts, restaurants, bars, and shops. The town is predominantly white, with approximately 95% of the population being white. The median household income in the town is approximately $35,000, and the median home value is approximately $150,000. The town has a low unemployment rate, and the majority of the population is employed in the tourism industry.
Common Questions
What is Per Capita Income in Lake George?
Per Capita income in Lake George is $32,617.
What is the Median Family Income in Lake George?
Median Family Income in Lake George is $64,688.
What is the Median Household income in Lake George?
Median Household Income in Lake George is $67,500.
What is Income or Wage Gap in Lake George?
Income or Wage Gap in Lake George is 51.6%.
Women in Lake George earn 48.4 cents for every dollar earned by a man.
What is Inequality or Gini Index in Lake George?
Inequality or Gini Index in Lake George is 0.33.
What is the Total Population of Lake George?
Total Population of Lake George is 256.
What is the Total Male Population of Lake George?
Total Male Population of Lake George is 149.
What is the Total Female Population of Lake George?
Total Female Population of Lake George is 107.
What is the Ratio of Males per 100 Females in Lake George?
There are 139.25 Males per 100 Females in Lake George.
What is the Ratio of Females per 100 Males in Lake George?
There are 71.81 Females per 100 Males in Lake George.
What is the Median Population Age in Lake George?
Median Population Age in Lake George is 49.2 Years.
What is the Average Family Size in Lake George
Average Family Size in Lake George is 3.2 People.
What is the Average Household Size in Lake George
Average Household Size in Lake George is 2.9 People.
How Large is the Labor Force in Lake George?
There are 124 People in the Labor Forcein in Lake George.
What is the Percentage of People in the Labor Force in Lake George?
56.1% of People are in the Labor Force in Lake George.
What is the Unemployment Rate in Lake George?
Unemployment Rate in Lake George is 16.1%.