Lake Bronson, MN Map & Demographics
Lake Bronson Map
Lake Bronson Overview
$33,716
PER CAPITA INCOME
$77,813
AVG FAMILY INCOME
$52,614
AVG HOUSEHOLD INCOME
1.1%
WAGE / INCOME GAP [ % ]
98.9¢/ $1
WAGE / INCOME GAP [ $ ]
0.35
INEQUALITY / GINI INDEX
170
TOTAL POPULATION
88
MALE POPULATION
82
FEMALE POPULATION
107.32
MALES / 100 FEMALES
93.18
FEMALES / 100 MALES
44.0
MEDIAN AGE
2.3
AVG FAMILY SIZE
1.5
AVG HOUSEHOLD SIZE
132
LABOR FORCE [ PEOPLE ]
80.0%
PERCENT IN LABOR FORCE
22.7%
UNEMPLOYMENT RATE
Lake Bronson Zip Codes
Lake Bronson Area Codes
Income in Lake Bronson
Income Overview in Lake Bronson
Per Capita Income in Lake Bronson is $33,716, while median incomes of families and households are $77,813 and $52,614 respectively.
| Characteristic | Number | Measure |
| Per Capita Income | 170 | $33,716 |
| Median Family Income | 19 | $77,813 |
| Mean Family Income | 19 | $82,374 |
| Median Household Income | 110 | $52,614 |
| Mean Household Income | 110 | $52,975 |
| Income Deficit | 19 | $0 |
| Wage / Income Gap (%) | 170 | 1.13% |
| Wage / Income Gap ($) | 170 | 98.87¢ per $1 |
| Gini / Inequality Index | 170 | 0.35 |
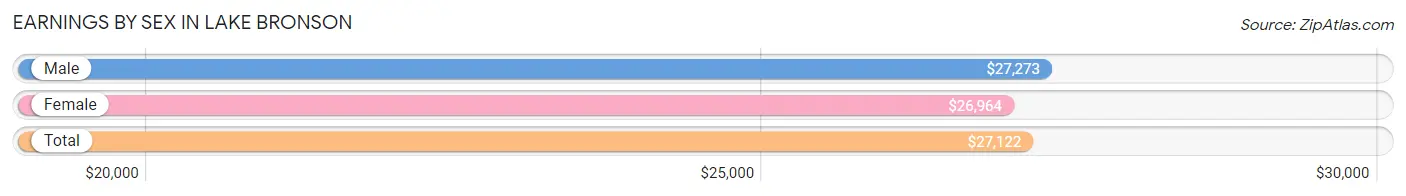
Earnings by Sex in Lake Bronson
Average Earnings in Lake Bronson are $27,122, $27,273 for men and $26,964 for women, a difference of 1.1%.
| Sex | Number | Average Earnings |
| Male | 78 (56.1%) | $27,273 |
| Female | 61 (43.9%) | $26,964 |
| Total | 139 (100.0%) | $27,122 |
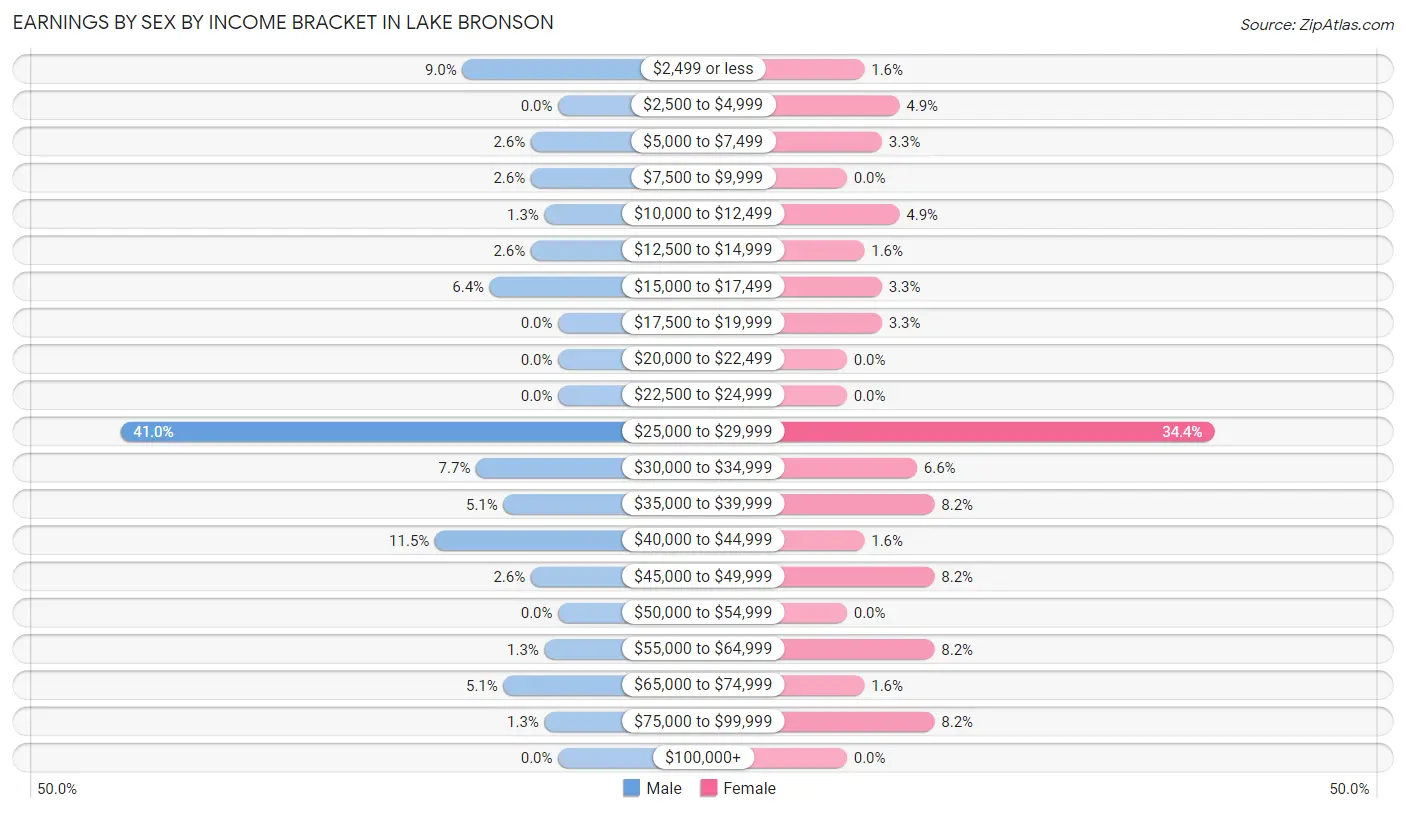
Earnings by Sex by Income Bracket in Lake Bronson
The most common earnings brackets in Lake Bronson are $25,000 to $29,999 for men (32 | 41.0%) and $25,000 to $29,999 for women (21 | 34.4%).
| Income | Male | Female |
| $2,499 or less | 7 (9.0%) | 1 (1.6%) |
| $2,500 to $4,999 | 0 (0.0%) | 3 (4.9%) |
| $5,000 to $7,499 | 2 (2.6%) | 2 (3.3%) |
| $7,500 to $9,999 | 2 (2.6%) | 0 (0.0%) |
| $10,000 to $12,499 | 1 (1.3%) | 3 (4.9%) |
| $12,500 to $14,999 | 2 (2.6%) | 1 (1.6%) |
| $15,000 to $17,499 | 5 (6.4%) | 2 (3.3%) |
| $17,500 to $19,999 | 0 (0.0%) | 2 (3.3%) |
| $20,000 to $22,499 | 0 (0.0%) | 0 (0.0%) |
| $22,500 to $24,999 | 0 (0.0%) | 0 (0.0%) |
| $25,000 to $29,999 | 32 (41.0%) | 21 (34.4%) |
| $30,000 to $34,999 | 6 (7.7%) | 4 (6.6%) |
| $35,000 to $39,999 | 4 (5.1%) | 5 (8.2%) |
| $40,000 to $44,999 | 9 (11.5%) | 1 (1.6%) |
| $45,000 to $49,999 | 2 (2.6%) | 5 (8.2%) |
| $50,000 to $54,999 | 0 (0.0%) | 0 (0.0%) |
| $55,000 to $64,999 | 1 (1.3%) | 5 (8.2%) |
| $65,000 to $74,999 | 4 (5.1%) | 1 (1.6%) |
| $75,000 to $99,999 | 1 (1.3%) | 5 (8.2%) |
| $100,000+ | 0 (0.0%) | 0 (0.0%) |
| Total | 78 (100.0%) | 61 (100.0%) |
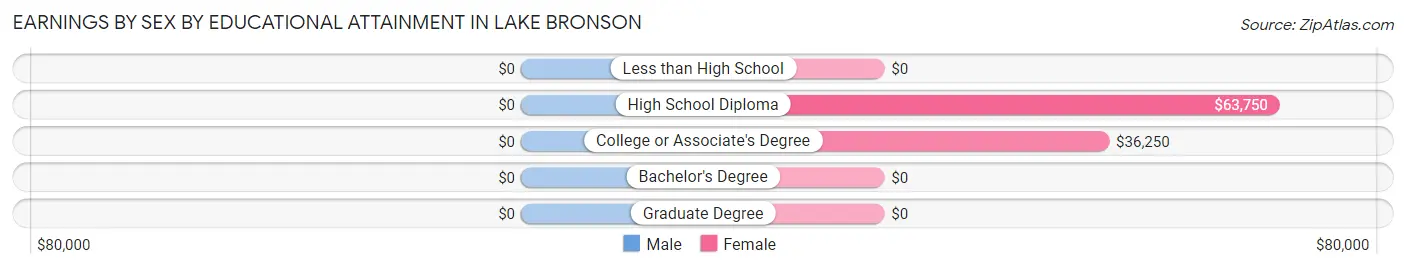
Earnings by Sex by Educational Attainment in Lake Bronson
| Educational Attainment | Male Income | Female Income |
| Less than High School | - | - |
| High School Diploma | - | - |
| College or Associate's Degree | - | - |
| Bachelor's Degree | - | - |
| Graduate Degree | - | - |
| Total | $32,500 | $37,500 |
Family Income in Lake Bronson
Family Income Brackets in Lake Bronson
According to the Lake Bronson family income data, there are 8 families falling into the $75,000 to $99,999 income range, which is the most common income bracket and makes up 42.1% of all families.
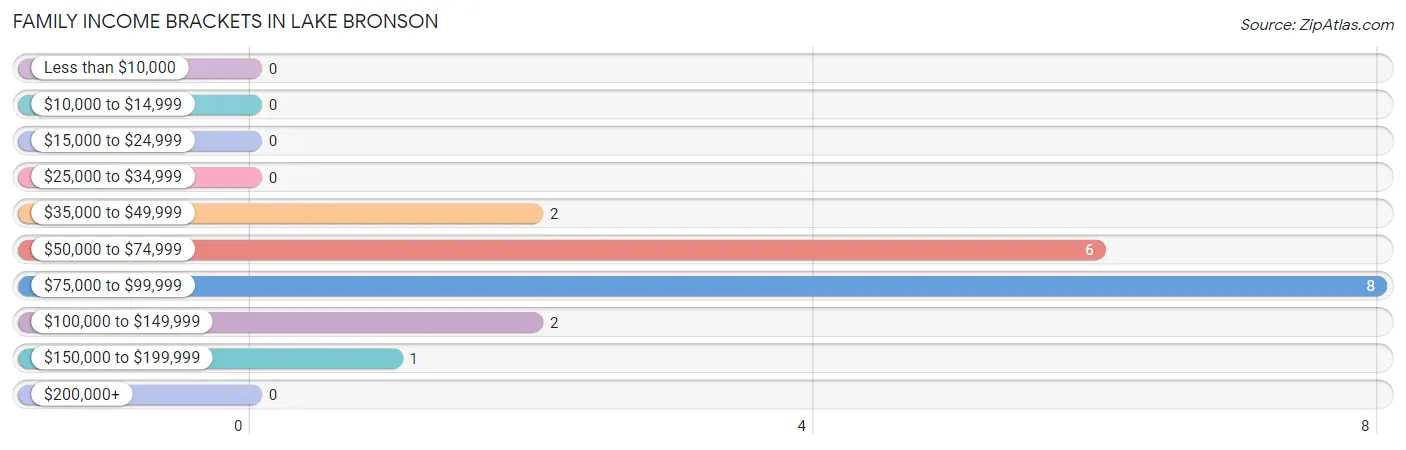
| Income Bracket | # Families | % Families |
| Less than $10,000 | 0 | 0.0% |
| $10,000 to $14,999 | 0 | 0.0% |
| $15,000 to $24,999 | 0 | 0.0% |
| $25,000 to $34,999 | 0 | 0.0% |
| $35,000 to $49,999 | 2 | 10.5% |
| $50,000 to $74,999 | 6 | 31.6% |
| $75,000 to $99,999 | 8 | 42.1% |
| $100,000 to $149,999 | 2 | 10.5% |
| $150,000 to $199,999 | 1 | 5.3% |
| $200,000+ | 0 | 0.0% |
Family Income by Famaliy Size in Lake Bronson
2-person families (14 | 73.7%) account for the highest median family income in Lake Bronson with $78,750 per family, while 2-person families (14 | 73.7%) have the highest median income of $39,375 per family member.
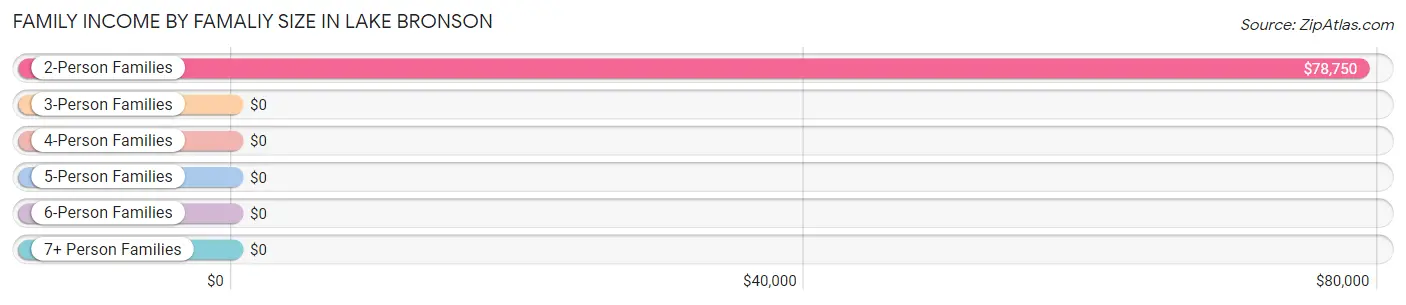
| Income Bracket | # Families | Median Income |
| 2-Person Families | 14 (73.7%) | $78,750 |
| 3-Person Families | 4 (21.0%) | $0 |
| 4-Person Families | 1 (5.3%) | $0 |
| 5-Person Families | 0 (0.0%) | $0 |
| 6-Person Families | 0 (0.0%) | $0 |
| 7+ Person Families | 0 (0.0%) | $0 |
| Total | 19 (100.0%) | $77,813 |
Family Income by Number of Earners in Lake Bronson
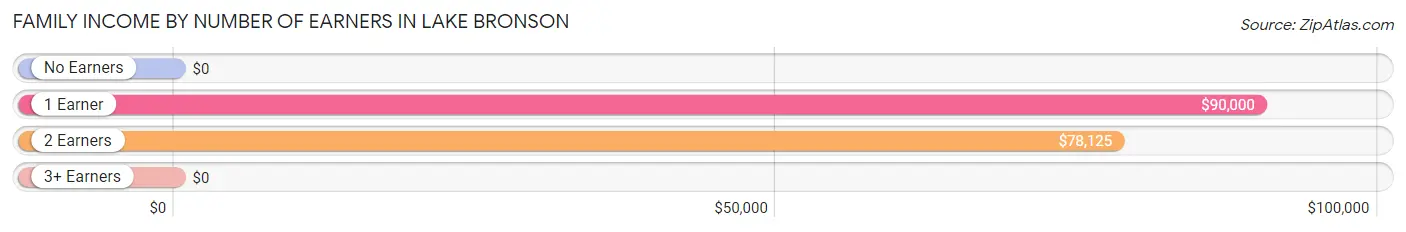
| Number of Earners | # Families | Median Income |
| No Earners | 1 (5.3%) | $0 |
| 1 Earner | 4 (21.0%) | $90,000 |
| 2 Earners | 12 (63.2%) | $78,125 |
| 3+ Earners | 2 (10.5%) | $0 |
| Total | 19 (100.0%) | $77,813 |
Household Income in Lake Bronson
Household Income Brackets in Lake Bronson
With 32 households falling in the category, the $50,000 to $74,999 income range is the most frequent in Lake Bronson, accounting for 29.1% of all households.
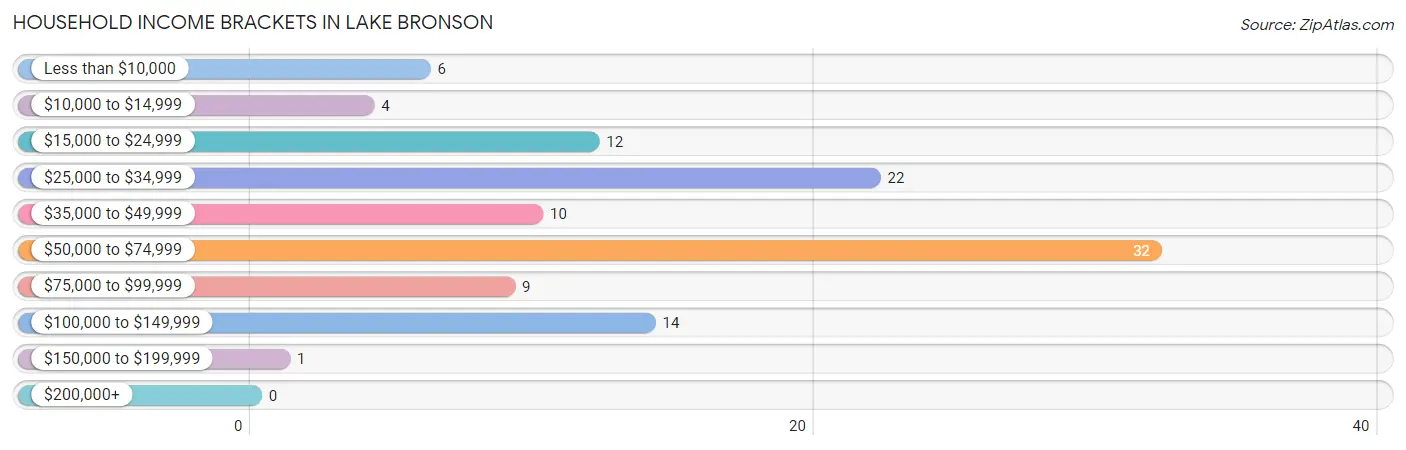
| Income Bracket | # Households | % Households |
| Less than $10,000 | 6 | 5.5% |
| $10,000 to $14,999 | 4 | 3.6% |
| $15,000 to $24,999 | 12 | 10.9% |
| $25,000 to $34,999 | 22 | 20.0% |
| $35,000 to $49,999 | 10 | 9.1% |
| $50,000 to $74,999 | 32 | 29.1% |
| $75,000 to $99,999 | 9 | 8.2% |
| $100,000 to $149,999 | 14 | 12.7% |
| $150,000 to $199,999 | 1 | 0.9% |
| $200,000+ | 0 | 0.0% |
Household Income by Householder Age in Lake Bronson
The median household income in Lake Bronson is $52,614, with the highest median household income of $74,375 found in the 45 to 64 years age bracket for the primary householder. A total of 23 households (20.9%) fall into this category. Meanwhile, the 65+ years age bracket for the primary householder has the lowest median household income of $42,750, with 37 households (33.6%) in this group.
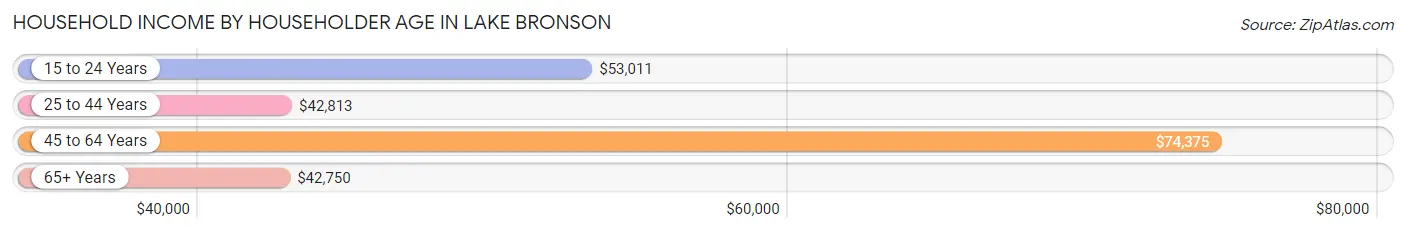
| Income Bracket | # Households | Median Income |
| 15 to 24 Years | 35 (31.8%) | $53,011 |
| 25 to 44 Years | 15 (13.6%) | $42,813 |
| 45 to 64 Years | 23 (20.9%) | $74,375 |
| 65+ Years | 37 (33.6%) | $42,750 |
| Total | 110 (100.0%) | $52,614 |
Poverty in Lake Bronson
Income Below Poverty by Sex and Age in Lake Bronson
With 6.9% poverty level for males and 8.7% for females among the residents of Lake Bronson, 65 to 74 year old males and 45 to 54 year old females are the most vulnerable to poverty, with 6 males (66.7%) and 2 females (22.2%) in their respective age groups living below the poverty level.
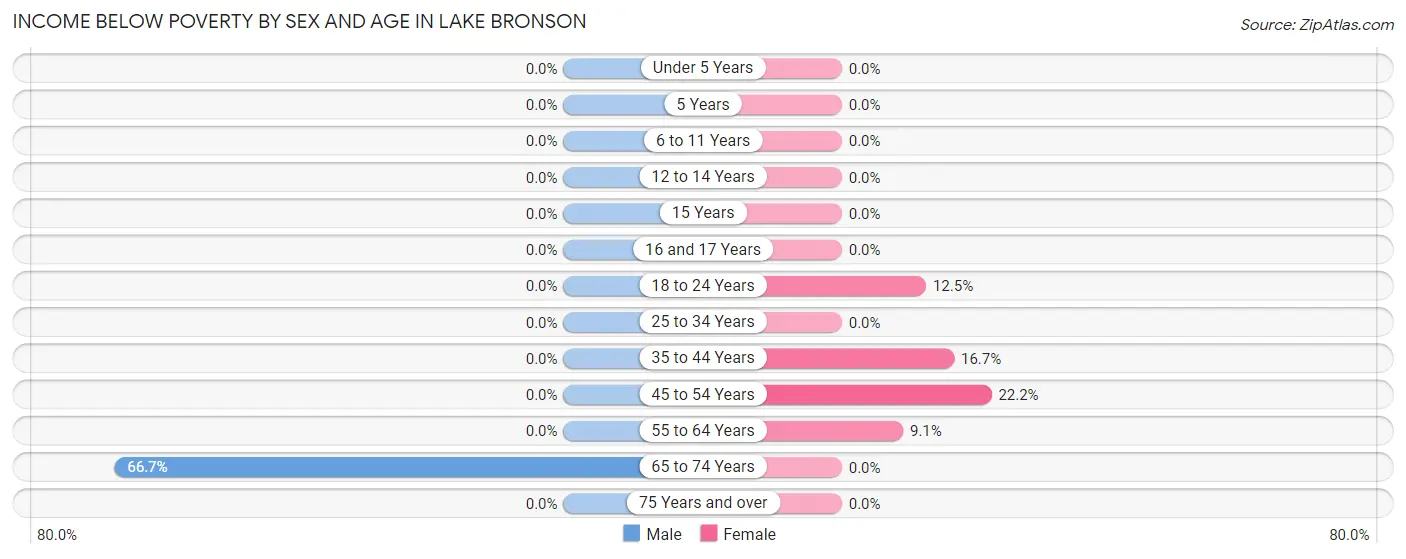
| Age Bracket | Male | Female |
| Under 5 Years | 0 (0.0%) | 0 (0.0%) |
| 5 Years | 0 (0.0%) | 0 (0.0%) |
| 6 to 11 Years | 0 (0.0%) | 0 (0.0%) |
| 12 to 14 Years | 0 (0.0%) | 0 (0.0%) |
| 15 Years | 0 (0.0%) | 0 (0.0%) |
| 16 and 17 Years | 0 (0.0%) | 0 (0.0%) |
| 18 to 24 Years | 0 (0.0%) | 3 (12.5%) |
| 25 to 34 Years | 0 (0.0%) | 0 (0.0%) |
| 35 to 44 Years | 0 (0.0%) | 1 (16.7%) |
| 45 to 54 Years | 0 (0.0%) | 2 (22.2%) |
| 55 to 64 Years | 0 (0.0%) | 1 (9.1%) |
| 65 to 74 Years | 6 (66.7%) | 0 (0.0%) |
| 75 Years and over | 0 (0.0%) | 0 (0.0%) |
| Total | 6 (6.9%) | 7 (8.7%) |
Income Above Poverty by Sex and Age in Lake Bronson
According to the poverty statistics in Lake Bronson, males aged 6 to 11 years and females aged 6 to 11 years are the age groups that are most secure financially, with 100.0% of males and 100.0% of females in these age groups living above the poverty line.
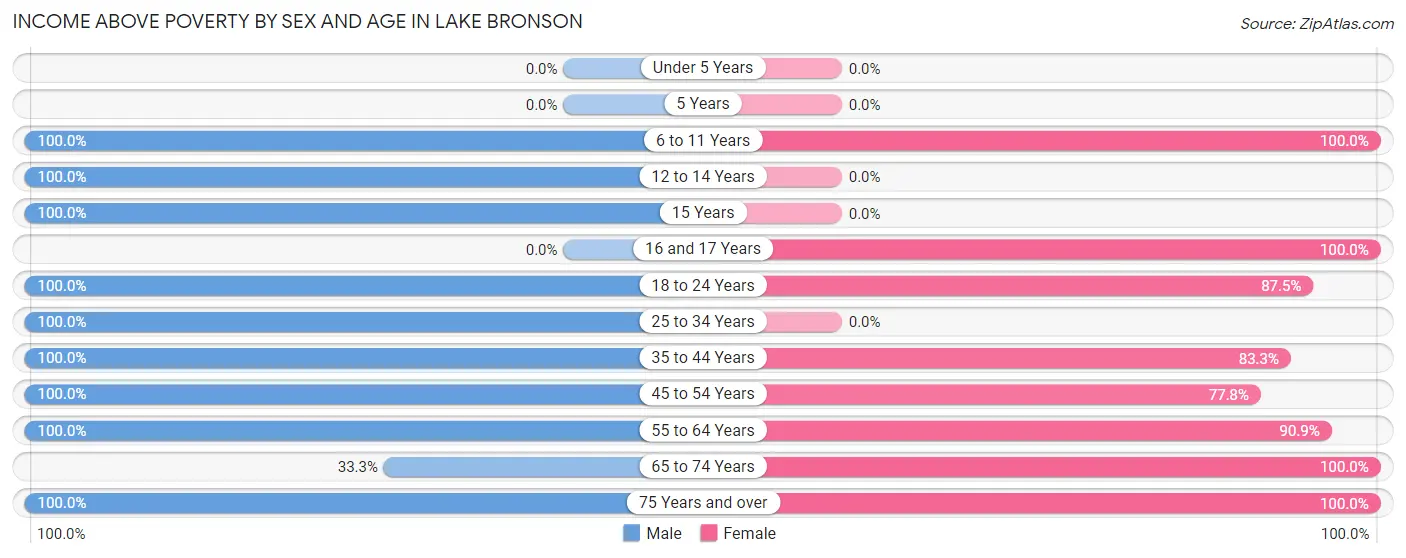
| Age Bracket | Male | Female |
| Under 5 Years | 0 (0.0%) | 0 (0.0%) |
| 5 Years | 0 (0.0%) | 0 (0.0%) |
| 6 to 11 Years | 2 (100.0%) | 1 (100.0%) |
| 12 to 14 Years | 1 (100.0%) | 0 (0.0%) |
| 15 Years | 1 (100.0%) | 0 (0.0%) |
| 16 and 17 Years | 0 (0.0%) | 1 (100.0%) |
| 18 to 24 Years | 34 (100.0%) | 21 (87.5%) |
| 25 to 34 Years | 10 (100.0%) | 0 (0.0%) |
| 35 to 44 Years | 3 (100.0%) | 5 (83.3%) |
| 45 to 54 Years | 4 (100.0%) | 7 (77.8%) |
| 55 to 64 Years | 15 (100.0%) | 10 (90.9%) |
| 65 to 74 Years | 3 (33.3%) | 11 (100.0%) |
| 75 Years and over | 8 (100.0%) | 17 (100.0%) |
| Total | 81 (93.1%) | 73 (91.2%) |
Income Below Poverty Among Married-Couple Families in Lake Bronson
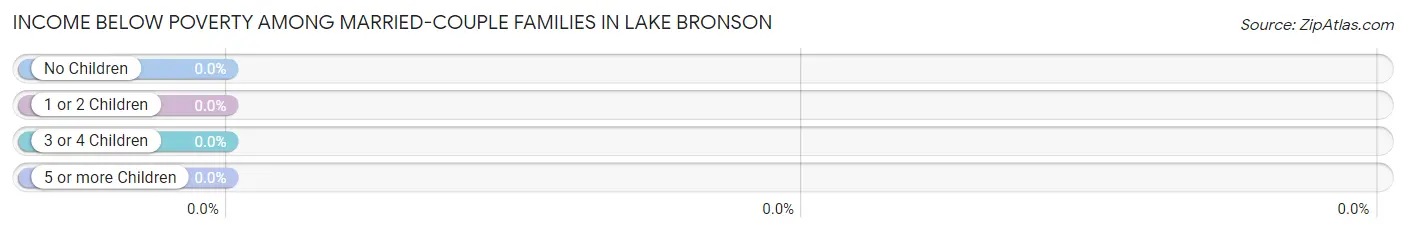
| Children | Above Poverty | Below Poverty |
| No Children | 13 (100.0%) | 0 (0.0%) |
| 1 or 2 Children | 1 (100.0%) | 0 (0.0%) |
| 3 or 4 Children | 0 (0.0%) | 0 (0.0%) |
| 5 or more Children | 0 (0.0%) | 0 (0.0%) |
| Total | 14 (100.0%) | 0 (0.0%) |
Income Below Poverty Among Single-Parent Households in Lake Bronson
| Children | Single Father | Single Mother |
| No Children | 0 (0.0%) | 0 (0.0%) |
| 1 or 2 Children | 0 (0.0%) | 0 (0.0%) |
| 3 or 4 Children | 0 (0.0%) | 0 (0.0%) |
| 5 or more Children | 0 (0.0%) | 0 (0.0%) |
| Total | 0 (0.0%) | 0 (0.0%) |
Income Below Poverty Among Married-Couple vs Single-Parent Households in Lake Bronson
| Children | Married-Couple Families | Single-Parent Households |
| No Children | 0 (0.0%) | 0 (0.0%) |
| 1 or 2 Children | 0 (0.0%) | 0 (0.0%) |
| 3 or 4 Children | 0 (0.0%) | 0 (0.0%) |
| 5 or more Children | 0 (0.0%) | 0 (0.0%) |
| Total | 0 (0.0%) | 0 (0.0%) |
Race in Lake Bronson
The most populous races in Lake Bronson are White / Caucasian (153 | 90.0%), Two or more Races (16 | 9.4%), and Black / African American (1 | 0.6%).
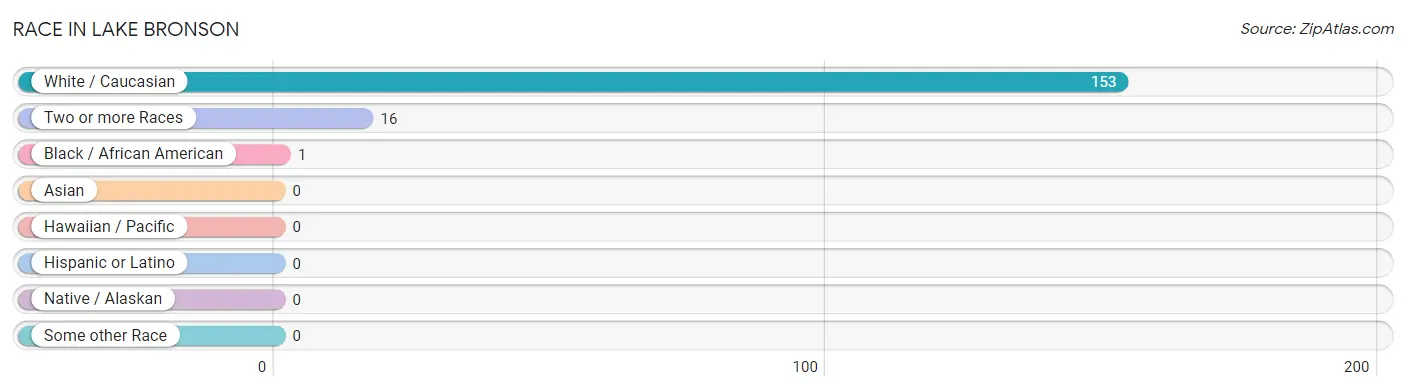
| Race | # Population | % Population |
| Asian | 0 | 0.0% |
| Black / African American | 1 | 0.6% |
| Hawaiian / Pacific | 0 | 0.0% |
| Hispanic or Latino | 0 | 0.0% |
| Native / Alaskan | 0 | 0.0% |
| White / Caucasian | 153 | 90.0% |
| Two or more Races | 16 | 9.4% |
| Some other Race | 0 | 0.0% |
| Total | 170 | 100.0% |
Ancestry in Lake Bronson
The most populous ancestries reported in Lake Bronson are Norwegian (54 | 31.8%), German (47 | 27.7%), Swedish (36 | 21.2%), French (21 | 12.3%), and Irish (10 | 5.9%), together accounting for 98.8% of all Lake Bronson residents.
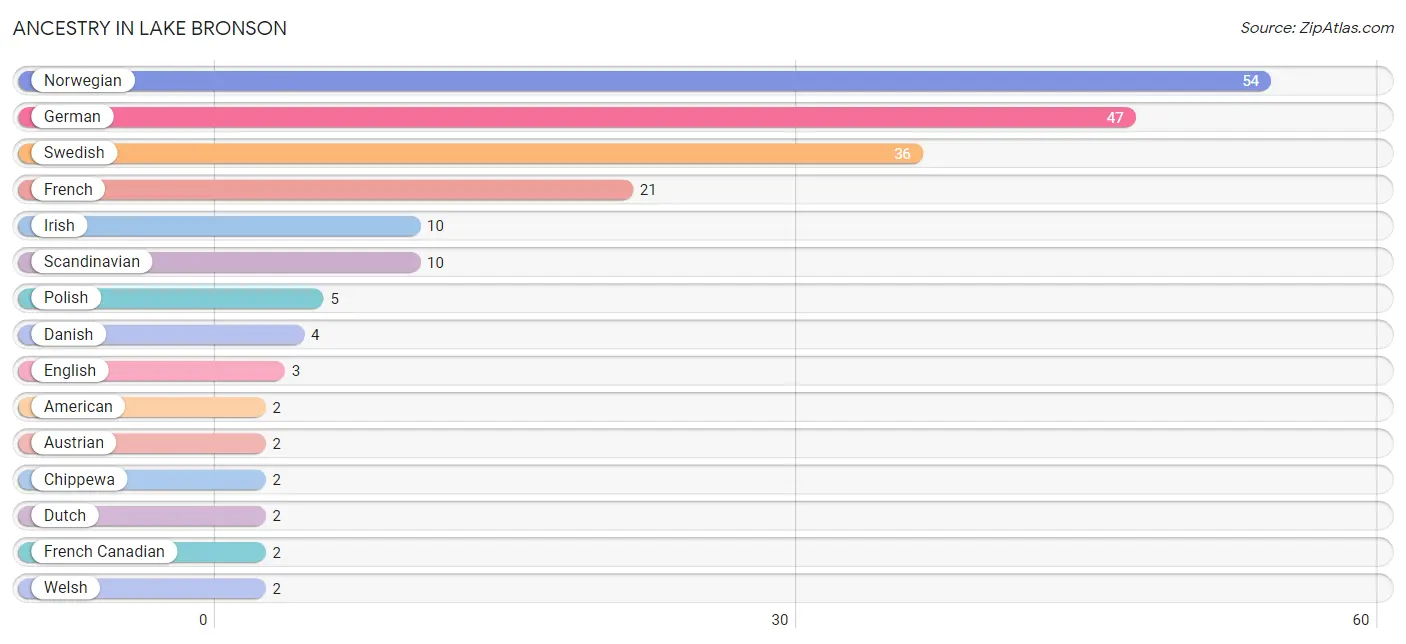
| Ancestry | # Population | % Population |
| American | 2 | 1.2% |
| Austrian | 2 | 1.2% |
| Chippewa | 2 | 1.2% |
| Danish | 4 | 2.4% |
| Dutch | 2 | 1.2% |
| English | 3 | 1.8% |
| Finnish | 1 | 0.6% |
| French | 21 | 12.3% |
| French Canadian | 2 | 1.2% |
| German | 47 | 27.7% |
| Irish | 10 | 5.9% |
| Norwegian | 54 | 31.8% |
| Polish | 5 | 2.9% |
| Scandinavian | 10 | 5.9% |
| Scottish | 1 | 0.6% |
| Swedish | 36 | 21.2% |
| Welsh | 2 | 1.2% | View All 17 Rows |
Immigrants in Lake Bronson

| Immigration Origin | # Population | % Population | View All 0 Rows |
Sex and Age in Lake Bronson
Sex and Age in Lake Bronson
The most populous age groups in Lake Bronson are 20 to 24 Years (33 | 37.5%) for men and 20 to 24 Years (25 | 30.5%) for women.
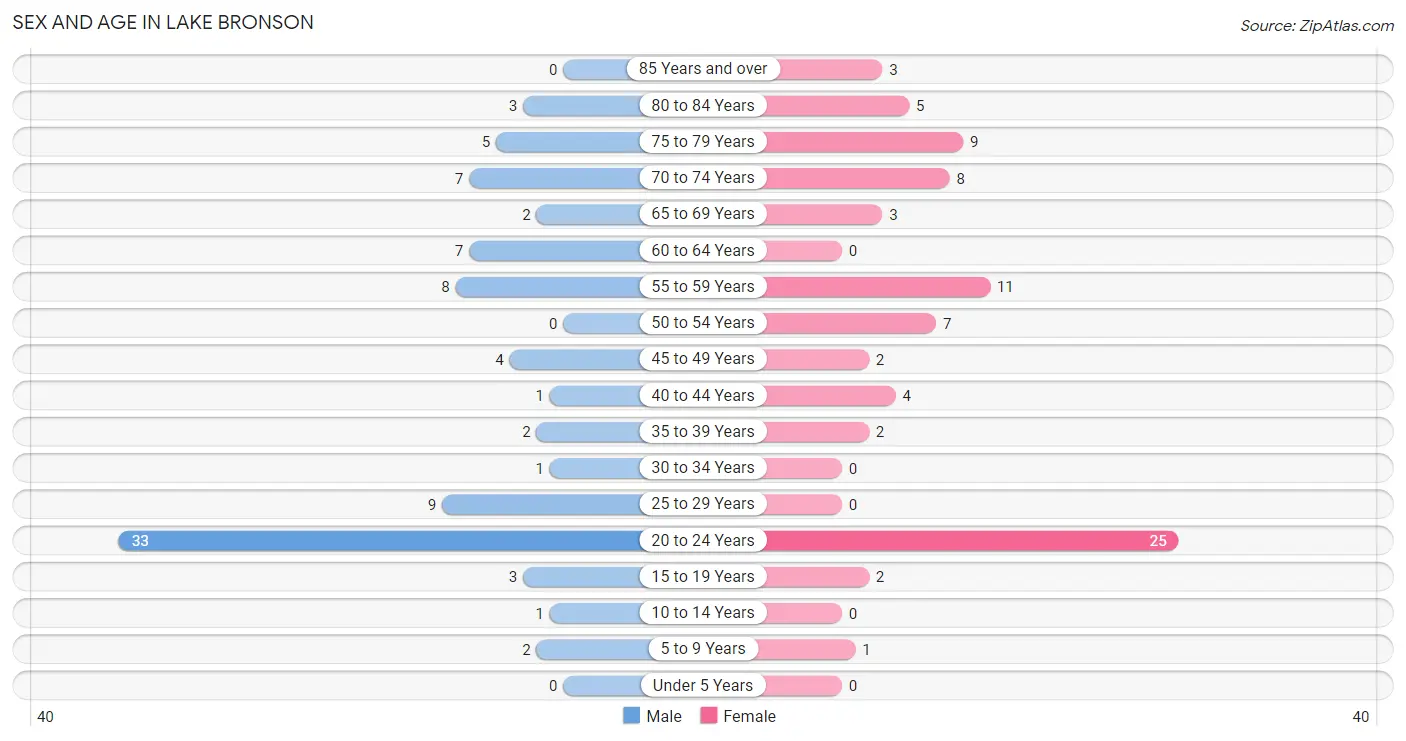
| Age Bracket | Male | Female |
| Under 5 Years | 0 (0.0%) | 0 (0.0%) |
| 5 to 9 Years | 2 (2.3%) | 1 (1.2%) |
| 10 to 14 Years | 1 (1.1%) | 0 (0.0%) |
| 15 to 19 Years | 3 (3.4%) | 2 (2.4%) |
| 20 to 24 Years | 33 (37.5%) | 25 (30.5%) |
| 25 to 29 Years | 9 (10.2%) | 0 (0.0%) |
| 30 to 34 Years | 1 (1.1%) | 0 (0.0%) |
| 35 to 39 Years | 2 (2.3%) | 2 (2.4%) |
| 40 to 44 Years | 1 (1.1%) | 4 (4.9%) |
| 45 to 49 Years | 4 (4.5%) | 2 (2.4%) |
| 50 to 54 Years | 0 (0.0%) | 7 (8.5%) |
| 55 to 59 Years | 8 (9.1%) | 11 (13.4%) |
| 60 to 64 Years | 7 (8.0%) | 0 (0.0%) |
| 65 to 69 Years | 2 (2.3%) | 3 (3.7%) |
| 70 to 74 Years | 7 (8.0%) | 8 (9.8%) |
| 75 to 79 Years | 5 (5.7%) | 9 (11.0%) |
| 80 to 84 Years | 3 (3.4%) | 5 (6.1%) |
| 85 Years and over | 0 (0.0%) | 3 (3.7%) |
| Total | 88 (100.0%) | 82 (100.0%) |
Families and Households in Lake Bronson
Median Family Size in Lake Bronson
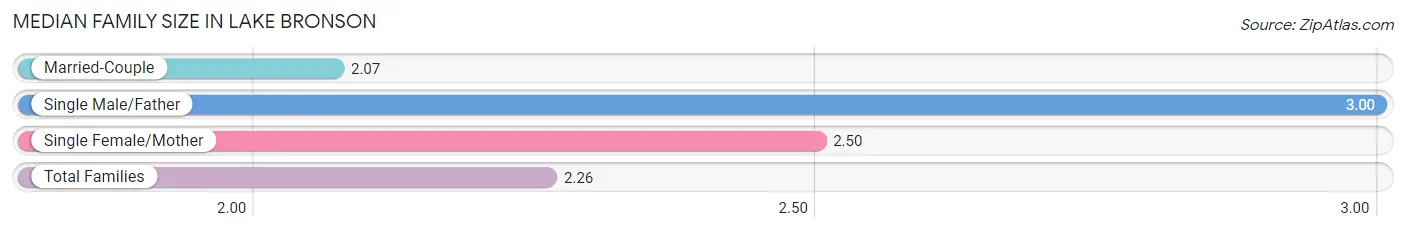
The median family size in Lake Bronson is 2.26 persons per family, with single male/father families (3 | 15.8%) accounting for the largest median family size of 3 persons per family. On the other hand, married-couple families (14 | 73.7%) represent the smallest median family size with 2.07 persons per family.
| Family Type | # Families | Family Size |
| Married-Couple | 14 (73.7%) | 2.07 |
| Single Male/Father | 3 (15.8%) | 3.00 |
| Single Female/Mother | 2 (10.5%) | 2.50 |
| Total Families | 19 (100.0%) | 2.26 |
Median Household Size in Lake Bronson
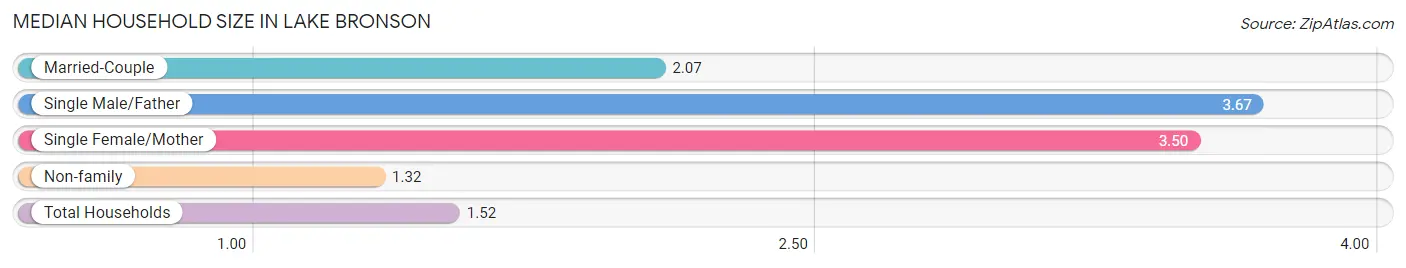
The median household size in Lake Bronson is 1.52 persons per household, with single male/father households (3 | 2.7%) accounting for the largest median household size of 3.67 persons per household. non-family households (91 | 82.7%) represent the smallest median household size with 1.32 persons per household.
| Household Type | # Households | Household Size |
| Married-Couple | 14 (12.7%) | 2.07 |
| Single Male/Father | 3 (2.7%) | 3.67 |
| Single Female/Mother | 2 (1.8%) | 3.50 |
| Non-family | 91 (82.7%) | 1.32 |
| Total Households | 110 (100.0%) | 1.52 |
Household Size by Marriage Status in Lake Bronson
Out of a total of 110 households in Lake Bronson, 19 (17.3%) are family households, while 91 (82.7%) are nonfamily households. The most numerous type of family households are 2-person households, comprising 13, and the most common type of nonfamily households are 1-person households, comprising 58.
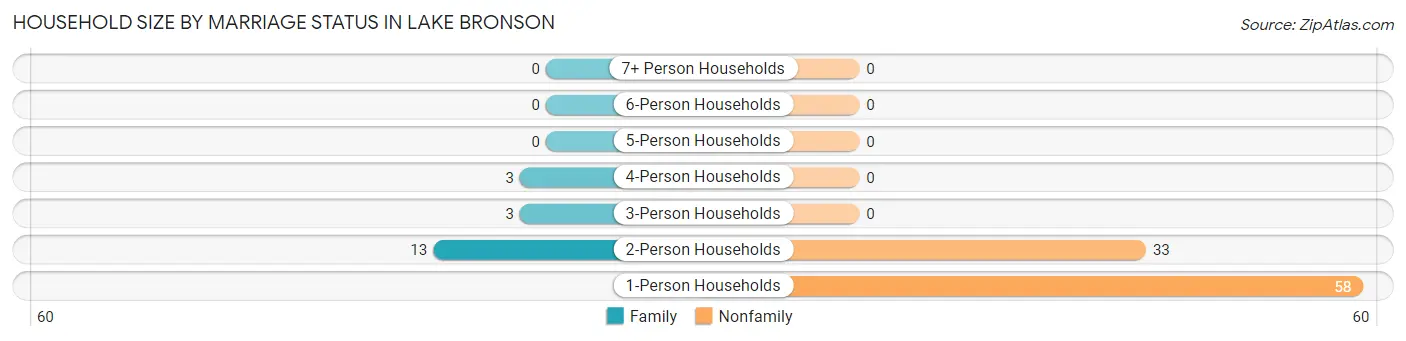
| Household Size | Family Households | Nonfamily Households |
| 1-Person Households | - | 58 (52.7%) |
| 2-Person Households | 13 (11.8%) | 33 (30.0%) |
| 3-Person Households | 3 (2.7%) | 0 (0.0%) |
| 4-Person Households | 3 (2.7%) | 0 (0.0%) |
| 5-Person Households | 0 (0.0%) | 0 (0.0%) |
| 6-Person Households | 0 (0.0%) | 0 (0.0%) |
| 7+ Person Households | 0 (0.0%) | 0 (0.0%) |
| Total | 19 (17.3%) | 91 (82.7%) |
Female Fertility in Lake Bronson
Fertility by Age in Lake Bronson
| Age Bracket | Women with Births | Births / 1,000 Women |
| 15 to 19 years | 0 (0.0%) | 0.0 |
| 20 to 34 years | 0 (0.0%) | 0.0 |
| 35 to 50 years | 0 (0.0%) | 0.0 |
| Total | 0 (0.0%) | 0.0 |
Fertility by Age by Marriage Status in Lake Bronson
| Age Bracket | Married | Unmarried |
| 15 to 19 years | 0 (0.0%) | 0 (0.0%) |
| 20 to 34 years | 0 (0.0%) | 0 (0.0%) |
| 35 to 50 years | 0 (0.0%) | 0 (0.0%) |
| Total | 0 (0.0%) | 0 (0.0%) |
Fertility by Education in Lake Bronson
| Educational Attainment | Women with Births | Births / 1,000 Women |
| Less than High School | 0 (0.0%) | 0.0 |
| High School Diploma | 0 (0.0%) | 0.0 |
| College or Associate's Degree | 0 (0.0%) | 0.0 |
| Bachelor's Degree | 0 (0.0%) | 0.0 |
| Graduate Degree | 0 (0.0%) | 0.0 |
| Total | 0 (0.0%) | 0.0 |
Fertility by Education by Marriage Status in Lake Bronson
| Educational Attainment | Married | Unmarried |
| Less than High School | 0 (0.0%) | 0 (0.0%) |
| High School Diploma | 0 (0.0%) | 0 (0.0%) |
| College or Associate's Degree | 0 (0.0%) | 0 (0.0%) |
| Bachelor's Degree | 0 (0.0%) | 0 (0.0%) |
| Graduate Degree | 0 (0.0%) | 0 (0.0%) |
| Total | 0 (0.0%) | 0 (0.0%) |
Employment Characteristics in Lake Bronson
Employment by Class of Employer in Lake Bronson
Among the 102 employed individuals in Lake Bronson, private company employees (82 | 80.4%), self-employed (incorporated) (6 | 5.9%), and self-employed (not incorporated) (6 | 5.9%) make up the most common classes of employment.
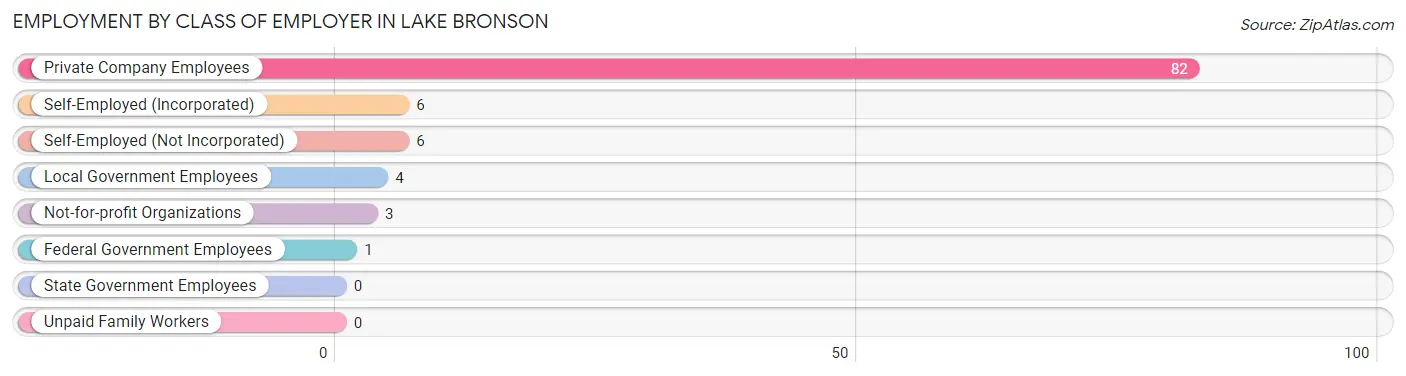
| Employer Class | # Employees | % Employees |
| Private Company Employees | 82 | 80.4% |
| Self-Employed (Incorporated) | 6 | 5.9% |
| Self-Employed (Not Incorporated) | 6 | 5.9% |
| Not-for-profit Organizations | 3 | 2.9% |
| Local Government Employees | 4 | 3.9% |
| State Government Employees | 0 | 0.0% |
| Federal Government Employees | 1 | 1.0% |
| Unpaid Family Workers | 0 | 0.0% |
| Total | 102 | 100.0% |
Employment Status by Age in Lake Bronson
According to the labor force statistics for Lake Bronson, out of the total population over 16 years of age (165), 80.0% or 132 individuals are in the labor force, with 22.7% or 30 of them unemployed. The age group with the highest labor force participation rate is 25 to 29 years, with 100.0% or 9 individuals in the labor force. Within the labor force, the 60 to 64 years age range has the highest percentage of unemployed individuals, with 71.4% or 5 of them being unemployed.
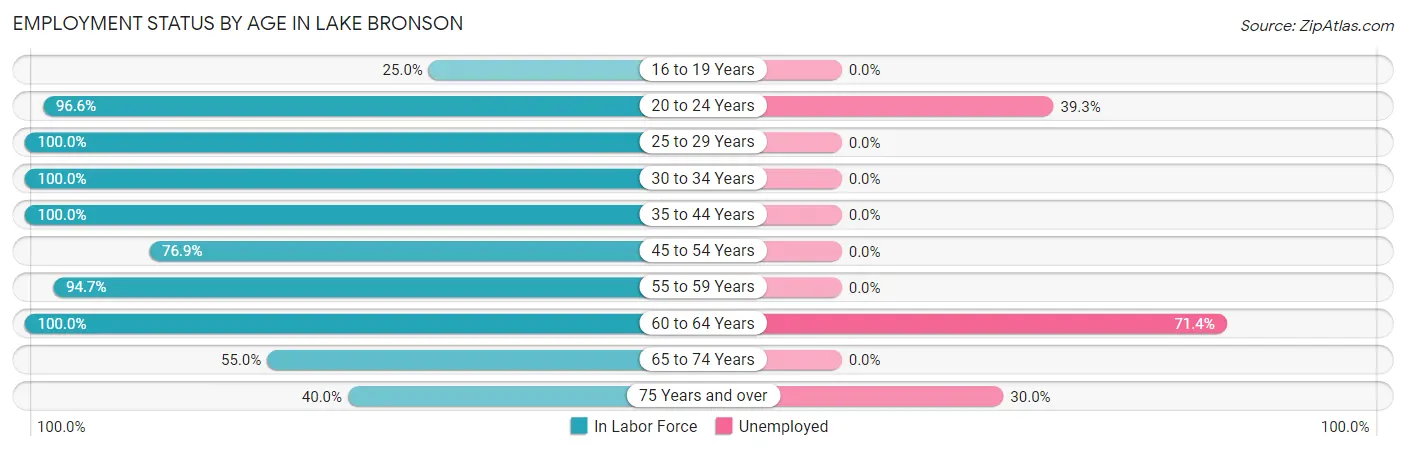
| Age Bracket | In Labor Force | Unemployed |
| 16 to 19 Years | 1 (25.0%) | 0 (0.0%) |
| 20 to 24 Years | 56 (96.6%) | 22 (39.3%) |
| 25 to 29 Years | 9 (100.0%) | 0 (0.0%) |
| 30 to 34 Years | 1 (100.0%) | 0 (0.0%) |
| 35 to 44 Years | 9 (100.0%) | 0 (0.0%) |
| 45 to 54 Years | 10 (76.9%) | 0 (0.0%) |
| 55 to 59 Years | 18 (94.7%) | 0 (0.0%) |
| 60 to 64 Years | 7 (100.0%) | 5 (71.4%) |
| 65 to 74 Years | 11 (55.0%) | 0 (0.0%) |
| 75 Years and over | 10 (40.0%) | 3 (30.0%) |
| Total | 132 (80.0%) | 30 (22.7%) |
Employment Status by Educational Attainment in Lake Bronson
According to labor force statistics for Lake Bronson, 93.1% of individuals (54) out of the total population between 25 and 64 years of age (58) are in the labor force, with 9.3% or 5 of them being unemployed. The group with the highest labor force participation rate are those with the educational attainment of bachelor's degree or higher, with 100.0% or 1 individuals in the labor force. Within the labor force, individuals with less than high school education have the highest percentage of unemployment, with 45.5% or 5 of them being unemployed.
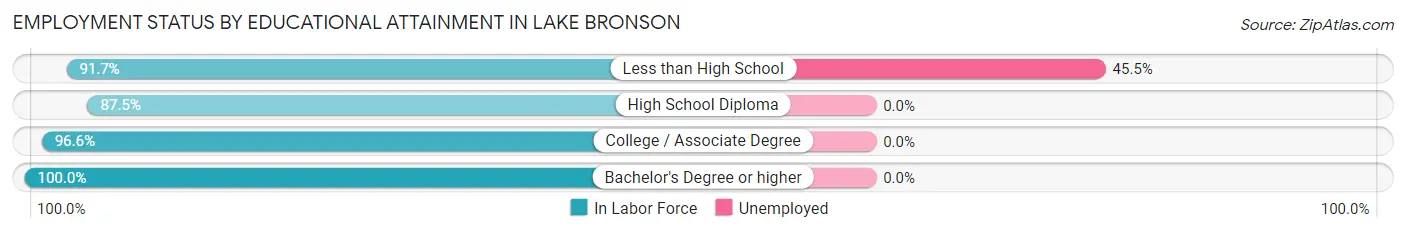
| Educational Attainment | In Labor Force | Unemployed |
| Less than High School | 11 (91.7%) | 5 (45.5%) |
| High School Diploma | 14 (87.5%) | 0 (0.0%) |
| College / Associate Degree | 28 (96.6%) | 0 (0.0%) |
| Bachelor's Degree or higher | 1 (100.0%) | 0 (0.0%) |
| Total | 54 (93.1%) | 5 (9.3%) |
Employment Occupations by Sex in Lake Bronson
Management, Business, Science and Arts Occupations
The most common Management, Business, Science and Arts occupations in Lake Bronson are Management (7 | 6.9%), Community & Social Service (3 | 2.9%), Education Instruction & Library (3 | 2.9%), Health Diagnosing & Treating (2 | 2.0%), and Business & Financial (1 | 1.0%).
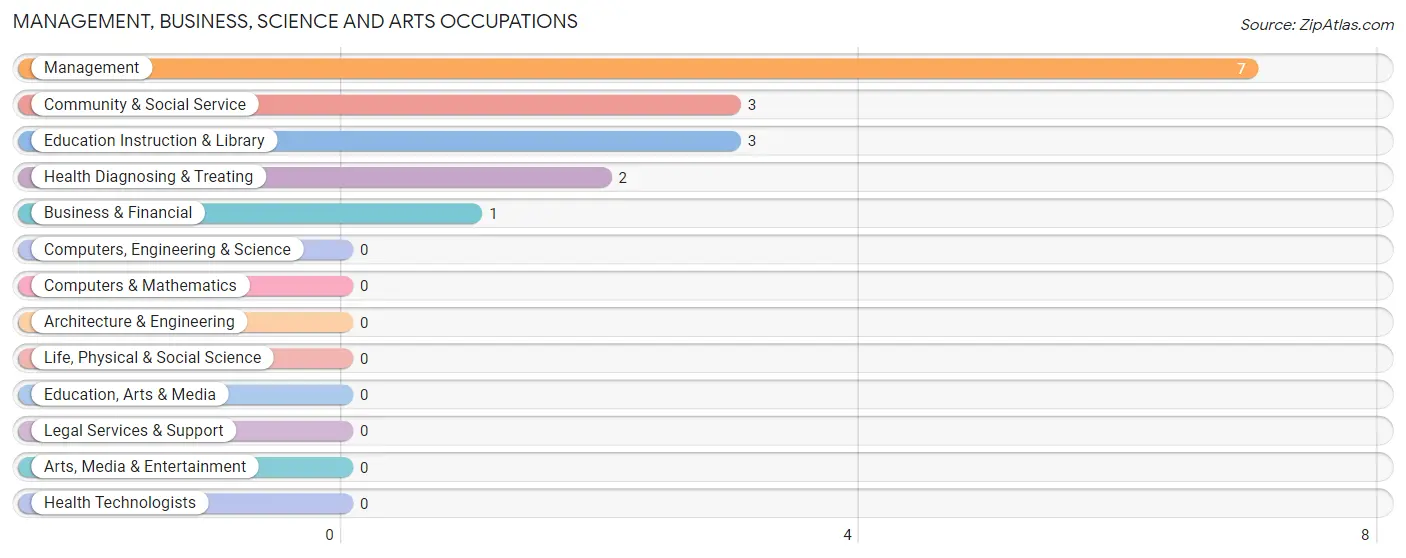
Management, Business, Science and Arts Occupations by Sex
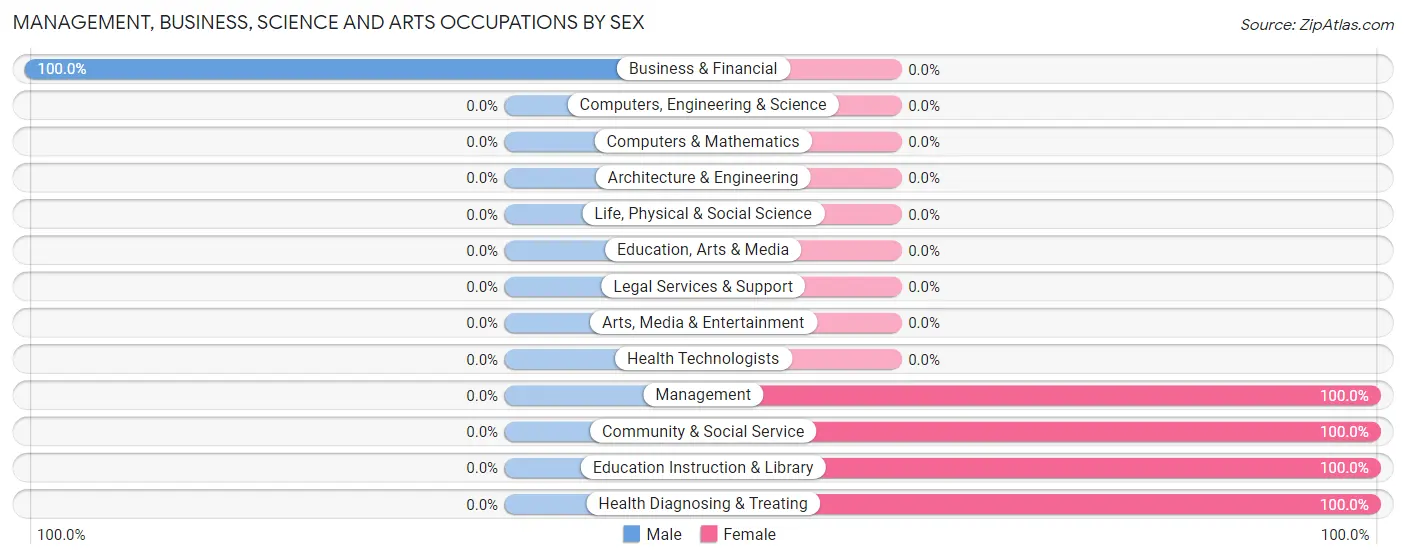
| Occupation | Male | Female |
| Management | 0 (0.0%) | 7 (100.0%) |
| Business & Financial | 1 (100.0%) | 0 (0.0%) |
| Computers, Engineering & Science | 0 (0.0%) | 0 (0.0%) |
| Computers & Mathematics | 0 (0.0%) | 0 (0.0%) |
| Architecture & Engineering | 0 (0.0%) | 0 (0.0%) |
| Life, Physical & Social Science | 0 (0.0%) | 0 (0.0%) |
| Community & Social Service | 0 (0.0%) | 3 (100.0%) |
| Education, Arts & Media | 0 (0.0%) | 0 (0.0%) |
| Legal Services & Support | 0 (0.0%) | 0 (0.0%) |
| Education Instruction & Library | 0 (0.0%) | 3 (100.0%) |
| Arts, Media & Entertainment | 0 (0.0%) | 0 (0.0%) |
| Health Diagnosing & Treating | 0 (0.0%) | 2 (100.0%) |
| Health Technologists | 0 (0.0%) | 0 (0.0%) |
| Total (Category) | 1 (7.7%) | 12 (92.3%) |
| Total (Overall) | 45 (44.1%) | 57 (55.9%) |
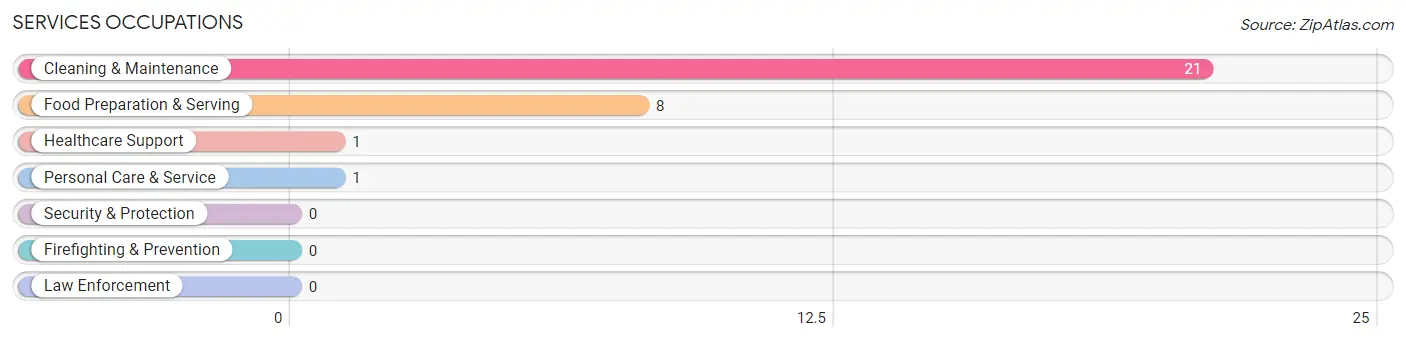
Services Occupations
The most common Services occupations in Lake Bronson are Cleaning & Maintenance (21 | 20.6%), Food Preparation & Serving (8 | 7.8%), Healthcare Support (1 | 1.0%), and Personal Care & Service (1 | 1.0%).
Services Occupations by Sex
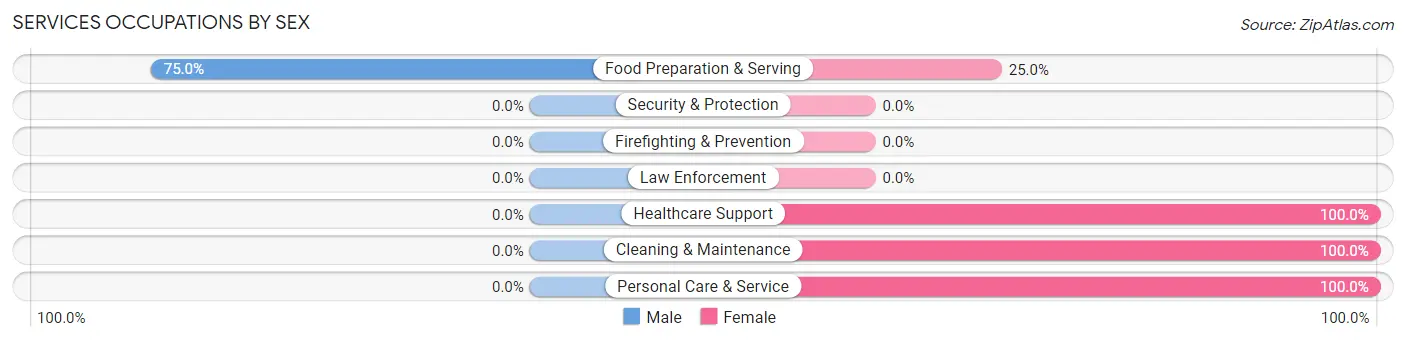
| Occupation | Male | Female |
| Healthcare Support | 0 (0.0%) | 1 (100.0%) |
| Security & Protection | 0 (0.0%) | 0 (0.0%) |
| Firefighting & Prevention | 0 (0.0%) | 0 (0.0%) |
| Law Enforcement | 0 (0.0%) | 0 (0.0%) |
| Food Preparation & Serving | 6 (75.0%) | 2 (25.0%) |
| Cleaning & Maintenance | 0 (0.0%) | 21 (100.0%) |
| Personal Care & Service | 0 (0.0%) | 1 (100.0%) |
| Total (Category) | 6 (19.4%) | 25 (80.6%) |
| Total (Overall) | 45 (44.1%) | 57 (55.9%) |
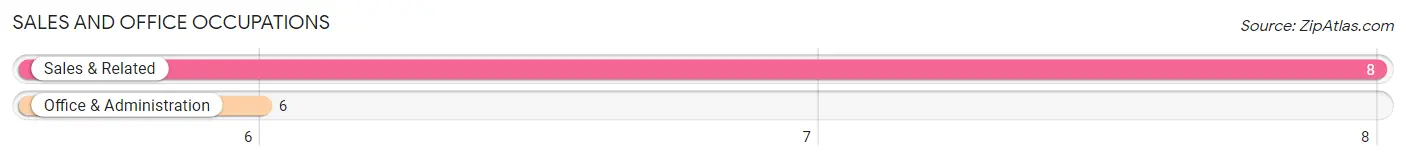
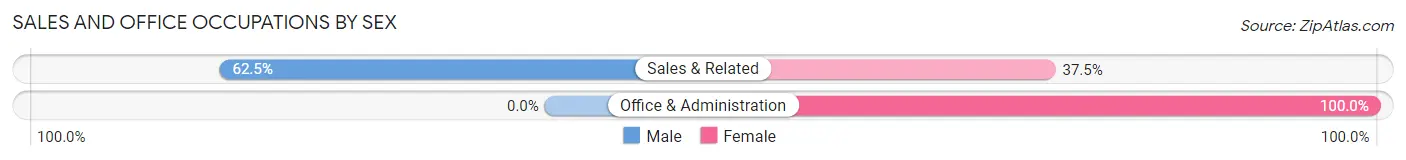
Sales and Office Occupations
The most common Sales and Office occupations in Lake Bronson are Sales & Related (8 | 7.8%), and Office & Administration (6 | 5.9%).
Sales and Office Occupations by Sex
| Occupation | Male | Female |
| Sales & Related | 5 (62.5%) | 3 (37.5%) |
| Office & Administration | 0 (0.0%) | 6 (100.0%) |
| Total (Category) | 5 (35.7%) | 9 (64.3%) |
| Total (Overall) | 45 (44.1%) | 57 (55.9%) |
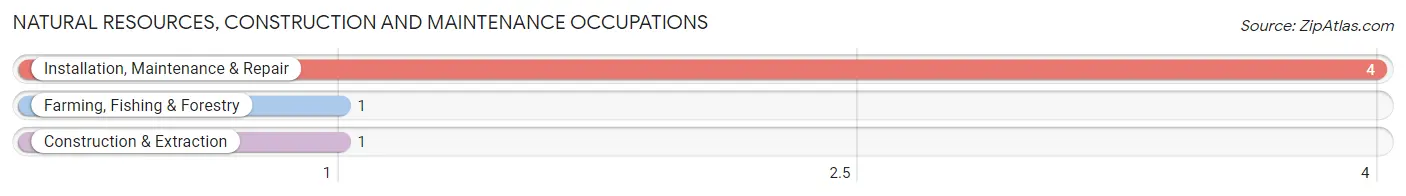
Natural Resources, Construction and Maintenance Occupations
The most common Natural Resources, Construction and Maintenance occupations in Lake Bronson are Installation, Maintenance & Repair (4 | 3.9%), Farming, Fishing & Forestry (1 | 1.0%), and Construction & Extraction (1 | 1.0%).
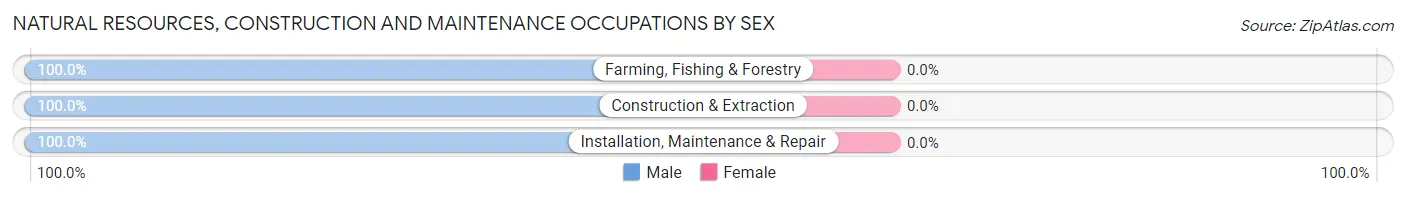
Natural Resources, Construction and Maintenance Occupations by Sex
| Occupation | Male | Female |
| Farming, Fishing & Forestry | 1 (100.0%) | 0 (0.0%) |
| Construction & Extraction | 1 (100.0%) | 0 (0.0%) |
| Installation, Maintenance & Repair | 4 (100.0%) | 0 (0.0%) |
| Total (Category) | 6 (100.0%) | 0 (0.0%) |
| Total (Overall) | 45 (44.1%) | 57 (55.9%) |
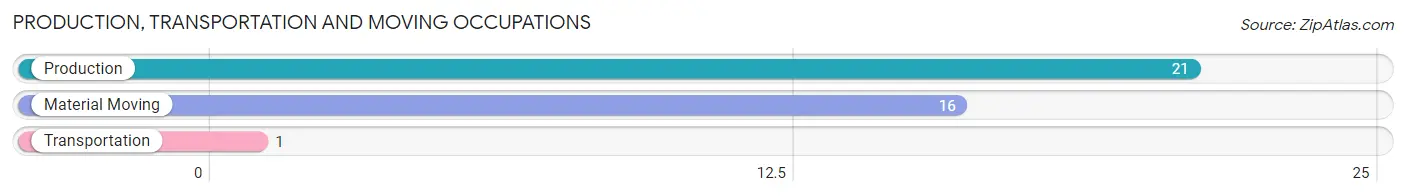
Production, Transportation and Moving Occupations
The most common Production, Transportation and Moving occupations in Lake Bronson are Production (21 | 20.6%), Material Moving (16 | 15.7%), and Transportation (1 | 1.0%).
Production, Transportation and Moving Occupations by Sex
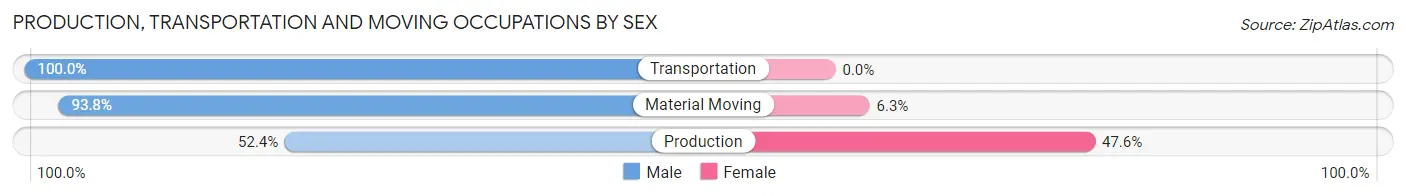
| Occupation | Male | Female |
| Production | 11 (52.4%) | 10 (47.6%) |
| Transportation | 1 (100.0%) | 0 (0.0%) |
| Material Moving | 15 (93.8%) | 1 (6.2%) |
| Total (Category) | 27 (71.1%) | 11 (28.9%) |
| Total (Overall) | 45 (44.1%) | 57 (55.9%) |
Employment Industries by Sex in Lake Bronson
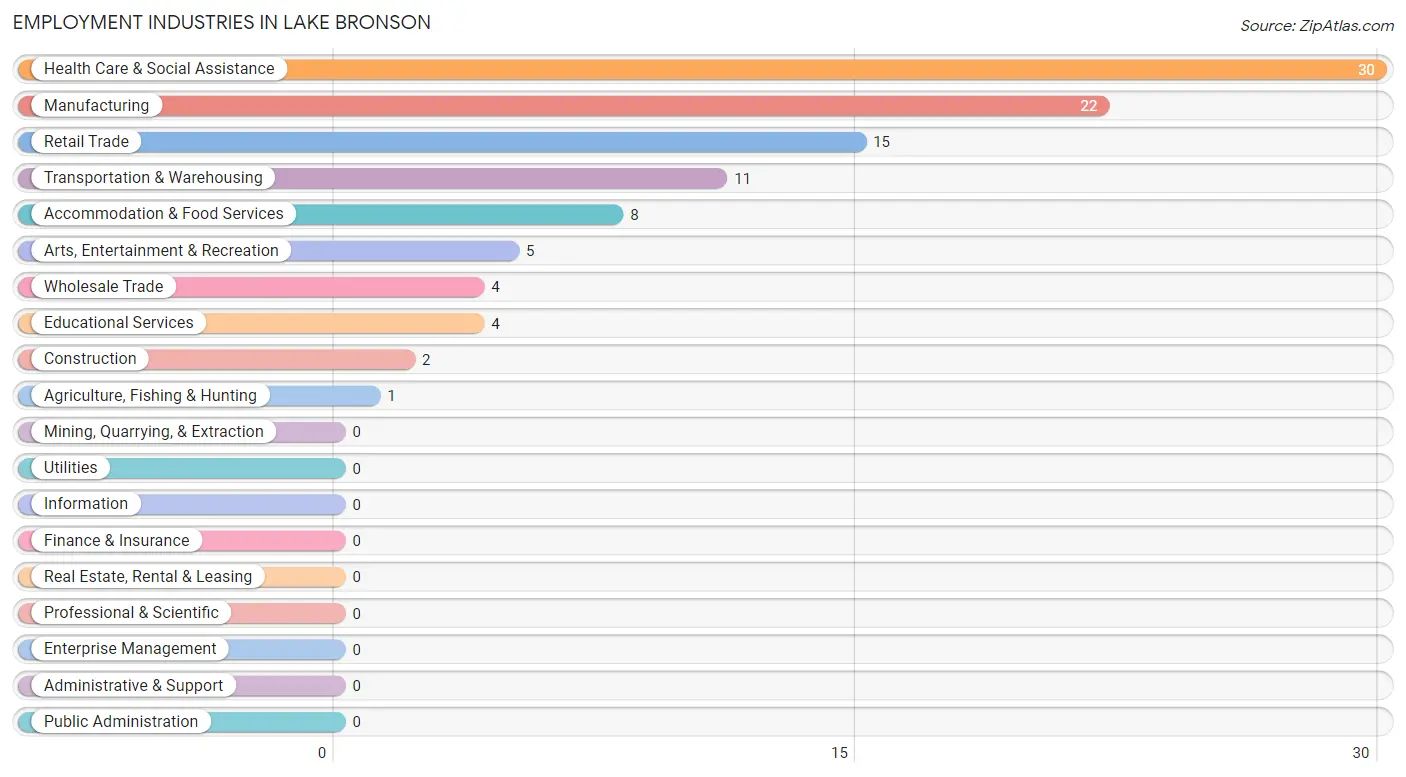
Employment Industries in Lake Bronson
The major employment industries in Lake Bronson include Health Care & Social Assistance (30 | 29.4%), Manufacturing (22 | 21.6%), Retail Trade (15 | 14.7%), Transportation & Warehousing (11 | 10.8%), and Accommodation & Food Services (8 | 7.8%).
Employment Industries by Sex in Lake Bronson
The Lake Bronson industries that see more men than women are Agriculture, Fishing & Hunting (100.0%), Construction (100.0%), and Transportation & Warehousing (90.9%), whereas the industries that tend to have a higher number of women are Educational Services (100.0%), Health Care & Social Assistance (100.0%), and Arts, Entertainment & Recreation (100.0%).
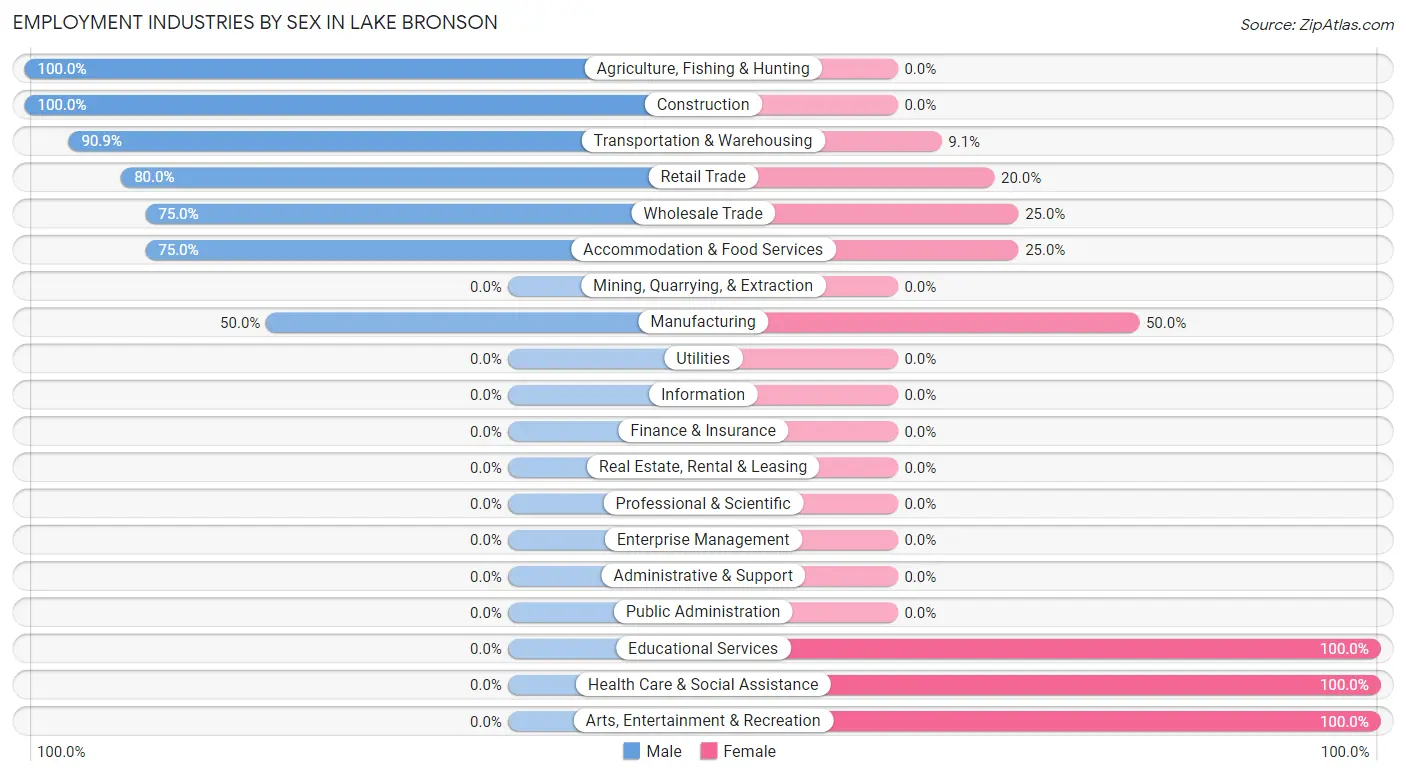
| Industry | Male | Female |
| Agriculture, Fishing & Hunting | 1 (100.0%) | 0 (0.0%) |
| Mining, Quarrying, & Extraction | 0 (0.0%) | 0 (0.0%) |
| Construction | 2 (100.0%) | 0 (0.0%) |
| Manufacturing | 11 (50.0%) | 11 (50.0%) |
| Wholesale Trade | 3 (75.0%) | 1 (25.0%) |
| Retail Trade | 12 (80.0%) | 3 (20.0%) |
| Transportation & Warehousing | 10 (90.9%) | 1 (9.1%) |
| Utilities | 0 (0.0%) | 0 (0.0%) |
| Information | 0 (0.0%) | 0 (0.0%) |
| Finance & Insurance | 0 (0.0%) | 0 (0.0%) |
| Real Estate, Rental & Leasing | 0 (0.0%) | 0 (0.0%) |
| Professional & Scientific | 0 (0.0%) | 0 (0.0%) |
| Enterprise Management | 0 (0.0%) | 0 (0.0%) |
| Administrative & Support | 0 (0.0%) | 0 (0.0%) |
| Educational Services | 0 (0.0%) | 4 (100.0%) |
| Health Care & Social Assistance | 0 (0.0%) | 30 (100.0%) |
| Arts, Entertainment & Recreation | 0 (0.0%) | 5 (100.0%) |
| Accommodation & Food Services | 6 (75.0%) | 2 (25.0%) |
| Public Administration | 0 (0.0%) | 0 (0.0%) |
| Total | 45 (44.1%) | 57 (55.9%) |
Education in Lake Bronson
School Enrollment in Lake Bronson
The most common levels of schooling among the 17 students in Lake Bronson are high school (10 | 58.8%), elementary school (3 | 17.6%), and college / undergraduate (3 | 17.6%).
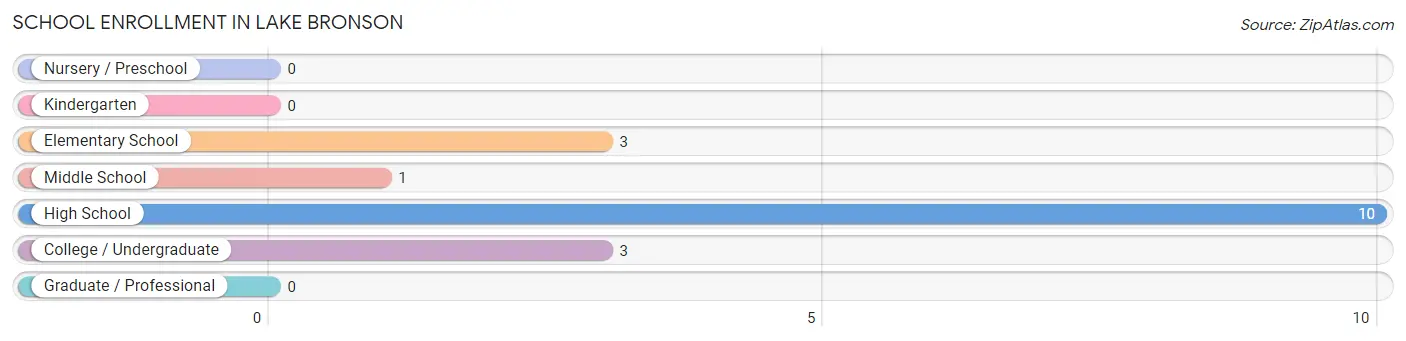
| School Level | # Students | % Students |
| Nursery / Preschool | 0 | 0.0% |
| Kindergarten | 0 | 0.0% |
| Elementary School | 3 | 17.6% |
| Middle School | 1 | 5.9% |
| High School | 10 | 58.8% |
| College / Undergraduate | 3 | 17.6% |
| Graduate / Professional | 0 | 0.0% |
| Total | 17 | 100.0% |
School Enrollment by Age by Funding Source in Lake Bronson
Out of a total of 17 students who are enrolled in schools in Lake Bronson, 3 (17.6%) attend a private institution, while the remaining 14 (82.4%) are enrolled in public schools. The age group of 20 to 24 year olds has the highest likelihood of being enrolled in private schools, with 1 (50.0% in the age bracket) enrolled. Conversely, the age group of 10 to 14 year olds has the lowest likelihood of being enrolled in a private school, with 1 (100.0% in the age bracket) attending a public institution.
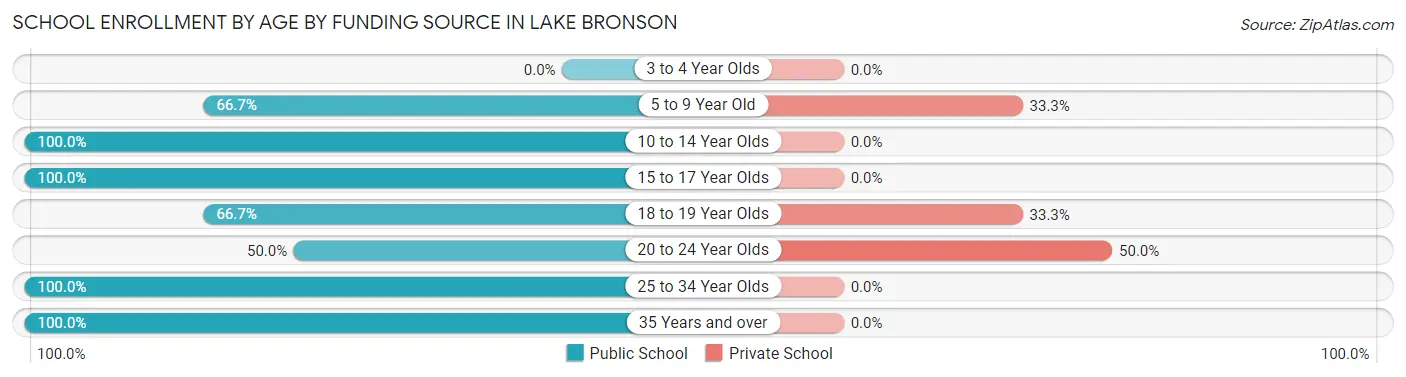
| Age Bracket | Public School | Private School |
| 3 to 4 Year Olds | 0 (0.0%) | 0 (0.0%) |
| 5 to 9 Year Old | 2 (66.7%) | 1 (33.3%) |
| 10 to 14 Year Olds | 1 (100.0%) | 0 (0.0%) |
| 15 to 17 Year Olds | 2 (100.0%) | 0 (0.0%) |
| 18 to 19 Year Olds | 2 (66.7%) | 1 (33.3%) |
| 20 to 24 Year Olds | 1 (50.0%) | 1 (50.0%) |
| 25 to 34 Year Olds | 5 (100.0%) | 0 (0.0%) |
| 35 Years and over | 1 (100.0%) | 0 (0.0%) |
| Total | 14 (82.4%) | 3 (17.6%) |
Educational Attainment by Field of Study in Lake Bronson
Education (3 | 60.0%), and business (2 | 40.0%) are the most common fields of study among 5 individuals in Lake Bronson who have obtained a bachelor's degree or higher.
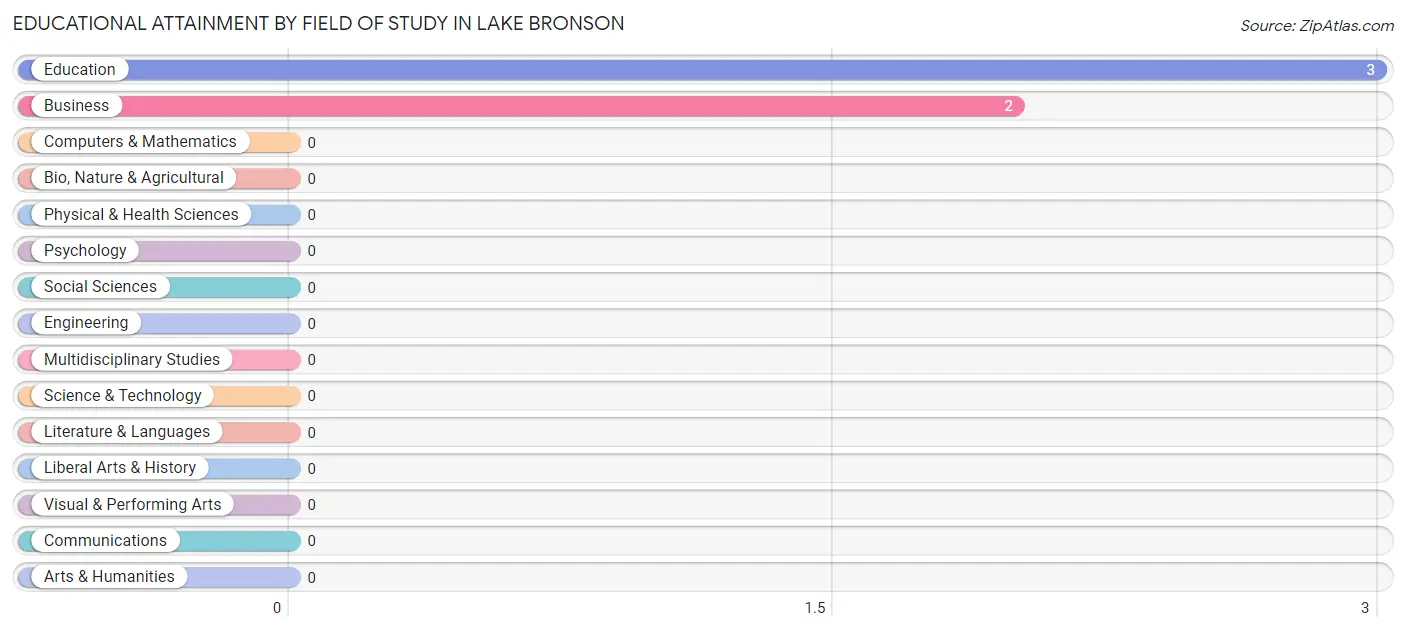
| Field of Study | # Graduates | % Graduates |
| Computers & Mathematics | 0 | 0.0% |
| Bio, Nature & Agricultural | 0 | 0.0% |
| Physical & Health Sciences | 0 | 0.0% |
| Psychology | 0 | 0.0% |
| Social Sciences | 0 | 0.0% |
| Engineering | 0 | 0.0% |
| Multidisciplinary Studies | 0 | 0.0% |
| Science & Technology | 0 | 0.0% |
| Business | 2 | 40.0% |
| Education | 3 | 60.0% |
| Literature & Languages | 0 | 0.0% |
| Liberal Arts & History | 0 | 0.0% |
| Visual & Performing Arts | 0 | 0.0% |
| Communications | 0 | 0.0% |
| Arts & Humanities | 0 | 0.0% |
| Total | 5 | 100.0% |
Transportation & Commute in Lake Bronson
Vehicle Availability by Sex in Lake Bronson
The most prevalent vehicle ownership categories in Lake Bronson are males with 2 vehicles (23, accounting for 51.1%) and females with 2 vehicles (34, making up 40.4%).
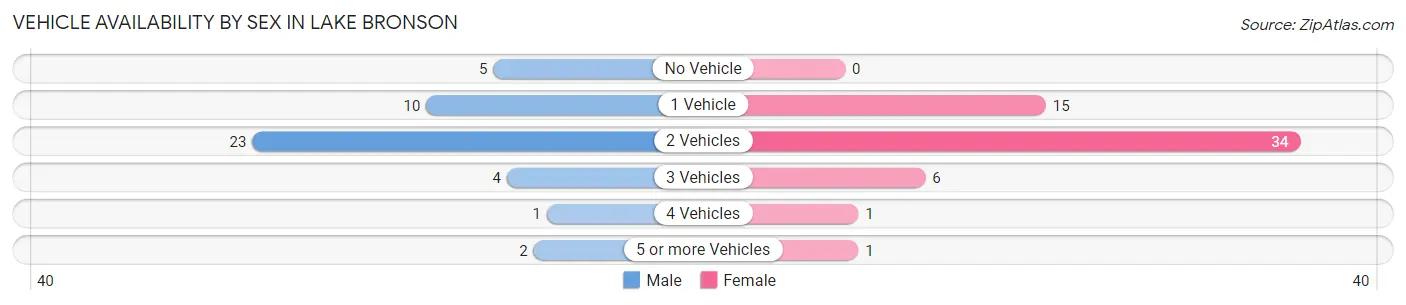
| Vehicles Available | Male | Female |
| No Vehicle | 5 (11.1%) | 0 (0.0%) |
| 1 Vehicle | 10 (22.2%) | 15 (26.3%) |
| 2 Vehicles | 23 (51.1%) | 34 (59.7%) |
| 3 Vehicles | 4 (8.9%) | 6 (10.5%) |
| 4 Vehicles | 1 (2.2%) | 1 (1.8%) |
| 5 or more Vehicles | 2 (4.4%) | 1 (1.8%) |
| Total | 45 (100.0%) | 57 (100.0%) |
Commute Time in Lake Bronson
The most frequently occuring commute durations in Lake Bronson are 15 to 19 minutes (39 commuters, 38.6%), less than 5 minutes (21 commuters, 20.8%), and 40 to 44 minutes (10 commuters, 9.9%).
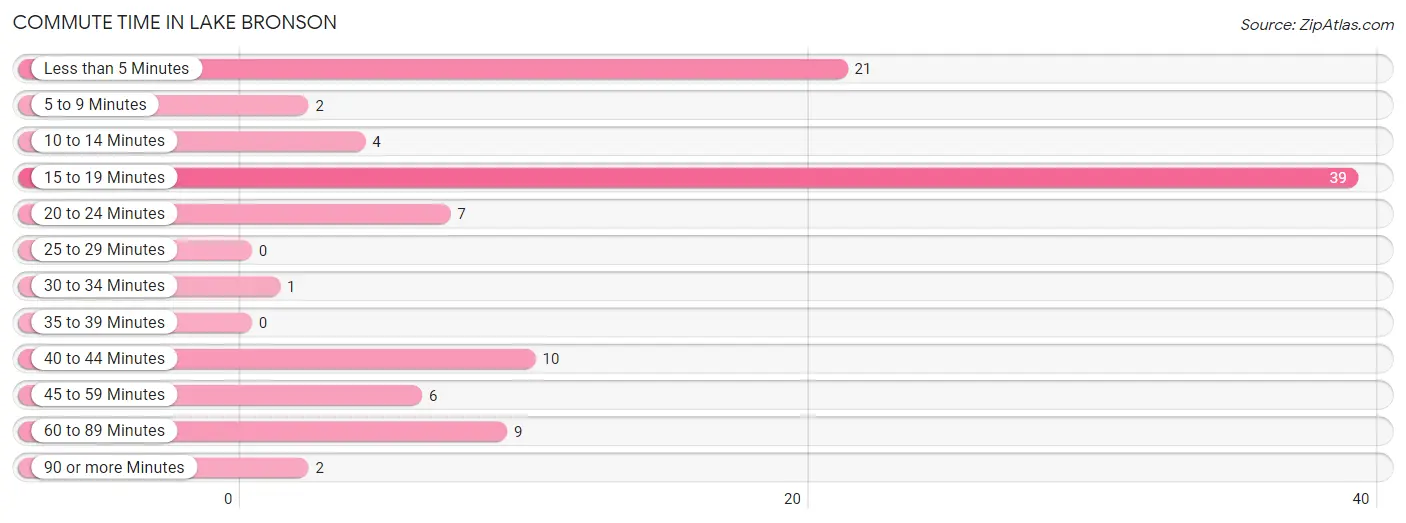
| Commute Time | # Commuters | % Commuters |
| Less than 5 Minutes | 21 | 20.8% |
| 5 to 9 Minutes | 2 | 2.0% |
| 10 to 14 Minutes | 4 | 4.0% |
| 15 to 19 Minutes | 39 | 38.6% |
| 20 to 24 Minutes | 7 | 6.9% |
| 25 to 29 Minutes | 0 | 0.0% |
| 30 to 34 Minutes | 1 | 1.0% |
| 35 to 39 Minutes | 0 | 0.0% |
| 40 to 44 Minutes | 10 | 9.9% |
| 45 to 59 Minutes | 6 | 5.9% |
| 60 to 89 Minutes | 9 | 8.9% |
| 90 or more Minutes | 2 | 2.0% |
Commute Time by Sex in Lake Bronson
The most common commute times in Lake Bronson are less than 5 minutes (11 commuters, 24.4%) for males and 15 to 19 minutes (29 commuters, 51.8%) for females.
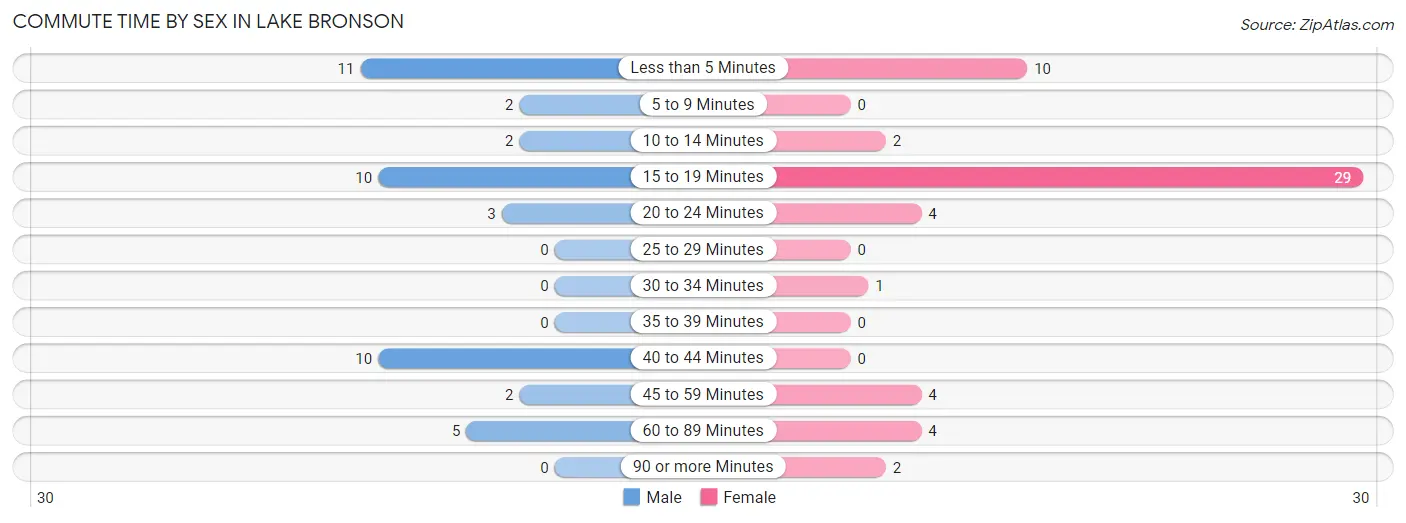
| Commute Time | Male | Female |
| Less than 5 Minutes | 11 (24.4%) | 10 (17.9%) |
| 5 to 9 Minutes | 2 (4.4%) | 0 (0.0%) |
| 10 to 14 Minutes | 2 (4.4%) | 2 (3.6%) |
| 15 to 19 Minutes | 10 (22.2%) | 29 (51.8%) |
| 20 to 24 Minutes | 3 (6.7%) | 4 (7.1%) |
| 25 to 29 Minutes | 0 (0.0%) | 0 (0.0%) |
| 30 to 34 Minutes | 0 (0.0%) | 1 (1.8%) |
| 35 to 39 Minutes | 0 (0.0%) | 0 (0.0%) |
| 40 to 44 Minutes | 10 (22.2%) | 0 (0.0%) |
| 45 to 59 Minutes | 2 (4.4%) | 4 (7.1%) |
| 60 to 89 Minutes | 5 (11.1%) | 4 (7.1%) |
| 90 or more Minutes | 0 (0.0%) | 2 (3.6%) |
Time of Departure to Work by Sex in Lake Bronson
The most frequent times of departure to work in Lake Bronson are 12:00 PM to 3:59 PM (18, 40.0%) for males and 5:30 AM to 5:59 AM (22, 39.3%) for females.
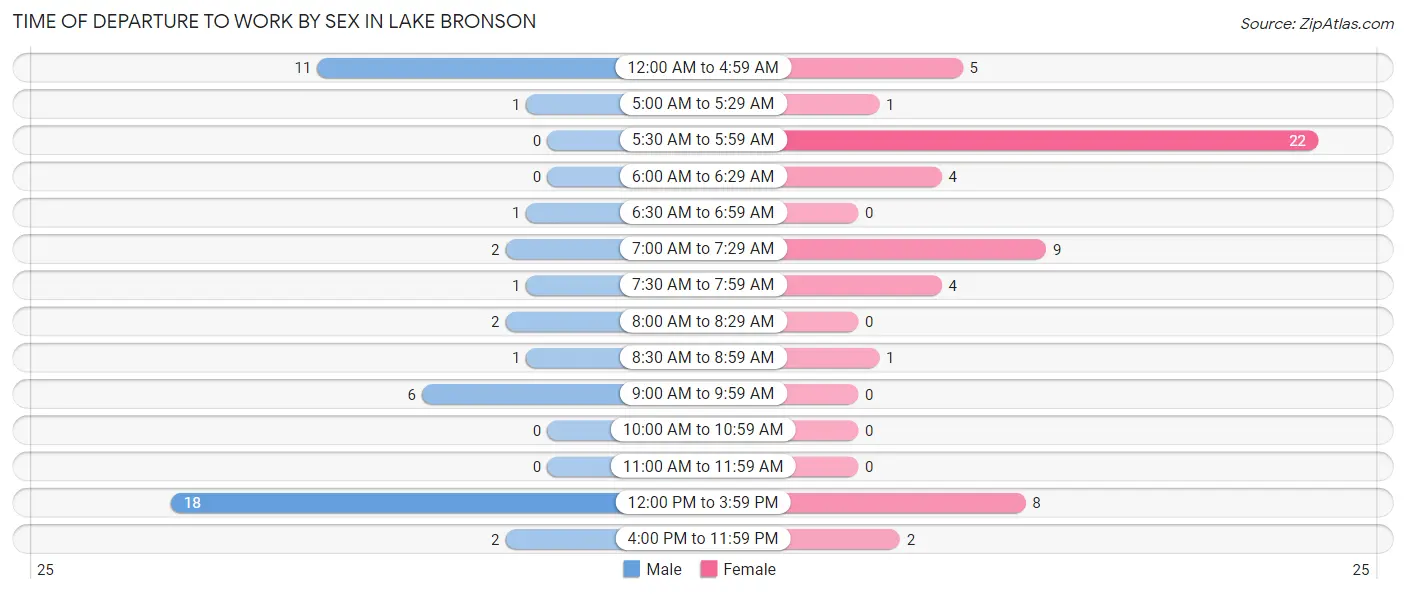
| Time of Departure | Male | Female |
| 12:00 AM to 4:59 AM | 11 (24.4%) | 5 (8.9%) |
| 5:00 AM to 5:29 AM | 1 (2.2%) | 1 (1.8%) |
| 5:30 AM to 5:59 AM | 0 (0.0%) | 22 (39.3%) |
| 6:00 AM to 6:29 AM | 0 (0.0%) | 4 (7.1%) |
| 6:30 AM to 6:59 AM | 1 (2.2%) | 0 (0.0%) |
| 7:00 AM to 7:29 AM | 2 (4.4%) | 9 (16.1%) |
| 7:30 AM to 7:59 AM | 1 (2.2%) | 4 (7.1%) |
| 8:00 AM to 8:29 AM | 2 (4.4%) | 0 (0.0%) |
| 8:30 AM to 8:59 AM | 1 (2.2%) | 1 (1.8%) |
| 9:00 AM to 9:59 AM | 6 (13.3%) | 0 (0.0%) |
| 10:00 AM to 10:59 AM | 0 (0.0%) | 0 (0.0%) |
| 11:00 AM to 11:59 AM | 0 (0.0%) | 0 (0.0%) |
| 12:00 PM to 3:59 PM | 18 (40.0%) | 8 (14.3%) |
| 4:00 PM to 11:59 PM | 2 (4.4%) | 2 (3.6%) |
| Total | 45 (100.0%) | 56 (100.0%) |
Housing Occupancy in Lake Bronson
Occupancy by Ownership in Lake Bronson
Of the total 110 dwellings in Lake Bronson, owner-occupied units account for 65 (59.1%), while renter-occupied units make up 45 (40.9%).
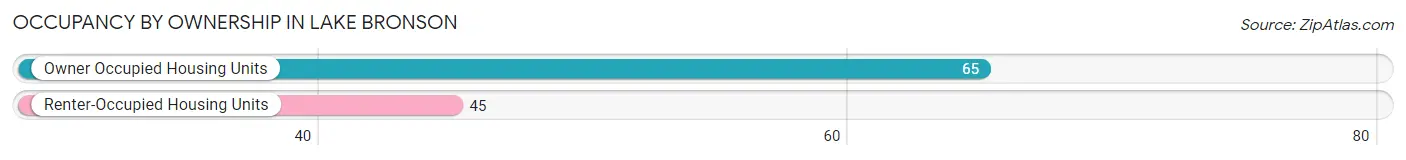
| Occupancy | # Housing Units | % Housing Units |
| Owner Occupied Housing Units | 65 | 59.1% |
| Renter-Occupied Housing Units | 45 | 40.9% |
| Total Occupied Housing Units | 110 | 100.0% |
Occupancy by Household Size in Lake Bronson
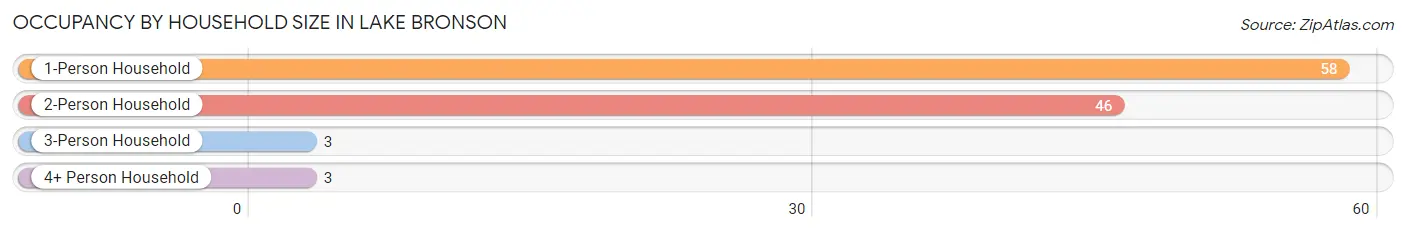
| Household Size | # Housing Units | % Housing Units |
| 1-Person Household | 58 | 52.7% |
| 2-Person Household | 46 | 41.8% |
| 3-Person Household | 3 | 2.7% |
| 4+ Person Household | 3 | 2.7% |
| Total Housing Units | 110 | 100.0% |
Occupancy by Ownership by Household Size in Lake Bronson
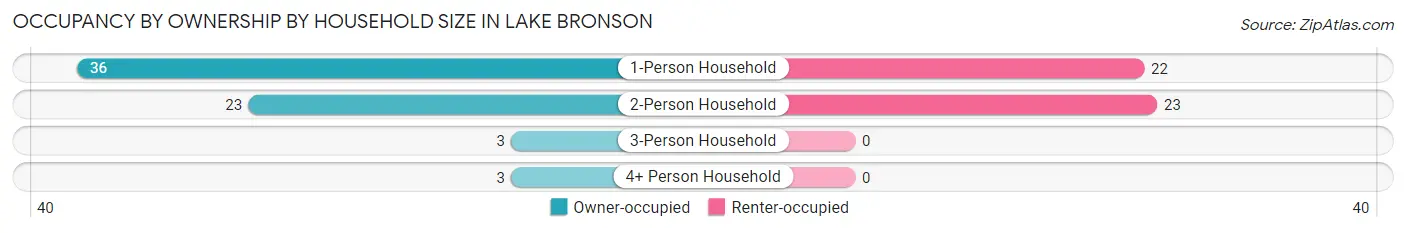
| Household Size | Owner-occupied | Renter-occupied |
| 1-Person Household | 36 (62.1%) | 22 (37.9%) |
| 2-Person Household | 23 (50.0%) | 23 (50.0%) |
| 3-Person Household | 3 (100.0%) | 0 (0.0%) |
| 4+ Person Household | 3 (100.0%) | 0 (0.0%) |
| Total Housing Units | 65 (59.1%) | 45 (40.9%) |
Occupancy by Educational Attainment in Lake Bronson
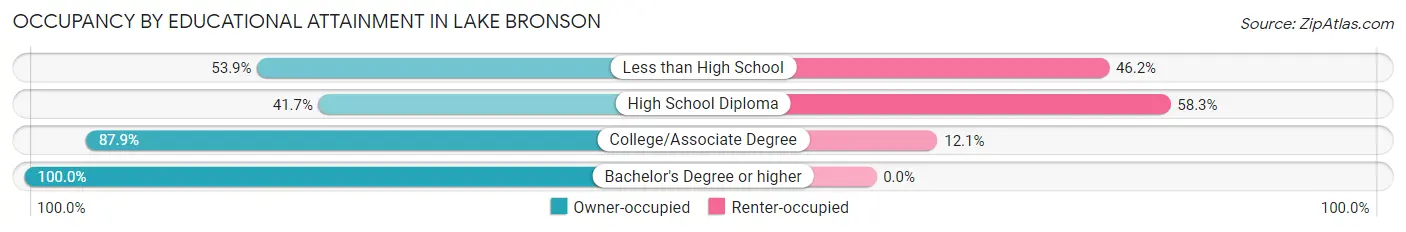
| Household Size | Owner-occupied | Renter-occupied |
| Less than High School | 7 (53.8%) | 6 (46.2%) |
| High School Diploma | 25 (41.7%) | 35 (58.3%) |
| College/Associate Degree | 29 (87.9%) | 4 (12.1%) |
| Bachelor's Degree or higher | 4 (100.0%) | 0 (0.0%) |
Occupancy by Age of Householder in Lake Bronson
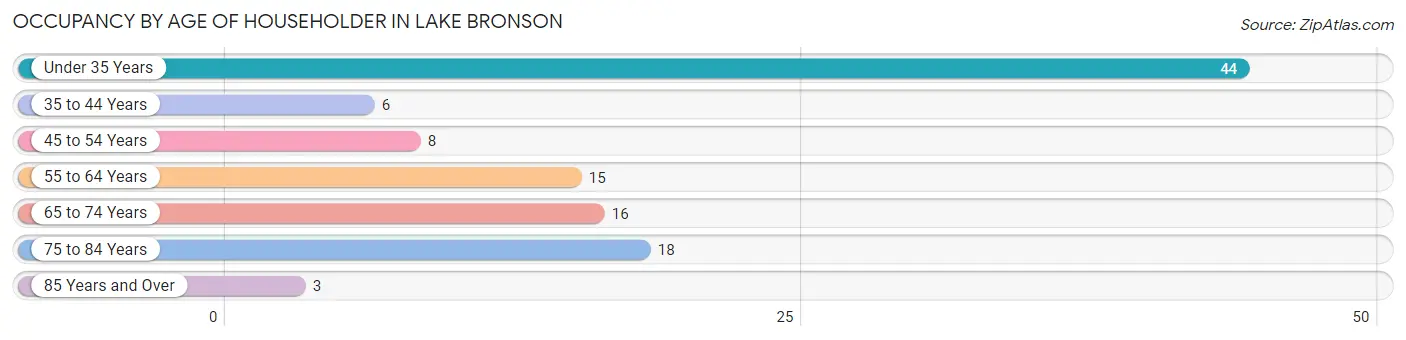
| Age Bracket | # Households | % Households |
| Under 35 Years | 44 | 40.0% |
| 35 to 44 Years | 6 | 5.4% |
| 45 to 54 Years | 8 | 7.3% |
| 55 to 64 Years | 15 | 13.6% |
| 65 to 74 Years | 16 | 14.5% |
| 75 to 84 Years | 18 | 16.4% |
| 85 Years and Over | 3 | 2.7% |
| Total | 110 | 100.0% |
Housing Finances in Lake Bronson
Median Income by Occupancy in Lake Bronson
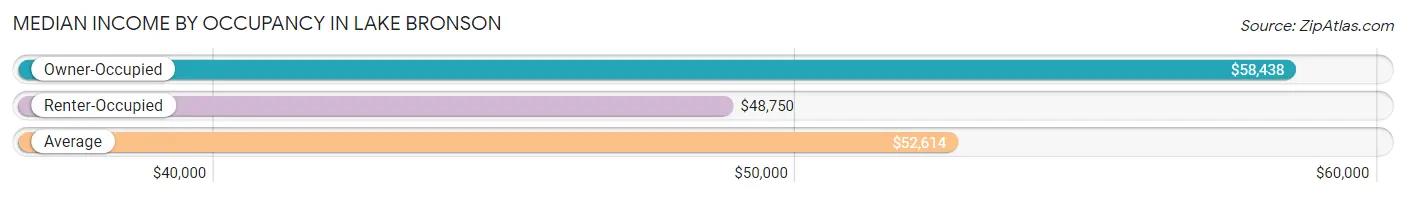
| Occupancy Type | # Households | Median Income |
| Owner-Occupied | 65 (59.1%) | $58,438 |
| Renter-Occupied | 45 (40.9%) | $48,750 |
| Average | 110 (100.0%) | $52,614 |
Occupancy by Householder Income Bracket in Lake Bronson
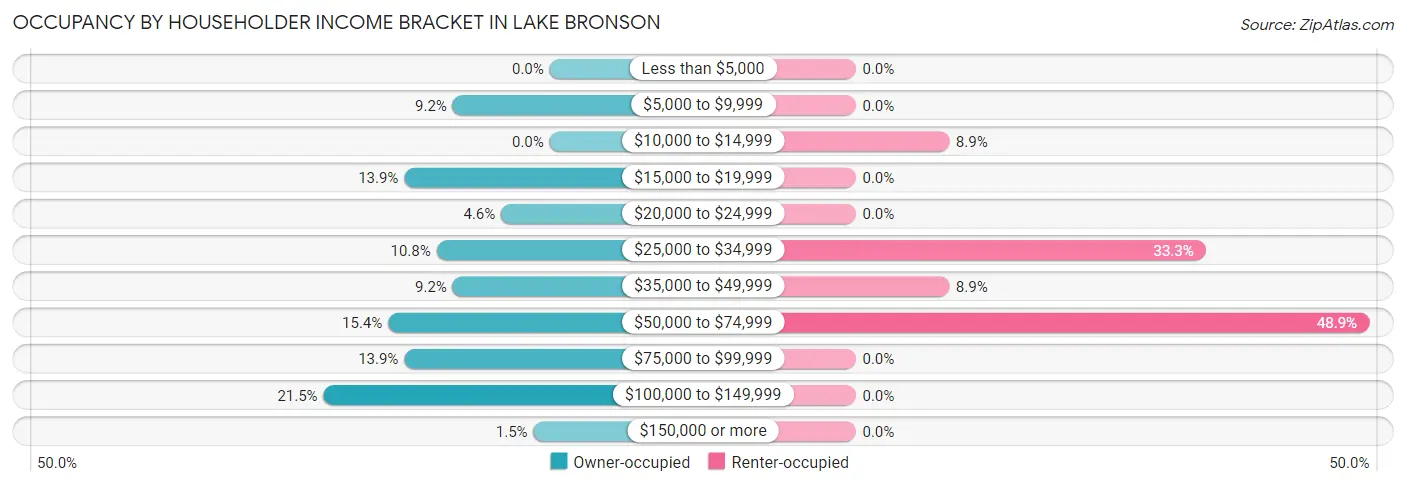
| Income Bracket | Owner-occupied | Renter-occupied |
| Less than $5,000 | 0 (0.0%) | 0 (0.0%) |
| $5,000 to $9,999 | 6 (9.2%) | 0 (0.0%) |
| $10,000 to $14,999 | 0 (0.0%) | 4 (8.9%) |
| $15,000 to $19,999 | 9 (13.9%) | 0 (0.0%) |
| $20,000 to $24,999 | 3 (4.6%) | 0 (0.0%) |
| $25,000 to $34,999 | 7 (10.8%) | 15 (33.3%) |
| $35,000 to $49,999 | 6 (9.2%) | 4 (8.9%) |
| $50,000 to $74,999 | 10 (15.4%) | 22 (48.9%) |
| $75,000 to $99,999 | 9 (13.9%) | 0 (0.0%) |
| $100,000 to $149,999 | 14 (21.5%) | 0 (0.0%) |
| $150,000 or more | 1 (1.5%) | 0 (0.0%) |
| Total | 65 (100.0%) | 45 (100.0%) |
Monthly Housing Cost Tiers in Lake Bronson
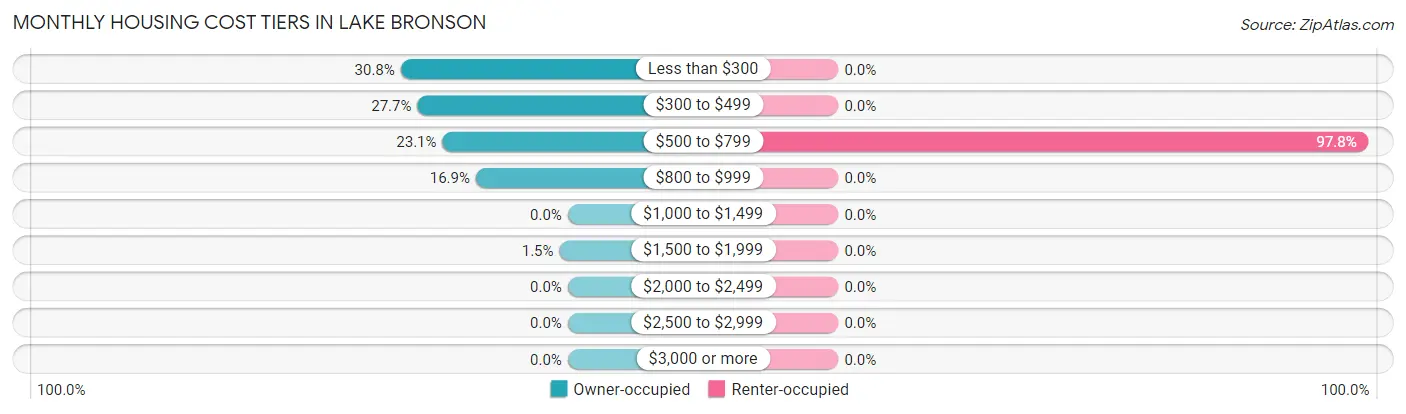
| Monthly Cost | Owner-occupied | Renter-occupied |
| Less than $300 | 20 (30.8%) | 0 (0.0%) |
| $300 to $499 | 18 (27.7%) | 0 (0.0%) |
| $500 to $799 | 15 (23.1%) | 44 (97.8%) |
| $800 to $999 | 11 (16.9%) | 0 (0.0%) |
| $1,000 to $1,499 | 0 (0.0%) | 0 (0.0%) |
| $1,500 to $1,999 | 1 (1.5%) | 0 (0.0%) |
| $2,000 to $2,499 | 0 (0.0%) | 0 (0.0%) |
| $2,500 to $2,999 | 0 (0.0%) | 0 (0.0%) |
| $3,000 or more | 0 (0.0%) | 0 (0.0%) |
| Total | 65 (100.0%) | 45 (100.0%) |
Physical Housing Characteristics in Lake Bronson
Housing Structures in Lake Bronson
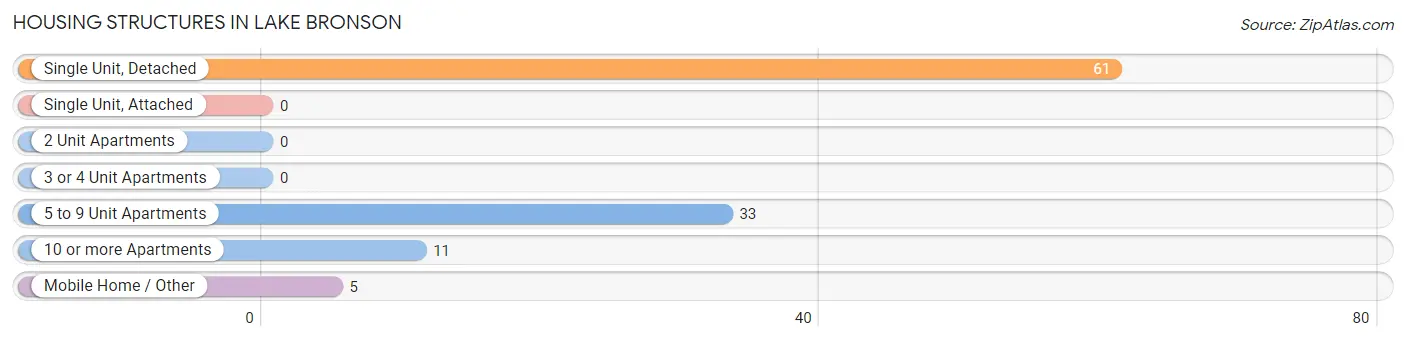
| Structure Type | # Housing Units | % Housing Units |
| Single Unit, Detached | 61 | 55.4% |
| Single Unit, Attached | 0 | 0.0% |
| 2 Unit Apartments | 0 | 0.0% |
| 3 or 4 Unit Apartments | 0 | 0.0% |
| 5 to 9 Unit Apartments | 33 | 30.0% |
| 10 or more Apartments | 11 | 10.0% |
| Mobile Home / Other | 5 | 4.5% |
| Total | 110 | 100.0% |
Housing Structures by Occupancy in Lake Bronson
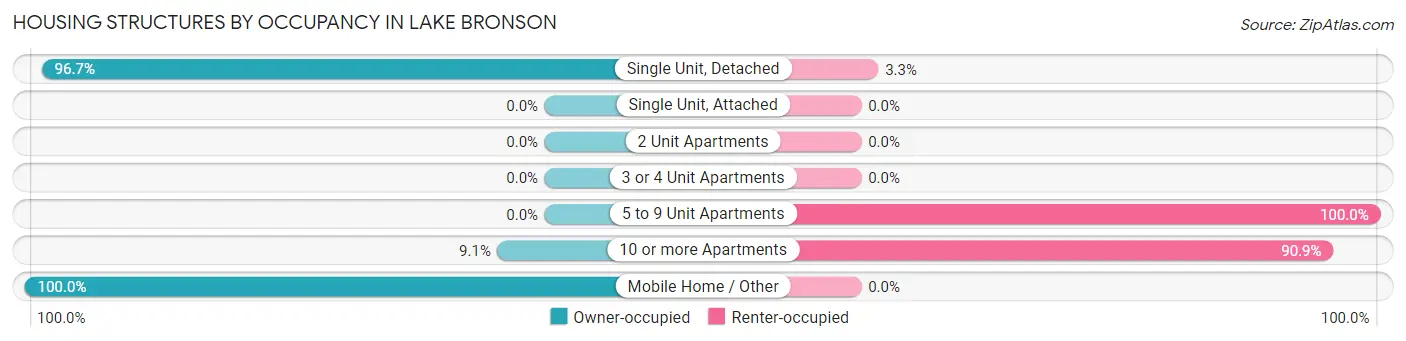
| Structure Type | Owner-occupied | Renter-occupied |
| Single Unit, Detached | 59 (96.7%) | 2 (3.3%) |
| Single Unit, Attached | 0 (0.0%) | 0 (0.0%) |
| 2 Unit Apartments | 0 (0.0%) | 0 (0.0%) |
| 3 or 4 Unit Apartments | 0 (0.0%) | 0 (0.0%) |
| 5 to 9 Unit Apartments | 0 (0.0%) | 33 (100.0%) |
| 10 or more Apartments | 1 (9.1%) | 10 (90.9%) |
| Mobile Home / Other | 5 (100.0%) | 0 (0.0%) |
| Total | 65 (59.1%) | 45 (40.9%) |
Housing Structures by Number of Rooms in Lake Bronson
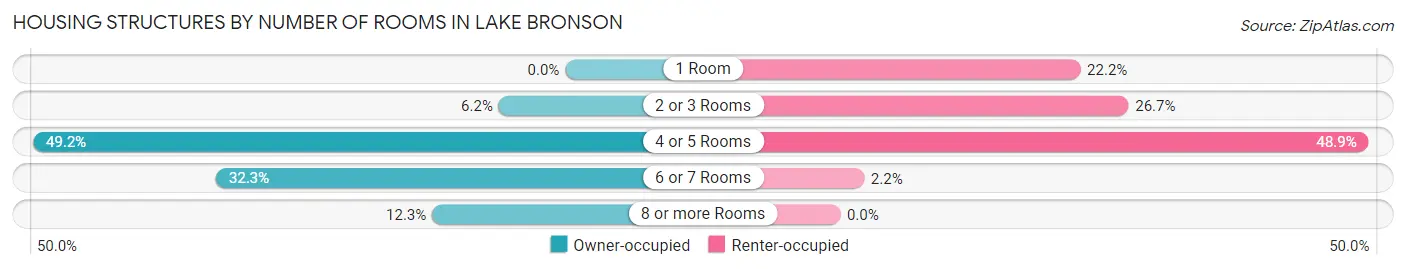
| Number of Rooms | Owner-occupied | Renter-occupied |
| 1 Room | 0 (0.0%) | 10 (22.2%) |
| 2 or 3 Rooms | 4 (6.1%) | 12 (26.7%) |
| 4 or 5 Rooms | 32 (49.2%) | 22 (48.9%) |
| 6 or 7 Rooms | 21 (32.3%) | 1 (2.2%) |
| 8 or more Rooms | 8 (12.3%) | 0 (0.0%) |
| Total | 65 (100.0%) | 45 (100.0%) |
Housing Structure by Heating Type in Lake Bronson
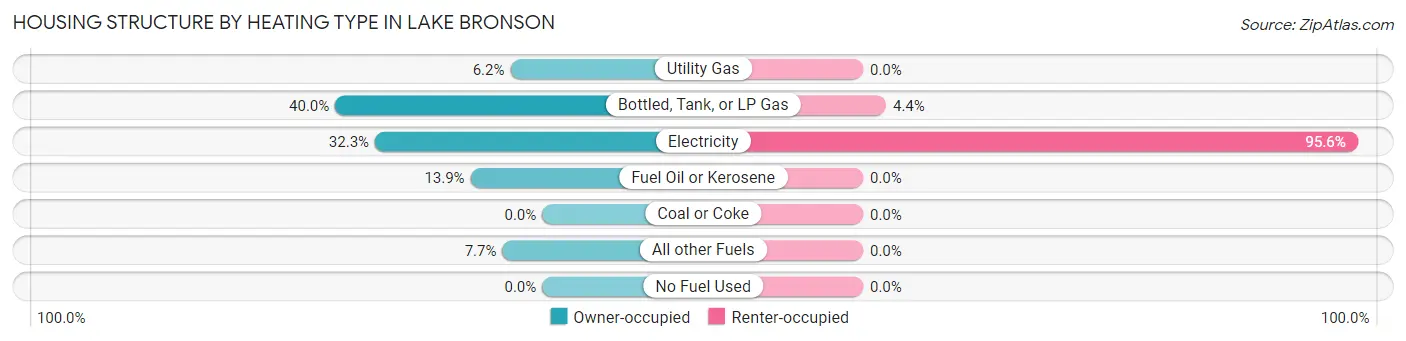
| Heating Type | Owner-occupied | Renter-occupied |
| Utility Gas | 4 (6.1%) | 0 (0.0%) |
| Bottled, Tank, or LP Gas | 26 (40.0%) | 2 (4.4%) |
| Electricity | 21 (32.3%) | 43 (95.6%) |
| Fuel Oil or Kerosene | 9 (13.9%) | 0 (0.0%) |
| Coal or Coke | 0 (0.0%) | 0 (0.0%) |
| All other Fuels | 5 (7.7%) | 0 (0.0%) |
| No Fuel Used | 0 (0.0%) | 0 (0.0%) |
| Total | 65 (100.0%) | 45 (100.0%) |
Household Vehicle Usage in Lake Bronson
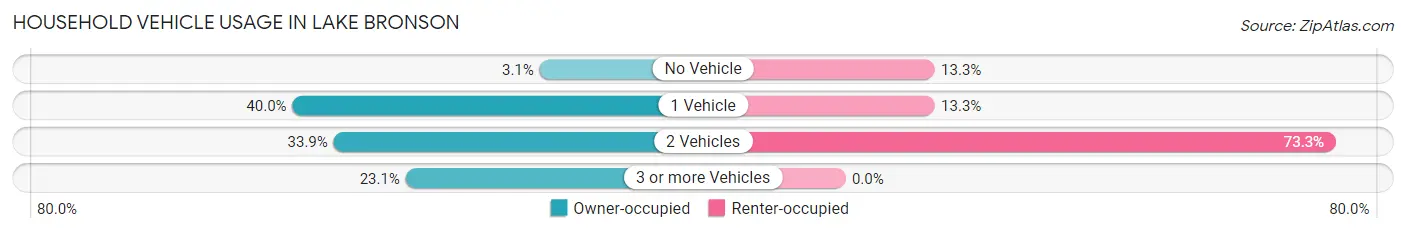
| Vehicles per Household | Owner-occupied | Renter-occupied |
| No Vehicle | 2 (3.1%) | 6 (13.3%) |
| 1 Vehicle | 26 (40.0%) | 6 (13.3%) |
| 2 Vehicles | 22 (33.9%) | 33 (73.3%) |
| 3 or more Vehicles | 15 (23.1%) | 0 (0.0%) |
| Total | 65 (100.0%) | 45 (100.0%) |
Real Estate & Mortgages in Lake Bronson
Real Estate and Mortgage Overview in Lake Bronson
| Characteristic | Without Mortgage | With Mortgage |
| Housing Units | 56 | 9 |
| Median Property Value | $40,000 | $56,400 |
| Median Household Income | $44,000 | $0 |
| Monthly Housing Costs | $385 | $0 |
| Real Estate Taxes | $583 | $1 |
Property Value by Mortgage Status in Lake Bronson
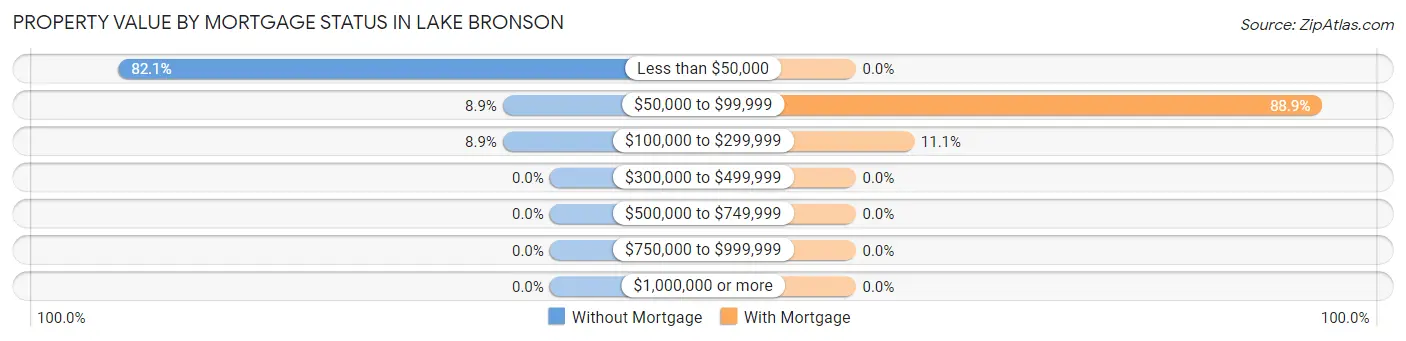
| Property Value | Without Mortgage | With Mortgage |
| Less than $50,000 | 46 (82.1%) | 0 (0.0%) |
| $50,000 to $99,999 | 5 (8.9%) | 8 (88.9%) |
| $100,000 to $299,999 | 5 (8.9%) | 1 (11.1%) |
| $300,000 to $499,999 | 0 (0.0%) | 0 (0.0%) |
| $500,000 to $749,999 | 0 (0.0%) | 0 (0.0%) |
| $750,000 to $999,999 | 0 (0.0%) | 0 (0.0%) |
| $1,000,000 or more | 0 (0.0%) | 0 (0.0%) |
| Total | 56 (100.0%) | 9 (100.0%) |
Household Income by Mortgage Status in Lake Bronson
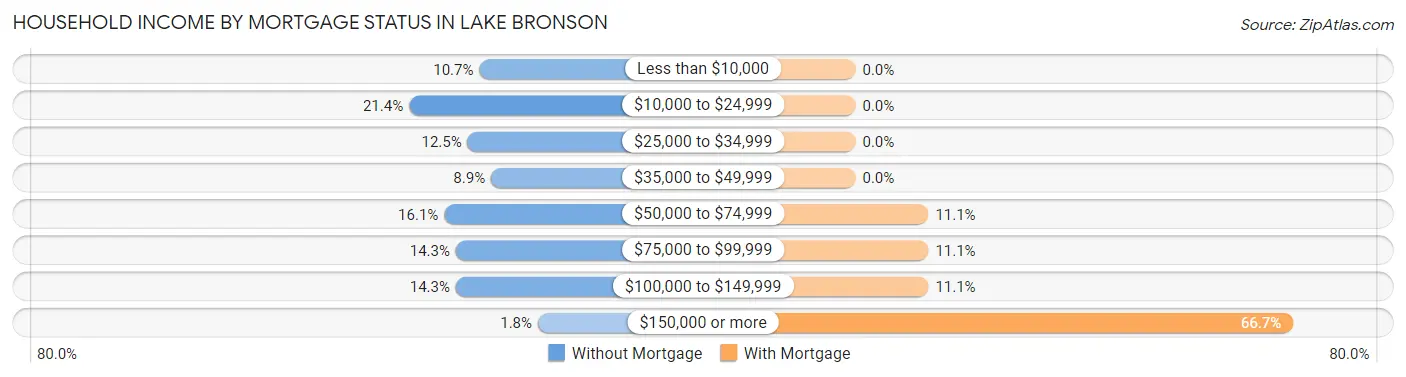
| Household Income | Without Mortgage | With Mortgage |
| Less than $10,000 | 6 (10.7%) | 0 (0.0%) |
| $10,000 to $24,999 | 12 (21.4%) | 0 (0.0%) |
| $25,000 to $34,999 | 7 (12.5%) | 0 (0.0%) |
| $35,000 to $49,999 | 5 (8.9%) | 0 (0.0%) |
| $50,000 to $74,999 | 9 (16.1%) | 1 (11.1%) |
| $75,000 to $99,999 | 8 (14.3%) | 1 (11.1%) |
| $100,000 to $149,999 | 8 (14.3%) | 1 (11.1%) |
| $150,000 or more | 1 (1.8%) | 6 (66.7%) |
| Total | 56 (100.0%) | 9 (100.0%) |
Property Value to Household Income Ratio in Lake Bronson
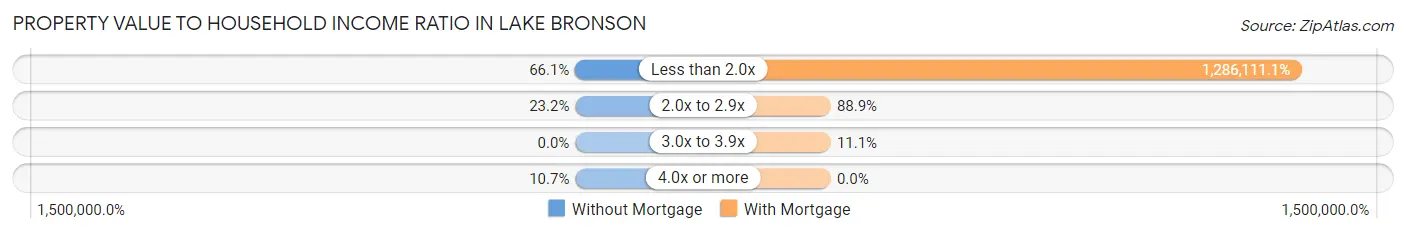
| Value-to-Income Ratio | Without Mortgage | With Mortgage |
| Less than 2.0x | 37 (66.1%) | 115,750 (1,286,111.1%) |
| 2.0x to 2.9x | 13 (23.2%) | 8 (88.9%) |
| 3.0x to 3.9x | 0 (0.0%) | 1 (11.1%) |
| 4.0x or more | 6 (10.7%) | 0 (0.0%) |
| Total | 56 (100.0%) | 9 (100.0%) |
Real Estate Taxes by Mortgage Status in Lake Bronson
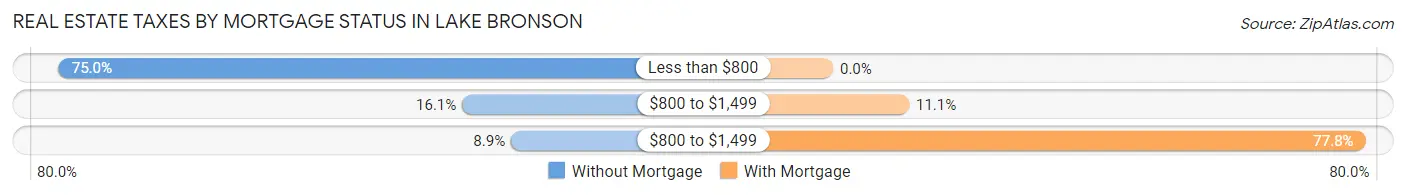
| Property Taxes | Without Mortgage | With Mortgage |
| Less than $800 | 42 (75.0%) | 0 (0.0%) |
| $800 to $1,499 | 9 (16.1%) | 1 (11.1%) |
| $800 to $1,499 | 5 (8.9%) | 7 (77.8%) |
| Total | 56 (100.0%) | 9 (100.0%) |
Health & Disability in Lake Bronson
Health Insurance Coverage by Age in Lake Bronson
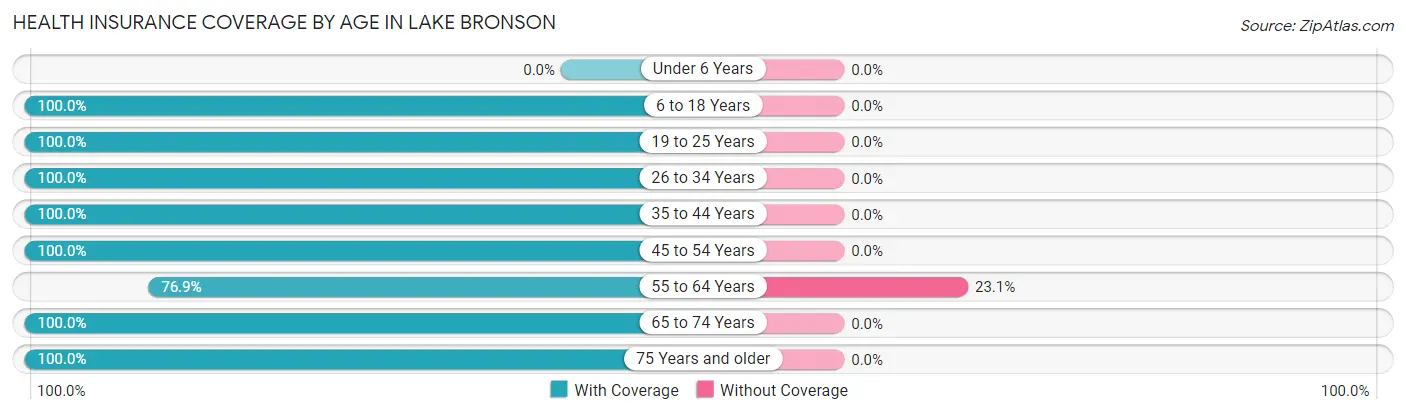
| Age Bracket | With Coverage | Without Coverage |
| Under 6 Years | 0 (0.0%) | 0 (0.0%) |
| 6 to 18 Years | 8 (100.0%) | 0 (0.0%) |
| 19 to 25 Years | 60 (100.0%) | 0 (0.0%) |
| 26 to 34 Years | 6 (100.0%) | 0 (0.0%) |
| 35 to 44 Years | 9 (100.0%) | 0 (0.0%) |
| 45 to 54 Years | 13 (100.0%) | 0 (0.0%) |
| 55 to 64 Years | 20 (76.9%) | 6 (23.1%) |
| 65 to 74 Years | 20 (100.0%) | 0 (0.0%) |
| 75 Years and older | 25 (100.0%) | 0 (0.0%) |
| Total | 161 (96.4%) | 6 (3.6%) |
Health Insurance Coverage by Citizenship Status in Lake Bronson
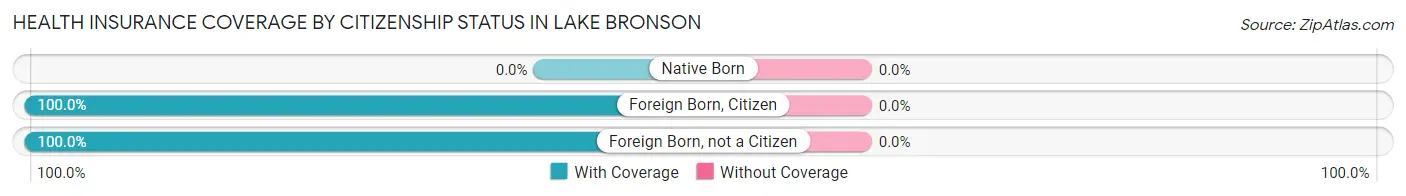
| Citizenship Status | With Coverage | Without Coverage |
| Native Born | 0 (0.0%) | 0 (0.0%) |
| Foreign Born, Citizen | 8 (100.0%) | 0 (0.0%) |
| Foreign Born, not a Citizen | 60 (100.0%) | 0 (0.0%) |
Health Insurance Coverage by Household Income in Lake Bronson
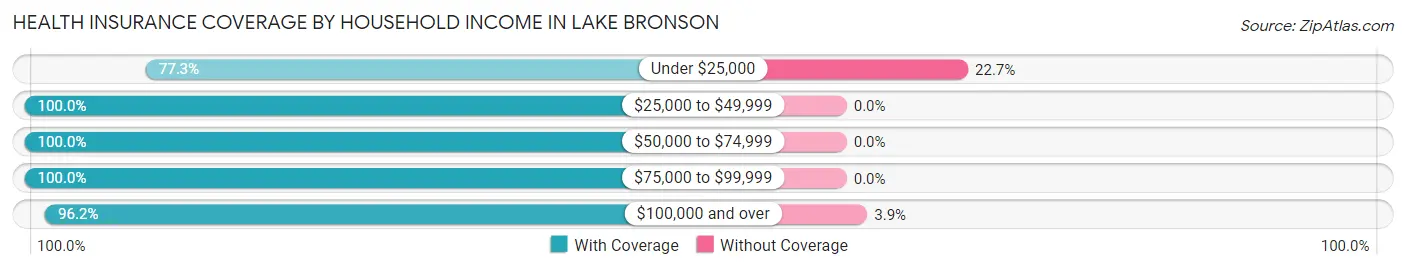
| Household Income | With Coverage | Without Coverage |
| Under $25,000 | 17 (77.3%) | 5 (22.7%) |
| $25,000 to $49,999 | 39 (100.0%) | 0 (0.0%) |
| $50,000 to $74,999 | 63 (100.0%) | 0 (0.0%) |
| $75,000 to $99,999 | 17 (100.0%) | 0 (0.0%) |
| $100,000 and over | 25 (96.2%) | 1 (3.8%) |
Public vs Private Health Insurance Coverage by Age in Lake Bronson
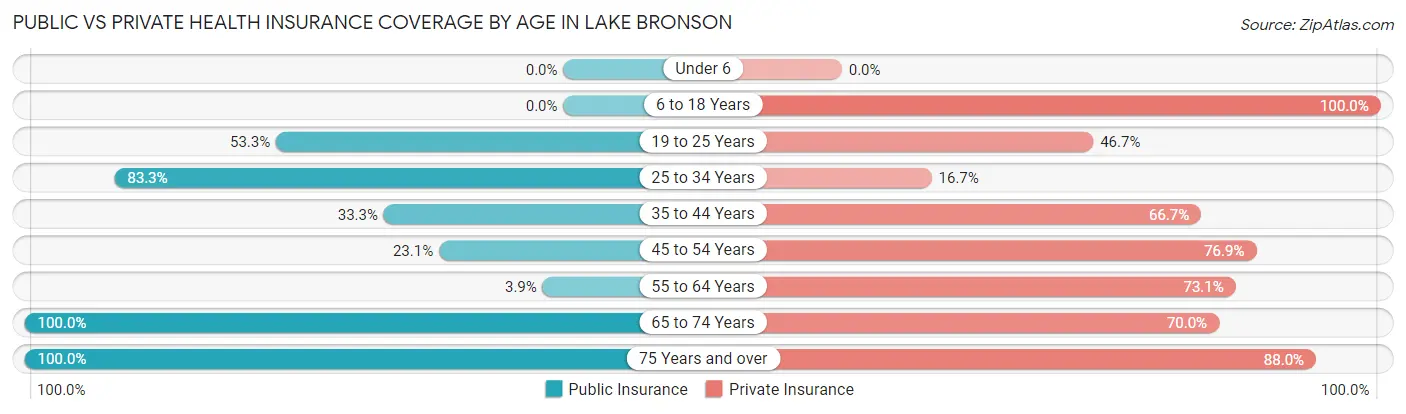
| Age Bracket | Public Insurance | Private Insurance |
| Under 6 | 0 (0.0%) | 0 (0.0%) |
| 6 to 18 Years | 0 (0.0%) | 8 (100.0%) |
| 19 to 25 Years | 32 (53.3%) | 28 (46.7%) |
| 25 to 34 Years | 5 (83.3%) | 1 (16.7%) |
| 35 to 44 Years | 3 (33.3%) | 6 (66.7%) |
| 45 to 54 Years | 3 (23.1%) | 10 (76.9%) |
| 55 to 64 Years | 1 (3.8%) | 19 (73.1%) |
| 65 to 74 Years | 20 (100.0%) | 14 (70.0%) |
| 75 Years and over | 25 (100.0%) | 22 (88.0%) |
| Total | 89 (53.3%) | 108 (64.7%) |
Disability Status by Sex by Age in Lake Bronson
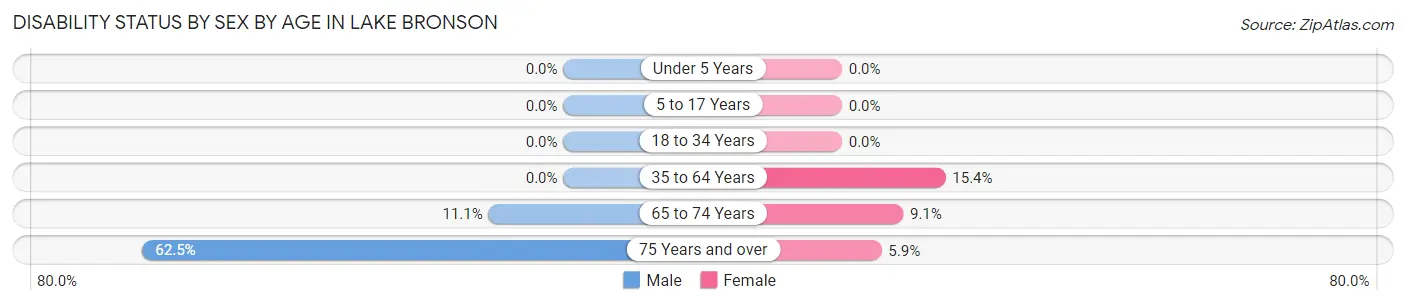
| Age Bracket | Male | Female |
| Under 5 Years | 0 (0.0%) | 0 (0.0%) |
| 5 to 17 Years | 0 (0.0%) | 0 (0.0%) |
| 18 to 34 Years | 0 (0.0%) | 0 (0.0%) |
| 35 to 64 Years | 0 (0.0%) | 4 (15.4%) |
| 65 to 74 Years | 1 (11.1%) | 1 (9.1%) |
| 75 Years and over | 5 (62.5%) | 1 (5.9%) |
Disability Class by Sex by Age in Lake Bronson
Disability Class: Hearing Difficulty
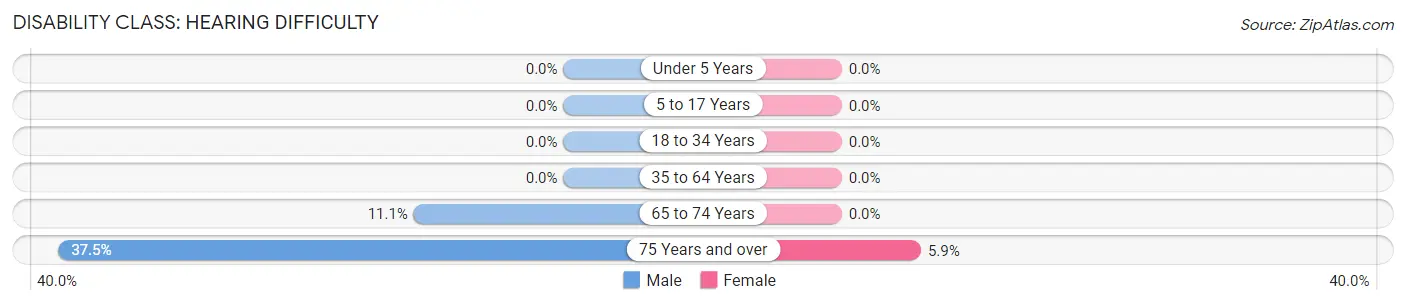
| Age Bracket | Male | Female |
| Under 5 Years | 0 (0.0%) | 0 (0.0%) |
| 5 to 17 Years | 0 (0.0%) | 0 (0.0%) |
| 18 to 34 Years | 0 (0.0%) | 0 (0.0%) |
| 35 to 64 Years | 0 (0.0%) | 0 (0.0%) |
| 65 to 74 Years | 1 (11.1%) | 0 (0.0%) |
| 75 Years and over | 3 (37.5%) | 1 (5.9%) |
Disability Class: Vision Difficulty
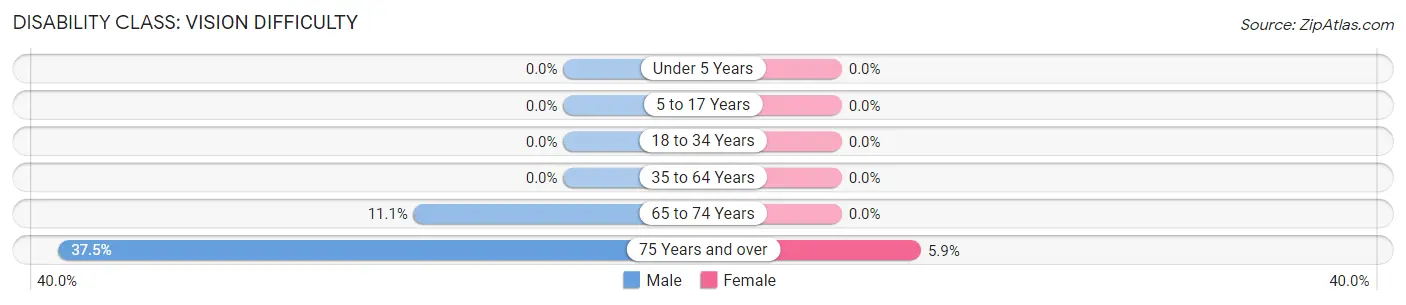
| Age Bracket | Male | Female |
| Under 5 Years | 0 (0.0%) | 0 (0.0%) |
| 5 to 17 Years | 0 (0.0%) | 0 (0.0%) |
| 18 to 34 Years | 0 (0.0%) | 0 (0.0%) |
| 35 to 64 Years | 0 (0.0%) | 0 (0.0%) |
| 65 to 74 Years | 1 (11.1%) | 0 (0.0%) |
| 75 Years and over | 3 (37.5%) | 1 (5.9%) |
Disability Class: Cognitive Difficulty
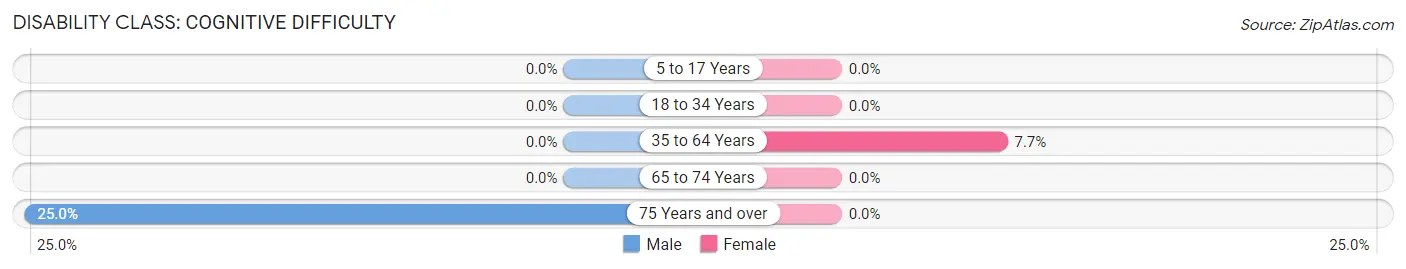
| Age Bracket | Male | Female |
| 5 to 17 Years | 0 (0.0%) | 0 (0.0%) |
| 18 to 34 Years | 0 (0.0%) | 0 (0.0%) |
| 35 to 64 Years | 0 (0.0%) | 2 (7.7%) |
| 65 to 74 Years | 0 (0.0%) | 0 (0.0%) |
| 75 Years and over | 2 (25.0%) | 0 (0.0%) |
Disability Class: Ambulatory Difficulty
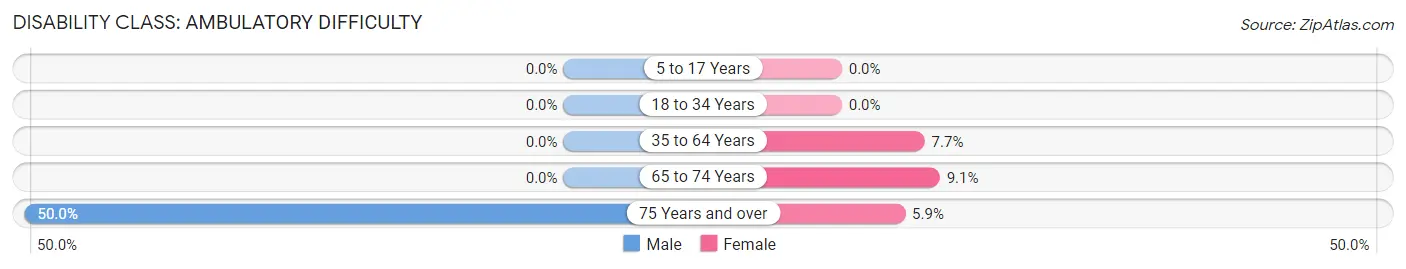
| Age Bracket | Male | Female |
| 5 to 17 Years | 0 (0.0%) | 0 (0.0%) |
| 18 to 34 Years | 0 (0.0%) | 0 (0.0%) |
| 35 to 64 Years | 0 (0.0%) | 2 (7.7%) |
| 65 to 74 Years | 0 (0.0%) | 1 (9.1%) |
| 75 Years and over | 4 (50.0%) | 1 (5.9%) |
Disability Class: Self-Care Difficulty

| Age Bracket | Male | Female |
| 5 to 17 Years | 0 (0.0%) | 0 (0.0%) |
| 18 to 34 Years | 0 (0.0%) | 0 (0.0%) |
| 35 to 64 Years | 0 (0.0%) | 2 (7.7%) |
| 65 to 74 Years | 0 (0.0%) | 0 (0.0%) |
| 75 Years and over | 2 (25.0%) | 0 (0.0%) |
Technology Access in Lake Bronson
Computing Device Access in Lake Bronson
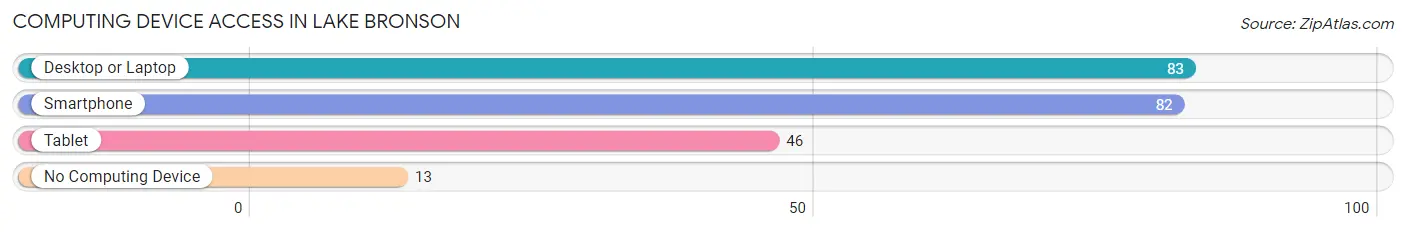
| Device Type | # Households | % Households |
| Desktop or Laptop | 83 | 75.4% |
| Smartphone | 82 | 74.6% |
| Tablet | 46 | 41.8% |
| No Computing Device | 13 | 11.8% |
| Total | 110 | 100.0% |
Internet Access in Lake Bronson
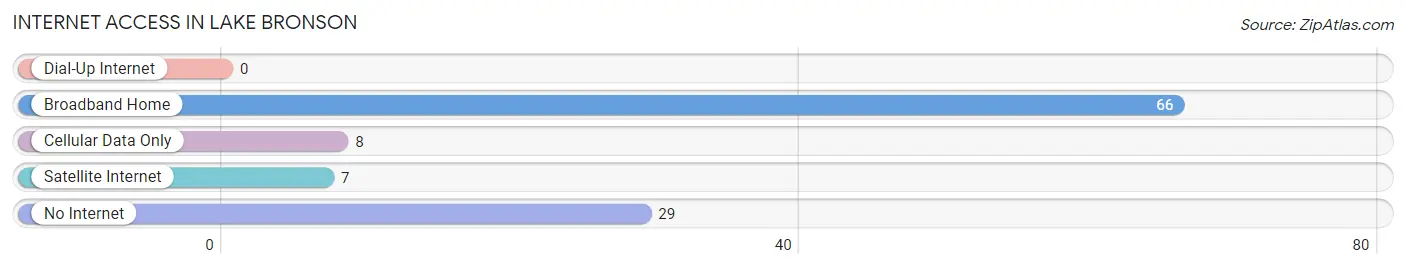
| Internet Type | # Households | % Households |
| Dial-Up Internet | 0 | 0.0% |
| Broadband Home | 66 | 60.0% |
| Cellular Data Only | 8 | 7.3% |
| Satellite Internet | 7 | 6.4% |
| No Internet | 29 | 26.4% |
| Total | 110 | 100.0% |
Lake Bronson Summary
Lake Bronson is a small city located in Kittson County, Minnesota. It is situated on the banks of the Red River, which forms the border between Minnesota and North Dakota. The city has a population of approximately 500 people and is located about 30 miles south of the Canadian border.
History
The area around Lake Bronson was first settled in the late 1800s by Norwegian immigrants. The first settlers were attracted to the area by the abundance of timber and the potential for farming. The first post office was established in 1883 and the town was officially incorporated in 1887.
The city was named after the nearby lake, which was named after the first settler in the area, John Bronson. The lake was originally known as Bronson Lake, but the name was changed to Lake Bronson in 1887.
The city grew slowly over the years, but it was not until the 1950s that it began to experience significant growth. This was due to the construction of the Red River Valley Railroad, which connected the city to the rest of the state. The railroad also brought in new businesses and industries, which helped to spur the city’s growth.
Geography
Lake Bronson is located in the Red River Valley, which is a flat, fertile plain that stretches from the Canadian border to the Dakotas. The city is situated on the banks of the Red River, which forms the border between Minnesota and North Dakota. The city is surrounded by rolling hills and forests, and is located about 30 miles south of the Canadian border.
The climate in Lake Bronson is typical of the northern Midwest, with cold winters and hot summers. The average temperature in the winter is around 20 degrees Fahrenheit, while the average temperature in the summer is around 70 degrees Fahrenheit.
Economy
The economy of Lake Bronson is largely based on agriculture and tourism. The city is home to several farms, which produce a variety of crops, including wheat, corn, soybeans, and hay. The city is also home to several tourist attractions, including the Lake Bronson State Park, which offers camping, fishing, and other outdoor activities.
The city is also home to several small businesses, including restaurants, retail stores, and service providers. The city is also home to several manufacturing companies, which produce a variety of products, including furniture, clothing, and electronics.
Demographics
As of the 2010 census, the population of Lake Bronson was 498 people. The racial makeup of the city was 97.6% White, 0.2% African American, 0.2% Native American, 0.2% Asian, 0.2% from other races, and 1.8% from two or more races. The median household income was $41,250, and the median family income was $48,750.
Conclusion
Lake Bronson is a small city located in Kittson County, Minnesota. It is situated on the banks of the Red River, which forms the border between Minnesota and North Dakota. The city has a population of approximately 500 people and is located about 30 miles south of the Canadian border. The economy of Lake Bronson is largely based on agriculture and tourism, and the city is home to several small businesses, including restaurants, retail stores, and service providers. The racial makeup of the city is predominantly White, with a small percentage of African American, Native American, and Asian residents.
Common Questions
What is Per Capita Income in Lake Bronson?
Per Capita income in Lake Bronson is $33,716.
What is the Median Family Income in Lake Bronson?
Median Family Income in Lake Bronson is $77,813.
What is the Median Household income in Lake Bronson?
Median Household Income in Lake Bronson is $52,614.
What is Income or Wage Gap in Lake Bronson?
Income or Wage Gap in Lake Bronson is 1.1%.
Women in Lake Bronson earn 98.9 cents for every dollar earned by a man.
What is Inequality or Gini Index in Lake Bronson?
Inequality or Gini Index in Lake Bronson is 0.35.
What is the Total Population of Lake Bronson?
Total Population of Lake Bronson is 170.
What is the Total Male Population of Lake Bronson?
Total Male Population of Lake Bronson is 88.
What is the Total Female Population of Lake Bronson?
Total Female Population of Lake Bronson is 82.
What is the Ratio of Males per 100 Females in Lake Bronson?
There are 107.32 Males per 100 Females in Lake Bronson.
What is the Ratio of Females per 100 Males in Lake Bronson?
There are 93.18 Females per 100 Males in Lake Bronson.
What is the Median Population Age in Lake Bronson?
Median Population Age in Lake Bronson is 44.0 Years.
What is the Average Family Size in Lake Bronson
Average Family Size in Lake Bronson is 2.3 People.
What is the Average Household Size in Lake Bronson
Average Household Size in Lake Bronson is 1.5 People.
How Large is the Labor Force in Lake Bronson?
There are 132 People in the Labor Forcein in Lake Bronson.
What is the Percentage of People in the Labor Force in Lake Bronson?
80.0% of People are in the Labor Force in Lake Bronson.
What is the Unemployment Rate in Lake Bronson?
Unemployment Rate in Lake Bronson is 22.7%.