Kiester, MN Map & Demographics
Kiester Map
Kiester Overview
$20,146
PER CAPITA INCOME
$45,000
AVG FAMILY INCOME
$44,091
AVG HOUSEHOLD INCOME
1.5%
WAGE / INCOME GAP [ % ]
98.5¢/ $1
WAGE / INCOME GAP [ $ ]
$9,509
FAMILY INCOME DEFICIT
0.38
INEQUALITY / GINI INDEX
617
TOTAL POPULATION
316
MALE POPULATION
301
FEMALE POPULATION
104.98
MALES / 100 FEMALES
95.25
FEMALES / 100 MALES
41.8
MEDIAN AGE
2.6
AVG FAMILY SIZE
2.4
AVG HOUSEHOLD SIZE
288
LABOR FORCE [ PEOPLE ]
60.0%
PERCENT IN LABOR FORCE
11.5%
UNEMPLOYMENT RATE
Kiester Zip Codes
Kiester Area Codes
Income in Kiester
Income Overview in Kiester
Per Capita Income in Kiester is $20,146, while median incomes of families and households are $45,000 and $44,091 respectively.
| Characteristic | Number | Measure |
| Per Capita Income | 617 | $20,146 |
| Median Family Income | 190 | $45,000 |
| Mean Family Income | 190 | $52,263 |
| Median Household Income | 260 | $44,091 |
| Mean Household Income | 260 | $49,305 |
| Income Deficit | 190 | $9,509 |
| Wage / Income Gap (%) | 617 | 1.47% |
| Wage / Income Gap ($) | 617 | 98.53¢ per $1 |
| Gini / Inequality Index | 617 | 0.38 |
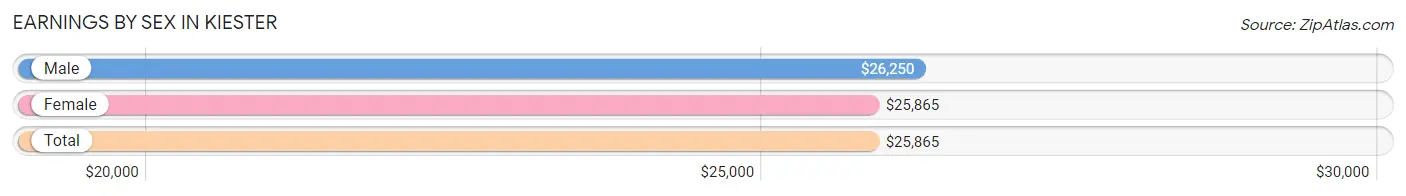
Earnings by Sex in Kiester
Average Earnings in Kiester are $25,865, $26,250 for men and $25,865 for women, a difference of 1.5%.
| Sex | Number | Average Earnings |
| Male | 156 (53.2%) | $26,250 |
| Female | 137 (46.8%) | $25,865 |
| Total | 293 (100.0%) | $25,865 |
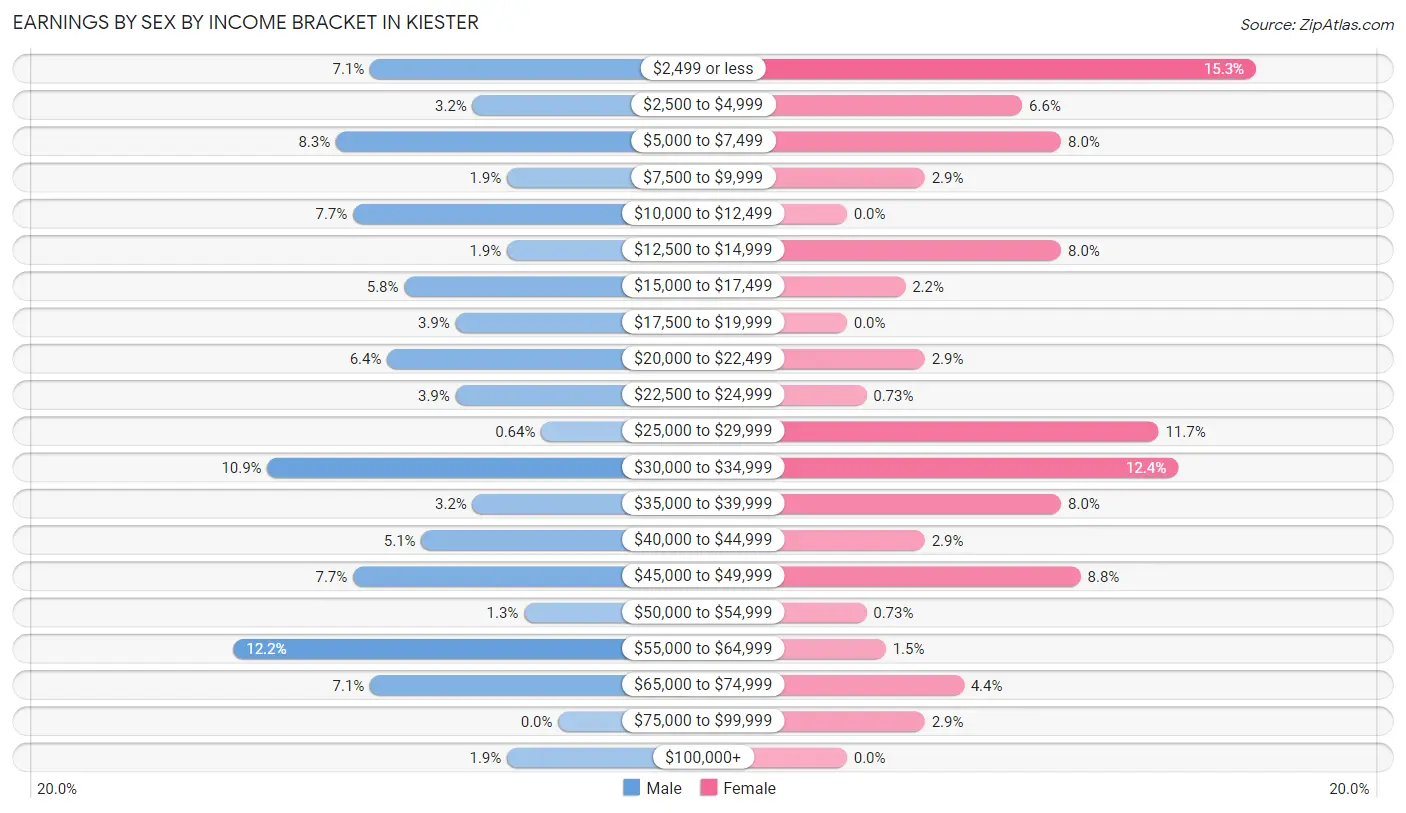
Earnings by Sex by Income Bracket in Kiester
The most common earnings brackets in Kiester are $55,000 to $64,999 for men (19 | 12.2%) and $2,499 or less for women (21 | 15.3%).
| Income | Male | Female |
| $2,499 or less | 11 (7.0%) | 21 (15.3%) |
| $2,500 to $4,999 | 5 (3.2%) | 9 (6.6%) |
| $5,000 to $7,499 | 13 (8.3%) | 11 (8.0%) |
| $7,500 to $9,999 | 3 (1.9%) | 4 (2.9%) |
| $10,000 to $12,499 | 12 (7.7%) | 0 (0.0%) |
| $12,500 to $14,999 | 3 (1.9%) | 11 (8.0%) |
| $15,000 to $17,499 | 9 (5.8%) | 3 (2.2%) |
| $17,500 to $19,999 | 6 (3.8%) | 0 (0.0%) |
| $20,000 to $22,499 | 10 (6.4%) | 4 (2.9%) |
| $22,500 to $24,999 | 6 (3.8%) | 1 (0.7%) |
| $25,000 to $29,999 | 1 (0.6%) | 16 (11.7%) |
| $30,000 to $34,999 | 17 (10.9%) | 17 (12.4%) |
| $35,000 to $39,999 | 5 (3.2%) | 11 (8.0%) |
| $40,000 to $44,999 | 8 (5.1%) | 4 (2.9%) |
| $45,000 to $49,999 | 12 (7.7%) | 12 (8.8%) |
| $50,000 to $54,999 | 2 (1.3%) | 1 (0.7%) |
| $55,000 to $64,999 | 19 (12.2%) | 2 (1.5%) |
| $65,000 to $74,999 | 11 (7.0%) | 6 (4.4%) |
| $75,000 to $99,999 | 0 (0.0%) | 4 (2.9%) |
| $100,000+ | 3 (1.9%) | 0 (0.0%) |
| Total | 156 (100.0%) | 137 (100.0%) |
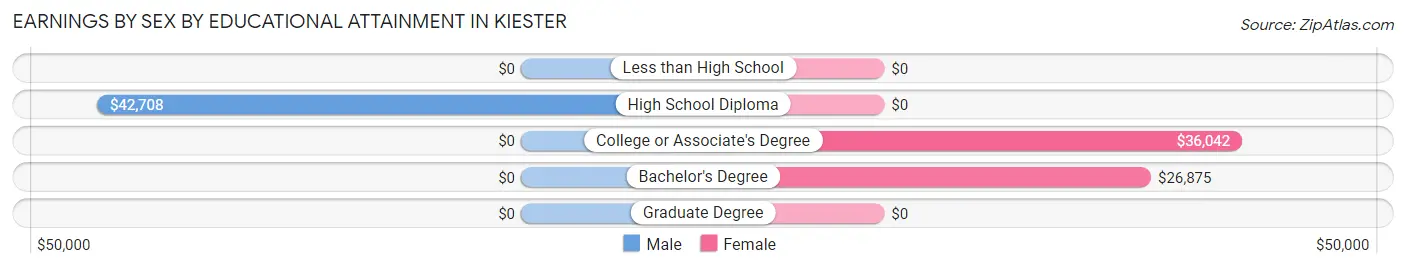
Earnings by Sex by Educational Attainment in Kiester
Average earnings in Kiester are $34,886 for men and $27,083 for women, a difference of 22.4%. Men with an educational attainment of high school diploma enjoy the highest average annual earnings of $42,708, while those with high school diploma education earn the least with $42,708. Women with an educational attainment of college or associate's degree earn the most with the average annual earnings of $36,042, while those with bachelor's degree education have the smallest earnings of $26,875.
| Educational Attainment | Male Income | Female Income |
| Less than High School | - | - |
| High School Diploma | $42,708 | $0 |
| College or Associate's Degree | - | - |
| Bachelor's Degree | - | - |
| Graduate Degree | - | - |
| Total | $34,886 | $27,083 |
Family Income in Kiester
Family Income Brackets in Kiester
According to the Kiester family income data, there are 43 families falling into the $35,000 to $49,999 income range, which is the most common income bracket and makes up 22.6% of all families. Conversely, the less than $10,000 income bracket is the least frequent group with only 3 families (1.6%) belonging to this category.
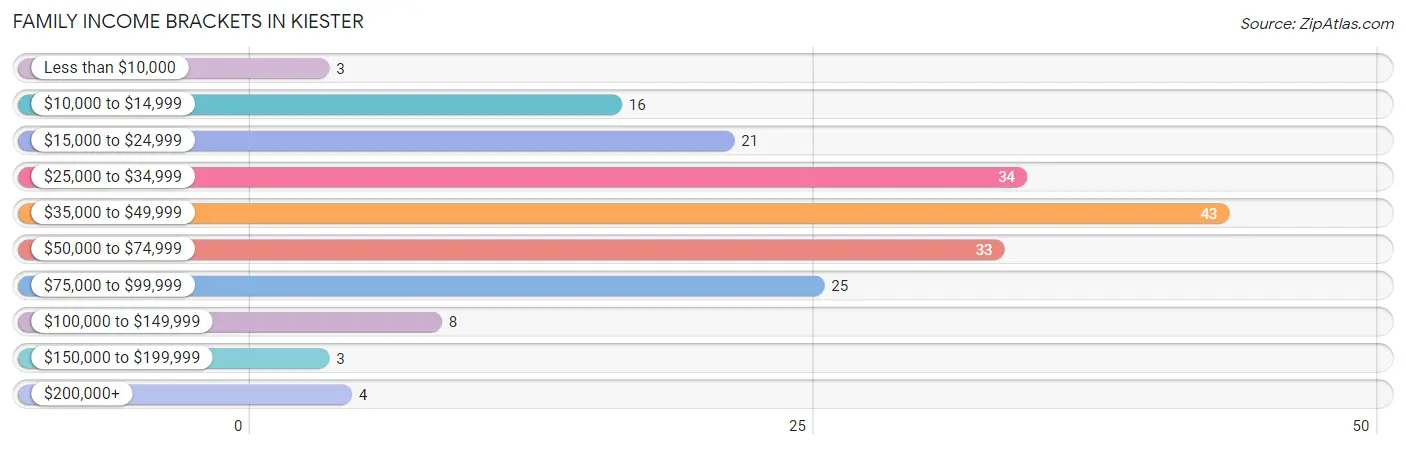
| Income Bracket | # Families | % Families |
| Less than $10,000 | 3 | 1.6% |
| $10,000 to $14,999 | 16 | 8.4% |
| $15,000 to $24,999 | 21 | 11.1% |
| $25,000 to $34,999 | 34 | 17.9% |
| $35,000 to $49,999 | 43 | 22.6% |
| $50,000 to $74,999 | 33 | 17.4% |
| $75,000 to $99,999 | 25 | 13.2% |
| $100,000 to $149,999 | 8 | 4.2% |
| $150,000 to $199,999 | 3 | 1.6% |
| $200,000+ | 4 | 2.1% |
Family Income by Famaliy Size in Kiester
4-person families (8 | 4.2%) account for the highest median family income in Kiester with $70,000 per family, while 2-person families (101 | 53.2%) have the highest median income of $24,602 per family member.
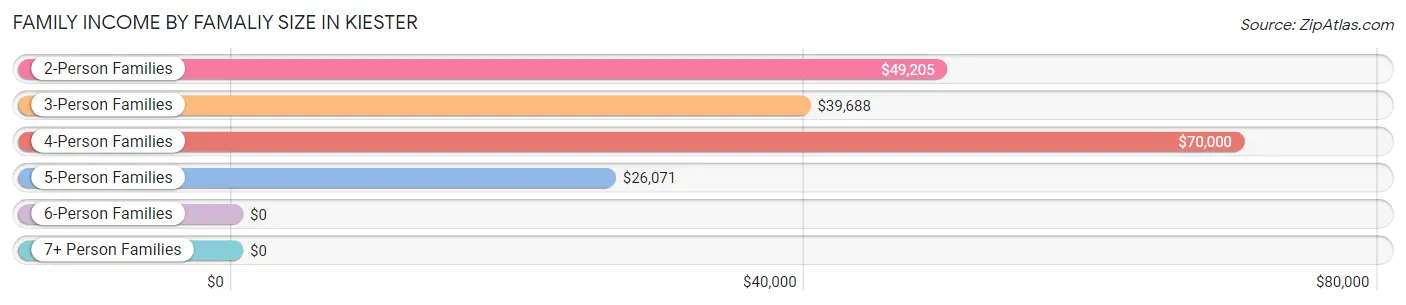
| Income Bracket | # Families | Median Income |
| 2-Person Families | 101 (53.2%) | $49,205 |
| 3-Person Families | 43 (22.6%) | $39,688 |
| 4-Person Families | 8 (4.2%) | $70,000 |
| 5-Person Families | 38 (20.0%) | $26,071 |
| 6-Person Families | 0 (0.0%) | $0 |
| 7+ Person Families | 0 (0.0%) | $0 |
| Total | 190 (100.0%) | $45,000 |
Family Income by Number of Earners in Kiester
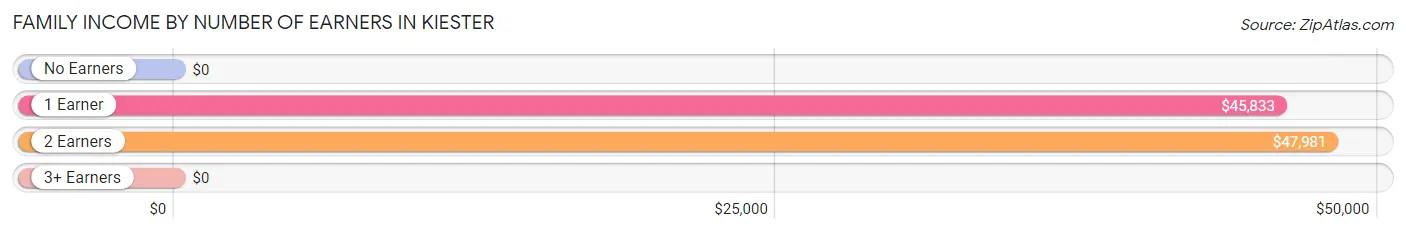
| Number of Earners | # Families | Median Income |
| No Earners | 40 (21.0%) | $0 |
| 1 Earner | 46 (24.2%) | $45,833 |
| 2 Earners | 91 (47.9%) | $47,981 |
| 3+ Earners | 13 (6.8%) | $0 |
| Total | 190 (100.0%) | $45,000 |
Household Income in Kiester
Household Income Brackets in Kiester
With 68 households falling in the category, the $35,000 to $49,999 income range is the most frequent in Kiester, accounting for 26.2% of all households. In contrast, only 3 households (1.1%) fall into the $150,000 to $199,999 income bracket, making it the least populous group.
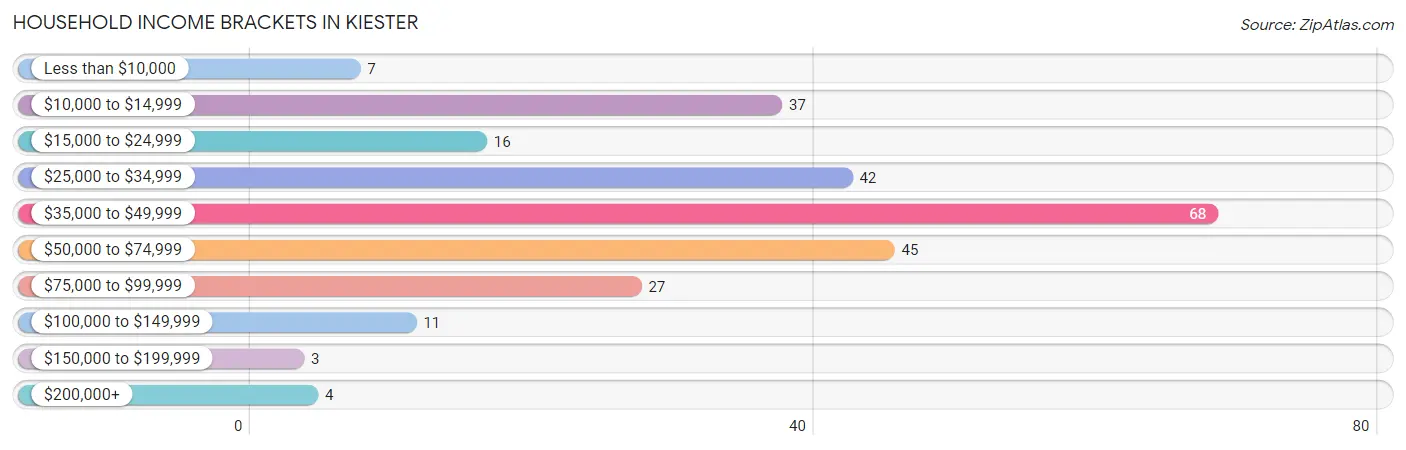
| Income Bracket | # Households | % Households |
| Less than $10,000 | 7 | 2.7% |
| $10,000 to $14,999 | 37 | 14.2% |
| $15,000 to $24,999 | 16 | 6.2% |
| $25,000 to $34,999 | 42 | 16.2% |
| $35,000 to $49,999 | 68 | 26.2% |
| $50,000 to $74,999 | 45 | 17.3% |
| $75,000 to $99,999 | 27 | 10.4% |
| $100,000 to $149,999 | 11 | 4.2% |
| $150,000 to $199,999 | 3 | 1.2% |
| $200,000+ | 4 | 1.5% |
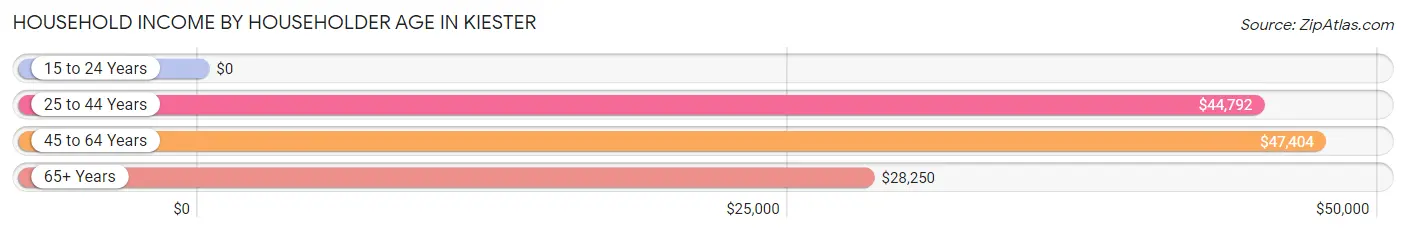
Household Income by Householder Age in Kiester
The median household income in Kiester is $44,091, with the highest median household income of $47,404 found in the 45 to 64 years age bracket for the primary householder. A total of 91 households (35.0%) fall into this category. Meanwhile, the 15 to 24 years age bracket for the primary householder has the lowest median household income of $0, with 7 households (2.7%) in this group.
| Income Bracket | # Households | Median Income |
| 15 to 24 Years | 7 (2.7%) | $0 |
| 25 to 44 Years | 83 (31.9%) | $44,792 |
| 45 to 64 Years | 91 (35.0%) | $47,404 |
| 65+ Years | 79 (30.4%) | $28,250 |
| Total | 260 (100.0%) | $44,091 |
Poverty in Kiester
Income Below Poverty by Sex and Age in Kiester
With 39.2% poverty level for males and 32.1% for females among the residents of Kiester, 6 to 11 year old males and 15 year old females are the most vulnerable to poverty, with 26 males (92.9%) and 12 females (70.6%) in their respective age groups living below the poverty level.
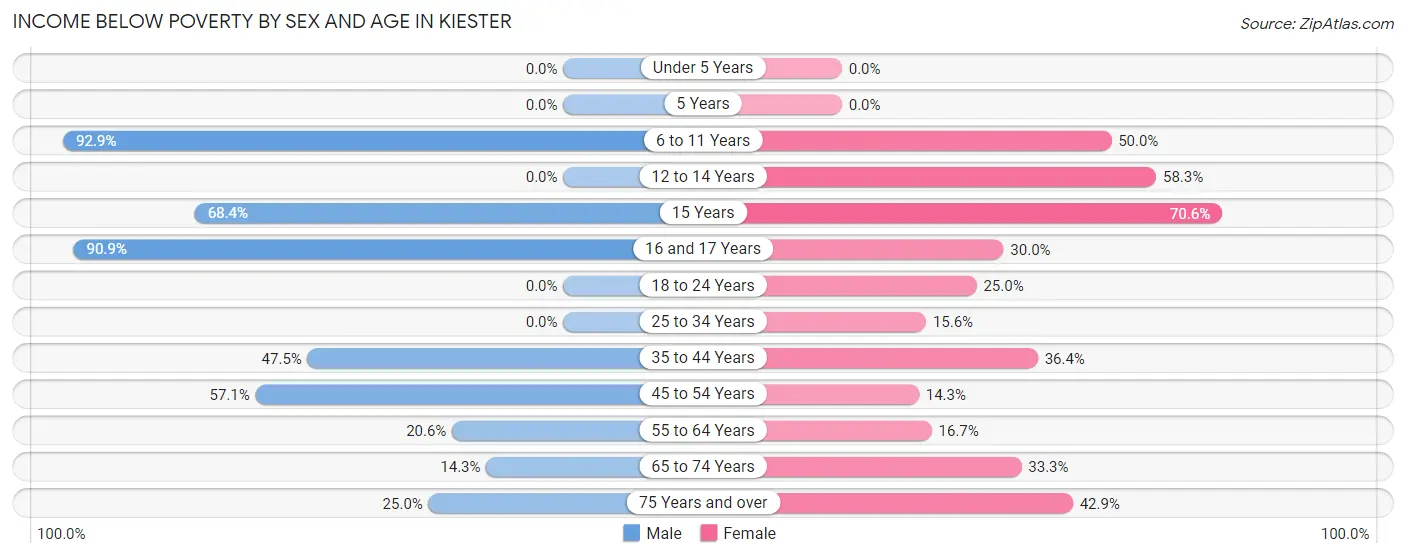
| Age Bracket | Male | Female |
| Under 5 Years | 0 (0.0%) | 0 (0.0%) |
| 5 Years | 0 (0.0%) | 0 (0.0%) |
| 6 to 11 Years | 26 (92.9%) | 7 (50.0%) |
| 12 to 14 Years | 0 (0.0%) | 14 (58.3%) |
| 15 Years | 13 (68.4%) | 12 (70.6%) |
| 16 and 17 Years | 20 (90.9%) | 3 (30.0%) |
| 18 to 24 Years | 0 (0.0%) | 5 (25.0%) |
| 25 to 34 Years | 0 (0.0%) | 5 (15.6%) |
| 35 to 44 Years | 28 (47.5%) | 16 (36.4%) |
| 45 to 54 Years | 12 (57.1%) | 4 (14.3%) |
| 55 to 64 Years | 13 (20.6%) | 5 (16.7%) |
| 65 to 74 Years | 3 (14.3%) | 16 (33.3%) |
| 75 Years and over | 6 (25.0%) | 9 (42.9%) |
| Total | 121 (39.2%) | 96 (32.1%) |
Income Above Poverty by Sex and Age in Kiester
According to the poverty statistics in Kiester, males aged under 5 years and females aged under 5 years are the age groups that are most secure financially, with 100.0% of males and 100.0% of females in these age groups living above the poverty line.
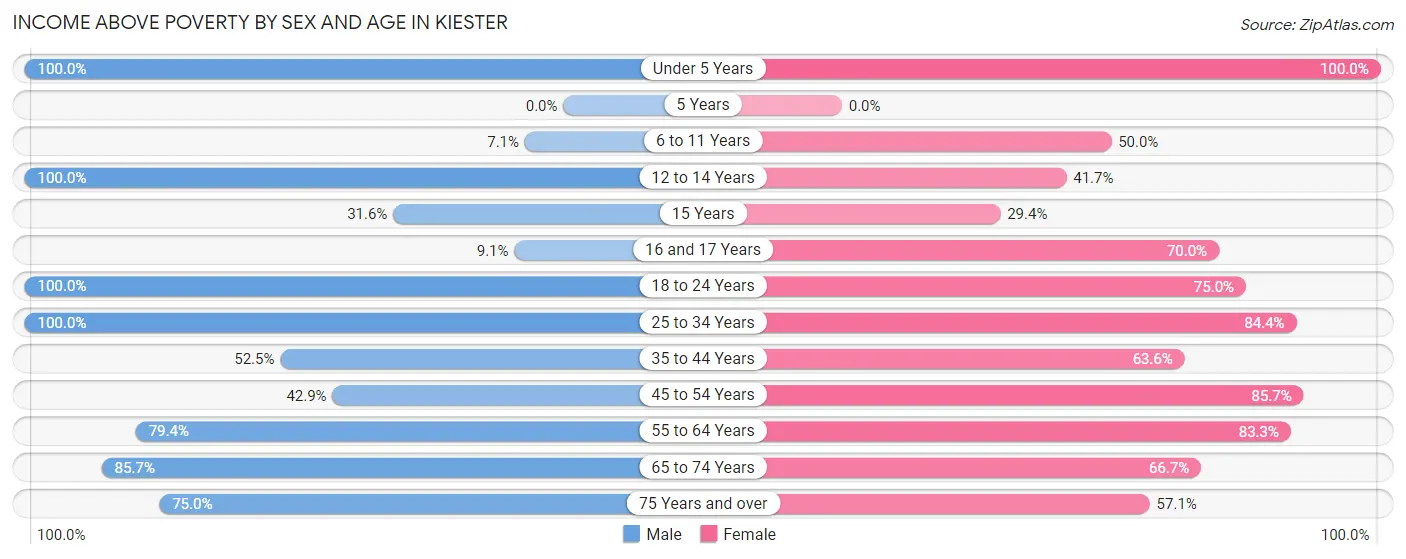
| Age Bracket | Male | Female |
| Under 5 Years | 10 (100.0%) | 11 (100.0%) |
| 5 Years | 0 (0.0%) | 0 (0.0%) |
| 6 to 11 Years | 2 (7.1%) | 7 (50.0%) |
| 12 to 14 Years | 5 (100.0%) | 10 (41.7%) |
| 15 Years | 6 (31.6%) | 5 (29.4%) |
| 16 and 17 Years | 2 (9.1%) | 7 (70.0%) |
| 18 to 24 Years | 13 (100.0%) | 15 (75.0%) |
| 25 to 34 Years | 24 (100.0%) | 27 (84.4%) |
| 35 to 44 Years | 31 (52.5%) | 28 (63.6%) |
| 45 to 54 Years | 9 (42.9%) | 24 (85.7%) |
| 55 to 64 Years | 50 (79.4%) | 25 (83.3%) |
| 65 to 74 Years | 18 (85.7%) | 32 (66.7%) |
| 75 Years and over | 18 (75.0%) | 12 (57.1%) |
| Total | 188 (60.8%) | 203 (67.9%) |
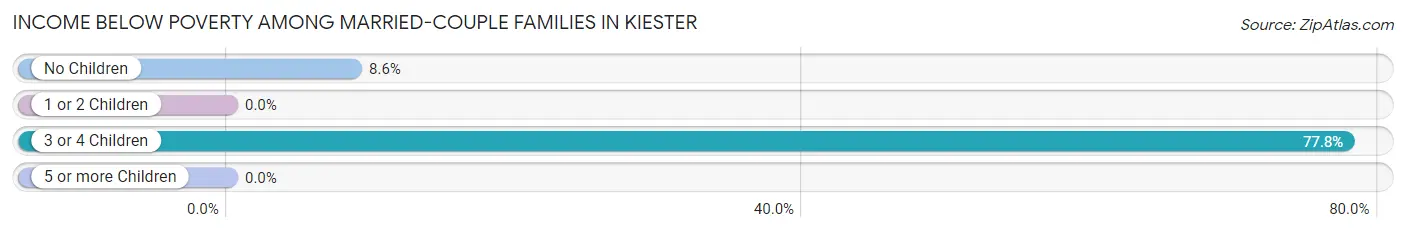
Income Below Poverty Among Married-Couple Families in Kiester
The poverty statistics for married-couple families in Kiester show that 24.3% or 28 of the total 115 families live below the poverty line. Families with 3 or 4 children have the highest poverty rate of 77.8%, comprising of 21 families. On the other hand, families with 1 or 2 children have the lowest poverty rate of 0.0%, which includes 0 families.
| Children | Above Poverty | Below Poverty |
| No Children | 74 (91.4%) | 7 (8.6%) |
| 1 or 2 Children | 7 (100.0%) | 0 (0.0%) |
| 3 or 4 Children | 6 (22.2%) | 21 (77.8%) |
| 5 or more Children | 0 (0.0%) | 0 (0.0%) |
| Total | 87 (75.6%) | 28 (24.3%) |
Income Below Poverty Among Single-Parent Households in Kiester
According to the poverty data in Kiester, 61.1% or 22 single-father households and 15.4% or 6 single-mother households are living below the poverty line. Among single-father households, those with 3 or 4 children have the highest poverty rate, with 10 households (100.0%) experiencing poverty. Likewise, among single-mother households, those with no children have the highest poverty rate, with 4 households (28.6%) falling below the poverty line.
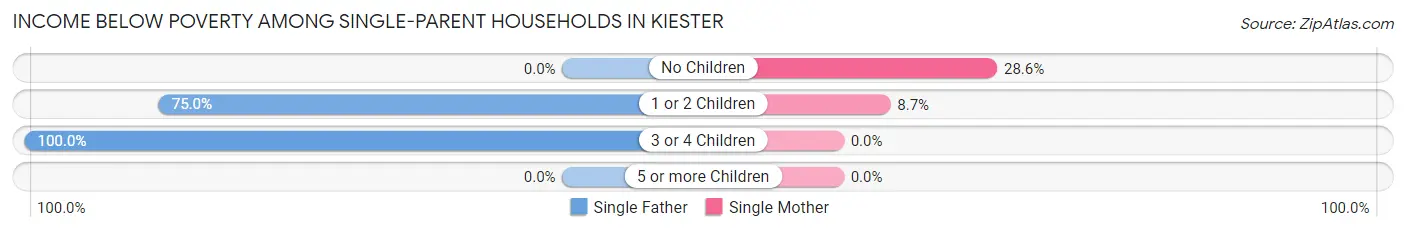
| Children | Single Father | Single Mother |
| No Children | 0 (0.0%) | 4 (28.6%) |
| 1 or 2 Children | 12 (75.0%) | 2 (8.7%) |
| 3 or 4 Children | 10 (100.0%) | 0 (0.0%) |
| 5 or more Children | 0 (0.0%) | 0 (0.0%) |
| Total | 22 (61.1%) | 6 (15.4%) |
Income Below Poverty Among Married-Couple vs Single-Parent Households in Kiester
The poverty data for Kiester shows that 28 of the married-couple family households (24.3%) and 28 of the single-parent households (37.3%) are living below the poverty level. Within the married-couple family households, those with 3 or 4 children have the highest poverty rate, with 21 households (77.8%) falling below the poverty line. Among the single-parent households, those with 3 or 4 children have the highest poverty rate, with 10 household (83.3%) living below poverty.
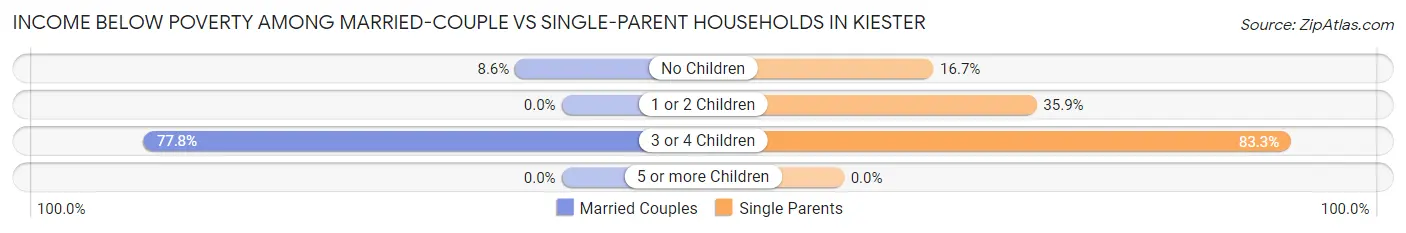
| Children | Married-Couple Families | Single-Parent Households |
| No Children | 7 (8.6%) | 4 (16.7%) |
| 1 or 2 Children | 0 (0.0%) | 14 (35.9%) |
| 3 or 4 Children | 21 (77.8%) | 10 (83.3%) |
| 5 or more Children | 0 (0.0%) | 0 (0.0%) |
| Total | 28 (24.3%) | 28 (37.3%) |
Race in Kiester
The most populous races in Kiester are White / Caucasian (576 | 93.3%), Hispanic or Latino (55 | 8.9%), and Two or more Races (35 | 5.7%).
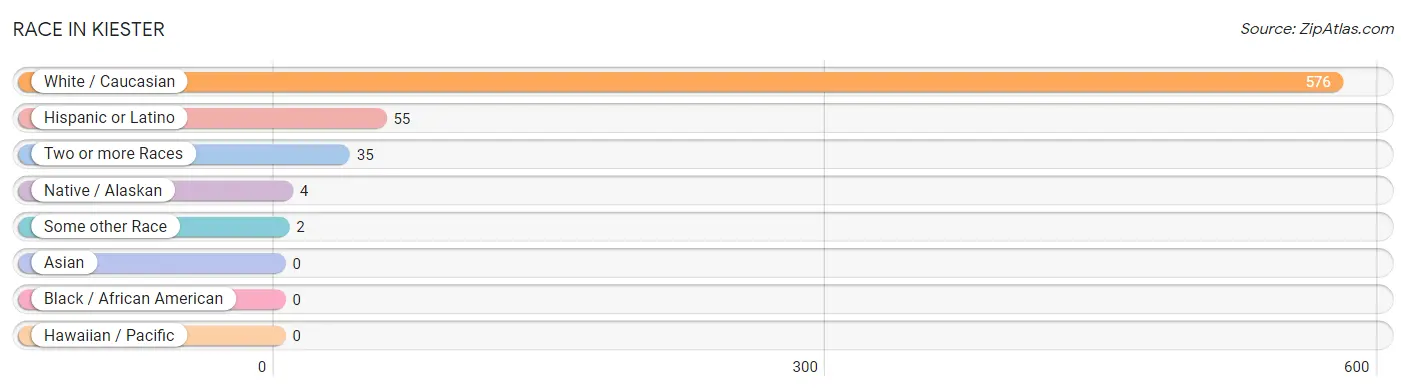
| Race | # Population | % Population |
| Asian | 0 | 0.0% |
| Black / African American | 0 | 0.0% |
| Hawaiian / Pacific | 0 | 0.0% |
| Hispanic or Latino | 55 | 8.9% |
| Native / Alaskan | 4 | 0.6% |
| White / Caucasian | 576 | 93.3% |
| Two or more Races | 35 | 5.7% |
| Some other Race | 2 | 0.3% |
| Total | 617 | 100.0% |
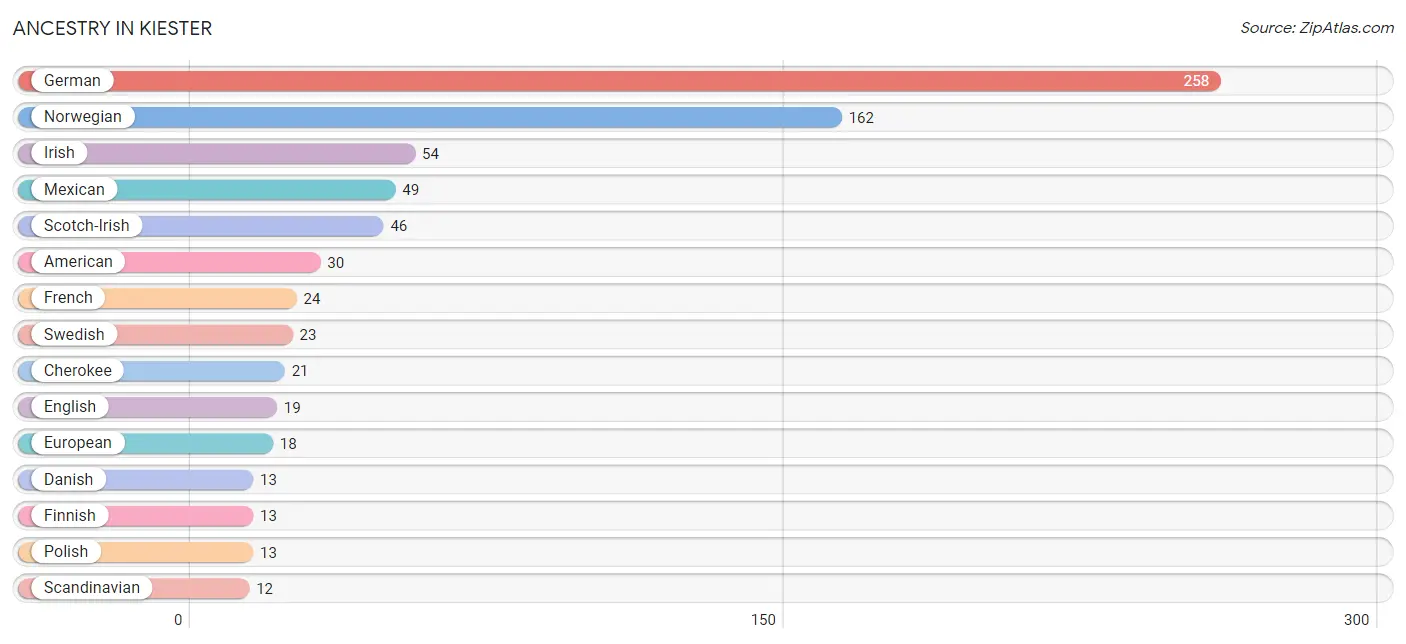
Ancestry in Kiester
The most populous ancestries reported in Kiester are German (258 | 41.8%), Norwegian (162 | 26.3%), Irish (54 | 8.7%), Mexican (49 | 7.9%), and Scotch-Irish (46 | 7.5%), together accounting for 92.2% of all Kiester residents.
| Ancestry | # Population | % Population |
| American | 30 | 4.9% |
| Blackfeet | 4 | 0.6% |
| Cherokee | 21 | 3.4% |
| Chippewa | 4 | 0.6% |
| Cuban | 4 | 0.6% |
| Danish | 13 | 2.1% |
| Dutch | 11 | 1.8% |
| English | 19 | 3.1% |
| European | 18 | 2.9% |
| Finnish | 13 | 2.1% |
| French | 24 | 3.9% |
| French Canadian | 7 | 1.1% |
| German | 258 | 41.8% |
| Irish | 54 | 8.7% |
| Italian | 11 | 1.8% |
| Lithuanian | 5 | 0.8% |
| Mexican | 49 | 7.9% |
| Norwegian | 162 | 26.3% |
| Polish | 13 | 2.1% |
| Puerto Rican | 2 | 0.3% |
| Scandinavian | 12 | 1.9% |
| Scotch-Irish | 46 | 7.5% |
| Scottish | 5 | 0.8% |
| Sioux | 4 | 0.6% |
| Swedish | 23 | 3.7% |
| Welsh | 7 | 1.1% | View All 26 Rows |
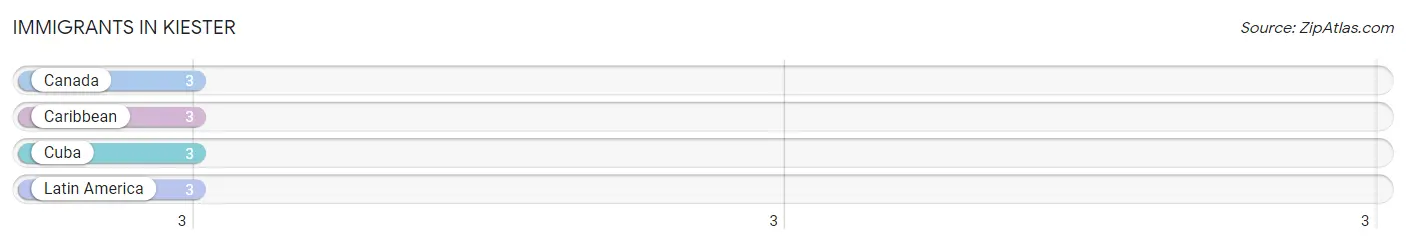
Immigrants in Kiester
The most numerous immigrant groups reported in Kiester came from Canada (3 | 0.5%), Caribbean (3 | 0.5%), Cuba (3 | 0.5%), and Latin America (3 | 0.5%), together accounting for 2.0% of all Kiester residents.
| Immigration Origin | # Population | % Population |
| Canada | 3 | 0.5% |
| Caribbean | 3 | 0.5% |
| Cuba | 3 | 0.5% |
| Latin America | 3 | 0.5% | View All 4 Rows |
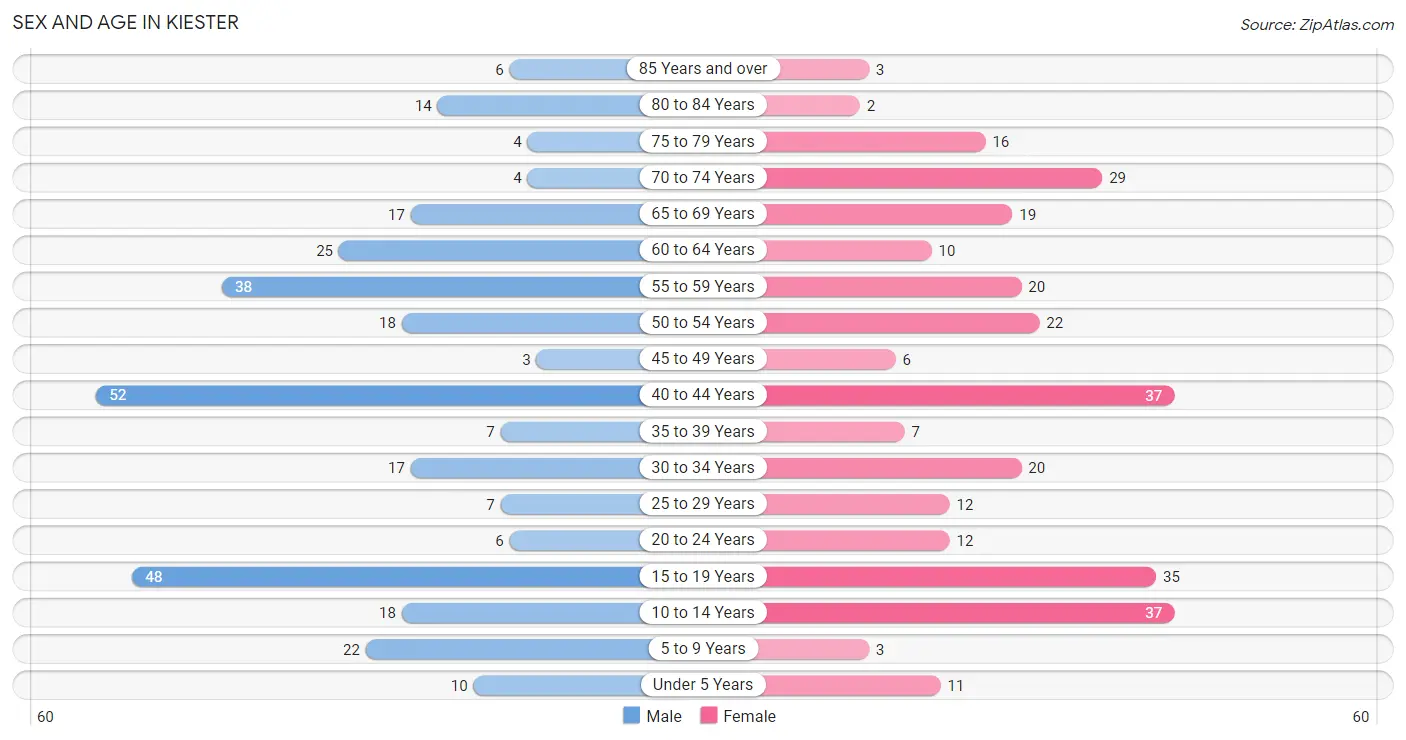
Sex and Age in Kiester
Sex and Age in Kiester
The most populous age groups in Kiester are 40 to 44 Years (52 | 16.5%) for men and 10 to 14 Years (37 | 12.3%) for women.
| Age Bracket | Male | Female |
| Under 5 Years | 10 (3.2%) | 11 (3.6%) |
| 5 to 9 Years | 22 (7.0%) | 3 (1.0%) |
| 10 to 14 Years | 18 (5.7%) | 37 (12.3%) |
| 15 to 19 Years | 48 (15.2%) | 35 (11.6%) |
| 20 to 24 Years | 6 (1.9%) | 12 (4.0%) |
| 25 to 29 Years | 7 (2.2%) | 12 (4.0%) |
| 30 to 34 Years | 17 (5.4%) | 20 (6.6%) |
| 35 to 39 Years | 7 (2.2%) | 7 (2.3%) |
| 40 to 44 Years | 52 (16.5%) | 37 (12.3%) |
| 45 to 49 Years | 3 (0.9%) | 6 (2.0%) |
| 50 to 54 Years | 18 (5.7%) | 22 (7.3%) |
| 55 to 59 Years | 38 (12.0%) | 20 (6.6%) |
| 60 to 64 Years | 25 (7.9%) | 10 (3.3%) |
| 65 to 69 Years | 17 (5.4%) | 19 (6.3%) |
| 70 to 74 Years | 4 (1.3%) | 29 (9.6%) |
| 75 to 79 Years | 4 (1.3%) | 16 (5.3%) |
| 80 to 84 Years | 14 (4.4%) | 2 (0.7%) |
| 85 Years and over | 6 (1.9%) | 3 (1.0%) |
| Total | 316 (100.0%) | 301 (100.0%) |
Families and Households in Kiester
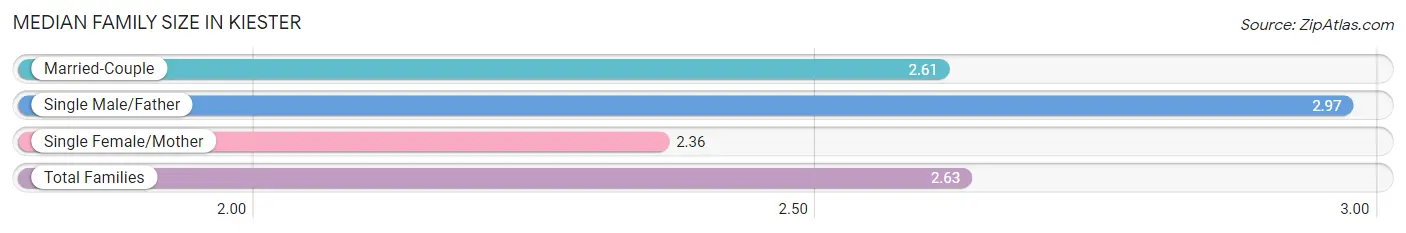
Median Family Size in Kiester
The median family size in Kiester is 2.63 persons per family, with single male/father families (36 | 19.0%) accounting for the largest median family size of 2.97 persons per family. On the other hand, single female/mother families (39 | 20.5%) represent the smallest median family size with 2.36 persons per family.
| Family Type | # Families | Family Size |
| Married-Couple | 115 (60.5%) | 2.61 |
| Single Male/Father | 36 (19.0%) | 2.97 |
| Single Female/Mother | 39 (20.5%) | 2.36 |
| Total Families | 190 (100.0%) | 2.63 |
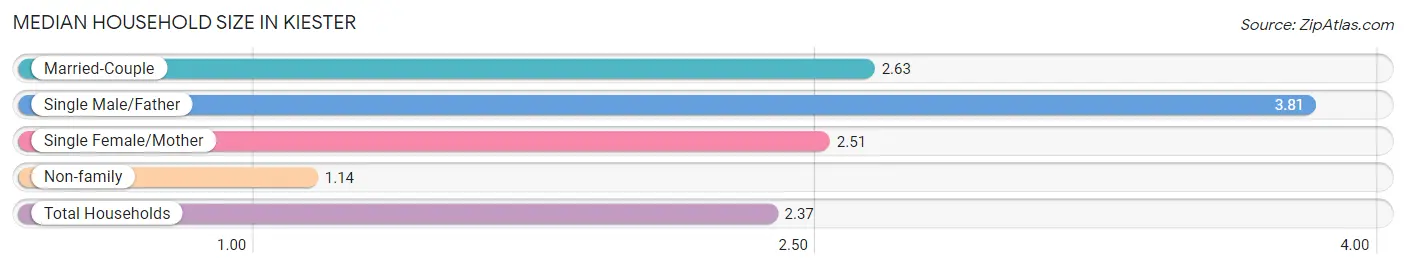
Median Household Size in Kiester
The median household size in Kiester is 2.37 persons per household, with single male/father households (36 | 13.9%) accounting for the largest median household size of 3.81 persons per household. non-family households (70 | 26.9%) represent the smallest median household size with 1.14 persons per household.
| Household Type | # Households | Household Size |
| Married-Couple | 115 (44.2%) | 2.63 |
| Single Male/Father | 36 (13.9%) | 3.81 |
| Single Female/Mother | 39 (15.0%) | 2.51 |
| Non-family | 70 (26.9%) | 1.14 |
| Total Households | 260 (100.0%) | 2.37 |
Household Size by Marriage Status in Kiester
Out of a total of 260 households in Kiester, 190 (73.1%) are family households, while 70 (26.9%) are nonfamily households. The most numerous type of family households are 2-person households, comprising 84, and the most common type of nonfamily households are 1-person households, comprising 63.
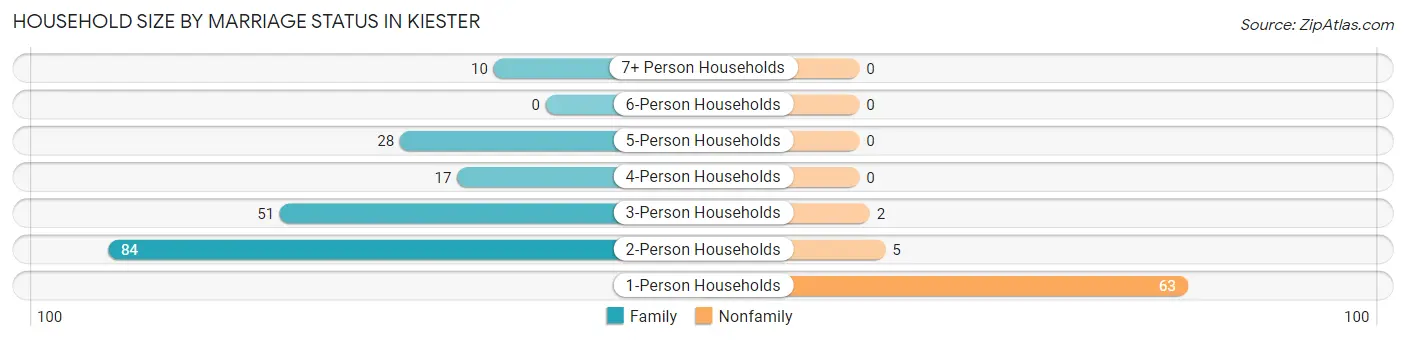
| Household Size | Family Households | Nonfamily Households |
| 1-Person Households | - | 63 (24.2%) |
| 2-Person Households | 84 (32.3%) | 5 (1.9%) |
| 3-Person Households | 51 (19.6%) | 2 (0.8%) |
| 4-Person Households | 17 (6.5%) | 0 (0.0%) |
| 5-Person Households | 28 (10.8%) | 0 (0.0%) |
| 6-Person Households | 0 (0.0%) | 0 (0.0%) |
| 7+ Person Households | 10 (3.8%) | 0 (0.0%) |
| Total | 190 (73.1%) | 70 (26.9%) |
Female Fertility in Kiester
Fertility by Age in Kiester
Average fertility rate in Kiester is 14.0 births per 1,000 women. Women in the age bracket of 20 to 34 years have the highest fertility rate with 45.0 births per 1,000 women. Women in the age bracket of 20 to 34 years acount for 100.0% of all women with births.
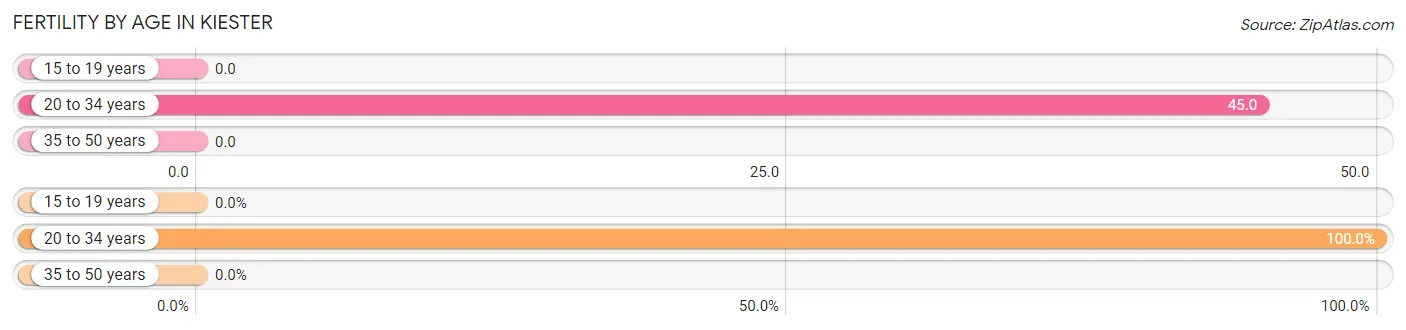
| Age Bracket | Women with Births | Births / 1,000 Women |
| 15 to 19 years | 0 (0.0%) | 0.0 |
| 20 to 34 years | 2 (100.0%) | 45.0 |
| 35 to 50 years | 0 (0.0%) | 0.0 |
| Total | 2 (100.0%) | 14.0 |
Fertility by Age by Marriage Status in Kiester
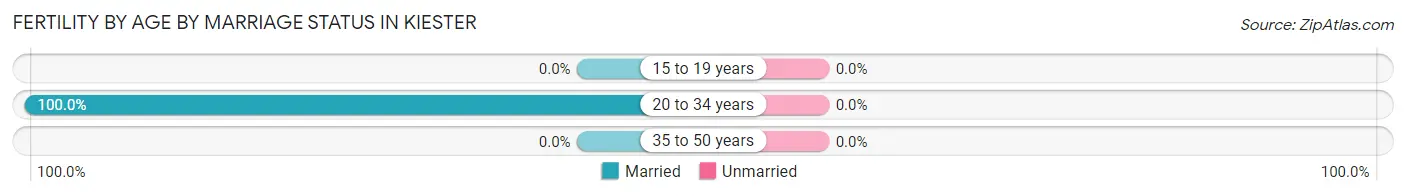
| Age Bracket | Married | Unmarried |
| 15 to 19 years | 0 (0.0%) | 0 (0.0%) |
| 20 to 34 years | 2 (100.0%) | 0 (0.0%) |
| 35 to 50 years | 0 (0.0%) | 0 (0.0%) |
| Total | 2 (100.0%) | 0 (0.0%) |
Fertility by Education in Kiester
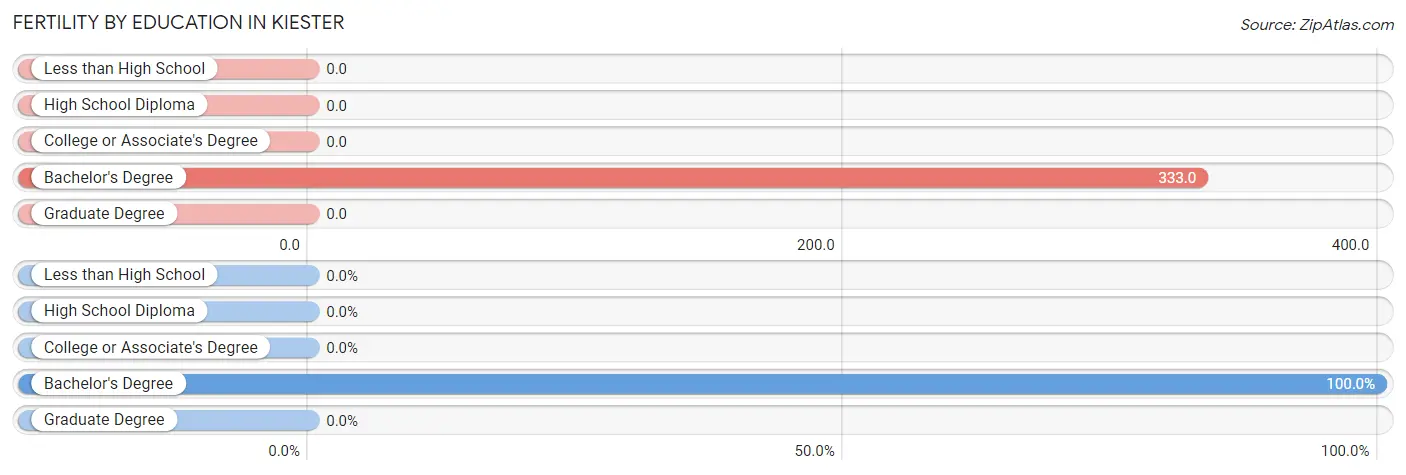
| Educational Attainment | Women with Births | Births / 1,000 Women |
| Less than High School | 0 (0.0%) | 0.0 |
| High School Diploma | 0 (0.0%) | 0.0 |
| College or Associate's Degree | 0 (0.0%) | 0.0 |
| Bachelor's Degree | 2 (100.0%) | 333.0 |
| Graduate Degree | 0 (0.0%) | 0.0 |
| Total | 2 (100.0%) | 14.0 |
Fertility by Education by Marriage Status in Kiester
| Educational Attainment | Married | Unmarried |
| Less than High School | 0 (0.0%) | 0 (0.0%) |
| High School Diploma | 0 (0.0%) | 0 (0.0%) |
| College or Associate's Degree | 0 (0.0%) | 0 (0.0%) |
| Bachelor's Degree | 2 (100.0%) | 0 (0.0%) |
| Graduate Degree | 0 (0.0%) | 0 (0.0%) |
| Total | 2 (100.0%) | 0 (0.0%) |
Employment Characteristics in Kiester
Employment by Class of Employer in Kiester
Among the 253 employed individuals in Kiester, private company employees (188 | 74.3%), not-for-profit organizations (14 | 5.5%), and self-employed (not incorporated) (13 | 5.1%) make up the most common classes of employment.
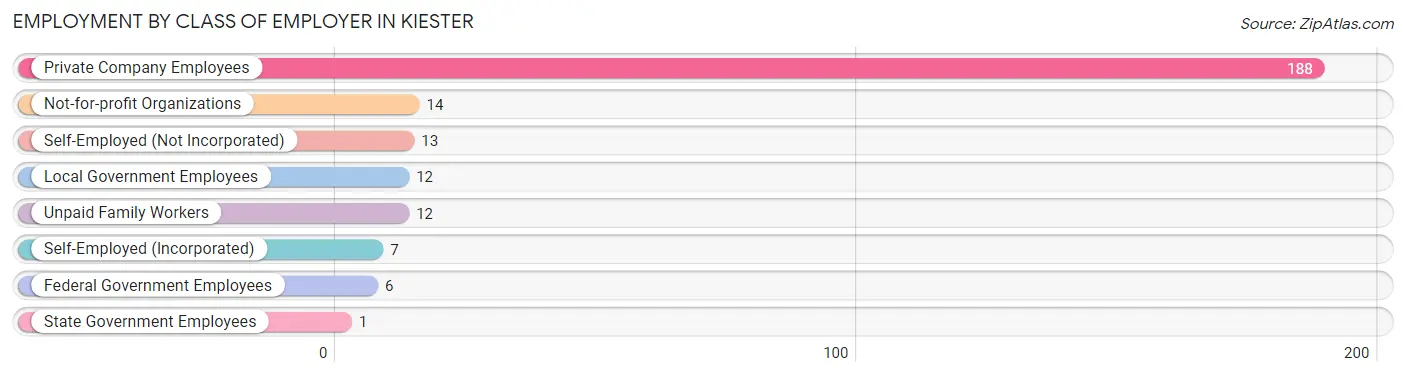
| Employer Class | # Employees | % Employees |
| Private Company Employees | 188 | 74.3% |
| Self-Employed (Incorporated) | 7 | 2.8% |
| Self-Employed (Not Incorporated) | 13 | 5.1% |
| Not-for-profit Organizations | 14 | 5.5% |
| Local Government Employees | 12 | 4.7% |
| State Government Employees | 1 | 0.4% |
| Federal Government Employees | 6 | 2.4% |
| Unpaid Family Workers | 12 | 4.7% |
| Total | 253 | 100.0% |
Employment Status by Age in Kiester
According to the labor force statistics for Kiester, out of the total population over 16 years of age (480), 60.0% or 288 individuals are in the labor force, with 11.5% or 33 of them unemployed. The age group with the highest labor force participation rate is 25 to 29 years, with 100.0% or 19 individuals in the labor force. Within the labor force, the 25 to 29 years age range has the highest percentage of unemployed individuals, with 26.3% or 5 of them being unemployed.
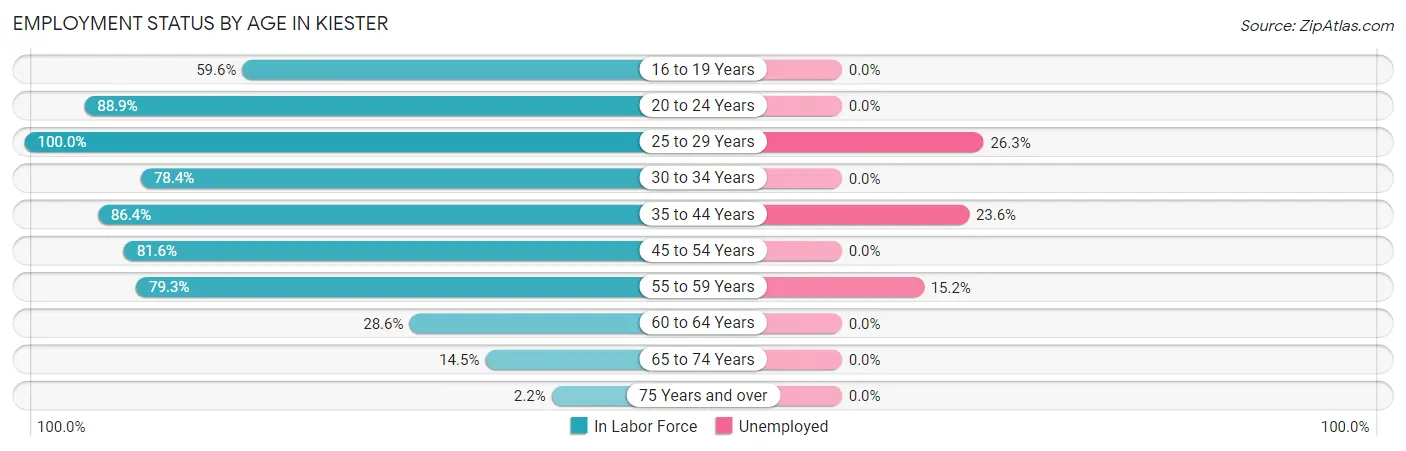
| Age Bracket | In Labor Force | Unemployed |
| 16 to 19 Years | 28 (59.6%) | 0 (0.0%) |
| 20 to 24 Years | 16 (88.9%) | 0 (0.0%) |
| 25 to 29 Years | 19 (100.0%) | 5 (26.3%) |
| 30 to 34 Years | 29 (78.4%) | 0 (0.0%) |
| 35 to 44 Years | 89 (86.4%) | 21 (23.6%) |
| 45 to 54 Years | 40 (81.6%) | 0 (0.0%) |
| 55 to 59 Years | 46 (79.3%) | 7 (15.2%) |
| 60 to 64 Years | 10 (28.6%) | 0 (0.0%) |
| 65 to 74 Years | 10 (14.5%) | 0 (0.0%) |
| 75 Years and over | 1 (2.2%) | 0 (0.0%) |
| Total | 288 (60.0%) | 33 (11.5%) |
Employment Status by Educational Attainment in Kiester
According to labor force statistics for Kiester, 77.4% of individuals (233) out of the total population between 25 and 64 years of age (301) are in the labor force, with 14.2% or 33 of them being unemployed. The group with the highest labor force participation rate are those with the educational attainment of high school diploma, with 79.6% or 109 individuals in the labor force. Within the labor force, individuals with high school diploma education have the highest percentage of unemployment, with 30.3% or 33 of them being unemployed.
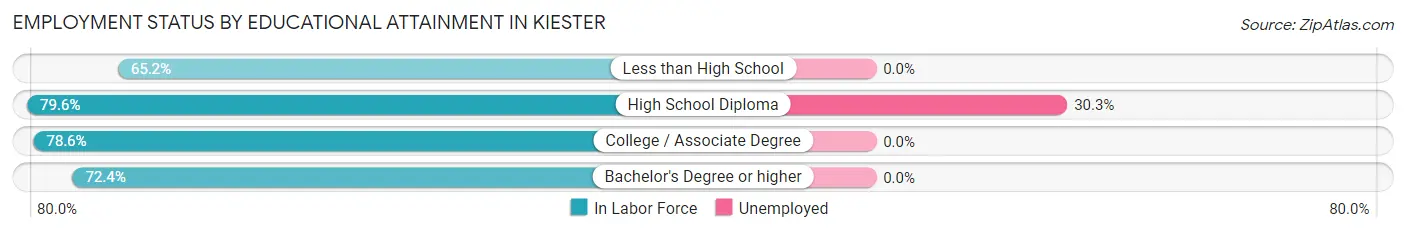
| Educational Attainment | In Labor Force | Unemployed |
| Less than High School | 15 (65.2%) | 0 (0.0%) |
| High School Diploma | 109 (79.6%) | 42 (30.3%) |
| College / Associate Degree | 88 (78.6%) | 0 (0.0%) |
| Bachelor's Degree or higher | 21 (72.4%) | 0 (0.0%) |
| Total | 233 (77.4%) | 43 (14.2%) |
Employment Occupations by Sex in Kiester
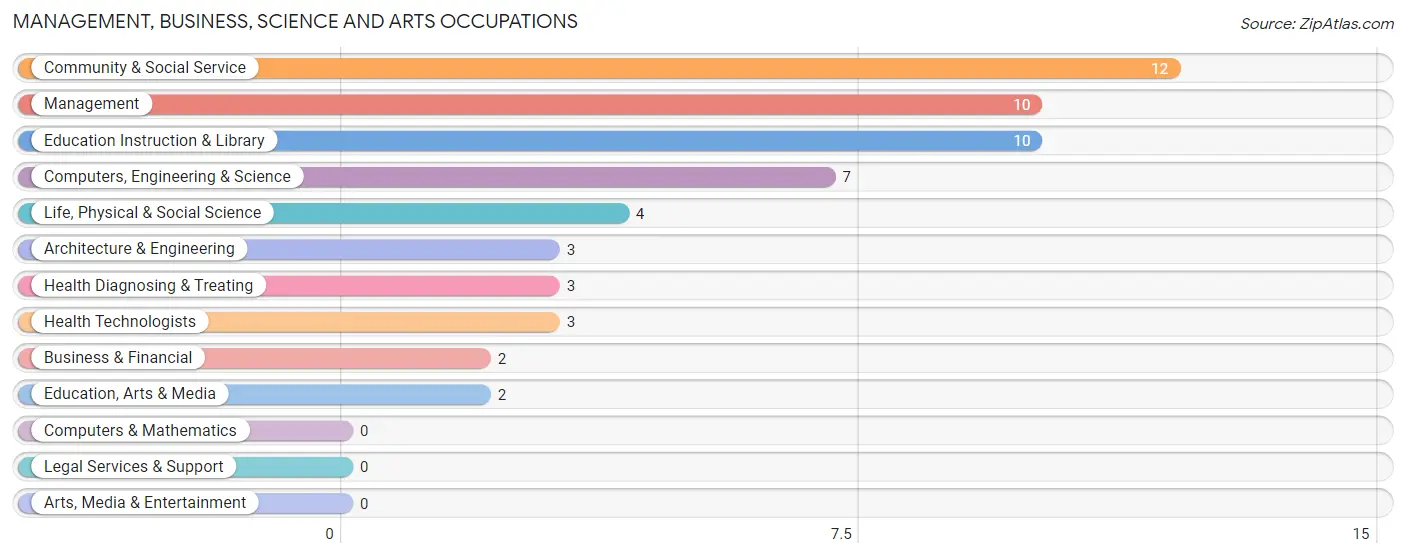
Management, Business, Science and Arts Occupations
The most common Management, Business, Science and Arts occupations in Kiester are Community & Social Service (12 | 4.7%), Management (10 | 3.9%), Education Instruction & Library (10 | 3.9%), Computers, Engineering & Science (7 | 2.8%), and Life, Physical & Social Science (4 | 1.6%).
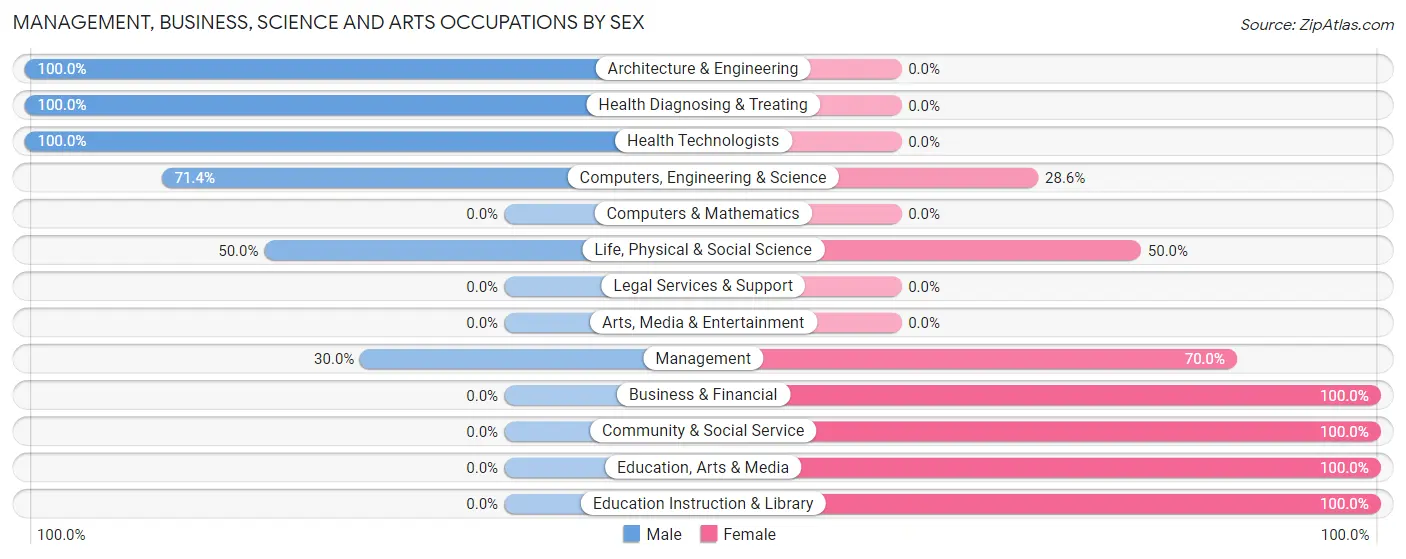
Management, Business, Science and Arts Occupations by Sex
Within the Management, Business, Science and Arts occupations in Kiester, the most male-oriented occupations are Architecture & Engineering (100.0%), Health Diagnosing & Treating (100.0%), and Health Technologists (100.0%), while the most female-oriented occupations are Business & Financial (100.0%), Community & Social Service (100.0%), and Education, Arts & Media (100.0%).
| Occupation | Male | Female |
| Management | 3 (30.0%) | 7 (70.0%) |
| Business & Financial | 0 (0.0%) | 2 (100.0%) |
| Computers, Engineering & Science | 5 (71.4%) | 2 (28.6%) |
| Computers & Mathematics | 0 (0.0%) | 0 (0.0%) |
| Architecture & Engineering | 3 (100.0%) | 0 (0.0%) |
| Life, Physical & Social Science | 2 (50.0%) | 2 (50.0%) |
| Community & Social Service | 0 (0.0%) | 12 (100.0%) |
| Education, Arts & Media | 0 (0.0%) | 2 (100.0%) |
| Legal Services & Support | 0 (0.0%) | 0 (0.0%) |
| Education Instruction & Library | 0 (0.0%) | 10 (100.0%) |
| Arts, Media & Entertainment | 0 (0.0%) | 0 (0.0%) |
| Health Diagnosing & Treating | 3 (100.0%) | 0 (0.0%) |
| Health Technologists | 3 (100.0%) | 0 (0.0%) |
| Total (Category) | 11 (32.4%) | 23 (67.6%) |
| Total (Overall) | 126 (49.4%) | 129 (50.6%) |
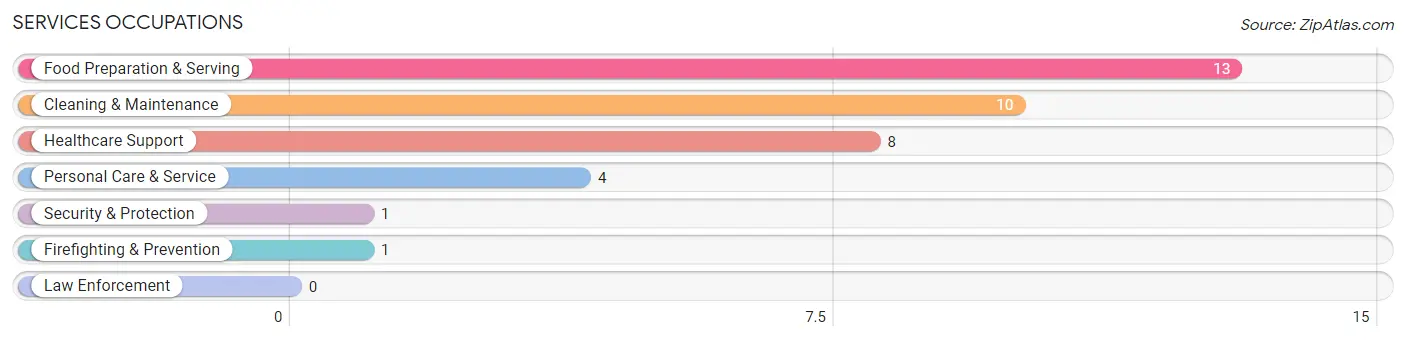
Services Occupations
The most common Services occupations in Kiester are Food Preparation & Serving (13 | 5.1%), Cleaning & Maintenance (10 | 3.9%), Healthcare Support (8 | 3.1%), Personal Care & Service (4 | 1.6%), and Security & Protection (1 | 0.4%).
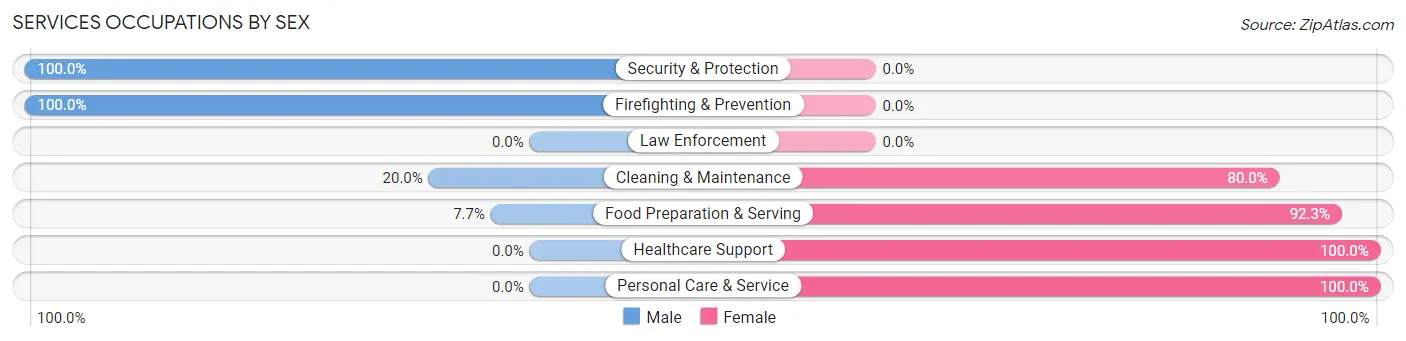
Services Occupations by Sex
Within the Services occupations in Kiester, the most male-oriented occupations are Security & Protection (100.0%), Firefighting & Prevention (100.0%), and Cleaning & Maintenance (20.0%), while the most female-oriented occupations are Healthcare Support (100.0%), Personal Care & Service (100.0%), and Food Preparation & Serving (92.3%).
| Occupation | Male | Female |
| Healthcare Support | 0 (0.0%) | 8 (100.0%) |
| Security & Protection | 1 (100.0%) | 0 (0.0%) |
| Firefighting & Prevention | 1 (100.0%) | 0 (0.0%) |
| Law Enforcement | 0 (0.0%) | 0 (0.0%) |
| Food Preparation & Serving | 1 (7.7%) | 12 (92.3%) |
| Cleaning & Maintenance | 2 (20.0%) | 8 (80.0%) |
| Personal Care & Service | 0 (0.0%) | 4 (100.0%) |
| Total (Category) | 4 (11.1%) | 32 (88.9%) |
| Total (Overall) | 126 (49.4%) | 129 (50.6%) |
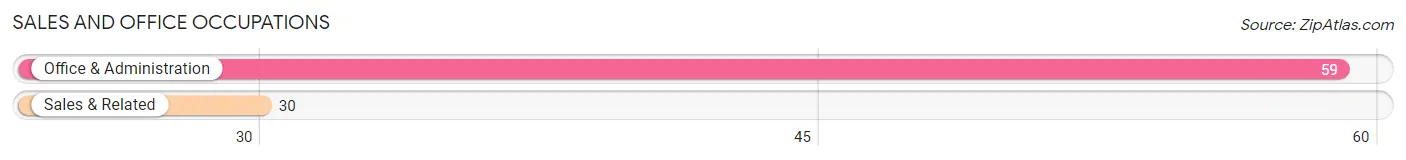
Sales and Office Occupations
The most common Sales and Office occupations in Kiester are Office & Administration (59 | 23.1%), and Sales & Related (30 | 11.8%).
Sales and Office Occupations by Sex
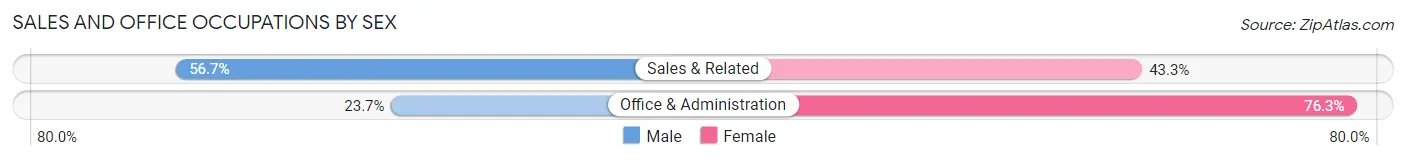
| Occupation | Male | Female |
| Sales & Related | 17 (56.7%) | 13 (43.3%) |
| Office & Administration | 14 (23.7%) | 45 (76.3%) |
| Total (Category) | 31 (34.8%) | 58 (65.2%) |
| Total (Overall) | 126 (49.4%) | 129 (50.6%) |
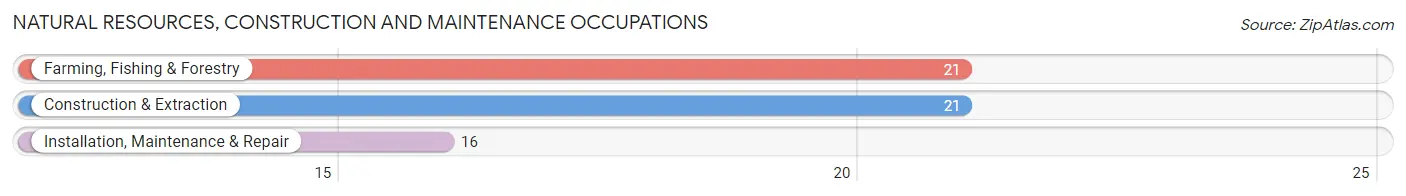
Natural Resources, Construction and Maintenance Occupations
The most common Natural Resources, Construction and Maintenance occupations in Kiester are Farming, Fishing & Forestry (21 | 8.2%), Construction & Extraction (21 | 8.2%), and Installation, Maintenance & Repair (16 | 6.3%).
Natural Resources, Construction and Maintenance Occupations by Sex
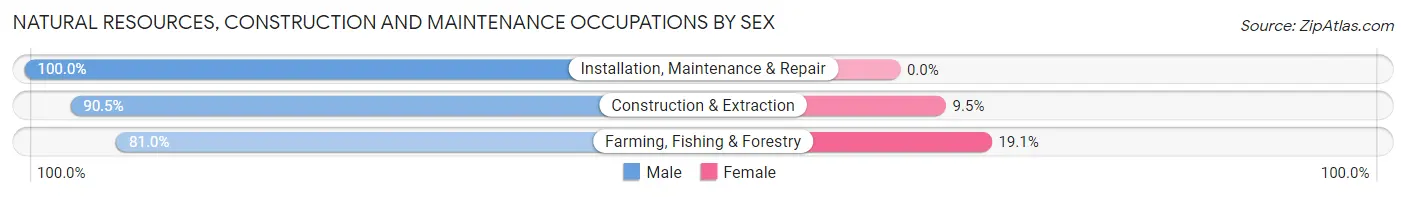
| Occupation | Male | Female |
| Farming, Fishing & Forestry | 17 (80.9%) | 4 (19.1%) |
| Construction & Extraction | 19 (90.5%) | 2 (9.5%) |
| Installation, Maintenance & Repair | 16 (100.0%) | 0 (0.0%) |
| Total (Category) | 52 (89.7%) | 6 (10.3%) |
| Total (Overall) | 126 (49.4%) | 129 (50.6%) |
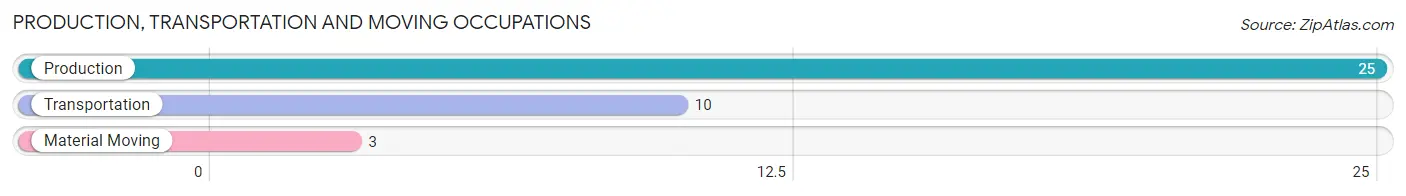
Production, Transportation and Moving Occupations
The most common Production, Transportation and Moving occupations in Kiester are Production (25 | 9.8%), Transportation (10 | 3.9%), and Material Moving (3 | 1.2%).
Production, Transportation and Moving Occupations by Sex
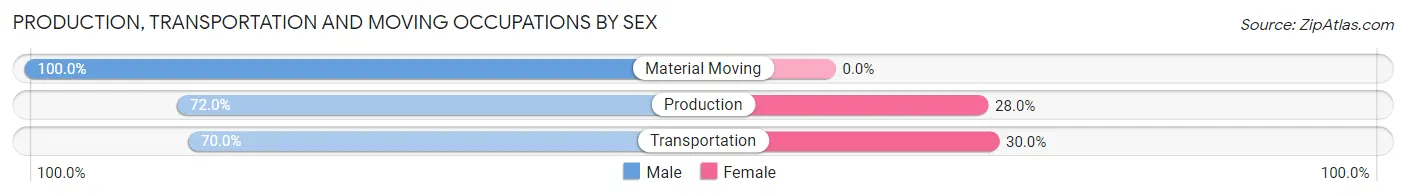
| Occupation | Male | Female |
| Production | 18 (72.0%) | 7 (28.0%) |
| Transportation | 7 (70.0%) | 3 (30.0%) |
| Material Moving | 3 (100.0%) | 0 (0.0%) |
| Total (Category) | 28 (73.7%) | 10 (26.3%) |
| Total (Overall) | 126 (49.4%) | 129 (50.6%) |
Employment Industries by Sex in Kiester
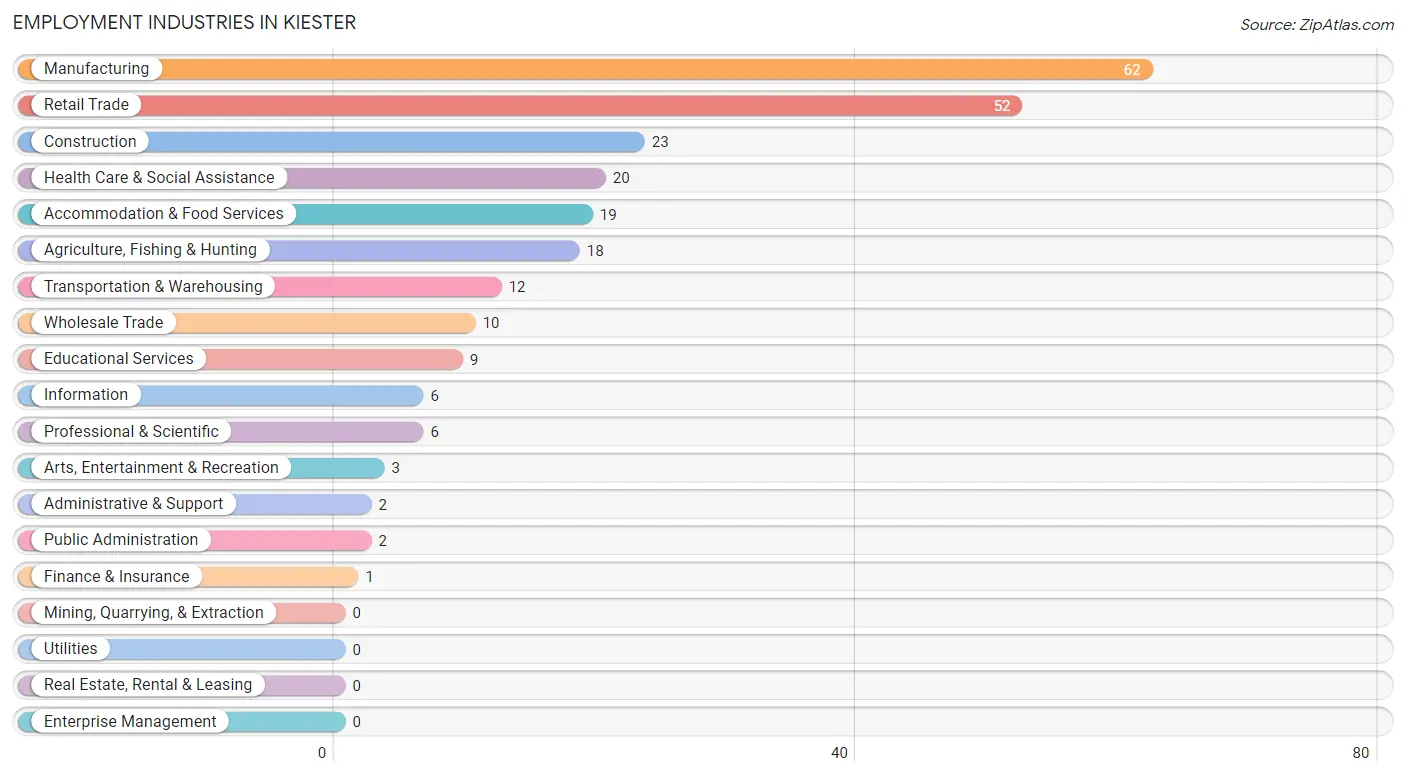
Employment Industries in Kiester
The major employment industries in Kiester include Manufacturing (62 | 24.3%), Retail Trade (52 | 20.4%), Construction (23 | 9.0%), Health Care & Social Assistance (20 | 7.8%), and Accommodation & Food Services (19 | 7.4%).
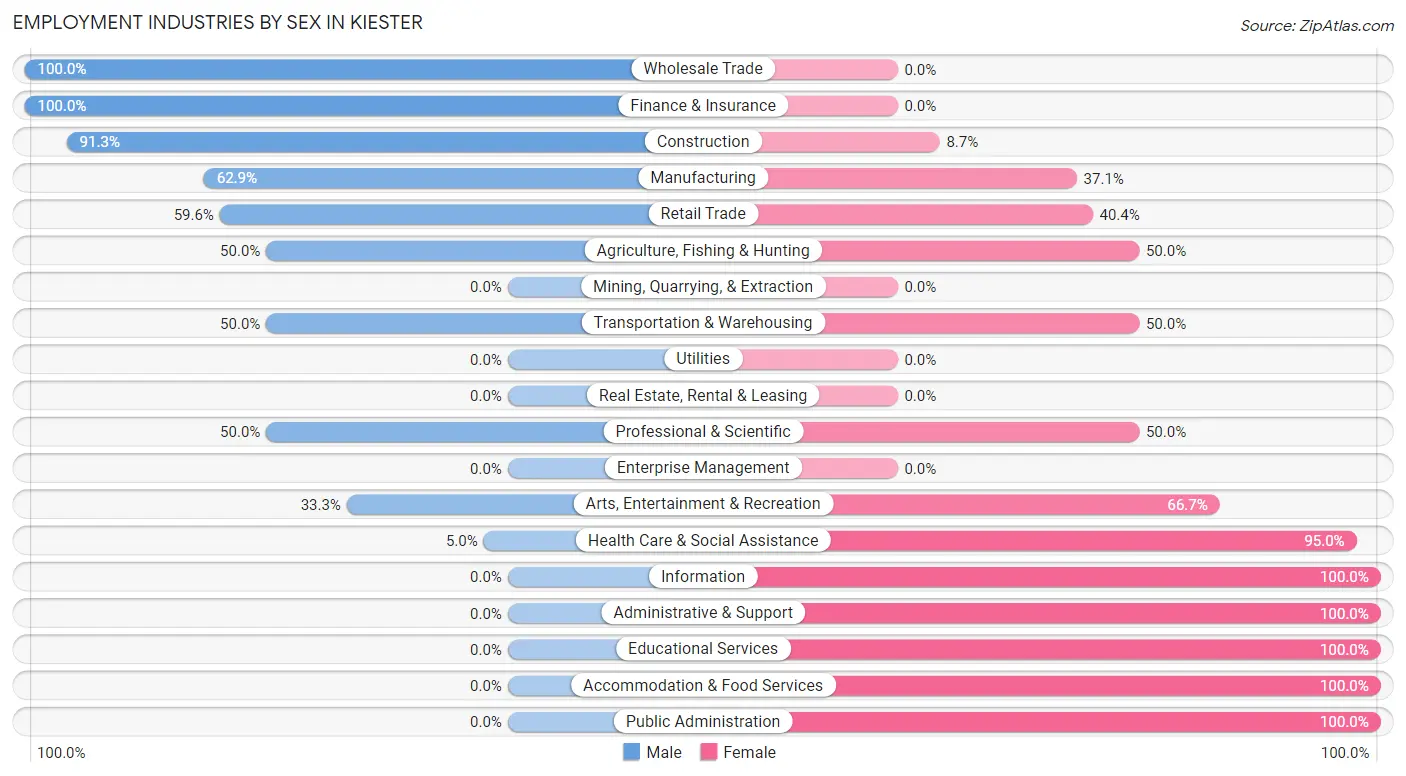
Employment Industries by Sex in Kiester
The Kiester industries that see more men than women are Wholesale Trade (100.0%), Finance & Insurance (100.0%), and Construction (91.3%), whereas the industries that tend to have a higher number of women are Information (100.0%), Administrative & Support (100.0%), and Educational Services (100.0%).
| Industry | Male | Female |
| Agriculture, Fishing & Hunting | 9 (50.0%) | 9 (50.0%) |
| Mining, Quarrying, & Extraction | 0 (0.0%) | 0 (0.0%) |
| Construction | 21 (91.3%) | 2 (8.7%) |
| Manufacturing | 39 (62.9%) | 23 (37.1%) |
| Wholesale Trade | 10 (100.0%) | 0 (0.0%) |
| Retail Trade | 31 (59.6%) | 21 (40.4%) |
| Transportation & Warehousing | 6 (50.0%) | 6 (50.0%) |
| Utilities | 0 (0.0%) | 0 (0.0%) |
| Information | 0 (0.0%) | 6 (100.0%) |
| Finance & Insurance | 1 (100.0%) | 0 (0.0%) |
| Real Estate, Rental & Leasing | 0 (0.0%) | 0 (0.0%) |
| Professional & Scientific | 3 (50.0%) | 3 (50.0%) |
| Enterprise Management | 0 (0.0%) | 0 (0.0%) |
| Administrative & Support | 0 (0.0%) | 2 (100.0%) |
| Educational Services | 0 (0.0%) | 9 (100.0%) |
| Health Care & Social Assistance | 1 (5.0%) | 19 (95.0%) |
| Arts, Entertainment & Recreation | 1 (33.3%) | 2 (66.7%) |
| Accommodation & Food Services | 0 (0.0%) | 19 (100.0%) |
| Public Administration | 0 (0.0%) | 2 (100.0%) |
| Total | 126 (49.4%) | 129 (50.6%) |
Education in Kiester
School Enrollment in Kiester
The most common levels of schooling among the 178 students in Kiester are high school (76 | 42.7%), middle school (44 | 24.7%), and elementary school (27 | 15.2%).
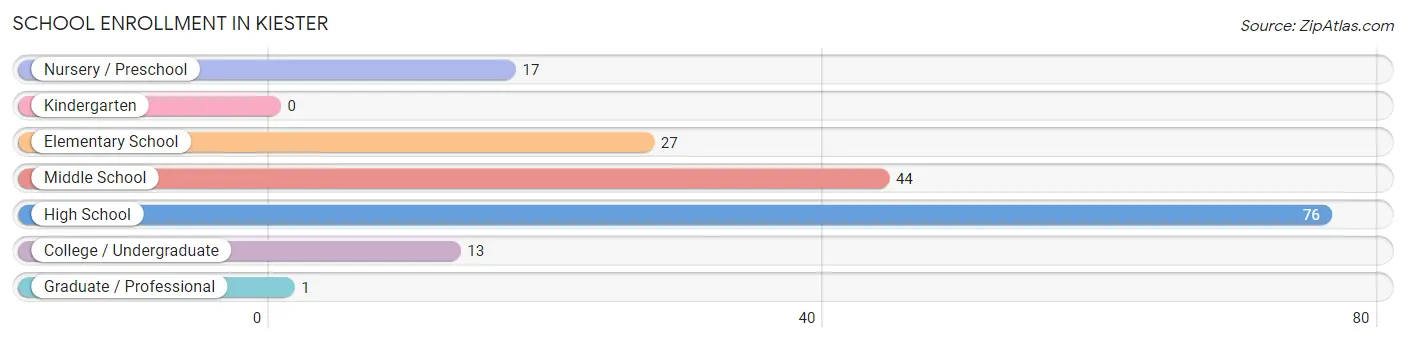
| School Level | # Students | % Students |
| Nursery / Preschool | 17 | 9.6% |
| Kindergarten | 0 | 0.0% |
| Elementary School | 27 | 15.2% |
| Middle School | 44 | 24.7% |
| High School | 76 | 42.7% |
| College / Undergraduate | 13 | 7.3% |
| Graduate / Professional | 1 | 0.6% |
| Total | 178 | 100.0% |
School Enrollment by Age by Funding Source in Kiester
Out of a total of 178 students who are enrolled in schools in Kiester, 4 (2.2%) attend a private institution, while the remaining 174 (97.8%) are enrolled in public schools. The age group of 35 years and over has the highest likelihood of being enrolled in private schools, with 1 (100.0% in the age bracket) enrolled. Conversely, the age group of 3 to 4 year olds has the lowest likelihood of being enrolled in a private school, with 10 (100.0% in the age bracket) attending a public institution.
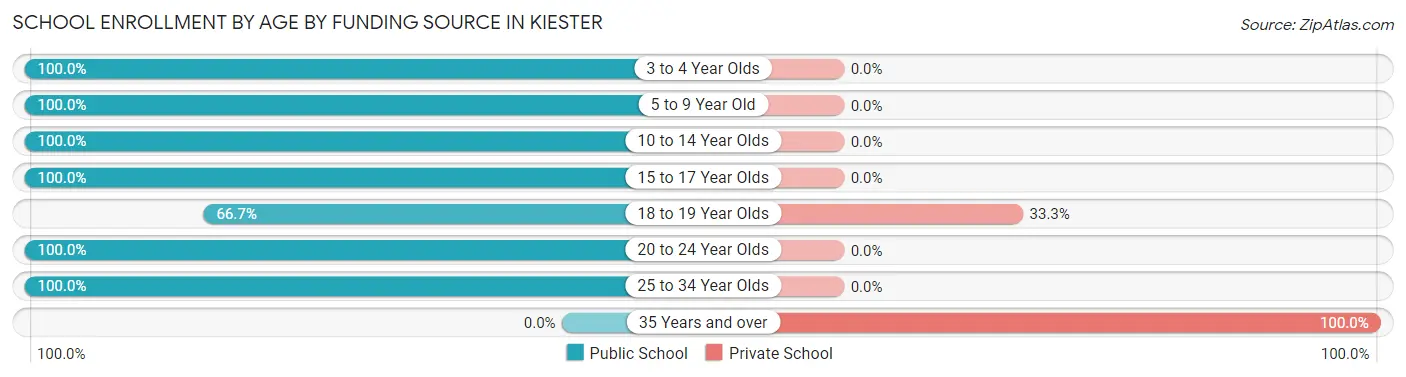
| Age Bracket | Public School | Private School |
| 3 to 4 Year Olds | 10 (100.0%) | 0 (0.0%) |
| 5 to 9 Year Old | 25 (100.0%) | 0 (0.0%) |
| 10 to 14 Year Olds | 55 (100.0%) | 0 (0.0%) |
| 15 to 17 Year Olds | 68 (100.0%) | 0 (0.0%) |
| 18 to 19 Year Olds | 6 (66.7%) | 3 (33.3%) |
| 20 to 24 Year Olds | 2 (100.0%) | 0 (0.0%) |
| 25 to 34 Year Olds | 8 (100.0%) | 0 (0.0%) |
| 35 Years and over | 0 (0.0%) | 1 (100.0%) |
| Total | 174 (97.8%) | 4 (2.2%) |
Educational Attainment by Field of Study in Kiester
Arts & humanities (11 | 19.6%), science & technology (10 | 17.9%), social sciences (8 | 14.3%), education (7 | 12.5%), and bio, nature & agricultural (5 | 8.9%) are the most common fields of study among 56 individuals in Kiester who have obtained a bachelor's degree or higher.
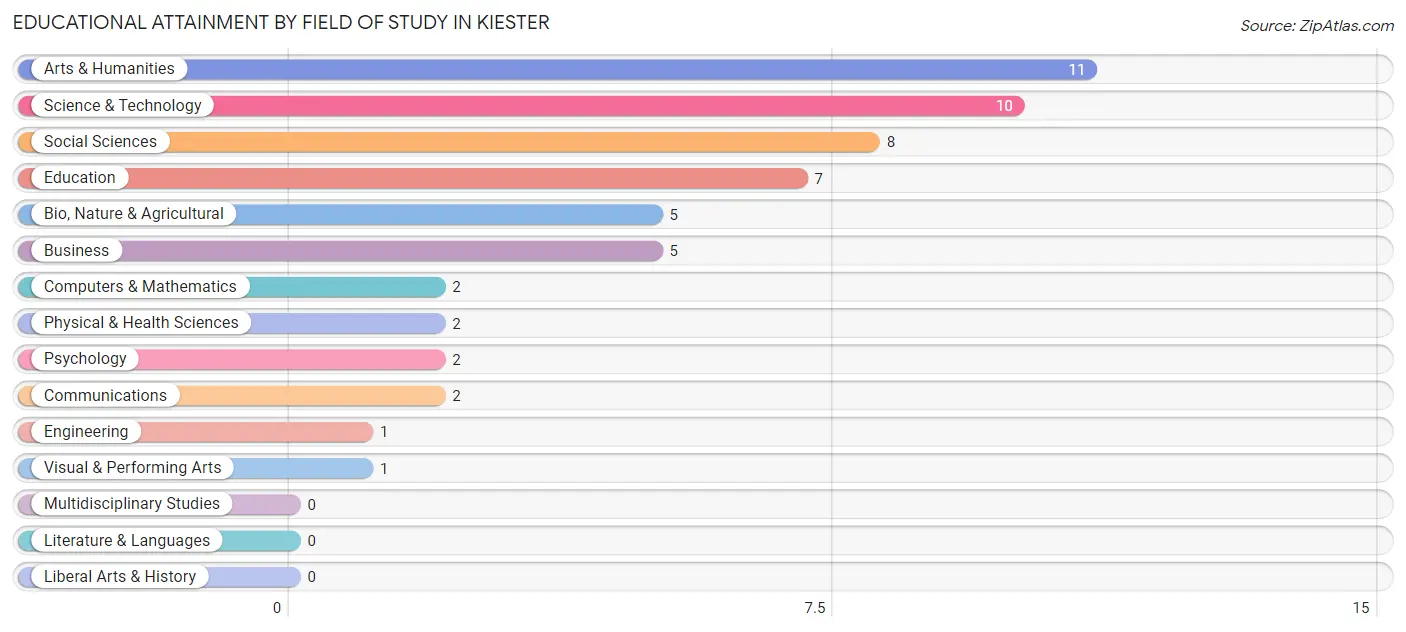
| Field of Study | # Graduates | % Graduates |
| Computers & Mathematics | 2 | 3.6% |
| Bio, Nature & Agricultural | 5 | 8.9% |
| Physical & Health Sciences | 2 | 3.6% |
| Psychology | 2 | 3.6% |
| Social Sciences | 8 | 14.3% |
| Engineering | 1 | 1.8% |
| Multidisciplinary Studies | 0 | 0.0% |
| Science & Technology | 10 | 17.9% |
| Business | 5 | 8.9% |
| Education | 7 | 12.5% |
| Literature & Languages | 0 | 0.0% |
| Liberal Arts & History | 0 | 0.0% |
| Visual & Performing Arts | 1 | 1.8% |
| Communications | 2 | 3.6% |
| Arts & Humanities | 11 | 19.6% |
| Total | 56 | 100.0% |
Transportation & Commute in Kiester
Vehicle Availability by Sex in Kiester
The most prevalent vehicle ownership categories in Kiester are males with 2 vehicles (36, accounting for 29.0%) and females with 2 vehicles (54, making up 27.9%).
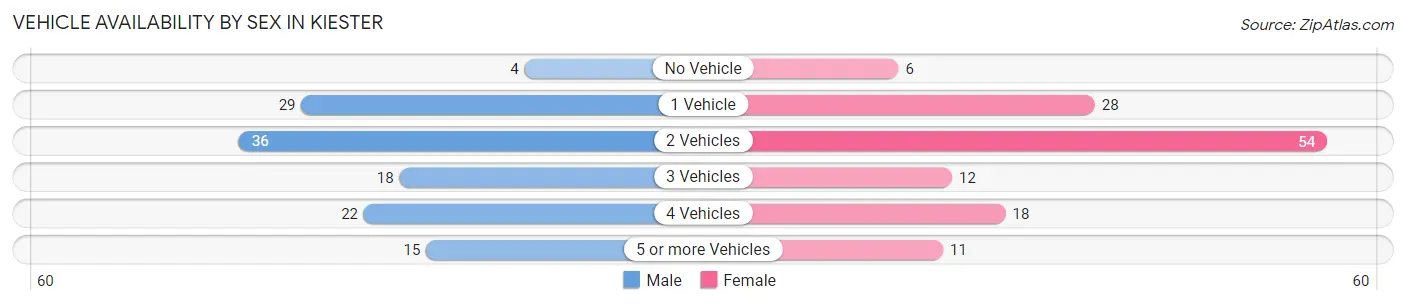
| Vehicles Available | Male | Female |
| No Vehicle | 4 (3.2%) | 6 (4.6%) |
| 1 Vehicle | 29 (23.4%) | 28 (21.7%) |
| 2 Vehicles | 36 (29.0%) | 54 (41.9%) |
| 3 Vehicles | 18 (14.5%) | 12 (9.3%) |
| 4 Vehicles | 22 (17.7%) | 18 (14.0%) |
| 5 or more Vehicles | 15 (12.1%) | 11 (8.5%) |
| Total | 124 (100.0%) | 129 (100.0%) |
Commute Time in Kiester
The most frequently occuring commute durations in Kiester are 30 to 34 minutes (64 commuters, 25.8%), 20 to 24 minutes (52 commuters, 21.0%), and less than 5 minutes (23 commuters, 9.3%).
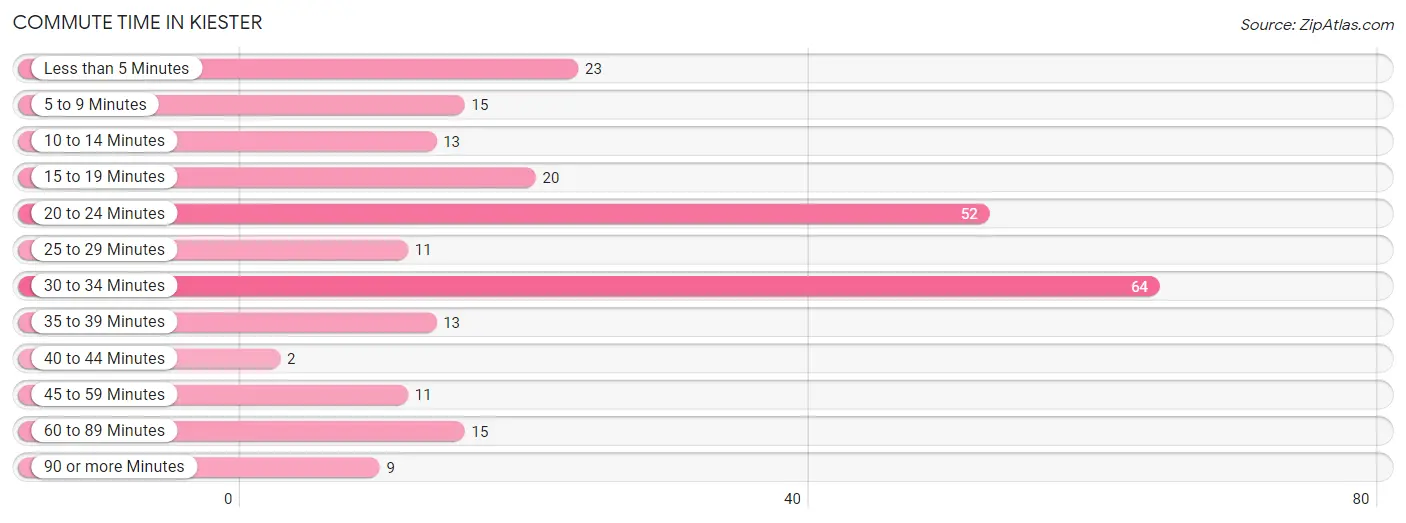
| Commute Time | # Commuters | % Commuters |
| Less than 5 Minutes | 23 | 9.3% |
| 5 to 9 Minutes | 15 | 6.0% |
| 10 to 14 Minutes | 13 | 5.2% |
| 15 to 19 Minutes | 20 | 8.1% |
| 20 to 24 Minutes | 52 | 21.0% |
| 25 to 29 Minutes | 11 | 4.4% |
| 30 to 34 Minutes | 64 | 25.8% |
| 35 to 39 Minutes | 13 | 5.2% |
| 40 to 44 Minutes | 2 | 0.8% |
| 45 to 59 Minutes | 11 | 4.4% |
| 60 to 89 Minutes | 15 | 6.0% |
| 90 or more Minutes | 9 | 3.6% |
Commute Time by Sex in Kiester
The most common commute times in Kiester are 20 to 24 minutes (36 commuters, 30.2%) for males and 30 to 34 minutes (42 commuters, 32.6%) for females.
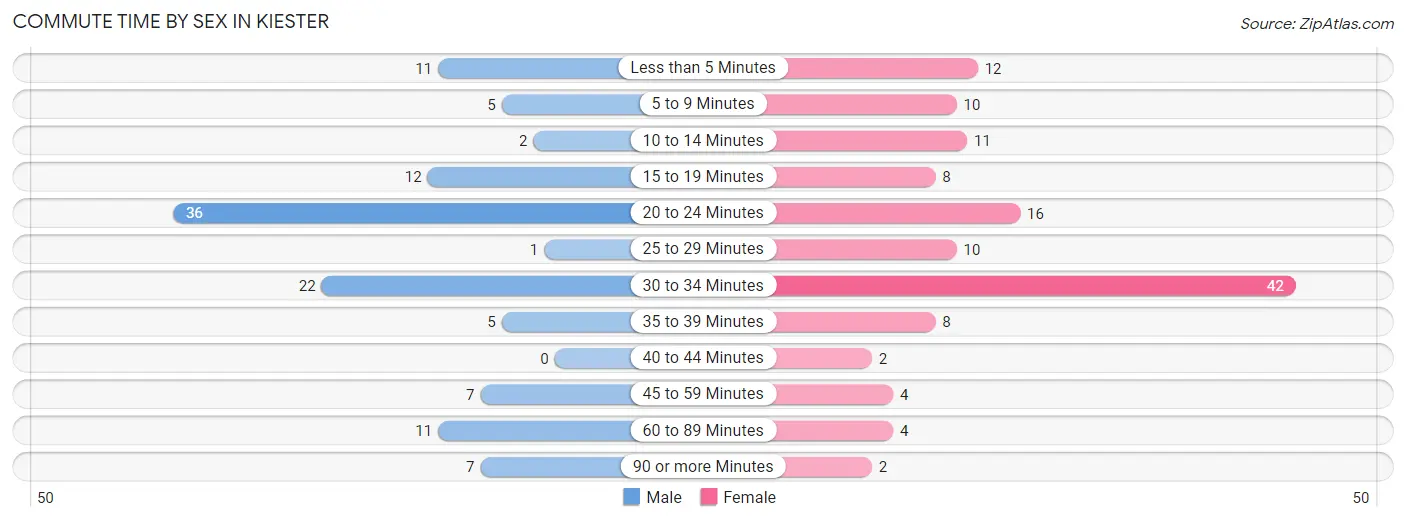
| Commute Time | Male | Female |
| Less than 5 Minutes | 11 (9.2%) | 12 (9.3%) |
| 5 to 9 Minutes | 5 (4.2%) | 10 (7.7%) |
| 10 to 14 Minutes | 2 (1.7%) | 11 (8.5%) |
| 15 to 19 Minutes | 12 (10.1%) | 8 (6.2%) |
| 20 to 24 Minutes | 36 (30.2%) | 16 (12.4%) |
| 25 to 29 Minutes | 1 (0.8%) | 10 (7.7%) |
| 30 to 34 Minutes | 22 (18.5%) | 42 (32.6%) |
| 35 to 39 Minutes | 5 (4.2%) | 8 (6.2%) |
| 40 to 44 Minutes | 0 (0.0%) | 2 (1.5%) |
| 45 to 59 Minutes | 7 (5.9%) | 4 (3.1%) |
| 60 to 89 Minutes | 11 (9.2%) | 4 (3.1%) |
| 90 or more Minutes | 7 (5.9%) | 2 (1.5%) |
Time of Departure to Work by Sex in Kiester
The most frequent times of departure to work in Kiester are 12:00 AM to 4:59 AM (22, 18.5%) for males and 12:00 PM to 3:59 PM (23, 17.8%) for females.
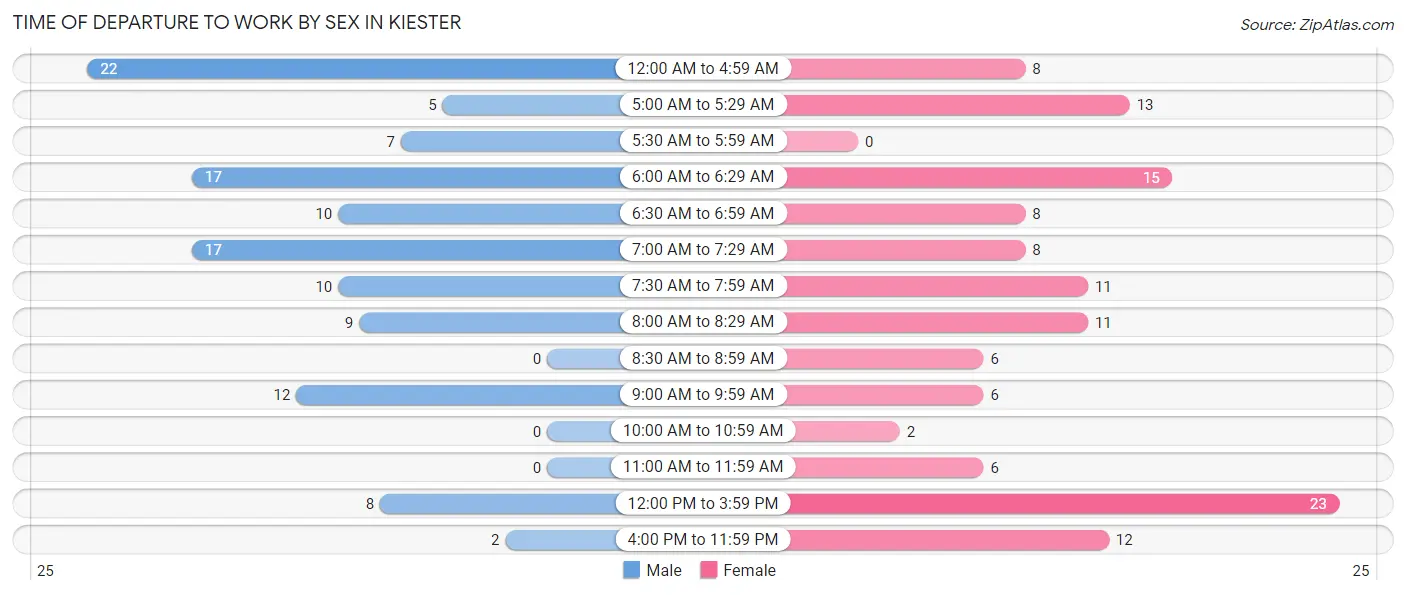
| Time of Departure | Male | Female |
| 12:00 AM to 4:59 AM | 22 (18.5%) | 8 (6.2%) |
| 5:00 AM to 5:29 AM | 5 (4.2%) | 13 (10.1%) |
| 5:30 AM to 5:59 AM | 7 (5.9%) | 0 (0.0%) |
| 6:00 AM to 6:29 AM | 17 (14.3%) | 15 (11.6%) |
| 6:30 AM to 6:59 AM | 10 (8.4%) | 8 (6.2%) |
| 7:00 AM to 7:29 AM | 17 (14.3%) | 8 (6.2%) |
| 7:30 AM to 7:59 AM | 10 (8.4%) | 11 (8.5%) |
| 8:00 AM to 8:29 AM | 9 (7.6%) | 11 (8.5%) |
| 8:30 AM to 8:59 AM | 0 (0.0%) | 6 (4.6%) |
| 9:00 AM to 9:59 AM | 12 (10.1%) | 6 (4.6%) |
| 10:00 AM to 10:59 AM | 0 (0.0%) | 2 (1.5%) |
| 11:00 AM to 11:59 AM | 0 (0.0%) | 6 (4.6%) |
| 12:00 PM to 3:59 PM | 8 (6.7%) | 23 (17.8%) |
| 4:00 PM to 11:59 PM | 2 (1.7%) | 12 (9.3%) |
| Total | 119 (100.0%) | 129 (100.0%) |
Housing Occupancy in Kiester
Occupancy by Ownership in Kiester
Of the total 260 dwellings in Kiester, owner-occupied units account for 207 (79.6%), while renter-occupied units make up 53 (20.4%).
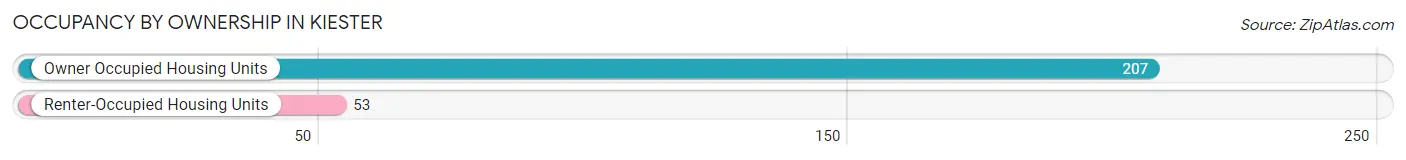
| Occupancy | # Housing Units | % Housing Units |
| Owner Occupied Housing Units | 207 | 79.6% |
| Renter-Occupied Housing Units | 53 | 20.4% |
| Total Occupied Housing Units | 260 | 100.0% |
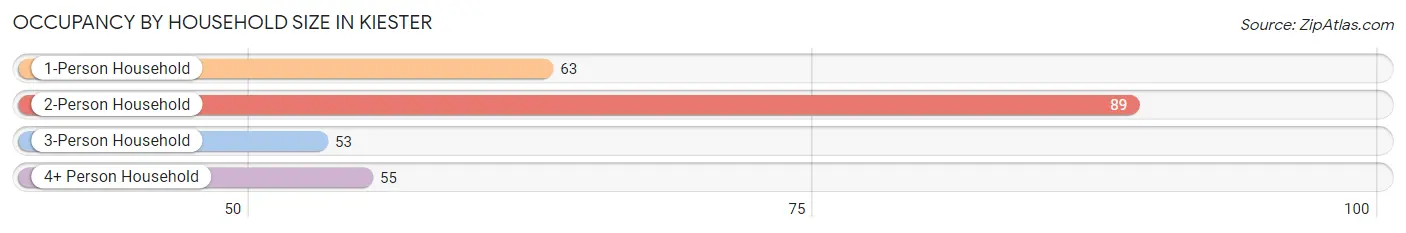
Occupancy by Household Size in Kiester
| Household Size | # Housing Units | % Housing Units |
| 1-Person Household | 63 | 24.2% |
| 2-Person Household | 89 | 34.2% |
| 3-Person Household | 53 | 20.4% |
| 4+ Person Household | 55 | 21.1% |
| Total Housing Units | 260 | 100.0% |
Occupancy by Ownership by Household Size in Kiester
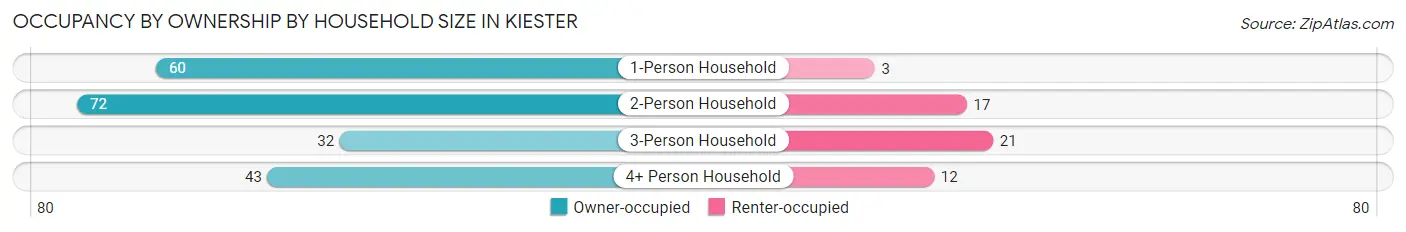
| Household Size | Owner-occupied | Renter-occupied |
| 1-Person Household | 60 (95.2%) | 3 (4.8%) |
| 2-Person Household | 72 (80.9%) | 17 (19.1%) |
| 3-Person Household | 32 (60.4%) | 21 (39.6%) |
| 4+ Person Household | 43 (78.2%) | 12 (21.8%) |
| Total Housing Units | 207 (79.6%) | 53 (20.4%) |
Occupancy by Educational Attainment in Kiester
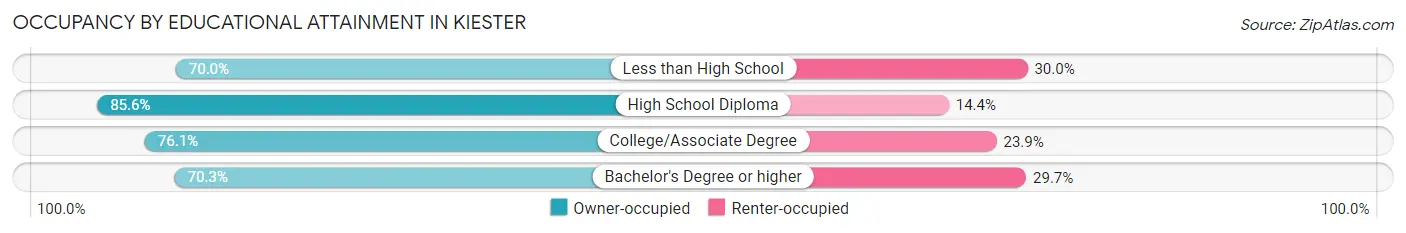
| Household Size | Owner-occupied | Renter-occupied |
| Less than High School | 7 (70.0%) | 3 (30.0%) |
| High School Diploma | 107 (85.6%) | 18 (14.4%) |
| College/Associate Degree | 67 (76.1%) | 21 (23.9%) |
| Bachelor's Degree or higher | 26 (70.3%) | 11 (29.7%) |
Occupancy by Age of Householder in Kiester
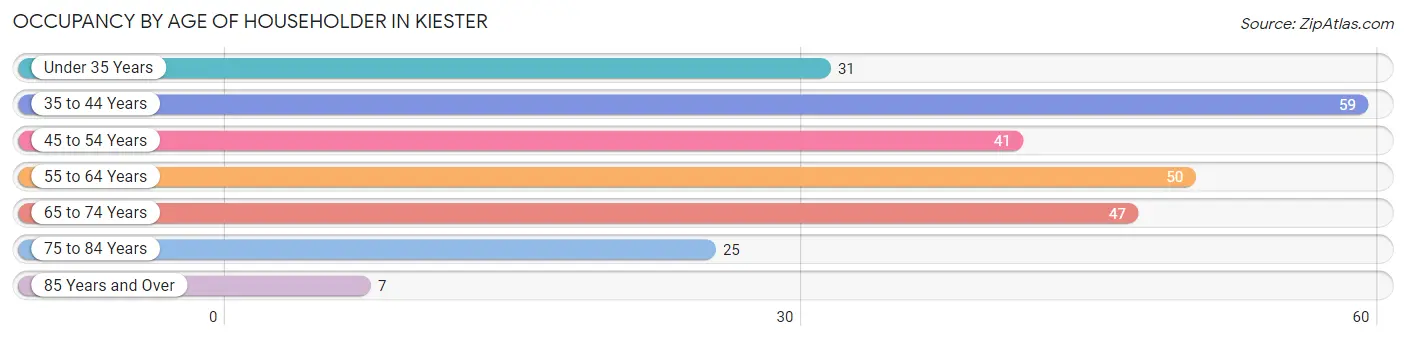
| Age Bracket | # Households | % Households |
| Under 35 Years | 31 | 11.9% |
| 35 to 44 Years | 59 | 22.7% |
| 45 to 54 Years | 41 | 15.8% |
| 55 to 64 Years | 50 | 19.2% |
| 65 to 74 Years | 47 | 18.1% |
| 75 to 84 Years | 25 | 9.6% |
| 85 Years and Over | 7 | 2.7% |
| Total | 260 | 100.0% |
Housing Finances in Kiester
Median Income by Occupancy in Kiester
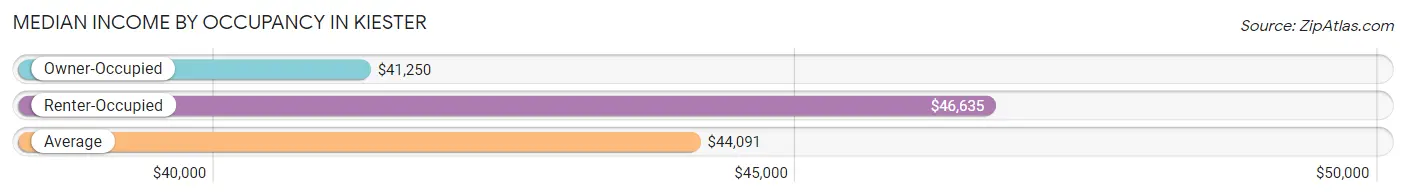
| Occupancy Type | # Households | Median Income |
| Owner-Occupied | 207 (79.6%) | $41,250 |
| Renter-Occupied | 53 (20.4%) | $46,635 |
| Average | 260 (100.0%) | $44,091 |
Occupancy by Householder Income Bracket in Kiester
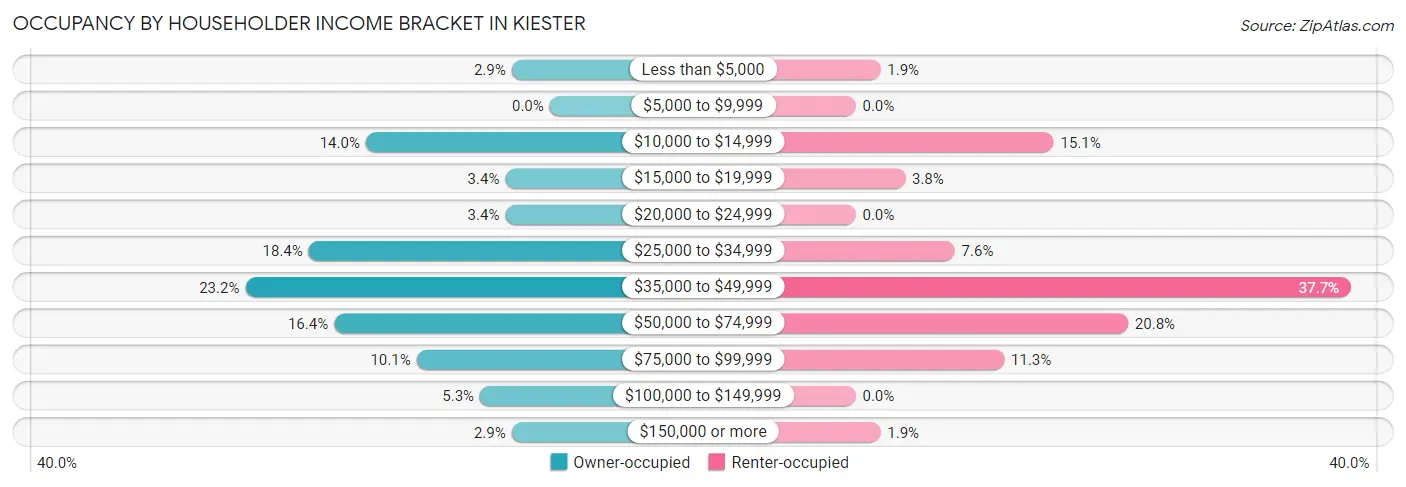
| Income Bracket | Owner-occupied | Renter-occupied |
| Less than $5,000 | 6 (2.9%) | 1 (1.9%) |
| $5,000 to $9,999 | 0 (0.0%) | 0 (0.0%) |
| $10,000 to $14,999 | 29 (14.0%) | 8 (15.1%) |
| $15,000 to $19,999 | 7 (3.4%) | 2 (3.8%) |
| $20,000 to $24,999 | 7 (3.4%) | 0 (0.0%) |
| $25,000 to $34,999 | 38 (18.4%) | 4 (7.5%) |
| $35,000 to $49,999 | 48 (23.2%) | 20 (37.7%) |
| $50,000 to $74,999 | 34 (16.4%) | 11 (20.7%) |
| $75,000 to $99,999 | 21 (10.1%) | 6 (11.3%) |
| $100,000 to $149,999 | 11 (5.3%) | 0 (0.0%) |
| $150,000 or more | 6 (2.9%) | 1 (1.9%) |
| Total | 207 (100.0%) | 53 (100.0%) |
Monthly Housing Cost Tiers in Kiester
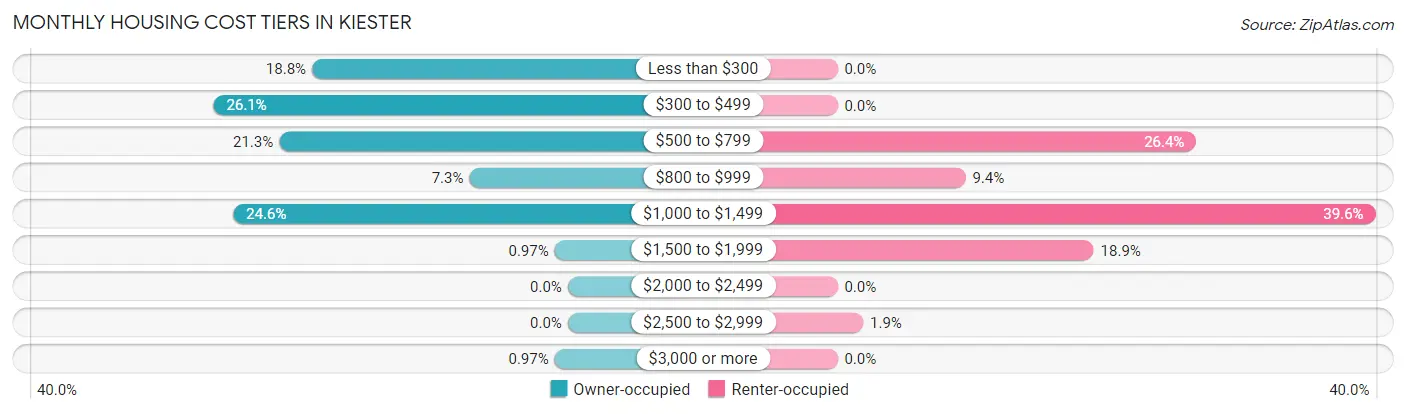
| Monthly Cost | Owner-occupied | Renter-occupied |
| Less than $300 | 39 (18.8%) | 0 (0.0%) |
| $300 to $499 | 54 (26.1%) | 0 (0.0%) |
| $500 to $799 | 44 (21.3%) | 14 (26.4%) |
| $800 to $999 | 15 (7.2%) | 5 (9.4%) |
| $1,000 to $1,499 | 51 (24.6%) | 21 (39.6%) |
| $1,500 to $1,999 | 2 (1.0%) | 10 (18.9%) |
| $2,000 to $2,499 | 0 (0.0%) | 0 (0.0%) |
| $2,500 to $2,999 | 0 (0.0%) | 1 (1.9%) |
| $3,000 or more | 2 (1.0%) | 0 (0.0%) |
| Total | 207 (100.0%) | 53 (100.0%) |
Physical Housing Characteristics in Kiester
Housing Structures in Kiester
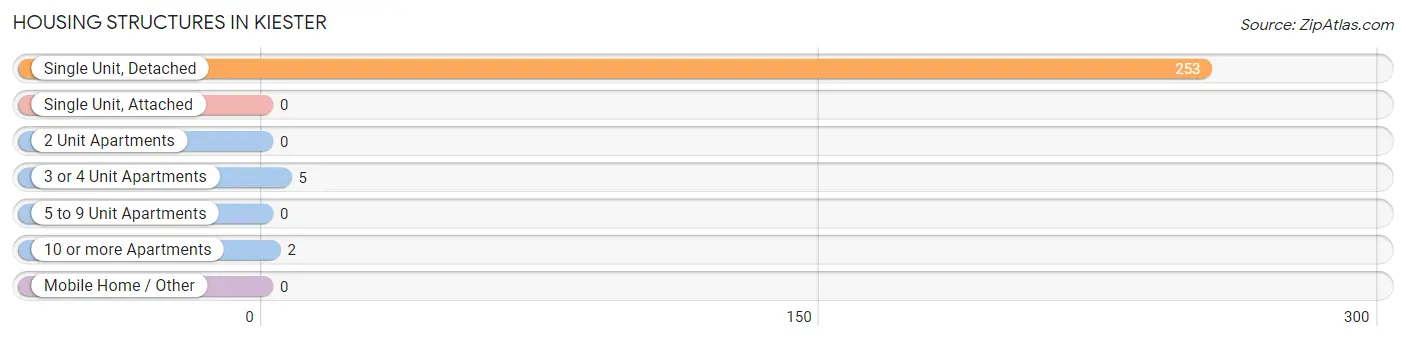
| Structure Type | # Housing Units | % Housing Units |
| Single Unit, Detached | 253 | 97.3% |
| Single Unit, Attached | 0 | 0.0% |
| 2 Unit Apartments | 0 | 0.0% |
| 3 or 4 Unit Apartments | 5 | 1.9% |
| 5 to 9 Unit Apartments | 0 | 0.0% |
| 10 or more Apartments | 2 | 0.8% |
| Mobile Home / Other | 0 | 0.0% |
| Total | 260 | 100.0% |
Housing Structures by Occupancy in Kiester
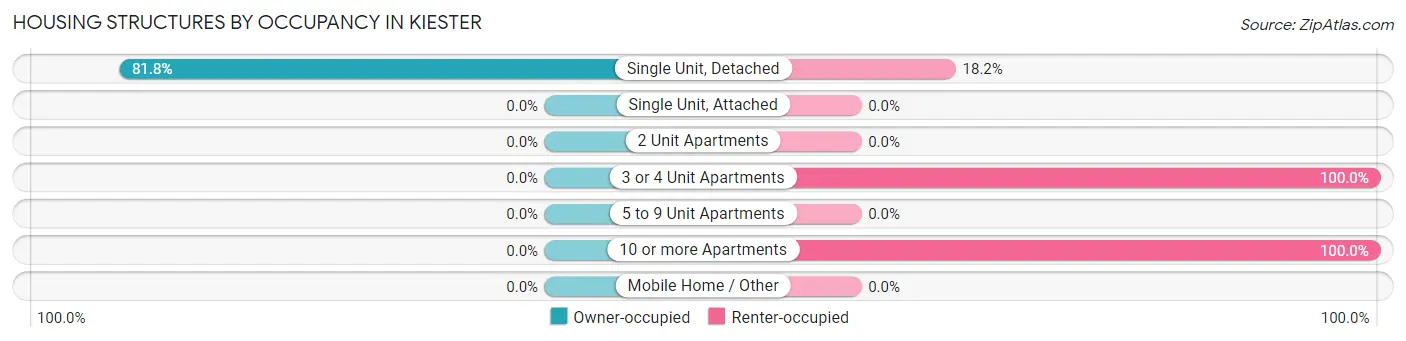
| Structure Type | Owner-occupied | Renter-occupied |
| Single Unit, Detached | 207 (81.8%) | 46 (18.2%) |
| Single Unit, Attached | 0 (0.0%) | 0 (0.0%) |
| 2 Unit Apartments | 0 (0.0%) | 0 (0.0%) |
| 3 or 4 Unit Apartments | 0 (0.0%) | 5 (100.0%) |
| 5 to 9 Unit Apartments | 0 (0.0%) | 0 (0.0%) |
| 10 or more Apartments | 0 (0.0%) | 2 (100.0%) |
| Mobile Home / Other | 0 (0.0%) | 0 (0.0%) |
| Total | 207 (79.6%) | 53 (20.4%) |
Housing Structures by Number of Rooms in Kiester
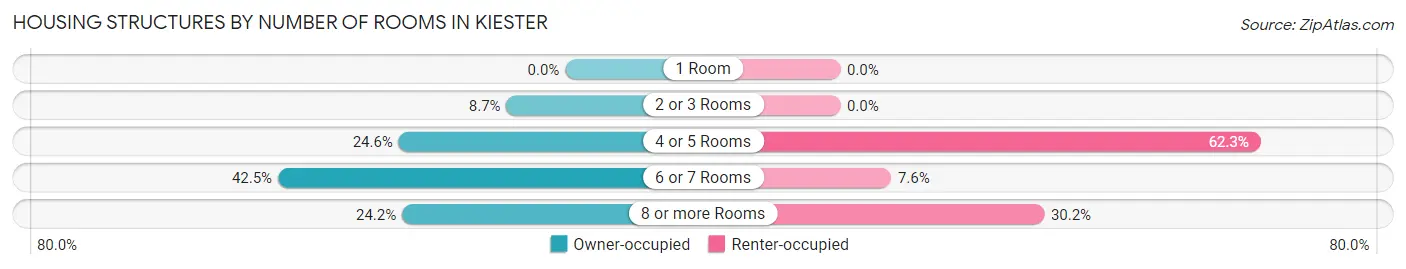
| Number of Rooms | Owner-occupied | Renter-occupied |
| 1 Room | 0 (0.0%) | 0 (0.0%) |
| 2 or 3 Rooms | 18 (8.7%) | 0 (0.0%) |
| 4 or 5 Rooms | 51 (24.6%) | 33 (62.3%) |
| 6 or 7 Rooms | 88 (42.5%) | 4 (7.5%) |
| 8 or more Rooms | 50 (24.1%) | 16 (30.2%) |
| Total | 207 (100.0%) | 53 (100.0%) |
Housing Structure by Heating Type in Kiester
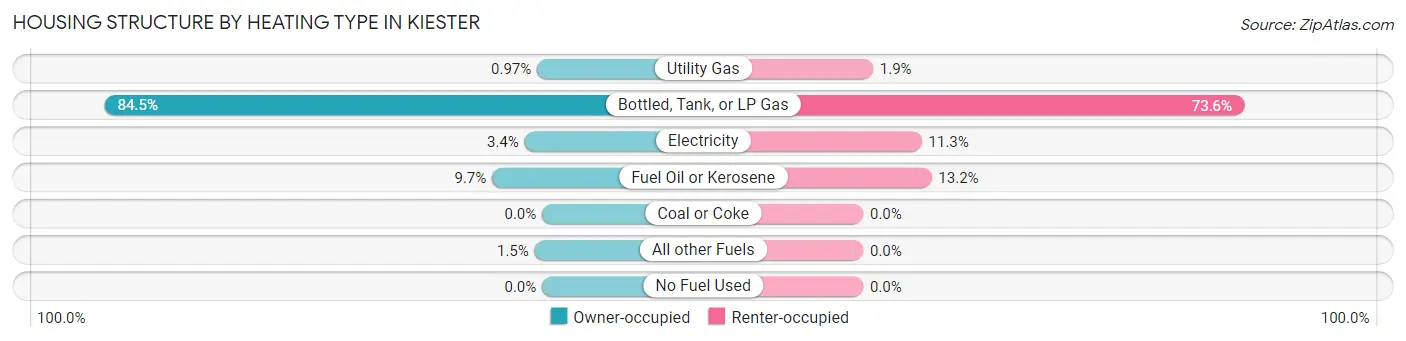
| Heating Type | Owner-occupied | Renter-occupied |
| Utility Gas | 2 (1.0%) | 1 (1.9%) |
| Bottled, Tank, or LP Gas | 175 (84.5%) | 39 (73.6%) |
| Electricity | 7 (3.4%) | 6 (11.3%) |
| Fuel Oil or Kerosene | 20 (9.7%) | 7 (13.2%) |
| Coal or Coke | 0 (0.0%) | 0 (0.0%) |
| All other Fuels | 3 (1.5%) | 0 (0.0%) |
| No Fuel Used | 0 (0.0%) | 0 (0.0%) |
| Total | 207 (100.0%) | 53 (100.0%) |
Household Vehicle Usage in Kiester
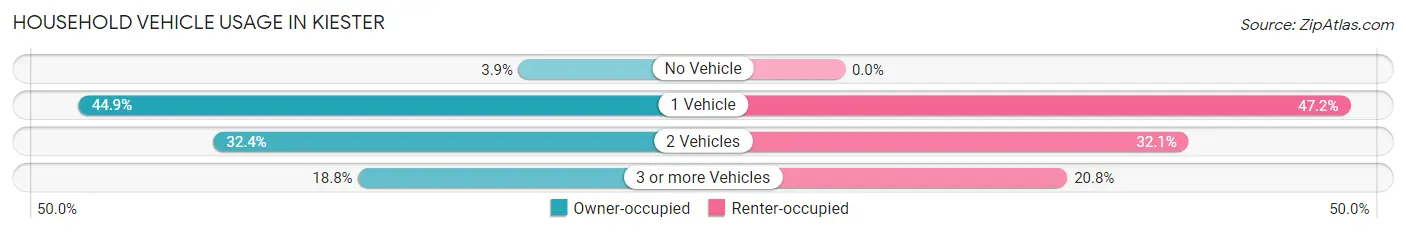
| Vehicles per Household | Owner-occupied | Renter-occupied |
| No Vehicle | 8 (3.9%) | 0 (0.0%) |
| 1 Vehicle | 93 (44.9%) | 25 (47.2%) |
| 2 Vehicles | 67 (32.4%) | 17 (32.1%) |
| 3 or more Vehicles | 39 (18.8%) | 11 (20.7%) |
| Total | 207 (100.0%) | 53 (100.0%) |
Real Estate & Mortgages in Kiester
Real Estate and Mortgage Overview in Kiester
| Characteristic | Without Mortgage | With Mortgage |
| Housing Units | 132 | 75 |
| Median Property Value | $39,500 | $46,100 |
| Median Household Income | $38,214 | $6 |
| Monthly Housing Costs | $417 | $2 |
| Real Estate Taxes | $916 | $0 |
Property Value by Mortgage Status in Kiester
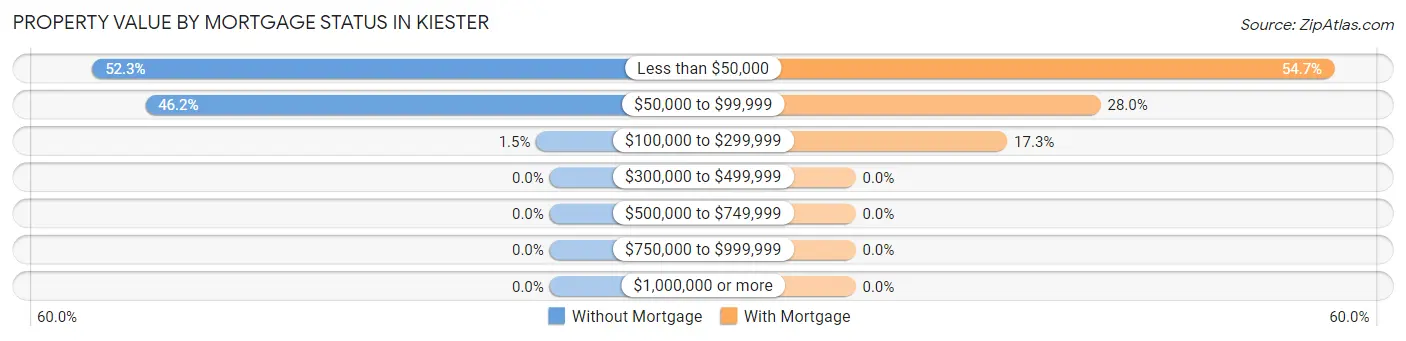
| Property Value | Without Mortgage | With Mortgage |
| Less than $50,000 | 69 (52.3%) | 41 (54.7%) |
| $50,000 to $99,999 | 61 (46.2%) | 21 (28.0%) |
| $100,000 to $299,999 | 2 (1.5%) | 13 (17.3%) |
| $300,000 to $499,999 | 0 (0.0%) | 0 (0.0%) |
| $500,000 to $749,999 | 0 (0.0%) | 0 (0.0%) |
| $750,000 to $999,999 | 0 (0.0%) | 0 (0.0%) |
| $1,000,000 or more | 0 (0.0%) | 0 (0.0%) |
| Total | 132 (100.0%) | 75 (100.0%) |
Household Income by Mortgage Status in Kiester
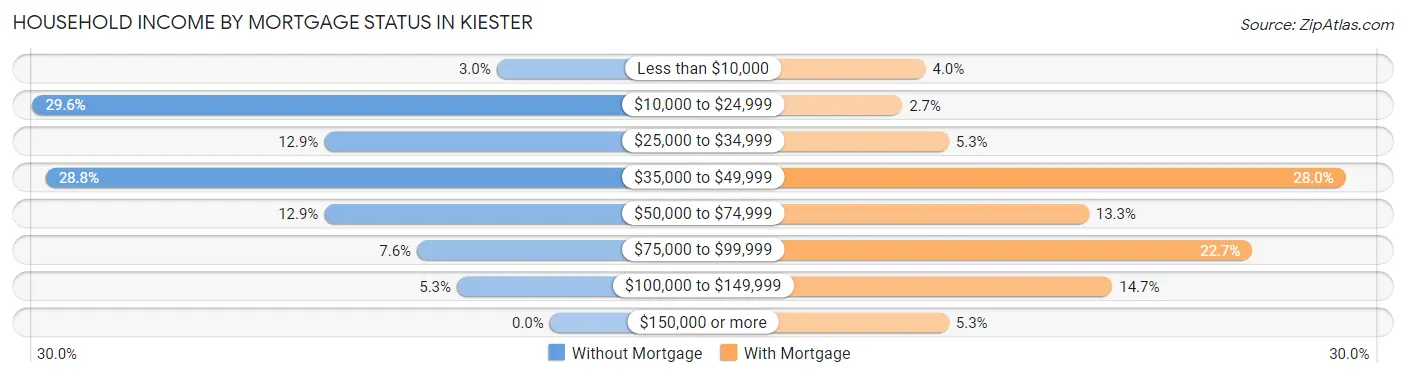
| Household Income | Without Mortgage | With Mortgage |
| Less than $10,000 | 4 (3.0%) | 3 (4.0%) |
| $10,000 to $24,999 | 39 (29.5%) | 2 (2.7%) |
| $25,000 to $34,999 | 17 (12.9%) | 4 (5.3%) |
| $35,000 to $49,999 | 38 (28.8%) | 21 (28.0%) |
| $50,000 to $74,999 | 17 (12.9%) | 10 (13.3%) |
| $75,000 to $99,999 | 10 (7.6%) | 17 (22.7%) |
| $100,000 to $149,999 | 7 (5.3%) | 11 (14.7%) |
| $150,000 or more | 0 (0.0%) | 4 (5.3%) |
| Total | 132 (100.0%) | 75 (100.0%) |
Property Value to Household Income Ratio in Kiester
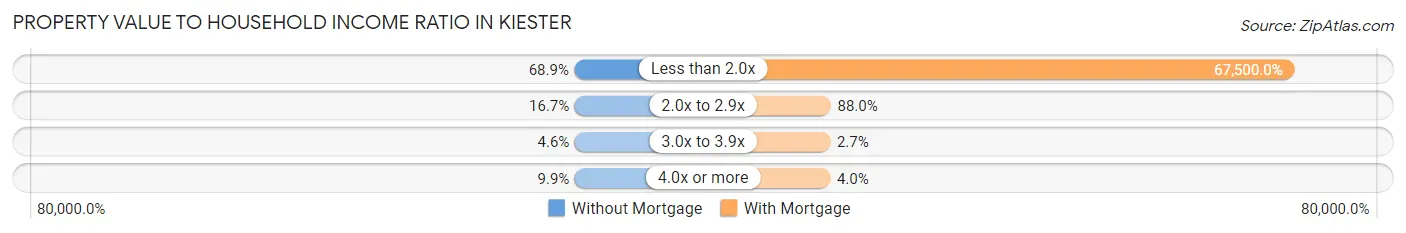
| Value-to-Income Ratio | Without Mortgage | With Mortgage |
| Less than 2.0x | 91 (68.9%) | 50,625 (67,500.0%) |
| 2.0x to 2.9x | 22 (16.7%) | 66 (88.0%) |
| 3.0x to 3.9x | 6 (4.5%) | 2 (2.7%) |
| 4.0x or more | 13 (9.9%) | 3 (4.0%) |
| Total | 132 (100.0%) | 75 (100.0%) |
Real Estate Taxes by Mortgage Status in Kiester
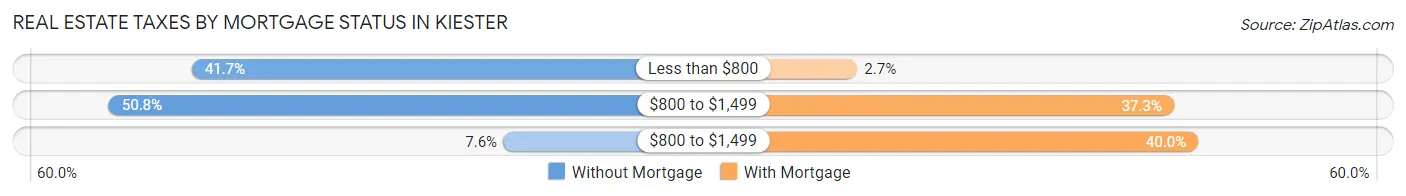
| Property Taxes | Without Mortgage | With Mortgage |
| Less than $800 | 55 (41.7%) | 2 (2.7%) |
| $800 to $1,499 | 67 (50.8%) | 28 (37.3%) |
| $800 to $1,499 | 10 (7.6%) | 30 (40.0%) |
| Total | 132 (100.0%) | 75 (100.0%) |
Health & Disability in Kiester
Health Insurance Coverage by Age in Kiester
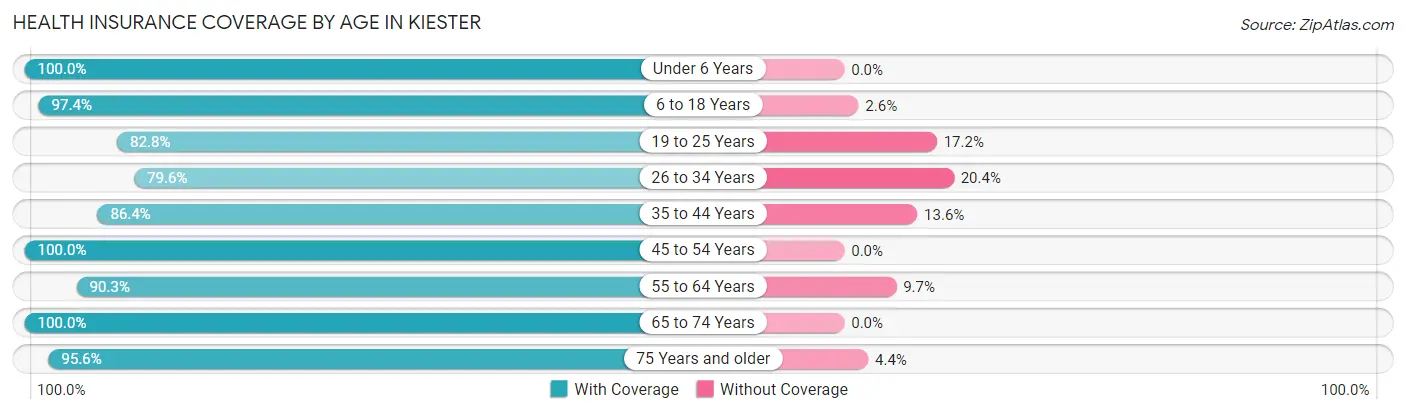
| Age Bracket | With Coverage | Without Coverage |
| Under 6 Years | 28 (100.0%) | 0 (0.0%) |
| 6 to 18 Years | 148 (97.4%) | 4 (2.6%) |
| 19 to 25 Years | 24 (82.8%) | 5 (17.2%) |
| 26 to 34 Years | 39 (79.6%) | 10 (20.4%) |
| 35 to 44 Years | 89 (86.4%) | 14 (13.6%) |
| 45 to 54 Years | 49 (100.0%) | 0 (0.0%) |
| 55 to 64 Years | 84 (90.3%) | 9 (9.7%) |
| 65 to 74 Years | 69 (100.0%) | 0 (0.0%) |
| 75 Years and older | 43 (95.6%) | 2 (4.4%) |
| Total | 573 (92.9%) | 44 (7.1%) |
Health Insurance Coverage by Citizenship Status in Kiester
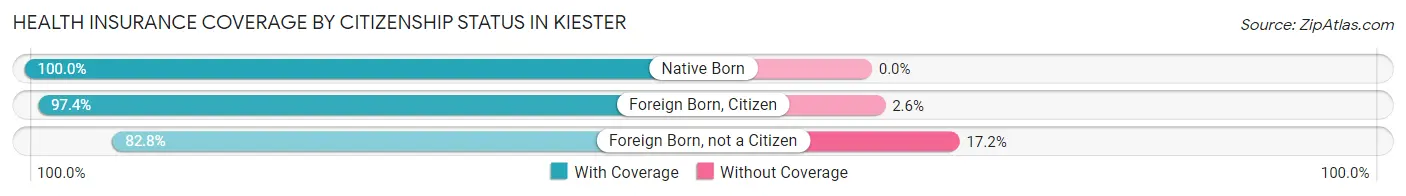
| Citizenship Status | With Coverage | Without Coverage |
| Native Born | 28 (100.0%) | 0 (0.0%) |
| Foreign Born, Citizen | 148 (97.4%) | 4 (2.6%) |
| Foreign Born, not a Citizen | 24 (82.8%) | 5 (17.2%) |
Health Insurance Coverage by Household Income in Kiester
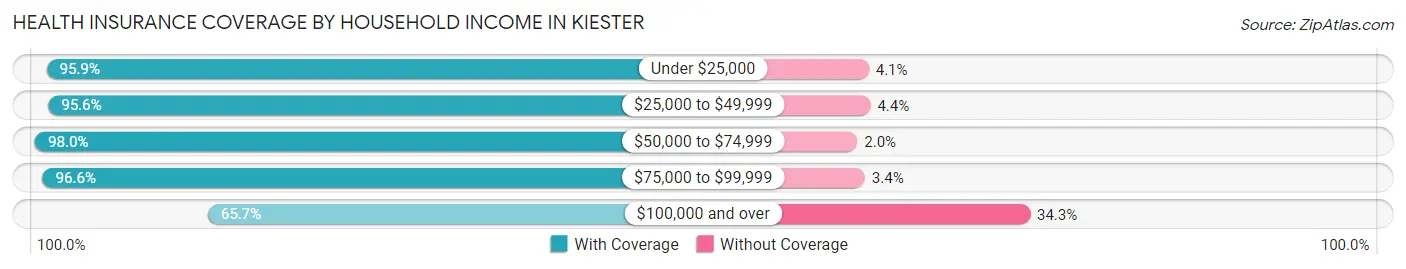
| Household Income | With Coverage | Without Coverage |
| Under $25,000 | 93 (95.9%) | 4 (4.1%) |
| $25,000 to $49,999 | 280 (95.6%) | 13 (4.4%) |
| $50,000 to $74,999 | 99 (98.0%) | 2 (2.0%) |
| $75,000 to $99,999 | 57 (96.6%) | 2 (3.4%) |
| $100,000 and over | 44 (65.7%) | 23 (34.3%) |
Public vs Private Health Insurance Coverage by Age in Kiester
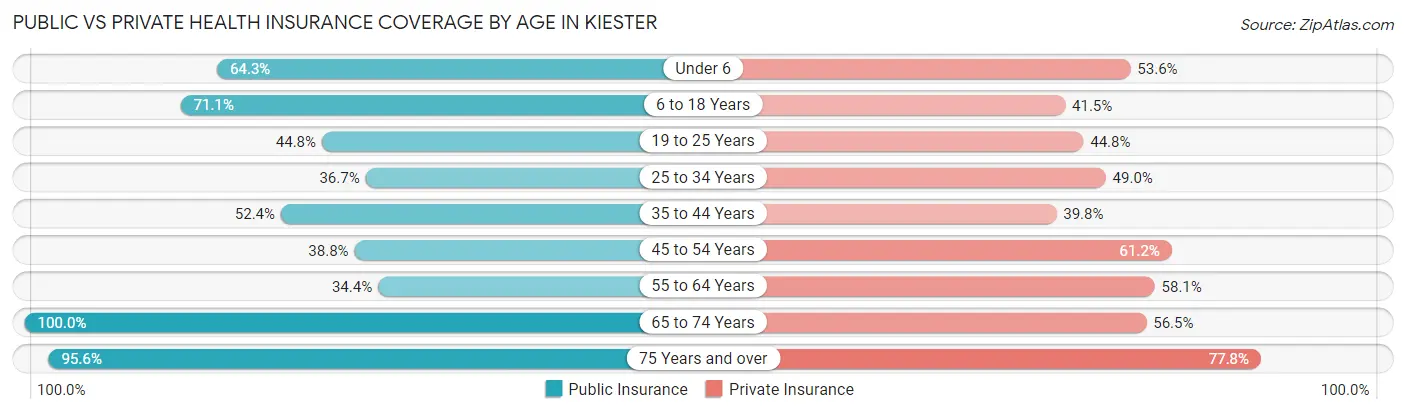
| Age Bracket | Public Insurance | Private Insurance |
| Under 6 | 18 (64.3%) | 15 (53.6%) |
| 6 to 18 Years | 108 (71.1%) | 63 (41.4%) |
| 19 to 25 Years | 13 (44.8%) | 13 (44.8%) |
| 25 to 34 Years | 18 (36.7%) | 24 (49.0%) |
| 35 to 44 Years | 54 (52.4%) | 41 (39.8%) |
| 45 to 54 Years | 19 (38.8%) | 30 (61.2%) |
| 55 to 64 Years | 32 (34.4%) | 54 (58.1%) |
| 65 to 74 Years | 69 (100.0%) | 39 (56.5%) |
| 75 Years and over | 43 (95.6%) | 35 (77.8%) |
| Total | 374 (60.6%) | 314 (50.9%) |
Disability Status by Sex by Age in Kiester
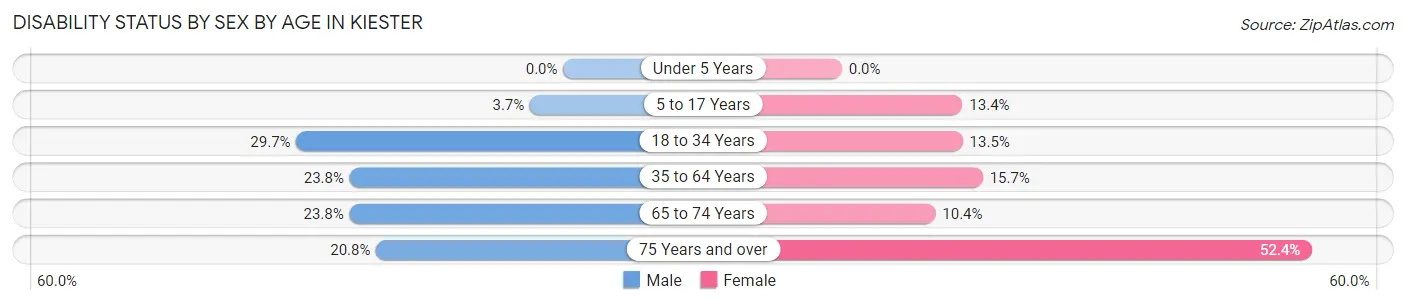
| Age Bracket | Male | Female |
| Under 5 Years | 0 (0.0%) | 0 (0.0%) |
| 5 to 17 Years | 3 (3.7%) | 9 (13.4%) |
| 18 to 34 Years | 11 (29.7%) | 7 (13.5%) |
| 35 to 64 Years | 34 (23.8%) | 16 (15.7%) |
| 65 to 74 Years | 5 (23.8%) | 5 (10.4%) |
| 75 Years and over | 5 (20.8%) | 11 (52.4%) |
Disability Class by Sex by Age in Kiester
Disability Class: Hearing Difficulty
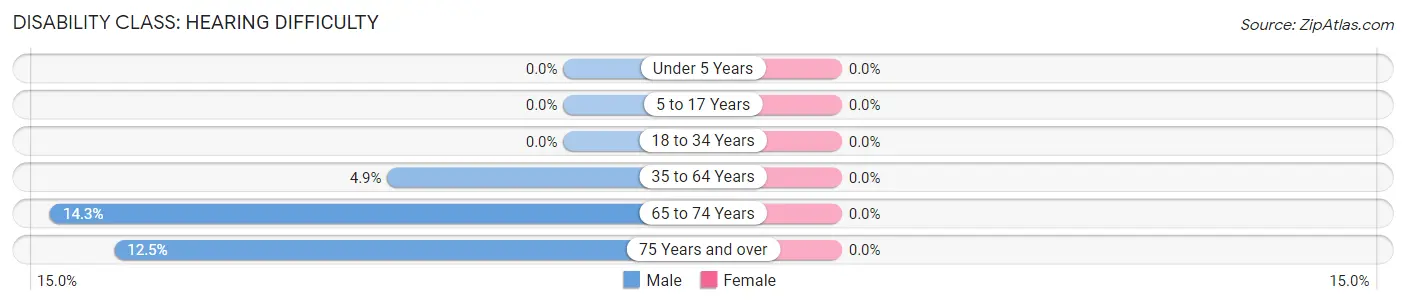
| Age Bracket | Male | Female |
| Under 5 Years | 0 (0.0%) | 0 (0.0%) |
| 5 to 17 Years | 0 (0.0%) | 0 (0.0%) |
| 18 to 34 Years | 0 (0.0%) | 0 (0.0%) |
| 35 to 64 Years | 7 (4.9%) | 0 (0.0%) |
| 65 to 74 Years | 3 (14.3%) | 0 (0.0%) |
| 75 Years and over | 3 (12.5%) | 0 (0.0%) |
Disability Class: Vision Difficulty
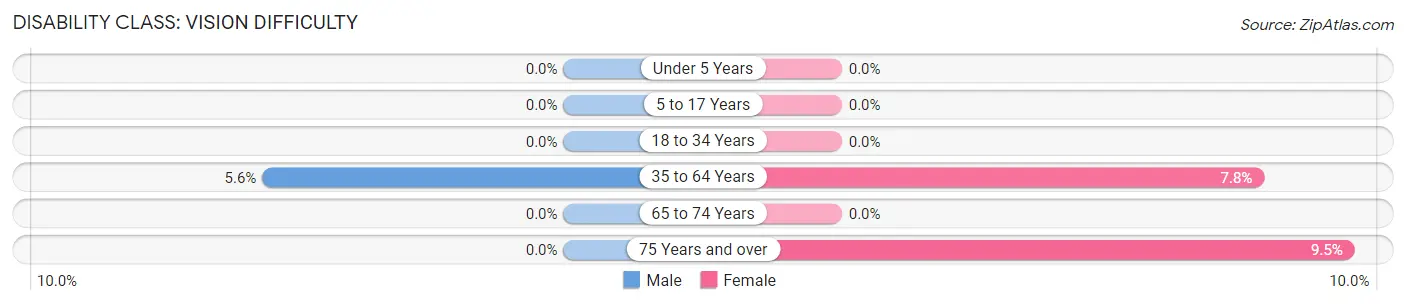
| Age Bracket | Male | Female |
| Under 5 Years | 0 (0.0%) | 0 (0.0%) |
| 5 to 17 Years | 0 (0.0%) | 0 (0.0%) |
| 18 to 34 Years | 0 (0.0%) | 0 (0.0%) |
| 35 to 64 Years | 8 (5.6%) | 8 (7.8%) |
| 65 to 74 Years | 0 (0.0%) | 0 (0.0%) |
| 75 Years and over | 0 (0.0%) | 2 (9.5%) |
Disability Class: Cognitive Difficulty
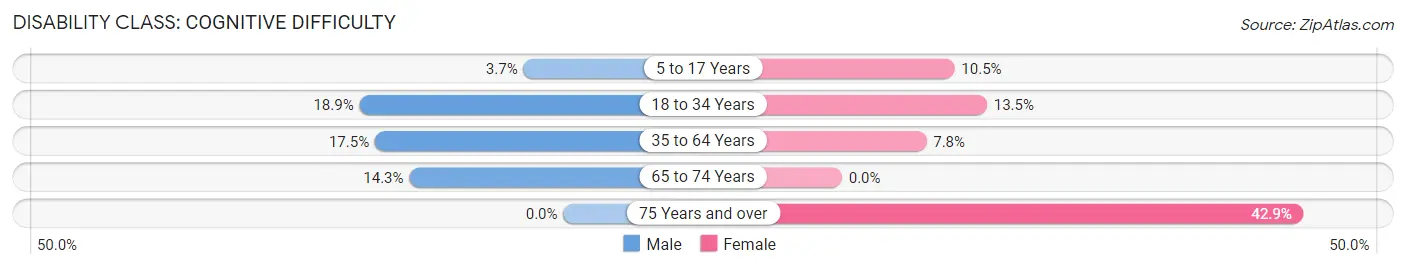
| Age Bracket | Male | Female |
| 5 to 17 Years | 3 (3.7%) | 7 (10.4%) |
| 18 to 34 Years | 7 (18.9%) | 7 (13.5%) |
| 35 to 64 Years | 25 (17.5%) | 8 (7.8%) |
| 65 to 74 Years | 3 (14.3%) | 0 (0.0%) |
| 75 Years and over | 0 (0.0%) | 9 (42.9%) |
Disability Class: Ambulatory Difficulty
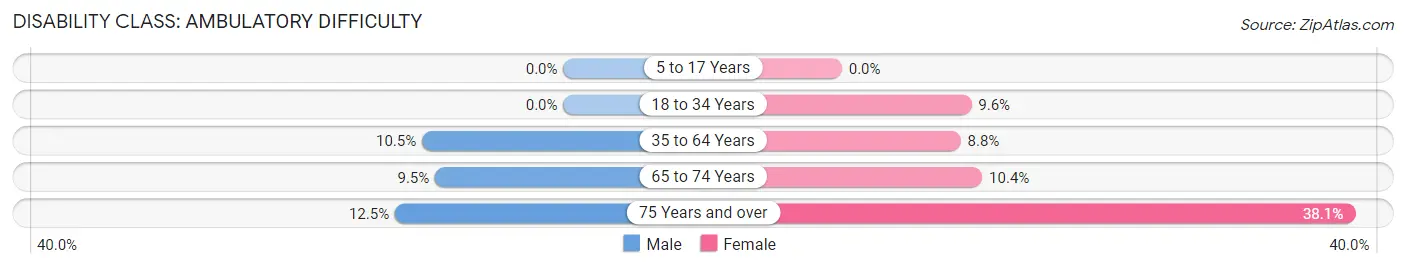
| Age Bracket | Male | Female |
| 5 to 17 Years | 0 (0.0%) | 0 (0.0%) |
| 18 to 34 Years | 0 (0.0%) | 5 (9.6%) |
| 35 to 64 Years | 15 (10.5%) | 9 (8.8%) |
| 65 to 74 Years | 2 (9.5%) | 5 (10.4%) |
| 75 Years and over | 3 (12.5%) | 8 (38.1%) |
Disability Class: Self-Care Difficulty
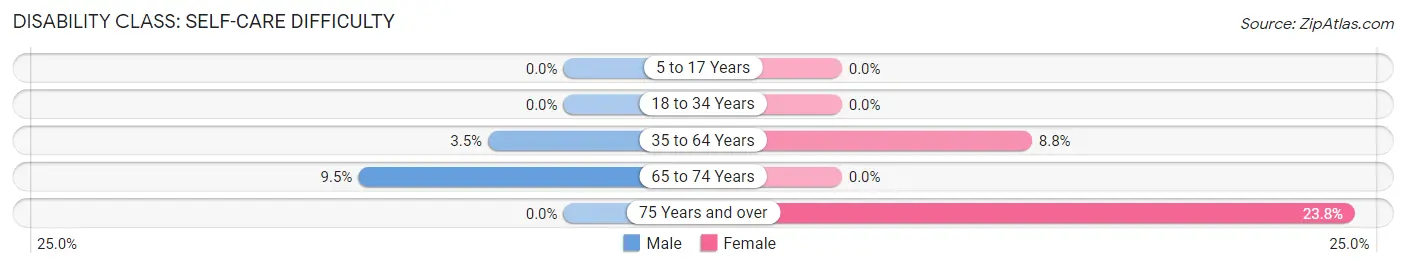
| Age Bracket | Male | Female |
| 5 to 17 Years | 0 (0.0%) | 0 (0.0%) |
| 18 to 34 Years | 0 (0.0%) | 0 (0.0%) |
| 35 to 64 Years | 5 (3.5%) | 9 (8.8%) |
| 65 to 74 Years | 2 (9.5%) | 0 (0.0%) |
| 75 Years and over | 0 (0.0%) | 5 (23.8%) |
Technology Access in Kiester
Computing Device Access in Kiester
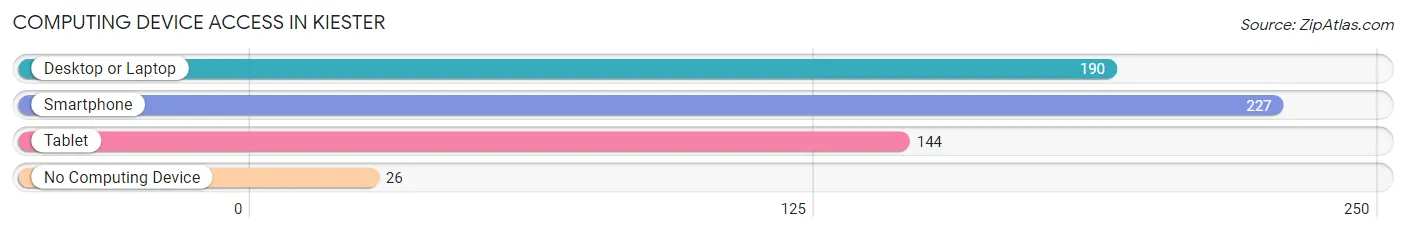
| Device Type | # Households | % Households |
| Desktop or Laptop | 190 | 73.1% |
| Smartphone | 227 | 87.3% |
| Tablet | 144 | 55.4% |
| No Computing Device | 26 | 10.0% |
| Total | 260 | 100.0% |
Internet Access in Kiester
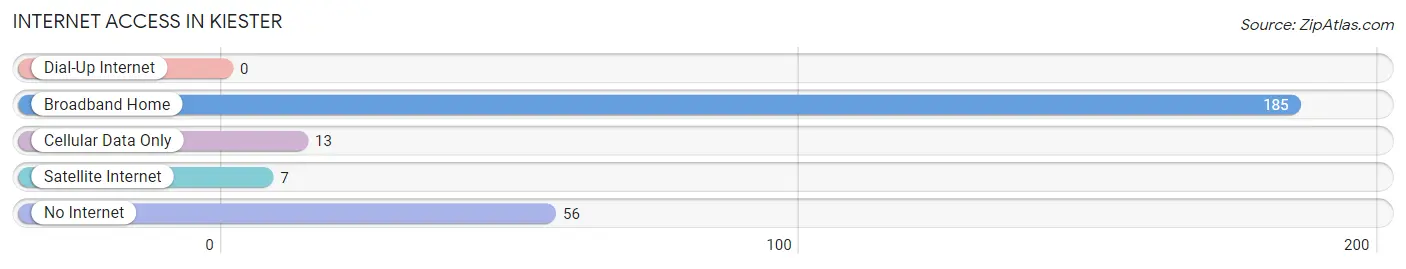
| Internet Type | # Households | % Households |
| Dial-Up Internet | 0 | 0.0% |
| Broadband Home | 185 | 71.2% |
| Cellular Data Only | 13 | 5.0% |
| Satellite Internet | 7 | 2.7% |
| No Internet | 56 | 21.5% |
| Total | 260 | 100.0% |
Kiester Summary
Kiester is a small city located in Faribault County, Minnesota. It is situated in the southeastern part of the state, about 50 miles south of the Twin Cities. The city has a population of approximately 500 people and covers an area of 0.6 square miles.
Kiester was founded in 1856 by German immigrants who were looking for a place to settle and farm. The city was named after the Kiester family, who were among the first settlers. The city was incorporated in 1876 and has remained a small, rural community ever since.
Geographically, Kiester is located in the rolling hills of the Minnesota River Valley. The city is surrounded by farmland and is situated on the banks of the Straight River. The climate in Kiester is typical of the Midwest, with cold winters and hot summers.
The economy of Kiester is largely based on agriculture. The city is home to several farms, which produce a variety of crops, including corn, soybeans, and wheat. In addition, Kiester is home to several small businesses, including a grocery store, a hardware store, and a restaurant.
Kiester is served by the Faribault County School District. The city has one elementary school, one middle school, and one high school. The city also has a public library and a community center.
Kiester is a predominantly white city, with a population that is 97.3% white. The median household income is $45,000, and the median home value is $125,000. The city has a low unemployment rate of 3.2%.
Kiester is a small, rural community that has remained largely unchanged for the past century. The city is home to a tight-knit community of residents who take pride in their city and its history. The city is a great place to live for those who enjoy the peace and quiet of small-town life.
Common Questions
What is Per Capita Income in Kiester?
Per Capita income in Kiester is $20,146.
What is the Median Family Income in Kiester?
Median Family Income in Kiester is $45,000.
What is the Median Household income in Kiester?
Median Household Income in Kiester is $44,091.
What is Income or Wage Gap in Kiester?
Income or Wage Gap in Kiester is 1.5%.
Women in Kiester earn 98.5 cents for every dollar earned by a man.
What is Family Income Deficit in Kiester?
Family Income Deficit in Kiester is $9,509.
Families that are below poverty line in Kiester earn $9,509 less on average than the poverty threshold level.
What is Inequality or Gini Index in Kiester?
Inequality or Gini Index in Kiester is 0.38.
What is the Total Population of Kiester?
Total Population of Kiester is 617.
What is the Total Male Population of Kiester?
Total Male Population of Kiester is 316.
What is the Total Female Population of Kiester?
Total Female Population of Kiester is 301.
What is the Ratio of Males per 100 Females in Kiester?
There are 104.98 Males per 100 Females in Kiester.
What is the Ratio of Females per 100 Males in Kiester?
There are 95.25 Females per 100 Males in Kiester.
What is the Median Population Age in Kiester?
Median Population Age in Kiester is 41.8 Years.
What is the Average Family Size in Kiester
Average Family Size in Kiester is 2.6 People.
What is the Average Household Size in Kiester
Average Household Size in Kiester is 2.4 People.
How Large is the Labor Force in Kiester?
There are 288 People in the Labor Forcein in Kiester.
What is the Percentage of People in the Labor Force in Kiester?
60.0% of People are in the Labor Force in Kiester.
What is the Unemployment Rate in Kiester?
Unemployment Rate in Kiester is 11.5%.