Kettle River, MN Map & Demographics
Kettle River Map
Kettle River Overview
$28,162
PER CAPITA INCOME
$82,679
AVG FAMILY INCOME
$51,250
AVG HOUSEHOLD INCOME
51.9%
WAGE / INCOME GAP [ % ]
48.1¢/ $1
WAGE / INCOME GAP [ $ ]
0.36
INEQUALITY / GINI INDEX
117
TOTAL POPULATION
64
MALE POPULATION
53
FEMALE POPULATION
120.75
MALES / 100 FEMALES
82.81
FEMALES / 100 MALES
48.3
MEDIAN AGE
2.7
AVG FAMILY SIZE
2.2
AVG HOUSEHOLD SIZE
57
LABOR FORCE [ PEOPLE ]
57.6%
PERCENT IN LABOR FORCE
5.3%
UNEMPLOYMENT RATE
Kettle River Zip Codes
Kettle River Area Codes
Income in Kettle River
Income Overview in Kettle River
Per Capita Income in Kettle River is $28,162, while median incomes of families and households are $82,679 and $51,250 respectively.
| Characteristic | Number | Measure |
| Per Capita Income | 117 | $28,162 |
| Median Family Income | 35 | $82,679 |
| Mean Family Income | 35 | $76,357 |
| Median Household Income | 53 | $51,250 |
| Mean Household Income | 53 | $62,292 |
| Income Deficit | 35 | $0 |
| Wage / Income Gap (%) | 117 | 51.90% |
| Wage / Income Gap ($) | 117 | 48.10¢ per $1 |
| Gini / Inequality Index | 117 | 0.36 |
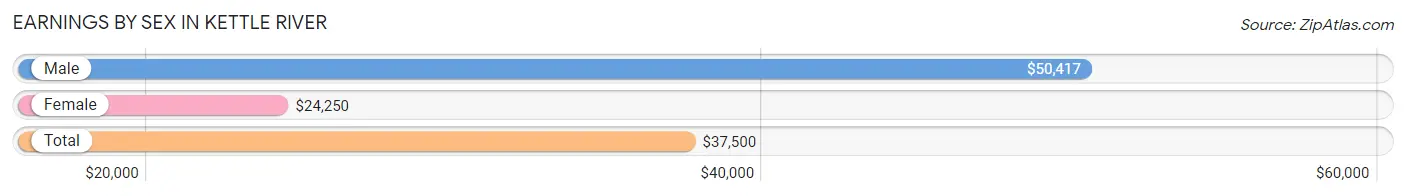
Earnings by Sex in Kettle River
Average Earnings in Kettle River are $37,500, $50,417 for men and $24,250 for women, a difference of 51.9%.
| Sex | Number | Average Earnings |
| Male | 33 (53.2%) | $50,417 |
| Female | 29 (46.8%) | $24,250 |
| Total | 62 (100.0%) | $37,500 |
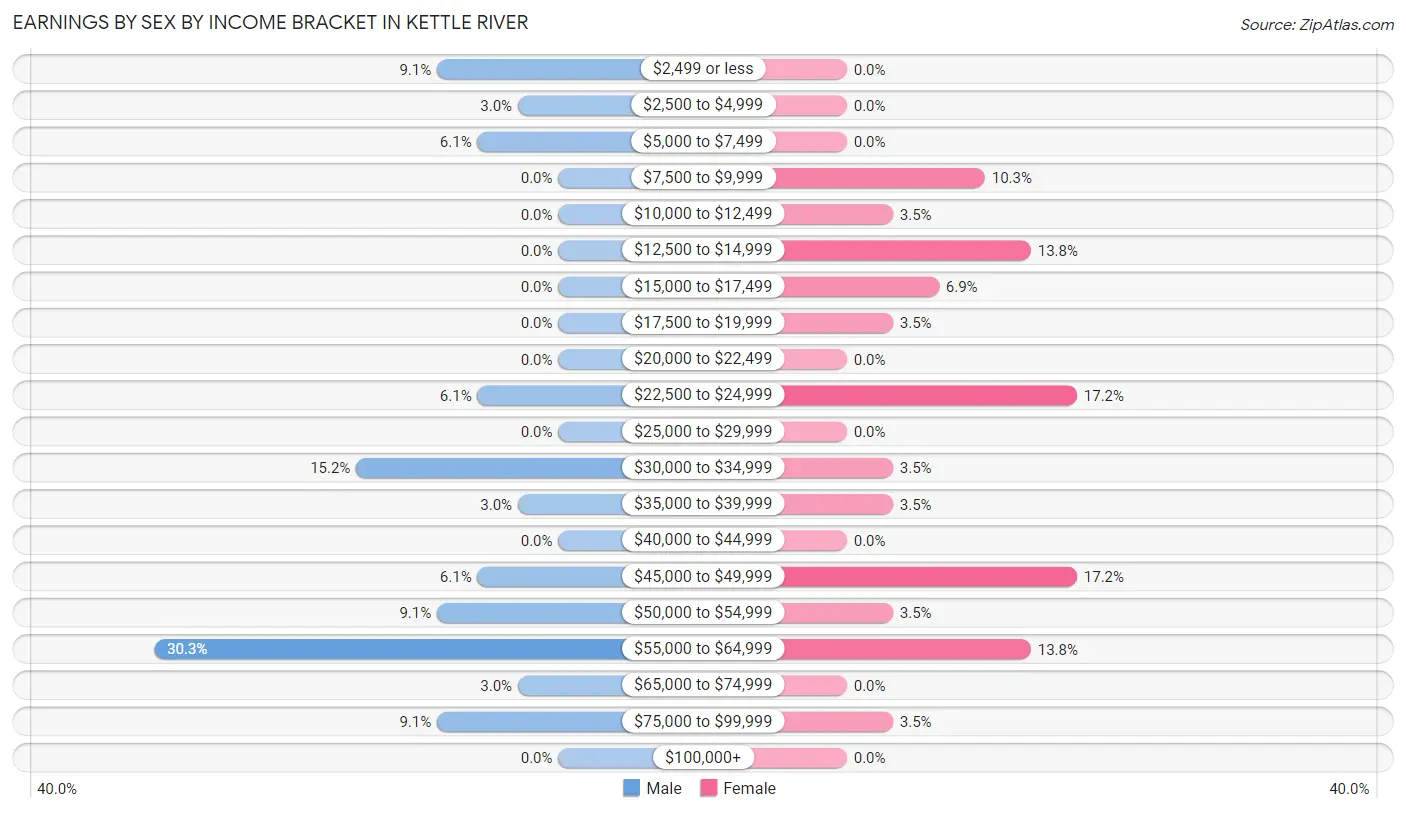
Earnings by Sex by Income Bracket in Kettle River
The most common earnings brackets in Kettle River are $55,000 to $64,999 for men (10 | 30.3%) and $22,500 to $24,999 for women (5 | 17.2%).
| Income | Male | Female |
| $2,499 or less | 3 (9.1%) | 0 (0.0%) |
| $2,500 to $4,999 | 1 (3.0%) | 0 (0.0%) |
| $5,000 to $7,499 | 2 (6.1%) | 0 (0.0%) |
| $7,500 to $9,999 | 0 (0.0%) | 3 (10.3%) |
| $10,000 to $12,499 | 0 (0.0%) | 1 (3.5%) |
| $12,500 to $14,999 | 0 (0.0%) | 4 (13.8%) |
| $15,000 to $17,499 | 0 (0.0%) | 2 (6.9%) |
| $17,500 to $19,999 | 0 (0.0%) | 1 (3.5%) |
| $20,000 to $22,499 | 0 (0.0%) | 0 (0.0%) |
| $22,500 to $24,999 | 2 (6.1%) | 5 (17.2%) |
| $25,000 to $29,999 | 0 (0.0%) | 0 (0.0%) |
| $30,000 to $34,999 | 5 (15.1%) | 1 (3.5%) |
| $35,000 to $39,999 | 1 (3.0%) | 1 (3.5%) |
| $40,000 to $44,999 | 0 (0.0%) | 0 (0.0%) |
| $45,000 to $49,999 | 2 (6.1%) | 5 (17.2%) |
| $50,000 to $54,999 | 3 (9.1%) | 1 (3.5%) |
| $55,000 to $64,999 | 10 (30.3%) | 4 (13.8%) |
| $65,000 to $74,999 | 1 (3.0%) | 0 (0.0%) |
| $75,000 to $99,999 | 3 (9.1%) | 1 (3.5%) |
| $100,000+ | 0 (0.0%) | 0 (0.0%) |
| Total | 33 (100.0%) | 29 (100.0%) |
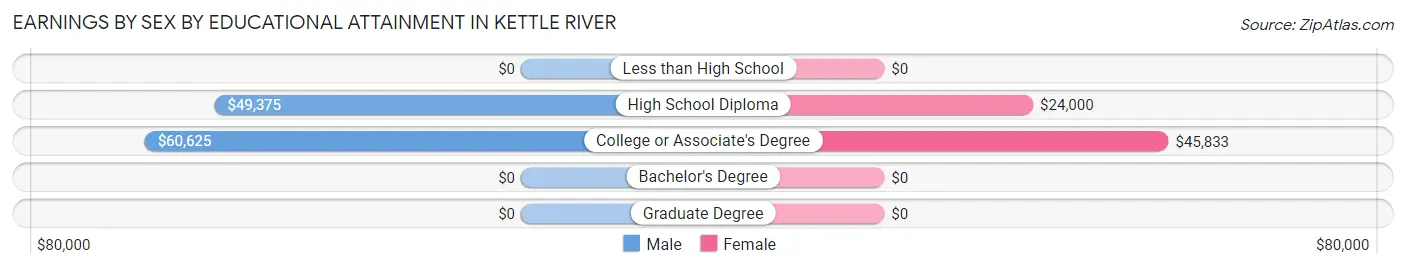
Earnings by Sex by Educational Attainment in Kettle River
Average earnings in Kettle River are $53,750 for men and $33,750 for women, a difference of 37.2%. Men with an educational attainment of college or associate's degree enjoy the highest average annual earnings of $60,625, while those with high school diploma education earn the least with $49,375. Women with an educational attainment of college or associate's degree earn the most with the average annual earnings of $45,833, while those with high school diploma education have the smallest earnings of $24,000.
| Educational Attainment | Male Income | Female Income |
| Less than High School | - | - |
| High School Diploma | $49,375 | $24,000 |
| College or Associate's Degree | $60,625 | $45,833 |
| Bachelor's Degree | - | - |
| Graduate Degree | - | - |
| Total | $53,750 | $33,750 |
Family Income in Kettle River
Family Income Brackets in Kettle River
According to the Kettle River family income data, there are 10 families falling into the $75,000 to $99,999 income range, which is the most common income bracket and makes up 28.6% of all families.
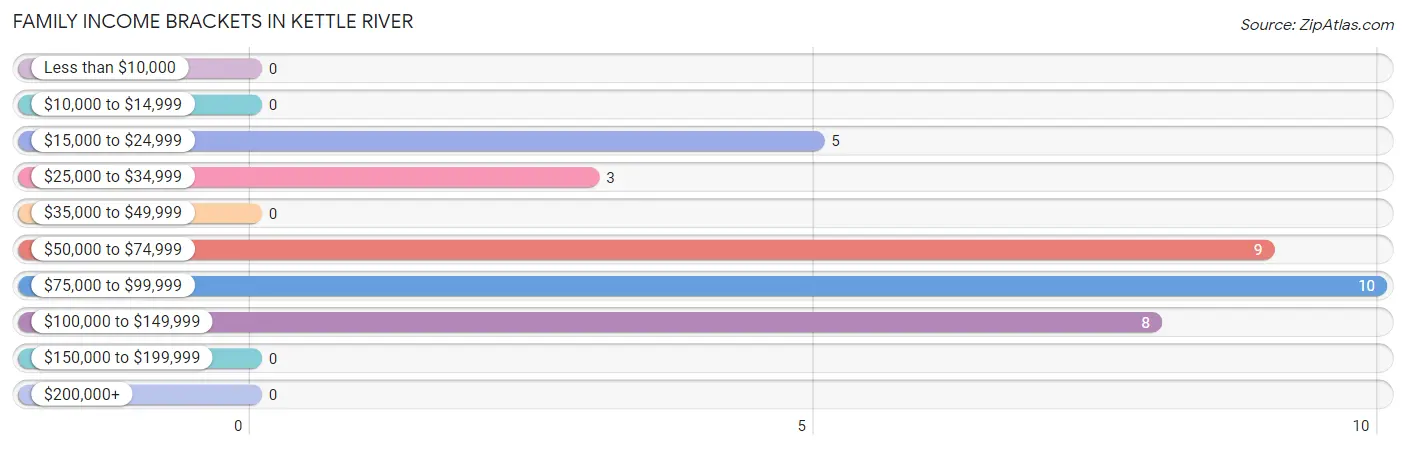
| Income Bracket | # Families | % Families |
| Less than $10,000 | 0 | 0.0% |
| $10,000 to $14,999 | 0 | 0.0% |
| $15,000 to $24,999 | 5 | 14.3% |
| $25,000 to $34,999 | 3 | 8.6% |
| $35,000 to $49,999 | 0 | 0.0% |
| $50,000 to $74,999 | 9 | 25.7% |
| $75,000 to $99,999 | 10 | 28.6% |
| $100,000 to $149,999 | 8 | 22.9% |
| $150,000 to $199,999 | 0 | 0.0% |
| $200,000+ | 0 | 0.0% |
Family Income by Famaliy Size in Kettle River
3-person families (8 | 22.9%) account for the highest median family income in Kettle River with $135,000 per family, while 3-person families (8 | 22.9%) have the highest median income of $45,000 per family member.
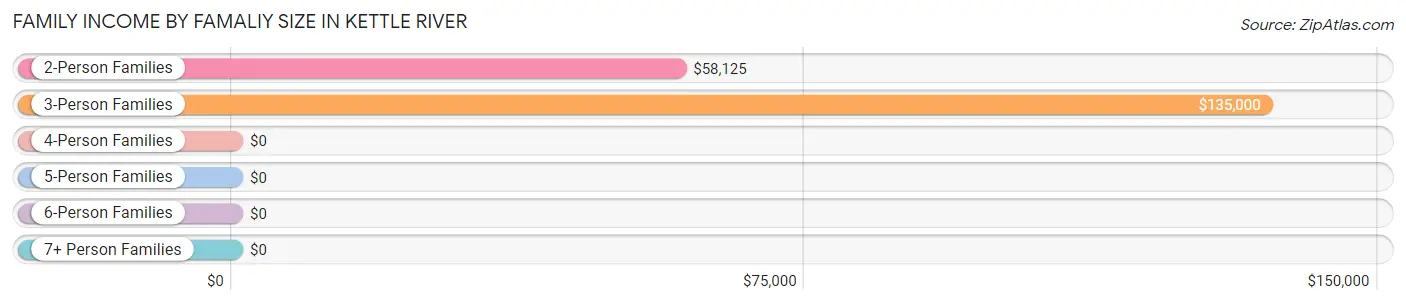
| Income Bracket | # Families | Median Income |
| 2-Person Families | 23 (65.7%) | $58,125 |
| 3-Person Families | 8 (22.9%) | $135,000 |
| 4-Person Families | 1 (2.9%) | $0 |
| 5-Person Families | 2 (5.7%) | $0 |
| 6-Person Families | 1 (2.9%) | $0 |
| 7+ Person Families | 0 (0.0%) | $0 |
| Total | 35 (100.0%) | $82,679 |
Family Income by Number of Earners in Kettle River
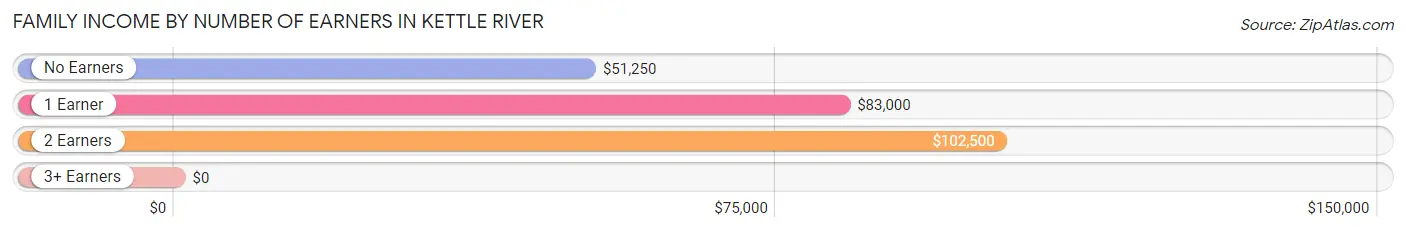
| Number of Earners | # Families | Median Income |
| No Earners | 5 (14.3%) | $51,250 |
| 1 Earner | 14 (40.0%) | $83,000 |
| 2 Earners | 14 (40.0%) | $102,500 |
| 3+ Earners | 2 (5.7%) | $0 |
| Total | 35 (100.0%) | $82,679 |
Household Income in Kettle River
Household Income Brackets in Kettle River
With 11 households falling in the category, the $25,000 to $34,999 income range is the most frequent in Kettle River, accounting for 20.7% of all households.
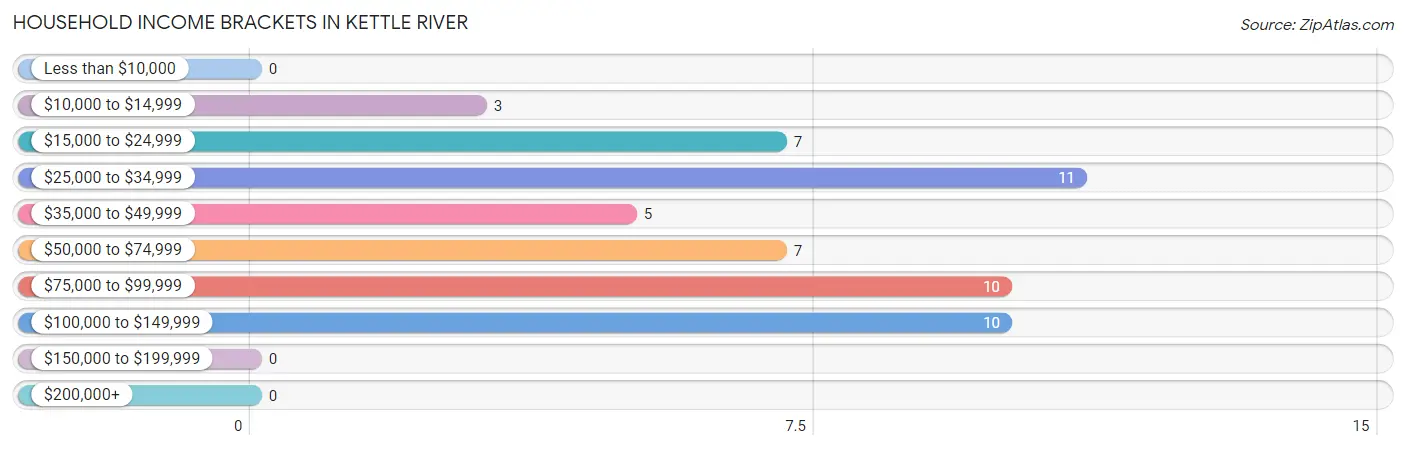
| Income Bracket | # Households | % Households |
| Less than $10,000 | 0 | 0.0% |
| $10,000 to $14,999 | 3 | 5.7% |
| $15,000 to $24,999 | 7 | 13.2% |
| $25,000 to $34,999 | 11 | 20.8% |
| $35,000 to $49,999 | 5 | 9.4% |
| $50,000 to $74,999 | 7 | 13.2% |
| $75,000 to $99,999 | 10 | 18.9% |
| $100,000 to $149,999 | 10 | 18.9% |
| $150,000 to $199,999 | 0 | 0.0% |
| $200,000+ | 0 | 0.0% |
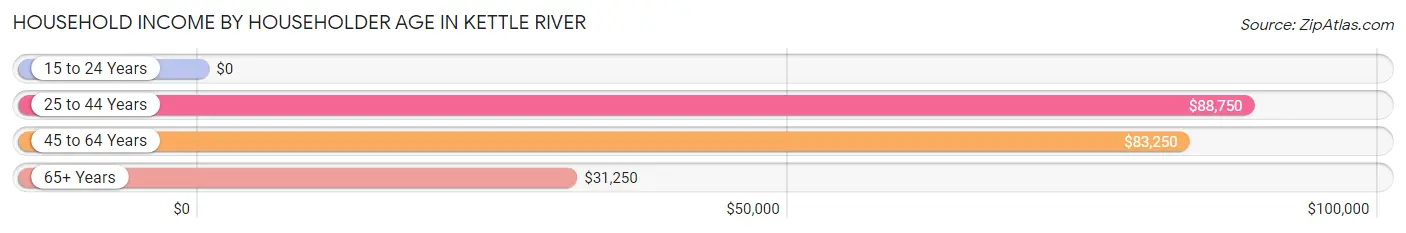
Household Income by Householder Age in Kettle River
The median household income in Kettle River is $51,250, with the highest median household income of $88,750 found in the 25 to 44 years age bracket for the primary householder. A total of 11 households (20.7%) fall into this category. Meanwhile, the 15 to 24 years age bracket for the primary householder has the lowest median household income of $0, with 5 households (9.4%) in this group.
| Income Bracket | # Households | Median Income |
| 15 to 24 Years | 5 (9.4%) | $0 |
| 25 to 44 Years | 11 (20.7%) | $88,750 |
| 45 to 64 Years | 19 (35.8%) | $83,250 |
| 65+ Years | 18 (34.0%) | $31,250 |
| Total | 53 (100.0%) | $51,250 |
Poverty in Kettle River
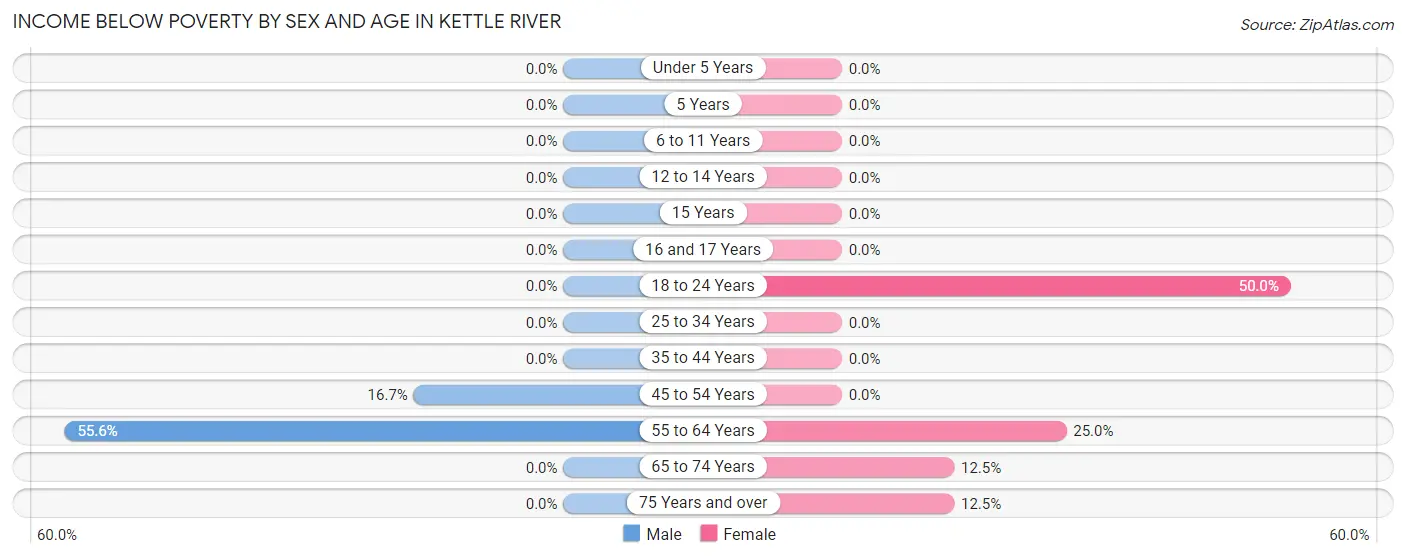
Income Below Poverty by Sex and Age in Kettle River
With 9.4% poverty level for males and 13.2% for females among the residents of Kettle River, 55 to 64 year old males and 18 to 24 year old females are the most vulnerable to poverty, with 5 males (55.6%) and 2 females (50.0%) in their respective age groups living below the poverty level.
| Age Bracket | Male | Female |
| Under 5 Years | 0 (0.0%) | 0 (0.0%) |
| 5 Years | 0 (0.0%) | 0 (0.0%) |
| 6 to 11 Years | 0 (0.0%) | 0 (0.0%) |
| 12 to 14 Years | 0 (0.0%) | 0 (0.0%) |
| 15 Years | 0 (0.0%) | 0 (0.0%) |
| 16 and 17 Years | 0 (0.0%) | 0 (0.0%) |
| 18 to 24 Years | 0 (0.0%) | 2 (50.0%) |
| 25 to 34 Years | 0 (0.0%) | 0 (0.0%) |
| 35 to 44 Years | 0 (0.0%) | 0 (0.0%) |
| 45 to 54 Years | 1 (16.7%) | 0 (0.0%) |
| 55 to 64 Years | 5 (55.6%) | 3 (25.0%) |
| 65 to 74 Years | 0 (0.0%) | 1 (12.5%) |
| 75 Years and over | 0 (0.0%) | 1 (12.5%) |
| Total | 6 (9.4%) | 7 (13.2%) |
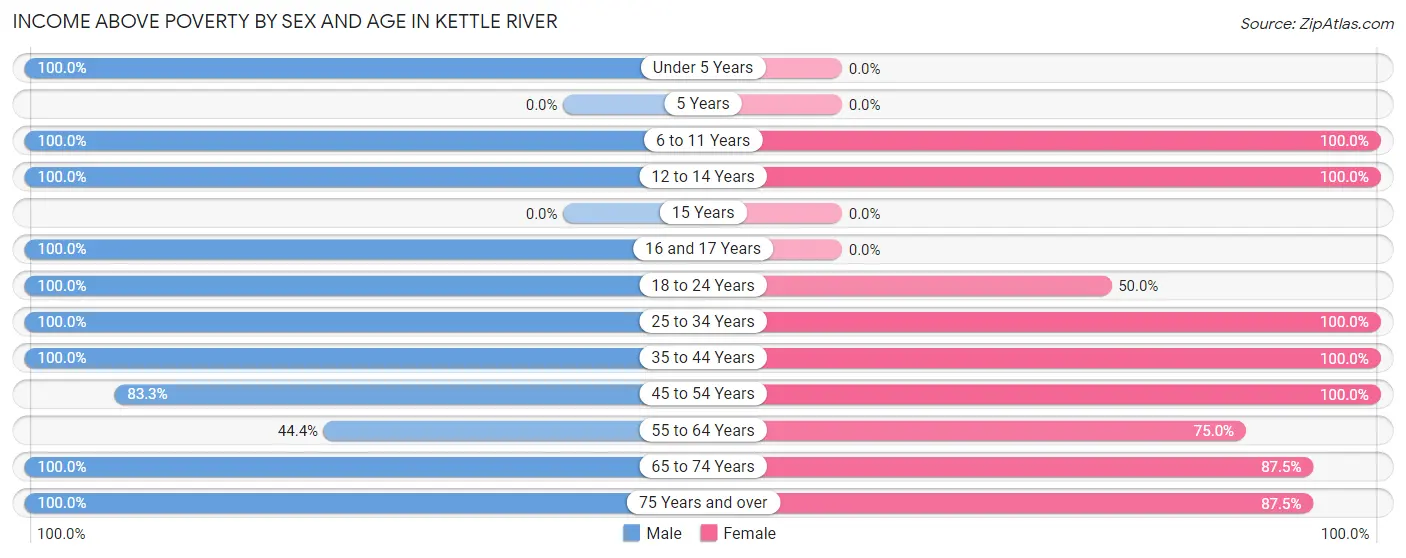
Income Above Poverty by Sex and Age in Kettle River
According to the poverty statistics in Kettle River, males aged under 5 years and females aged 6 to 11 years are the age groups that are most secure financially, with 100.0% of males and 100.0% of females in these age groups living above the poverty line.
| Age Bracket | Male | Female |
| Under 5 Years | 2 (100.0%) | 0 (0.0%) |
| 5 Years | 0 (0.0%) | 0 (0.0%) |
| 6 to 11 Years | 7 (100.0%) | 3 (100.0%) |
| 12 to 14 Years | 5 (100.0%) | 1 (100.0%) |
| 15 Years | 0 (0.0%) | 0 (0.0%) |
| 16 and 17 Years | 2 (100.0%) | 0 (0.0%) |
| 18 to 24 Years | 5 (100.0%) | 2 (50.0%) |
| 25 to 34 Years | 4 (100.0%) | 5 (100.0%) |
| 35 to 44 Years | 10 (100.0%) | 9 (100.0%) |
| 45 to 54 Years | 5 (83.3%) | 3 (100.0%) |
| 55 to 64 Years | 4 (44.4%) | 9 (75.0%) |
| 65 to 74 Years | 8 (100.0%) | 7 (87.5%) |
| 75 Years and over | 6 (100.0%) | 7 (87.5%) |
| Total | 58 (90.6%) | 46 (86.8%) |
Income Below Poverty Among Married-Couple Families in Kettle River
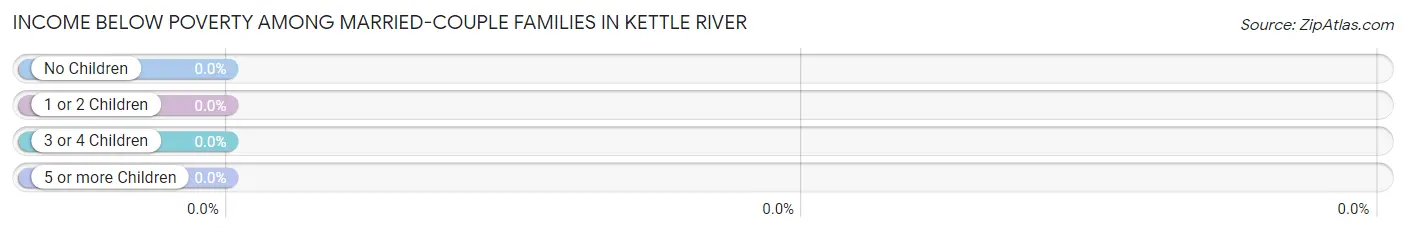
| Children | Above Poverty | Below Poverty |
| No Children | 15 (100.0%) | 0 (0.0%) |
| 1 or 2 Children | 8 (100.0%) | 0 (0.0%) |
| 3 or 4 Children | 1 (100.0%) | 0 (0.0%) |
| 5 or more Children | 0 (0.0%) | 0 (0.0%) |
| Total | 24 (100.0%) | 0 (0.0%) |
Income Below Poverty Among Single-Parent Households in Kettle River
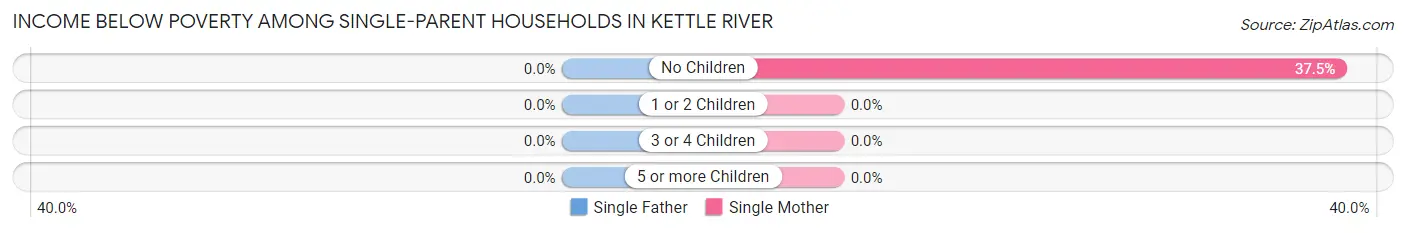
| Children | Single Father | Single Mother |
| No Children | 0 (0.0%) | 3 (37.5%) |
| 1 or 2 Children | 0 (0.0%) | 0 (0.0%) |
| 3 or 4 Children | 0 (0.0%) | 0 (0.0%) |
| 5 or more Children | 0 (0.0%) | 0 (0.0%) |
| Total | 0 (0.0%) | 3 (37.5%) |
Income Below Poverty Among Married-Couple vs Single-Parent Households in Kettle River
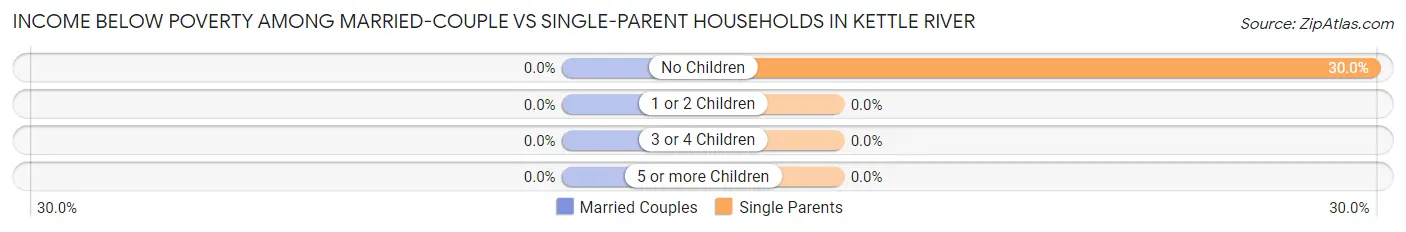
| Children | Married-Couple Families | Single-Parent Households |
| No Children | 0 (0.0%) | 3 (30.0%) |
| 1 or 2 Children | 0 (0.0%) | 0 (0.0%) |
| 3 or 4 Children | 0 (0.0%) | 0 (0.0%) |
| 5 or more Children | 0 (0.0%) | 0 (0.0%) |
| Total | 0 (0.0%) | 3 (27.3%) |
Race in Kettle River
The most populous races in Kettle River are White / Caucasian (101 | 86.3%), Two or more Races (11 | 9.4%), and Native / Alaskan (5 | 4.3%).
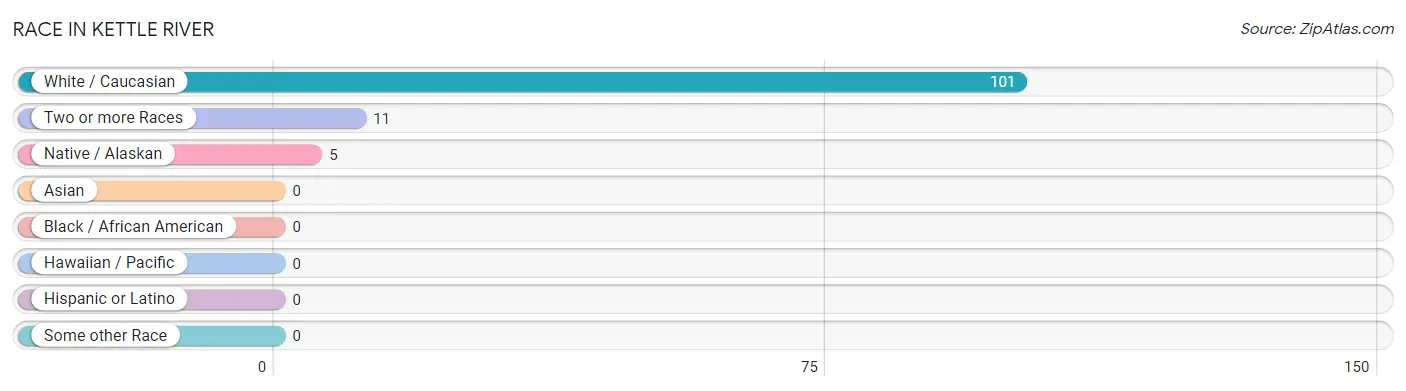
| Race | # Population | % Population |
| Asian | 0 | 0.0% |
| Black / African American | 0 | 0.0% |
| Hawaiian / Pacific | 0 | 0.0% |
| Hispanic or Latino | 0 | 0.0% |
| Native / Alaskan | 5 | 4.3% |
| White / Caucasian | 101 | 86.3% |
| Two or more Races | 11 | 9.4% |
| Some other Race | 0 | 0.0% |
| Total | 117 | 100.0% |
Ancestry in Kettle River
The most populous ancestries reported in Kettle River are Finnish (44 | 37.6%), German (30 | 25.6%), Irish (15 | 12.8%), English (13 | 11.1%), and Polish (12 | 10.3%), together accounting for 97.4% of all Kettle River residents.
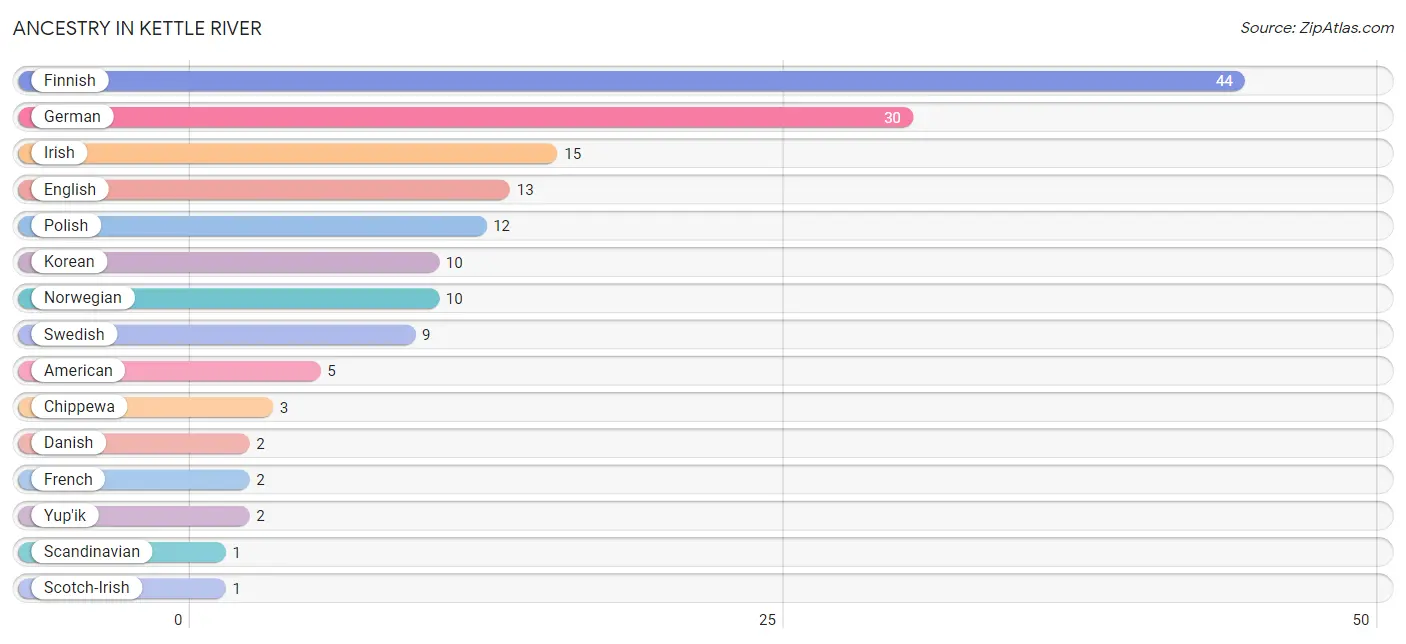
| Ancestry | # Population | % Population |
| American | 5 | 4.3% |
| Chippewa | 3 | 2.6% |
| Danish | 2 | 1.7% |
| English | 13 | 11.1% |
| Finnish | 44 | 37.6% |
| French | 2 | 1.7% |
| German | 30 | 25.6% |
| Irish | 15 | 12.8% |
| Korean | 10 | 8.6% |
| Norwegian | 10 | 8.6% |
| Polish | 12 | 10.3% |
| Scandinavian | 1 | 0.9% |
| Scotch-Irish | 1 | 0.9% |
| Swedish | 9 | 7.7% |
| Yup'ik | 2 | 1.7% | View All 15 Rows |
Immigrants in Kettle River

| Immigration Origin | # Population | % Population | View All 0 Rows |
Sex and Age in Kettle River
Sex and Age in Kettle River
The most populous age groups in Kettle River are 10 to 14 Years (8 | 12.5%) for men and 60 to 64 Years (10 | 18.9%) for women.
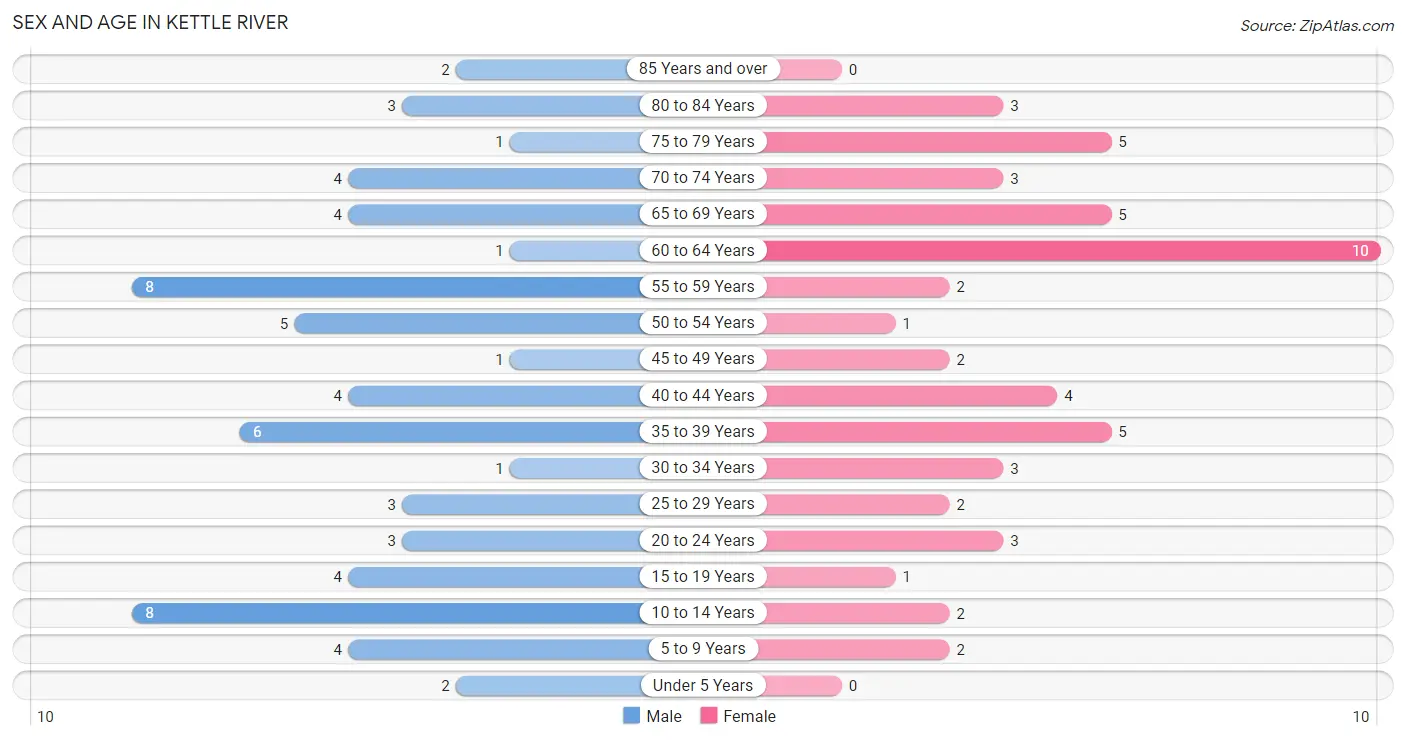
| Age Bracket | Male | Female |
| Under 5 Years | 2 (3.1%) | 0 (0.0%) |
| 5 to 9 Years | 4 (6.2%) | 2 (3.8%) |
| 10 to 14 Years | 8 (12.5%) | 2 (3.8%) |
| 15 to 19 Years | 4 (6.2%) | 1 (1.9%) |
| 20 to 24 Years | 3 (4.7%) | 3 (5.7%) |
| 25 to 29 Years | 3 (4.7%) | 2 (3.8%) |
| 30 to 34 Years | 1 (1.6%) | 3 (5.7%) |
| 35 to 39 Years | 6 (9.4%) | 5 (9.4%) |
| 40 to 44 Years | 4 (6.2%) | 4 (7.5%) |
| 45 to 49 Years | 1 (1.6%) | 2 (3.8%) |
| 50 to 54 Years | 5 (7.8%) | 1 (1.9%) |
| 55 to 59 Years | 8 (12.5%) | 2 (3.8%) |
| 60 to 64 Years | 1 (1.6%) | 10 (18.9%) |
| 65 to 69 Years | 4 (6.2%) | 5 (9.4%) |
| 70 to 74 Years | 4 (6.2%) | 3 (5.7%) |
| 75 to 79 Years | 1 (1.6%) | 5 (9.4%) |
| 80 to 84 Years | 3 (4.7%) | 3 (5.7%) |
| 85 Years and over | 2 (3.1%) | 0 (0.0%) |
| Total | 64 (100.0%) | 53 (100.0%) |
Families and Households in Kettle River
Median Family Size in Kettle River
The median family size in Kettle River is 2.69 persons per family, with married-couple families (24 | 68.6%) accounting for the largest median family size of 2.83 persons per family. On the other hand, single female/mother families (8 | 22.9%) represent the smallest median family size with 2.25 persons per family.
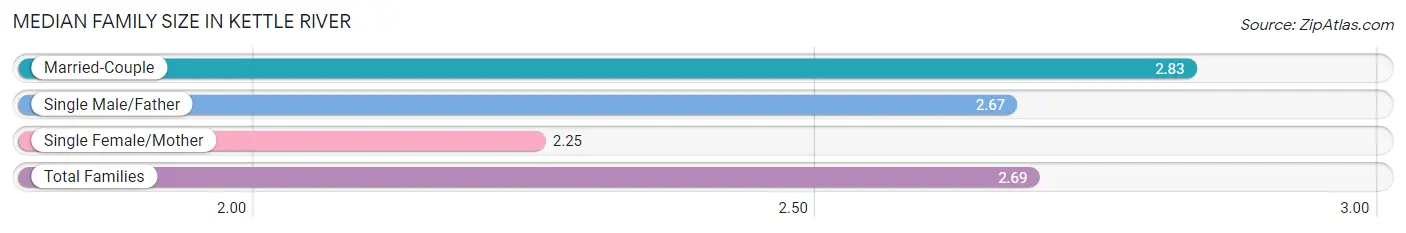
| Family Type | # Families | Family Size |
| Married-Couple | 24 (68.6%) | 2.83 |
| Single Male/Father | 3 (8.6%) | 2.67 |
| Single Female/Mother | 8 (22.9%) | 2.25 |
| Total Families | 35 (100.0%) | 2.69 |
Median Household Size in Kettle River
The median household size in Kettle River is 2.21 persons per household, with single male/father households (3 | 5.7%) accounting for the largest median household size of 3.33 persons per household. non-family households (18 | 34.0%) represent the smallest median household size with 1.17 persons per household.
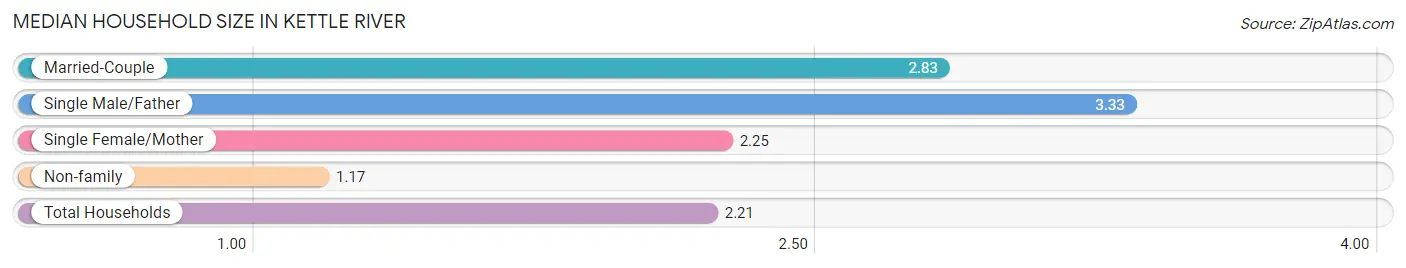
| Household Type | # Households | Household Size |
| Married-Couple | 24 (45.3%) | 2.83 |
| Single Male/Father | 3 (5.7%) | 3.33 |
| Single Female/Mother | 8 (15.1%) | 2.25 |
| Non-family | 18 (34.0%) | 1.17 |
| Total Households | 53 (100.0%) | 2.21 |
Household Size by Marriage Status in Kettle River
Out of a total of 53 households in Kettle River, 35 (66.0%) are family households, while 18 (34.0%) are nonfamily households. The most numerous type of family households are 2-person households, comprising 21, and the most common type of nonfamily households are 1-person households, comprising 15.
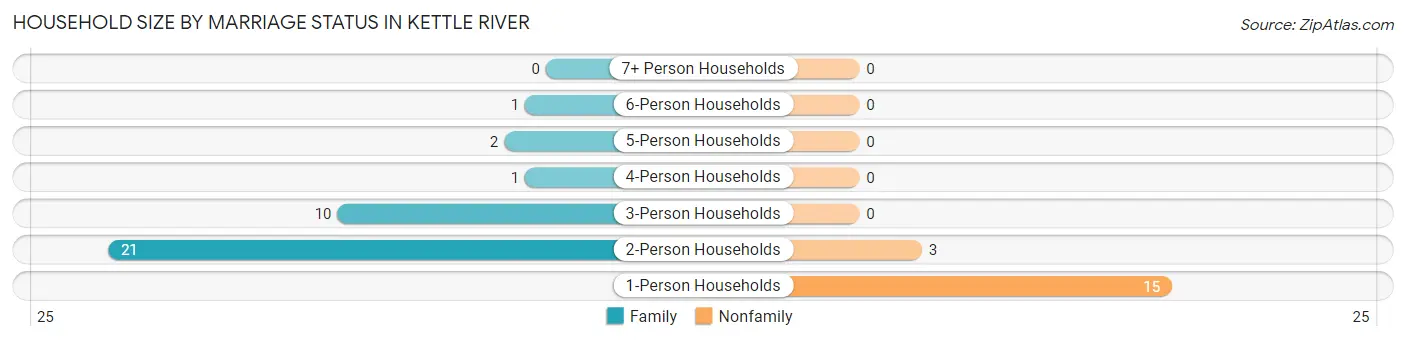
| Household Size | Family Households | Nonfamily Households |
| 1-Person Households | - | 15 (28.3%) |
| 2-Person Households | 21 (39.6%) | 3 (5.7%) |
| 3-Person Households | 10 (18.9%) | 0 (0.0%) |
| 4-Person Households | 1 (1.9%) | 0 (0.0%) |
| 5-Person Households | 2 (3.8%) | 0 (0.0%) |
| 6-Person Households | 1 (1.9%) | 0 (0.0%) |
| 7+ Person Households | 0 (0.0%) | 0 (0.0%) |
| Total | 35 (66.0%) | 18 (34.0%) |
Female Fertility in Kettle River
Fertility by Age in Kettle River
| Age Bracket | Women with Births | Births / 1,000 Women |
| 15 to 19 years | 0 (0.0%) | 0.0 |
| 20 to 34 years | 0 (0.0%) | 0.0 |
| 35 to 50 years | 0 (0.0%) | 0.0 |
| Total | 0 (0.0%) | 0.0 |
Fertility by Age by Marriage Status in Kettle River
| Age Bracket | Married | Unmarried |
| 15 to 19 years | 0 (0.0%) | 0 (0.0%) |
| 20 to 34 years | 0 (0.0%) | 0 (0.0%) |
| 35 to 50 years | 0 (0.0%) | 0 (0.0%) |
| Total | 0 (0.0%) | 0 (0.0%) |
Fertility by Education in Kettle River
| Educational Attainment | Women with Births | Births / 1,000 Women |
| Less than High School | 0 (0.0%) | 0.0 |
| High School Diploma | 0 (0.0%) | 0.0 |
| College or Associate's Degree | 0 (0.0%) | 0.0 |
| Bachelor's Degree | 0 (0.0%) | 0.0 |
| Graduate Degree | 0 (0.0%) | 0.0 |
| Total | 0 (0.0%) | 0.0 |
Fertility by Education by Marriage Status in Kettle River
| Educational Attainment | Married | Unmarried |
| Less than High School | 0 (0.0%) | 0 (0.0%) |
| High School Diploma | 0 (0.0%) | 0 (0.0%) |
| College or Associate's Degree | 0 (0.0%) | 0 (0.0%) |
| Bachelor's Degree | 0 (0.0%) | 0 (0.0%) |
| Graduate Degree | 0 (0.0%) | 0 (0.0%) |
| Total | 0 (0.0%) | 0 (0.0%) |
Employment Characteristics in Kettle River
Employment by Class of Employer in Kettle River
Among the 51 employed individuals in Kettle River, private company employees (29 | 56.9%), not-for-profit organizations (7 | 13.7%), and self-employed (not incorporated) (5 | 9.8%) make up the most common classes of employment.
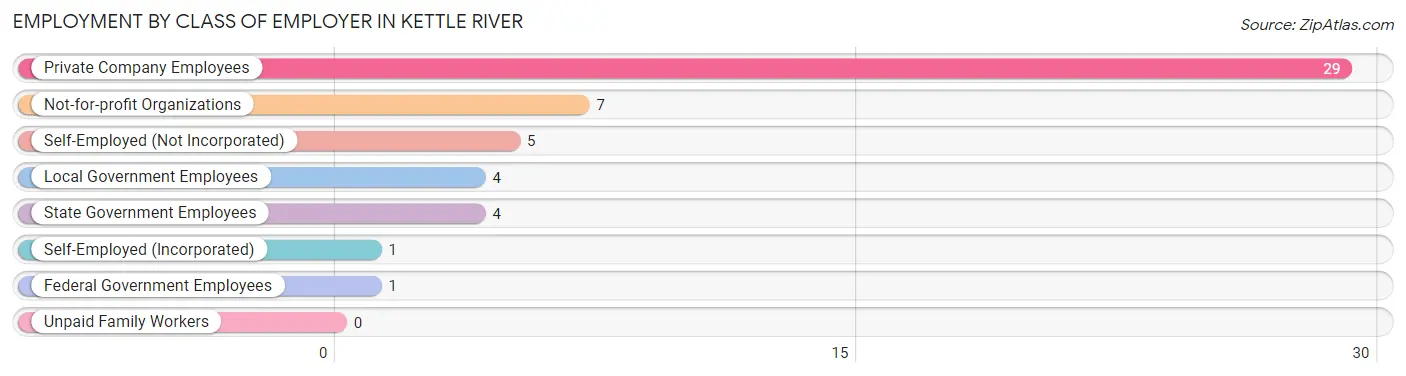
| Employer Class | # Employees | % Employees |
| Private Company Employees | 29 | 56.9% |
| Self-Employed (Incorporated) | 1 | 2.0% |
| Self-Employed (Not Incorporated) | 5 | 9.8% |
| Not-for-profit Organizations | 7 | 13.7% |
| Local Government Employees | 4 | 7.8% |
| State Government Employees | 4 | 7.8% |
| Federal Government Employees | 1 | 2.0% |
| Unpaid Family Workers | 0 | 0.0% |
| Total | 51 | 100.0% |
Employment Status by Age in Kettle River
According to the labor force statistics for Kettle River, out of the total population over 16 years of age (99), 57.6% or 57 individuals are in the labor force, with 5.3% or 3 of them unemployed. The age group with the highest labor force participation rate is 25 to 29 years, with 100.0% or 5 individuals in the labor force. Within the labor force, the 65 to 74 years age range has the highest percentage of unemployed individuals, with 22.2% or 2 of them being unemployed.
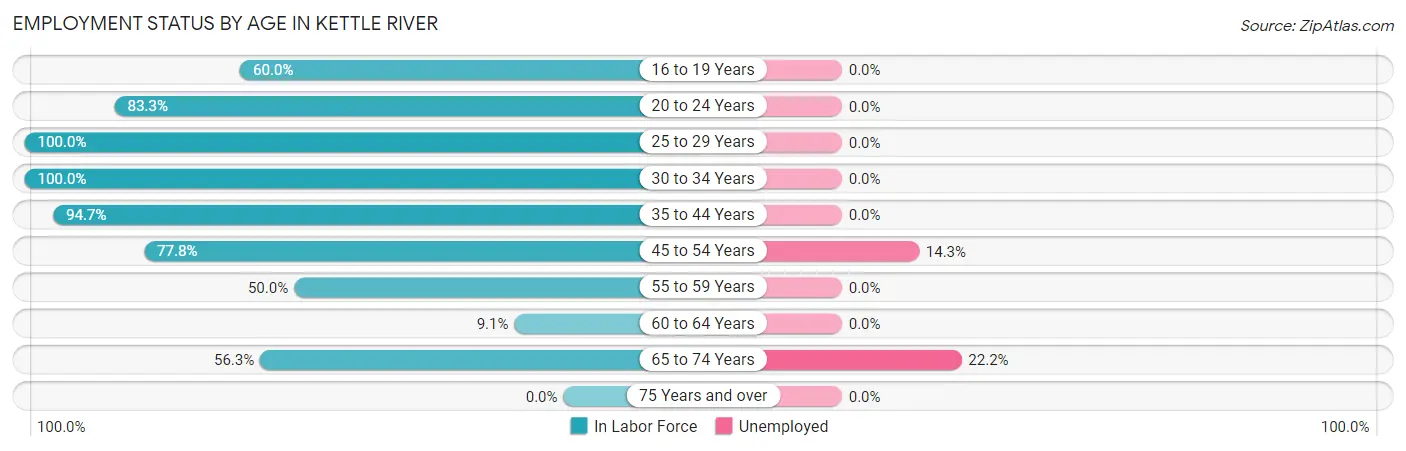
| Age Bracket | In Labor Force | Unemployed |
| 16 to 19 Years | 3 (60.0%) | 0 (0.0%) |
| 20 to 24 Years | 5 (83.3%) | 0 (0.0%) |
| 25 to 29 Years | 5 (100.0%) | 0 (0.0%) |
| 30 to 34 Years | 4 (100.0%) | 0 (0.0%) |
| 35 to 44 Years | 18 (94.7%) | 0 (0.0%) |
| 45 to 54 Years | 7 (77.8%) | 1 (14.3%) |
| 55 to 59 Years | 5 (50.0%) | 0 (0.0%) |
| 60 to 64 Years | 1 (9.1%) | 0 (0.0%) |
| 65 to 74 Years | 9 (56.3%) | 2 (22.2%) |
| 75 Years and over | 0 (0.0%) | 0 (0.0%) |
| Total | 57 (57.6%) | 3 (5.3%) |
Employment Status by Educational Attainment in Kettle River
According to labor force statistics for Kettle River, 69.0% of individuals (40) out of the total population between 25 and 64 years of age (58) are in the labor force, with 2.5% or 1 of them being unemployed. The group with the highest labor force participation rate are those with the educational attainment of college / associate degree, with 76.2% or 16 individuals in the labor force. Within the labor force, individuals with college / associate degree education have the highest percentage of unemployment, with 6.3% or 1 of them being unemployed.
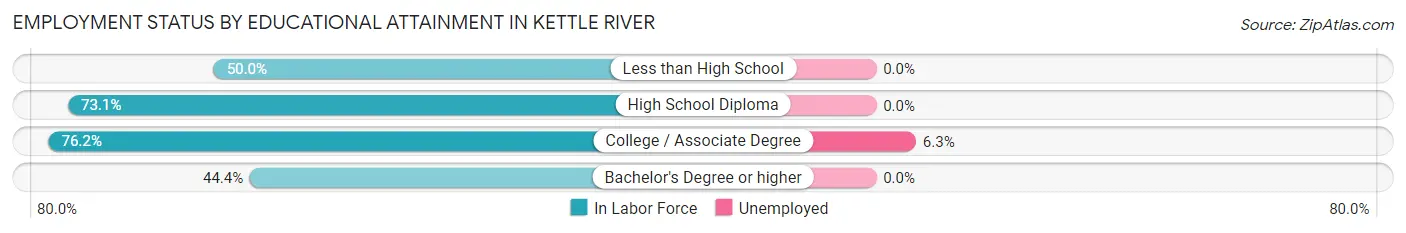
| Educational Attainment | In Labor Force | Unemployed |
| Less than High School | 1 (50.0%) | 0 (0.0%) |
| High School Diploma | 19 (73.1%) | 0 (0.0%) |
| College / Associate Degree | 16 (76.2%) | 1 (6.3%) |
| Bachelor's Degree or higher | 4 (44.4%) | 0 (0.0%) |
| Total | 40 (69.0%) | 1 (2.5%) |
Employment Occupations by Sex in Kettle River
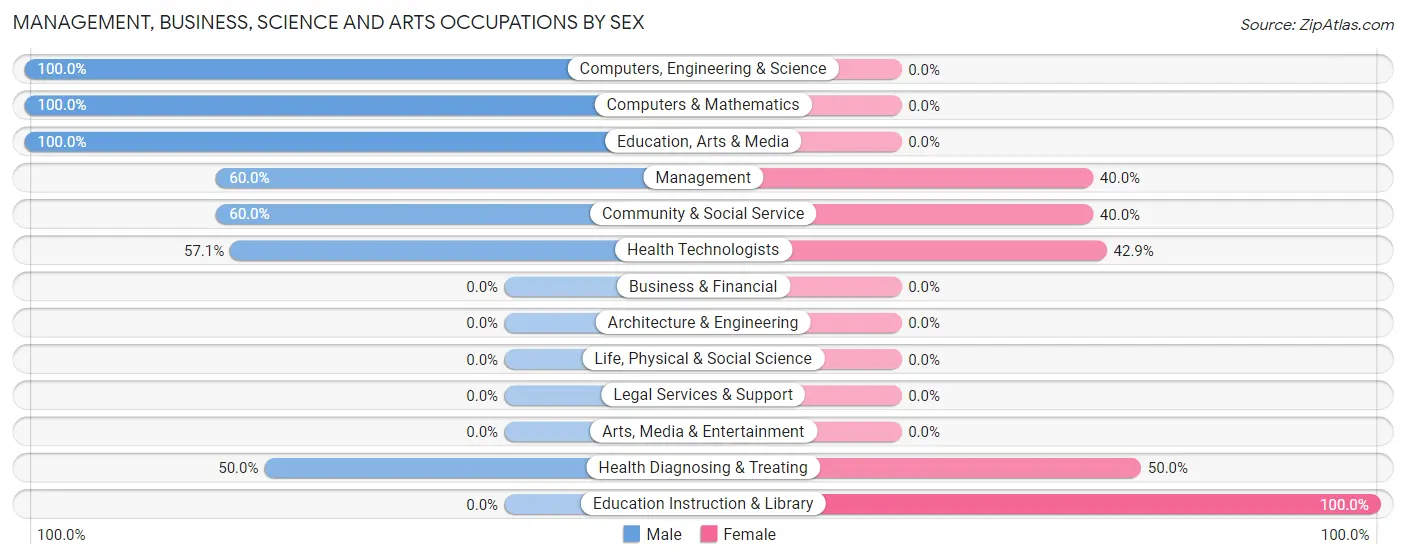
Management, Business, Science and Arts Occupations
The most common Management, Business, Science and Arts occupations in Kettle River are Health Diagnosing & Treating (8 | 14.8%), Health Technologists (7 | 13.0%), Management (5 | 9.3%), Community & Social Service (5 | 9.3%), and Education, Arts & Media (3 | 5.6%).
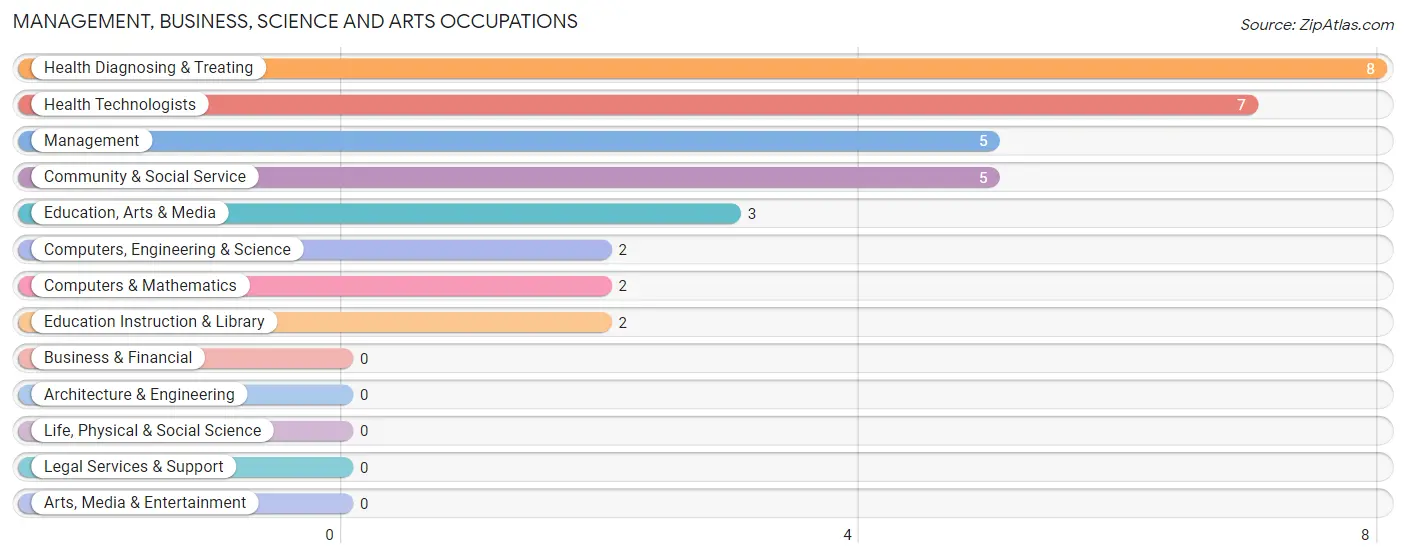
Management, Business, Science and Arts Occupations by Sex
Within the Management, Business, Science and Arts occupations in Kettle River, the most male-oriented occupations are Computers, Engineering & Science (100.0%), Computers & Mathematics (100.0%), and Education, Arts & Media (100.0%), while the most female-oriented occupations are Education Instruction & Library (100.0%), Health Diagnosing & Treating (50.0%), and Health Technologists (42.9%).
| Occupation | Male | Female |
| Management | 3 (60.0%) | 2 (40.0%) |
| Business & Financial | 0 (0.0%) | 0 (0.0%) |
| Computers, Engineering & Science | 2 (100.0%) | 0 (0.0%) |
| Computers & Mathematics | 2 (100.0%) | 0 (0.0%) |
| Architecture & Engineering | 0 (0.0%) | 0 (0.0%) |
| Life, Physical & Social Science | 0 (0.0%) | 0 (0.0%) |
| Community & Social Service | 3 (60.0%) | 2 (40.0%) |
| Education, Arts & Media | 3 (100.0%) | 0 (0.0%) |
| Legal Services & Support | 0 (0.0%) | 0 (0.0%) |
| Education Instruction & Library | 0 (0.0%) | 2 (100.0%) |
| Arts, Media & Entertainment | 0 (0.0%) | 0 (0.0%) |
| Health Diagnosing & Treating | 4 (50.0%) | 4 (50.0%) |
| Health Technologists | 4 (57.1%) | 3 (42.9%) |
| Total (Category) | 12 (60.0%) | 8 (40.0%) |
| Total (Overall) | 30 (55.6%) | 24 (44.4%) |
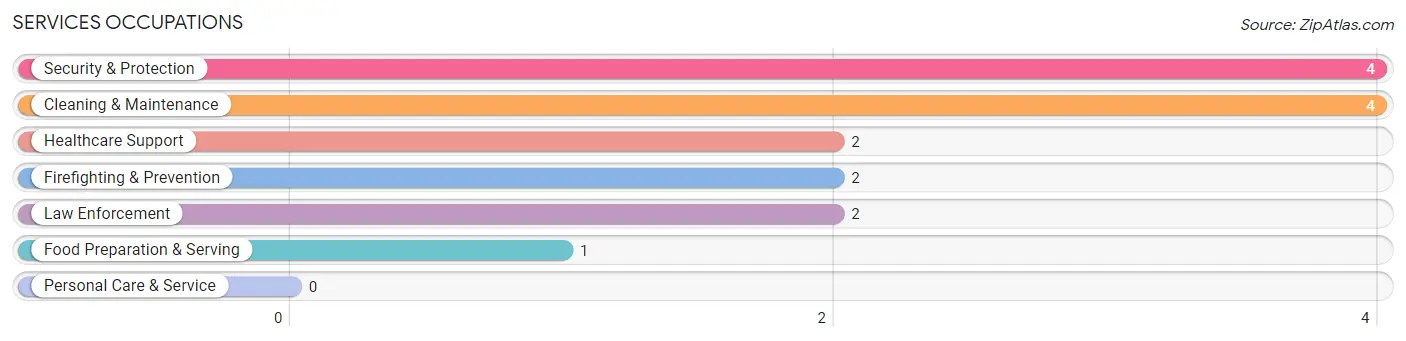
Services Occupations
The most common Services occupations in Kettle River are Security & Protection (4 | 7.4%), Cleaning & Maintenance (4 | 7.4%), Healthcare Support (2 | 3.7%), Firefighting & Prevention (2 | 3.7%), and Law Enforcement (2 | 3.7%).
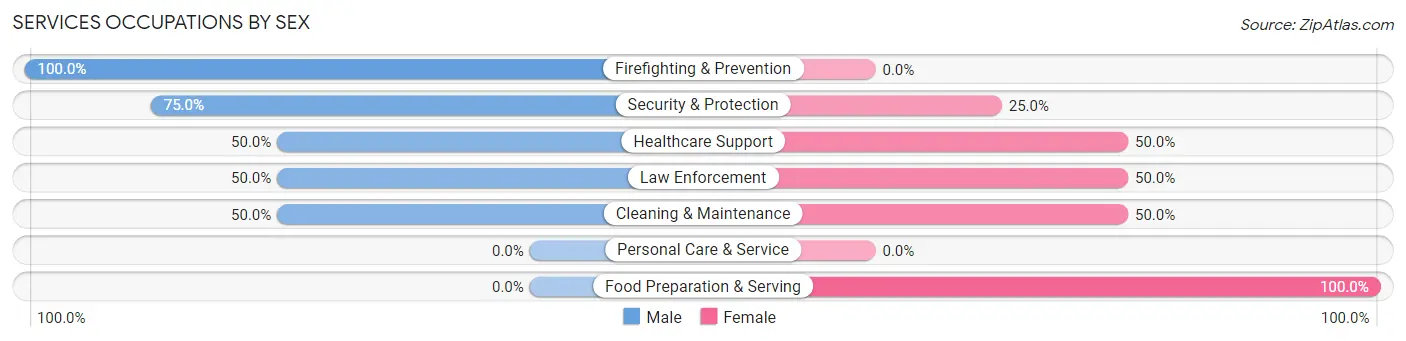
Services Occupations by Sex
Within the Services occupations in Kettle River, the most male-oriented occupations are Firefighting & Prevention (100.0%), Security & Protection (75.0%), and Healthcare Support (50.0%), while the most female-oriented occupations are Food Preparation & Serving (100.0%), Healthcare Support (50.0%), and Law Enforcement (50.0%).
| Occupation | Male | Female |
| Healthcare Support | 1 (50.0%) | 1 (50.0%) |
| Security & Protection | 3 (75.0%) | 1 (25.0%) |
| Firefighting & Prevention | 2 (100.0%) | 0 (0.0%) |
| Law Enforcement | 1 (50.0%) | 1 (50.0%) |
| Food Preparation & Serving | 0 (0.0%) | 1 (100.0%) |
| Cleaning & Maintenance | 2 (50.0%) | 2 (50.0%) |
| Personal Care & Service | 0 (0.0%) | 0 (0.0%) |
| Total (Category) | 6 (54.5%) | 5 (45.5%) |
| Total (Overall) | 30 (55.6%) | 24 (44.4%) |
Sales and Office Occupations
The most common Sales and Office occupations in Kettle River are Office & Administration (7 | 13.0%), and Sales & Related (3 | 5.6%).
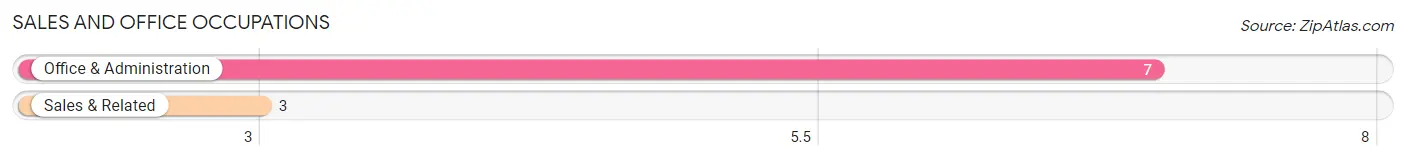
Sales and Office Occupations by Sex
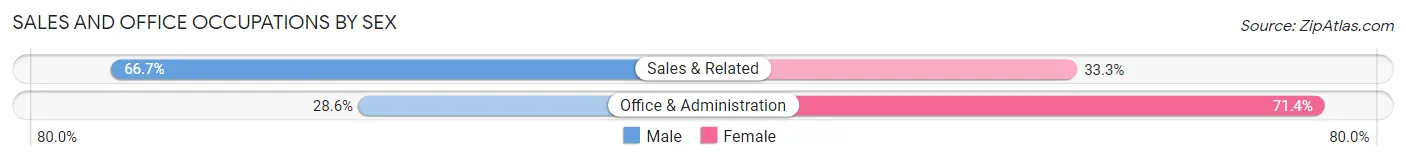
| Occupation | Male | Female |
| Sales & Related | 2 (66.7%) | 1 (33.3%) |
| Office & Administration | 2 (28.6%) | 5 (71.4%) |
| Total (Category) | 4 (40.0%) | 6 (60.0%) |
| Total (Overall) | 30 (55.6%) | 24 (44.4%) |
Natural Resources, Construction and Maintenance Occupations
The most common Natural Resources, Construction and Maintenance occupations in Kettle River are Construction & Extraction (4 | 7.4%), and Installation, Maintenance & Repair (2 | 3.7%).
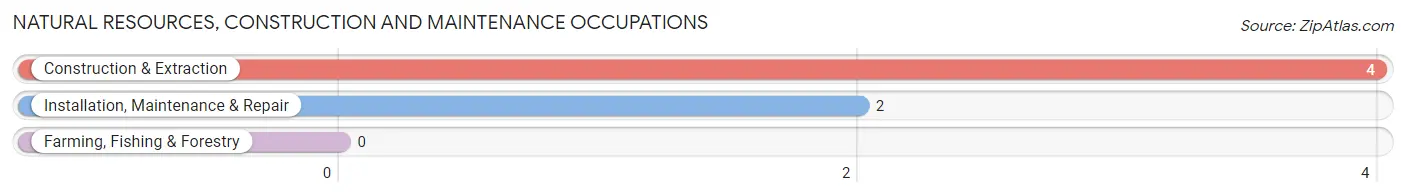
Natural Resources, Construction and Maintenance Occupations by Sex
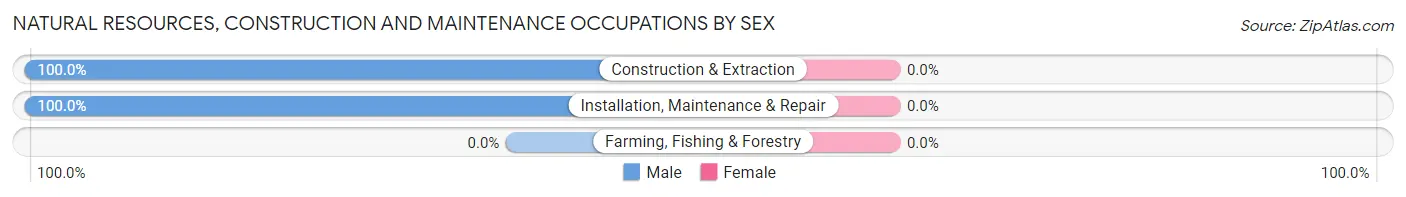
| Occupation | Male | Female |
| Farming, Fishing & Forestry | 0 (0.0%) | 0 (0.0%) |
| Construction & Extraction | 4 (100.0%) | 0 (0.0%) |
| Installation, Maintenance & Repair | 2 (100.0%) | 0 (0.0%) |
| Total (Category) | 6 (100.0%) | 0 (0.0%) |
| Total (Overall) | 30 (55.6%) | 24 (44.4%) |
Production, Transportation and Moving Occupations
The most common Production, Transportation and Moving occupations in Kettle River are Production (5 | 9.3%), and Transportation (2 | 3.7%).
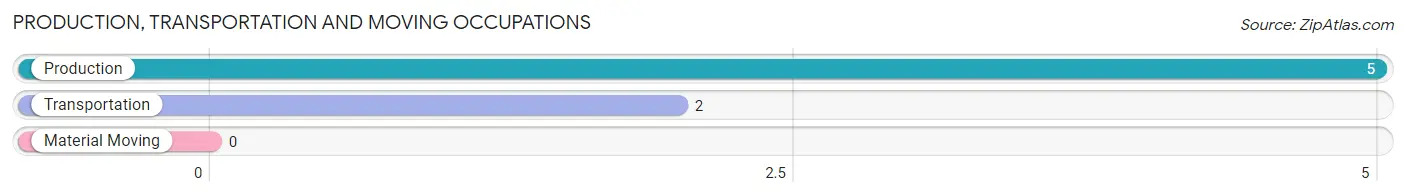
Production, Transportation and Moving Occupations by Sex
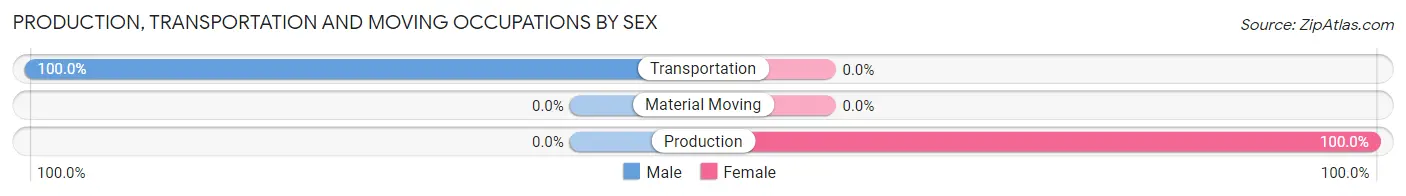
| Occupation | Male | Female |
| Production | 0 (0.0%) | 5 (100.0%) |
| Transportation | 2 (100.0%) | 0 (0.0%) |
| Material Moving | 0 (0.0%) | 0 (0.0%) |
| Total (Category) | 2 (28.6%) | 5 (71.4%) |
| Total (Overall) | 30 (55.6%) | 24 (44.4%) |
Employment Industries by Sex in Kettle River
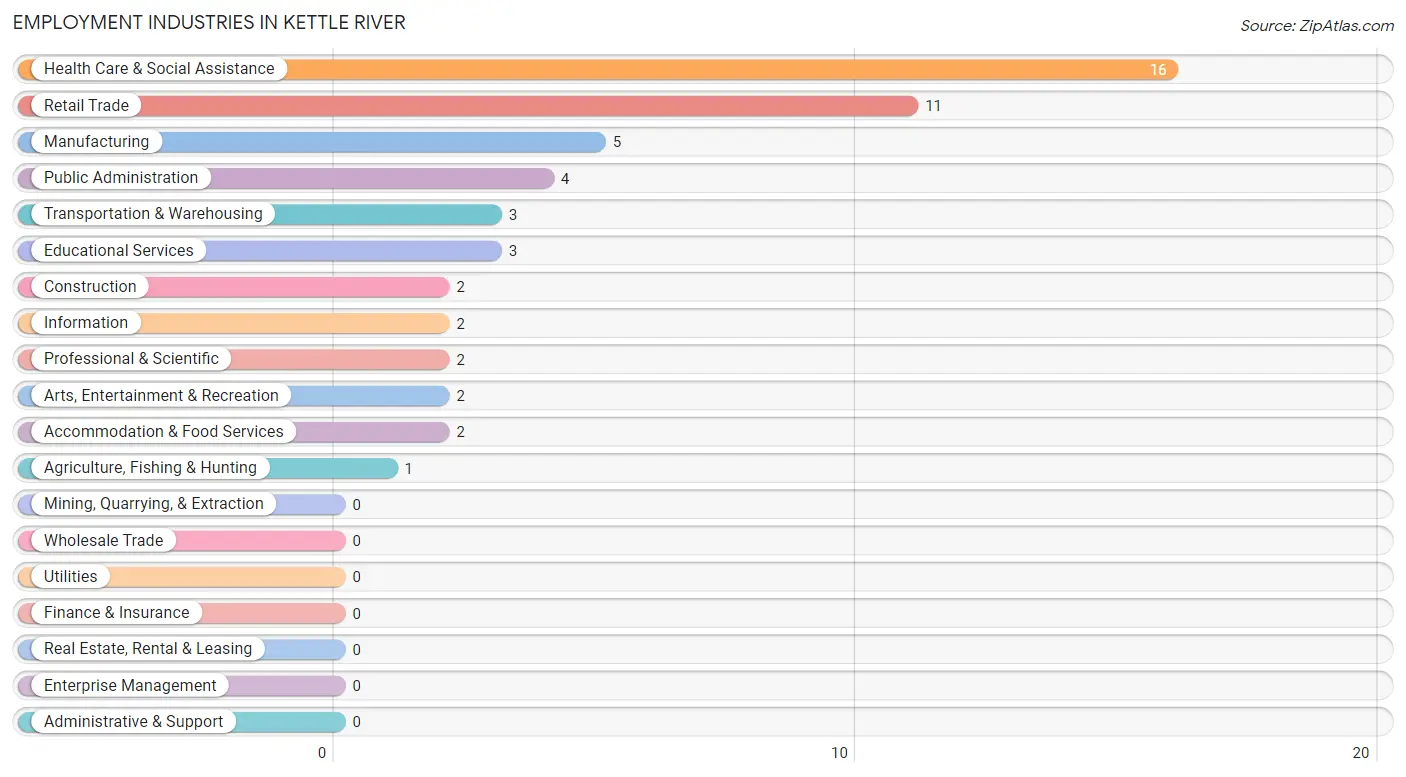
Employment Industries in Kettle River
The major employment industries in Kettle River include Health Care & Social Assistance (16 | 29.6%), Retail Trade (11 | 20.4%), Manufacturing (5 | 9.3%), Public Administration (4 | 7.4%), and Transportation & Warehousing (3 | 5.6%).
Employment Industries by Sex in Kettle River
The Kettle River industries that see more men than women are Agriculture, Fishing & Hunting (100.0%), Construction (100.0%), and Information (100.0%), whereas the industries that tend to have a higher number of women are Educational Services (100.0%), Arts, Entertainment & Recreation (100.0%), and Accommodation & Food Services (100.0%).
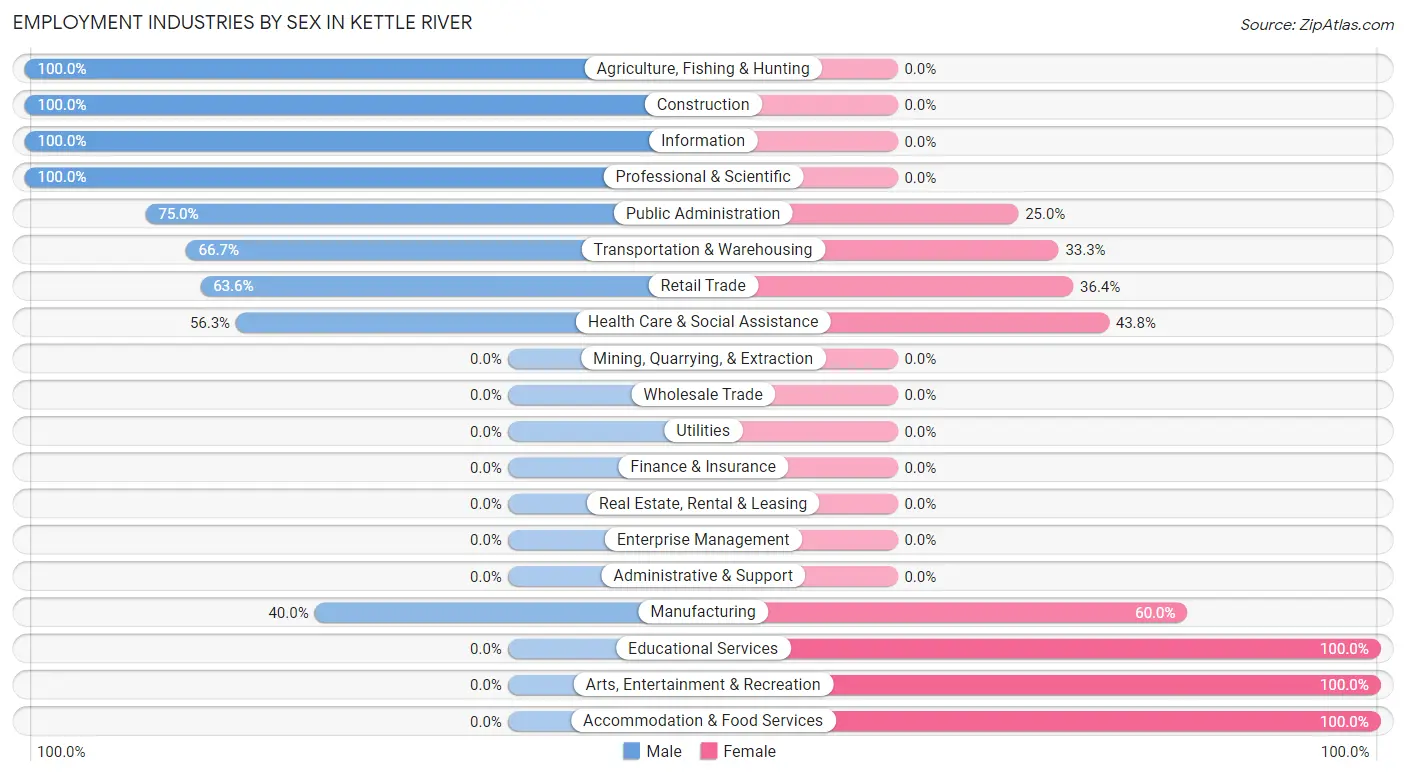
| Industry | Male | Female |
| Agriculture, Fishing & Hunting | 1 (100.0%) | 0 (0.0%) |
| Mining, Quarrying, & Extraction | 0 (0.0%) | 0 (0.0%) |
| Construction | 2 (100.0%) | 0 (0.0%) |
| Manufacturing | 2 (40.0%) | 3 (60.0%) |
| Wholesale Trade | 0 (0.0%) | 0 (0.0%) |
| Retail Trade | 7 (63.6%) | 4 (36.4%) |
| Transportation & Warehousing | 2 (66.7%) | 1 (33.3%) |
| Utilities | 0 (0.0%) | 0 (0.0%) |
| Information | 2 (100.0%) | 0 (0.0%) |
| Finance & Insurance | 0 (0.0%) | 0 (0.0%) |
| Real Estate, Rental & Leasing | 0 (0.0%) | 0 (0.0%) |
| Professional & Scientific | 2 (100.0%) | 0 (0.0%) |
| Enterprise Management | 0 (0.0%) | 0 (0.0%) |
| Administrative & Support | 0 (0.0%) | 0 (0.0%) |
| Educational Services | 0 (0.0%) | 3 (100.0%) |
| Health Care & Social Assistance | 9 (56.2%) | 7 (43.8%) |
| Arts, Entertainment & Recreation | 0 (0.0%) | 2 (100.0%) |
| Accommodation & Food Services | 0 (0.0%) | 2 (100.0%) |
| Public Administration | 3 (75.0%) | 1 (25.0%) |
| Total | 30 (55.6%) | 24 (44.4%) |
Education in Kettle River
School Enrollment in Kettle River
The most common levels of schooling among the 19 students in Kettle River are middle school (6 | 31.6%), high school (6 | 31.6%), and elementary school (5 | 26.3%).
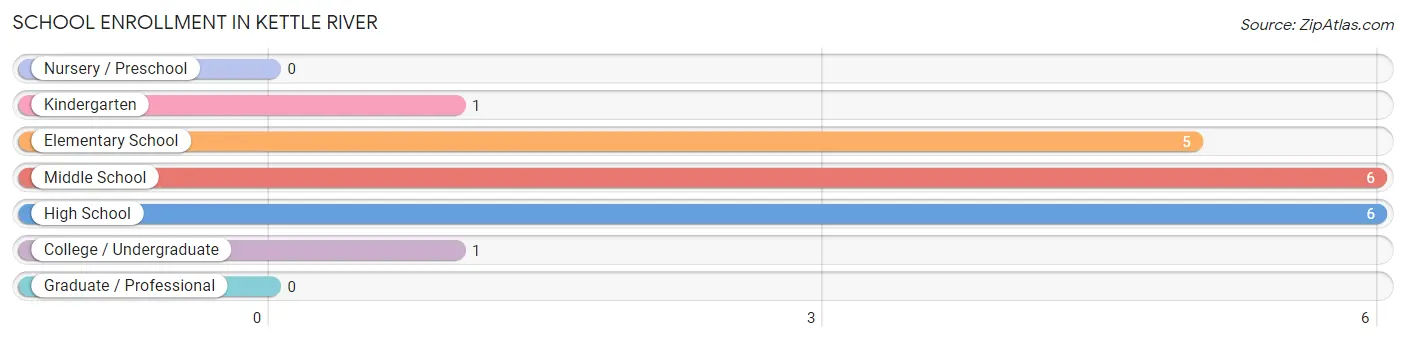
| School Level | # Students | % Students |
| Nursery / Preschool | 0 | 0.0% |
| Kindergarten | 1 | 5.3% |
| Elementary School | 5 | 26.3% |
| Middle School | 6 | 31.6% |
| High School | 6 | 31.6% |
| College / Undergraduate | 1 | 5.3% |
| Graduate / Professional | 0 | 0.0% |
| Total | 19 | 100.0% |
School Enrollment by Age by Funding Source in Kettle River
Out of a total of 19 students who are enrolled in schools in Kettle River, 4 (21.1%) attend a private institution, while the remaining 15 (78.9%) are enrolled in public schools. The age group of 15 to 17 year olds has the highest likelihood of being enrolled in private schools, with 1 (50.0% in the age bracket) enrolled. Conversely, the age group of 20 to 24 year olds has the lowest likelihood of being enrolled in a private school, with 1 (100.0% in the age bracket) attending a public institution.
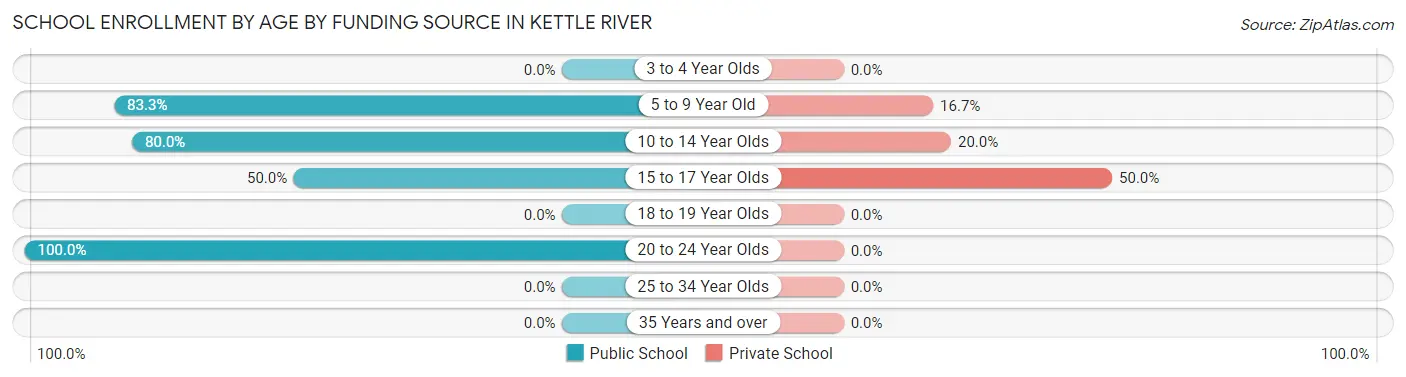
| Age Bracket | Public School | Private School |
| 3 to 4 Year Olds | 0 (0.0%) | 0 (0.0%) |
| 5 to 9 Year Old | 5 (83.3%) | 1 (16.7%) |
| 10 to 14 Year Olds | 8 (80.0%) | 2 (20.0%) |
| 15 to 17 Year Olds | 1 (50.0%) | 1 (50.0%) |
| 18 to 19 Year Olds | 0 (0.0%) | 0 (0.0%) |
| 20 to 24 Year Olds | 1 (100.0%) | 0 (0.0%) |
| 25 to 34 Year Olds | 0 (0.0%) | 0 (0.0%) |
| 35 Years and over | 0 (0.0%) | 0 (0.0%) |
| Total | 15 (78.9%) | 4 (21.1%) |
Educational Attainment by Field of Study in Kettle River
Bio, nature & agricultural (5 | 27.8%), arts & humanities (5 | 27.8%), psychology (2 | 11.1%), social sciences (2 | 11.1%), and business (2 | 11.1%) are the most common fields of study among 18 individuals in Kettle River who have obtained a bachelor's degree or higher.
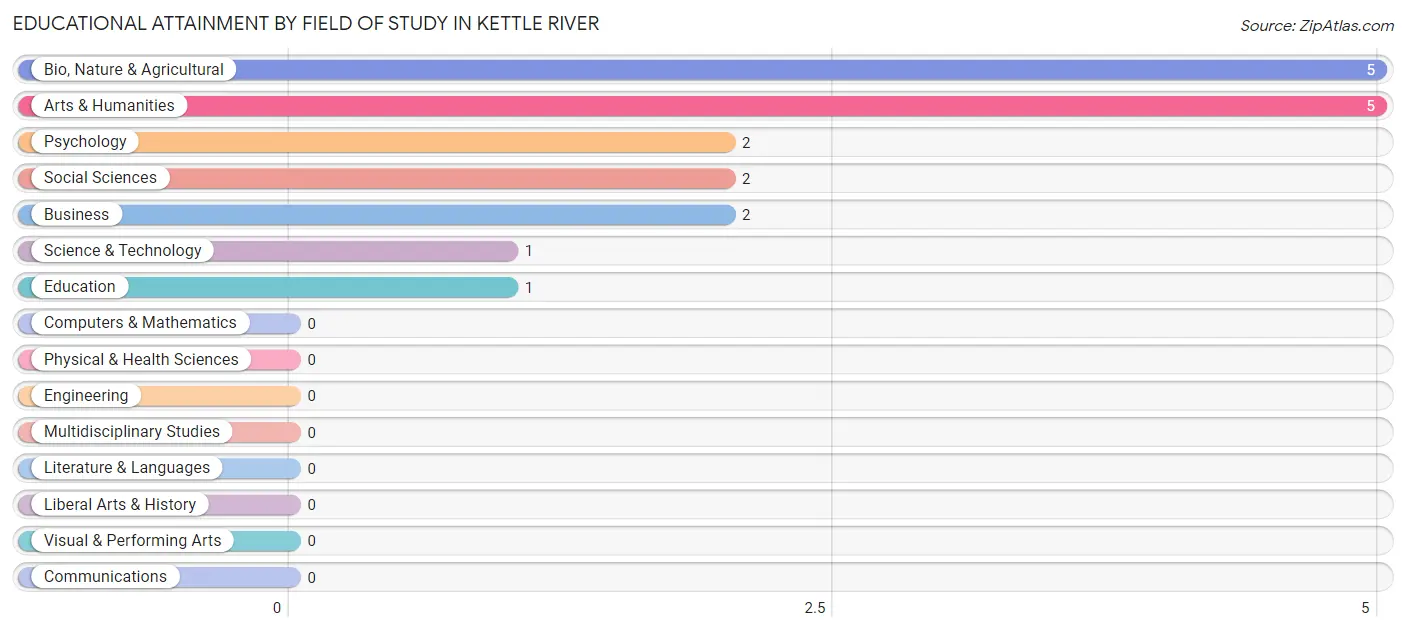
| Field of Study | # Graduates | % Graduates |
| Computers & Mathematics | 0 | 0.0% |
| Bio, Nature & Agricultural | 5 | 27.8% |
| Physical & Health Sciences | 0 | 0.0% |
| Psychology | 2 | 11.1% |
| Social Sciences | 2 | 11.1% |
| Engineering | 0 | 0.0% |
| Multidisciplinary Studies | 0 | 0.0% |
| Science & Technology | 1 | 5.6% |
| Business | 2 | 11.1% |
| Education | 1 | 5.6% |
| Literature & Languages | 0 | 0.0% |
| Liberal Arts & History | 0 | 0.0% |
| Visual & Performing Arts | 0 | 0.0% |
| Communications | 0 | 0.0% |
| Arts & Humanities | 5 | 27.8% |
| Total | 18 | 100.0% |
Transportation & Commute in Kettle River
Vehicle Availability by Sex in Kettle River
The most prevalent vehicle ownership categories in Kettle River are males with 2 vehicles (13, accounting for 43.3%) and females with 2 vehicles (6, making up 61.9%).
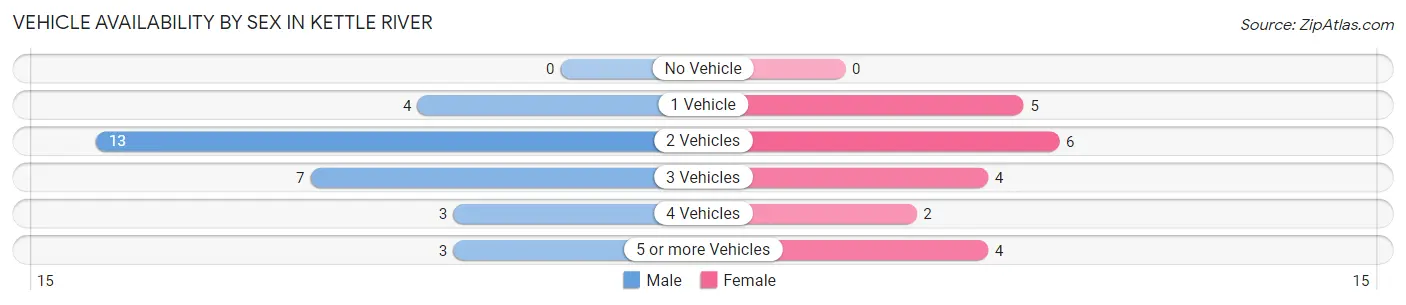
| Vehicles Available | Male | Female |
| No Vehicle | 0 (0.0%) | 0 (0.0%) |
| 1 Vehicle | 4 (13.3%) | 5 (23.8%) |
| 2 Vehicles | 13 (43.3%) | 6 (28.6%) |
| 3 Vehicles | 7 (23.3%) | 4 (19.1%) |
| 4 Vehicles | 3 (10.0%) | 2 (9.5%) |
| 5 or more Vehicles | 3 (10.0%) | 4 (19.1%) |
| Total | 30 (100.0%) | 21 (100.0%) |
Commute Time in Kettle River
The most frequently occuring commute durations in Kettle River are 15 to 19 minutes (12 commuters, 25.5%), 45 to 59 minutes (12 commuters, 25.5%), and 40 to 44 minutes (8 commuters, 17.0%).
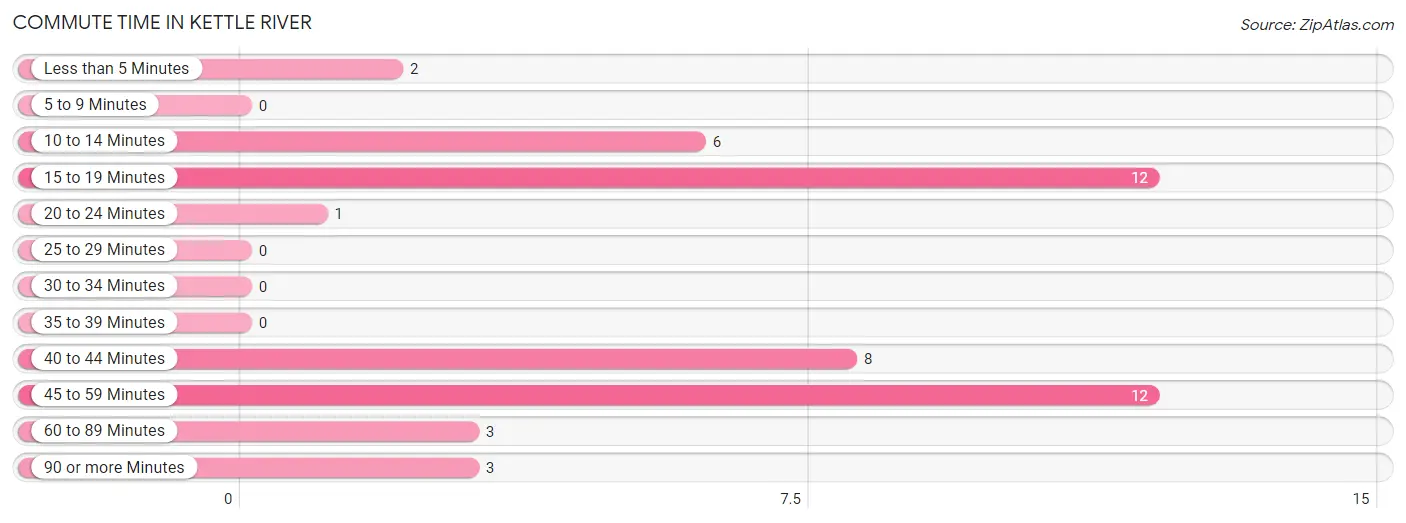
| Commute Time | # Commuters | % Commuters |
| Less than 5 Minutes | 2 | 4.3% |
| 5 to 9 Minutes | 0 | 0.0% |
| 10 to 14 Minutes | 6 | 12.8% |
| 15 to 19 Minutes | 12 | 25.5% |
| 20 to 24 Minutes | 1 | 2.1% |
| 25 to 29 Minutes | 0 | 0.0% |
| 30 to 34 Minutes | 0 | 0.0% |
| 35 to 39 Minutes | 0 | 0.0% |
| 40 to 44 Minutes | 8 | 17.0% |
| 45 to 59 Minutes | 12 | 25.5% |
| 60 to 89 Minutes | 3 | 6.4% |
| 90 or more Minutes | 3 | 6.4% |
Commute Time by Sex in Kettle River
The most common commute times in Kettle River are 45 to 59 minutes (8 commuters, 30.8%) for males and 15 to 19 minutes (6 commuters, 28.6%) for females.
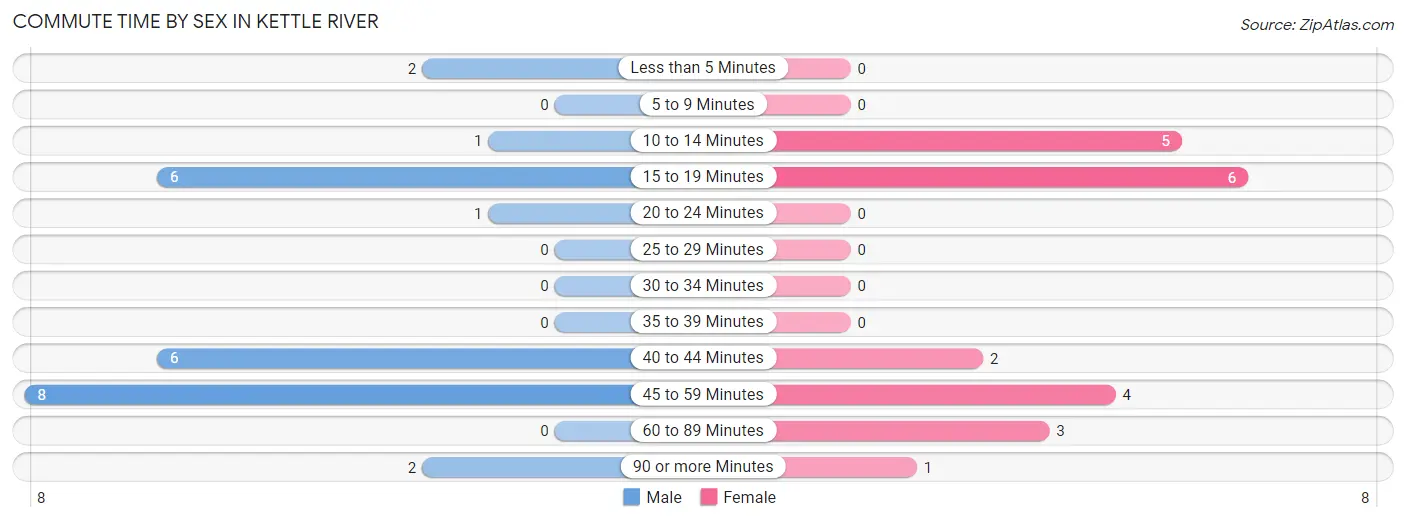
| Commute Time | Male | Female |
| Less than 5 Minutes | 2 (7.7%) | 0 (0.0%) |
| 5 to 9 Minutes | 0 (0.0%) | 0 (0.0%) |
| 10 to 14 Minutes | 1 (3.8%) | 5 (23.8%) |
| 15 to 19 Minutes | 6 (23.1%) | 6 (28.6%) |
| 20 to 24 Minutes | 1 (3.8%) | 0 (0.0%) |
| 25 to 29 Minutes | 0 (0.0%) | 0 (0.0%) |
| 30 to 34 Minutes | 0 (0.0%) | 0 (0.0%) |
| 35 to 39 Minutes | 0 (0.0%) | 0 (0.0%) |
| 40 to 44 Minutes | 6 (23.1%) | 2 (9.5%) |
| 45 to 59 Minutes | 8 (30.8%) | 4 (19.1%) |
| 60 to 89 Minutes | 0 (0.0%) | 3 (14.3%) |
| 90 or more Minutes | 2 (7.7%) | 1 (4.8%) |
Time of Departure to Work by Sex in Kettle River
The most frequent times of departure to work in Kettle River are 12:00 AM to 4:59 AM (6, 23.1%) for males and 7:30 AM to 7:59 AM (9, 42.9%) for females.
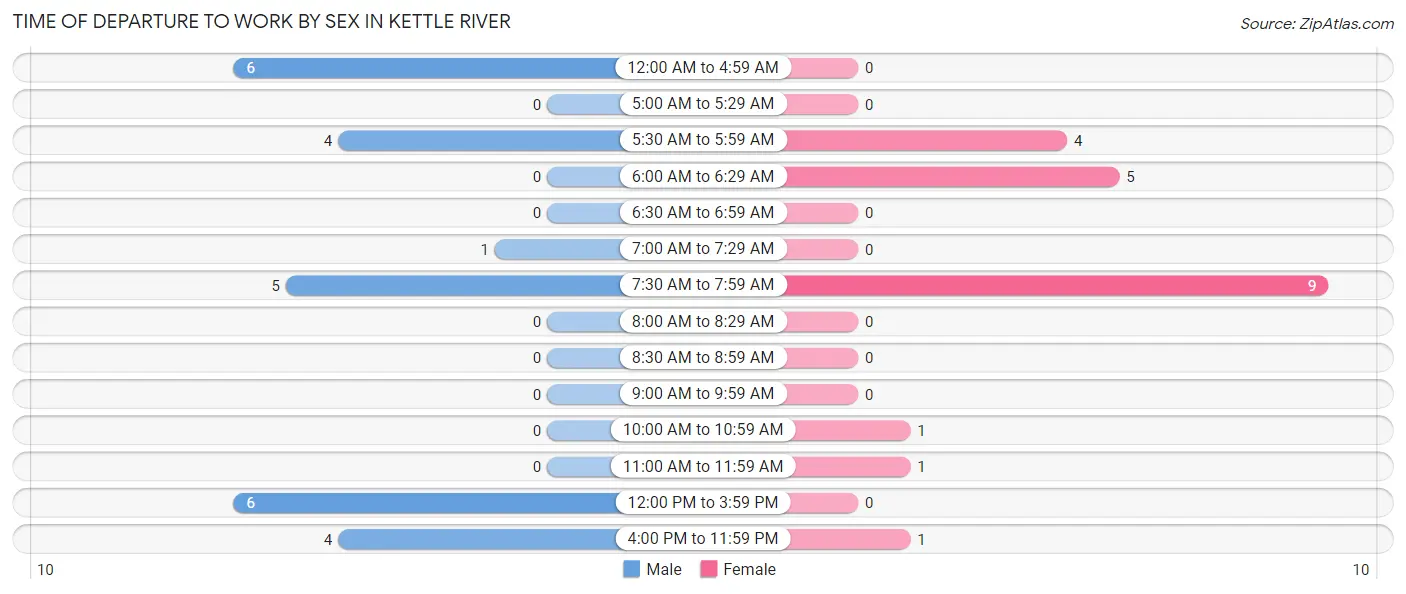
| Time of Departure | Male | Female |
| 12:00 AM to 4:59 AM | 6 (23.1%) | 0 (0.0%) |
| 5:00 AM to 5:29 AM | 0 (0.0%) | 0 (0.0%) |
| 5:30 AM to 5:59 AM | 4 (15.4%) | 4 (19.1%) |
| 6:00 AM to 6:29 AM | 0 (0.0%) | 5 (23.8%) |
| 6:30 AM to 6:59 AM | 0 (0.0%) | 0 (0.0%) |
| 7:00 AM to 7:29 AM | 1 (3.8%) | 0 (0.0%) |
| 7:30 AM to 7:59 AM | 5 (19.2%) | 9 (42.9%) |
| 8:00 AM to 8:29 AM | 0 (0.0%) | 0 (0.0%) |
| 8:30 AM to 8:59 AM | 0 (0.0%) | 0 (0.0%) |
| 9:00 AM to 9:59 AM | 0 (0.0%) | 0 (0.0%) |
| 10:00 AM to 10:59 AM | 0 (0.0%) | 1 (4.8%) |
| 11:00 AM to 11:59 AM | 0 (0.0%) | 1 (4.8%) |
| 12:00 PM to 3:59 PM | 6 (23.1%) | 0 (0.0%) |
| 4:00 PM to 11:59 PM | 4 (15.4%) | 1 (4.8%) |
| Total | 26 (100.0%) | 21 (100.0%) |
Housing Occupancy in Kettle River
Occupancy by Ownership in Kettle River
Of the total 53 dwellings in Kettle River, owner-occupied units account for 45 (84.9%), while renter-occupied units make up 8 (15.1%).
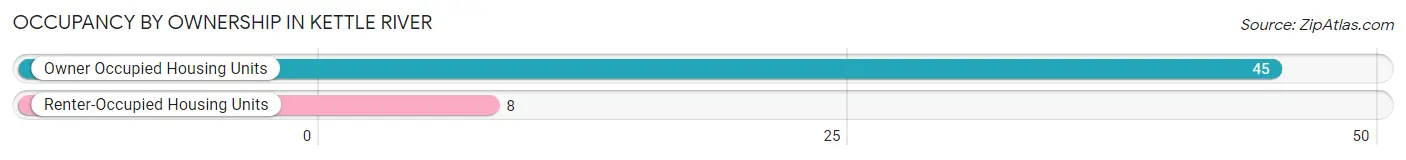
| Occupancy | # Housing Units | % Housing Units |
| Owner Occupied Housing Units | 45 | 84.9% |
| Renter-Occupied Housing Units | 8 | 15.1% |
| Total Occupied Housing Units | 53 | 100.0% |
Occupancy by Household Size in Kettle River
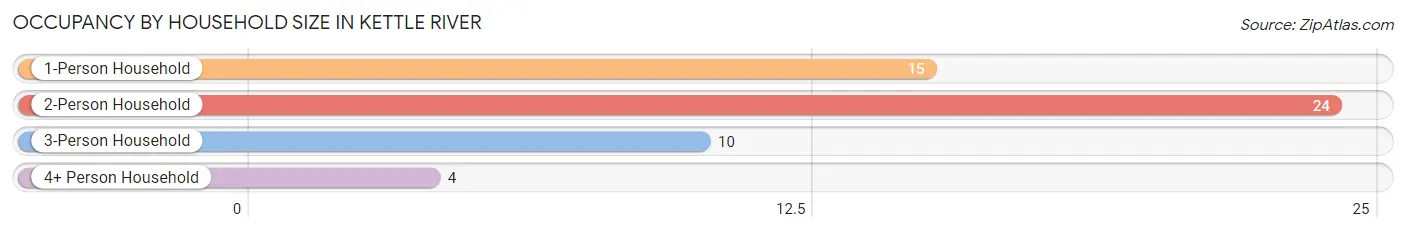
| Household Size | # Housing Units | % Housing Units |
| 1-Person Household | 15 | 28.3% |
| 2-Person Household | 24 | 45.3% |
| 3-Person Household | 10 | 18.9% |
| 4+ Person Household | 4 | 7.5% |
| Total Housing Units | 53 | 100.0% |
Occupancy by Ownership by Household Size in Kettle River
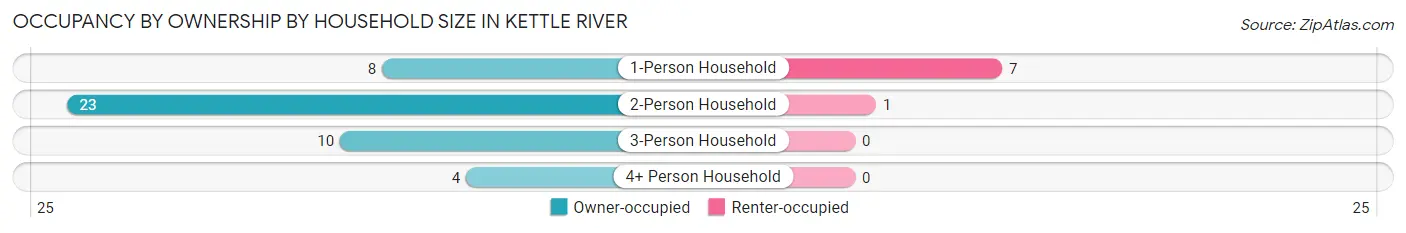
| Household Size | Owner-occupied | Renter-occupied |
| 1-Person Household | 8 (53.3%) | 7 (46.7%) |
| 2-Person Household | 23 (95.8%) | 1 (4.2%) |
| 3-Person Household | 10 (100.0%) | 0 (0.0%) |
| 4+ Person Household | 4 (100.0%) | 0 (0.0%) |
| Total Housing Units | 45 (84.9%) | 8 (15.1%) |
Occupancy by Educational Attainment in Kettle River
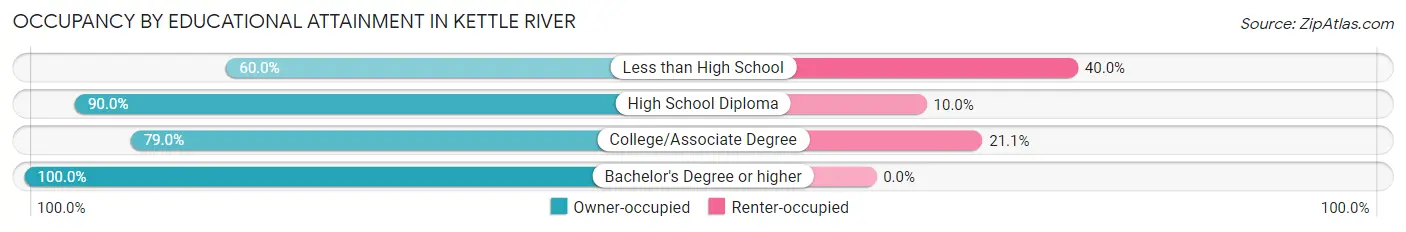
| Household Size | Owner-occupied | Renter-occupied |
| Less than High School | 3 (60.0%) | 2 (40.0%) |
| High School Diploma | 18 (90.0%) | 2 (10.0%) |
| College/Associate Degree | 15 (78.9%) | 4 (21.0%) |
| Bachelor's Degree or higher | 9 (100.0%) | 0 (0.0%) |
Occupancy by Age of Householder in Kettle River
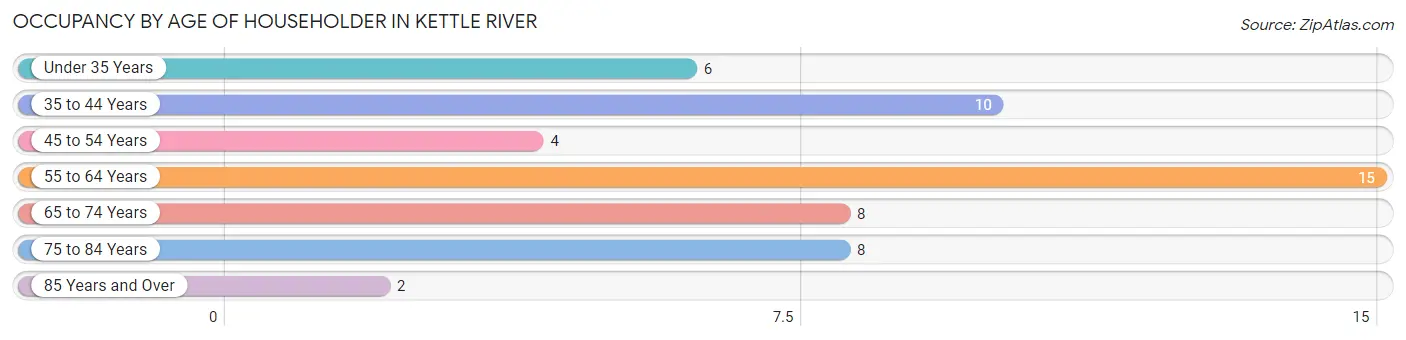
| Age Bracket | # Households | % Households |
| Under 35 Years | 6 | 11.3% |
| 35 to 44 Years | 10 | 18.9% |
| 45 to 54 Years | 4 | 7.5% |
| 55 to 64 Years | 15 | 28.3% |
| 65 to 74 Years | 8 | 15.1% |
| 75 to 84 Years | 8 | 15.1% |
| 85 Years and Over | 2 | 3.8% |
| Total | 53 | 100.0% |
Housing Finances in Kettle River
Median Income by Occupancy in Kettle River
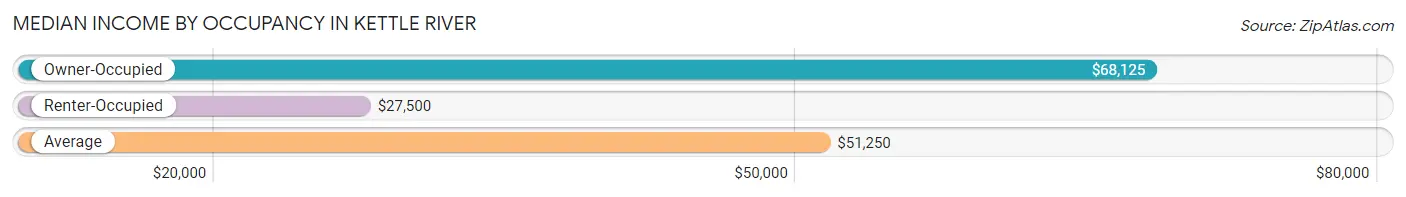
| Occupancy Type | # Households | Median Income |
| Owner-Occupied | 45 (84.9%) | $68,125 |
| Renter-Occupied | 8 (15.1%) | $27,500 |
| Average | 53 (100.0%) | $51,250 |
Occupancy by Householder Income Bracket in Kettle River
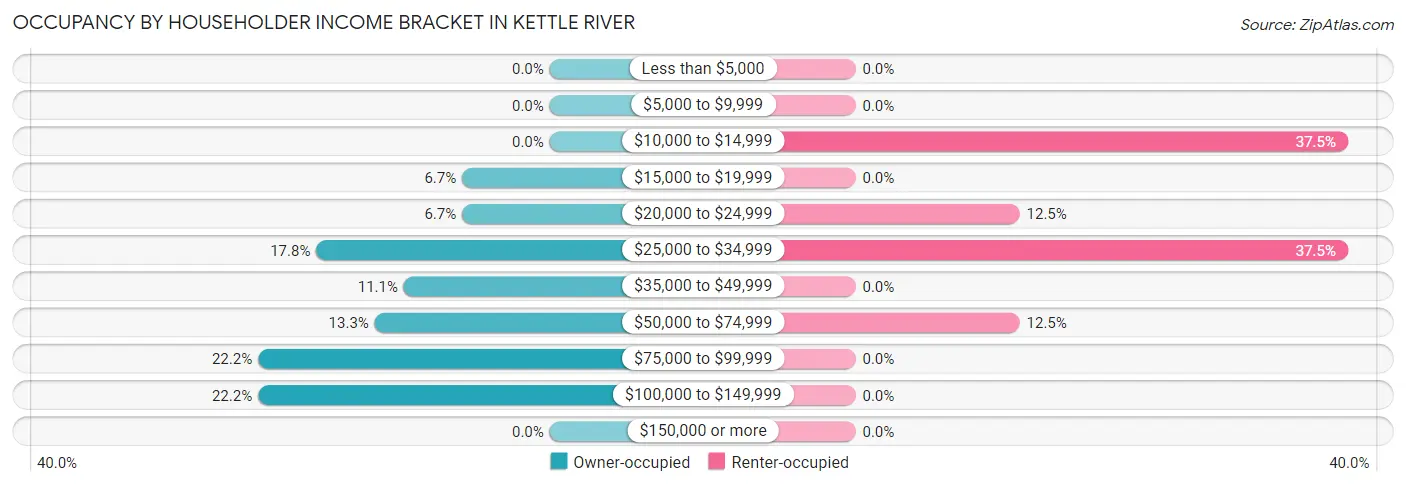
| Income Bracket | Owner-occupied | Renter-occupied |
| Less than $5,000 | 0 (0.0%) | 0 (0.0%) |
| $5,000 to $9,999 | 0 (0.0%) | 0 (0.0%) |
| $10,000 to $14,999 | 0 (0.0%) | 3 (37.5%) |
| $15,000 to $19,999 | 3 (6.7%) | 0 (0.0%) |
| $20,000 to $24,999 | 3 (6.7%) | 1 (12.5%) |
| $25,000 to $34,999 | 8 (17.8%) | 3 (37.5%) |
| $35,000 to $49,999 | 5 (11.1%) | 0 (0.0%) |
| $50,000 to $74,999 | 6 (13.3%) | 1 (12.5%) |
| $75,000 to $99,999 | 10 (22.2%) | 0 (0.0%) |
| $100,000 to $149,999 | 10 (22.2%) | 0 (0.0%) |
| $150,000 or more | 0 (0.0%) | 0 (0.0%) |
| Total | 45 (100.0%) | 8 (100.0%) |
Monthly Housing Cost Tiers in Kettle River
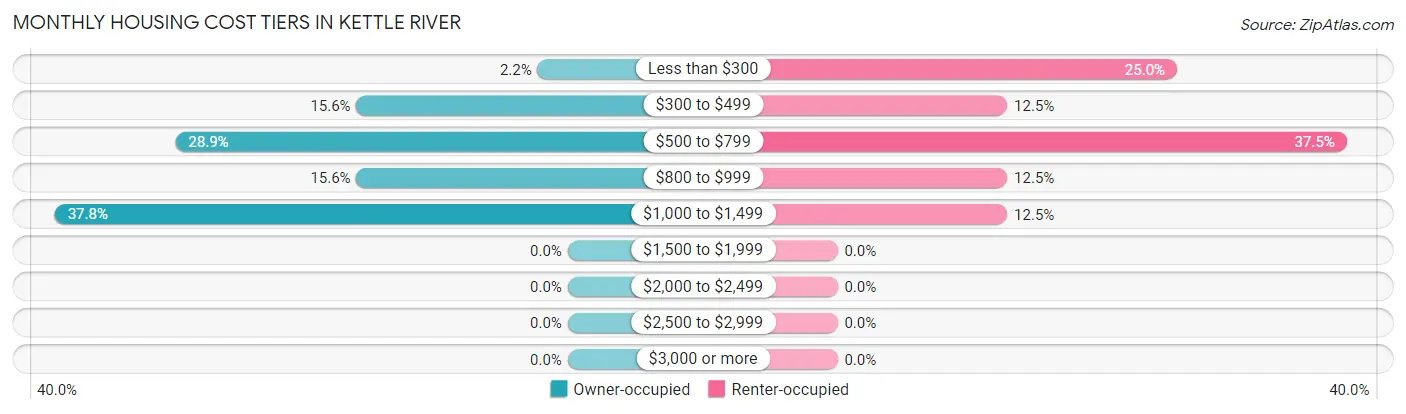
| Monthly Cost | Owner-occupied | Renter-occupied |
| Less than $300 | 1 (2.2%) | 2 (25.0%) |
| $300 to $499 | 7 (15.6%) | 1 (12.5%) |
| $500 to $799 | 13 (28.9%) | 3 (37.5%) |
| $800 to $999 | 7 (15.6%) | 1 (12.5%) |
| $1,000 to $1,499 | 17 (37.8%) | 1 (12.5%) |
| $1,500 to $1,999 | 0 (0.0%) | 0 (0.0%) |
| $2,000 to $2,499 | 0 (0.0%) | 0 (0.0%) |
| $2,500 to $2,999 | 0 (0.0%) | 0 (0.0%) |
| $3,000 or more | 0 (0.0%) | 0 (0.0%) |
| Total | 45 (100.0%) | 8 (100.0%) |
Physical Housing Characteristics in Kettle River
Housing Structures in Kettle River
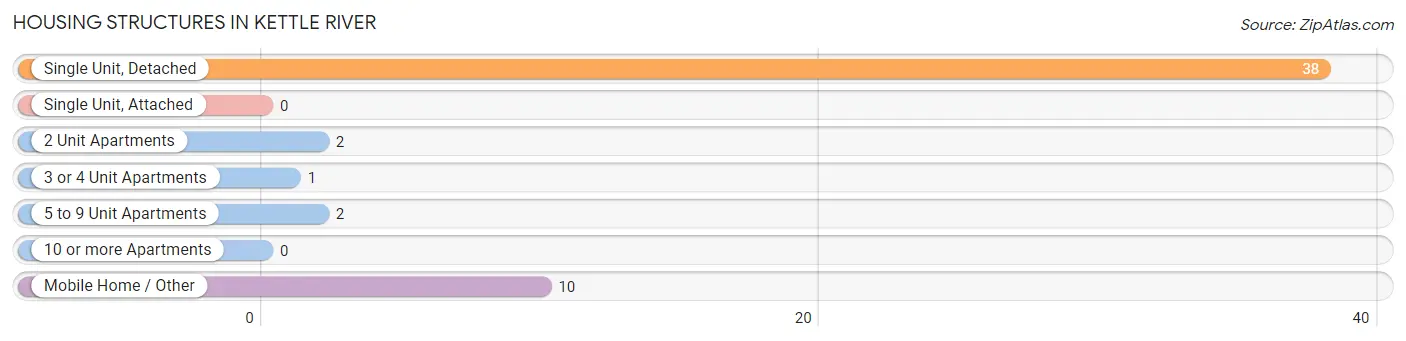
| Structure Type | # Housing Units | % Housing Units |
| Single Unit, Detached | 38 | 71.7% |
| Single Unit, Attached | 0 | 0.0% |
| 2 Unit Apartments | 2 | 3.8% |
| 3 or 4 Unit Apartments | 1 | 1.9% |
| 5 to 9 Unit Apartments | 2 | 3.8% |
| 10 or more Apartments | 0 | 0.0% |
| Mobile Home / Other | 10 | 18.9% |
| Total | 53 | 100.0% |
Housing Structures by Occupancy in Kettle River
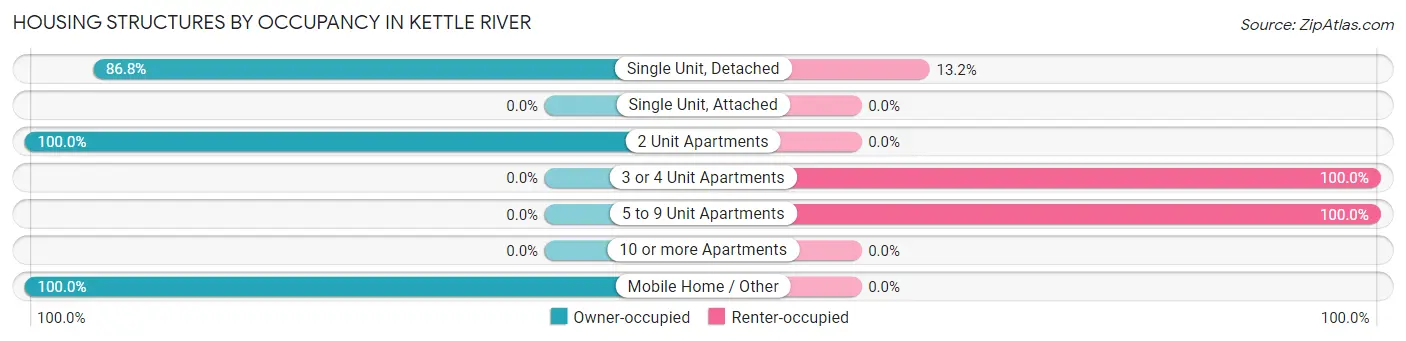
| Structure Type | Owner-occupied | Renter-occupied |
| Single Unit, Detached | 33 (86.8%) | 5 (13.2%) |
| Single Unit, Attached | 0 (0.0%) | 0 (0.0%) |
| 2 Unit Apartments | 2 (100.0%) | 0 (0.0%) |
| 3 or 4 Unit Apartments | 0 (0.0%) | 1 (100.0%) |
| 5 to 9 Unit Apartments | 0 (0.0%) | 2 (100.0%) |
| 10 or more Apartments | 0 (0.0%) | 0 (0.0%) |
| Mobile Home / Other | 10 (100.0%) | 0 (0.0%) |
| Total | 45 (84.9%) | 8 (15.1%) |
Housing Structures by Number of Rooms in Kettle River
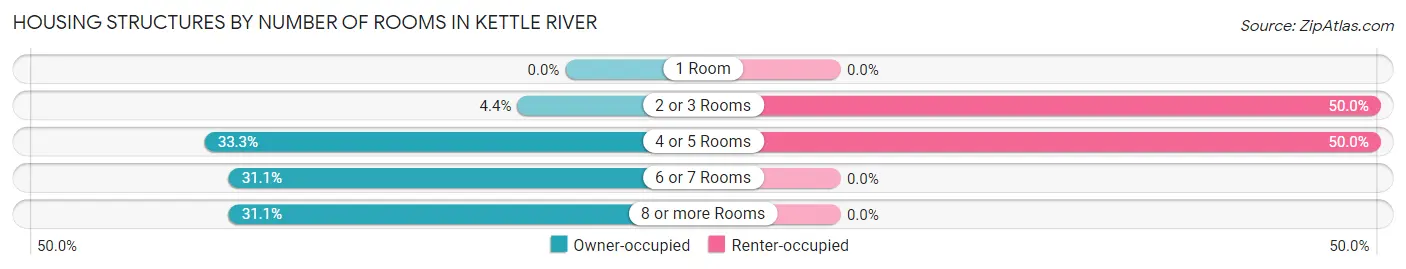
| Number of Rooms | Owner-occupied | Renter-occupied |
| 1 Room | 0 (0.0%) | 0 (0.0%) |
| 2 or 3 Rooms | 2 (4.4%) | 4 (50.0%) |
| 4 or 5 Rooms | 15 (33.3%) | 4 (50.0%) |
| 6 or 7 Rooms | 14 (31.1%) | 0 (0.0%) |
| 8 or more Rooms | 14 (31.1%) | 0 (0.0%) |
| Total | 45 (100.0%) | 8 (100.0%) |
Housing Structure by Heating Type in Kettle River
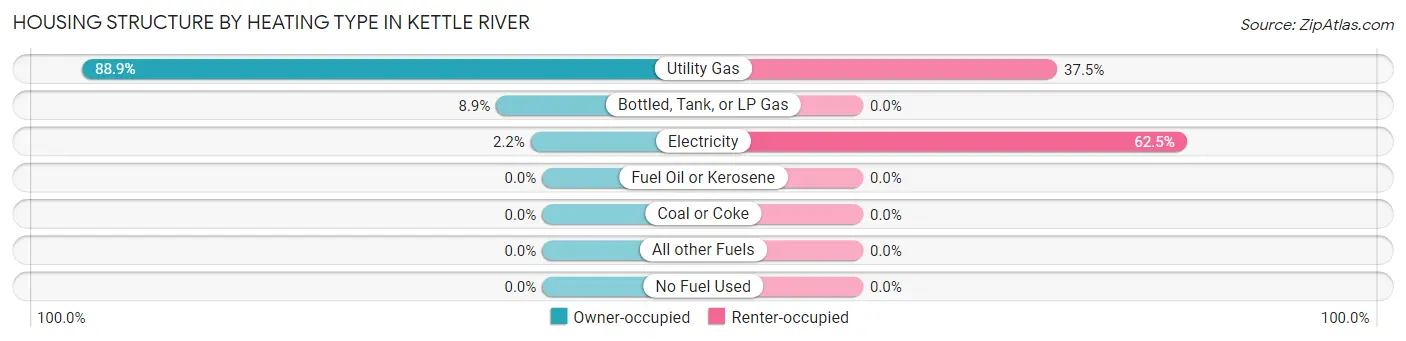
| Heating Type | Owner-occupied | Renter-occupied |
| Utility Gas | 40 (88.9%) | 3 (37.5%) |
| Bottled, Tank, or LP Gas | 4 (8.9%) | 0 (0.0%) |
| Electricity | 1 (2.2%) | 5 (62.5%) |
| Fuel Oil or Kerosene | 0 (0.0%) | 0 (0.0%) |
| Coal or Coke | 0 (0.0%) | 0 (0.0%) |
| All other Fuels | 0 (0.0%) | 0 (0.0%) |
| No Fuel Used | 0 (0.0%) | 0 (0.0%) |
| Total | 45 (100.0%) | 8 (100.0%) |
Household Vehicle Usage in Kettle River
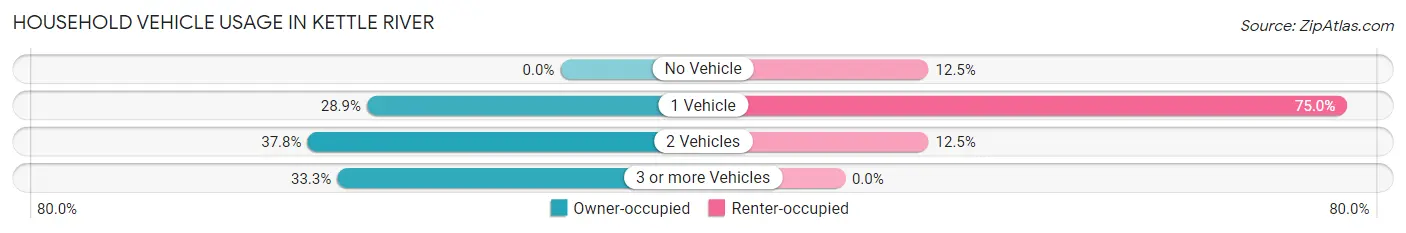
| Vehicles per Household | Owner-occupied | Renter-occupied |
| No Vehicle | 0 (0.0%) | 1 (12.5%) |
| 1 Vehicle | 13 (28.9%) | 6 (75.0%) |
| 2 Vehicles | 17 (37.8%) | 1 (12.5%) |
| 3 or more Vehicles | 15 (33.3%) | 0 (0.0%) |
| Total | 45 (100.0%) | 8 (100.0%) |
Real Estate & Mortgages in Kettle River
Real Estate and Mortgage Overview in Kettle River
| Characteristic | Without Mortgage | With Mortgage |
| Housing Units | 17 | 28 |
| Median Property Value | $87,000 | $116,700 |
| Median Household Income | $38,750 | $0 |
| Monthly Housing Costs | $538 | $0 |
| Real Estate Taxes | $1,536 | $0 |
Property Value by Mortgage Status in Kettle River
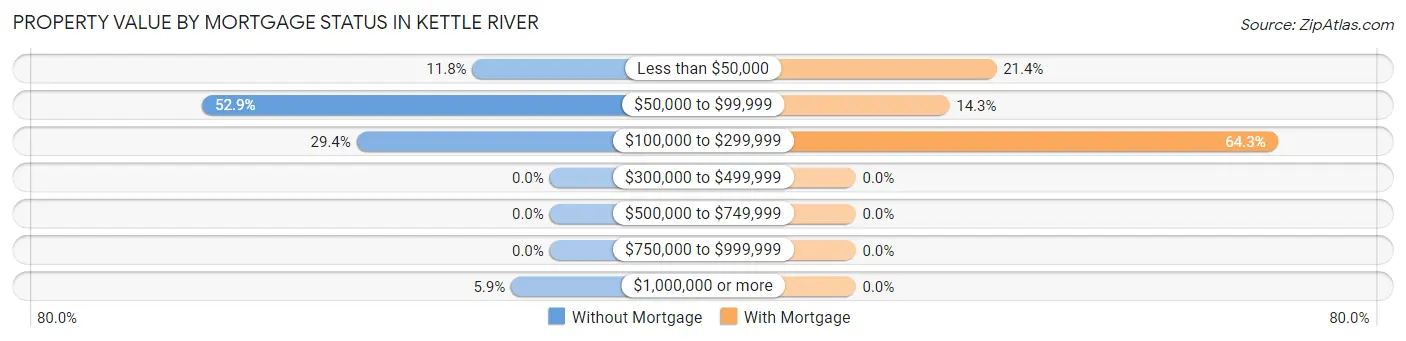
| Property Value | Without Mortgage | With Mortgage |
| Less than $50,000 | 2 (11.8%) | 6 (21.4%) |
| $50,000 to $99,999 | 9 (52.9%) | 4 (14.3%) |
| $100,000 to $299,999 | 5 (29.4%) | 18 (64.3%) |
| $300,000 to $499,999 | 0 (0.0%) | 0 (0.0%) |
| $500,000 to $749,999 | 0 (0.0%) | 0 (0.0%) |
| $750,000 to $999,999 | 0 (0.0%) | 0 (0.0%) |
| $1,000,000 or more | 1 (5.9%) | 0 (0.0%) |
| Total | 17 (100.0%) | 28 (100.0%) |
Household Income by Mortgage Status in Kettle River
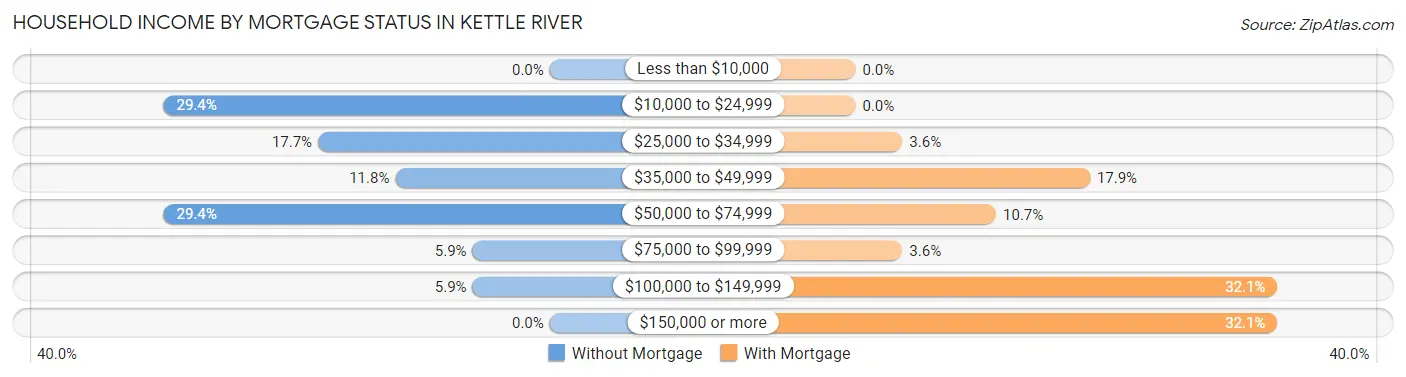
| Household Income | Without Mortgage | With Mortgage |
| Less than $10,000 | 0 (0.0%) | 0 (0.0%) |
| $10,000 to $24,999 | 5 (29.4%) | 0 (0.0%) |
| $25,000 to $34,999 | 3 (17.6%) | 1 (3.6%) |
| $35,000 to $49,999 | 2 (11.8%) | 5 (17.9%) |
| $50,000 to $74,999 | 5 (29.4%) | 3 (10.7%) |
| $75,000 to $99,999 | 1 (5.9%) | 1 (3.6%) |
| $100,000 to $149,999 | 1 (5.9%) | 9 (32.1%) |
| $150,000 or more | 0 (0.0%) | 9 (32.1%) |
| Total | 17 (100.0%) | 28 (100.0%) |
Property Value to Household Income Ratio in Kettle River
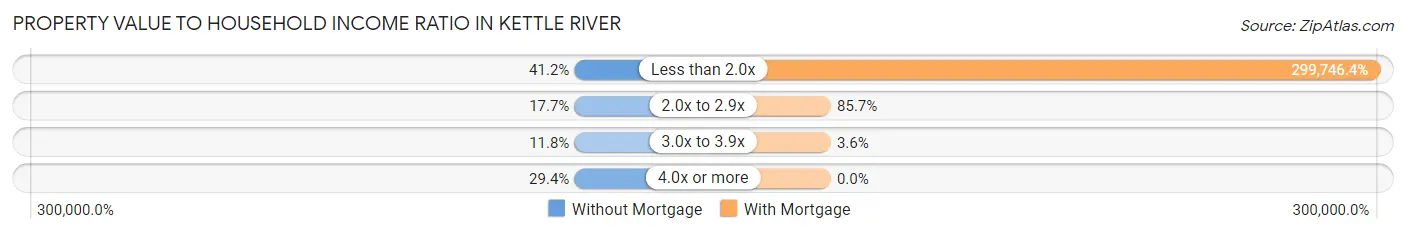
| Value-to-Income Ratio | Without Mortgage | With Mortgage |
| Less than 2.0x | 7 (41.2%) | 83,929 (299,746.4%) |
| 2.0x to 2.9x | 3 (17.6%) | 24 (85.7%) |
| 3.0x to 3.9x | 2 (11.8%) | 1 (3.6%) |
| 4.0x or more | 5 (29.4%) | 0 (0.0%) |
| Total | 17 (100.0%) | 28 (100.0%) |
Real Estate Taxes by Mortgage Status in Kettle River
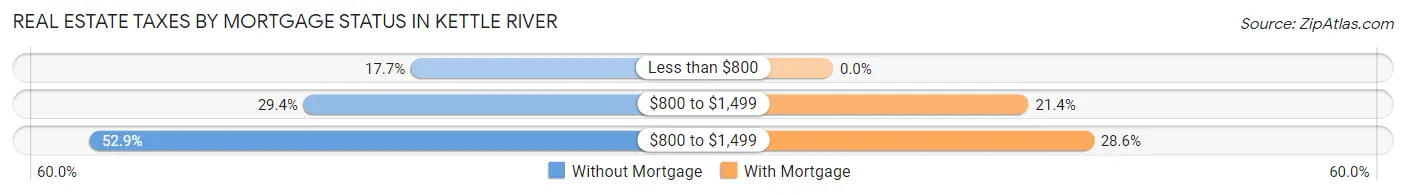
| Property Taxes | Without Mortgage | With Mortgage |
| Less than $800 | 3 (17.6%) | 0 (0.0%) |
| $800 to $1,499 | 5 (29.4%) | 6 (21.4%) |
| $800 to $1,499 | 9 (52.9%) | 8 (28.6%) |
| Total | 17 (100.0%) | 28 (100.0%) |
Health & Disability in Kettle River
Health Insurance Coverage by Age in Kettle River
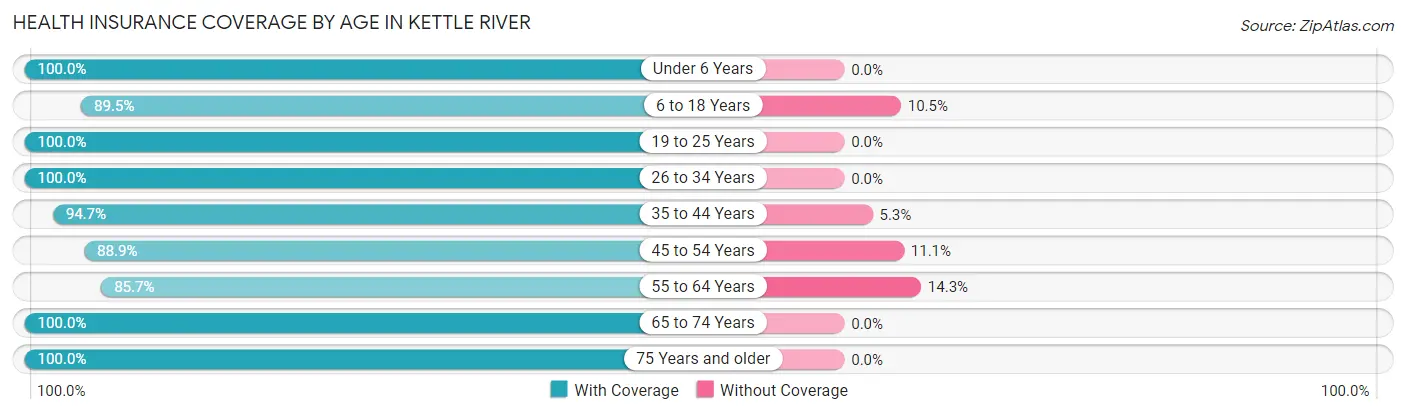
| Age Bracket | With Coverage | Without Coverage |
| Under 6 Years | 2 (100.0%) | 0 (0.0%) |
| 6 to 18 Years | 17 (89.5%) | 2 (10.5%) |
| 19 to 25 Years | 11 (100.0%) | 0 (0.0%) |
| 26 to 34 Years | 6 (100.0%) | 0 (0.0%) |
| 35 to 44 Years | 18 (94.7%) | 1 (5.3%) |
| 45 to 54 Years | 8 (88.9%) | 1 (11.1%) |
| 55 to 64 Years | 18 (85.7%) | 3 (14.3%) |
| 65 to 74 Years | 16 (100.0%) | 0 (0.0%) |
| 75 Years and older | 14 (100.0%) | 0 (0.0%) |
| Total | 110 (94.0%) | 7 (6.0%) |
Health Insurance Coverage by Citizenship Status in Kettle River
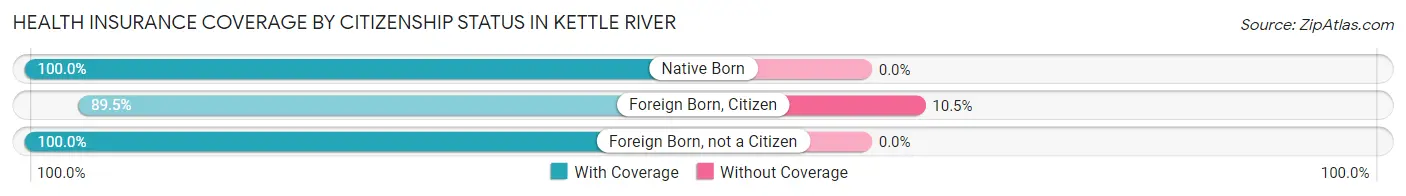
| Citizenship Status | With Coverage | Without Coverage |
| Native Born | 2 (100.0%) | 0 (0.0%) |
| Foreign Born, Citizen | 17 (89.5%) | 2 (10.5%) |
| Foreign Born, not a Citizen | 11 (100.0%) | 0 (0.0%) |
Health Insurance Coverage by Household Income in Kettle River
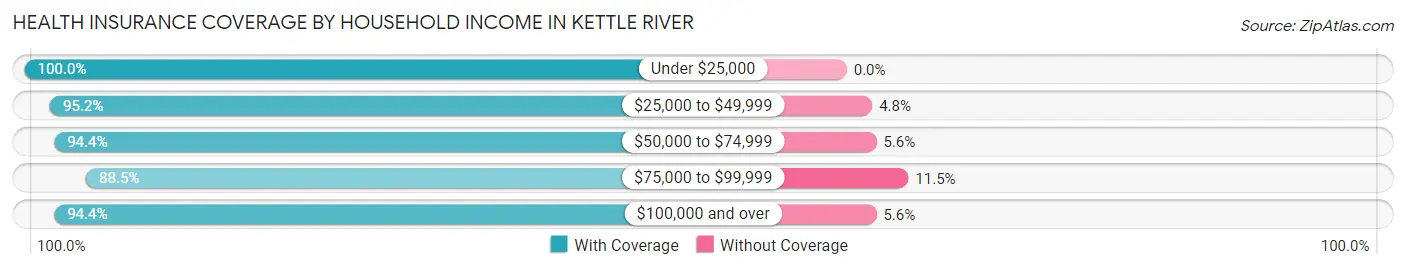
| Household Income | With Coverage | Without Coverage |
| Under $25,000 | 16 (100.0%) | 0 (0.0%) |
| $25,000 to $49,999 | 20 (95.2%) | 1 (4.8%) |
| $50,000 to $74,999 | 17 (94.4%) | 1 (5.6%) |
| $75,000 to $99,999 | 23 (88.5%) | 3 (11.5%) |
| $100,000 and over | 34 (94.4%) | 2 (5.6%) |
Public vs Private Health Insurance Coverage by Age in Kettle River
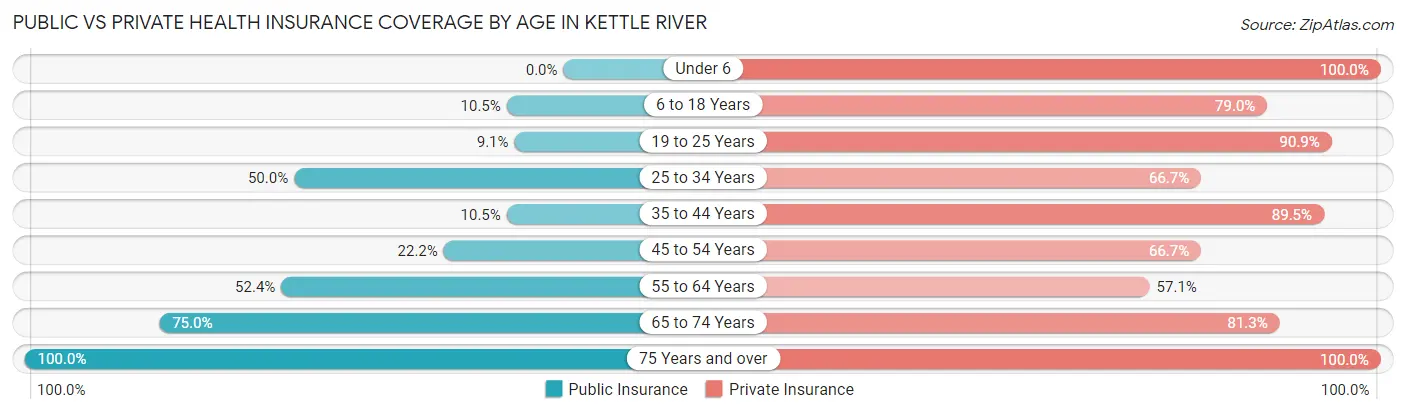
| Age Bracket | Public Insurance | Private Insurance |
| Under 6 | 0 (0.0%) | 2 (100.0%) |
| 6 to 18 Years | 2 (10.5%) | 15 (78.9%) |
| 19 to 25 Years | 1 (9.1%) | 10 (90.9%) |
| 25 to 34 Years | 3 (50.0%) | 4 (66.7%) |
| 35 to 44 Years | 2 (10.5%) | 17 (89.5%) |
| 45 to 54 Years | 2 (22.2%) | 6 (66.7%) |
| 55 to 64 Years | 11 (52.4%) | 12 (57.1%) |
| 65 to 74 Years | 12 (75.0%) | 13 (81.2%) |
| 75 Years and over | 14 (100.0%) | 14 (100.0%) |
| Total | 47 (40.2%) | 93 (79.5%) |
Disability Status by Sex by Age in Kettle River
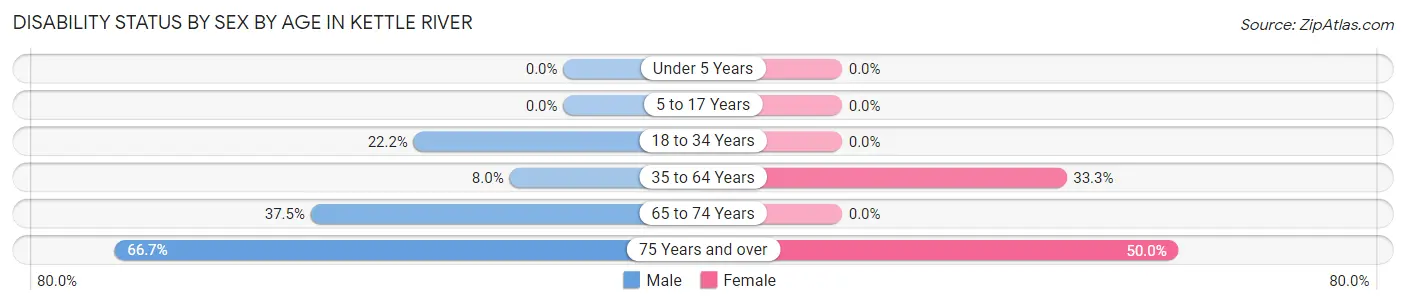
| Age Bracket | Male | Female |
| Under 5 Years | 0 (0.0%) | 0 (0.0%) |
| 5 to 17 Years | 0 (0.0%) | 0 (0.0%) |
| 18 to 34 Years | 2 (22.2%) | 0 (0.0%) |
| 35 to 64 Years | 2 (8.0%) | 8 (33.3%) |
| 65 to 74 Years | 3 (37.5%) | 0 (0.0%) |
| 75 Years and over | 4 (66.7%) | 4 (50.0%) |
Disability Class by Sex by Age in Kettle River
Disability Class: Hearing Difficulty
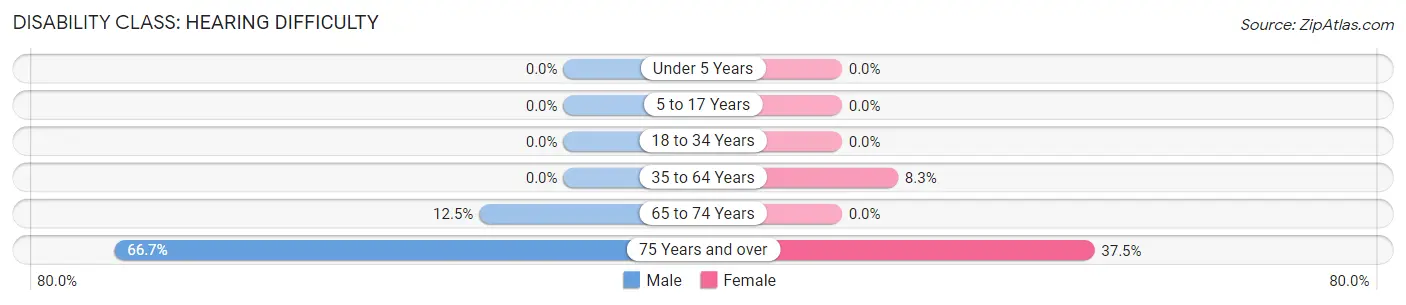
| Age Bracket | Male | Female |
| Under 5 Years | 0 (0.0%) | 0 (0.0%) |
| 5 to 17 Years | 0 (0.0%) | 0 (0.0%) |
| 18 to 34 Years | 0 (0.0%) | 0 (0.0%) |
| 35 to 64 Years | 0 (0.0%) | 2 (8.3%) |
| 65 to 74 Years | 1 (12.5%) | 0 (0.0%) |
| 75 Years and over | 4 (66.7%) | 3 (37.5%) |
Disability Class: Vision Difficulty
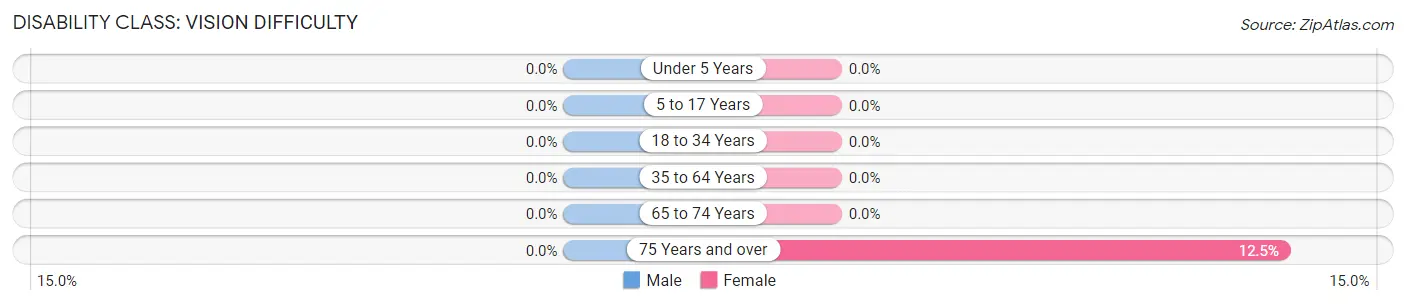
| Age Bracket | Male | Female |
| Under 5 Years | 0 (0.0%) | 0 (0.0%) |
| 5 to 17 Years | 0 (0.0%) | 0 (0.0%) |
| 18 to 34 Years | 0 (0.0%) | 0 (0.0%) |
| 35 to 64 Years | 0 (0.0%) | 0 (0.0%) |
| 65 to 74 Years | 0 (0.0%) | 0 (0.0%) |
| 75 Years and over | 0 (0.0%) | 1 (12.5%) |
Disability Class: Cognitive Difficulty
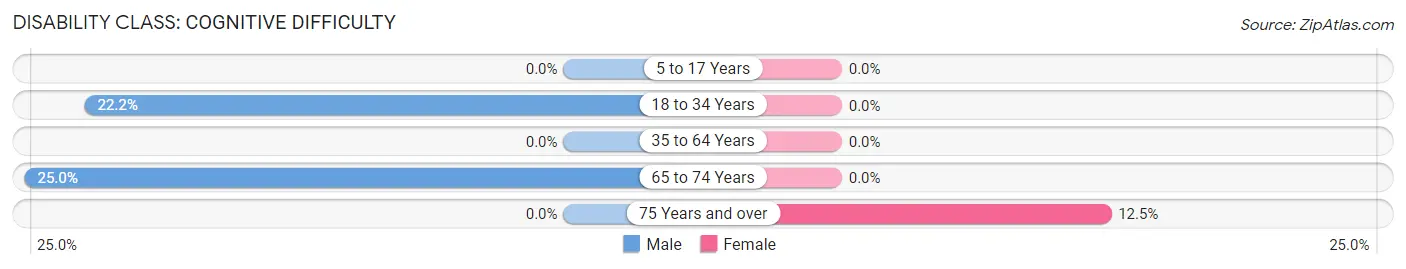
| Age Bracket | Male | Female |
| 5 to 17 Years | 0 (0.0%) | 0 (0.0%) |
| 18 to 34 Years | 2 (22.2%) | 0 (0.0%) |
| 35 to 64 Years | 0 (0.0%) | 0 (0.0%) |
| 65 to 74 Years | 2 (25.0%) | 0 (0.0%) |
| 75 Years and over | 0 (0.0%) | 1 (12.5%) |
Disability Class: Ambulatory Difficulty
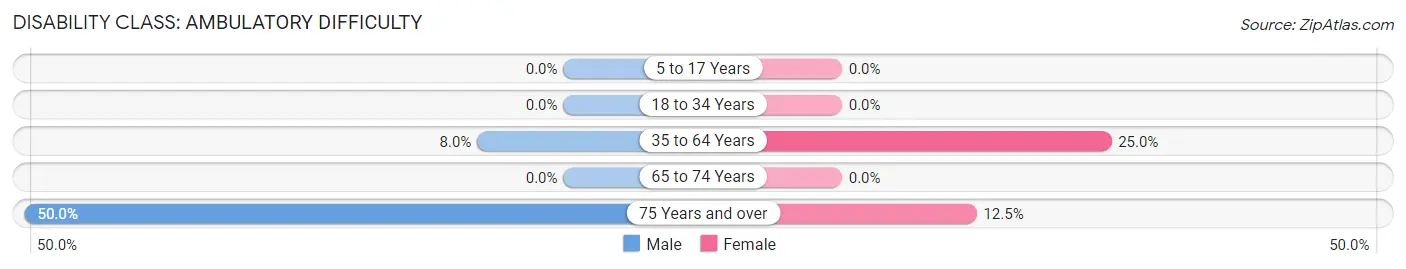
| Age Bracket | Male | Female |
| 5 to 17 Years | 0 (0.0%) | 0 (0.0%) |
| 18 to 34 Years | 0 (0.0%) | 0 (0.0%) |
| 35 to 64 Years | 2 (8.0%) | 6 (25.0%) |
| 65 to 74 Years | 0 (0.0%) | 0 (0.0%) |
| 75 Years and over | 3 (50.0%) | 1 (12.5%) |
Disability Class: Self-Care Difficulty
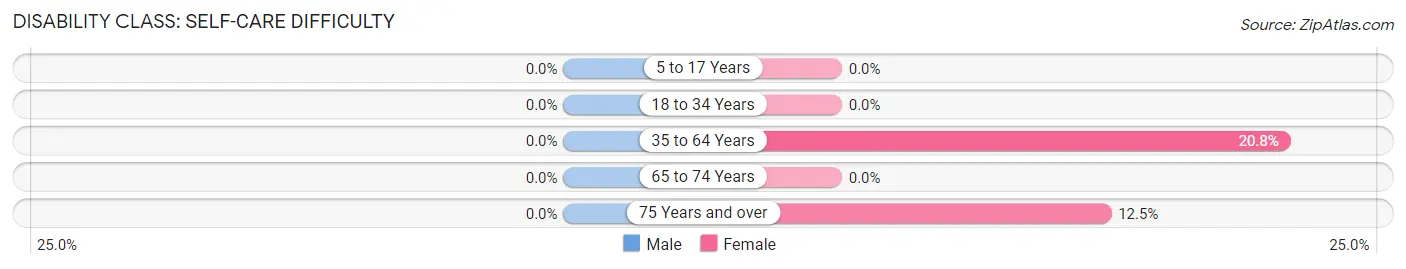
| Age Bracket | Male | Female |
| 5 to 17 Years | 0 (0.0%) | 0 (0.0%) |
| 18 to 34 Years | 0 (0.0%) | 0 (0.0%) |
| 35 to 64 Years | 0 (0.0%) | 5 (20.8%) |
| 65 to 74 Years | 0 (0.0%) | 0 (0.0%) |
| 75 Years and over | 0 (0.0%) | 1 (12.5%) |
Technology Access in Kettle River
Computing Device Access in Kettle River
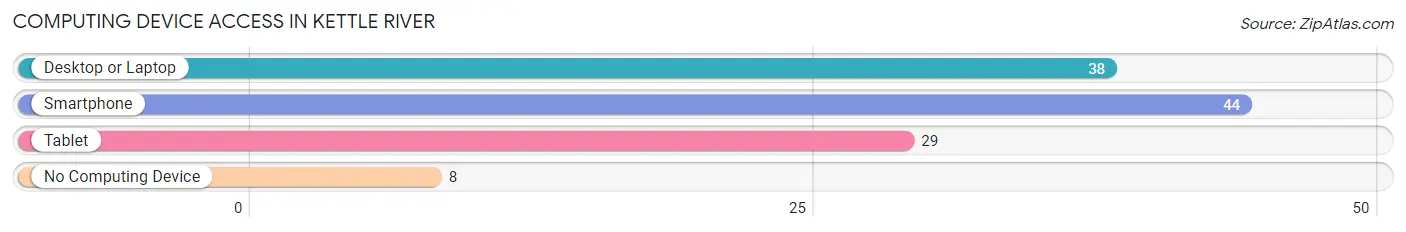
| Device Type | # Households | % Households |
| Desktop or Laptop | 38 | 71.7% |
| Smartphone | 44 | 83.0% |
| Tablet | 29 | 54.7% |
| No Computing Device | 8 | 15.1% |
| Total | 53 | 100.0% |
Internet Access in Kettle River
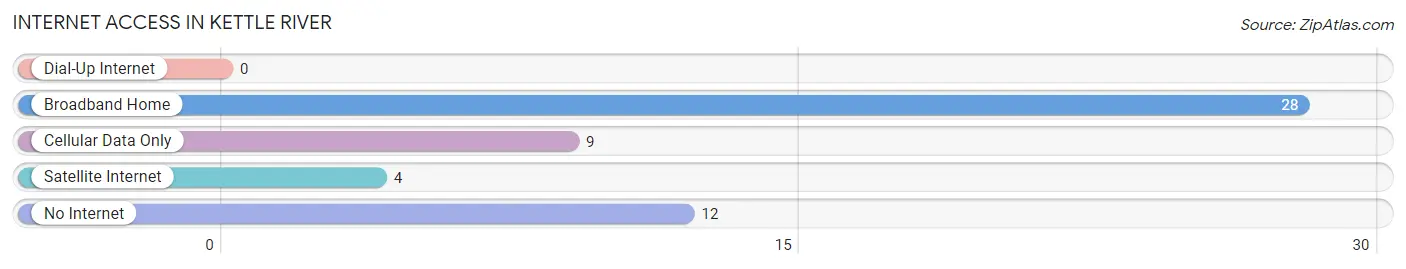
| Internet Type | # Households | % Households |
| Dial-Up Internet | 0 | 0.0% |
| Broadband Home | 28 | 52.8% |
| Cellular Data Only | 9 | 17.0% |
| Satellite Internet | 4 | 7.5% |
| No Internet | 12 | 22.6% |
| Total | 53 | 100.0% |
Kettle River Summary
Kettle River is a small town located in Pine County, Minnesota, United States. It is situated on the banks of the Kettle River, a tributary of the St. Croix River. The town was founded in 1887 and has a population of approximately 200 people.
History
Kettle River was founded in 1887 by a group of settlers from Wisconsin. The town was named after the nearby Kettle River, which was named by French explorers in the late 1700s. The river was so named because of its many kettle-shaped depressions in the riverbed. The settlers were attracted to the area due to its abundance of natural resources, including timber, fish, and game.
The town quickly grew and by the early 1900s, it had become a bustling logging and farming community. The town was also home to a number of businesses, including a sawmill, a general store, a blacksmith, and a hotel.
In the 1920s, the town began to decline as the logging industry moved away from the area. The Great Depression further exacerbated the town’s decline, and by the 1940s, the population had dropped to just over 100 people.
In the 1950s, the town began to experience a resurgence as a tourist destination. The Kettle River was a popular spot for fishing, canoeing, and camping. The town also became a popular destination for snowmobilers in the winter months.
Geography
Kettle River is located in Pine County, Minnesota, United States. It is situated on the banks of the Kettle River, a tributary of the St. Croix River. The town is located in a heavily forested area, with the majority of the land being covered in pine and hardwood trees.
The town is located approximately 30 miles north of Duluth, Minnesota, and is accessible via Highway 61. The nearest major city is Minneapolis, which is located approximately 100 miles to the south.
Economy
Kettle River’s economy is largely based on tourism. The town is a popular destination for fishing, canoeing, and camping. The town is also a popular destination for snowmobilers in the winter months.
In addition to tourism, the town is also home to a number of small businesses, including a general store, a sawmill, and a blacksmith.
Demographics
As of the 2010 census, the population of Kettle River was approximately 200 people. The town is predominantly white, with the majority of the population being of German and Scandinavian descent.
The median household income in Kettle River is approximately $35,000, and the median home value is approximately $100,000. The town has a low unemployment rate, and the majority of the population is employed in the tourism and service industries.
Common Questions
What is Per Capita Income in Kettle River?
Per Capita income in Kettle River is $28,162.
What is the Median Family Income in Kettle River?
Median Family Income in Kettle River is $82,679.
What is the Median Household income in Kettle River?
Median Household Income in Kettle River is $51,250.
What is Income or Wage Gap in Kettle River?
Income or Wage Gap in Kettle River is 51.9%.
Women in Kettle River earn 48.1 cents for every dollar earned by a man.
What is Inequality or Gini Index in Kettle River?
Inequality or Gini Index in Kettle River is 0.36.
What is the Total Population of Kettle River?
Total Population of Kettle River is 117.
What is the Total Male Population of Kettle River?
Total Male Population of Kettle River is 64.
What is the Total Female Population of Kettle River?
Total Female Population of Kettle River is 53.
What is the Ratio of Males per 100 Females in Kettle River?
There are 120.75 Males per 100 Females in Kettle River.
What is the Ratio of Females per 100 Males in Kettle River?
There are 82.81 Females per 100 Males in Kettle River.
What is the Median Population Age in Kettle River?
Median Population Age in Kettle River is 48.3 Years.
What is the Average Family Size in Kettle River
Average Family Size in Kettle River is 2.7 People.
What is the Average Household Size in Kettle River
Average Household Size in Kettle River is 2.2 People.
How Large is the Labor Force in Kettle River?
There are 57 People in the Labor Forcein in Kettle River.
What is the Percentage of People in the Labor Force in Kettle River?
57.6% of People are in the Labor Force in Kettle River.
What is the Unemployment Rate in Kettle River?
Unemployment Rate in Kettle River is 5.3%.